Does corporate performance improve after...
54
Transcript of Does corporate performance improve after...


^^ Of tt^.


13-Aeii
WORKING PAPER
ALFRED P. SLOAN SCHOOL OF MANAGEMENTPaul M. Healy
MIT's Sloan School of Management
Krishna G. PalepuHarvard Business School
and
Richard S. RubackHarvard Business School
Working Paper /'BlAg-SO
MASSACHUSETTS
INSTITUTE OF TECHNOLOGY50 MEMORIAL DRIVE
CAMBRIDGE, MASSACHUSETTS 02139


DOES CORPORATE PERFORMANCE IMPROVE AFTER MERGERS?
by
Paul M. HealyMIT's Sloan School of Management
Krishna G. PalepuHarvard Business School
and
Richard S. RubackHarvard Business School
Working Paper ^t'Bl'tS-SO
April 1990
We thank Robin Cooper, George Foster, Michael Jensen, Bob Kaplan, Richard Leftwich, MarkWolfson, Karen Wruck, and seminar participants at Baruch College, Carnegie Mellon, Columbia,Dartmouth, Duke, Federal Reserve Bank OVashington D.C.), Harvard, Michigan, MIT, NYU,Rochester, Stanford, USC, and U.S. Department of Justice for helpful conmients on earlier drafts,
Chris Fox and Ken Hao for research assistance, and the International Financial Services Center at
MIT and the Division of Research at HBS for financial support.

DOES CORPORATE PERFORMANCE IMPROVE AFTER MERGERS?
Abstract
We examine the post-acquisition operating performance of merged firms using a sample of the 50largest mergers between U.S. public industrial firms completed in the period 1979 to 1983. Theresults indicate that merged firms have significant improvements in asset productivity relative to
their industries after the merger, leading to higher post-merger operating cash flow returns.
Sample firms maintain their capital expenditure and R&D rates relative to their industries after the
merger, indicating that merged firms do not reduce their long-term investments. There is a strong
positive relation between post-merger increases in operating cash flows and abnormal stock returns
at merger announcements, indicating that expectations of economic improvements underlie the
equity revaluations of the merging firms.

DOES CORPORATE PERFORMANCE IMPROVE AFTER MERGERS?
1. Introduction
This study examines the post-merger cash flow performance of acquiring and target firms,
and explores the sources of merger-induced changes in cash flow performance. Our research is
motivated by the inability of stock price performance studies to determine whether takeovers create
real economic gains and to identify their sources.
There is near unanimous agreement that target stockholders benefit from mergers, as
evidenced by the premium they receive for selling their shares. The stock price studies of
takeovers also indicate that bidders generally break-even, and that the combined equity value of the
bidding and target firms increase as a result of takeovers. These increases in equity values are
typically attributed to some unmeasured source of real economic gains, such as synergy. But the
equity value gains could also be due to capital market inefficiencies. For example, the equity value
gains may simply arise from the creation of an over-valued security.
Previous studies have analyzed the stock price performance of unsuccessful takeovers to
determine if the equity increases in takeovers are from real economic gains or capital market
inefficiencies.! However, the studies of unsuccessful takeovers cannot distinguish between the
real economic gains and the market inefficiency explanations. The fact that the stock prices of
unsuccessful merger targets return to their pre-offer level is consistent with the loss of an
anticipated premium — whatever its source. The anticipation of real economic gains is
observationally equivalent to market mispricing. It is, therefore, difficult to conceive of a pure
stock price study that could resolve the ambiguity in the interpretation of the stock price evidence
because of this inherent identification problem.
Stock price studies also cannot provide evidence on the sources of any merger-related
1 Dodd (1980), Asquith (1983). Dodd and Ruback (1977), Bradley, Desai and Kim (1983), and Ruback
(1988).
Post-merger corporate performance page 2
gains. Yet, differences of opinion about the source of the gains in takeovers underlies much of
the public policy debate on their desirability. Gains from mergers could arise from a variety of
sources, such as operating synergies, tax savings, transfers from employees or other
stakeholders, or increased monopoly rents. Equity gains from only some of these sources are
unequivocally beneficial at the social level.
Our approach is to use post-merger accounting data to directly test for changes in
operating performance that result from mergers. 2 Our tests use accounting data collected from
company annual reports, merger prospectuses, proxy statements and analysts' reports for 50
large mergers between U.S. public industrial firms which were completed in the period 1979 to
1983. We recognize that accounting data are imperfect measures of economic performance and
that these data can be affected by managerial decisions. As we explain in section 2, we use cash
flow measures of economic performance to mitigate the impact of the financing of the acquisition
and the method of accounting for the transaction. We also recognize that our cash flow variables
measure period-by-period performance which is affected by firm-specific and industry factors.
We therefore use industry performance as a benchmark to evaluate post-merger performance.
Results reported in Section 3 show that the merged firms have increases in post-merger
operating cash flow performance relative to their industries. These increases arise from post-
merger improvements in asset productivity. We find no evidence that the improvement in post-
merger cash flows is achieved at the expense of the merged firms' long-term viability since the
sample firms maintain their capital expenditure and R&D rates relative to their industries. Our
results differ from the findings reported by Ravenscraft and Scherer (1987), and Herman and
Lowenstein (1988) who examine earnings performance after takeovers and conclude that merged
2 Three recent studies have examined earnings performance subsequent to management buyouts of
corporations (Bull (1988), Kaplan (1990), and Smith (1990)). Our paper focuses on acquisitions of one public
company by another either in a merger or a tender offer, rather than on management buyouts.

Post-merger corporate performance page 3
firms have no post-takeover operating improvements.
3
In section 4 we examine the relation between our cash flow measures of post-merger
performance and stock market measures used in earlier studies. Improvements in operating cash
flow returns in part explain the increase in equity values of the merging firms at the
announcement of the merger. This indicates that the stock price reaction to mergers is driven by
anticipated economic gains after the merger.
2. Experimental Design
2.1 Sample
We base our analysis on the largest 50 acquisitions during the period 1979 to 1983. We
limit the number of acquisitions studied to make the hand data collection tasks manageable. The
largest acquisitions have several important advantages over a similarly sized random sample.
First, if there are economic gains from a takeover, they are most likely to be detected when the
target firm is large. Second, while the sample consists of a small fraction of the total number of
acquisitions in the sample period, the total dollar value of the 50 firms selected accounts for a
significant portion of the dollar value of takeover activity.'* Finally, it is less likely that the
acquirers in the sample undertake equally large acquisitions prior or subsequent to the events,
reducing the probability of confounding events.
The sample period (1979-83) is selected to focus on recent mergers and also to have
sufficient post-merger performance data. To select the acquisition sample, we identify the 382
3 See Caves (1989) for a review of the studies that examine the ex post perfonnance of merged firms.
4 The aggregate market value of equity of the 50 target firms in our sample one year prior to the
acquisition is $43 billion.

Post-merger corporate performance P^g^ ^
merger-related delistings on the CRSP database in the sample period. The names of the acquirers
are identified from the Wall Street Journal Index . The sample comprises acquisitions involving
the 50 largest targets that satisfy the following two criteria: the acquirer is a US company which is
listed on the NYSE or ASE, and the target and acquirer are not financial or regulated companies.
Target firm size is computed from Compustat as the market value of common stock plus the book
values of net debt and preferred stock at the beginning of Uie year prior to the acquisition.
Acquisitions are deleted from the sample if the acquirers are non-US or private companies since
post-acquisition financial information is not available for these mergers. Regulated (railroads and
utilities) and financial firms are deleted because they are subject to special accounting and
regulatory requirements, making them difficult to compare with other firms.
Table 1 reports descriptive statistics on the time distribution of the sample mergers, their
industry distribution, and relative sizes of the target and acquiring firms. Panel A of die table
shows that twelve of the fifty sample mergers are completed in 1981 and fourteen in 1983. The
remaining 24 mergers are approximately evenly distributed over the other three sample years.
Since the sample is clustered in time, the sample firms' post-merger performance is likely to be
influenced by economy-wide changes. Our tests, therefore, control for these factors by
comparing sample firms' performance with their corresponding industries'. Evidence in Panel B
shows that the sample targets and acquirers represent a wide cross-section of Value Line
industries. The target firms belong to 27 different industries; the acquiring firms come from 33
different industries. A list of target and acquirer firms in our sample and a description of their
businesses is reported in an appendix.
Summary statistics on the relative sizes of the target and acquirer firms are reported in
Panel C of Table 1. The sizes of targets and acquirers are measured by the book value of net debt
Post-merger corporateperformance poge 5
Oong-term debt, plus short-term debt, less cash and marketable securities) plus the market value
of equity one year prior to the merger. The relative size of the two firms is the ratio of the size of
the target to that of the acquirer. On average, the target firm is 42% of the assets of the acquirer,
indicating that the acquisition is a significant economic event for the purchasing fums.
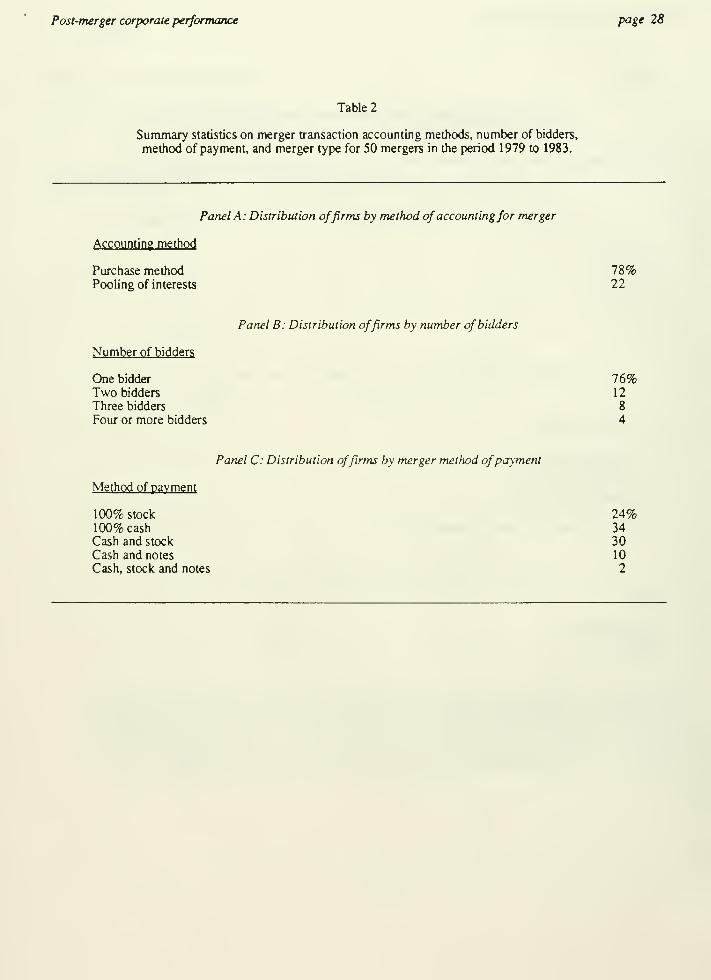
Descriptive statistics on the method of accounting, number of bidders, and method of
payment, are reported in Table 2 for the 50 mergers. Panel A shows that the majority of
transactions (80%) are accounted for under the purchase method. Panel B shows that most of the
acquisitions (70%) are uncontested. Twenty percent are contested by two bidders (including the
ultimate acquirer) and only ten percent of the transactions attracted more than two bidders. The
distribution of the basis of payment in Panel C indicates that payments in the form of 100% cash,
100% stock and a combination of cash and stock are equally common.
2.2 Performance Measurement
We use pre-tax operating cash flows to measure improvements in operating performance.
We define operating cash flows as sales, minus cost of goods sold, and selling and administrative
expenses, plus depreciation and goodwill expenses. This measure is deflated by the market value
of assets (market value of equity plus book value of net debt) to provide a return metric that is
comparable across firms. Unlike accounting return on book assets, our return measure excludes
the effect of depreciation, goodwill, interest expense/income, and taxes. It is therefore unaffected
by the method of accounting for the merger (purchase or pooling accounting) and/or the method
of financing the merger (cash, debt, or equity). As discussed below, these factors make it
difficult to compare traditional accounting returns of the merged firm over time and cross-
sectionally.

Post-merger corporate performance poge 6
Effects ofPurchase and Pooling Accounting
The purchase method requires that the assets and liabilities of target firms be restated at
their current market values. No such revaluation is permitted under the pooling method.
Further, under the purchase method the acquirer records any difference between the acquisition
price and market value of identifiable assets and liabilities of the target company as goodwill, and
amortizes it. No goodwill is recorded under the pooling-of-interests method. Finally, for the
first year of the merger, the purchase method consolidates results of the target with those of the
acquirer from the date the merger took place; the pooling method consolidates results for the two
firms from the beginning of the year regardless of when the merger took place.
The same transaction typically results in lower post-merger earnings under purchase
accounting than under pooling. The purchase method increases depreciation, cost of goods sold,
and goodwill expenses subsequent to the takeover. Also, in the year of the merger, earnings are
usually lower under purchase accounting because it consolidates the target's earnings with the
acquirer for a shorter period of time than pooling. The lower earnings reported under the
purchase method are entirely due to differences in the method of accounting for the merger and
not due to differences in economic performance. Furthermore, post-merger book assets under
the purchase method wiU be larger than those under pooling because of the asset write-up under
the purchase method. It is therefore misleading to compare pwst- and pre-merger accounting
rates of return for firms that use purchase accounting to infer whether there are economic gains
from mergers. In our sample, 80% of the firms use the purchase method to account for the
transaction.
Our operating cash flow performance measure —unlike earnings based performance
measures - is unaffected by depreciation and goodwill. It is comparable cross-sectionally and on
Post-merger corporate performance pog^ 7
a time-series basis when firms use different methods of accounting for the merger. We exclude
the first year of the merger in our analysis because of the differences between the purchase and
pooling methods in timing the consolidation of the target with the acquirer. Excluding the first
year also mitigates the effect of inventory write-ups under the purchase method, since this
inventory is usually included in cost of sales in the merger year. 5 Since the asset base in our
return metric is the market value, rather than book value, of assets, it is also unaffected by the
accounting method used to record the merger.
Effects ofMethod ofFinancing Mergers
Post-acquisition accounting earnings are also influenced by the method of financing the
merger. Accounting income is computed after deducting interest expenses (the cost of debt), but
before allowing for any cost of equity. Thus, if an acquisition is financed by debt or cash, its
post-acquisition profits will be lower than if the same acquisition is fmanced by stock. Since the
differences in earnings reflect the financing choice and not differences in economic performance,
it is misleading to compare reported accounting earnings, which are computed after interest
income and expense, for firms that use different methods of merger financing. Panel C of Table
2 shows that cash and stock methods of financing are equally common in our sample. We use
operating cash flows before interest expense and income from short-term investments deflated by
the market value of assets to measure performance. This cash flow return is unaffected by the
choice of fmancing.
5 Firms using the LIFO inventory valuation method expense the written-up inventory as inventory layers
are depleted, making it difficult to determine when to adjust earnings for the effect of the write-up. We therefore do
not make any adjustments for these firms. However, this is unlikely to lead to a serious downward bias in our
earnings measure since LIFO inventory liquidations are relatively infrequent.

Post-merger corporateperformance page 8
2.3 Performance Benchmark
We add the accounting data of the target and bidding firms prior to the merger to obtain
the proforma pre-merger performance of the combined firms. Comparing the fwst-merger
performance to this pre-merger benchmark provides a measure of the change in performance.
But some of the difference between pre-merger and post-merger performance could be due to
economy-wide or industry factors. Hence, we use the industry-adjusted performance of the
target and bidding firms as our primary benchmark to evaluate the post-merger performance.
Industry-adjusted performance measures are calculated by subtracting the industry median from
the sample firm value. The data for merging firms are excluded when calculating the industry
median. Value Line industry definitions immediately prior to the merger are used for the target
and acquirer in both the pre-merger and post-merger analysis. Industry data are collected from
Compustat Industrial and Research files.
2.4 Comparison with Prior Research
We examine more recent mergers than those analyzed by previous studies of post-merger
performance. Ravenscraft and Scherer's sample is from the period 1950 to 1977. While Herman
and Lowenstein select firms that merge in the period 1975 to 1981 , they have limited post-merger
data after 1981.
Neither Herman and Lowenstein, nor Ravenscraft and Scherer examine performance
expectations prior to the merger, or restate earnings and assets for firms using purchase
accounting, making it difficult to interpret their findings. Herman and Lowenstein do not adjust
their return on equity measure for differences in the method of financing the merger, and fail to
control for the effect of common industry shocks on post-merger earnings performance.

Post-merger corporate performance page 9
Ravenscraft and Scherer focus exclusively on lines of business. It is not obvious why
gains from mergers would only be reflected in the acquired segments; synergies are just as likely
to improve the performance of the other lines of business of the acquiring firms. They also use
FTC line of business data which have several potential problems. Definitions of business
segments may change systematically after mergers if acquirers restructure their operations.
Results of tests using segment data reported to the FTC are also likely to be difficult to inteipret
since reporting firms have incentives to use accounting discretion to reduce the likelihood of anti-
trust suits by the FTC (see Watts and Zimmerman (1986)).
3. Cash Flow Return Performance
3.1 Operating Cash Flow Returns before Industry Adjustments
To construct the pre-merger performance benchmark, we aggregate the cash flow data for
the target and acquiring firms to determine the proforma performance measures for the combined
firm in each of the five years before the merger (years -5 to -1). Performance measures for the
combined firms are weighted-averages of values for the target and acquiring firms separately,
where the weights are the relative sizes of the two firms at the beginning of each year.
The pre-tax operating cash flows of the merged firm are computed for years 1 to 5. Year
0, the year of the merger, is excluded from the analysis for two reasons. First, many of the
acquiring firms use the purchase accounting method, implying that in the year of the merger the
two firms are consolidated for financial reporting purposes from only the date of the merger.
Results for this year are therefore not comparable across firms or for industry comparisons.
Second, year figures are affected by one-time merger costs incurred during that year, making it
difficult to compare them with results for other years.

Post-merger corporcueperformance page 10
We deflate the operating cash flows by the market value of assets. Pre-tax op»erating cash
flow returns are computed as the ratio of pre-tax operating cash flows during the year to the
market value of assets at the beginning of the year. The market value of assets is recomputed at
the beginning of each year to control for changes in the size of the firm over time. For pre-
merger years the market value of assets is the sum of the values for the target and acquiring firms.
The market value of assets of the combined firm is used in the post-merger years.
We exclude the change in equity values of the target and acquiring firms at the merger
announcement from the asset base in the post-merger years. 6 This adjustment is important
because an efficient stock market capitalizes the value of any expected improvement in equity
prices at the merger announcement. If this equity revaluation is included in the asset base, the
measured pre-tax operating cash flow returns will not show any abnormal increase, even when
the merger results in an increase in operating cash flows. For example, consider an acquiring
firm (company A) and a target (company T) with annual operating cash flows of $20 and $10
respectively forever. Both firms have the same cost of capital (10%), implying that their market
values are $200 and $1(X) respectively. Therefore, a portfolio comprised of A and T has a market
value of $300 and cash flows of $30, producing an annual return of 10%. Suppose that when A
acquires T combined cash flows increase to $35 per year. An efficient market capitalizes this $5
improvement at $50. If post-merger cash flow returns are computed as the ratio of post-merger
cash flows ($35) and post-merger assets including the premium ($350), measured performance
will be identical to the pre-merger operating return for the portfolio of A and T (10%). There is
no improvement in the measured cash flow return even though cash flows per year have
increased by $5. Our measure of performance is computed as the ratio of post-merger cash flows
6 The change in equity value of the target at the announcement of the merger is measured from five days
before the first offer was announced (not necessarily by the ultimate acquirer) to the date the target was delisted
from trading on public exchanges. The change in equity value of the acquirer is measured from five days before its
first offer was announced to the date the target was delisted from trading on public exchanges.
Post-merger corporate performance page 1
1
($35) and post-merger assets excluding the asset revaluation ($350-$50). This return measure
(1 1.7%) correctly reflects the improvement in operating performance after the merger.
Panel A of Table 3 reports median pre-tax operating cash flow returns for the merged firm
in years -5 to -1, and 1 to 5. The median pre-tax operating returns range from 26% to 27.5% in
the five years before the merger. After the merger, the median pre-tax operating returns are
lower, ranging from 19% to 23% with a median annual value of 21.8% for the whole period.
This indicates that post-merger performance is lower than the pre-merger benchmark.''
These data do not adjust for the impact of contemporaneous events on the merged firms'
cash flow returns that are unrelated to the merger, and are therefore difficult to interpret. For
example, since we deflate cash flows by the market value of assets, changes in equity values due
to overall market movements will affect the measured returns over time. Equity values increased
during most of our sample period. This may explain the decrease in the cash flow returns in the
post-merger period. We focus on industry-adjusted performance measures because they
incorporate any contemporaneous changes in the overall cash flow performance and equity values
of the industry.
3.2 Operating Cash Flow Returns after Industry Adjustments
Industry-adjusted cash flow returns are the differences between values for the merged
firm and its weighted-average industry median estimates. Prior to the merger industry values for
the sample firms are constructed by weighting median performance measures for the target and
acquiring firms' industries by the relative asset sizes of the two firms at the beginning of each
' To calculate the sample median pre-tax operating cash flow return for years 1 to 5, we first compute the
median return in these years for each sample firm. The reported sample median is the median of these values.
Sample median returns in the jwe-merger period are calculated in the same way.

Post-merger corporate performance page 12
year. In all of the post-merger years target and acquirer industry cash flow returns are weighted
by the relative asset sizes of the two firms one year before the merger.
The industry-adjusted data reported in Panel B of Table 3 show that merged firms have
superior pre-tax operating cash flow returns on assets relative to their industries' in the post-
merger period. The industry-adjusted pre-tax operating return on assets for the merged firms is
2.7% in year 1, 3.8% in year 2, and 2.7% in year 3, all significantly different from zero. Years 4
and 5 also exhibit superior performance relative to the industry, but these differences are not
statistically significant Overall, the annual median pre-tax return in the five post-merger years is
2.8%. Stated differently, the merged firms' pre-tax operating returns in the post merger period
are about 15% larger than their industries' returns. 8 In contrast, no supjerior industry-adjusted
pre-tax operating cash flow returns occur in the five years before the merger; the median annual
return is 0.4%.
In Panel C of Table 3 we report the sample median difference in the industry-adjusted
performance in the post- and pre-merger periods.^ The improvement in industry-adjusted pre-tax
operating cash flow returns in the post-merger years is confirmed; the median difference in
industry-adjusted returns between the post- and pre-merger periods is 2.2%, which is statistically
reliable.
The industry-adjusted results are strikingly different from the operating cash flow returns
8 We calculate the percentage increase relative to the industry as 2.8/(21.3-2.8).
9 To compute the sample median performance difference between the post- and pre-merger periods, wefirst calculate the median returns for each sample firm in the post- and pre-merger years. We then compute
differences in the medians for each fum. The median of these pairwise differences is the sample median.

Post-merger corporate performance page 13
before industry adjustment. The industry-adjusted results show a significant increase in post-
merger performance and the unadjusted returns show a decrease in post-merger performance.
Industry-adjusted returns are a more reliable measure of performance since they control for
industry events unrelated to the merger. However, they are also confounded by two factors.
First, they are sensitive to the definitions of industries used in the analysis. To test
whether the industry-adjusted results are sensitive to the particular industry definitions employed
by Value Line, we use a market performance benchmark. We estimate the market index each year
as the median operating cash flow return for all firms on the Compustat Industrial and Research
tapes. The difference in the pre-merger and post-merger market-adjusted cash flow return for the
sample firms is 4.5%, confirming improvements in industry-adjusted performance.
Second, industry-adjusted returns can increase in the f)Ost-merger period even when cash
flows remain constant or decline if the market value of sample firms' assets decline relative to
their industries . Increased returns resulting from decreased asset values cannot be interpreted as
evidence that there are economic gains from mergers. To test whether there are declines in post-
merger market equity values of the sample firms relative to their industries, we compute the
difference between the annual stock returns for the sample firms and their industries in years
surrounding the merger. The industry-adjusted equity returns of the sample firms are
insignificant in the post-merger period (as well as in the pre-merger period). The industry-
adjusted returns are: 0.4% in year 1, 0.4% in year 2, 0.2% in year 3, -3.7% in year 4, and 3.7%
in year 5. This implies that the improvements in post-merger industry-adjusted cash flow returns
are due to increases in sample firms' operating cash flows rather than declines in their market
values.

Post-merger corporate performance page 14
3.3 Components of Industry Adjusted Cash Flow Returns
The improvements in pre-tax cash flow returns in the post-merger period can arise from a
variety of sources. These include improvements in operating margins, increased asset
productivity, or decreased labor costs. Alternatively, they may be achieved by focusing on short-
term performance improvements at the expense of long-term viability of the firm. In this section
we provide evidence on which of these sources contribute to the sample firms' post-merger cash
flow return increases. The specific variables analyzed are italicized in the text and are defined in
Table 4. The results are reported in Table 5.
Operating Performance Changes
The pre-tax operating cash flow return on assets can be decomposed into pre-tax cash
flow margin on sales and asset turnover. Pre-tax cash flow margin on sales measures the
operating cash flows generated per sales dollar. Asset turnover measures the sales dollars
generated from each dollar of investment in assets. The variables are defined so that their product
equals the pre-tax operating cash flow return on assets.
The results in Table 5 suggest that the increase in industry-adjusted pre-tax-operating
returns is attributable to an increase in asset turnover, rather than an increase in pre-tax operating
margins. In years -5 to -1 the merged firms have industry-adjusted median asset turnover of
-0.3, implying that they generated thirty cents less sales than their competitors for each dollar of
assets. The merged firms show a significant improvement in their industry-adjusted asset
turnover ratios in the post-merger period. In years 1 to 5 the industry-adjusted asset turnover is
0.1, indicating that the sample firms generate ten cents more sales than their industry counterparts
for each dollar of assets. The sample median difference in asset turnovers between these periods
is 0.2, which is statistically significant The merged firms also have higher pre-tax operating

Post-merger corporate performance page 15
margins on sales than their industries in the post-merger years. But these cannot be attributed to
the merger itself, since operating margins of the merged firms are also higher than those of their
industries in the pre-merger period. lO The difference between the pre- and post-merger industry
adjusted operating margin is insignificant. The absence of changes in operating margins suggest
that the post-merger cash flow improvements are not due to increases in monopoly rents. Rather,
merged firms seem to use their assets more productively.
Mergers also provide the acquirer with an opportunity to renegotiate expHcit and implicit
labor contracts to lower labor costs and achieve a more efficient mix of capital and labor (see
Schleifer and Summers (1988)). Because we are unable to obtain sufficient data on wages
direcdy, we examine employee growth rates and pension expense per employee to analyze
changes in labor costs in years surrounding the mergers.
The median number of employees declines in each of the post-merger years. Overall, the
industry-adjusted employee growth rate is significantly less than in the pre-merger period, n
There is also evidence of a decline in pension expense per employee after the merger. Before the
merger the sample firms have a significantly higher pension expense per employee than their
industries. After the merger the pension expense of the merged firms is reduced to the same level
as the industry. There are two ways to view these findings. One interpretation is that mergers
are followed by improvements in operating efficiency through reduced labor costs. Alternatively,
mergers lead to a wealth redistribution between employees and stockholders through
10 Prior to the merger, the higher operating margins are primarily due to higher industry-adjusted margins
by acquirer. Targets do not show higher operating margins than their industries in these years.
1
1
Wages per employee for the merged firms also decline relative to the industry after the merger.
However, this finding should be interpreted with caution since only a small number of firms report information on
wages.

Post-merger corporateperformance page 16
renegotiations of explicit and implicit employment contracts. Whatever the explanation, the
magnitude of labor cost reductions in the post-merger period does not appear to be large since
there are no significant changes in the post-merger operating margins.
Investment Policy Changes
Since our analysis is limited to only five years after the merger, we cannot provide direct
evidence on cash flows beyond this period. To assess whether the merged firms focus on short-
term performance improvements at the expense of long-term investments, we examine their
capital outlays, and research and development (R&D). Tliese expenditure patterns are reported in
Table 5. The median capital expenditures as a percentage of assets is 15% in the pre-merger
period and 1 1% in the post-merger years. The median R&D expense is 2.1% of assets in years
-5 to -1, and 2.4% in years 1 to 5. The capital expenditures and R&D of the sample firms are
not significantly different from those of their industry counterparts in either the pre- or the post-
merger periods.
Asset sales is another area where merged firms can potentially change their investment
policies. It is possible that post-merger improvements in asset turnover arise from the sale of
assets with low turnover. We therefore examine asset disposals in the pre- and post-merger
years. Statistics on asset sales as a percent of the market value of assets are reported in Table 4.
The median asset sales for the merged firms are 1.6% and 0.9% of assets in the pre- and post-
merger periods respectively. The merged firms have significantly higher asset sales rates than
their industry counterparts both before and after the merger. However, there is no significant
difference in industry-adjusted asset sales before and after the merger. Further, asset sales in all
years are small in magnitude relative to capital expenditures or the market value of total assets.

Post-merger corporate performance page 1
7
In summary, we find that merged firms have significant improvements in cash flow
operating returns in the five years following mergers. These improvements come from increased
asset productivity. There is no evidence of increased asset sales, or decreased capital
expenditures or R&D following mergers.
4. Relation Between Cash Flow And Stock Price Performance
Our post-merger data on cash flow performance is consistent with the hypothesis that the
stock market revaluation of merging firms at merger announcements reflects expected future
improvements in operations. A more powerful test of this hypothesis is to correlate the merger-
related stock market performance and the post-merger cash flow performance. If the stock
market capitalizes these improvements, there should be a significant positive correlation between
the stock market revaluation of merging firms and the actual post-merger cash flow
improvements.
Stock Returns at Merger Announcements
Market-adjusted stock returns for the target and acquirer at the announcement of the
merger are reported in Panel A of Table 6.12 Returns for the target are measured ft"om five days
before the first offer was announced (not necessarily by the ultimate acquirer) to the date the
target was delisted from trading on public exchanges. Returns for the acquirer are measured from
five days before its first offer was announced to the date the target was delisted from trading on
public exchanges. Similar to findings reported by earlier studies, target shareholders earn large
positive returns from mergers (mean 45.6%, and median 41.8%), and acquiring stockholders
earn insignificant returns.
12 Risk-adjusted returns, computed using pre-merger-announcement market model estimates, are similar
to the market-adjusted returns reported in the papCT.

Post-merger corporcae performance page 18
We also compute the aggregate market-adjusted return for the two firms in the merger
announcement period. This return is the weighted average of the market-adjusted returns for the
target and acquirer, where the weights are the relative market values of equity of the two firms
prior to the merger announcement period. The mean aggregate return, reported in Panel A of
Table 6, is 9.1%, and the median is 6.6%. Both these values are significantly different from zero.
These findings are consistent with those of Bradley, Desai, and Kim (1988).
Relation Between Announcement Returns and Post-Merger Cash Flow Improvements
Our tests examine whether the change in equity values at merger announcements can be
explained by cash flow improvements in the post-merger period. In Section 3 we measured post-
merger performance using cash flow return on assets whereas the merger announcement returns
computed above are return on equity. Therefore, before we correlate announcement returns and
cash flow improvements, we compute asset returns at merger announcements from equity
returns to ensure that the anticipated gains from mergers and ex post measured gains are
comparable.
Asset returns at the merger announcement (AVAO are weighted averages of returns to
equity (aE/E) and debt (aD/D):
jlY = I^iEiE + £AD}D (1)
V E V D V
Assuming that the value of debt does not change at takeover announcements, asset returns equal
the equity announcement returns multiplied by the equity-to-assets ratio (E/V)A'i We use leverage
at the beginning of the year of the takeover announcement to compute the equity-to-asset ratio.
13 A number of studies including Asquith and Kim (1982), report evidence consistent with this
assumption.

Post-merger corporate performance poge 1
9
Summary statistics on the estimated asset returns for the target firms, acquiring firms, and
combined firms are reported in Panel B of Table 6. The mean and median asset returns for the
targets are 40.6% and 32.5%, and for the combined firms are 8.8%, and 5.2%. The asset
returns for the bidding firm are insignificant
The hypothesis that merger-induced abnormal returns reflect the capitalized value of future
cash flow improvements implies:
aV = PV(CF) (2)
where AV is the change in the market value of assets at the merger announcement, PV is the
present value operator, and CF is the vector of cash flow improvements. Equation (2) can be
converted to a returns model by dividing both sides of the equation by V:
^V = py(CF)V V (3)
Consistent with equation (3), we estimate the following cross-sectional regression:
ARETi= a + pCFRETi + Ei (4)
Where ARET is the combined firms' measured abnormal asset retiun at the merger announcement
(unlevered abnormal equity returns) and CFRET is the median annual industry-adjusted pre-tax
operating cash flow return in the post-merger period.
The valuation model (equation (3)) does not have a constant, implying that the intercept in
(4) should equal zero. Since ARET is the capitalized value of future cash flow return
improvements, and CFRET is the pre-tax cash flow return improvement per year, the slope in (4)
equals the present value factor at the pre-tax capitalization rate. For example, if the pre-tax
capitalization rate is 20%, the slope coefficient would be 5 if the improvements are perpetual, and
2.99 if the improvements last for five years. For a capitalization rate of 30%, these coefficients
Post-merger corporate performance poge 20
would be 3.33 and 2.44 respectively.
The estimates of regression equation (4) are reported in Panel A of Figure 1. The
regression has an R2 of 21%, implying a cross-sectional correlation of 0.46 between the asset
returns at the merger announcement and the realized improvements in cash flow returns. While
the estimated slope coefficient is positive and statistically reliable, its magnitude is only 0.96,
implying a very high discount rate. Also, the intercept is statistically significant. However, these
regression estimates are likely to be biased since the operating cash flow returns have substantial
measurement error. This measurement error results in a downward bias in the estimated slope
coefficient and an upward bias in the estimated intercept (see Johnston (1972)).
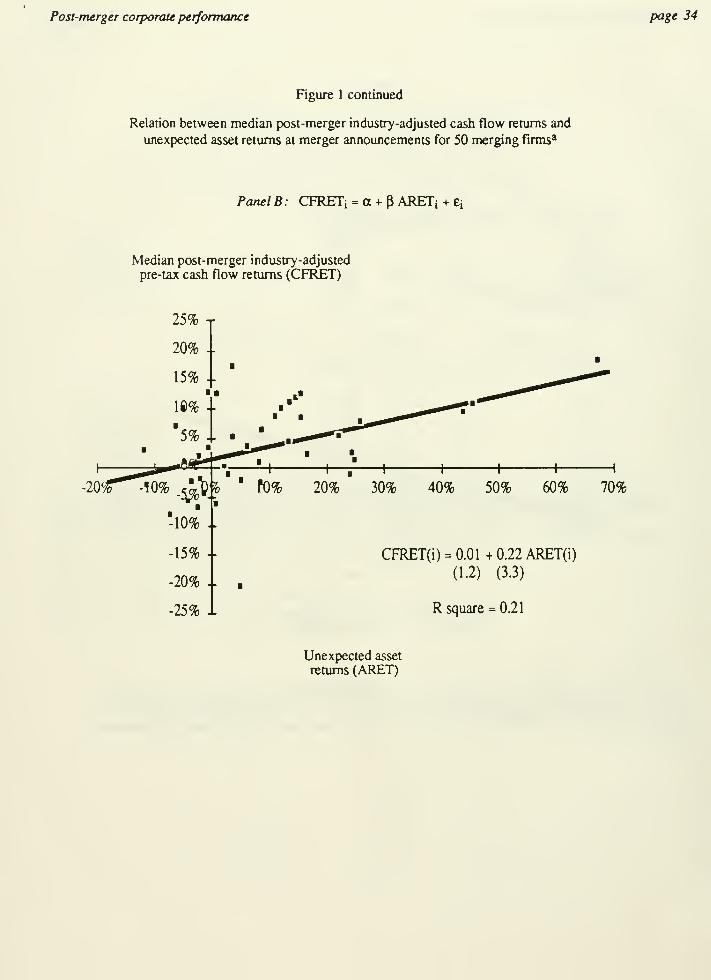
To provide a bound on the coefficient estimates, we reverse the dependent and
independent variables in (4) and estimate the following regression equation :
CFRETi= Y + XARETi + Vi (5)
The results are reported in Panel B of Figure 1. The estimated slope coefficient in equation (5) is
0.22. That is, the market capitalization rate is 22% if the improvements are a perpetuity. This
estimate corresponds to a slope coefficient value of 4.55 in equation (4). The estimated intercept
in equation (5) is insignificant These regression estimates are more in line with the predicted
values. 14
Since the regression analysis is affected by measurement error, we also compute a hack-
le Specification tests are conducted for regression equations (4) and (5) to assess whether the residuals are
honwskedastic (see White (1980)), and normally distributed. We cannot reject the hypotheses that the residuals are
homoskedastic and normally distributed at the 0.05 level. Belsley, Kuh and Welsch (1980) diagnostics for the
effect of extreme observations on the coefficients, and for multicollinearity indicate that the reported estimates are
not influenced by extreme observations. Finally, we estimate Spearman Rank Correlation coefficients between the
variables in the regression. The correlation is 0.45 and is significant at the 0.01 leveL

Post-merger corporate performance page 2
1
of-the-envelope estimate of the merger announcement asset return implied by the sample median
cash flow improvement. The data in Table 3 indicate that the merged firms' median annual pre-
tax operating cash flow return on assets in the post-merger period is about 2.2% larger than their
industries' return. To convert this to a rough estimate of the value change, we assume that the
risk of the improved performance equals the risk of an average security. We use an 8% risk
premium along with a 10% risk free rate for an 18% before-tax cost of capital. If the cash flow
gain is treated as a perpetuity, the implied increase in the asset value is 12%. If the increased
performance lasts for just five years, the asset value increase is about 6.6%. The actual mean and
median asset returns at the merger announcement reported in Table 6 are consistent with these
rough estimates.
In summary, the abnormal equity returns for the combined firms at the merger
announcement are broadly consistent with the value increases implied by the post-merger cash
flow return increases.
5. Discussion
Our finding that cash flows increase following mergers advances the debate on mergers
from whether there are cash flow changes after these transactions to why these cash flow
improvements occur. The improvements in sample firms' cash flow returns are primarily a result
of increased asset productivity. The reported post-merger gains cannot be attributed to tax
benefits, since the cash flow returns are pre-tax. They cannot be attributed to increased
monopoly rents since there is no increase in post-merger sales margins. While there is some
evidence that gains come at the expense of labor, reduced labor costs do not significantly increase
sample firms' profitability. Finally, there is no decrease in capital outlays and R&D
expenditures, or increase in asset sales after the merger, indicating that merged firms do not
Post-merger corporateperformance P<3ge 22
reduce their long-term investments.
Our findings raise two interesting questions. First, are the increases in cash flow returns
and asset productivity caused by the merger, or would they have occurred even without a merger?
Mergers can lead to increased asset productivity if sub-optimal policies pursued by the target or
the acquirer prior to the merger are eliminated, or if they provide new opportunities for using
existing resources of the merging firms. In contrast, if mergers arise from undervaluation of the
target firms by the stock market, there will be improvements in cash flows whether or not there is
a merger. Acquirers that anticipate the cash flow improvements will pay a premium to acquire the
targets.
A second interesting question is what are the economic factors that explain the cross-
sectional variation in post-merger cash flow changes? While there is an improvement in cash
flow performance on average, a quarter of the sample firms have negative post-merger cash flow
changes. These firms may have performed poorly because of bad luck. Alternatively, there may
have been systematic business and managerial reasons which led to these outcomes.
These questions, which have important managerial and public policy implications, can
only be answered by developing structural models of how mergers improve cash flows. We do
not attempt to undertake such an ambitious exercise in this paper. However, we do provide some
preliminary evidence and suggest directions for future research.
One popular structural model of how mergers improve cash flows is that they provide
opportunities for economies of scale and scope, synergy, or product market power. This implies
that mergers by firms that have related products or production will show greater cash flow

Post-merger corporate performance page 23
improvements than mergers between unrelated firms. 15 We examine this proposition by
classifying our sample firms as related or unrelated, and by comparing the average post-merger
cash flow improvements of the two groups. We classify mergers between firms with the same
Value Line industry definition as related. The results indicate that there are no differences in the
post-merger industry-adjusted operating cash flow retiuns between related and unrelated mergers.
We also classify mergers into related and uru-elated categories by examining the reasons
for undertaking mergers stated by the sample firms' managers in the merger prospectuses. The
potential to exploit product similarities or other associations is the most commonly stated reason
.
For example, the managers of Maryland Cup and Fort Howard Paper Co. (both in the paper
products industry) expected the merger to create "a number of new business opportunities as a
result of the compatibility of the two companies' businesses and customers." In addition, they
argued that "Maryland Cup could benefit from Fort Howard's production experience." The
second most frequently stated reason for merging is to reduce earnings volatility, as in the
Raytheon / Beech Aircraft merger. The managers of Raytheon anticipated that the acquisition
would "provide Raytheon with additional stability through product diversification as well as a
better balance between commercial and government-generated sales and earnings." We examine
whether there is a difference in post-merger cash flow returns for sample mergers undertaken to
exploit synergies and other mergers, and find no difference between the two groups.
The relation between the merging firms' businesses does not appear to be the sole
determinant of post-merger performance. For example. Pan Am and National AirUnes were both
in the airline business, yet their merger was unsuccessful. Pan Am expected the acquisition to
expand the domestic feeder routes to its international flights, providing a competitive edge over
15 Kaplan and Weisbach (1990) find that acquirers of firms in unrelated businesses are more likely to later
divest these targets than acquirers of related businesses.

Post-merger corporate performance page 24
other international carriers. However, the company did not have the expertise to run a domestic
airline, especially in the competitive conditions after deregulation. Further, Pan Am later
divested its Pacific routes, reducing the value of the National's domestic services to the west
coast.
Given the complexity and heterogeneity of reasons for mergers, we believe that large
sample studies are unlikely to provide significant new insights into the structural factors that
influence the outcomes of mergers. A promising approach is to examine a smaller number of
mergers in greater detail. These clinical studies will provide valuable evidence on the
mechanisms through which mergers increase cash flows, and will be fruitful avenues for future
research.
6. Summary
This paper examines the post-acquisition operating performance of merged firms using a
sample of the 50 largest mergers between U.S. public industrial firms completed in the period
1979 to 1983. We find that merged firms have significant improvements operating cash flow
returns after the merger, resulting from increases in asset productivity relative to their industries.
These cash flow improvements do not come at the expense of long-term performance, since
sample firms maintain their capital expenditure and R&D rates relative to their industries after the
merger. There is a strong positive relation between post-merger increases in operating cash flows
and abnormal stock returns at merger announcements, indicating that expectations of economic
improvements underlie the equity revaluations of the merging firms.

Post-merger corporate performance page 25
REFERENCES
Asquith, Paul, 1983, Merger bids, uncertainty, and stockholder returns, Journal of Financial
Economics, 11, 51-84.
Asquith, Paul, and E. Han Kim, 1982, The impact of merger bids on participating firms' security
holders. Journal of Finance 37, 1209-1228.
Bradley, Michael, Anand Desai and E. Han Kim, 1983, The rationale behind interfirm tender
offers: Information or synergy?. Journal of Financial Economics, 11, 183-206.
Bradley, M., A. Desai and E. Kim, 1988, Synergistic gains from corporate acquisitions and their
division between the stockholders of target and acquiring firms, Journal of Financial Economics,
21, 3-40.
Bull, I., 1988, Management Performance and leveraged buyouts: An empirical analysis,
Unpublished paper, University of Illinois at Urbana-Champaign.
Caves, Richard E., 1989, Effect of Mergers and Acquisitions on the Economy: An Industrial
Organization Perspective.
Dodd, Peter, 1980, Merger proposals, management discretion and stockholder wealth, Journal of
Financial Economics, 8, 105-138.
Dodd, Peter and Richard Ruback, 1977, Tender offers and stockholder returns: An empirical
analysis. Journal of Financial Economics, 5, 351-374.
Herman, E. and L. Lowenstein, 1988, The efficiency effects of hostile takeovers, in J. CoffeeJr., L. Lowenstein and S. Rose-Ackerman, eds.. Knights, raiders and targets: The impact of the
hostile takeover, (Oxford University Press, New York, NY).
Jensen, M. and R. Ruback, 1983, The market for corporate control: The scientific evidence.
Journal of Financial Economics, 1 1, 5-50.
Johnston, J., 1972, Econometric Methods, Second Edition, (McGraw-Hill, New York, NY).
Kaplan, S., 1990, The effects of management buyouts on operating performance and value,
Journal of Financial Economics, forthcoming.
Kaplan, S. and M. Weisbach, 1990, Acquisitions and diversification: What is divested and howmuch does the market anticipate? Working paper. University of Chicago.
Ravenscraft, D., and F. M. Scherer, 1987, Mergers, selloffs, and economic efficiency,
(Brookings, Washington, D.C.)
Ruback, R., Do target shareholders lose in unsuccessful control contests?, in CorporateTakeovers: Causes and Consequences, National Bureau of Economic Research, 1988.
Schleifer, A. and L. Summers, 1988, Breach of trust in hostile takeovers, in Corporate

Post-merger corporate performance page 26
Takeovers: Causes and Consequences, National Bureau of Economic Research.
Smith, A., 1990, Corporate ownership structure and performance: The case of managementbuyouts, Journal of Financial Economics, forthcoming.

Post-merger corporate performance page 27
Table 1
Descriptive statistics on time distribution of mergers, industry
distribution and relative asset sizes for 50 acquiring and 50 target firmsa
Panel A: Distribution ofMerger Years
Number of firms Percent of firms
1979 9 18
1980 6 12
1981 12 241982 9 18
1983 14 28
Total 50 100
Panel B: Distribution of Target and Acquiring Firms' Industries
Target firms Acquiring firms
Number of industries 27 33
Industries with 1 firm 15 22Industries with 2 firms 8 9Industries with 3 firms 2Industries with 4+ firms 2 2
Maximum number of firms in one industry 7 6
Panel C: Relative Asset Sizes of Target and Acquirers
Mean 42.0%
First quartile 16.5
Median 31.1
Third quarter 62.5
a The sample mergers are the largest acquisitions completed in the period 1979 to 1983 between public non-financial and
non-utility U.S. firms. Acquisition size is measured by the market value of common stock plus the book values of debt and
preferred stock for the target firm at the beginning of the year prior to the acquisition. The merger year is the year in which
the merger was completed. Relative asset size is the target's size as a percent of the size of the acquiring firm, where asset
size is the mailtet value of common stock plus the book values of debt and preferred stock at the beginning of the year prior
to completion of the acquisition. Industries are based on Value Line industry definitions prior to the merger.
Post-merger corporcae performance page 28
Table 2
Summary statistics on merger transaction accounting methods, number of bidders,
method of payment, and merger type for 50 mergers in the period 1979 to 1983.
Panel A: Distribution offirms by method of accounting for merger
Accounting method
Purchase method 78%Pooling of interests 22
Panel B: Distribution affirms by number of bidders
Number of bidders
One bidder 76%Two bidders 12Three bidders 8
Four or more bidders 4
Panel C: Distribution offirms by merger method ofpaymera
Method of payment
100% stock 24%100% cash 34Cash and stock 30Cash and notes 10Cash, stock and notes 2

Post-merger corporate performance page 29
Table 3
Firm and industry-adjusted median annual operating pre-tax cash flow return onassets for 50 combined target and acquirer firms' in years surrounding merger a
Year relative
to merger

Post-merger corporate performance page 30
Table 4
Definitions of variables used to analyze actual performance
of 50 targets and 50 acquirers in years surrounding mergers
Variable Definition
A. Operating Performance
Pre-tax operating margin
Asset turnover
Employee growth rate
Pension expense/employee
Earnings before depreciation, interest, and taxes as a percent of
sales
Sales divided by market value of assets at beginning of year (the
market value of common equity plus the book values of debt
and preferred stock)
Change in number of employees as a percent of number of
employees in the previous year
Pension expense per employee
B. Investment Policy
Capital expenditure rate
Asset sale rate
R&D rate
Capital expenditures as a percent of the market value of assets at
beginning of year
Asset sales as a percent of the market value of assets at beginning
of year
Research and development expenditures as a percent of the market
value of assets at beginnig of year

M
^
o
.a o•= 00
s e
E S
SJ i•I ^
1 ^
^ s
OO u
C3 3_ a-
•o cU C3
IS1^
S
oi.-9^
u
•s
o
3
a. g
s .1. OO
U OOCI. u
83
>
^^ 5§

Post-merger corporate performance page 32
Table 6
Equity and asset returns at merger announcements for 50 target
and acquiring firms merging in the period 1979 to 1983 *
Panel A: Distribution of equity returns at merger announcement
Target equity Acquiring equity Combined equity
45.6%b -2.2% 9.1%''Mean
First quartile
MedianThird quartiJe
21.2%41.8%''
64.1%
16.6%-3.6%3.4%
-2.9%
6.6%''
16.7%
Mean
First quartile
MedianThird quartile
Panel B: Distribution ofasset returns at merger announcement
Target firms Acquiring firms Combined firms
40.6%'' 0.6% 8.8%''
-2.3%
5.2%''
15.1%
19.0%

Post-merger corporate performance page 3i
Figure 1
Panel A: ARETi = y + A. CFRETi + "Oi
Unexpected asset
returns (ARET)
70% TARET(i) = 0.06 + 0.96 CFREr(i)
(2.3) (3.3) 60% +
R square = 0.21
-25% -20% -5%.^^^0?' 5% \(h 15% 20%
-20% ..
-30% ..
25%
Median post-merger industry-adjusted
pre-tax cash flow returns (CFRET)
a The mergers are completed in the period 1978 to 1983. The unexpected asset return is computed by unlevering the
combined equity announcement returns for the target and acquiring firms. The combined equity return for these firms is the
sum of the market-adjusted change in equity value for the target and acquirer in the meigo' announcement period as a
percentage of the sum of the pre-merger equity values for the two rirtns. Post-merger todustry-adjusted cash flow returns are
defined in table 3.
Post-merger corporate performance page 34
Figure 1 continued
Relation between median px)st-merger industry-adjusted cash flow returns and
unexpected asset returns at merger announcements for 50 merging firms*
Panel B: CFRETj = a + p ARETi + ei
Median post-merger industry-adjusted
pre-tax cash flow returns (CFRET)
70%
-25% i
CFRET(i) = 0.01 + 0.22 ARET(i)
(1.2) (3.3)
R square = 0.21
Unexjjected asset
returns (ARET)

Post-merger corporate performance page 35
AppendixAcquiring/Target Firms and their Industries
1. American Medical Intemarional /Lifemark
American Medical owns and operates proprietary hospitals and other health care businesses, andoffers medical-technical support (including diagnostic, cardio-pulmonary, and physical therapy
services, and management consulting services). Lifemark owns and manages general hospitals,
and provides cardio-pulmonary, physical therapy, pharmacy, and clinical laboratory services.
2. Anheuser-Busch Companies / Campbell Taggart Inc.
Anheuser-Busch is the world's largest brewer of beer. Campbell Taggart's business is bakingand distributing bread, rolls, crackers, cake and other sweet products, and food products.
3. Associated Drv Goods / Caldor Inc.
Associated Dry Goods operates general department stores in 25 states. Caldor operates 65promotional discount department stores in five states.
4. Avon Products Inc./ Mallinckrodt
Avon is the world's largest manufacturer of cosmetics and toiletries, and also sells costumejewellery and ceramics. Mallinckrodt develops and manufactures fine chemicals, drugs and other
health care products, and chemicals for the food, cosmetics, laboratory, petrochemical andprinting industries.
5. Best Products / Modem Merchandising Inc.
Best and Modem Merchandising are both catalog showroom retailers.
6. Brown-Forman Distillers / Lenox Inc.
Brown-Forman manufactures a wide variety of alcoholic beverages. Lenox operates produceshome furnishings (including china and crystal), and personal use products (including jewelry andluggage).
7. Burroughs Corp./ Memorex Corp.
Burroughs is a major participant in the data processing and business computer equipmentindustry. Memorex develops, manufactures, markets and services a wide range of computerperipheral equipment systems, and products employed in the recording, retrieval,
communication, and storage of information.
8. Coca Cola Co./ Columbia Pictures Industries Inc.
Coca-Cola is the largest manufacturer and distributor of soft drink concentrates and syrups in the
world. The company also manufactures citrus, coffee, tea, wine and plastic products. ColumbiaPictures produces and distributes theatrical motion pictures, television series and features,
amusement games, and commercials.
9. Con Agra Inc./ Peavey Co.Con Agra is a diversified food processor engaged in agriculture (agricultural chemicals, formula
feed, and fertilizers), grain (flour, by-products, and grain and feed merchandising) and food(frozen foods, broiler chicken, eggs, seafood, and pet products) industries. Peavey is also a
diversified food processor and retailer engaged in grain merchandising, food processing (flour,
bakery mixes, and jams), and operating specialty retail stores,
.

Post-merger corporateperformance poge 36
10. Cooper Industries /Gardner-Denver
Cooper is a diversified, international corporation which produces consumer and industrial tools,
aircraft services, mining and construction, and energy services. Gardner-Denver makes portable
and stationary air compressors, drilling equipment for above- and underground, and air-operated
tools.
11. Dart Industries /Kraft Inc.
Dart is diversified company that manufactures and markets consumer products, including
Tupperware containers, Duracell batteries, and West Bend appliances. Kraft manufactures food
products and markets them to retail, industrial and food service customers.
12. Diamond Shamrock / Natomas Co.
Diamond Shamrock is a domestic integrated oil and gas company with interests in coal andchemicals. Natomas is principally engaged in petroleum exploration and production.
13. E. I. Du Pont de Nemours / Conoco Inc.
Du Pont manufactures diversified hnes of chemicals, plastics, specialty products, and fibers.
Conoco is engaged in the exploration, production, and transportation of crude oil, coal, andnatural gas; petroleum refining; and the production, processing and transportation of chemicals.
14. Eaton Corp./ Cutler-Hammer Inc.
Eaton is engaged in technologically related businesses in areas of transportation, materials
handling, industrial automation, security, construction, agriculture and consumer durables.
Cutler-Hammer designs and manufactures electronic and electrical components and system for
industrial, aerospace, air traffic control, semiconductor, housing, and consumer markets.
15. Exxon Corp./ Reliance Electric Co.Exxon is engaged in the exploration, production, and transportation of crude oil and natural gas;
and the production and transportation of petroleum and chemicals. Reliance develop,manufacture, and servicing a broad line of industrial equipment, including electric motors anddrives, mechanical power transmission components, industrial and retail scales and weighingsystems, and telecommunications equipment
16. Fairchild Industries / VSI Corp.
Fairchild produces military aircraft and parts, commercial aircraft and parts, spacecraft and parts,
and domestic communications systems. VSI is a diversified manufacturer of a wide range of
precision metal products (including fastening systems for aircraft and missiles, steel mod bases
for the plastics industry, door knobs, stainless steel cabinets, and building hardware.
17. Fluor Corp./ St. Joe Minerals Corp.
Fluor designs, engineers, procures and constructs complex manufacturing plants, processing
plants, and related facilities for energy, natural resources and industrial clients. St. Joe is a
diversified producer of natural resources (principally coal, lead, gold, oil and gas, zinc, silver and
iron ore).
18. Fort Howard Paper Co./ Maryland Cup Corp.
Fort Howard manufactures a broad line of disposable sanitary paper products, principally table
napkins, paper towels, toilet tissue, industrial and automotive wipes, and boxed facial tissues.
Maryland Cup manufactures a variety of single use paper and plastic products for food andbeverage service, including plates, cups, bowls, cutlery, cirinking straws and toothpicks.

Post-merger corporateperformance page 37
19. Freeport Minerals Co./ McMoran Oil & Gas Co.
Freeport Minerals is a diversified company engaged in exploration and development of natural
resources, including agricultural minerals, oil and gas, uranium, oxide and kaolin. McMoran is
engaged in the acquisition, exploration and development of oil and gas properties, and the
production and sale of oil and natural gas.
20. Gannett Co. Inc./ Combined Communications Corp .
Gannett and its subsidiaries publish daily newspapers. Combined Communications Corporation
is engaged in television and radio broadcasting, outdoor advertising and newspaper publishing.
21. General Foods Corp./ Oscar Mayer & Co. Inc.
General Foods is a leading processor of packaged grocery products. Oscar Mayer operates in
the meat packing and processing industry.
22. Genstar Ltd./ Flintkote Co.
Genstar manufactures building materials and cement, and is engaged in housing and land
development, construction, marine transportation, financial services, and venture capital
investment Flintkote is engaged in mining, and manufactures various building and construction
materials, including gypsum wallboard, floor tile, sand and gravel products, concrete, cementand various Ume products.
23. Gulf & Western Industries / Simmons Co.Gulf and Western is a conglomerate with interests in the manufacture of automotive and air-
conditioning components, paper products, leisure, financial services, automotive replacementparts, consumer products sugar growing and processing, citrus farming, natural resources, andapparel. Simmons produces furnishings for home, commercial and institutional customers.
24. Harris Corp./ Lanier Business Products Inc.
Harris designs and produces voice and video communication, and information processing
systems, equipment, and components. Lanier develops, manufactures, and services a broad line
of dictating equipment, several models of video-display text-editing typewriters, and small
business computers.
25. Holiday Inns Inc./ Harrahs
Holiday Inns owns and operates hotels throughout the world. Harrahs operates two luxury
hotel/casinos.
26. Intemorth Inc./ Belco Petroleum Corp.Intemorth owns and operates natural gas businesses; produces, transports, and markets liquid
fuels and petrochemicals; and is involved in the exploration and production of oil and gas. Belco
is engaged in the exploration and production of crude oil and natural gas, and the production of
coal.
27. Kroger Inc./ Dillon Companies Inc.
Kroger operates the country's second largest supermarket chain; manufactures and processes
food for sale by these supermarkets; and operates one of the country's largest drugstore chains.
Dillon distributes retail food through supermarkets and convenience stores.
28. Litton Industries / Itek Corp.
Litton produces advanced electronics products for defense, industrial automation and geophysical
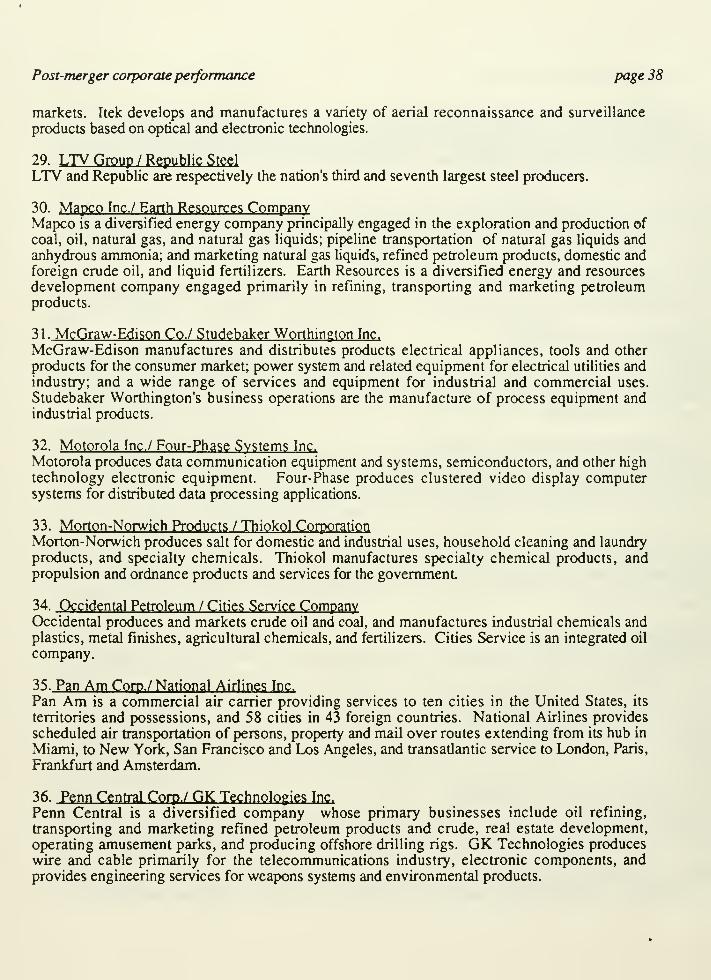
Post-merger corporateperformance page 38
markets. Itek develops and manufactures a variety of aerial reconnaissance and surveillance
products based on optical and electronic technologies.
29. LTV Orgyp / RgpyflJg Stggl
LTV and Republic are respectively the nation's third and seventh largest steel producers.
30. Mapco Inc./ Earth Resources CompanyMapco is a diversified energy company principally engaged in the exploration and production of
coal, oil, natural gas, and natural gas liquids; pipeline transportation of natural gas liquids andanhydrous ammonia; and marketing natural gas liquids, refined petroleum products, domestic andforeign crude oil, and liquid fertilizers. Earth Resources is a diversified energy and resources
development company engaged primarily in refining, transporting and marketing petroleumproducts.
31. McGraw-Edison Co./ Studebaker Worthington Inc.
McGraw-Edison manufactures and distributes products electrical appliances, tools and other
products for the consumer market; px>wer system and related equipment for electrical utilities andindustry; and a wide range of services and equipment for industrial and commercial uses.
Studebaker Worthington's business operations are the manufacture of process equipment andindustrial products.
32. Motorola Inc./ Four-Phase Systems Inc.
Motorola produces data communication equipment and systems, semiconductors, and other high
technology electronic equipment. Four-Phase produces clustered video display computersystems for distributed data processing applications.
33. Morton-Norwich Products / Thiokol Corporation
Morton-Norwich produces salt for domestic and industrial uses, household cleaning and laundry
products, and specialty chemicals. Thiokol manufactures specialty chemical products, andpropulsion and ordnance products and services for the government
34. Occidental Petroleum / Cities Service CompanvOccidental produces and markets crude oil and coal, and manufactures industrial chemicals andplastics, metal finishes, agricultural chemicals, and fertilizers. Cities Service is an integrated oil
company.
35. Pan Am Corp./ National Airlines Inc.
Pan Am is a commercial air carrier providing services to ten cities in the United States, its
territories and possessions, and 58 cities in 43 foreign countries. National Airlines provides
scheduled air transportation of persons, property and mail over routes extending from its hub in
Miami, to New York, San Francisco and Los Angeles, and transatlantic service to London, Paris,
Frankfurt and Amsterdam.
36. Penn Central Corp./ GK Technologies Inc.
Penn Central is a diversified company whose primary businesses include oil refining,
transporting and marketing refined petroleum products and crude, real estate development,
operating amusement parks, and producing offshore drilling rigs. GK Technologies produces
wire and cable primarily for the telecommunications industry, electronic components, and
provides engineering services for weapons systems and environmental products.

Post-merger corporateperformance page 39
37. Phillips Petroleum / General American Oil of Texas
Phillips Petroleum is a fully integrated oil company engaged in petroleum exploration,
production, and refining. General American is primarily engaged in oil and gas production andexploration.
38. Raytheon Corp./ Beech Aircraft Corp.
Raytheon develops and manufactures electronic systems for government and commercial use.
Raytheon is also supplies energy services, manufactures major home appliances, designs andmanufactures heavy construction equipment, and publishes textbooks. Beech Aircraft designs,
manufactures, and sells airplanes for the general aviation market. Beech is also a substantial
aerospace contractor producing a variety of military aircraft, missile targets, and cryogenics
systems for aerospace vehicles.
39. Revlon Inc./ Technicon Corp.Revlon is in the beauty products and health products and service business. Technicon designs andproduces automated testing systems for blood and other biological fluids, chemical reagents andconsumables, industrial analytical instruments, and medical information systems.
40. R.J. Revnolds Corp./ Del Monte Corp.
R.J. Reynolds' lines of business are the domestic and international manufacture and sale of
tobacco products, transportation (container size freight transportation systems carrying general
cargo), energy (oil and gas products), food and beverage products, and aluminum products andpackaging. Del Monte's principal business is in food products (primarily processed foods, andfresh fruit), and related services (including transportation, and institutional services).
41. Si gnal Companies / Wheelabrator Frye Inc.
Signal is a diversified, technology -based company which manufactures aerospace equipment,professional audio-video systems, and heavy trucks. Wheelabrator Frye's products and services
include environmental, energy and engineered products and services, and chemical and specialty
products.
42. Smithkline Corp./ Beckman Instruments Inc.
Smithkline researches, develops, manufactures, and markets ethical drugs, proprietary
medicines, animal health products, ethical and proprietary eye care products, and ultrasonic andelectronic instruments. Beckman is an international manufacturer of laboratory analytical
instruments and related chemical products that are used widely in medicine and science, and in a
broad range of industrial applications.
43. Sohio / Kennecott Corp.Sohio is an integrated petroleum company engaged in all phases of the petroleum business.
Kennecott produces copper, gold, silver, molybdenum and lead; manufactures industrial abrasive
and resistant materials; manufactures and markets industrial engineered systems; and owns two-
thirds of a Canadian producer of titanium dioxide slag, high purity iron, and iron powders.
44. Standard Brands /Nabisco Inc.
Nabisco is a manufacturer and marketer of food products (specializing in cookies and crackers),
toiletries, pharmaceuticals, and household accessories. Standard Brands is a manufacturer,
processor and distributor of food and related products.

Post-merger corporate performance page 40
45. Tenneco / Houston Oil & Minerals Corp .
The major businesses of Tenneco are integrated oil and gas operations, natural gas pip)elines,
construction and farm equipment, automotive components, shipbuilding, chemicals, packaging,
agriculture and land management, and life insurance. The recent business emphasis of HoustonOil & Minerals has been on the exploration for oil and natural gas on undeveloped properties, and
the development of production upon discovery.
46. Tosco Corp/ ATT, Resources Inc.
Tosco owns and operates petroleum refineries and related wholesale distribution facilities. AZLhas been in the process of changing its focus from agricultural-based businesses to oil and gas
exploration and production.
47. U.S. Steel / Marathon Oil Co.
U.S. Steel's principal business include steel, chemicals, resource development, fabricating andengineering, and transportation. Marathon is an integrated petroleum company engaged in the
production, refining, and transportation of crude oil, natural gas and petroleum products
48. United Technologies / Carrier CorpUnited Technologies designs and produces high-technology power systems, flight systems, andindustrial products and services. Carrier's principal business is the manufacture and sale of air
conditioning equipment
49. Westinghouse Electric / Teleprompter Corp.
Westinghouse Electric is a diversified corporation primarily engaged in the manufacture and sale
of electrical equipment. Westinghouse's wholly owned subsidiary WBC operates six TVstations, 12 radio stations, and cable television systems. Teleprompter is nation's largest cable
television company, and owns MUZAC, the leading supplier of music to offices and other
commercial establishments.
50. Williams Companies / Northwest Energy CompanyWilliams is primarily engaged in the chemical fertilizer, energy and metals businesses.
Northwest is primarily engaged in interstate natural gas transmission, oil and gas exploration, andmarketing natural gas liquids.
7253 06t+


Date DueIBCT 1
"HimAi
/1{/S. .:?
* -:.
Lib-26-67

MIT LIBRSPieS nilPl 1
3 TOflO 00563203 2