DOE’s 449 MHz Wind Profiling Radars on the U.S. West …€™s 449 MHz Wind Profiling Radars on...
30
PNNL-25925 Prepared for the U.S. Department of Energy under Contract DE-AC05-76RL01830 DOE’s 449 MHz Wind Profiling Radars on the U.S. West Coast: Annual Summary for Fiscal Year 2016 September 2016 JE Flaherty WJ Shaw JM Wilczak AB White CW King TE Ayers
Transcript of DOE’s 449 MHz Wind Profiling Radars on the U.S. West …€™s 449 MHz Wind Profiling Radars on...

PNNL-25925
Prepared for the U.S. Department of Energy under Contract DE-AC05-76RL01830
DOE’s 449 MHz Wind Profiling Radars on the U.S. West Coast: Annual Summary for Fiscal Year 2016
September 2016
JE Flaherty WJ Shaw JM Wilczak AB White CW King TE Ayers

PNNL-25925
DOE’s 449 MHz Wind Profiling Radars on the U.S. West Coast: Annual Summary for Fiscal Year 2016 JE Flaherty WJ Shaw JM Wilczak AB White CW King TE Ayers September 2016 Prepared for the U.S. Department of Energy under Contract DE-AC05-76RL01830 Pacific Northwest National Laboratory Richland, Washington 99352


v
Summary
The three coastal wind profilers and associated meteorological instruments located in Forks, Washington, Astoria, Oregon, and North Bend, Oregon, provide important observations at high temporal and vertical spatial resolution for characterizing the meteorological inflow to the western region of the United States. These instruments have been operating for a year or more, and furnish boundary conditions for the modeling efforts of the WFIP 2 project. The data have been delivered to archives at both National Oceanic and Atmospheric Administration (NOAA) and the U.S. Department of Energy’s Atmosphere to Electrons Data Archive and Portal at a data recovery rate in excess of 98%. Site maintenance activities have been relatively minor, and have involved only a few component replacements and repairs to radio acoustic sounding system foam. Bird mortality surveys have found no bird nests or carcasses, and the U.S. Fish and Wildlife Service has regularly been provided survey reports. This project represents a successful collaboration between Pacific Northwest National Laboratory and NOAA to procure, test, deploy, maintain, and operate three 449 MHz radar wind profilers.

vii
Acknowledgments
This work was funded by the U.S. Department of Energy (DOE) Office of Energy Efficiency and Renewable Energy. We express our appreciation to Joel Cline, DOE Project Manager, for his support of this effort.


ix
Acronyms and Abbreviations
A2e Atmosphere to electrons DAP Data Archive and Portal DOE Department of Energy EMC Environmental Modeling Center ESRL Earth System Research Laboratory GPS Global Positioning System GW gigawatt(s) km kilometer(s) m meter(s) MHz megahertz NCEP National Centers for Environmental Prediction NEPA National Environmental Policy Act NOAA National Oceanic and Atmospheric Administration OTH airport code for Southwest Oregon Regional Airport PNNL Pacific Northwest National Laboratory radar Radio Detection and Ranging RASS radio acoustic sounding system U.S. United States of America UTC Coordinated Universal Time WFIP Wind Forecast Improvement Project


xi
Contents
Summary ....................................................................................................................................................... v Acknowledgments ....................................................................................................................................... vii Acronyms and Abbreviations ...................................................................................................................... ix Contents ....................................................................................................................................................... xi Figures ........................................................................................................................................................ xii Tables .......................................................................................................................................................... xii 1.0 Introduction ....................................................................................................................................... 1.1 2.0 Radar Wind Profiler Operations ........................................................................................................ 2.1
2.1 Equipment Maintenance ............................................................................................................ 2.1 2.2 Data Availability ....................................................................................................................... 2.2 2.3 High-Wind Case ........................................................................................................................ 2.3
3.0 Summary ............................................................................................................................................ 3.1 4.0 References ......................................................................................................................................... 4.1
xii
Figures
1.1 Radar Wind Profiler Sites along the U.S. West Coast ....................................................................... 1.2 2.1 Chart of Operational Period at Each Radar Wind Profiler Site ......................................................... 2.1 2.2 Daily Weather Map from March 1, 2016 ........................................................................................... 2.5 2.3. Meteorological Station Data from the Forks, Washington Site on March 1, 2016 ............................ 2.6 2.4 Meteorological station data from the Astoria, Oregon site on March 1, 2016 ................................... 2.7 2.5 Meteorological Station Data from the North Bend, Oregon Site on March 1, 2016 ......................... 2.8 2.6 Radar Data from the Forks, Washington Site on March 1, 2016 ....................................................... 2.9 2.7 Radar Data from the Astoria, Oregon Site on March 1, 2016............................................................ 2.9 2.8 Radar data from the North Bend, Oregon site on March 1, 2016 .................................................... 2.10
Tables
2.1 Site Maintenance Dates and Activities for the Three Radar Wind Profiler Sites .............................. 2.2 2.2 Radar Data Recovery Rates at the Three Radar Sites ........................................................................ 2.3

1.1
1.0 Introduction
Over the last decade, installed wind capacity in the United States has grown significantly; nearly 74 GW were installed by the end of 2015. This represents approximately 5% of overall electrical energy capacity from all sources. During 2015, approximately 41% of all new electrical capacity in the United States has been from wind (DOE 2016).
As the contribution of wind energy to the overall U.S. electrical power production grows, so does the importance of accurate forecasts of wind power production. These forecasts are necessary to maintain stability in the electrical grid and keep power costs low. Forecast accuracy, in large part, depends on data to provide accurate initialization of numerical weather forecast models. Currently, routine observations of winds and temperatures above the surface are provided primarily by sparsely distributed (in both space and time) radiosonde systems in many regions. Benjamin et al. (2010) have demonstrated that assimilation of wind profiling radar observations into numerical weather prediction models improves the accuracy of wind forecasts in the troposphere. The Wind Forecast Improvement Project (WFIP; Wilczak et al. 2015) showed that additional model initialization data, especially above the surface, provided a clear benefit to hub-height forecast accuracy. Because weather systems generally progress from west to east, the greatest benefit is expected from additional model initialization data collected to the west of areas of forecast interest.
The U.S. Department of Energy (DOE), in collaboration with the National Oceanic and Atmospheric Administration (NOAA), installed three new wind profiling radars on the Washington and Oregon coasts during calendar year 2015. These systems operate at a frequency of 449 MHz and provide mean wind profiles to a height of approximately 8 km; the maximum measurement height depends on time-varying atmospheric conditions. This is roughly half the depth of the troposphere at these latitudes. A radio acoustic sounding system (RASS) is installed with each radar system to provide a measure of the temperature profile to heights of approximately 2 km (depending on atmospheric conditions). Additional equipment at these sites includes a 10 m meteorological tower, a tipping-bucket rain gauge, and a Global Positioning System (GPS) antenna to measure column-integrated water vapor (Bevis et al. 1992). Details regarding the radar sites, instruments, and data streams are provided by Flaherty et al. (2015).
The three DOE coastal radar wind profilers complement four identical profilers that are being installed by NOAA along the California coast on behalf of the California Department of Water Resources (White et al. 2013). These profilers are spaced approximately 250 km apart, from Santa Barbara, California, in the south to Forks, Washington, in the north. This “picket fence” of wind profilers (Figure 1.1) is expected to significantly improve wind forecasts from the National Weather Service’s foundational forecast models. In addition, the data from the DOE profilers will provide valuable information to the second WFIP (WFIP 2) that will help improve the representation of physical processes in resource characterization models. The WFIP 2 field study in the Columbia River Valley of Oregon and Washington began in 2015 and will conclude in early 2017.
This report describes the first year of operation of the three DOE wind profilers. It also describes the site maintenance activities, data dissemination, and an illustrative case study of data collected at these sites. It serves as the annual milestone summary for project 68578 (WBS 1.3.1.602, WFIP 2 Wind Profiler Support).

1.2
Figure 1.1. Radar Wind Profiler Sites along the U.S. West Coast

2.1
2.0 Radar Wind Profiler Operations
The coastal radar wind profilers described in this report were deployed to more accurately characterize the inflow boundary conditions for numerical weather forecast models by measuring the profiles of wind speed and wind direction along the west coast of the United States. Most large-scale systems in this area propagate from the west to the east, use of these data are expected to result in improvements in both wind forecasts in the west and in the next-day forecasts in the central United States.
This project began in fiscal year 2014 with the planning and procurement tasks necessary for this profiler deployment. Sites were installed beginning in July 2015 and all three sites were operational by October 2015 (see Figure 2.1). This section describes the first year of radar operations, including equipment maintenance and site visit activities, data storage, data recovery, and example data during a selected high-wind case.
Figure 2.1. Chart of Operational Period at Each Radar Wind Profiler Site
2.1 Equipment Maintenance
NOAA performs maintenance visits for each of the profiler sites approximately once per calendar quarter. During each visit, the condition of the equipment is evaluated, any necessary repairs or replacements are made, data backup is verified, spectral data are retrieved, and any site landscaping needs are addressed. (Site owners do not mow the grass near the radar equipment to avoid interfering with guy wires, so grass trimming is performed during growing season maintenance visits.) No major issues have been noted since the radar sites were installed, but the following minor needs have been addressed:
• During periods of heavy rain and wind, rainwater was getting into the instrument trailer through the rooftop air-conditioning unit at all three sites. A plastic tub was placed below the air conditioner in each trailer to catch the water and to prevent damage to the wood floors.
• The foam lining of the RASS enclosure was coming loose at all three sites during wet weather. Repairs were made when the weather was dry.
• Two RASS transducers have been replaced at the Forks site because of failed voice coils. The cause for this repeated failure is still under investigation.
o The failure of one voice coil does not result in any noticeable reduction in RASS coverage. The transducer was replaced and the transducer with the failed voice coil was returned to the lab for repair.
In addition, instrument function is monitored regularly by NOAA staff in Boulder, Colorado. System re-starts, voltage checks, and other maintenance activities are performed remotely.
2.2
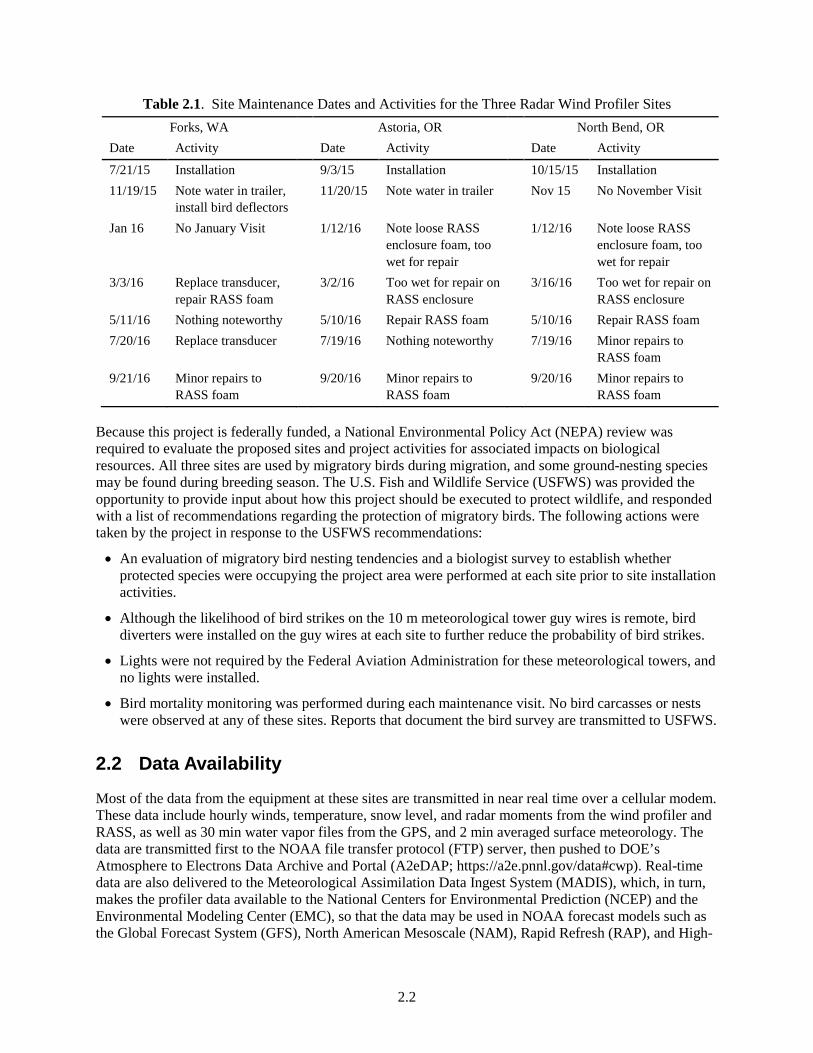
Table 2.1. Site Maintenance Dates and Activities for the Three Radar Wind Profiler Sites Forks, WA Astoria, OR North Bend, OR
Date Activity Date Activity Date Activity
7/21/15 Installation 9/3/15 Installation 10/15/15 Installation 11/19/15 Note water in trailer,
install bird deflectors 11/20/15 Note water in trailer Nov 15 No November Visit
Jan 16 No January Visit 1/12/16 Note loose RASS enclosure foam, too wet for repair
1/12/16 Note loose RASS enclosure foam, too wet for repair
3/3/16 Replace transducer, repair RASS foam
3/2/16 Too wet for repair on RASS enclosure
3/16/16 Too wet for repair on RASS enclosure
5/11/16 Nothing noteworthy 5/10/16 Repair RASS foam 5/10/16 Repair RASS foam 7/20/16 Replace transducer 7/19/16 Nothing noteworthy 7/19/16 Minor repairs to
RASS foam 9/21/16 Minor repairs to
RASS foam 9/20/16 Minor repairs to
RASS foam 9/20/16 Minor repairs to
RASS foam
Because this project is federally funded, a National Environmental Policy Act (NEPA) review was required to evaluate the proposed sites and project activities for associated impacts on biological resources. All three sites are used by migratory birds during migration, and some ground-nesting species may be found during breeding season. The U.S. Fish and Wildlife Service (USFWS) was provided the opportunity to provide input about how this project should be executed to protect wildlife, and responded with a list of recommendations regarding the protection of migratory birds. The following actions were taken by the project in response to the USFWS recommendations:
• An evaluation of migratory bird nesting tendencies and a biologist survey to establish whether protected species were occupying the project area were performed at each site prior to site installation activities.
• Although the likelihood of bird strikes on the 10 m meteorological tower guy wires is remote, bird diverters were installed on the guy wires at each site to further reduce the probability of bird strikes.
• Lights were not required by the Federal Aviation Administration for these meteorological towers, and no lights were installed.
• Bird mortality monitoring was performed during each maintenance visit. No bird carcasses or nests were observed at any of these sites. Reports that document the bird survey are transmitted to USFWS.
2.2 Data Availability
Most of the data from the equipment at these sites are transmitted in near real time over a cellular modem. These data include hourly winds, temperature, snow level, and radar moments from the wind profiler and RASS, as well as 30 min water vapor files from the GPS, and 2 min averaged surface meteorology. The data are transmitted first to the NOAA file transfer protocol (FTP) server, then pushed to DOE’s Atmosphere to Electrons Data Archive and Portal (A2eDAP; https://a2e.pnnl.gov/data#cwp). Real-time data are also delivered to the Meteorological Assimilation Data Ingest System (MADIS), which, in turn, makes the profiler data available to the National Centers for Environmental Prediction (NCEP) and the Environmental Modeling Center (EMC), so that the data may be used in NOAA forecast models such as the Global Forecast System (GFS), North American Mesoscale (NAM), Rapid Refresh (RAP), and High-
2.3
Resolution Rapid Refresh (HRRR) models. A comparison between the profiler data and the NOAA forecast models is available on a NOAA-hosted WFIP2 data site: http://wfip.esrl.noaa.gov/psd/programs/wfip2/.
The radar spectra are saved on the local computer housed in the trailer at each site, but because of their large file size these data are not transmitted over the cellular network. Instead, during maintenance visits at the sites, the spectra are manually downloaded to a hard drive and uploaded to the NOAA FTP server upon return to NOAA. These data have been posted to the A2e DAP as well.
Real-time data recovery statistics as well as raw data recovery statistics are computed for each site. There are times when real-time data delivery is delayed, primarily due to communications problems. However, the data are collected at the site, and the data archive eventually catches up with the site. Raw data outages, during which the data are lost and not delivered to the archive, are rare. There was just one instance when there was multi-day data loss at the Forks site. The temperature within the trailer dropped below a threshold value, which caused the system to shut down. This occurrence began on December 31, 2015, so it was not identified and corrected until staff returned to the office on January 4, 2016, after the New Year’s holiday. Data recovery rates from the radar for the period January 1 through September 20, 2016, were provided by NOAA and are listed in Table 2.2.
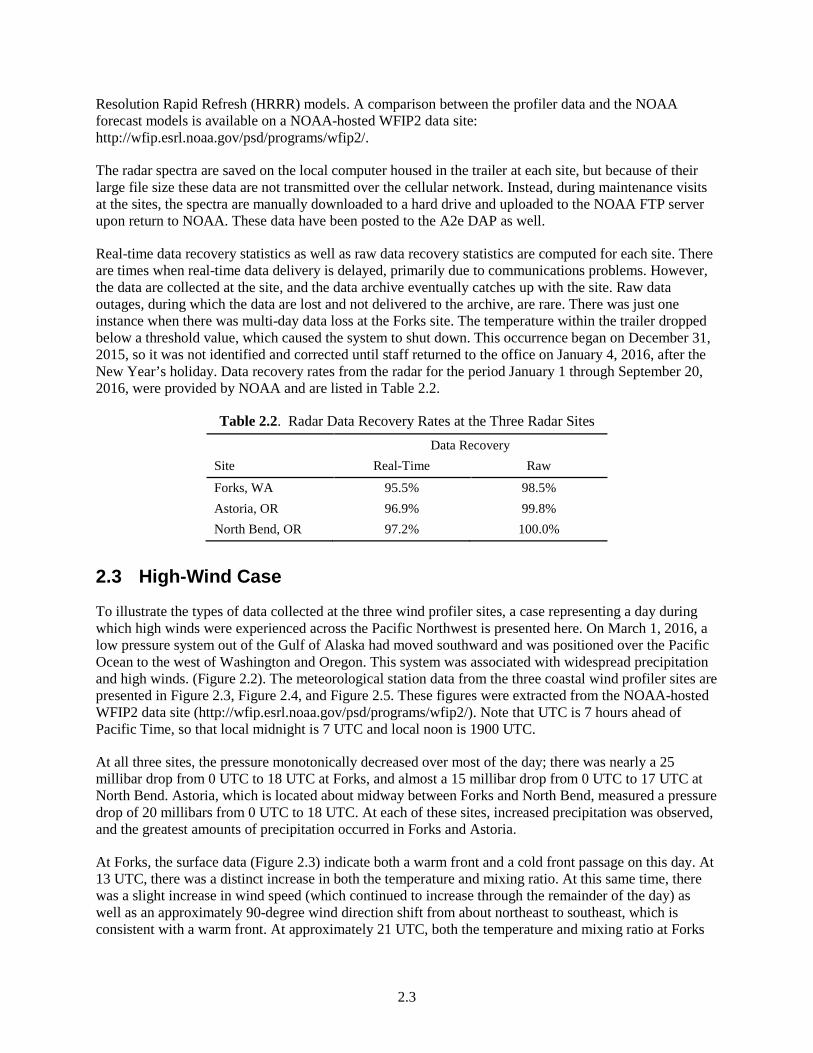
Table 2.2. Radar Data Recovery Rates at the Three Radar Sites
Site Data Recovery
Real-Time Raw
Forks, WA 95.5% 98.5% Astoria, OR 96.9% 99.8% North Bend, OR 97.2% 100.0%
2.3 High-Wind Case
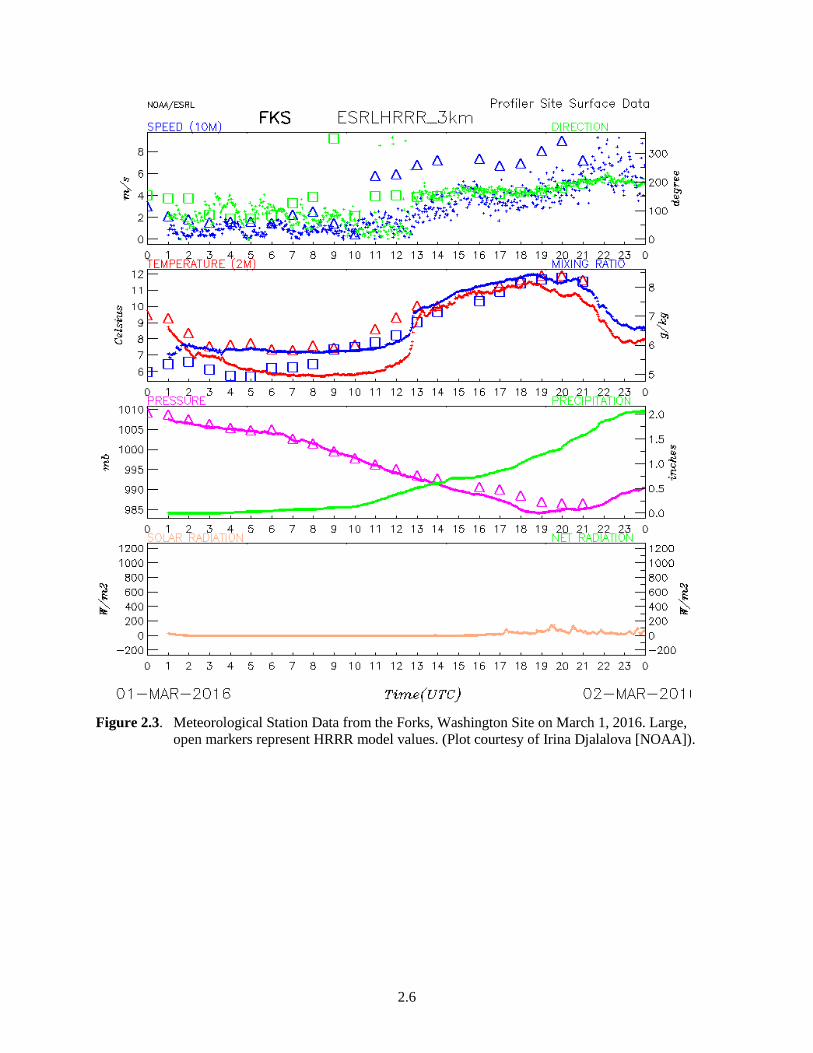
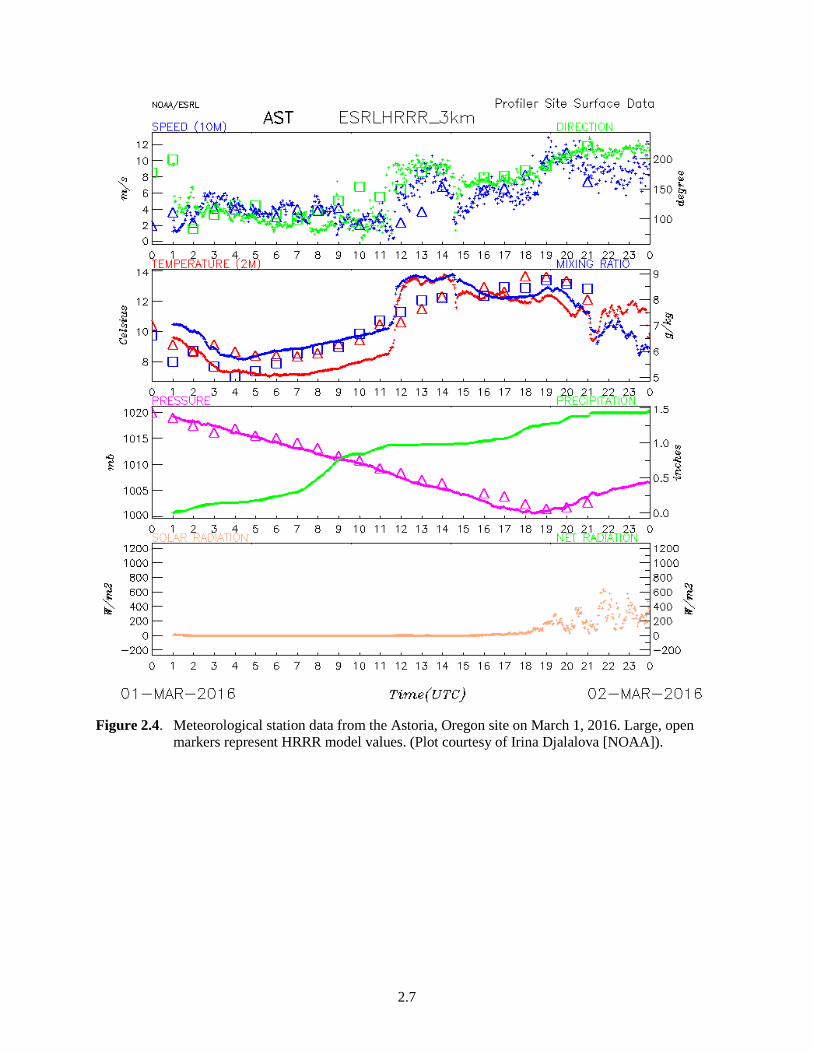
To illustrate the types of data collected at the three wind profiler sites, a case representing a day during which high winds were experienced across the Pacific Northwest is presented here. On March 1, 2016, a low pressure system out of the Gulf of Alaska had moved southward and was positioned over the Pacific Ocean to the west of Washington and Oregon. This system was associated with widespread precipitation and high winds. (Figure 2.2). The meteorological station data from the three coastal wind profiler sites are presented in Figure 2.3, Figure 2.4, and Figure 2.5. These figures were extracted from the NOAA-hosted WFIP2 data site (http://wfip.esrl.noaa.gov/psd/programs/wfip2/). Note that UTC is 7 hours ahead of Pacific Time, so that local midnight is 7 UTC and local noon is 1900 UTC.
At all three sites, the pressure monotonically decreased over most of the day; there was nearly a 25 millibar drop from 0 UTC to 18 UTC at Forks, and almost a 15 millibar drop from 0 UTC to 17 UTC at North Bend. Astoria, which is located about midway between Forks and North Bend, measured a pressure drop of 20 millibars from 0 UTC to 18 UTC. At each of these sites, increased precipitation was observed, and the greatest amounts of precipitation occurred in Forks and Astoria.
At Forks, the surface data (Figure 2.3) indicate both a warm front and a cold front passage on this day. At 13 UTC, there was a distinct increase in both the temperature and mixing ratio. At this same time, there was a slight increase in wind speed (which continued to increase through the remainder of the day) as well as an approximately 90-degree wind direction shift from about northeast to southeast, which is consistent with a warm front. At approximately 21 UTC, both the temperature and mixing ratio at Forks

2.4
decreased as a cold front passed over the site. Skies were generally overcast at Forks; the solar radiation measurements were nearly flat and a few spikes that were less than 200 W/m2.
At Astoria (Figure 2.4), the temperature and mixing ratio increase occurred at about 12 UTC, which is consistent with a warm front moving northward from Astoria toward Forks. Forks saw the warm front passage an hour later at 13 UTC. At Astoria, this warm front was associated with a pretty significant wind speed increase and wind direction shift. The cold front passage at Astoria, at around 19 UTC, is also indicated by post-frontal clearing, which results in higher solar radiation signals—spikes as high as 600 W/m2.
Only a cold front is observed at the North Bend site (Figure 2.5). The temperature and mixing ratios at North Bend were somewhat erratic during the first part of the day, but had a distinct increase at around 16 UTC. This increase was also associated with a wind speed increase and wind direction shift comparable to that observed at Astoria during the cold front passage there. Additionally, the precipitation at the site increased during the frontal passage, and the skies cleared after the frontal passage, which is consistent with a cold front.
Note that the large, open markers on the upper three panels of Figure 2.3, Figure 2.4, and Figure 2.5 are the NOAA HRRR model predictions. In general, the pressure was predicted relatively well, but temperature predictions were often about 2°C higher than measurements at Forks and Astoria, particularly before the warm front. The North Bend temperatures during the first part of the day were not predicted well, but the timing of the temperature increase was captured fairly well.
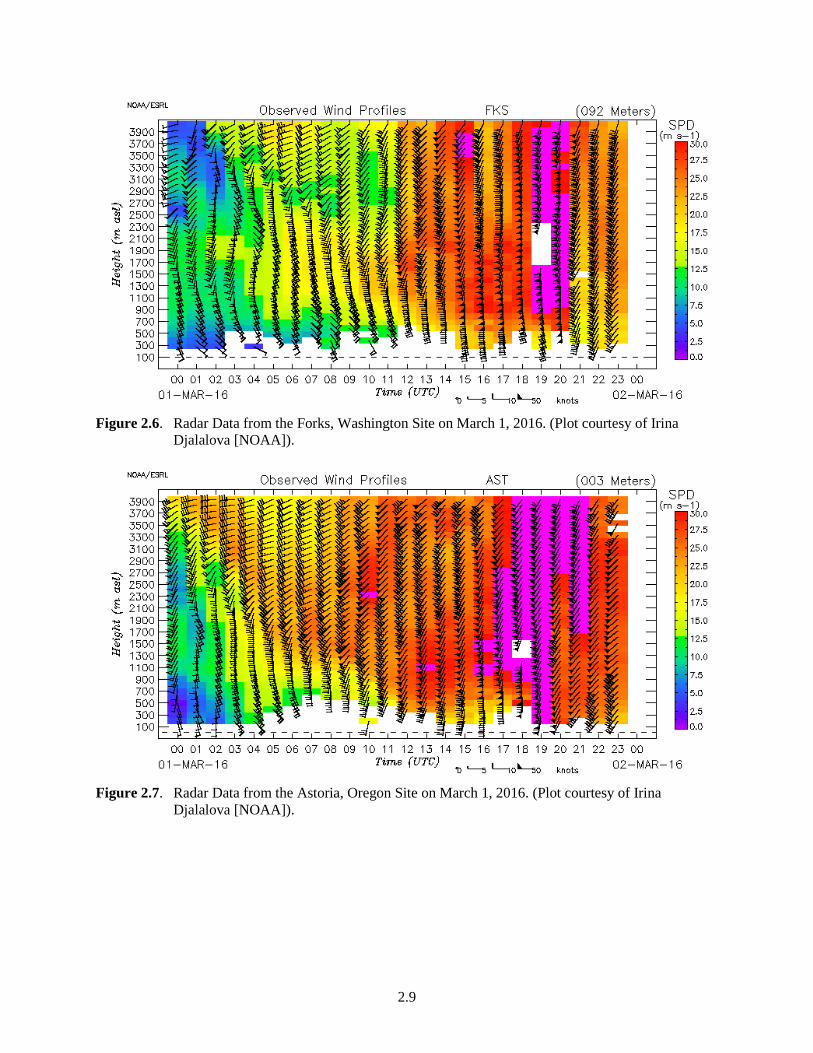
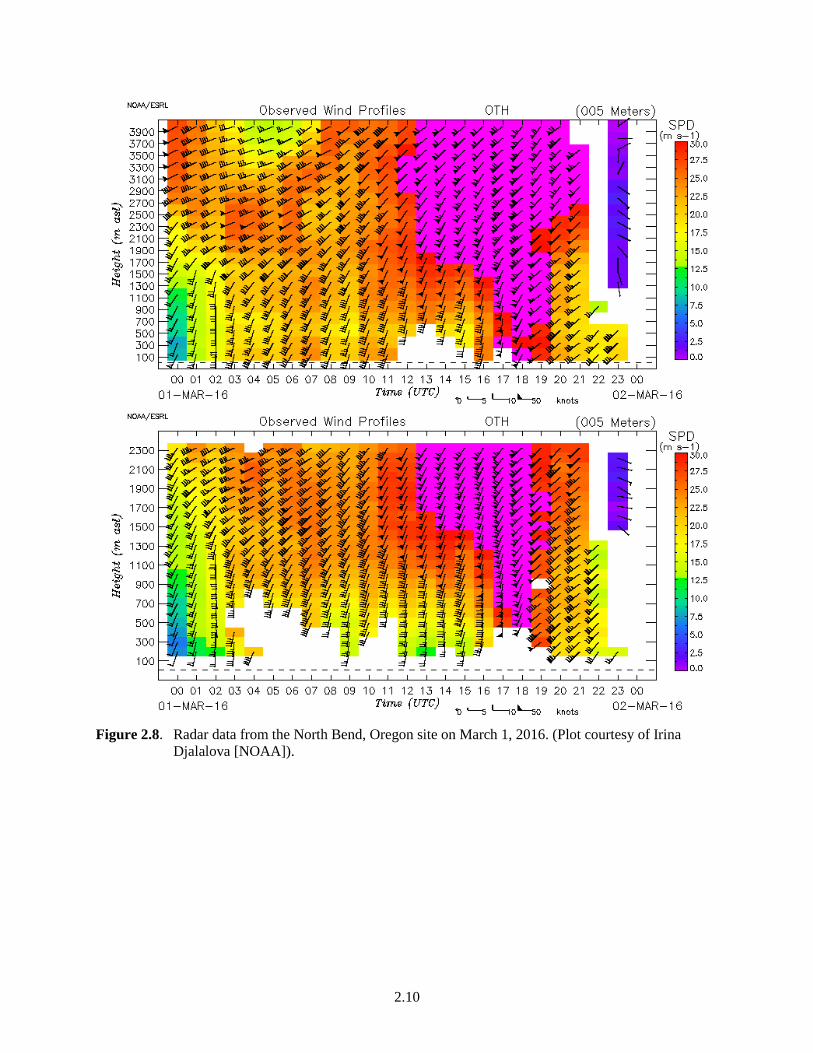
The radar profiles for approximately the lowest 4 km at Forks and Astoria, North Bend are included in Figure 2.6, Figure 2.7, and Figure 2.8. These are the plots from the radar Low Mode at Forks and Astoria, and the High Mode at North Bend. It appears that the plotting convention for the North Bend site limits the Low Mode plot to 2300 m, so the High Mode is included to provide similar height coverage to Forks and Astoria. Note that the vertical resolution for the High Mode is half of that of the Low Mode. The profile from Forks (Figure 2.6) shows wind direction changes with height through 11 UTC, then the profile is primarily uniform in wind direction and at higher wind speeds after 12 UTC. The Astoria wind profile shows the vertical structure of the warm front as it passed over the site; it shows a relatively clear line where the wind direction changes with height, and that height decreases with time until the full profile is relatively uniform in wind direction at 11 UTC. The cold front passage is not as distinct at the North Bend site; this is likely attributable to the fact that this site is the farthest south and the most distant from the center of the low pressure system. The pressure minimum measured at this site on this day was the highest value among the three sites. At 23 UTC, it appears that there is erroneous wind data at North Bend, perhaps due to radio frequency interference. This type of extreme outlier is rejected by data assimilation systems, so it is unlikely to adversely affect forecasts. However, recent improvements to signal processing algorithms will eliminate this type of error.

2.5
Figure 2.2. Daily Weather Map from March 1, 2016. (Retrieved from
http://www.wpc.ncep.noaa.gov/dailywxmap/index_20160301.html.)
2.6
Figure 2.3. Meteorological Station Data from the Forks, Washington Site on March 1, 2016. Large,
open markers represent HRRR model values. (Plot courtesy of Irina Djalalova [NOAA]).
2.7
Figure 2.4. Meteorological station data from the Astoria, Oregon site on March 1, 2016. Large, open
markers represent HRRR model values. (Plot courtesy of Irina Djalalova [NOAA]).

2.8
Figure 2.5. Meteorological Station Data from the North Bend, Oregon Site on March 1, 2016. Large,
open markers represent HRRR model values. (Plot courtesy of Irina Djalalova [NOAA]).
2.9
Figure 2.6. Radar Data from the Forks, Washington Site on March 1, 2016. (Plot courtesy of Irina
Djalalova [NOAA]).
Figure 2.7. Radar Data from the Astoria, Oregon Site on March 1, 2016. (Plot courtesy of Irina
Djalalova [NOAA]).
2.10
Figure 2.8. Radar data from the North Bend, Oregon site on March 1, 2016. (Plot courtesy of Irina
Djalalova [NOAA]).

3.1
3.0 Summary
The three coastal wind profilers and associated meteorological instruments located in Forks, Washington, Astoria, Oregon, and North Bend, Oregon, provide important observations at high temporal and vertical spatial resolution for characterizing the meteorological inflow to the western region of the United States. These instruments have been operating for a year or more, and furnish boundary conditions for the modeling efforts of the WFIP 2 project. The data have been delivered to archives at both NOAA and the DOE A2e DAP at a data recovery rate in excess of 98%. Site maintenance activities have been relatively minor, and have involved only a few component replacements and repairs to RASS foam. Bird mortality surveys have found no bird nests or carcasses, and the USFWS has regularly been provided survey reports. This project represents a successful collaboration between PNNL and NOAA to procure, test, deploy, maintain, and operate three 449 MHz radar wind profilers.


4.1
4.0 References
Benjamin SG, BD Jamison, WR Moninger, SR Sahm, B Schwartz, and TW Schlatter. 2010. Relative short-range forecast impact from aircraft, profiler, radiosonde, VAD, GPS-PW, METAR, and mesonet observations via the RUC hourly assimilation cycle. Monthly Weather Review 138, 1319–1343.
Bevis M, S Businger, T Herring, C Rocken, RA Anthes, and RH Ware. 1992. GPS Meteorology: Remote Sensing of Atmospheric Water Vapor Using the Global Positioning System. Journal of Geophysical Research 97(D14):15,787–15,801.
Flaherty, JE, WJ Shaw, VR Morris, JM Wilczak, AB White, TE Ayers, JR Jordan, CW King. 2015. Installation and Initial Operation of DOE’s 449 MHz Wind Profiling Radars on the U.S. West Coast. PNNL-24866, Pacific Northwest National Laboratory, Richland, Washington.
DOE (U.S. Department of Energy). 2016. 2015 Wind Technologies Market Report. DOE/GO-10216-4885, Washington, D.C.
White AB, ML Anderson, MD Dettinger, et al. 2013. A Twenty-First-Century California Observing Network for Monitoring Extreme Weather Events. Journal of Atmospheric and Oceanic Technology 30:1585–1603. doi:10.1175/JTECH-D-12-00217.1.
Wilczak, J, C Finley, J Freedman, et al. 2015. The Wind Forecast Improvement Project (WFIP): A Public-Private Partnership Addressing Wind Energy Forecast Needs. Bulletin of the American Meteorological Society In Press. doi: 10.1175/BAMS-D-14-00107.1.


PNNL-25925
Distribution
No. of No. of Copies Copies
Distr.1
1 Joel Cline DOE EERE
4 NOAA ESRL 325 Broadway Boulder, CO 80305 Jim Wilczak Allen White Tom Ayers Clark King
2 Local Distribution Pacific Northwest National Laboratory William Shaw (PDF) Julia Flaherty (PDF)