DOCUNENT'RESUME - ERIC - Education Resources ... occupations. Charts contain on'or more indicators...
26
ED 215 821 AUTHOR ,TITLE "INSTIT'uTION PUB DATE NOTE AVAILABLE FROM EDRS PRICE DESCRI'PTORS' 'IDENTIFIERS - DOCUNENT'RESUME RC 013 322 Lormer,. Thomas; Bachu, Amara Illustrative .Statistics on Vionien in Selected Developing Countribs. Itgecy for International DeVelopment IDCA), f Washington, D.C. Office of Women in.Development.; Bureau of the Censut (DOC), Suitland, Md. Jun 80 48p.; Piper copy not available.due to print size. Superintendent of Documents, U.S. Government Printin Office; Washington, DC 20402. MF0.3. Plus Postage. PC Not Available from EDRS. Age; Birth Rate; Comparative Analysis; *Developing = Nations; *Educational Status Comparison; Employed Women; *Females; Foreign Countries; Labor Force; Literacy; Males; Marital Status;' *Occupational Surveys;, Professional occupations; Regional Charapteristies; Rural Population; *Sex Differences; Table's (Data); Urban Population Africa; *ftia; *Latin America 4 ABSTRACT Data pertaining to some basic aspects'of women's .articipation in selected developing countries are presented in 13 chatts, arranged alphabeticallyby region and country within region. Countries in each of the three major developing regions--Africa, Asia, and Latin America--are included when possible. Each chart 4 present's data fora single topic in the following sequence: age of .women, residence, longevity, childhood mortality, age.at marriage, marital status, fertility, literacy, school enrollment, school completion, labor force participation, sector of employment, and ,pro ssional occupations. Charts contain on'or more indicators of women status and, where appropriate, a, ratio-4-kdicator value for . 'women di ided by the Corresponding indicator value for men so that a measure of the status of women relative to that of men is provided. (AMA) g 4 ti **********************************************,************************ * Reproductions supplied by EDRS area the best that can. be'made * * , f:om the original document. t t **********************************************16******************;**** 4 41
Transcript of DOCUNENT'RESUME - ERIC - Education Resources ... occupations. Charts contain on'or more indicators...
ED 215 821
AUTHOR,TITLE
"INSTIT'uTION
PUB DATENOTE
AVAILABLE FROM
EDRS PRICEDESCRI'PTORS'
'IDENTIFIERS
- DOCUNENT'RESUME
RC 013 322
Lormer,. Thomas; Bachu, AmaraIllustrative .Statistics on Vionien in SelectedDeveloping Countribs.Itgecy for International DeVelopment IDCA),
f Washington, D.C. Office of Women in.Development.;Bureau of the Censut (DOC), Suitland, Md.Jun 8048p.; Piper copy not available.due to printsize.Superintendent of Documents, U.S. Government PrintinOffice; Washington, DC 20402.
MF0.3. Plus Postage. PC Not Available from EDRS.Age; Birth Rate; Comparative Analysis; *Developing
= Nations; *Educational Status Comparison; EmployedWomen; *Females; Foreign Countries; Labor Force;Literacy; Males; Marital Status;' *OccupationalSurveys;, Professional occupations; RegionalCharapteristies; Rural Population; *Sex Differences;Table's (Data); Urban PopulationAfrica; *ftia; *Latin America
4
ABSTRACTData pertaining to some basic aspects'of women's
.articipation in selected developing countries are presented in 13chatts, arranged alphabeticallyby region and country within region.Countries in each of the three major developing regions--Africa,Asia, and Latin America--are included when possible. Each chart
4
present's data fora single topic in the following sequence: age of.women, residence, longevity, childhood mortality, age.at marriage,marital status, fertility, literacy, school enrollment, schoolcompletion, labor force participation, sector of employment, and
,pro ssional occupations. Charts contain on'or more indicators ofwomen status and, where appropriate, a, ratio-4-kdicator value for .
'women di ided by the Corresponding indicator value for men so that ameasure of the status of women relative to that of men is provided.(AMA)
g
4
ti
**********************************************,************************
* Reproductions supplied by EDRS area the best that can. be'made *
* , f:om the original document. t t
**********************************************16******************;****
4
41

.7
t
r:-
0CoCo
5'A
e-`,i
tyI
N
. F .1 Vi t.,ti 04..,) 0
6
4
illustrative Statistics,on Women In Selected
. Developing Countrie tg
WHOCF Vrtt 4."1 '',67."hrrt"t,frut=1f
Prepared for the Office of Women in Development;U.S. agency for Interriafional Developrfient.
5'
U.S. Depart inenf of CommerceBUREAU.OF THE CENSUS. .
US. DEPARTMENT OF EDUCATIONNATIONAL INSTITUTE OF EDUCATION
EDUCATIONAL RESOURteS INFORMATIONCENTER (ERICI
0 This document has been reproduced asreceived from the person or organizationoriginating it.
CY...Minor changes have been made to improvereproduction qualityl
Points of view or opinions stated in this document do not necessarily represent official NIE
. position or policy.

aff°6Va.eeNrim
DePartineniof ConiniercePhilip M. Klutznick, Secretary .
Luther H. Hodges, Jr., .Deputy Secretary It
CourtenayiM. Slater,Chief Economist
BUREAU OF THE CENSUSVincent t. Barabba, DirectorDaniel B. Lavine, Deputy DirectorMeyer Zitter, Assistant Directorfor International Programs
INTERNATIONAL DEtOGRAPHICe'DATA CENTER .
Samu2I Baum, Chief
ACKNOWLEDGMENTS
This report war prepared in the InternationalDemographic Data Center by Thomas Lorimer,with the assistance of Amara Bachu. It wasdevelo'ped in cooperation with and funded by theOffice of Wrimen in Development, U.S. Agencyfor International Development; Arvonne Fraser,Coordinator. j
SUGGESTED CITATION
U.S. Bureau of the Census, Illdstrative Statisticson Women in Selected Developing Countries.Washington, D:C. 1980:
/ Library of Congress Card No. 80.600097
4Issued June 19805
For sale by the Superintendent eiDoeuinepts, U,S, Goveratnent Printing (Mee, Washington, D.C. 20402
O
V
iritroduction; :1
"In'recognition'of-theiactthat women Indevelopingcountries play a significant role in ecOnciffiraTir,6-duo-.tion,'family support andthe overall developmentprocas,'' in 199, the U.S. Congress mandated'thatForeign Assistance "shall be, adrninistered so as to'give particur attention. to those programs, projects,and adiviti which-tend to integrate women i!itothe national economies of developing countries, thusimproving their status and assistingthe total develop-ment effort" (Sec.111, the PerCy Amett(ment to the .Foreign Assistance Act). In response to this Congres-sionk mandate, the Agency for InternationalDevelopment created an Office of Women inDevelopment.
One of the goals of the Office of Women in Develop-ment is to promote the-collection and analysis ofdata which eniill facilitate better understanding of the.status of women in sodetyind their role in nationaldevelopment, and better monitoring of the progressbr.ing made to attain the internationally agreed upongoads of the World Plan of Action for the Decade forWomen (1976-1985). To further the goal of reliableinformation on,Women in Development issues, theOfftpe of Women in Development has recently 'sponsored a program at the U.S. Bureau of the Censuswhich alms at the developinent of a reliable kndinternationally comparable data base for this subjectarea.
I
-
1
A
This chartb;misis..urOductof-thetarly.stagerof::-this cooperative endeavor. Th6charts which followAre intended to give only a general overview of somebasic, aspects of women's participationin,setecteddevelophIg countries. The selection of-countries forwhich data are preientegeflects the reality of dataayailabilitxlle effort was made to include,countriesin eachof the..three major developing regionsAfrica,Asia, and-Latin Americaand to include the moreiOpillotis countries if at all/possible-
I The data compiled in this;report are:presented in-13 Charts"; The dita:Within each chart are .
organized alphabeticalry hiregiim ind countrywithin region to facilitatethe comparative reading
_of the data inanithe countries.' Eachitarepresentsthe data for a single topic in the following sequenc9age-Of women, residence, longevity, childhood .mortality,'age of Marriage, marital status, fertility,literacy, school pnrollment, schoolCompletion, laborforceparticipationpstctor.of employment', andprofessional ocCuPatic..... Each chart contains one ormore Indicators of women's status and, where ap-
spropriata, a ratiof the indicator value for womendivided by thd corresponding indicator value for menso that a measure of the itatus1of women relative tothat of men Is provided. "
4
V
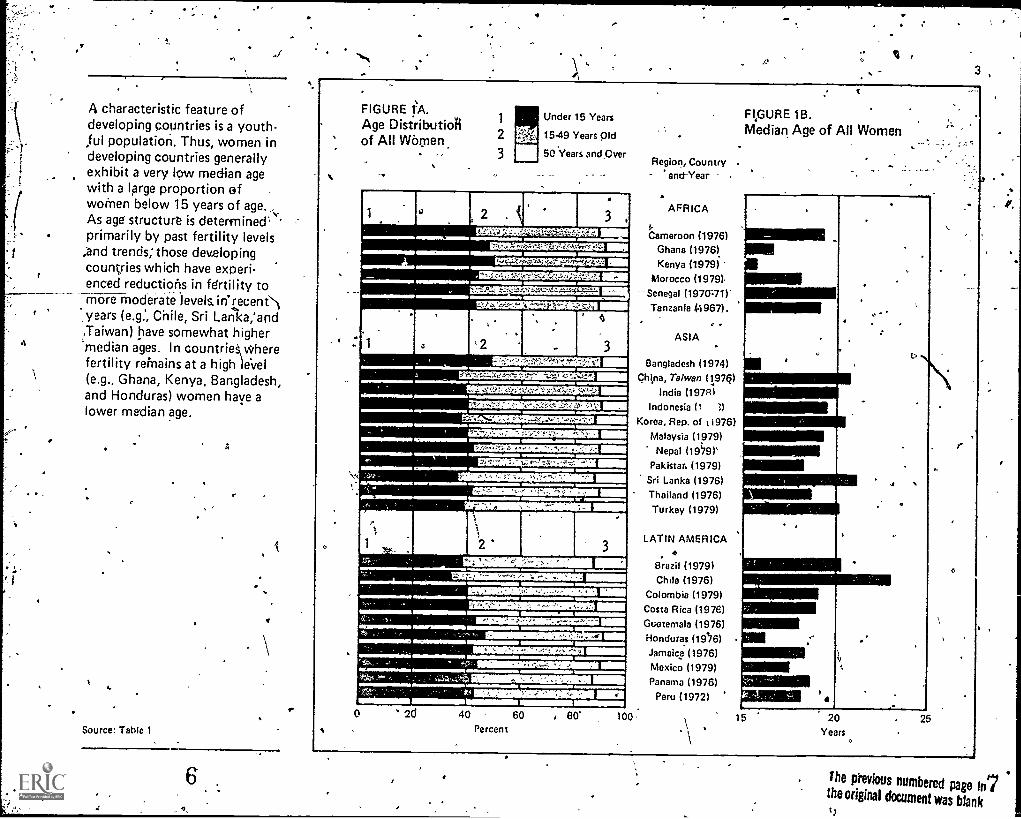
A characteristic feature ofdeveloping countries is a youth-ful population. Thus, women indeveloping countries generallyexhibit a very low median agewith a large proportion ofwomen below 15 years of age.As age structure is determined'primarily by past fertility levels
;and trends; those developingcountries which have experi-enced reductiortis in fertility tomore moderate levels. ircucent`lyears (e.g:, Chile, Sri Lanka:and,Taiwan) have somewhat highermedian ages. In countrieSWherefertility remains at a high leVel(e.g., Ghana, Kenya, Bangladesh,and Honduras) women have alower median age.
Source: Table 1
3
0
FIGURE TA.Age Distributionof All Wimen.
1
2
3
Under 15 Years
15-49 Years Old
50 Years and Over
11111 '
3 ,
vsenswea imp.._ .sumassmmemmums mu................ 0 glligo ..
.sesamusmemen
1 . , 2 .
mil,
3
..
..
. NEMEJEMEMOMIllmosimosimmiMilangsziet=unitanimain1Aammo=mmowoulmmmmSMOSOMME3SEMSE MI.........
1MNIMPIIIII.P11- . Walininal MI11111. MIIIM MIMMI6MMIIIIMI
014=1ENUMMINEE =II.=mobw1=1.Mr VaaNWEKOMMEXII Mall
MI''ntmewwwW11.1M' IMMEN1111 EMIIWPMMMMOM
111ITIMMISRMIMaiMIIIIIIIII,...----WainIMEIMISOMMON NIMII
2
101' MM IMIM' NiMilIMMIX1 Mill.alllWMNI1EMMNIMOIP
MiaiMINESI MIIIIarmelimior wl.i.mimimom- MatigNSIIMINIEMIMMINO
mresolomplielmiammonm
=wrimim..arrmIIII*INignalagatiMM.w.....m........r.'rtk . , - .- . , ...,,. IIIMMINIMINII IMIll%"7"rr7"4anir6aleNiedmioNionwe15211=1.1M=lei0 40 60
PercentI 60'
FIGURE 1B.Median Age of All Women
Region, Country .
and-Year
AFRICA
Cameroon (1976)Ghana (1976)
Kenya (1979)
Morocco (1979)-Senegal (1970;71)
Tanzania .0967).
ASIA
Bangladesh (1974)chtna, Taiwan (1.976)
India (197R1Indonesia (1 3)
Korea, Rep, of %1976)
Malaysia (1979)Nepal (19`79)`
Pakistan (1979)
Sri Lanka (1976)
Thailand (1976)Turkey (1979)
LATIN AMERICA4
1111111111111111111M1
1111111111111111101111
111111111111111.1111M11111111111111111111
11111111111111111111111
Brazil (1979) Mill11111MINI 0
Chile (1976)Colombia (1979)Costa Rica (1976) 1111.111111111111
Guatemala (1976)Honduras (106) INNJamaica (1976)Mexico (1979) il1111111111
Panama (1976) 31111111111111111
Peru (1972) =MS '100 15 20
Years25
the previous numbered page In7the original document was blank;1

4
Women in developing countries'of.Asia and Africa are predom-inbntly rural dwellers, wherea's in ,
Latin American countries amajority of women live in urbanareas. In urbsan areas of LatinAmerica, women outnumbermen, which is presumaNy a re-sat of a greater prop.ensit7 ofwomen to.migrate to urbanareas. In contrast, the predomi-nance of men in many of the .
urban areas of Asia and Africa ,suggests that in these regionsmore men than women migrateto urban areas.
Source: Table '2
4
FIGURE 2A.Percent of Women Residingin Urban Areas
Region, Countryand Year
AFRICA
FIGURE 2R,Sex Ratio of Urban Population,15-49 Years Old
Women IOutnumber Men Outnumber Women
MenCameroon (1976)
Ghana (1970)
Kenya (1969)
Morocm (1971)Senegal (1970.71)
Tanzania (1967)
ti
Bangladesh 11974)
China, Taiwan (1977)India (1971)
Indonesia (1971)Korea Rep. of (1975)
Malaysia (1970)
Nepal (1971)
Pakistan (1972)
Sri Lanka (1971)
Thailand (1970)Ttirkey (1970)
LATIN AMERICA
Brazil (1970)Chile (1970)
Colombia (1973)Ccista Rica (1973).
Guatemala11973)Honduras (1974)
tattoo (1970) .1
Panama (1970)
Peru (1972)
BO,
_
100 120 140 1601 4,Ratio (Men Per 100 Women),/-
. ,

Women ipd.eveloping countriesgeneraly have a short life expect-
, aricy. Women in Asia and LatinAmerica can expect to live longeron the average than can Africanwomen. As is.true for mostcountries of the world, women indeveloping countries can expectto live longer than men, exceptfor India, Nepal, and Pakissan.
. I
4erce
Source: Table 3
10
FIGURE 3A.Life ExpectanWAt Birthfor Women
5
75 70 65 60 55 50 .45 19 35. YearsI
FIGURE 3B.Female/Male Ratio of Life ExpectancyAt Birth
Region, Countryand Year
AFRICA
k.ameroor; (1976)Ghana (1970)
Kenya (1577) -
Morocco (1972)Senegal (1970.75)
ASIA
i3angladesh (1969.74)
China, Taiwan (1975)Jodi° (1969)
Indonesia (1961-71)
Korea-, Rep. of (1970)
Malaysia (1970)
Nepal (1974-76), Pakistan (1962-65)
Sri Lanka (1970-72)
Thailand (1970)- Turkey (1974-75)
LATIN AMERICA .
Brazil (1974-75), Chile (1969-70)
Colombia (1973r,Costa Rica (1973)
Guatemala (1973)
Honduras (1974)
.Jamaica (3,970)
Mexico (1970)Panama (1970)
Peru (1970.75)
0.90
o
Men Live Women LiveLonger Longer
1.00 1,10Ratio
1.20.
13,

6
Childhood mortality, a majorfactor determining longevity, islower in Latin America than in
'Africa. The Asian countries pre-sent a mixed picture with Tai-wan, Korea, Malaysia, a'nd SriLanka having a childhoOd mor-tality level on a par with those ofLatin American countries, whilethe level is higher in the otherAsian countries. India, flepal,and Pmorereach i
istan are unique in thatiris than boys die beforeg their fifth birthday.
Source: Table 4
12
`FIGLIgiE 4A.Proportion of Female Infants NotSuiviving to Fifth Birthday
FIGURE 4B.Female/Male Ratio of ProportionNot Surviving
Region, Countryand Year
AFRICA
Cameroon (1976) ,Ghana (1970)
_Kenya (1977)
Morocco (1972)
ASIA
Bangladesh (1969.74)China, Taiwan (1975)
India (1969)
Indonesia (1961.71)Koreal Rep. (1970),
Malaysti (1970)INIgpal (1974-76)
.Pakistan (1962-65)Sri Lanka (1970.72)
Thailand (1970)
Turkey (1974.75)
ne,
LATIN AMERICA
Brazil (1974-75)Chile (1969.70)Colombia (1971)Costa Rica (1973)
atemala (1973)Hohdurai (-1974)
Jamaica (1970)
Mexico (1970).,Panama (1970)
Peru (1970.7b)
More Females Survive More Males
Survive
0.70 0.80 0.90 1.00- Ratio
1.10 1.20
13

The minimum legal age at mar-riage for women tends to be lowin developing countries, thus,only minimally restraining earlymarriage even when the laws areobserved. The majority ofwon1yn in Africa are married be-fore they reach their twentiethbirthday, whereas in Latin Amer-ica, the majority ha°ve not beenmarried untiLthey enter theirtwenties. ,In Asia, the situationi5 quite varied, with the majority
, f women marrying at very earlyOs in son-le countries (e.g.,
Bangladesh, India, and Nepal) ...
and at considerably later ages inothers (e.g., Sri Lanka and SouthKorea). '
Source: Table 5
14.
FIGURE 5A.
Mininium Legal Age At MarFor Women
O7
Region, Countryand Ye,
AFRICA
Cameroon (1976):Ghana (1970).
Kenya (1969)Morocco (1971)
Senegal (1970.71)
Tanzania (1967)
FIGURE 5B. ,
Age By Which 50 Percent of Womengave Ever Been Married
Bangladesh (1974)
China, Taiwan (1975)India (1971)
Indonesia (1971)
Korea, Rep. of (1975)Malaysia (1970)
Nepal (1971)
Pakistan (1972)
Sri Lanka (1971)Thailand (1971)Turkey (f975)
moduntimModioommio
,oc;o-
10Years
.LATIN AMERICA
Brazil (1970)
Chile (1970)Colombia (1973)Costa Rica (1973)
Guatemala (1973)Honduras (1971.72)
Jamaica (1970)
Mexico (1970)Panama (1970)
Peru (1972)
20 30Years
0
15
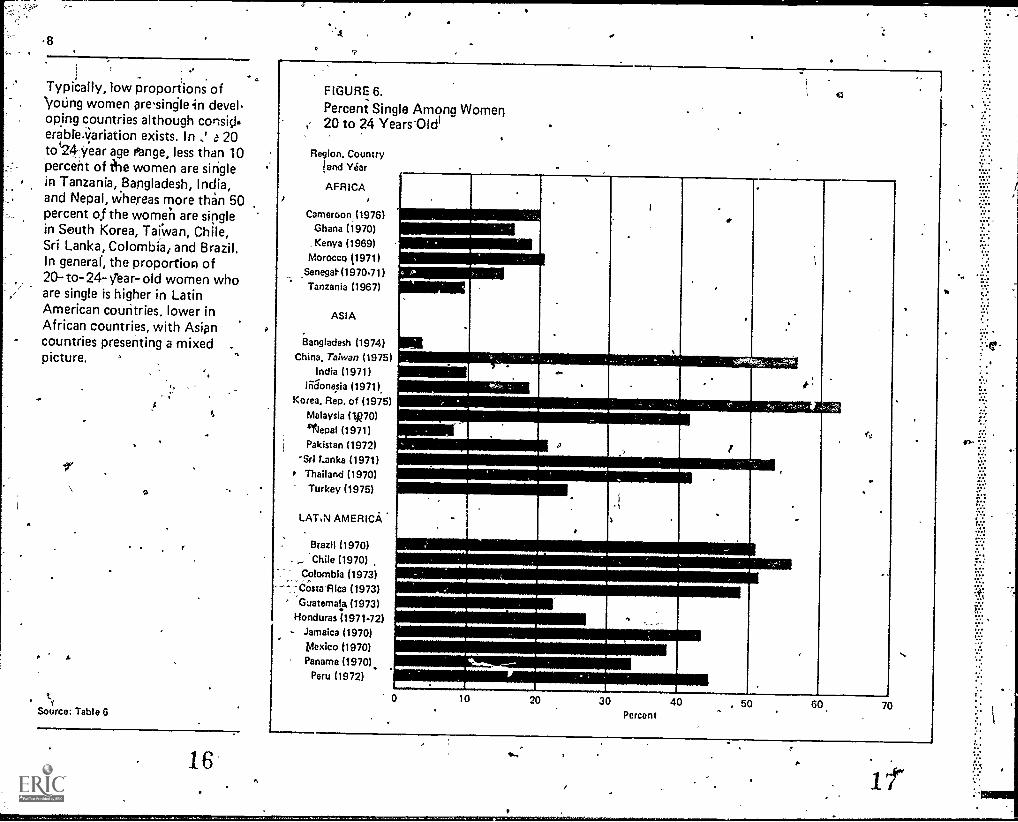
Typically, low proportions ofyoung women pre'single in devel-oping countries although consid.erable.liariation exists. In a 20toi24year age Mange, less than 10percent of Ale women are singlein Tanzania, Bangladesh, India,and Nepal, whereas more than 50percent of the women are singlein South Korea, Taiwan, Chile,Sri Lanka, Colombia; and Brazil.In general, the proportion of20-to- 24- year- old women whoare single is higher in LatinAmerican countries, lower inAfrican countries, with Asiancountries presenting a mixedpicture.
' 1.1
Source: Table 6
16
FIGURE 6.
Percent Single Among Women20 to 24 Years'Oldl
Region, Country!and Year
AFRICA
Cameroon (1976)Ghana (1970)
Kenya (1969)
Moroccq 11971)
Senegal(1970-71)Tanzania (1967)
ASIA
Bangladesh (1974)
China. Taiwan (1975)India (1971)
Indonesia (1971),
Korea, Rep. of (1975)Malaysia (1,P70)
sepal (1971)Pakistan (1972)
-Sri Lanka (1971)
Thailand (1970)Turkey (1975)
LATIN AMERICA
,f4
Brazil (1970)
... Chile (1970) ,
Colombia (1973)Costa Rica (1973)
"GuatemaLa. (1973)
Honduras (1971.72)Jamaica (1970)
Mexico $1970)
Panama (1970),Peru (1972)
0 10 20 30 40 . 50 60 70Percent
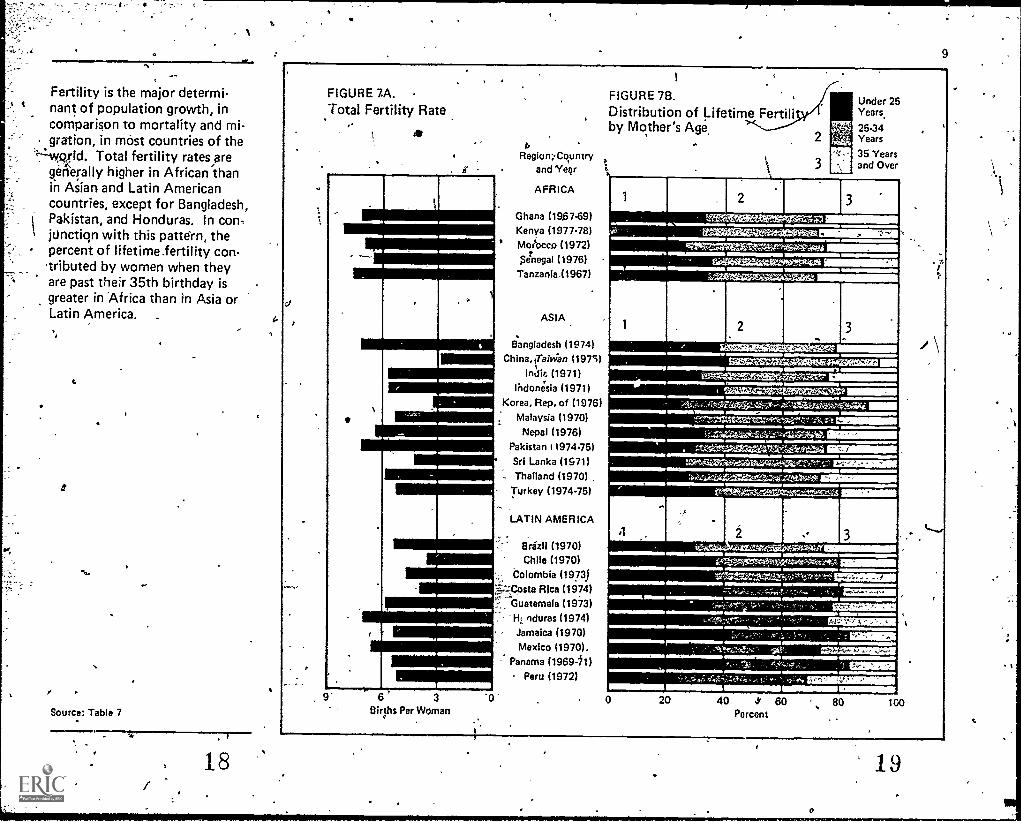
Fertility is the major determi-nant of population growth, incomparison to mortality and mi-gration, in most countries of the
1:--wgrld. Total fertility rates aregenerally higher in African thanin Asian and Latin Americancountries, except for Bangladesh,Pakistan, and Honduras. In con,junction with this pattern, thepercent of lifetime.fertility con-tributed by women when theyare past theh. 35th birthday isgreater in 'Africa than in Asia orLatin America. -
Source: Table 7
4,
la/
18
FIGURE 7A. -
Total Fertility Rate
Region;-Countryand "Year
AFRICA
Ghana (19E7-69)
Kenya (1977-78)
Maocco (19721anegal (1976)Tanzania,(1967)
ASIA
FIGURE 78.
Distribution of Lifetime Fertiliby Mother's Age.
9
Under 25Years,
25.34Years
35 Yearsand Over
Bangladesh (1974)
China,TaiWan (1975)Indic (1971)
Indonesia (1971)
Korea, Rep. of (1976)Malaysia (1970)
Nepal (1976)
Pakistan 11974-75)
Sri Lanka (1571)
Thailand (1970) ,
Turkey (1974-75)
LATIN AMERICA
Brazil (1970)Chile (1970)
Colombia (1973)1Costa Rica (1974)
:Guatemala (1973)nduras (1974)
Jamaica (1970)
Mexico (1970).Panama (1969-71)
Peru (1972)
OatiaMMEMMSIMMIMM ER
t4W.rm°°*"''eikatra=f;,',ZW.ZRAtt'aitCn"..4-1r.011.11111111.11
;Ce* CEMIX1161111
ElrfaRMIMMIV:544jW ,.eat.lt-W....r1:.`Z11111111111111.1
AT& V...0X,YEaliniNMEM0":.r.jaifC1.4WItY^WAt.2*A =Mini
trassommt .01.,km...!,, . ,7777,"tommummomIIIIN111111111
.;
l."M"..7 1' 1Vi="""CIMOMMEMISMI
eaMIIIMIO
gilOMMB9: 6 3
Births Per Woman20 40 t 60
Percent
0
19

ip
In the Latin AmeriOn countries(with the exception Qf Guate-mala") a maj9rity of Women areliterate, whereas in the\Africancountries, less than onehird ofthe women are literate. The sit-Rtion in Asian countries\jshighly varied, with the range of
,literacy for women ranging ,,from'3 to 81 percent. The findingthat women 15to 24 years ofagein all the countries have ahigher literacy'rate than do all-wOmeh (15 years and over), in-dicates that their educationalsituation has imprOved in recentdecades:
In almost all countries, fewer. ,women than men ari- literate.However, in Latin America the"gap" is generally a small one.'In some countries of Asia aswell, the "gap" between thesexes is disappeiring rapidly.
Source: Table 8
20
FIGURE 8A. 115-24 Years OldPercent Literate 15 Years Old and OverAuong Women
111111MIIIMINIIMI
111111117a
100 80 60 40- 20 0Percent
Region, Countryand Year
AFFi'ICA
cameroon (1976) -
Ghana (1970)
Morocco (1971)
Tanzania (1967)
ASIA. /.Bangladesh (1974)China, Taiwan (1975)
India (1971)
Indonesia (19711\Korea, Rep. of (197b)
Malaysia )11970)
Nepal (1971)
Pakistan (1972)Sri Lanka (1971)
Thailand (1970)Turkey (1975)
LATIN AMERICA
Brazil 0970)Chile (1970)
Colombia (1973 )Costa Rica (1973)
Guatemala (1973)Honduras (1974)Mexico (1970)Panama (1970)
Peru (1972)'
FIGURE 8B.
Female/Male Ratioof Percent Literate
15-Years Old and Over
15.24 Years Old
Fewer WomenAre Literate
NUM
MoreWomen
AreLiterate
111111111111111
w
0.00 0.70 0.40 0.60Ratio
1.20
a
2:1

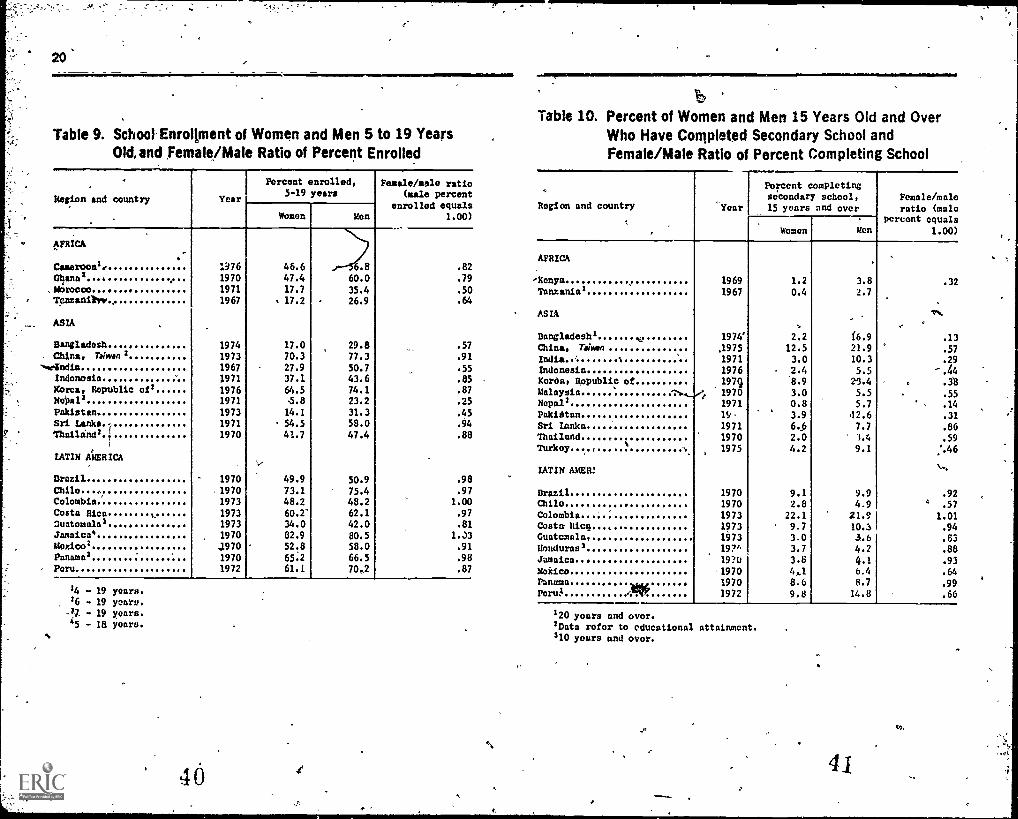
School enrollment ratios forwomen 5 to 19 years vary con-siderably among the developiogcountries in each of the threeregions, with Latin Americanwomen generally having higherenrollment ratios than women inthe other two regions. Women inall three regions generally havelower enrollment ratiithandomen, with the size of the "gap"being quite varied among tcountries shown. Colombia ndJamaica exhibit enrollment ratiosfor women that are equal to orhigher than the ratio for men.
A
t
'Source: Table 9
0.
0
FIGURE 9A. ,
*Percent of Females,5-19 Years Old,Enrolled in School
t7
60 40 . 20Percent
4w.
Region. Countryand Year
AFRICA
Cameroon (1976)
Ghana (1910)Morocco (1971)Tanzania (1967)'.
ASIA
Bangladesh (1974)
China, Taiwan 11973)
India (1967)\Indonesia (1971)
.Korea, Rep. of (1976)
Neotl (1971) .Pakistan (1973)
Sri Lanka (1971)Thailand (1970)
LATIN AMERICA
Brazil (1970)Chile (1970)
Colombia (1973)'Cope Rica (1973)Gbatemila (1973)
Jamaica (1970)
Mexico,(1.970)
Panama (1970) /Peru (1972)
0 /' 0.20
FIGURE 98.Female/Male Ratio ofPercent Enrolled
j-'t
,
.
f,t
,
,
d
.
Ir
, .
teFewe
Attend
ik3er'.4.04*
.
\ srs,E,r.,-,A0-
-;7.,
1l. r
.
Girls,School
t....1- ,-'..`,'
.-
MoreGirls
AttendSchool
-. ,
.
.
,
l
.
.. . .
..
,';',. 7,''. i;',*
:,-,-,". ,s.
,
4.
'-'-.'
....
Ella
'
111'
1MIMI"
0.40 0.60 0.80Ratio
1.00

12
Fewwomenin_developing-trieshave completed secondarysch4x31,. Except in some LatinAmerican countries and SriLank'a,,ttw proportion of ,womenwho have completed secondaryschool ic.considerably lower than
"srthe proportion of men.
t.
Source: Table 10
24
1
'FIGURE 10A. . .
Percent of Women.15 Years Oldand Over MO HavedompletedSecondayy School
a
25 Y 20 . 15 10Percent
0
Region, Countryand Year -
AFRICA
Kenya (1969)
Tanzania (1967)
ASIA
Bangladesh (1974)
China, Taiwan (1975) s
India (1971)
Indonesia (1976)Korea, Rep. of (1970)
Malaysia (11970)
Nepal (1911)
Pakistan (1973)
Sri Lanka 1.1971)
Thailand (1970)
Turkey (19751
LATIN AMERICAo
Brazil (1970)Chile (1970)
Colombia (1973)Cotta Rica (1973)Guatemala (1973)Honduras (1974)Jamaica (1970)
Mexico (1970)Panama (1970)
Peru (1972)
FIGURE 10B.
Female/Male Ratio of PercentCompfetirig Secondary School
Fewer Wor enComplete Schad(
MoreWomen
CompleteSchool
0.00 0.20 0.40 0.60 0.80 ; 1.00 1.20Ratio
25

I
The labor forc participation ratereported for wo n varies considerably in Africa Asia,with rates for Latin Amecountries,being generally row.To some extent, the low re-ported rates for Latin America(as well as some other countries)are due to census and surveypractices which exclude mostwomen engaged in agriculturalactivities from being countedamong the economically activepopulation. In all countriesshown, the activity rates forwomen are considerably lowerthan for men, although the rela-tive participation of women inthe labor ,force varies consider-ably at -long these developingcountries.
Source: Table 11
FIGURE 1 lAtk.
Labor ForCe Participation Rateof Women 10 Years Oldand Over
Region, Countryand Year
AFRICA
Ghana (1970)Kenya (1970)
Morocco (1971)Senegal (1970.71)
Tanzania (1967)
FIGURE 11B.Female/Male Ratio of Labor ForceParticipation
. 13
ASIA
Bangladesh (1974)China, Taiwan (1975)
India (1971)Indonesia (1971)
Korea, Rep. of (1975)Malaysia (1970)
Nepal (1971)Pakistan (1973)
Sri Canka (1971)Thailand (1975)Turkey (1975)
LATIN AMERICA
Brazil (1970)Chile (1970)
Colombia (1973)
Costa Rica,(1973)
Guatemala (1973)
Honduras (1974)
Jamaica (19751
Mexico (1969)`Panama (1910)
Peru (1972)
_ 60 -40 20 .Percent'
0.00 0.20 0.40 0.60 9.80 1.00Ratio
26 27r

While an overwhelming majorityof women work-in nonagricul-tural activities in Latin Americancluntries, this is true for fewAfrican and Asian countries.Many of these Latin Americanwome,r* perpasiserviceworkers.
FIGUR512.Distribution of Women' In Labor Forceby Agricultural and Nonagricultrual Sector ,
Region, Countryand Year
AFRICA
Ghana (1970)Morocco (1971)Tanzania (1967)
ASIA
Bangladesh (1974)China, Taiwan (1975).
India (1971)
Indonesia-(1971) '-Kiirea. Rep. of (1975),
Malaysia (1950)Nepal (19711
Pakistan (1973)Sri Lanka (1971)
Thailand (1975)
TurkeA(1975)
LATIN AMERICA
Brazil (1970),Chile (1970)
Colombia (1973)Costa Rica (1973
Guatemala (1953):;:'Honduras 0974)JaMaica (1975)
Mexico (1969)Panama (1,970)
Peru (1972)
' 1
Nonagricultural
Agricultural
WM=011E1E1=11. ..._ ' , ., -,.
11P11=.=11D
,' i 1WIEMMIIMIll
1101rme.MMIMIBMIAmmomommagmir
Source: Table 120-- 10 20 30 40 50 60 70 80 90 100Percent
2928

The i:)rcent of women in pro-fessional, technic I and relatedoccupations is lo in most Asianand African count 'es and uni-formly higher in L tin Arnerica.A significantly hig er proportionof women than men are found inthese higher level occupations inthe Latin American countries.To some extent, however, thefavorable position of women inrelation to men in a number of .
these cciuntr:es is due to censusand survey procedures whichexclude women in agriculturaloccupations.
Source: Table 13
30
15
' FIGURE 13A. . FIGURE 13B.Percent of Women In The Labor Force Female/Male Ratio ofIn Professional Occupations - Percent Professional
O
0
stot
20 15_ _>10Percent-.;
Region, Countryand Year
AFRICA)
Ghana (197Q)Morocco (1971)
Tapzapia (1967)
ASIA
Bangladesh (f974)China, Taiwan (1975)
India. (1971)
Indonesia (19711
Korea; Rep. of (1975)Malaysia (1970)
Nepal (1971)
Pakistan (1973)Sri Lanka (1971)Thailand (1975)Turkey (1575)
.LATIN AMERICA
Brazil (1970)Chile (4970)
Colombia (1973)`7CtistiiRiee.:(1973)
Guatemala (1973)
Honduras (1974)
Jamaica (1975).
Mexico (1959)"
Paname (1970)
Peru (1972)
FewerWomen
AreProfessional
Rim
In%
'1%mi
Lie
M\ Are
ore WomeInProfessional
111111111111111111111111111
1.00 2.00 3.00Ratio
4,00 5.00 6,00

tai
Table 1. -Age Distribution and Median Age of Women
Region and country , Year
. Percept distribution
Medianago
(years)TotalUnder
15 years
.
15-49years
50 yearsand over
AFRICA
1
Cameroon 1976 100.0 41.7 , 47.0 11.4 ,19.3Ghana 1976 100.0 47.0 43.5 9.4 16.5Kenya 1979 100.0 48.6 42.4 9:0 15.6Morocco 1979 100.0 43.2 .46.6 10,2 18.0Senegal 1970771 100.0 39.9 49.2 10.9 19.8
ani 1967 100.0 42.5 46.0 11.5 19.1
ASIA ,,
Bangladesh 1974 100.0 48.7 41.2 10.0 15.8China, rases 1976 100.0 36.2 51.8 12.0 20.7India 1978 100.0 3p.5 48.5 11.9 20.0Indonesia 1978 100.0 39.9 50.2 9.9 19.5Korea, Republic of 1976 100.0 37.3 50.0 12.7 20.4Malaysia 1979 100.0 39.9 49.2 10.9 19.3Nepal.. 1979 100.0 42.2 46.9 10.9 19.0Pakistan ,. ,1979 100.0 43.5 44.8 11.6 18.2Sri Lanka '1976 100.0 36.7 50.9 12.4 11.1Thailand 1976 100.0 42.0 47.2 10.8 18.6Turkey 1979 100.0 38.9 48.1 13.0 20.1
LATIN AMERICA
Brazil 1979 100.0 39.7 49.0 12.3 20.2Chile 1976 100.0 34.0 50.3 15.8 22.9Colombia 1979 100.0 40.2 49.2 10.5 19.1Costa Rica 1976 100.0 40.6 48. 11.2 18.9Guatemala 1976 100.0 43.5 46.2 10.3 18.0Honduras 1976 100.0 47.3 43.9 8.8 16.2Jamaica 1976 100.0 42.4 42.2 15.5 18.3Mexico 1979 100.0 44.4 45.6 10.0 17.5Panama .. .. .,
pore1976
1972
100.0100.0
42.2
43.445.745.2
12.1
11.418.6
18.1
32
- Table 2. Perce t of Women Resid;ng in Urban Areas, andSex Rat f Urban.fitopulation 15 to 49 Years Old
Region and country Year Percent of allwoman residingin urban areas
Sex ratio of urbanpopulation 15-49years (number of
men per 109 women)
AFRICA .
.
Cameroon 1976 26.5. 111.6Ghana 1970 28,7 107,1Kenya .
,1969 8.3 166.1Morocco 1971 35.8 91.3Senegal 1970-71 44.2 86.9Tanzania 1967 4.9 127.3
0
ASIA'
Bangladesh 1974 7.9 153.0China, Taiwan 2 1977 64.7 105.6India 1971 . 19.1 124.1Indonesia 1971' , 17.1 97.9Korea, Republic of 1975 48.7 98.6Malaysia 1970 38.9 99.5Nepal 1971 3.7 127.1Pakistani 1972 26.0 123.3Sri Lanka 1971 21.7 120.1Thailand 1970 13'.1 97.1Turkey 1970 31.7 124.3
'
LATIN AMIi1ICA.
Brazil 1970 57.4 90.9Chile 1970 77.1 . 87.8Colombia' 1973 b5.7 79.2Costa Rica 1973 42.8 85.5GuatemalaHonduras
1973
197437.832.7
88.484.2
Mexico.
1970 59.7 92,2Panama 1970 49.8 89,7Peru 1972
,59.7 100,2
. 'Excludes Fukien.
2EXcludes population of the Federally Administered Tribal Area (2,491,230),
Kohistan Area of Hnzara District (160,647), and the Tribal Area adjoiningHazara District (195,580) for which data were not availnble by age group.
tabecora rather than urban.

17
Table 3. Life ExpAttancy at Birth for Women and Men, andFemale/Male Ratio of Life Expectancy atBirth
Region and country Year
Lifo expectancy atbirth years)
0&men lien
AFRICA
CameroonGhanaKenyaMorocco
Senegal
ASIA
Bangladesh ......... . . . .
1976
19701977
1972
1970-75
1969-74
45.650.2
55.851.541.6
46.6
43.046.951.2
50.5.
38.5
45.7China, 7".u.vx. 1975 72.8 67.4India 1969 46.7 48.1Indonesia 1961-71 40.0 37.4Koren, Republic of 1970 67.5" 61.4Malaysia 1970 65.9 61.6Nepal 1974-76 41.8 44.5Pakistan 1962-65 46.7 49.2Sri Lanka 1970-72 65.8 62.7Thailand 1970 59.5 56.7Turkey 1974-75 58.3 55.0
LATIN AMERICA
Brazil 1974-75 63.0 58.3Chile 1969-70 64.7 58.3Colombia 1973 60.8 57.4Costa Rica 1973 70.2 66.2Guatemala 1973 53.9 51.8Honduras 1974 57.0 52.3Jamaica 1970 69.1 65.2Moxico 1970 62.3 58.2Panama 1970 66.3 63.8Poru 1970-75 57.0 53.3
Female/male ratioof life oxpoctancy
at birth (malolife expectancy
equals 1.00)
1.p61.07
.1.09
1.021.08
1.02
1.08
.97
1.07
1.10
1.07
.94
.95
1.051.05
1.06
1.08
1.11
1.061.06
1.041.09
1.061.07
1.04
1.07
Table 4. Proportion Of Female and Mile Infants Not Survivingto Fifth Birthday and Female/Male Ratio of ProportionNot Surviving
Region and country Year
Proportion of infantsnot surviving totifth birthday
Femnfe halo
AFRICA
Gamoroon 1976 ' .24Ghana 1970 .18 .20Kenya 1977 .13 .15Morocco 1972 .20 .22
4
ASIA
Bangladesh 1969-74 .22 .23China, raison 1975 .03 .03India 1969 .24 .21Indonesia 1961-71 .26 .26Norm, Republic of 1970 .05 .07Malaysia 1970 .05 .06Nepal 1974-76 .25 .24Pakistan 1962-65 .26 .22Sri Lanka 1970-72 .08 .08Thailand 1970 .12 .13Turkey 1974-75 .16 .18
$ATIN'AMERICA
Brazil 1974-75 .11 .12Chile 1969:70 .09 .10Colombia 1973 .11 .12Costa Rica 1973 .06 .07Guatemala 1973 .16 .17HonduriS 1974 .14 .16Jamaica 1970 .05 .06Mexico 1970 .11 .12Panama 1970 ..08 .09Peru 1970-75 .15 .18
razale/malo ratio(malo proportion
not survivingequals 1.00)
.93
.90
.86
.93
.93
.75
1.11
.91
.73
.83
1.03'
1.17
.94
.94
.91
.91
.86
.92
.83
.95
.89
.86
.91
.86
.83

18
\Table 5. Minimum Legal Age at Marriage for Women and Age by
Which 50 Percent of Women Have Ever Been Married
Region. and country Year inimum legal ageat marriage for
women
AFRICA
Cameroon 1976 15
Ghana 1970 13Kenya 1969 16Morocco 1971 15Senegal 1970-71 16Tanzania 1967 15
ASIA
Bangladesh 1974 15
China, Eapieo 1975 18India 1971 15Indonesia 1971 116Xerew, Republic of 1975 16Malaysia 1970 4, 218Nepal 1971 14
Pakistan 1972 16Sri Lanka 1971 12
Thailand 075 15
Turkey 1975 15
LATIN AMERICA
Brazil 1970 16Chile 1970 12
Colombia 1973 18
Costa Rica 1973 15
Guatemala 1973 14Honduras 1971-72 12
4amaica 1970 ,16Mexico 1970 18Panama 1970 14
Peru 1972 14
11976.
21975.
36
Age by which 50percent of womenhave ever been
married
18
19
19
19
18
17
15
23
fr-,19
24
21
16'
19
23
22
20
22
24.23
22
19,
20
21
21
20
21
'1?
Table 6. 'Marital Staturef Women 15 tok49 Years Old, andPercent Single Among Wonien20-to 24 Years Oldand 0 to 49 Years Old
.
Region and country Year
Marital status of women15-49 years (peroent)
Percentsingle
among women
Total Single Married
widowed,divorced
'and
separated20-24years
45-49years
AFRICA
Cameroon 1976 100.0 18.5 73.2 8.3 19.8 4.3Chaim 1470 100,.0 17.4 72.0 10.6 16.0 0.5Kenya 1969 100.0 21.0 71.6 *7.4 18.6 12.8Morocco 1971 100.0 232.6 252.7 '14.7 20.4 2.7Senegal 1970-71 100.0 15.5 79.6 4.9% 14.6 0.3Tanzania 1967 '100.0 12.4 79.9 7.6 9.1 1.3
ASIA .
0pangladosh 1974 100.0 5 7 86.3 8.0 3.2, 0.3China, Mien 1975 100.0 3:;1 59.8 2.1 56.5 2.6Indi* 1971 100.0 12 .8 168.3 15.0 9.5 0.5Indonesia 1971 100.0 17.0 70.8 12.1 18.5 1.0
Koreai, Republic of 1975 100.0 35.5 59.9 4.7 62.6 , 0.2Malaysia 1970 100.0 31.6. 63.3 5.1 41.3 1.6
Nepal 1971 100.0 9.5 85.7 4.9 1.9 0.8Pakistan " 1972 100.0 18.6 "78.2 "3.2 21.3 1.5,
Sri Lanka 1971 100.0 37.6 59.0 3.3 53.2 4.1'
Thailand 1970 100.0 34.6 '60.3 5.1 41.5 , 3.3Turkey....1. 1975 100.0 24.4 72.6 2.9 24.1 1.7
LATIN AMERICA
Brazil ; 1970 100.0 3 .1 55.5 5,4 50,8 8.8Chile 4970 100.0 4 .5 53.8 4.8 56.0 12.8Colombia 1973 100.0 4 .2 52.0 4.8 51.2 14,9Costa Rica 1973 100.0 41. 54.6 3.6 48.7 14.6Guatemala 1973 100.0 23.8 72.5 1.8 22.2 6.4Honduras 1971-72 100.0 25.7 59.2 15.1 27.1 4.1Jamaica 1970 100.0 31.4 60.3 8.3 43.1 12.3Mexico 1970 100.0 32.5 62.3 5.2 38.5 7.0Panama 1970 100.0 29.0 60.1 10.9 33.4 6,9Peru 1972 100.0 35.6 60.2 4.2 44.5 10.2
140-49 years.210 years and over.210..49 years.
"Separated women included in married category,
e.

".1wwWwrmmmowm.
11111May...s.j., AIMMINNO11111
Table 7.. TolabFertility Rate and Distribution of Lifetime.Fertility by Mother'slAge
ReiJon and country Yenr
AFRICA
Shane 1,167-6p
Kenya 1977-78Morocco 1172Senegal 1976Tanzania 1973
ASIA
Sangh:Josh 1(173- 76cbirle. Amen 1977
India 1971
Indonesia. 1975Korea, Republic "t 1176
I°76Nepal. 1'16PWKleten 1974-75
3P1 1.ehita 1"74Tba.11sni 1975TUriOy 1974.75
MTV AMERICA
Brtlet1 1976 77Ch 197,-
tomble 1078due kt.s 1977
dvaAemal4 1973Honduras 1)74Jamaica 1 g75Mexico. l°77-.78Amon% 1 17e- 76l'exu LI E
total-
fert111t3,
rate (birth;per woman)
Percent of lifetime fertil----1-ty-eAntIllittUil-frT women
Ilndvr 25 25-34.ar% years
35 ye..rs
and over
7.148.06
6.886.44
6.30
t'l6.34-7.08
2.7o
5.67
3,21
6.3/7. "I-3.73
4.50 4.905.21
33.032.226.3U. 3
37.3
34.842.1
31./
36.1
29.132.629.526.432.036.7
4.2)-444. 29.33.-) 4i.24.11 / 30.1
.3 81 42.05.80 36.57.01 32.33.66'5.18
5%614-51
18.032.3
39.432.1
41.340.348.638.8
40.0
10.63-1.8
44.143.4
65.050.643.146.2
47.5
43.8
43.9
25.727.525.125:822.8
23.75.524-2
10.620.4
24.126.1.23. b19.4
147.E 23.642.0 16.8.45.2 24.641.5 16.5
39.8 23.743.2 24.534..3 16.9
46.5 tt..541.4 19.2114.8 23.1
poet.: See appendi7 table 1 1S. 221 for Caviler data. on fertillty rior Someczurtztles for yedr5 corregroncting mom closely to the reference year OF the
° Sockotos-myrtle ants presented in °tiler tables.
.01P f tla r7 C
.1f..4..,4
Table 8. Percent Literate Among Women and Men andFemale/Male Ratio of Percent Literate
19
.
.Region and country Year
Percent literate Femple/mal ".ratio ofpercent iterate(male rcentequals 1.00)
15 yearsand over
15-24
years
Women Men Women Ron15 yea'sand over
15-24years
AFMCA
Cameroon 1976 29.1 54.9 59.1 79.9 .53 .74Ghana 1970 18.4 42.8 39.6 68.3 .43 .58
riMorocco<Tanzania
1971
19679.714.9
33.442.6
22.629.4
52.6'60.0,
.29
.35
.43
.49
ASIA
Bangladesh 1974 13.2 36.P 22.3 46.5 .36 .48China, Taiwan 1975 75.6 92.2 97.4 99.4 .82 .98India 1971 19.4 47.3 33.3' §1.7 .41 .54Indonesia 1971 44.6 9.7 74.2 86.3 .64 .86Korea, Republic of 1970 81.0 94.2 98.8 0.8 .86 1.06Malaysia 1970 42.2 69.2 71.3 83.9 .61 .85Nepal 1971 1.6 21.7 5.6 32.9 .12 .17Pakistan 1972 10.6 30.3 18.1 41.1 .35 .44Sri Lanka 197/ 68.5 85.6 84.1 89.5 .80 .94
Thailand. 1970 70.5 87.0 92.0 95.8 .8i .96Turkey 1975 43.1 77.0 67.6 .91.4 .56 .74
LATIN AMERICA
Brazil 1970 63.1 69.3 74.9 74.2 .91 1.01Chile 1970 88.2 90.0 95.5 95.5 A.98 1.00Colombia 1973 79.8 82.3 188.3 187.4 .97 11.01Costa Rica 1973 88.2 88.2 95.4 94.5 . 1.00 1.01Guatemala 1973 38.5 53.5 47.6 " 61.8 .72 .77
Honduras 1974 55.1 58.6 12.3 '70.2 ;94 1.03Mexico 1970 70.4 78.2 81.9 85.3 .90 .96Panama 1970 77.7 79.3 86.9 87.8 .9,8' .99Peru 1972 57.3 80.7 80.3 93.4 .71 .86
115-29 years.
_
4:3 9
20
Table 9. School Enrollment of Women and Men 5 to 19 YearsOlt and Female/Male Ratio of Percent Enrolled
Region and country Year
Percent enrolled,5-19 years
Female/isle ratio(male percent
enrolled equals1.00)Women Mon
AFRICA
Csaeroonly 1976 46.6 .8 .82
Ghana: 1970 47.4 60.0 .79
.1kireeee 1971 17.7 35.4 .50Tc.nzaniltr. 1967 . 17.2 26.9 .64
ASIA
Bangladesh 1974 17.0 29.8 .57
China, Taiwan 1973 70.3 77.3 .91
"melodic' 1967 27.9 50.7 .55Indonesia 1971 37.1 43.6 .85
Korea, Republic of= 1976 64.5 74.1 .87
N4a12... 1971 5.8 23.2 .25
Pakistan 1973 14.1 31.3 .45
Sri Lanka 1971 54.5 58.0 .94
1970 41.7 47.4 .88
LATIN AMERICA
Brazil 1970 49.9 50.9 .98
Chile.... 1970 73.1 75.4 .97
Colombia 1973 48.2 48.2 1.00Costa Rica 1973 60.2- 62.1 .97
tWatomala3 1973 34.0 42.0 .81Jamaica4 1970 82.9 80.5 1.J3Mexioe1 4970 52.8 58.0 .91Panama= 1970 65.2 66.5 .98Peru 1972 61.1 70.2 .87
14 - 19 years.16 - 19 yetaw.
- 19 years.5 - la years.
4
bTable 10. Percent of Women and Men 15 Years Old and Over
Who Have Completed Secondary School andFemale/Male Ratio of Percent Completing School
Region and country Year
Percent completingsecondary school,15 years and over
Female/maleratio (male
percent equals
1.00)Women Men
AFRICA
,Konya 1969 1.2 3.8 .32Tanzanial 1967 0.4 2.7
ASIA 17.4.
Bangladeshi 1974' 2.2 f6.9 .13China, Taiwan 3975 12.5 21.9 .57
India , 1971 3.0 10.3 .29Indonesia 1976 2.4 5.5 -.44Korea, Republic of 1974 '8.9 2'3.4 .3RMalaysia 1970 3.0 5.5 .55Nepal= 1971 0.8 5.7 .14Pakistan 19- 3.9 42.6 .31Sri Lanka 1971 6.' 7.7 .86Thailand 1970 2.0 1.4 .59Turkey ti 1975 4.2 9.1 '46
LATIN AMER!
Brazil 1970 9.1 9.9 .92Chile 1970 2.8 4.9 .57Colombia 1973 22.1 21.9 1.01Costa Mica... 1973 9.7 10.3 .94Guatemala. 1973 3.0 3.6 .83Menduras3 1974 3.7 4.2 .88Jamaica 1970 3.8 4.1 .93Mexico 1970 6.4 .64Panama 1970 8.6 8.7 .99Itrui 100k 1972 9.8 14.8 .66
120 years and over.1Data refer to educational attainment.310 yours and over.
41
V).
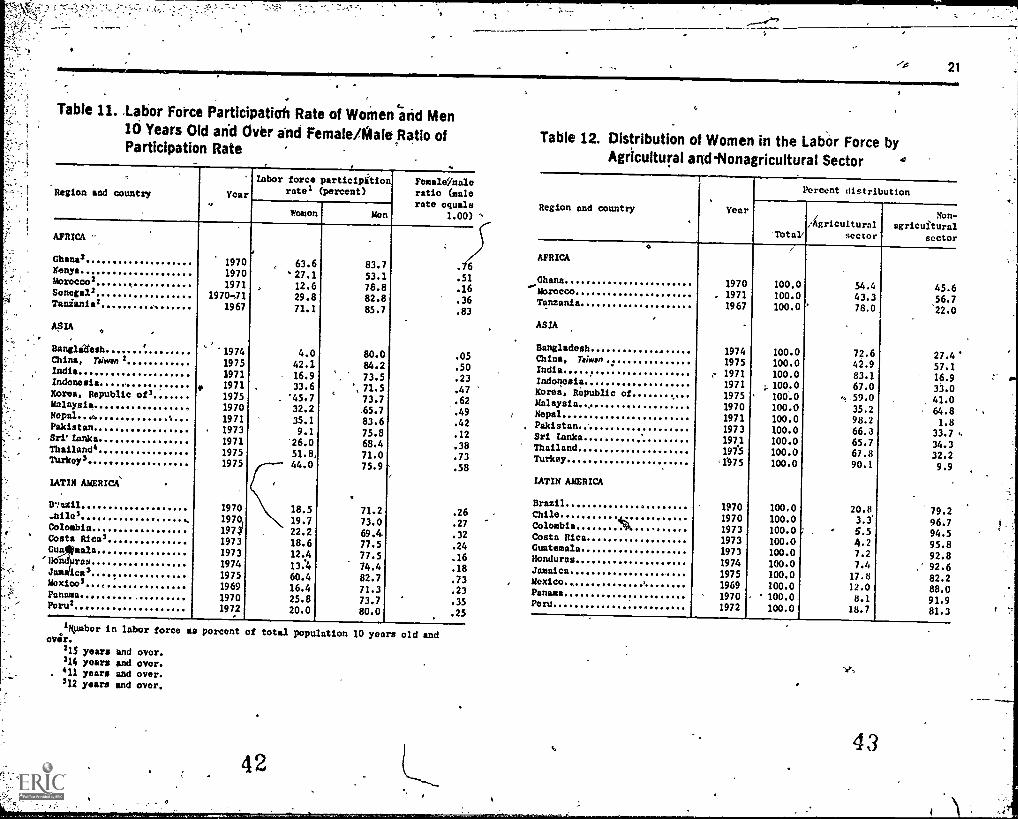
Table 11-Labor Force Participatiah Rate of WoMen arid Men10 Years Old and Over and Female /Male Ratio ofParticipation Rate
Region and country
,
Year
Labor force participition
rates (percent)Femalemaleratio (malerate equals
1.00)Women Mon
AFRICAi
/Ghans2 1970 63.6 83.7 .76Kenya 1970 '27.1 53.1 .51Morocco= . 1971 12.6 78.8 .16Senegs12 1970-11 29.8 82.8 .36Tanzania= '. 1967 71.1 85.7 .83
ASIA,
Banglidesh "''1974 4.0 80.0 .05China, toinnui2 1975 42.1 84.2 .50India 1971 16.9 ', 73.5 .23Indonesia 4, 1971 . 33.6 % 71.5 .47Korea, Republic of2 1975 . '45.7 73.7 .62Malaysia 1970 32.2 .65.7 '.49Nepal...4 1971 35.1 83.6 .42Pakistan. 1973 9.1 75.8 .12Sri' Lanka 1971 '26.0 68.4 .38Thailand4 1975 51.8, 71.0 .73Turkeys 1975 44.0 75.9 .58
LATIN AMERICA '
I.smil 1970 18.5 71.2 '.26..silos.. 1970 19.7 73.0 .27Colombia 1971 22.2 69.4 .32Costa Ricas 1973 18.6 77.5 .24Gumala 1973 12.4 77.5 .16Ho rau 1974 13.4 74.4 .18J ica3 1975 60.4 82.7 .73Maxi& 1969 16.4 71.3 .23Panama 1970 25.8 73.7 .35Peru2 1972 20.0 80.0 .25
IKumber in labor forceover.
215 years and over.214 years and over.411 years and over.212 years and over.
as portent of total population 10 years old and
21Nammfosor Mes
Table 12. Distribution of Women in the Labor Force byAgricultural and-Nonagricultural Sector a
Region and country Year
Percent distrib ution
'Total/
/Agriculturalsector
Non-agricultural
sector
AFRICA
Ghana 1970 100.0 54.4 45.6"...Morocco 1971 100.0 43.3 56.7Tanzania 19 67 100.0 78.0 '22.0
ASIA
Bangladesh 1974 100.0 72.6 27.4'China, Taiwan 1975 100.0 42.9 57.1India. 1971 100.0 83.1 16.9Indonesia 1971 100.0 67.0 33.0Korea, Republic of 1975 100.0 ..59.0 41.0Malaysia.... 1970 100.0 35.2 64.8Nepal 1971 100.0 98.2 1.8Pakistan 1973 100.0 66.3 33.7 .Sri Lanka 1971 100.0 65.7 34.3Thailand 1975 100.0 67.8 32.2Turkey <1.975 100.0 90.1 9.9
LATIN AMERICA
Brazil 1970 100.0 20.8 79.2Chile44,1/4
1970 100.0 3.3 96.7Colombia 1973 100.0 5.5 94.5Costa Rica 1973 100.0 4.2 95.8Guatemala 1973 100.0 7.2 92.8Honduras 1974 100.0 7.4 92.6Jamaica 1975 100.0 17.8 82.2Mexico 1969 100.0 12.0 88.0Panama 1970 100.0- 8.1 91.9Peru 1972 100.0 18.7 81.3
43

. .Table 13. Percent of Male and Female Labor Force in Pro-
-;'-'::-,:::-,.1::,--lei:iifonatPtcupations and FemalelMale RatioProfessional
2i1SUr include technical and related occupations). -
Region and country Year-
Percent of labor force1 in professional
'occuputions
--AFRICA,
-thin&
tailtaniat, 7
Ai4
Bangladesh,chi*, "Tenon
ln4oncsiaBares Republic of
gri-Lanki .
Thailand-
=-- IATIN AlratICA
Brasil
colombiaCosta Rica
Honduras-amide%
, -Maxine
PanamaPoru
197019711967
1974'
1975197119711975
100197119731971
19751975
1970,
197019731973
1973197419751169
1970
44
Women Hen
2.0 5.34.3 4.20.6 1.7
2.EA 1.84.8 4.62.9 2.82.3 2.32.1 '4.15.3 44.60.1 '0.7
10.1 4.99.3 3.82.8 2.33.5 5.3
14.5 2.613.7 4.311.0 4.520.0 ,5.610.7 2.612.4 2.610.4 6.411.1 4.813.2 3.612.0 6.3
Female/maleratio (male
percent equals1.00)
.38
1.02.36
1.431.041.04
.51
1.15.14
2.062.451.22
.66
5.583.192.443.57
4.124.771.622.31
3.671.91
I '
N.,
DefinitionsSz. Source of Data
Definitions of the general concepts underlying thedata presented in the figures and,tables are givenbelow. The word "general" is used advisedly for tworeasons. First, it may be that inconsistencies existbetween the verbal or written definition of a conceptand the operational procedures used in nationalcensuses and surveys to collect the data. Second,nuances in the verbal or written definition of 4concept are known to exist from country to country.Taking these two cautions into account, the followingdefinitions are offered as descriptions of the essentialattributes of the concepts. The definitions areorganized by figure and table number.
e.
Figure 1 and table 1
Age:Theege classification is based on the person'sage at last birthday.
Median age. The age which divide the distributionof women, when ranked by age from youngest tooldest, exactly in halfl. Half of the women areyounger than the median agt and half are older.
Figure 2 and table 2.
Urban areas: Towns, cities, and other localities areclassified as urban areas in pcipulation censuses andsurveys when they meet criteria such as populationsize, population density, type of local government,proportion of labor fcirce in nonagricultural activities,and/or presence of such urban-like characteristics asstreet lighting and sewers, Although countries differ.considerably in their-definition of "urban," thedifferences affect primarily the classification oflocalities of relatively small size, and affect a smallproportion of total population.
Sex ratio. The number of mates per 100 females in apopulation:
Figure 3 and table 3
Life expeiiancy at birth. The average number ofyears to be lived by persons born in a certain year if
- mortalitil-atet foteach age.group tn the specifiedyear remain constant in the future.
Figure 4 and table 4
Proportion of infants not surviving to fifth birthday.The proportion expected to die before their fifthbirthdai, if-mortility rates by age from birth to age5 observed in the specified year remaih constantin the fulure.
Figure 5 and table 5
23
Age by which 50 percent of women have ever beenmarried. The age by yfrfEhbne half of the womenhave been married &, conversely, the age by whichthe proportion single has been reduced to 50 pereent,This measure has been calculated by fitting aMakeham curve to data on the proportion singleamong women by 5.year age groups from thelatest census or survey available.
Figure '6 ano table 6
Marital status. The civil status of each individual atthe time of the census or survey; in relation to themarriage laws and customs of a eiven country. It isusually definedin terms of the following categories:
Single (or never married)Married(including consensual unions)
WidowedDivorcedSeparated (married but legally separated)
Figure 7 and table 7
Total fertility rate (TFR). The average number ofchildren that would be born per woman, if all womenlived to the end of their childbearing years and borechildren according to the sefof agespecific fertilityrates for a specified year. An agespecific fertilityrate is the number of births.during.1 year towomen in a given 5year age group per 1,000 womenin the same age group based on midyear population.
Distribution of lifetime fertility by mother's age.The percent shown for each age group representsthe proportion of an average woman's total fertilitywhich occurs while she is in that age group. Eachpercent expresses the relative contribution of theage group to total fertility.
4 (3
Figure 8 and 'table 0
Literate. A literate person is one who can both readand write with understanding a short, simple state-ment on his everyday life. The language in which aperson can read and write is not a factor in determin-ing literacy.
Figure 9 and table 9
School enrollment, Enrollment at any regular andrecognized public or private educational institutionfor systematic instruction at any educational levelduririge specified.recent time period. Enrollmentfor instruction in \particular skills, which is notpart of the iecognized educational structure of thecountry (e.g., in-service trainins courses in factories)is not considered school enrollment.
Figure 10 and table 10
Secondary school completion. Completion of thehighest grade.(year of school) at the second levelof education which usually begins between ages
10 and 15 years and usually lasts 3 or 4 years. Thesecond level is based upon at leait years of previousinstruction at the first level, and provides general arrd/oispeckized educition.
Figure 11 and table 11.
Labor force. Comprises all persons who furnish thelalior for the production of economic goods andservices during'a spetified time period. It includes
employed and unemployed persons in the civilianlabor fdrce and those in the armed forces. Employedpersons are,those who either worked during the
specified time period or had worked at a job from-which they were temporarily absent. Unemployedpersons are those who did not work but were seekingwork for pay or profit during a specified time period.
Figure 12 and table 12
Agricultural sector. As 'used here, sector refers to theindustry (or branch of economic activity) of theestablishment in which a member of the labor forceworked during a specified time period, or last workedif unemployed. The agricultural sector includesestablishments whose activity is farming, hunting,foresy, or fishing.
Nodagricuitural sector. Includes establishments whoseactivity.is other than farming, hunting, forestry, orfishing. Examples include mining, manufacturing,construction, transportation, communications,commerce, and personal, business, and Governmentservices.
Figure 13 and table 13
Professional (including technical and related) occupa-tions. Occupation refers to the kind of work doneduring a specified time period by the pe son em-ployed (or performed on the last job byunemployed) irrespective of the kind of est lish-ment in which the person is employed. Persons inprofessional, technical and related occupatiOnsperform tasks which usually require training in aspecific scientific or other professional field, at auniversity, technical institute, or similar establish-ment, or which require creative ability in literatureor art, or talent in entertaining, Examples of occupations classified as professional include engineers,
chemists, phySicists, biologists, agronomists,
physicians, nurses, teachers, clergy, lawyers, artists,writers, actors, librarians, economists, social workers,scientists, statisticians, and musicians, among others.
SOURCE OF DATA
All data in this publication were obtained from thedata base maintained at the Internatibnal Demo-graphic Data Center, U.S. Bureau of the Census,Washington, D.C. 20233. Portions of this data baseare published in the series Country Demographic Pro-filesend other publications such as World Population1.977Recent Demographic Estimates for Countriesand Regionslof the World, and A Compilation of Age-
' Specific Fertility Rates for Developing Countriesm,AReports thus far published in the Country Demo-graphic Profiles series include Costa Rica, Ghana,Guatemala, Panama, Sri Lanka, Jamaica, Honduras,Kenya, Republic of China (Taiwan), Chile, Mexico,Thailand, India, Republic of Korea, Indonesia,Colombia, Nepal, Malaysia, and Pakistan. Forth-coming in the near future are reports for Brazil,Morocco, Turkey, Bangladesh, Botswana, and 4
Liberia, as well as the. World Population 1979 report.
U. s, COVERNMENT PRINTING OFFICE :1,40 311-04SIM