Documentation for the NCES Comparable Wage Index · Documentation for the NCES Comparable Wage...
83
U.S. Department of Education EFSC 2007-397 Documentation for the NCES Comparable Wage Index Data Files, 2005
Transcript of Documentation for the NCES Comparable Wage Index · Documentation for the NCES Comparable Wage...

U.S. Department of Education EFSC 2007-397
Documentation for the NCES Comparable Wage Index Data Files, 2005


U.S. Department of Education EFSC 2007-397
Documentation for the NCES Comparable Wage Index Data Files, 2005
August 2007 Lori L. Taylor Bush School of Government and Public Service Texas A&M University Mark C. Glander Kforce Government Solutions William J. Fowler, Jr. Graduate School of Education George Mason University Frank Johnson Project Officer National Center for Education Statistics

U.S. Department of Education Margaret Spellings Secretary
Institute of Education Sciences Grover J. Whitehurst Director
National Center for Education Statistics Mark Schneider Commissioner
The National Center for Education Statistics (NCES) is the primary federal entity for collecting, analyzing, and reporting data related to education in the United States and other nations. It fulfills a congressional mandate to collect, collate, analyze, and report full and complete statistics on the condition of education in the United States; conduct and publish reports and specialized analyses of the meaning and significance of such statistics; assist state and local education agencies in improving their statistical systems; and review and report on education activities in foreign countries.
NCES activities are designed to address high-priority education data needs; provide consistent, reliable, complete, and accurate indicators of education status and trends; and report timely, useful, and high-quality data to the U.S. Department of Education, the Congress, the states, other education policymakers, practitioners, data users, and the general public. Unless specifically noted, all information contained herein is in the public domain.
We strive to make our products available in a variety of formats and in language that is appropriate to a variety of audiences. You, as our customer, are the best judge of our success in communicating information effectively. If you have any comments or suggestions about this or any other NCES product or report, we would like to hear from you. Please direct your comments to
National Center for Education Statistics Institute of Education Sciences U.S. Department of Education 1990 K Street NW Washington, DC 20006-5651
August 2007
The NCES World Wide Web Home Page address is http://nces.ed.gov. The NCES education finance World Wide Web Home Page address is http://nces.ed.gov/edfin. The NCES World Wide Web Electronic Catalog address is http://nces.ed.gov/pubsearch.
This publication is only available online. To download, view, and print the report as a PDF file, go to the NCES World Wide Web Electronic Catalog address shown above.
Suggested Citation Taylor, L. L., Glander, M., and Fowler, W. J. (2007). Documentation for the NCES Comparable Wage Index Data File, 2005 (EFSC 2007-397). National Center for Education Statistics, Institute of Education Sciences, U.S. Department of Education. Washington, DC.
Content Contact Frank Johnson 202-502-7362 [email protected]

iii
Contents
Page
I. Introduction to the NCES Comparable Wage Index Data Files ............................................. 1 II. Background ............................................................................................................................ 3 III. User’s Guide ........................................................................................................................... 5 A. CWI Geography ................................................................................................................. 5 B. Using the Index .................................................................................................................. 6 C. Standard Errors .................................................................................................................. 8 D. School District CWI File ................................................................................................... 9 E. Labor Market CWI File ................................................................................................... 11 F. State CWI File .................................................................................................................. 12 G. Regional CWI File ........................................................................................................... 13 H. Related Data Files ............................................................................................................ 14 I. File Formats and File Names ........................................................................................... 15 IV. References ............................................................................................................................ 17
Appendixes Appendix A— Record Layout and Descriptions of Data Elements:
NCES District CWI Data File ............................................................................ A-1 Appendix B— Record Layout and Descriptions of Data Elements:
NCES Labor Market CWI Data File ...................................................................B-1 Appendix C— Record Layout and Descriptions of Data Elements:
NCES State CWI Data File .................................................................................C-1 Appendix D— Record Layout and Descriptions of Data Elements:
NCES Regional CWI Data File ......................................................................... D-1 Appendix E— Glossary ..............................................................................................................E-1 Appendix F— Variable Frequencies ...........................................................................................F-1
Appendix G— Places of work names and constituent counties.................................................. G-1


1
U.S. Department of Education INSTITUTE OF EDUCATION SCIENCES
NATIONAL CENTER FOR EDUCATION STATISTICS 1990 K Street NW, Washington, DC 20006
I. Introduction to the NCES Comparable Wage Index Data Files
The Comparable Wage Index (CWI) is a measure of the systematic, regional variations in the salaries of college graduates who are not educators. It can be used by researchers to adjust district-level finance data at different levels in order to make better comparisons across geographic areas.
The original CWI files were released in June, 2006, and provided indexes for the years 1997 through 2004. This documentation describes the updated files with additional indexes for 2005.
The CWI was developed by Dr. Lori L. Taylor at the Bush School of Government and Public Service, Texas A&M University and William J. Fowler, Jr. at NCES. Dr. Taylor’s research was supported by a contract with the National Center for Education Statistics. The complete description of the research is provided in the NCES Research and Development “A Comparable Wage Approach to Geographic Cost Adjustment” (NCES 2006-321).
This documentation describes four geographic levels of the CWI, which are presented in four separate files. These files are the school district, labor market, state, and a combined regional and national file.
The school district file provides a CWI for each local education agency (LEA) in the NCES Common Core of Data (CCD) database. For each LEA there is a series of indexes for the years 1997–2005. The file can be merged with school district finance data, and this merged file can be used to produce finance data adjusted for geographic cost differences.
The additional files allow for similar cost adjustments for larger geographic areas.
NCES has sponsored the development of other geographic adjustment indexes in the past; the latest was for the 1993–94 school year. For more information on these, and on geographic cost adjustments generally, please see this web site— http://nces.ed.gov/edfin/adjustments.asp. The remainder of this documentation includes background information, a user’s guide and the following appendixes.
Appendix A—Record layout and descriptions of data elements in the district level file
Appendix B—Record layout and descriptions of data elements in the labor market file
Appendix C—Record layout and descriptions of data elements in the state level file
Appendix D—Record layout and descriptions of data elements in the regional file
Appendix E—Glossary of terms particular to this data file.

2
Appendix F—Variable ranges.
Appendix G—Places of work names and constituent counties.

3
II. Background
Geographic cost data for states, metropolitan areas, and school districts are frequently and widely requested by the public and school finance research community. In response, the National Center for Education Statistics (NCES) has had a long tradition of publishing work that reflects the latest research and development of education geographic cost adjustments.1 This report documents the newly developed Comparable Wage Index (CWI).
The basic premise of a comparable wage index is that all types of workers—including teachers—demand higher wages in areas with a higher cost of living (e.g., San Diego) or a lack of amenities (e.g., Detroit, which has a particularly high crime rate) (Federal Bureau of Investigation 2003). Therefore, one should be able to measure most of the uncontrollable variation in educator pay by observing variations in the earnings of comparable workers who are not educators.2 The CWI reflects systematic, regional variations in the salaries of college graduates who are not educators. Provided that these noneducators are similar to educators in terms of age, educational background, and tastes for local amenities, the CWI can be used to measure the uncontrollable component of variations in the wages paid to educators. Intuitively, if accountants in the Atlanta metro area are paid 5 percent more than the national average accounting wage, Atlanta engineers are paid 5 percent more than the national average engineering wage, Atlanta nurses are paid 5 percent more than the national average nursing wage, and so on, then the CWI predicts that Atlanta teachers should also be paid 5 percent more than the national average teacher wage.
The CWI was developed by combining baseline estimates from the 2000 U.S. census with annual data from the Bureau of Labor Statistics (BLS). The Occupational Employment Statistics (OES) survey is a BLS database that contains average annual earnings by occupation for states and metropolitan areas from about 400,000 nonfarm businesses, and is available from 1997 to 2005. Combining the Census with the OES makes it possible to have yearly CWI estimates for states and local labor markets for each year after 1997. OES data are available each May and permit the construction of an up-to-date, annual CWI. For a complete description of the methodology, see “A Comparable Wage Approach to Geographic Cost Adjustment” (NCES 2006-321).
The CWI offers many advantages over the previous NCES geographic cost adjustment methodologies.3 In addition to its obvious timeliness, the clearest advantage of the CWI is that it measures costs that are beyond the control of school district administrators. Unlike analyses based on school district expenditures, there is no risk that a cost-of-living index confuses high-spending school districts with high-cost school districts, and no need to rely on statistical technique and researcher judgment to separate controllable from uncontrollable costs. The CWI is also appropriate regardless of the competitiveness of teacher labor markets. If a lack of competition in the teacher market distorts teacher compensation patterns, then cost indexes based on teacher compensation will be biased, but a CWI will not (Hanushek 1999; Goldhaber 1999). Another advantage of the comparable wage approach is its general applicability. Because the resulting cost index is based on systematic differences in the general wage level, it can be used to
1 For example, see Brazer and Anderson 1983; Chambers 1997; Fowler and Monk 2001; Goldhaber 1999; Taylor and Keller 2003. 2 See for example, Rothstein and Smith (1997), Guthrie and Rothstein (1999), Goldhaber (1999), Alexander et al. (2000), Taylor et al. (2002), and Stoddard (2005). 3 For a more detailed discussion of the advantages and disadvantages of the CWI, see Taylor and Fowler (2006).

4
measure labor costs not only for public elementary and secondary education, but also for private schools, job training programs, and postsecondary institutions.
There are also a number of disadvantages to using the CWI to measure variations in school district costs. First, the CWI is a labor cost index, and labor cost is only part of the total cost of education—albeit a very large part.4 Therefore, while it is clearly appropriate to use the CWI to adjust for cost variations with respect to teacher salaries or current operating expenditures, it could be problematic to apply a labor cost index such as the CWI to school district expenditures that are largely unaffected by labor cost differentials, such as energy costs (Smith et al. 2003) or capital outlays.
Second, the methodology underlying the CWI presumes that workers are mobile. If moving costs or other barriers to moving slow worker migration, then labor costs may temporarily diverge from what is expected given local amenities and the cost of living. Employers in fast-growing industries and school districts in fast-growing areas may need to pay a temporary premium to attract workers. The CWI cannot capture this effect.
Finally, the CWI may not capture all of the uncontrollable variations in labor cost. By design, the CWI measures cost in a broad labor market like a metropolitan area. It does not capture variations in cost across school districts within a labor market. In particular, it does not reflect any variations in cost attributable to working conditions in specific school districts. All school districts in a given labor market are assigned the same CWI.
Despite its limitations, the CWI should be a particularly useful tool for researchers and policymakers. The CWI offers a timely method for geographic cost adjustment that is undeniably outside of school district control. Furthermore, it demonstrates that the gains from cost adjustment could be substantial. In 2004, the CWI for Washington, DC was 63 percent higher than the CWI for Montana, while the CWI for New York City was 49 percent higher than the CWI for Elmira, New York. Given such large differences in the prevailing wage for college graduates, cost adjustment is crucial to a complete understanding of important school finance issues both across states and within states.
4 Payroll costs comprise more than 80 percent of current school district expenditures (U.S. Census Bureau 2004).

5
III. User’s Guide A. CWI Geography
For this study, 800 labor markets in the U.S. were identified. Except in Hawaii, each labor market includes one or more public school districts. Hawaii has a single, state-wide school district which includes three separate labor markets, so the state-level index was used for this district.
All labor markets are based on “place-of-work areas” defined by the Census Bureau. Census place-of-work areas are geographic regions designed to contain at least 100,000 persons. The place-of-work areas do not cross state boundaries and generally follow the boundaries of county groups, single counties, or census-defined places (Ruggles et al. 2003). Counties in sparsely-populated parts of the country are clustered together into a single census place-of-work area. Whenever possible, places of work in metropolitan areas have been aggregated to correspond to Core Based Statistical Areas (CBSAs) as defined by the Office of Management and Budget.5 However, the data did not support creating an index for all of the metropolitan areas defined by OMB. Places of work that straddled more than one CBSA were treated as separate labor markets. All parts of the United States are included in either a CBSA or a place-of-work area.
The four CWI files provide index values at several geographic levels:
1. The labor market files provide the CWI for each of the 800 U.S. labor markets under analysis.
2. The school district file provides a CWI for each local education agency (LEA) in the NCES Common Core of Data (CCD) database. Each district was matched to its corresponding labor market using geographic information from the CCD. Where the data supported it, labor markets were aggregated to metropolitan areas (“Core Based Statistical Areas”). The remaining labor markets are identified as “places of work”. All districts within a labor market have the same CWI. For example, the 22 rural counties in the Texas Panhandle are clustered together into a single place-of-work area and therefore all districts in those 22 counties have been assigned the same CWI value.
3. The state level file provides an aggregate CWI for each U.S. state. A state’s CWI is a weighted average of the local wages within its borders.
4. The regional and national file presents similarly aggregate CWIs for census regions and the nation as a whole.
5 In June 2003, Census and OMB began using the term, Core Based Statistical Area (CBSA) instead of Metropolitan Statistical Area (MSA). See Frey, et al. (2004).

6
B. Using the Index The CWI measures labor cost relative to the national average in 1999 (CWI = 1.0). Therefore, when comparing labor costs across locations within a given year, one must take into account changes in the price level since 1999. Geographic Adjustment One way to use the CWI is to adjust expenditures for geographic variations in the cost of education to better compare these dollar amounts. To normalize dollar amounts for districts across the country, divide by the index and then multiply by the national average CWI for the relevant year (see table 1). Adjusted dollars = (actual dollars / district CWI) * national CWI Table 1. National Comparable Wage Index, by fiscal year
1997 1998 1999 2000 2001 2002 2003 2004 20050.9161 0.9534 1.0000 1.0562 1.0959 1.1547 1.185 1.2275 1.2648
SOURCE: U.S Department of Education, National Center for Education Statistics, 2005 Regional Comparable Wage Index Data File (v. 1a). The example in table 2 below uses expenditure data from the CCD School District Finance Survey (Form F-33) for fiscal year 2002. Table 2. Expenditure adjustment using the Comparable Wage Index
District
Total current expenditures per
pupil, FY 2002
District CWI, FY 2002
National CWI, FY 2002
Total current expenditures per pupil (adjusted),
FY 2002New York City 11,605 1.4331 1.1547 9,351Suwannee County, FL 6050 0.7163 1.1547 9,753
SOURCE: U.S Department of Education, National Center for Education Statistics, School District Finance Survey (form F-33) FY 2002, 2005 Regional Comparable Wage Index Data File (v. 1a), and 2005 District Comparable Wage Index Data File (v. 1a).
When these amounts are normalized the Suwannee County School District effectively spent $402 more per pupil than did NYC schools in 2002. To compare the school districts within a single state to one another without reference to the national average, substitute the state CWI for the national CWI in the above formula.
7
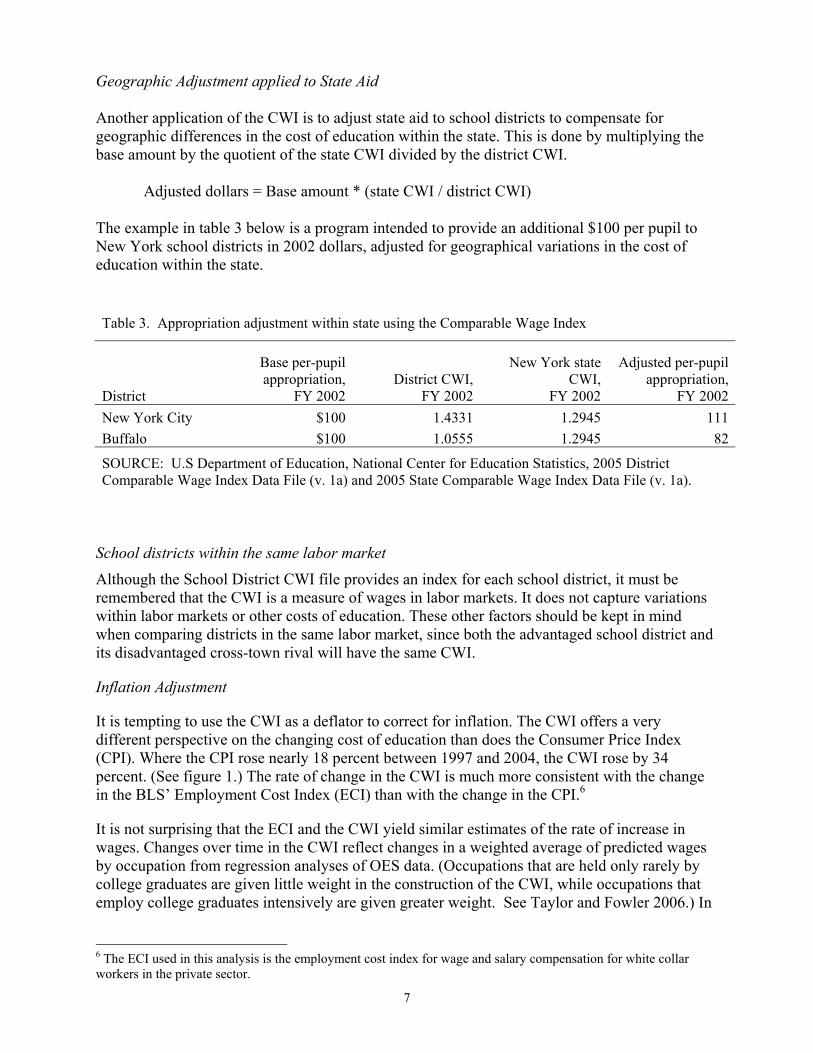
Geographic Adjustment applied to State Aid Another application of the CWI is to adjust state aid to school districts to compensate for geographic differences in the cost of education within the state. This is done by multiplying the base amount by the quotient of the state CWI divided by the district CWI. Adjusted dollars = Base amount * (state CWI / district CWI) The example in table 3 below is a program intended to provide an additional $100 per pupil to New York school districts in 2002 dollars, adjusted for geographical variations in the cost of education within the state. Table 3. Appropriation adjustment within state using the Comparable Wage Index
District
Base per-pupil appropriation,
FY 2002District CWI,
FY 2002
New York state CWI,
FY 2002
Adjusted per-pupil appropriation,
FY 2002New York City $100 1.4331 1.2945 111Buffalo $100 1.0555 1.2945 82
SOURCE: U.S Department of Education, National Center for Education Statistics, 2005 District Comparable Wage Index Data File (v. 1a) and 2005 State Comparable Wage Index Data File (v. 1a).
School districts within the same labor market Although the School District CWI file provides an index for each school district, it must be remembered that the CWI is a measure of wages in labor markets. It does not capture variations within labor markets or other costs of education. These other factors should be kept in mind when comparing districts in the same labor market, since both the advantaged school district and its disadvantaged cross-town rival will have the same CWI.
Inflation Adjustment
It is tempting to use the CWI as a deflator to correct for inflation. The CWI offers a very different perspective on the changing cost of education than does the Consumer Price Index (CPI). Where the CPI rose nearly 18 percent between 1997 and 2004, the CWI rose by 34 percent. (See figure 1.) The rate of change in the CWI is much more consistent with the change in the BLS’ Employment Cost Index (ECI) than with the change in the CPI.6
It is not surprising that the ECI and the CWI yield similar estimates of the rate of increase in wages. Changes over time in the CWI reflect changes in a weighted average of predicted wages by occupation from regression analyses of OES data. (Occupations that are held only rarely by college graduates are given little weight in the construction of the CWI, while occupations that employ college graduates intensively are given greater weight. See Taylor and Fowler 2006.) In
6 The ECI used in this analysis is the employment cost index for wage and salary compensation for white collar workers in the private sector.

8
turn, the OES relies on occupation-specific estimates of the ECI to adjust its multi-year sample for inflation (BLS 2003). Therefore, much of the information in the ECI is imbedded in the CWI.
The NCES does not recommend the use of the CWI as a deflator because the BLS does not encourage the use of the OES for time series analysis. The BLS is concerned that the OES estimates are based on a multi-year panel and the underlying occupational and industrial classification systems have changed over time (http://www.bls.gov/oes/oes_ques.htm). Arguably, the research method used in the construction of the CWI addresses many of the BLS’ concerns. However, the extent of the remaining measurement error is unknown, and caution is warranted.
Figure 1. The CWI and Inflation:1997-2004
0%
5%
10%
15%
20%
25%
30%
35%
40%
CWI ECI CPI
NOTE: The ECI is the employment cost index for the wages and salaries of private, white-collar occupations (excluding sales occupations). SOURCE: U.S. Department of Education, National Center for Education Statistics, Comparable Wage Index data file, 2006, Bureau of Labor Statistics, Employment Cost Index data file, 2006, and Bureau of Labor Statistics, Consumer Price Index data file, 2006. C. Standard Errors
The CWI is estimated by dividing the predicted wage level in each labor market by the national average predicted wage for 1999, or $47,836. Dividing one standard error of each predicted wage by $47,836 yields the standard error of the baseline CWI. It ranges from 0.003 in Los Angeles to 0.050 in rural Texas.
As discussed in Taylor and Fowler (2006), the log predicted wage for noncensus years is estimated by adding the change in log predicted wages in each labor market to the baseline log

9
predicted wage. Annual regression analysis of OES data yields log predicted wages (population marginal means) and their corresponding standard errors for all U.S. states and for the metropolitan areas covered by the OES survey. Thus, for those labor markets, the log predicted wage in 2000 equals the baseline log predicted wage plus the difference between the OES-based log predicted wages in 2000 and 1999 (the baseline year). Similarly, the standard error of the log predicted wage for 2000 is the quadratic sum of the standard errors for the baseline log predicted wage, the OES-based log predicted wage for 2000 and the OES-based log predicted wage for 1999. As with the baseline estimates, dividing one standard error of the predicted wage by $47,836 yields the standard error of the CWI.
Except in the census year (1999), predicted wages for nonmetropolitan areas cannot be measured directly. Instead, they are imputed by assuming that wage growth in a state is a weighted average of the wage growth in its metropolitan areas and its other places of work. There is no way to accurately report the standard error for those estimates.
D. School District CWI File For the school district CWI file, each CCD school district (local education agency) has been mapped to its corresponding labor market. This file provides the CWIs for each school district. There are 16,770 records in this file.
A district CWI record was created for any district that was included in the F33 survey for the fiscal years 1997–2004. Some districts closed during that time and some new ones were formed, so not all the districts in the CWI will have a corresponding record in each year of the F33 survey. Additionally, because the F33 and the CCD agency universes are different, not all districts in the nonfiscal CCD will have a record in the CWI.
States have different ways of administering charter schools and reporting data for them. Some states create a separate district for each charter school. Not all of these charter school districts meet the criteria for inclusion in the F33 survey. A CWI record has been created for those charter school districts that are included in the F33 survey. Data Elements There are 25 data elements in the School District CWI file.
• LEAID and name. The LEAID code uniquely identifies each local education agency in the CCD database. It consists of seven characters: the two-digit state FIPS code (see table 4) followed by a five-digit number that is unique to each agency within the state. Also included in the file is the LEA name.
• Labor Market. Labor markets are the units of analysis for the Comparable Wage Index
study. These are geographic regions (either Core Based Statistical Areas (CBSAs) or Places of Work) that have the same value for a comparable wage index. For CBSAs, the labor market is the five digit CBSA code defined by OMB (see http://www.census.gov/population/estimates/metro-city/0312msa.txt). For Places of Work, the labor market is coded as 8 characters, formatted “ST_99999” where “ST” is the two-digit FIPS state code (see table 4) and “99999” is the five-digit Census code for the place of work.

10
Table 4.—Federal Information Processing Standards (FIPS) state codes, by state abbreviation and state name
State abbreviation State name FIPS State code AL Alabama 1 AK Alaska 2 AZ Arizona 4 AR Arkansas 5 CA California 6
CO Colorado 8 CT Connecticut 9 DE Delaware 10 DC District of Columbia 11 FL Florida 12
GA Georgia 13 HI Hawaii 15 ID Idaho 16 IL Illinois 17 IN Indiana 18
IA Iowa 19 KS Kansas 20 KY Kentucky 21 LA Louisiana 22 ME Maine 23
MD Maryland 24 MA Massachusetts 25 MI Michigan 26 MN Minnesota 27 MS Mississippi 28
MO Missouri 29 MT Montana 30 NE Nebraska 31 NV Nevada 32 NH New Hampshire 33
NJ New Jersey 34 NM New Mexico 35 NY New York 36 NC North Carolina 37 ND North Dakota 38
OH Ohio 39 OK Oklahoma 40 OR Oregon 41 PA Pennsylvania 42 RI Rhode Island 44
SC South Carolina 45 SD South Dakota 46 TN Tennessee 47 TX Texas 48 UT Utah 49
VT Vermont 50 VA Virginia 51 WA Washington 53 WV West Virginia 54 WI Wisconsin 55 WY Wyoming 56
SOURCE: U.S. Department of Commerce, National Institute of Standards and Technology, Computer Systems Laboratory. Federal Information Processing Standards Publication 5-2, Codes for the Identification of the States, The District of Columbia and the Outlying Areas of the United States, and Associated Areas. Gaithersburg, MD: 1970.

11
• Labor market name. This is the name of either the CBSA or the place of work that
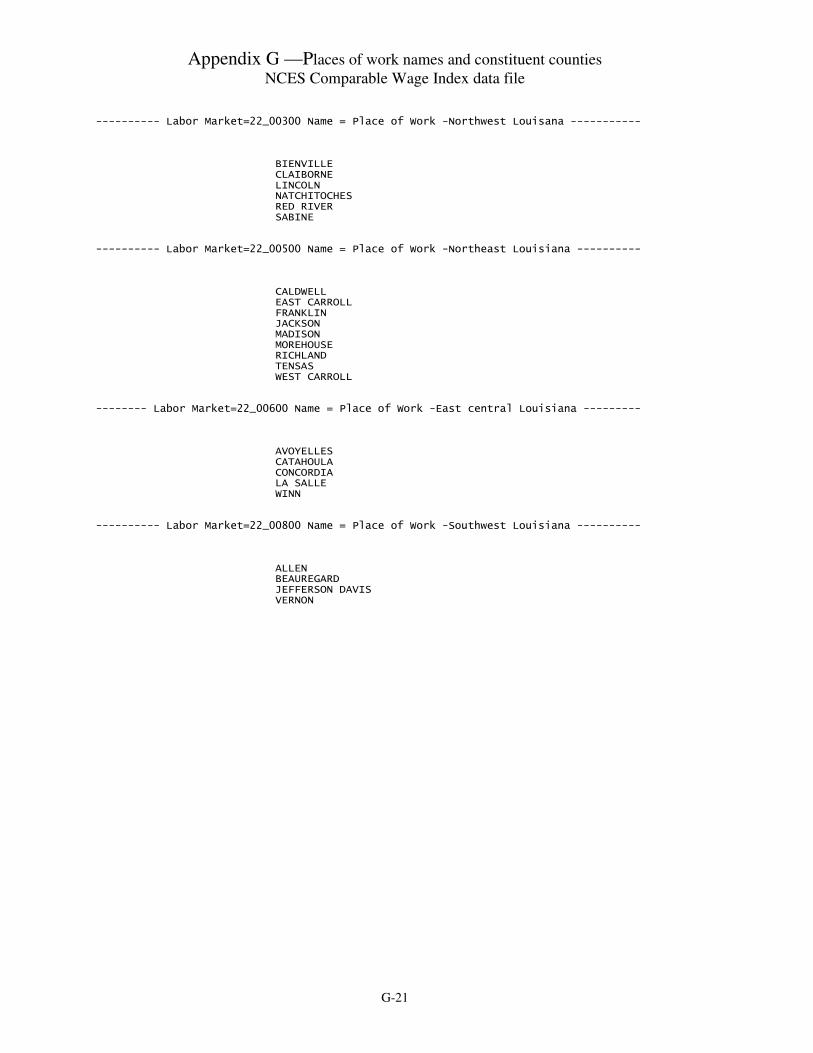
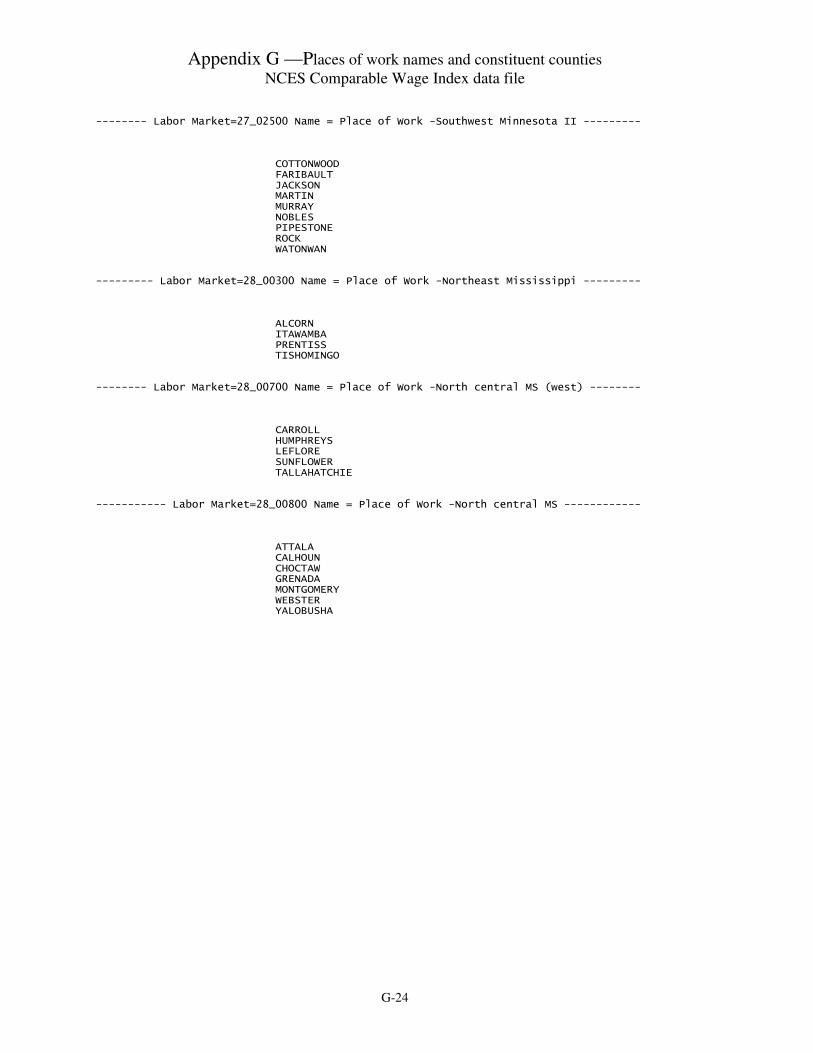
constitutes the labor market. The name used for CBSAs are from the Census document, http://www.census.gov/population/estimates/metro-city/0312msa.txt. For places of work, a name has been created based on the counties associated with the school districts within the labor market. These names are prefaced with “Place of work” and followed by a list of the constituent counties, or—where there were more counties than could be listed—a description of their location within the state. To see the counties that constitute these areas, see Appendix F—Places of work names and constituent counties.
• County code and name. This is the five digit Federal Information Processing Standards
(FIPS) code and name of the county where the school district’s offices are located. The first two digits of the FIPS code indicate the state; the last three digits uniquely identify the county within the state. Table 4 on the previous page lists FIPS state codes by state name and state abbreviation.
• State name.
• D_STD_CWI_yyyy. These 9 fields are the standard errors for the extended comparable wage index, where ‘yyyy’ indicates the year (1997–2005).
• D_CWI_yyyy. These 9 fields are the extended comparable wage index values, where
‘yyyy’ indicates the year (1997–2005). Missing Data Standard errors for the CWI (D_STD_CWI_yyyy ) for years other than 1999 are not included for 8,365 LEAs. In these cases, the growth rate used to extend the CWI to these years was imputed from the difference between the state growth rate and the metro growth rate in the state and a meaningful standard error cannot be derived. These missing values are indicated by a “-2”. E. Labor Market CWI File
Labor markets are based on “place-of-work areas” defined by the Census Bureau. Whenever possible, places of work in metropolitan areas have been aggregated to correspond to Core Based Statistical Areas (CBSAs) as defined by the Office of Management and Budget.7 However, the data did not support creating an index for all of the metropolitan areas defined by OMB. Places of work that straddled more than one CBSA were treated as separate labor markets. All parts of the United States are included in either a CBSA or a place-of-work area. There are 800 records in this file.
The Labor Market CWI file includes 20 data elements.
• Labor Market. Labor markets are the units of analysis for the Comparable Wage Index study. These are geographic regions (either Core Based Statistical Areas or Places of Work) that have the same value for a comparable wage index. For CBSAs, the labor market is the five digit CBSA code defined by OMB (see
7 In June 2003, Census and OMB began using the term, Core Based Statistical Area (CBSA) instead of Metropolitan Statistical Area (MSA). See Frey, et al. (2004).

12
http://www.census.gov/population/estimates/metro-city/0312msa.txt). For Places of Work, the labor market is coded as 8 characters, formatted “ST_99999” where “ST” is the two-digit FIPS state code (see table 4) and “99999” is the five-digit Census code for the place of work.
• Labor market name. This is the name of either the CBSA or the place of work that
constitutes the labor market. The name used for CBSAs are from the Census document, http://www.census.gov/population/estimates/metro-city/0312msa.txt. For places of work, a name has been created based on the counties associated with the school districts within the labor market. These names are prefaced with “Place of work” and followed by a list of the constituent counties, or—where there were more counties than could be listed—a description of their location within the state. To see the counties that constitute these areas, see Appendix F—Places of work names and constituent counties.
• LM_STD_CWI_yyyy. These 9 fields are the standard errors for the extended comparable
wage index, where ‘yyyy’ indicates the year (1997–2005). There are 456 labor markets for which the standard errors in years other than 1999 are missing (indicated by a value of “-2”). In these cases, the growth rate used to extend the CWI to these years was imputed from the difference between the state growth rate and the metro growth rate in the state and a meaningful standard error cannot be derived.
• LM_CWI_yyyy. These 9 fields are the extended comparable wage index values, where
‘yyyy’ indicates the year (1997–2005). F. State CWI File There are 51 records in the State CWI file and 20 data elements.
• State FIPS Code. This is the two-digit Federal Information Processing Standard (FIPS) code for the state.
• State Name. • ST_STD_CWI_yyyy. These 9 fields are the standard errors for the extended comparable
wage index, where ‘yyyy’ indicates the year (1997–2005).
• ST_CWI_yyyy. These 9 fields are the extended comparable wage index values, where ‘yyyy’ indicates the year (1997–2005).

13
G. Regional CWI File The Regional CWI file has 14 records and 19 data elements.
• Region Name. This file provides CWI data at the national level as well as at the four regional levels (in bold below) and nine divisional levels (in parentheses below) used in the Current Population Survey (CPS). These regions and divisions are as follows.
Northeast Midwest (New England) (East North Central) Maine Ohio New Hampshire Indiana Vermont Illinois Massachusetts Michigan Rhode Island Wisconsin Connecticut (Middle Atlantic) (West North Central)New York Minnesota New Jersey Iowa Pennsylvania Missouri North Dakota South Dakota Nebraska Kansas
South West (South Atlantic) (Mountain) Delaware Montana Maryland Idaho District of Columbia Wyoming Virginia Colorado West Virginia New Mexico North Carolina Arizona South Carolina Utah Georgia Nevada Florida (East South Central) (Pacific) Kentucky Washington Tennessee Oregon Alabama California Mississippi Alaska Hawaii (West South Central) Arkansas Louisiana Oklahoma Texas
• R_STD_CWI_yyyy. These 9 fields are the standard errors for the extended comparable
wage index, where ‘yyyy’ indicates the year (1997–2005).

14
• R_CWI_yyyy. These 9 fields are the extended comparable wage index values, where ‘yyyy’ indicates the year (1997–2005).
H. Related Data Files Common Core of Data (CCD) The CCD is a comprehensive, annual, national database of information concerning all public elementary and secondary schools and school districts (LEAs). CCD consists of five surveys: 1) Public Elementary/Secondary School Universe, 2) Local Education Agency (School District) Universe, 3) State Nonfiscal, 4) National Public Education Finance Survey (NPEFS), and 5) the Local Education Agency Finance Data File (F-33) surveys. All CCD data are provided by the state education agencies and are edited by NCES. When merging the F-33 data file with other CCD data files, data users are encouraged to use the F-33 count for student membership. The student membership count has been changed on some records to more closely reflect the count of students enrolled in the schools in the LEA. The LEAID links all these surveys together. It is shared by both the LEA file and the F33 file. The first two digits of the LEAID are the state FIPS code, facilitating the aggregation of data from agency level to state level. The LEAID is also included in the School universe file, making it possible to aggregate school-level data to the agency or state level. The CCD Local Education Agency (School District) Universe contains data on students and staff, as well as dropout and graduate counts. The Local Education Agency Finance Data File (F-33) survey is part of the Census Bureau’s Annual Survey of Local Government Finances—School Systems. (The shorthand reference, “F-33” is the form number used for the data collection.) Unlike the CCD LEA universe, the F33 universe (i.e. local government school systems) does not include state or federally operated school districts, or school districts in the outlying territories. Charter school districts are also defined differently in the F33 survey than they are in CCD. The NPEFS component of CCD collects state totals of public education finance data. NPEFS includes expenditures for the outlying territories, special state-run schools and charter schools that may not be included in the F-33. NPEFS data are used in determining state funding allocations for a number of federal education programs including those authorized by Title I of the Elementary and Secondary Education Act of 1965. Data from the most recent NCES files can be accessed on the web at the U.S. Department of Education/NCES web site at http://nces.ed.gov/ccd.
15
Fiscal-nonfiscal longitudinal files These files contain district-level fiscal and nonfiscal data for each year from 1989–90 to 1999–2000, for the universe of regular public elementary and secondary school districts. The database is available in two forms. The primary longitudinal Fiscal-Nonfiscal (FNF) file in the database contains a separate record for each regular school district that was open some years in the 1990s. The other longitudinal file, the Unified Fiscal-Nonfiscal file (UFNF), combines data from separate elementary districts with the secondary districts they feed, so that each record contains data for a Unified K–12 “pseudo-district.” (“Elementary” districts typically covered the grades K–8, while “secondary” districts typically covered the grades 9–12.) The database is designed for research use in testing hypotheses about longitudinal trends in school districts over this period. To facilitate analysis, all missing data have been replaced by statistical imputations, and clearly erroneous responses have been edited and replaced by plausible values. I. File Formats and File Names Data File Formats. The data files are available in two formats—SAS (.sas7bdat), and a tab delimited text file (.txt). The names of these datasets are:
CWI_Distict_2005_1a.sas7bdat (SAS)
CWI_District_2005_1a.txt (Tab-delimited text file) CWI_Lbr_Mrkt_2005_1a.sas7bdat (SAS)
CWI_ Lbr_Mrkt _2005_1a.txt (Tab-delimited text file) CWI_State_2005_1a.xls (MS Excel)
CWI_State_2005_1a.txt (Tab-delimited text file) CWI_Regional_2005_1a.xls (MS Excel)
CWI_Regional_2005_1a.txt (Tab-delimited text file) The last 2 characters of the file name indicate the file version. “1” indicates a public release by NCES, and “a” indicates this is the first release of this file by NCES. The tab-delimited text files are provided for those researchers who wish to use these data in applications other than SAS or MS Excel. The tab-delimited format is easily imported into most applications. When viewed in a text editor, the tab-delimited files will not appear in columnar format. The LEAID includes the leading zero where it occurs so that it is consistent with CCD data files. To ensure that this leading zero is retained when importing the text file into an application, the field must be defined as a character field. If, for example, the district text data file is opened in Excel without using the import function, Excel will define LEAID as a numeric field and drop the leading zero. The variable descriptions (name, length, data type—alpha or numeric, and variable description) are in the appendixes A–D and should be consulted when importing the text files into an application.


17
IV. References Alexander, C.D., Gronberg, T., Jansen, D., Keller, H., Taylor, L., and Treisman, P.U. (2000). A
Study of Uncontrollable Variations in the Costs of Texas Public Education. Summary report prepared for the 77th Texas Legislature. Austin, TX: Charles A. Dana Center, University of Texas at Austin. Retrieved May 19, 2005, from http://www.utdanacenter.org.
Brazer, H. & Anderson, A. (1983). A Cost Adjustment Index for Michigan School Districts. In
E. Tron (Ed.), Selected Papers in School Finance, 1975. Washington, DC: U.S. Office of Education.
Bureau of Labor Statistics. (2003). Technical Notes for the May 2003 OES Estimates. Retrieved
May 19, 2005, from http://stats.bls.gov/oes/2003/may/oes_tec.htm. Bureau of Labor Statistics (2006). Consumer Price Index. Retrieved April 6, 2006 from
http://stats.bls.gov/cpi/home.htm. Bureau of Labor Statistics (2006). Employment Cost Index. Retrieved April 6, 2006 from
http://data.bls.gov/cgi-bin/dsrv?ec. Chambers, J.G. (1997). Measuring Inflation in Public Schools Costs (NCES 97-43). U.S.
Department of Education. Washington, DC: National Center for Education Statistics Working Paper.
Chambers, J.G. (1998). Geographic Variations in Public Schools Costs (NCES 98-04). U.S.
Department of Education. Washington, DC: National Center for Education Statistics Working Paper.
Federal Bureau of Investigation (2003). Crime in the United States. Uniform Crime Reports.
Retrieved May 19, 2005, from http://www.fbi.gov/ucr/03cius.htm. Fowler, W.J., and Monk, D.H. (2001). A Primer for Making Cost Adjustments in Education
(NCES 2001-323). U.S. Department of Education. Washington, DC: National Center for Education Statistics.
Frey, W.H., Wilson, J.H., Berube, A., and Singer. A. (2004). Tracking Metropolitan America
into the 21st Century: A Field Guide to the New Metropolitan and Micropolitan Definitions. Washington, DC: The Brookings Institution.
Goldhaber, D. (1999). An Alternative Measure of Inflation in Teacher Salaries. In W.J. Fowler
(Ed.), Selected Papers in School Finance (NCES 1999-334) (pp.29–54). U.S. Department of Education. Washington, DC: National Center for Education Statistics.

18
Guthrie, J., and Rothstein, R. (1999). Enabling ‘Adequacy’ to Achieve Reality: Translating Adequacy into State School Finance Distribution Arrangements. In H.F. Ladd, R. Chalk, and J.S. Hansen (Eds.), Equity and Adequacy in Education Finance (pp. 209–259). Washington, DC: National Academy Press.
Hanushek, E.A. (1999). Adjusting for Differences in the Costs of Educational Inputs. In W.J.
Fowler (Ed.), Selected Papers in School Finance, 1997–99 (NCES 1999–334) (pp. 13–28). U.S. Department of Education. Washington, DC: National Center for Education Statistics.
Rothstein, R., and Smith, J.R. (1997). Adjusting Oregon Education Expenditures for Regional
Cost Differences: A Feasibility Study. Submitted to the Confederation of Oregon School Administrators. Sacramento, CA: Management Analysis & Planning Associates, LLC.
Ruggles, S., Sobek, M., Alexander, T., Fitch, C., Goeken, R., Hall, P., King, M., and Ronnander,
C. (2004). Integrated Public Use Microdata Series: Version 3.0 (machine-readable database). Minneapolis, MN: Minnesota Population Center. Available at http://www.ipums.org.
Smith, T., Porch, R., Farris, E., and Fowler, W.J. (2003). Effects of Energy Needs and
Expenditures on U.S. Public Schools (NCES 2003-018). National Center for Education Statistics, Institute of Education Sciences, U.S. Department of Education. Washington, DC.
Stoddard, C. (2005). Adjusting Teacher Salaries for the Cost of Living: The Effect on Salary
Comparisons and Policy Conclusions. Economics of Education Review, 24(3): 323–339. Taylor, L.L., Alexander, C., Gronberg, T., Jansen, D., and Keller, H. (2002). Updating the Texas
Cost of Education Index. The Journal of Education Finance, 28(2): 267–284. Taylor, L.L., and Fowler, W.J. (2006). A Comparable Wage Approach to Geographic Cost
Adjustment (NCES 2006-321). National Center for Education Statistics, Institute of Education Sciences, U.S. Department of Education. Washington, DC.
Taylor, L.L., and Keller H. (2003). Competing Perspectives on the Cost of Education. In W.J.
Fowler (Ed.), Developments in School Finance (NCES 2003-403). National Center for Education Statistics, Institute of Education Sciences, U.S. Department of Education. Washington, DC.
U.S. Census Bureau. (2004). 2002 Census of Governments, Volume 4, Number 1, Government
Finances, GC02(4)-1. U.S. Department of Commerce, Economics and Statistics Administration. Washington, DC: U.S. Government Printing Office.

Appendix A—Record Layout and Descriptions of Data Elements: NCES District CWI Data File
A-1
File name=CWI_District_2005_1a.txt Number of Variables=25 Record Length = variable (tab-delimited) Number of Observations= 16,770 Release: 1a, September 2007 This is a tab-delimited file.
Position Variable Name Length Type Variable Description 1 LEAID 7 Char Unique Agency ID (NCES Assigned) 2 LEA_NAME 33 Char LEA Name 3 LABORMARKET 14 Char Applicable area of wage index 4 LM_NAME 71 Char Name of CBSA or Place of Work 5 CNTY_CODE 5 Char FIPS State-County Code 6 CNTY_NAME 32 Char County Name 7 STATE_NAME 20 Char State Name 8 D_STD_CWI_1997 6 Num STD ERR CWI for 1997 9 D_STD_CWI_1998 6 Num STD ERR CWI for 1998 10 D_STD_CWI_1999 6 Num STD ERR CWI for 1999 11 D_STD_CWI_2000 6 Num STD ERR CWI for 2000 12 D_STD_CWI_2001 6 Num STD ERR CWI for 2001 13 D_STD_CWI_2002 6 Num STD ERR CWI for 2002 14 D_STD_CWI_2003 6 Num STD ERR CWI for 2003 15 D_STD_CWI_2004 6 Num STD ERR CWI for 2004 16 D_STD_CWI_2005 6 Num STD ERR CWI for 2005 17 D_CWI_1997 6 Num Comparable Wage Index for 1997 18 D_CWI_1998 6 Num Comparable Wage Index for 1998 19 D_CWI_1999 6 Num Comparable Wage Index for 1999 20 D_CWI_2000 6 Num Comparable Wage Index for 2000 21 D_CWI_2001 6 Num Comparable Wage Index for 2001 22 D_CWI_2002 6 Num Comparable Wage Index for 2002 23 D_CWI_2003 6 Num Comparable Wage Index for 2003 24 D_CWI_2004 6 Num Comparable Wage Index for 2004 25 D_CWI_2005 6 Num Comparable Wage Index for 2005


Appendix B—Record Layout and Descriptions of Data Elements: NCES Labor Market CWI Data File
B-1
File name=CWI_LBR_MRKT_2005_1a.txt Number of Variables=20 Record Length = variable (tab-delimited) Number of Observations= 800 Release: 1a, September 2007 This is a tab-delimited file.
Position Variable Name Length Type Variable Description 1 LABORMARKET 14 Char Applicable area of wage index 2 LM_NAME 71 Char Name of CBSA or Place of Work 3 LM_STD_CWI_1997 8 Num STD ERR CWI for 1997 4 LM_STD_CWI_1998 8 Num STD ERR CWI for 1998 5 LM_STD_CWI_1999 8 Num STD ERR CWI for 1999 6 LM_STD_CWI_2000 8 Num STD ERR CWI for 2000 7 LM_STD_CWI_2001 8 Num STD ERR CWI for 2001 8 LM_STD_CWI_2002 8 Num STD ERR CWI for 2002 9 LM_STD_CWI_2003 8 Num STD ERR CWI for 2003 10 LM_STD_CWI_2004 8 Num STD ERR CWI for 2004 11 LM_STD_CWI_2005 8 Num STD ERR CWI for 2005 12 LM_CWI_1997 8 Num Comparable Wage Index for 1997 13 LM_CWI_1998 8 Num Comparable Wage Index for 1998 14 LM_CWI_1999 8 Num Comparable Wage Index for 1999 15 LM_CWI_2000 8 Num Comparable Wage Index for 2000 16 LM_CWI_2001 8 Num Comparable Wage Index for 2001 17 LM_CWI_2002 8 Num Comparable Wage Index for 2002 18 LM_CWI_2003 8 Num Comparable Wage Index for 2003 19 LM_CWI_2004 8 Num Comparable Wage Index for 2004 20 LM_CWI_2005 8 Num Comparable Wage Index for 2005


Appendix C—Record Layout and Descriptions of Data Elements: NCES State CWI Data File
C-1
File name=CWI_State__2005_1a.txt Number of Variables=20 Record Length = variable (tab-delimited) Number of Observations= 51 Release: 1a, September 2007 This is a tab-delimited file.
Position Variable Name Length Type Variable Description 1 ST_FIPS 2 Char State FIPS Code 2 ST_NAME 20 Char State Name 3 ST_STD_CWI_1997 8 Num STD ERR CWI for 1997 4 ST_STD_CWI_1998 8 Num STD ERR CWI for 1998 5 ST_STD_CWI_1999 8 Num STD ERR CWI for 1999 6 ST_STD_CWI_2000 8 Num STD ERR CWI for 2000 7 ST_STD_CWI_2001 8 Num STD ERR CWI for 2001 8 ST_STD_CWI_2002 8 Num STD ERR CWI for 2002 9 ST_STD_CWI_2003 8 Num STD ERR CWI for 2003 10 ST_STD_CWI_2004 8 Num STD ERR CWI for 2004 11 ST_STD_CWI_2005 8 Num STD ERR CWI for 2005 12 ST_CWI_1997 8 Num Comparable Wage Index for 1997 13 ST_CWI_1998 8 Num Comparable Wage Index for 1998 14 ST_CWI_1999 8 Num Comparable Wage Index for 1999 15 ST_CWI_2000 8 Num Comparable Wage Index for 2000 16 ST_CWI_2001 8 Num Comparable Wage Index for 2001 17 ST_CWI_2002 8 Num Comparable Wage Index for 2002 18 ST_CWI_2003 8 Num Comparable Wage Index for 2003 19 ST_CWI_2004 8 Num Comparable Wage Index for 2004 20 ST_CWI_2005 8 Num Comparable Wage Index for 2005


Appendix D—Record Layout and Descriptions of Data Elements: NCES Regional CWI Data File
D-1
File name=CWI_Regional_2005_1a.txt Number of Variables=19 Record Length = variable (tab-delimited) Number of Observations= 14 Release: 1a, September 2007 This is a tab-delimited file.
Position Variable Name Length Type Variable Description 1 REG_NAME 24 Char Region Name 2 R_STD_CWI_1997 8 Num STD ERR CWI for 1997 3 R_STD_CWI_1998 8 Num STD ERR CWI for 1998 4 R_STD_CWI_1999 8 Num STD ERR CWI for 1999 5 R_STD_CWI_2000 8 Num STD ERR CWI for 2000 6 R_STD_CWI_2001 8 Num STD ERR CWI for 2001 7 R_STD_CWI_2002 8 Num STD ERR CWI for 2002 8 R_STD_CWI_2003 8 Num STD ERR CWI for 2003 9 R_STD_CWI_2004 8 Num STD ERR CWI for 2004 10 R_STD_CWI_2005 8 Num STD ERR CWI for 2005 11 R_CWI_1997 8 Num Comparable Wage Index for 1997 12 R_CWI_1998 8 Num Comparable Wage Index for 1998 13 R_CWI_1999 8 Num Comparable Wage Index for 1999 14 R_CWI_2000 8 Num Comparable Wage Index for 2000 15 R_CWI_2001 8 Num Comparable Wage Index for 2001 16 R_CWI_2002 8 Num Comparable Wage Index for 2002 17 R_CWI_2003 8 Num Comparable Wage Index for 2003 18 R_CWI_2004 8 Num Comparable Wage Index for 2004 19 R_CWI_2005 8 Num Comparable Wage Index for 2005


Appendix E —Glossary NCES Comparable Wage Index Data File
E-1
Core Based Statistical Area (CBSA). These are the metropolitan statistical areas and metropolitan divisions defined by the Office of Management and Budget, December 2003, and disseminated by the Population Division, U.S. Census Bureau (Last Revised: January 6, 2004; Internet Release Date: February 25, 2004 http://www.census.gov/population/estimates/metro-city/0312msa.txt ). Comparable wage indexes are based on Core Based Statistical Areas or Places of Work. Common Core of Data (CCD). A group of public elementary/secondary education surveys of NCES. CCD data are collected from each state’s department of education, from their administrative records data systems. Charter Schools. Charter schools are public schools that are exempted from significant state or local rules that normally govern the operation and management of public schools. A charter school is created by a developer as a public school, or is adapted by a developer from an existing public school. It operates in pursuit of a specific set of education objectives determined by the school’s developer and agreed to by the public chartering agency and provides a program of elementary or secondary education, or both. It meets all applicable federal, state, and local health and safety requirements; complies with federal civil rights laws and operates in accordance with state law. Charter schools may be operated by a regular school district, or they may be self-governing entities. Elementary/Secondary Education. Programs providing instruction, or assisting in providing instruction, for students in prekindergarten, kindergarten, grades 1 through 12, and ungraded programs. Fiscal Year. The 12-month period to which the annual operating budget applies. At the end of the fiscal year, the agency determines its financial condition and the results of its operations. Labor Market. Labor markets are the units of analysis for the Comparable Wage Index study. These are geographic regions (either Core Based Statistical Areas or Places of Work) that have the same value for a comparable wage index. LEA. Local Education Agency, often called school districts, an education agency at the local level whose primary responsibility is to operate public schools or to contract for public school services. National Center for Education Statistics (NCES). An organization within the Institute of Education Sciences (IES), part of the U.S. Department of Education. NCES is the primary federal entity for collecting, analyzing, and reporting data related to education. Place of Work. A geographic area defined by the Census Bureau. Comparable wage indexes are based on either Core Based Statistical Areas or Places of Work. Public School Systems. Includes independent school district governments and dependent school systems. Independent school district governments are organized local entities providing public elementary, secondary, special, and vocational/technical education. Dependent school systems

Appendix E —Glossary NCES Comparable Wage Index Data File
E-2
are classified by the Census Bureau as sub-units of some other governmental unit such as a county, municipality, township, or the state.

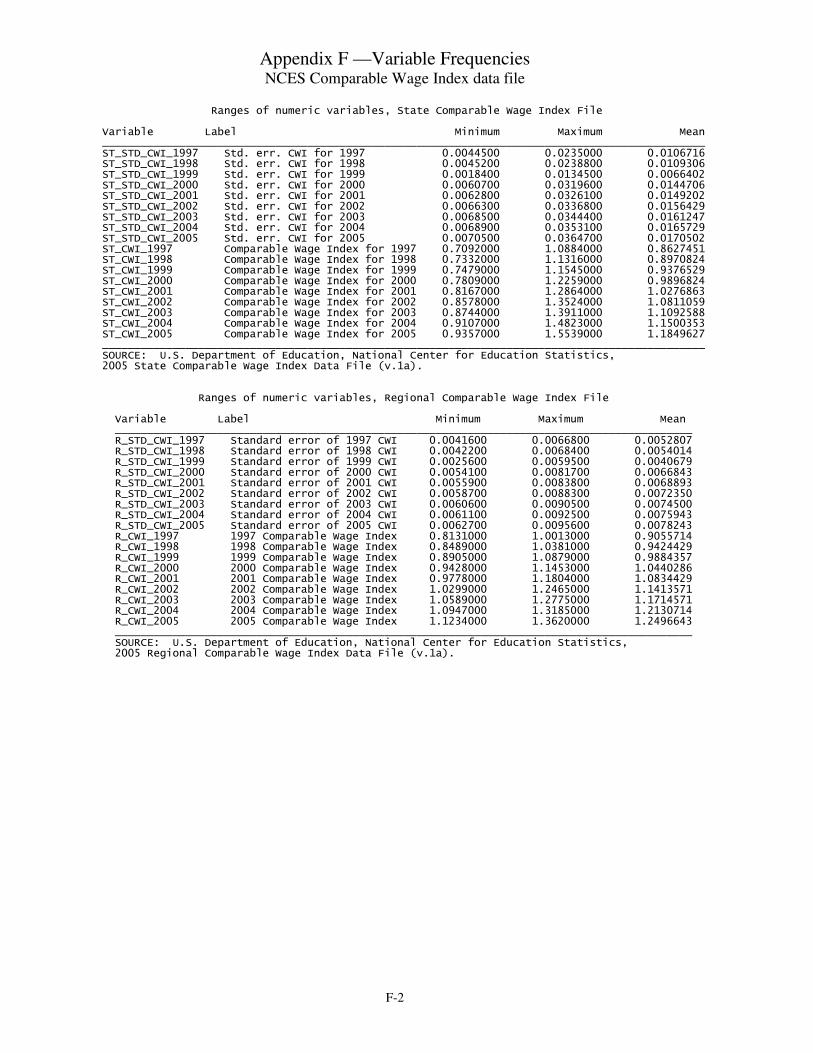
Appendix F —Variable Frequencies NCES Comparable Wage Index data file
F-1
Ranges of numeric variables, District Comparable Wage Index File Variable Label Minimum Maximum Mean ____________________________________________________________________________________________ D_STD_CWI_1997 Standard error of 1997 CWI -2.0000000 0.0508400 -0.9674291 D_STD_CWI_1998 Standard error of 1998 CWI -2.0000000 0.0516200 -0.9671598 D_STD_CWI_1999 Standard error of 1999 CWI 0.0031900 0.0497900 0.0188147 D_STD_CWI_2000 Standard error of 2000 CWI -2.0000000 0.0702500 -0.9646007 D_STD_CWI_2001 Standard error of 2001 CWI -2.0000000 0.0726900 -0.9642606 D_STD_CWI_2002 Standard error of 2002 CWI -2.0000000 0.0745500 -0.9637044 D_STD_CWI_2003 Standard error of 2003 CWI -2.0000000 0.0778500 -0.9633825 D_STD_CWI_2004 Standard error of 2004 CWI -2.0000000 0.0790700 -0.9629939 D_STD_CWI_2005 Standard error of 2005 CWI -2.0000000 0.0826900 -0.9676777 D_CWI_1997 1997 Comparable Wage Index 0.6034000 1.1400000 0.8218406 D_CWI_1998 1998 Comparable Wage Index 0.6044000 1.1853000 0.8554870 D_CWI_1999 1999 Comparable Wage Index 0.7032000 1.2436000 0.9000033 D_CWI_2000 2000 Comparable Wage Index 0.7173000 1.3506000 0.9485407 D_CWI_2001 2001 Comparable Wage Index 0.7278000 1.4226000 0.9816315 D_CWI_2002 2002 Comparable Wage Index 0.7163000 1.5139000 1.0313198 D_CWI_2003 2003 Comparable Wage Index 0.7624000 1.5648000 1.0598191 D_CWI_2004 2004 Comparable Wage Index 0.7676000 1.6276000 1.0953656 D_CWI_2005 2005 Comparable Wage Index 0.8333000 1.6687000 1.1291745 ____________________________________________________________________________________________ SOURCE: U.S. Department of Education, National Center for Education Statistics, 2005 District Comparable Wage Index Data File (v.1a). Ranges of numeric variables, Labor Market Comparable Wage Index File Variable Label Minimum Maximum Mean _________________________________________________________________________________________________ LM_STD_CWI_1997 Std. err. CWI for 1997 -2.0000000 0.0508400 -1.1248530 LM_STD_CWI_1998 Std. err. CWI for 1998 -2.0000000 0.0516200 -1.1245647 LM_STD_CWI_1999 Std. err. CWI for 1999 0.0031900 0.0497900 0.0237951 LM_STD_CWI_2000 Std. err. CWI for 2000 -2.0000000 0.0702500 -1.1192620 LM_STD_CWI_2001 Std. err. CWI for 2001 -2.0000000 0.0726900 -1.1188180 LM_STD_CWI_2002 Std. err. CWI for 2002 -2.0000000 0.0745500 -1.1181423 LM_STD_CWI_2003 Std. err. CWI for 2003 -2.0000000 0.0778500 -1.1177494 LM_STD_CWI_2004 Std. err. CWI for 2004 -2.0000000 0.0790700 -1.1172641 LM_STD_CWI_2005 Std. err. CWI for 2005 -2.0000000 0.0826900 -1.1220745 LM_CWI_1997 Comparable Wage Index for 1997 0.6034000 1.1400000 0.7988985 LM_CWI_1998 Comparable Wage Index for 1998 0.6044000 1.1853000 0.8322310 LM_CWI_1999 Comparable Wage Index for 1999 0.7032000 1.2436000 0.8768106 LM_CWI_2000 Comparable Wage Index for 2000 0.7173000 1.3506000 0.9229992 LM_CWI_2001 Comparable Wage Index for 2001 0.7278000 1.4226000 0.9548191 LM_CWI_2002 Comparable Wage Index for 2002 0.7163000 1.5139000 1.0015973 LM_CWI_2003 Comparable Wage Index for 2003 0.7624000 1.5648000 1.0300080 LM_CWI_2004 Comparable Wage Index for 2004 0.7676000 1.6276000 1.0635634 LM_CWI_2005 Comparable Wage Index for 2005 0.8333000 1.6687000 1.0962220 _________________________________________________________________________________________________ SOURCE: U.S. Department of Education, National Center for Education Statistics, 2005 Labor Market Comparable Wage Index Data File (v.1a).
Appendix F —Variable Frequencies NCES Comparable Wage Index data file
F-2
Ranges of numeric variables, State Comparable Wage Index File Variable Label Minimum Maximum Mean ______________________________________________________________________________________________ ST_STD_CWI_1997 Std. err. CWI for 1997 0.0044500 0.0235000 0.0106716 ST_STD_CWI_1998 Std. err. CWI for 1998 0.0045200 0.0238800 0.0109306 ST_STD_CWI_1999 Std. err. CWI for 1999 0.0018400 0.0134500 0.0066402 ST_STD_CWI_2000 Std. err. CWI for 2000 0.0060700 0.0319600 0.0144706 ST_STD_CWI_2001 Std. err. CWI for 2001 0.0062800 0.0326100 0.0149202 ST_STD_CWI_2002 Std. err. CWI for 2002 0.0066300 0.0336800 0.0156429 ST_STD_CWI_2003 Std. err. CWI for 2003 0.0068500 0.0344400 0.0161247 ST_STD_CWI_2004 Std. err. CWI for 2004 0.0068900 0.0353100 0.0165729 ST_STD_CWI_2005 Std. err. CWI for 2005 0.0070500 0.0364700 0.0170502 ST_CWI_1997 Comparable Wage Index for 1997 0.7092000 1.0884000 0.8627451 ST_CWI_1998 Comparable Wage Index for 1998 0.7332000 1.1316000 0.8970824 ST_CWI_1999 Comparable Wage Index for 1999 0.7479000 1.1545000 0.9376529 ST_CWI_2000 Comparable Wage Index for 2000 0.7809000 1.2259000 0.9896824 ST_CWI_2001 Comparable Wage Index for 2001 0.8167000 1.2864000 1.0276863 ST_CWI_2002 Comparable Wage Index for 2002 0.8578000 1.3524000 1.0811059 ST_CWI_2003 Comparable Wage Index for 2003 0.8744000 1.3911000 1.1092588 ST_CWI_2004 Comparable Wage Index for 2004 0.9107000 1.4823000 1.1500353 ST_CWI_2005 Comparable Wage Index for 2005 0.9357000 1.5539000 1.1849627 ______________________________________________________________________________________________ SOURCE: U.S. Department of Education, National Center for Education Statistics, 2005 State Comparable Wage Index Data File (v.1a). Ranges of numeric variables, Regional Comparable Wage Index File Variable Label Minimum Maximum Mean __________________________________________________________________________________________ R_STD_CWI_1997 Standard error of 1997 CWI 0.0041600 0.0066800 0.0052807 R_STD_CWI_1998 Standard error of 1998 CWI 0.0042200 0.0068400 0.0054014 R_STD_CWI_1999 Standard error of 1999 CWI 0.0025600 0.0059500 0.0040679 R_STD_CWI_2000 Standard error of 2000 CWI 0.0054100 0.0081700 0.0066843 R_STD_CWI_2001 Standard error of 2001 CWI 0.0055900 0.0083800 0.0068893 R_STD_CWI_2002 Standard error of 2002 CWI 0.0058700 0.0088300 0.0072350 R_STD_CWI_2003 Standard error of 2003 CWI 0.0060600 0.0090500 0.0074500 R_STD_CWI_2004 Standard error of 2004 CWI 0.0061100 0.0092500 0.0075943 R_STD_CWI_2005 Standard error of 2005 CWI 0.0062700 0.0095600 0.0078243 R_CWI_1997 1997 Comparable Wage Index 0.8131000 1.0013000 0.9055714 R_CWI_1998 1998 Comparable Wage Index 0.8489000 1.0381000 0.9424429 R_CWI_1999 1999 Comparable Wage Index 0.8905000 1.0879000 0.9884357 R_CWI_2000 2000 Comparable Wage Index 0.9428000 1.1453000 1.0440286 R_CWI_2001 2001 Comparable Wage Index 0.9778000 1.1804000 1.0834429 R_CWI_2002 2002 Comparable Wage Index 1.0299000 1.2465000 1.1413571 R_CWI_2003 2003 Comparable Wage Index 1.0589000 1.2775000 1.1714571 R_CWI_2004 2004 Comparable Wage Index 1.0947000 1.3185000 1.2130714 R_CWI_2005 2005 Comparable Wage Index 1.1234000 1.3620000 1.2496643 __________________________________________________________________________________________ SOURCE: U.S. Department of Education, National Center for Education Statistics, 2005 Regional Comparable Wage Index Data File (v.1a).
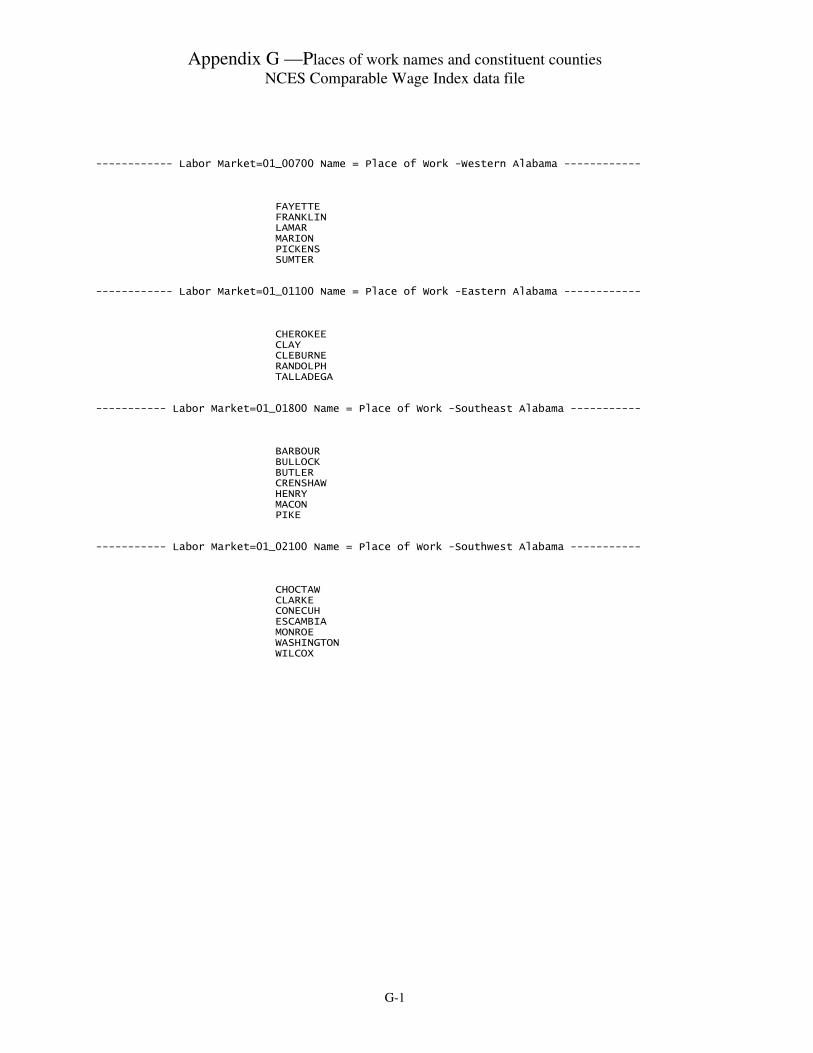
Appendix G —Places of work names and constituent counties NCES Comparable Wage Index data file
G-1
------------ Labor Market=01_00700 Name = Place of Work -Western Alabama ------------ FAYETTE FRANKLIN LAMAR MARION PICKENS SUMTER ------------ Labor Market=01_01100 Name = Place of Work -Eastern Alabama ------------ CHEROKEE CLAY CLEBURNE RANDOLPH TALLADEGA ----------- Labor Market=01_01800 Name = Place of Work -Southeast Alabama ----------- BARBOUR BULLOCK BUTLER CRENSHAW HENRY MACON PIKE ----------- Labor Market=01_02100 Name = Place of Work -Southwest Alabama ----------- CHOCTAW CLARKE CONECUH ESCAMBIA MONROE WASHINGTON WILCOX
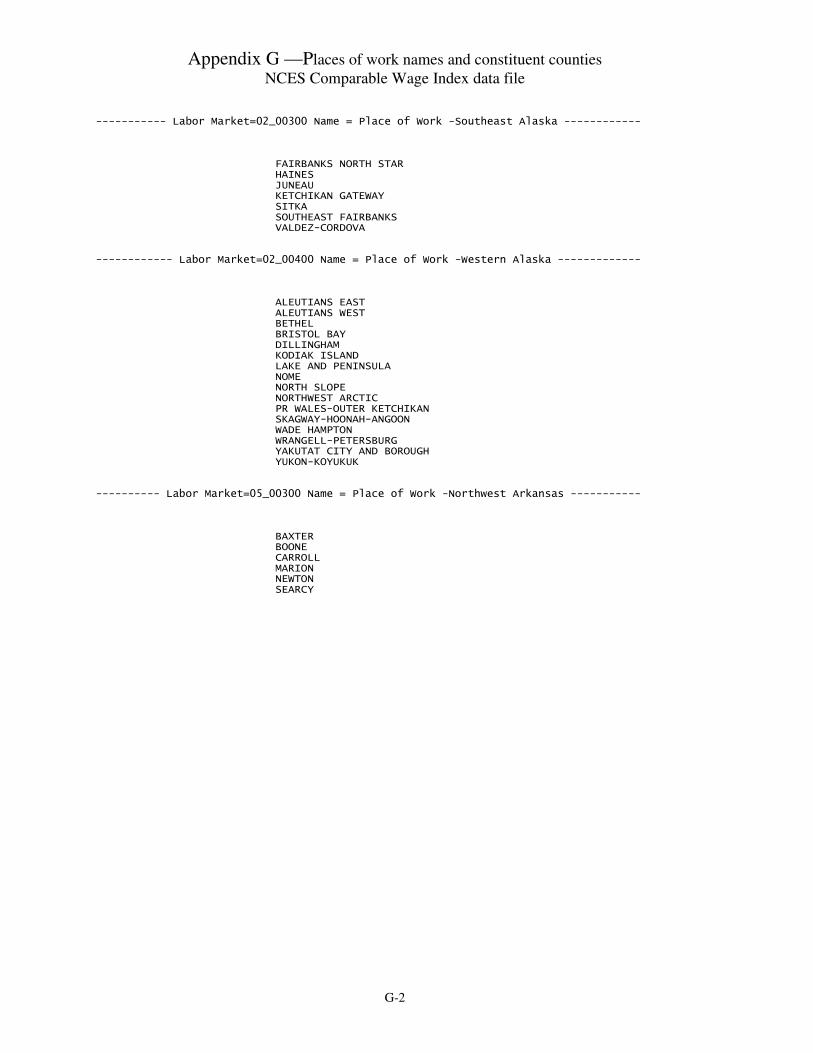
Appendix G —Places of work names and constituent counties NCES Comparable Wage Index data file
G-2
----------- Labor Market=02_00300 Name = Place of Work -Southeast Alaska ------------ FAIRBANKS NORTH STAR HAINES JUNEAU KETCHIKAN GATEWAY SITKA SOUTHEAST FAIRBANKS VALDEZ-CORDOVA ------------ Labor Market=02_00400 Name = Place of Work -Western Alaska ------------- ALEUTIANS EAST ALEUTIANS WEST BETHEL BRISTOL BAY DILLINGHAM KODIAK ISLAND LAKE AND PENINSULA NOME NORTH SLOPE NORTHWEST ARCTIC PR WALES-OUTER KETCHIKAN SKAGWAY-HOONAH-ANGOON WADE HAMPTON WRANGELL-PETERSBURG YAKUTAT CITY AND BOROUGH YUKON-KOYUKUK ---------- Labor Market=05_00300 Name = Place of Work -Northwest Arkansas ----------- BAXTER BOONE CARROLL MARION NEWTON SEARCY

Appendix G —Places of work names and constituent counties NCES Comparable Wage Index data file
G-3
-------- Labor Market=05_00400 Name = Place of Work -North central Arkansas --------- CLEBURNE FULTON INDEPENDENCE IZARD SHARP STONE VAN BUREN ---------- Labor Market=05_00500 Name = Place of Work -Northeast Arkansas ----------- CLAY CRAIGHEAD GREENE LAWRENCE RANDOLPH ----------- Labor Market=05_00700 Name = Place of Work -Eastern Arkansas ------------ CROSS LEE PHILLIPS POINSETT ST. FRANCIS ----------- Labor Market=05_00800 Name = Place of Work -Central Arkansas ------------ JACKSON MONROE PRAIRIE WHITE WOODRUFF --------- Labor Market=05_01500 Name = Place of Work -Southwest Arkansas I ---------- CLARK GARLAND HOT SPRING MONTGOMERY ---------- Labor Market=05_01700 Name = Place of Work -Southeast Arkansas ----------- ASHLEY BRADLEY CHICOT CLEVELAND DESHA DREW LINCOLN -------- Labor Market=05_01800 Name = Place of Work -South central Arkansas --------- CALHOUN COLUMBIA DALLAS OUACHITA UNION

Appendix G —Places of work names and constituent counties NCES Comparable Wage Index data file
G-4
--------- Labor Market=05_01900 Name = Place of Work -Southwest Arkansas II --------- HEMPSTEAD LAFAYETTE LITTLE RIVER MILLER NEVADA PIKE -------- Labor Market=06_01800 Name = Place of Work -East central California -------- ALPINE AMADOR CALAVERAS INYO MARIPOSA MONO TUOLUMNE ---------- Labor Market=08_00100 Name = Place of Work -Northwest Colorado ----------- GARFIELD JACKSON MESA MOFFAT RIO BLANCO ROUTT

Appendix G —Places of work names and constituent counties NCES Comparable Wage Index data file
G-5
----------- Labor Market=08_00400 Name = Place of Work -Eastern Colorado ------------ BENT CHEYENNE CROWLEY ELBERT KIOWA KIT CARSON LINCOLN LOGAN MORGAN PHILLIPS PROWERS SEDGWICK WASHINGTON YUMA -------- Labor Market=08_00500 Name = Place of Work -South central Colorado --------- ALAMOSA BACA CONEJOS COSTILLA HUERFANO LAS ANIMAS OTERO PUEBLO RIO GRANDE SAGUACHE ---------- Labor Market=08_00600 Name = Place of Work -Southwest Colorado ----------- ARCHULETA DELTA DOLORES LA PLATA MONTEZUMA MONTROSE SAN JUAN SAN MIGUEL

Appendix G —Places of work names and constituent counties NCES Comparable Wage Index data file
G-6
--------- Labor Market=08_00700 Name = Place of Work -West central Colorado --------- EAGLE GRAND GUNNISON HINSDALE LAKE MINERAL OURAY PITKIN SUMMIT ------ Labor Market=12_00600 Name = Place of Work -Central panhandle, Florida ------- CALHOUN FRANKLIN GULF LIBERTY MADISON TAYLOR ----------- Labor Market=12_00800 Name = Place of Work -Northern Florida ------------ DIXIE HAMILTON LAFAYETTE LEVY SUWANNEE

Appendix G —Places of work names and constituent counties NCES Comparable Wage Index data file
G-7
----------- Labor Market=12_03100 Name = Place of Work -Southwest Florida ----------- DE SOTO GLADES HARDEE HENDRY HIGHLANDS ----------- Labor Market=13_00300 Name = Place of Work -Northern Georgia ------------ FANNIN GILMER HABERSHAM LUMPKIN RABUN TOWNS UNION WHITE ----------- Labor Market=13_00400 Name = Place of Work -Northeast Georgia ----------- BANKS FRANKLIN HART JACKSON STEPHENS --------- Labor Market=13_02200 Name = Place of Work -North central Georgia --------- ELBERT GREENE HANCOCK LINCOLN MORGAN TALIAFERRO WARREN WILKES

Appendix G —Places of work names and constituent counties NCES Comparable Wage Index data file
G-8
--------- Labor Market=13_02500 Name = Place of Work -East central Georgia ---------- EMANUEL GLASCOCK JEFFERSON JENKINS SCREVEN WASHINGTON ------------ Labor Market=13_02600 Name = Place of Work -Central Georgia ------------ BALDWIN JOHNSON LAURENS PUTNAM WILKINSON --------- Labor Market=13_03100 Name = Place of Work -West central Georgia ---------- CRISP DOOLY MACON SCHLEY SUMTER TAYLOR WEBSTER -------- Labor Market=13_03200 Name = Place of Work -South central Georgia I -------- BLECKLEY DODGE MONTGOMERY PULASKI TELFAIR TOOMBS TREUTLEN WHEELER WILCOX

Appendix G —Places of work names and constituent counties NCES Comparable Wage Index data file
G-9
------------ Labor Market=13_03300 Name = Place of Work -Eastern Georgia ------------ APPLING BULLOCH CANDLER EVANS JEFF DAVIS TATTNALL WAYNE ---------- Labor Market=13_03600 Name = Place of Work -Southeast Georgia I ---------- BRANTLEY GLYNN LIBERTY LONG MCINTOSH --------- Labor Market=13_03800 Name = Place of Work -Southeast Georgia II ---------- ATKINSON BACON CHARLTON CLINCH COFFEE PIERCE WARE ------- Labor Market=13_03900 Name = Place of Work -South central Georgia II -------- BEN HILL BERRIEN COOK IRWIN TIFT TURNER

Appendix G —Places of work names and constituent counties NCES Comparable Wage Index data file
G-10
------------ Labor Market=13_04100 Name = Place of Work -Western Georgia ------------ CALHOUN CLAY COLQUITT EARLY MITCHELL QUITMAN RANDOLPH STEWART ----------- Labor Market=13_04200 Name = Place of Work -Southwest Georgia ----------- DECATUR GRADY MILLER SEMINOLE THOMAS ------------ Labor Market=16_00100 Name = Place of Work -Idaho panhandle ------------ BENEWAH BONNER BOUNDARY KOOTENAI SHOSHONE ---------- Labor Market=16_00200 Name = Place of Work -North central Idaho ---------- CLEARWATER IDAHO LATAH LEWIS NEZ PERCE

Appendix G —Places of work names and constituent counties NCES Comparable Wage Index data file
G-11
------------- Labor Market=16_00300 Name = Place of Work -Eastern Idaho ------------- BONNEVILLE BUTTE CLARK CUSTER FREMONT JEFFERSON LEMHI MADISON TETON ---------- Labor Market=16_00400 Name = Place of Work -West central Idaho ----------- ADAMS ELMORE PAYETTE VALLEY WASHINGTON ---------- Labor Market=16_00800 Name = Place of Work -South central Idaho ---------- BLAINE CAMAS CASSIA GOODING JEROME LINCOLN MINIDOKA TWIN FALLS ------------ Labor Market=16_00900 Name = Place of Work -Southeast Idaho ------------ BANNOCK BEAR LAKE BINGHAM CARIBOU FRANKLIN ONEIDA POWER

Appendix G —Places of work names and constituent counties NCES Comparable Wage Index data file
G-12
--------- Labor Market=17_00200 Name = Place of Work -West central Illinois --------- FULTON HANCOCK HENDERSON MCDONOUGH WARREN ----------- Labor Market=17_00700 Name = Place of Work -Eastern Illinois ------------ CLARK CLAY CRAWFORD JASPER LAWRENCE RICHLAND WAYNE ----------- Labor Market=17_00800 Name = Place of Work -Southern Illinois ----------- ALEXANDER EDWARDS GALLATIN HAMILTON HARDIN JOHNSON MASSAC POPE PULASKI SALINE UNION WABASH WHITE -------- Labor Market=17_01000 Name = Place of Work -South central Illinois --------- JEFFERSON MARION RANDOLPH WASHINGTON

Appendix G —Places of work names and constituent counties NCES Comparable Wage Index data file
G-13
--------- Labor Market=18_01400 Name = Place of Work -West central Indiana ---------- BENTON CARROLL FOUNTAIN MONTGOMERY WARREN WHITE ----------- Labor Market=18_03100 Name = Place of Work -Southeast Indiana ----------- DECATUR FAYETTE JENNINGS RUSH UNION ------------ Labor Market=19_00100 Name = Place of Work -Northwest Iowa ------------- BUENA VISTA CLAY DICKINSON EMMET LYON O'BRIEN OSCEOLA PALO ALTO SIOUX --------- Labor Market=19_00200 Name = Place of Work -North central Iowa I ---------- CERRO GORDO FLOYD FRANKLIN HANCOCK KOSSUTH MITCHELL WINNEBAGO WORTH

Appendix G —Places of work names and constituent counties NCES Comparable Wage Index data file
G-14
------------ Labor Market=19_00300 Name = Place of Work -Northeast Iowa ------------- ALLAMAKEE BUCHANAN BUTLER CHICKASAW CLAYTON FAYETTE HOWARD WINNESHIEK ------------- Labor Market=19_00500 Name = Place of Work -Eastern Iowa -------------- CEDAR CLINTON DELAWARE DUBUQUE JACKSON ----------- Labor Market=19_00600 Name = Place of Work -East central Iowa ----------- HARDIN IOWA MARSHALL POWESHIEK TAMA --------- Labor Market=19_00900 Name = Place of Work -North central Iowa II --------- CALHOUN HAMILTON HUMBOLDT POCAHONTAS WEBSTER WRIGHT

Appendix G —Places of work names and constituent counties NCES Comparable Wage Index data file
G-15
----------- Labor Market=19_01000 Name = Place of Work -West central Iowa ----------- AUDUBON CARROLL CHEROKEE CRAWFORD GREENE IDA MONONA PLYMOUTH SAC ------------ Labor Market=19_01200 Name = Place of Work -Southwest Iowa ------------- CASS FREMONT MONTGOMERY PAGE SHELBY ---------- Labor Market=19_01300 Name = Place of Work -South central Iowa ----------- ADAIR ADAMS APPANOOSE CLARKE DAVIS DECATUR JEFFERSON KEOKUK LUCAS MAHASKA MONROE RINGGOLD TAYLOR UNION VAN BUREN WAPELLO WAYNE

Appendix G —Places of work names and constituent counties NCES Comparable Wage Index data file
G-16
------------ Labor Market=19_01800 Name = Place of Work -Southeast Iowa ------------- DES MOINES HENRY LEE LOUISA MUSCATINE ----------- Labor Market=20_00100 Name = Place of Work -Northwest Kansas ------------ CHEYENNE DECATUR ELLIS GOVE GRAHAM LOGAN NORTON OSBORNE PHILLIPS RAWLINS ROOKS RUSSELL SHERIDAN SHERMAN SMITH THOMAS TREGO WALLACE ------ Labor Market=20_00200 Name = Place of Work -North central Kansas (west) ------ CLOUD ELLSWORTH JEWELL LINCOLN MITCHELL OTTAWA REPUBLIC SALINE WASHINGTON
Appendix G —Places of work names and constituent counties NCES Comparable Wage Index data file
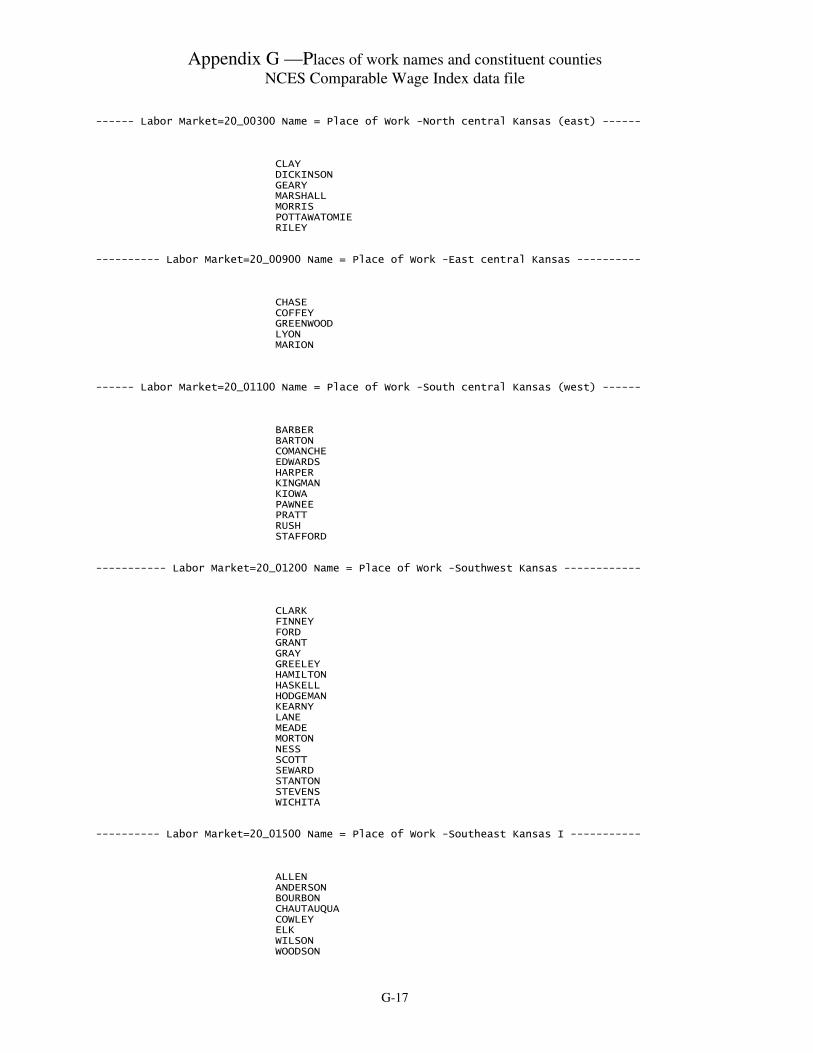
G-17
------ Labor Market=20_00300 Name = Place of Work -North central Kansas (east) ------ CLAY DICKINSON GEARY MARSHALL MORRIS POTTAWATOMIE RILEY ---------- Labor Market=20_00900 Name = Place of Work -East central Kansas ---------- CHASE COFFEY GREENWOOD LYON MARION ------ Labor Market=20_01100 Name = Place of Work -South central Kansas (west) ------ BARBER BARTON COMANCHE EDWARDS HARPER KINGMAN KIOWA PAWNEE PRATT RUSH STAFFORD ----------- Labor Market=20_01200 Name = Place of Work -Southwest Kansas ------------ CLARK FINNEY FORD GRANT GRAY GREELEY HAMILTON HASKELL HODGEMAN KEARNY LANE MEADE MORTON NESS SCOTT SEWARD STANTON STEVENS WICHITA ---------- Labor Market=20_01500 Name = Place of Work -Southeast Kansas I ----------- ALLEN ANDERSON BOURBON CHAUTAUQUA COWLEY ELK WILSON WOODSON

Appendix G —Places of work names and constituent counties NCES Comparable Wage Index data file
G-18
---------- Labor Market=20_01600 Name = Place of Work -Southeast Kansas II ---------- CHEROKEE CRAWFORD LABETTE MONTGOMERY NEOSHO -------- Labor Market=21_00100 Name = Place of Work -Western tip of Kentucky -------- BALLARD CALLOWAY CARLISLE FULTON GRAVES HICKMAN MARSHALL MCCRACKEN ----------- Labor Market=21_00200 Name = Place of Work -Western Kentucky ------------ CALDWELL CRITTENDEN HOPKINS LIVINGSTON MUHLENBERG ----- Labor Market=21_00500 Name = Place of Work -South central Kentucky (west) ----- ALLEN BARREN EDMONSON HART METCALFE MONROE ----- Labor Market=21_00600 Name = Place of Work -South central Kentucky (east) ----- ADAIR CASEY CLINTON CUMBERLAND GREEN MCCREARY PULASKI RUSSELL TAYLOR WAYNE ---------- Labor Market=21_00900 Name = Place of Work -Southeast Kentucky ----------- BREATHITT KNOTT LEE LESLIE LETCHER OWSLEY PERRY WOLFE

Appendix G —Places of work names and constituent counties NCES Comparable Wage Index data file
G-19
--------- Labor Market=21_01000 Name = Place of Work -East central Kentucky --------- FLOYD JOHNSON MAGOFFIN MARTIN PIKE

Appendix G —Places of work names and constituent counties NCES Comparable Wage Index data file
G-20
-------- Labor Market=21_01100 Name = Place of Work -Central Kentucky (east) -------- ESTILL GARRARD LINCOLN MADISON POWELL -------- Labor Market=21_01300 Name = Place of Work -Central Kentucky (west) -------- BRECKINRIDGE GRAYSON LARUE MARION WASHINGTON ---------- Labor Market=21_02100 Name = Place of Work -Northeast Kentucky ----------- BATH FLEMING LEWIS MASON MENIFEE MONTGOMERY MORGAN ROBERTSON ROWAN
Appendix G —Places of work names and constituent counties NCES Comparable Wage Index data file
G-21
---------- Labor Market=22_00300 Name = Place of Work -Northwest Louisana ----------- BIENVILLE CLAIBORNE LINCOLN NATCHITOCHES RED RIVER SABINE ---------- Labor Market=22_00500 Name = Place of Work -Northeast Louisiana ---------- CALDWELL EAST CARROLL FRANKLIN JACKSON MADISON MOREHOUSE RICHLAND TENSAS WEST CARROLL -------- Labor Market=22_00600 Name = Place of Work -East central Louisiana --------- AVOYELLES CATAHOULA CONCORDIA LA SALLE WINN ---------- Labor Market=22_00800 Name = Place of Work -Southwest Louisiana ---------- ALLEN BEAUREGARD JEFFERSON DAVIS VERNON

Appendix G —Places of work names and constituent counties NCES Comparable Wage Index data file
G-22
--------- Labor Market=25_00200 Name = Place of Work -Western Massachusetts --------- BERKSHIRE FRANKLIN HAMPSHIRE WORCESTER ------ Labor Market=26_00100 Name = Place of Work -Western upper peninsula, MI ------ DICKINSON GOGEBIC HOUGHTON IRON KEWEENAW ONTONAGON ------ Labor Market=26_00300 Name = Place of Work -Eastern upper peninsula, MI ------ CHIPPEWA DELTA LUCE MACKINAC SCHOOLCRAFT ---- Labor Market=26_00400 Name = Place of Work -Northwest lower peninsula, MI I ---- ANTRIM CHARLEVOIX EMMET KALKASKA MISSAUKEE WEXFORD ----- Labor Market=26_00500 Name = Place of Work -Northeast lower peninsula, MI ----- ALCONA ALPENA CHEBOYGAN CRAWFORD ----- Labor Market=26_00500 Name = Place of Work -Northeast lower peninsula, MI ----- (continued) MONTMORENCY OSCODA OTSEGO PRESQUE ISLE --- Labor Market=26_00600 Name = Place of Work -East central lower peninsula, MI ---- ARENAC GLADWIN IOSCO OGEMAW ROSCOMMON

Appendix G —Places of work names and constituent counties NCES Comparable Wage Index data file
G-23
--- Labor Market=26_01600 Name = Place of Work -Northwest lower peninsula, MI II ---- BENZIE GRAND TRAVERSE LEELANAU MANISTEE -------- Labor Market=27_00200 Name = Place of Work -Northwest Minnesota ------------ BECKER BELTRAMI CLEARWATER HUBBARD LAKE OF THE WOODS MAHNOMEN -------- Labor Market=27_00500 Name = Place of Work -East central Minnesota --------- AITKIN CROW WING KANABEC MILLE LACS PINE -------- Labor Market=27_00700 Name = Place of Work -West central Minnesota --------- BIG STONE GRANT OTTER TAIL POPE STEVENS SWIFT TRAVERSE WILKIN -------- Labor Market=27_01800 Name = Place of Work -South central Minnesota -------- KANDIYOHI MCLEOD MEEKER RENVILLE SIBLEY --------- Labor Market=27_01900 Name = Place of Work -Southwest Minnesota I --------- BROWN CHIPPEWA LAC QUI PARLE LINCOLN LYON REDWOOD YELLOW MEDICINE
Appendix G —Places of work names and constituent counties NCES Comparable Wage Index data file
G-24
-------- Labor Market=27_02500 Name = Place of Work -Southwest Minnesota II --------- COTTONWOOD FARIBAULT JACKSON MARTIN MURRAY NOBLES PIPESTONE ROCK WATONWAN --------- Labor Market=28_00300 Name = Place of Work -Northeast Mississippi --------- ALCORN ITAWAMBA PRENTISS TISHOMINGO -------- Labor Market=28_00700 Name = Place of Work -North central MS (west) -------- CARROLL HUMPHREYS LEFLORE SUNFLOWER TALLAHATCHIE ----------- Labor Market=28_00800 Name = Place of Work -North central MS ------------ ATTALA CALHOUN CHOCTAW GRENADA MONTGOMERY WEBSTER YALOBUSHA

Appendix G —Places of work names and constituent counties NCES Comparable Wage Index data file
G-25
-------- Labor Market=28_01700 Name = Place of Work -Southwest Mississippi I -------- CLAIBORNE COVINGTON JEFFERSON JEFFERSON DAVIS LAWRENCE LINCOLN ------- Labor Market=28_02000 Name = Place of Work -Southwest Mississippi II -------- ADAMS AMITE FRANKLIN MARION PIKE WALTHALL WILKINSON ---------- Labor Market=29_00100 Name = Place of Work -Northwest Missouri ----------- ATCHISON DAVIESS GENTRY GRUNDY HARRISON HOLT LIVINGSTON MERCER NODAWAY WORTH ---------- Labor Market=29_00300 Name = Place of Work -Northeast Missouri ----------- ADAIR CLARK KNOX LEWIS LINN MACON PUTNAM SCHUYLER SCOTLAND SHELBY SULLIVAN -------- Labor Market=29_00400 Name = Place of Work -East central Missouri I -------- MARION MONROE MONTGOMERY PIKE RALLS RANDOLPH ---------- Labor Market=29_00500 Name = Place of Work -Central Missouri I ----------- AUDRAIN CALLAWAY COLE COOPER MONITEAU

Appendix G —Places of work names and constituent counties NCES Comparable Wage Index data file
G-26
----- Labor Market=29_00700 Name = Place of Work -West central Missouri (north) ----- CARROLL CHARITON JOHNSON PETTIS SALINE ----- Labor Market=29_01200 Name = Place of Work -West central Missouri (south) ----- BARTON BENTON CEDAR HENRY HICKORY ST. CLAIR VERNON ---------- Labor Market=29_01300 Name = Place of Work -Central Missouri II ---------- CAMDEN LACLEDE MILLER MORGAN PULASKI -------- Labor Market=29_01400 Name = Place of Work -Central Missouri (east) -------- DENT GASCONADE MARIES OSAGE PHELPS ------- Labor Market=29_02000 Name = Place of Work -East central Missouri II -------- BOLLINGER CAPE GIRARDEAU IRON MADISON PERRY ST. FRANCOIS STE. GENEVIEVE --------- Labor Market=29_02100 Name = Place of Work -Southeast Missouri I ---------- DUNKLIN MISSISSIPPI NEW MADRID PEMISCOT SCOTT --------- Labor Market=29_02200 Name = Place of Work -Southeast Missouri II --------- BUTLER CARTER REYNOLDS RIPLEY STODDARD WAYNE

Appendix G —Places of work names and constituent counties NCES Comparable Wage Index data file
G-27
-------- Labor Market=29_02300 Name = Place of Work -South Central Missouri --------- DOUGLAS HOWELL OREGON OZARK SHANNON TEXAS WRIGHT --------- Labor Market=30_00200 Name = Place of Work -North central Montana --------- BLAINE CASCADE CHOUTEAU GLACIER HILL JUDITH BASIN LIBERTY PONDERA TETON TOOLE ------------ Labor Market=30_00300 Name = Place of Work -Eastern Montana ------------ BIG HORN CARTER CUSTER DANIELS DAWSON FALLON FERGUS GARFIELD GOLDEN VALLEY MCCONE MUSSELSHELL PETROLEUM PHILLIPS POWDER RIVER PRAIRIE RICHLAND ROOSEVELT ROSEBUD SHERIDAN STILLWATER SWEET GRASS TREASURE VALLEY WHEATLAND WIBAUX ----------- Labor Market=30_00500 Name = Place of Work -Southwest Montana ----------- BEAVERHEAD GALLATIN MADISON MEAGHER PARK

Appendix G —Places of work names and constituent counties NCES Comparable Wage Index data file
G-28
--------- Labor Market=30_00600 Name = Place of Work -West central Montana ---------- BROADWATER DEER LODGE GRANITE JEFFERSON LEWIS AND CLARK POWELL SILVER BOW ---- Labor Market=31_00100 Name = Place of Work -Northern Nebraska and panhandle ---- BANNER BOX BUTTE BOYD BROWN CHERRY CHEYENNE DAWES DEUEL GARDEN HOLT KEYA PAHA KIMBALL MORRILL ROCK SCOTTS BLUFF SHERIDAN SIOUX ---------- Labor Market=31_00200 Name = Place of Work -Northeast Nebraska ----------- ANTELOPE BOONE BURT CEDAR COLFAX CUMING KNOX MADISON NANCE PIERCE PLATTE STANTON THURSTON WAYNE ----------- Labor Market=31_00300 Name = Place of Work -Central Nebraska ------------ BLAINE CUSTER GARFIELD GREELEY HALL HAMILTON HOWARD LOUP MERRICK SHERMAN VALLEY WHEELER

Appendix G —Places of work names and constituent counties NCES Comparable Wage Index data file
G-29
---------- Labor Market=31_00400 Name = Place of Work -Southwest Nebraska ----------- ARTHUR CHASE DAWSON DUNDY FRONTIER FURNAS GOSPER GRANT HAYES HITCHCOCK HOOKER KEITH LINCOLN LOGAN MCPHERSON PERKINS RED WILLOW THOMAS -------- Labor Market=31_00500 Name = Place of Work -South Central Nebraska --------- ADAMS BUFFALO CLAY FRANKLIN HARLAN KEARNEY NUCKOLLS PHELPS WEBSTER ---------- Labor Market=31_00600 Name = Place of Work -Southeast Nebraska ----------- BUTLER FILLMORE GAGE JEFFERSON JOHNSON NEMAHA OTOE PAWNEE POLK RICHARDSON SALINE THAYER YORK ------------ Labor Market=32_00300 Name = Place of Work -Most of Nevada ------------- CHURCHILL ELKO ESMERALDA EUREKA HUMBOLDT LANDER LINCOLN MINERAL NYE PERSHING WHITE PINE

Appendix G —Places of work names and constituent counties NCES Comparable Wage Index data file
G-30
------- Labor Market=35_00200 Name = Place of Work -North central New Mexico -------- GUADALUPE MORA RIO ARRIBA SAN MIGUEL TAOS
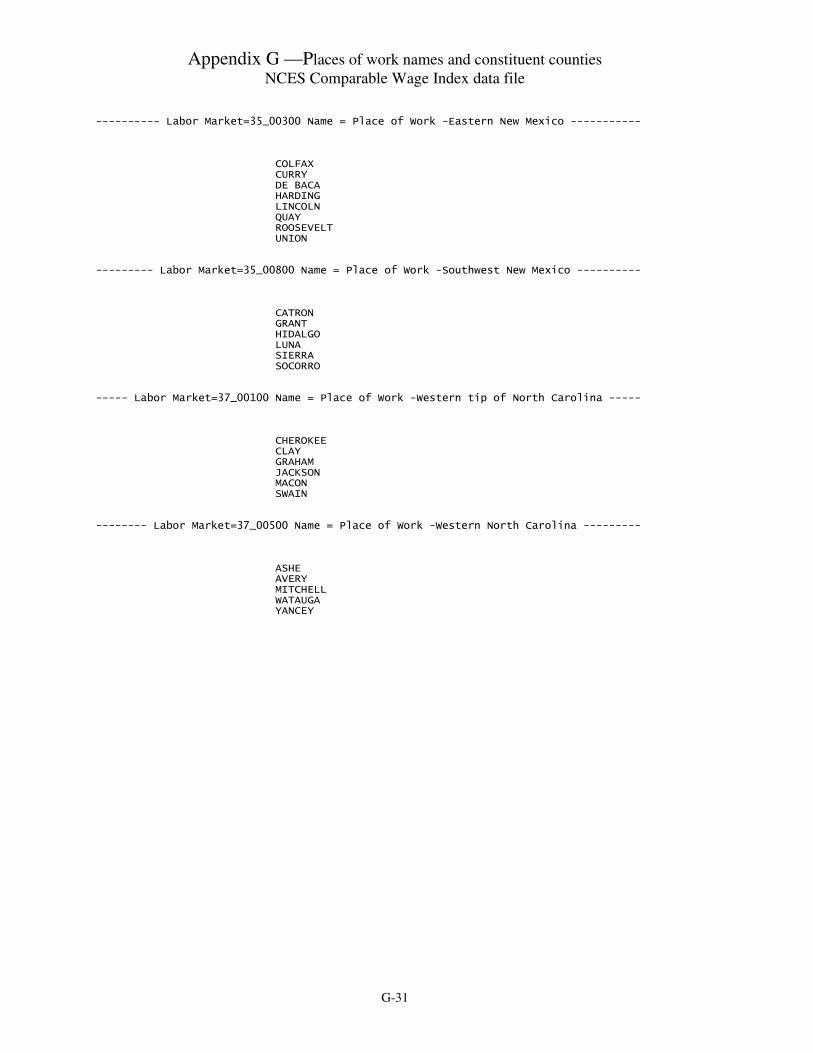
Appendix G —Places of work names and constituent counties NCES Comparable Wage Index data file
G-31
---------- Labor Market=35_00300 Name = Place of Work -Eastern New Mexico ----------- COLFAX CURRY DE BACA HARDING LINCOLN QUAY ROOSEVELT UNION --------- Labor Market=35_00800 Name = Place of Work -Southwest New Mexico ---------- CATRON GRANT HIDALGO LUNA SIERRA SOCORRO ----- Labor Market=37_00100 Name = Place of Work -Western tip of North Carolina ----- CHEROKEE CLAY GRAHAM JACKSON MACON SWAIN -------- Labor Market=37_00500 Name = Place of Work -Western North Carolina --------- ASHE AVERY MITCHELL WATAUGA YANCEY

Appendix G —Places of work names and constituent counties NCES Comparable Wage Index data file
G-32
---- Labor Market=37_04800 Name = Place of Work -Albemarle Sound, North Carolina ---- CAMDEN CHOWAN DARE GATES HYDE PASQUOTANK PERQUIMANS TYRRELL WASHINGTON --------- Labor Market=38_00100 Name = Place of Work -Western North Dakota ---------- ADAMS BILLINGS BOWMAN DIVIDE DUNN GOLDEN VALLEY GRANT HETTINGER MCKENZIE MERCER MORTON OLIVER SIOUX SLOPE STARK WILLIAMS ------ Labor Market=38_00200 Name = Place of Work -Central North Dakota (west) ------ BOTTINEAU BURKE BURLEIGH EMMONS KIDDER LOGAN MCHENRY MCINTOSH MCLEAN MOUNTRAIL PIERCE RENVILLE ROLETTE SHERIDAN WARD
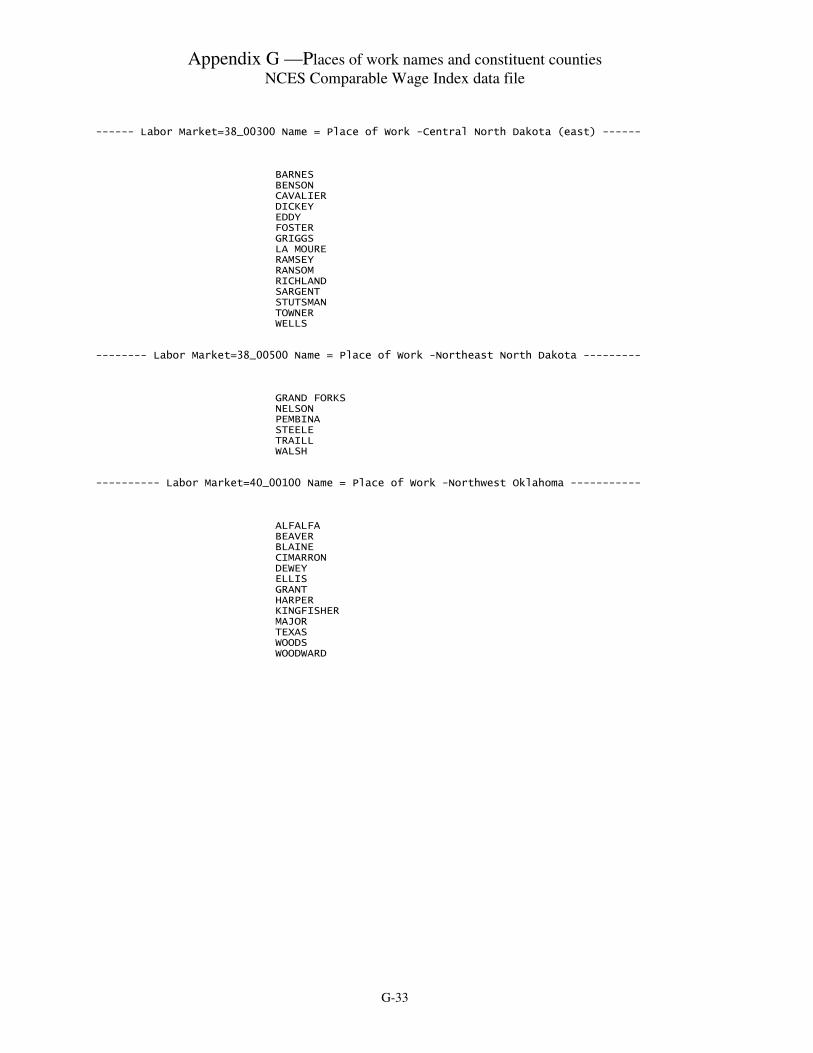
Appendix G —Places of work names and constituent counties NCES Comparable Wage Index data file
G-33
------ Labor Market=38_00300 Name = Place of Work -Central North Dakota (east) ------ BARNES BENSON CAVALIER DICKEY EDDY FOSTER GRIGGS LA MOURE RAMSEY RANSOM RICHLAND SARGENT STUTSMAN TOWNER WELLS -------- Labor Market=38_00500 Name = Place of Work -Northeast North Dakota --------- GRAND FORKS NELSON PEMBINA STEELE TRAILL WALSH ---------- Labor Market=40_00100 Name = Place of Work -Northwest Oklahoma ----------- ALFALFA BEAVER BLAINE CIMARRON DEWEY ELLIS GRANT HARPER KINGFISHER MAJOR TEXAS WOODS WOODWARD

Appendix G —Places of work names and constituent counties NCES Comparable Wage Index data file
G-34
---------- Labor Market=40_00300 Name = Place of Work -Southwest Oklahoma ----------- BECKHAM CUSTER GREER HARMON JACKSON KIOWA ROGER MILLS WASHITA ----- Labor Market=40_00500 Name = Place of Work -South central Oklahoma ----------- ATOKA BRYAN CARTER COAL GARVIN JOHNSTON LOVE MARSHALL MURRAY PONTOTOC ---------- Labor Market=40_00700 Name = Place of Work -Southeast Oklahoma ----------- CHOCTAW HASKELL LATIMER MCCURTAIN PITTSBURG PUSHMATAHA

Appendix G —Places of work names and constituent counties NCES Comparable Wage Index data file
G-35
---------- Labor Market=40_00900 Name = Place of Work -Northeast Oklahoma ----------- CRAIG DELAWARE MAYES NOWATA OTTAWA WASHINGTON --------- Labor Market=41_00200 Name = Place of Work -North central Oregon ---------- CROOK GILLIAM GRANT HOOD RIVER JEFFERSON MORROW SHERMAN WASCO WHEELER --------- Labor Market=42_01200 Name = Place of Work -Central Pennsylvania ---------- CLINTON JUNIATA MIFFLIN SNYDER UNION -------- Labor Market=45_01800 Name = Place of Work -Southern South Carolina -------- ALLENDALE BAMBERG BARNWELL HAMPTON ORANGEBURG

Appendix G —Places of work names and constituent counties NCES Comparable Wage Index data file
G-36
--------- Labor Market=46_00200 Name = Place of Work -Western South Dakota ---------- BENNETT BUTTE CORSON CUSTER DEWEY FALL RIVER HAAKON HARDING JACKSON JONES MEADE MELLETTE PERKINS POTTER SHANNON TODD ZIEBACH -------- Labor Market=46_00300 Name = Place of Work -North East South Dakota -------- BEADLE BROWN CAMPBELL DAY EDMUNDS FAULK HAND JERAULD MARSHALL MCPHERSON ROBERTS SPINK WALWORTH ------- Labor Market=46_00400 Name = Place of Work -East central South Dakota ------- BROOKINGS CLARK CODINGTON DEUEL GRANT HAMLIN KINGSBURY LAKE MINER MOODY -------- Labor Market=46_00500 Name = Place of Work -Southeast South Dakota --------- AURORA BON HOMME BRULE CHARLES MIX DAVISON DOUGLAS GREGORY HANSON HUGHES HUTCHINSON HYDE LYMAN SANBORN STANLEY SULLY TRIPP

Appendix G —Places of work names and constituent counties NCES Comparable Wage Index data file
G-37
---------- Labor Market=47_00100 Name = Place of Work -Northwest Tennessee ---------- CROCKETT DYER GIBSON LAKE OBION WEAKLEY ---- Labor Market=47_00200 Name = Place of Work -North central Tennessee (west) ----- BENTON CARROLL HENRY HOUSTON HUMPHREYS -------- Labor Market=47_00600 Name = Place of Work -North central Tennessee -------- CLAY DE KALB FENTRESS JACKSON OVERTON PICKETT VAN BUREN WARREN

Appendix G —Places of work names and constituent counties NCES Comparable Wage Index data file
G-38
---- Labor Market=47_00700 Name = Place of Work -North central Tennessee (east) ----- CAMPBELL CLAIBORNE HANCOCK MORGAN SCOTT ---------- Labor Market=47_02800 Name = Place of Work -Southwest Tennessee ---------- DECATUR HARDEMAN HARDIN HAYWOOD HENDERSON MCNAIRY ----------- Labor Market=48_00100 Name = Place of Work -Panhandle, Texas ------------ BRISCOE CASTRO CHILDRESS COLLINGSWORTH DALLAM DEAF SMITH DONLEY GRAY HALL HANSFORD HARTLEY HEMPHILL HUTCHINSON LIPSCOMB MOORE OCHILTREE OLDHAM PARMER ROBERTS SHERMAN SWISHER WHEELER

Appendix G —Places of work names and constituent counties NCES Comparable Wage Index data file
G-39
------------ Labor Market=48_00400 Name = Place of Work -Northwest Texas ------------ BAILEY COCHRAN DICKENS FLOYD GARZA HALE HOCKLEY KING LAMB LYNN MOTLEY TERRY YOAKUM ---------- Labor Market=48_00600 Name = Place of Work -North central Texas ---------- BAYLOR COTTLE FOARD HARDEMAN JACK KNOX MONTAGUE WILBARGER YOUNG ------------ Labor Market=48_01000 Name = Place of Work -Northeast Texas ------------ FRANKLIN HOPKINS LAMAR MORRIS RED RIVER TITUS ------------ Labor Market=48_01200 Name = Place of Work -Eastern Texas I ------------ CAMP MARION RAINS UPSHUR VAN ZANDT WOOD ----------- Labor Market=48_01600 Name = Place of Work -Eastern Texas II ------------ JASPER NEWTON SABINE SAN AUGUSTINE SHELBY TYLER
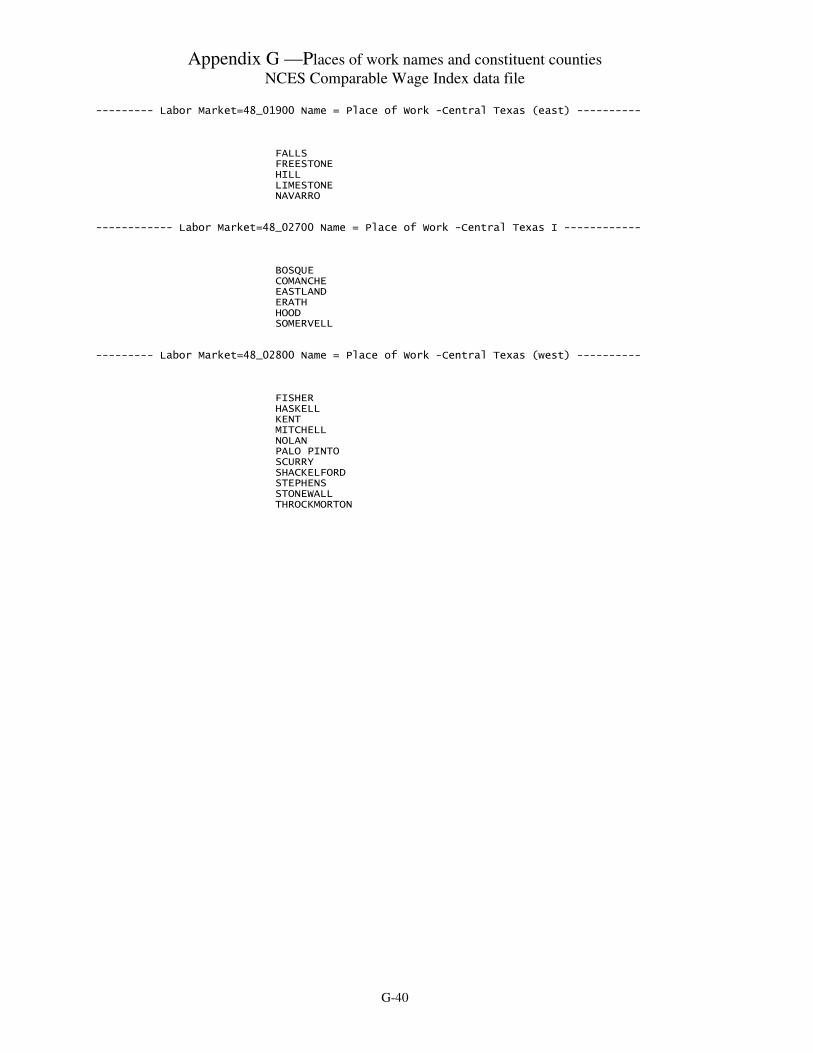
Appendix G —Places of work names and constituent counties NCES Comparable Wage Index data file
G-40
--------- Labor Market=48_01900 Name = Place of Work -Central Texas (east) ---------- FALLS FREESTONE HILL LIMESTONE NAVARRO ------------ Labor Market=48_02700 Name = Place of Work -Central Texas I ------------ BOSQUE COMANCHE EASTLAND ERATH HOOD SOMERVELL --------- Labor Market=48_02800 Name = Place of Work -Central Texas (west) ---------- FISHER HASKELL KENT MITCHELL NOLAN PALO PINTO SCURRY SHACKELFORD STEPHENS STONEWALL THROCKMORTON

Appendix G —Places of work names and constituent counties NCES Comparable Wage Index data file
G-41
---------- Labor Market=48_03100 Name = Place of Work -West central Texas ----------- BORDEN CONCHO CROCKETT DAWSON GLASSCOCK HOWARD IRION KIMBLE MARTIN MASON MCCULLOCH MENARD REAGAN RUNNELS SCHLEICHER STERLING SUTTON UPTON -------------- Labor Market=48_03400 Name = Place of Work -West Texas --------------- ANDREWS BREWSTER CRANE CULBERSON GAINES HUDSPETH JEFF DAVIS PECOS PRESIDIO REEVES TERRELL WARD WINKLER ----------- Labor Market=48_03600 Name = Place of Work -Central Texas II ------------ BLANCO BROWN BURNET COLEMAN HAMILTON LLANO MILLS SAN SABA

Appendix G —Places of work names and constituent counties NCES Comparable Wage Index data file
G-42
------------ Labor Market=48_05900 Name = Place of Work -Southwest Texas ------------ DIMMIT EDWARDS KINNEY LA SALLE MAVERICK REAL UVALDE VAL VERDE ZAVALA ------------ Labor Market=48_06100 Name = Place of Work -Southern Texas ------------- BEE DUVAL JIM WELLS LIVE OAK MCMULLEN REFUGIO --------- Labor Market=48_06500 Name = Place of Work -Southern tip of Texas --------- BROOKS JIM HOGG KENEDY KLEBERG STARR WILLACY ZAPATA ------------- Labor Market=49_00400 Name = Place of Work -Eastern Utah -------------- CARBON DAGGETT DUCHESNE EMERY GRAND SAN JUAN UINTAH WASATCH ------------ Labor Market=49_00700 Name = Place of Work -Southwest Utah ------------- BEAVER GARFIELD IRON KANE MILLARD PIUTE SANPETE SEVIER WASHINGTON WAYNE

Appendix G —Places of work names and constituent counties NCES Comparable Wage Index data file
G-43
----------- Labor Market=50_00200 Name = Place of Work -Northeast Vermont ----------- CALEDONIA ESSEX LAMOILLE ORLEANS WASHINGTON ---------- Labor Market=51_00400 Name = Place of Work -Northwest Virginia ----------- FREDERICK SHENANDOAH WINCHESTER CITY -------- Labor Market=51_00700 Name = Place of Work -North central Virginia --------- HARRISONBURG CITY MADISON ORANGE PAGE RAPPAHANNOCK ROCKINGHAM ---------- Labor Market=51_01100 Name = Place of Work -Western Virginia I ----------- AUGUSTA BATH BUENA VISTA CITY COVINGTON CITY HIGHLAND LEXINGTON CITY ROCKBRIDGE STAUNTON CITY WAYNESBORO CITY ----- Labor Market=51_01900 Name = Place of Work -Chesapeake Bay area, Virginia ----- ACCOMACK ESSEX LANCASTER MIDDLESEX NORTHAMPTON NORTHUMBERLAND RICHMOND WESTMORELAND ---------- Labor Market=51_02400 Name = Place of Work -Western Virginia II ---------- FLOYD GILES MONTGOMERY PULASKI RADFORD CITY

Appendix G —Places of work names and constituent counties NCES Comparable Wage Index data file
G-44
-------- Labor Market=51_02500 Name = Place of Work -Western tip of Virginia -------- DICKENSON LEE NORTON CITY RUSSELL WISE --------- Labor Market=51_02700 Name = Place of Work -Western Virginia III ---------- BLAND BUCHANAN CARROLL GALAX CITY GRAYSON TAZEWELL WYTHE ---- Labor Market=51_03200 Name = Place of Work -Eastern south central Virginia ----- BRUNSWICK FRANKLIN CITY GREENSVILLE LUNENBURG MECKLENBURG SOUTHAMPTON ---- Labor Market=51_03400 Name = Place of Work -Western south central Virginia ----- BUCKINGHAM CHARLOTTE HALIFAX NOTTOWAY PRINCE EDWARD --------- Labor Market=53_00400 Name = Place of Work -Northeast Washington ---------- ADAMS FERRY GRANT LINCOLN PEND OREILLE STEVENS --------- Labor Market=53_00700 Name = Place of Work -Southeast Washington ---------- ASOTIN COLUMBIA GARFIELD WALLA WALLA WHITMAN -------- Labor Market=54_00100 Name = Place of Work -Northern panhandle, WV --------- BROOKE HANCOCK MARSHALL OHIO WETZEL

Appendix G —Places of work names and constituent counties NCES Comparable Wage Index data file
G-45
- Labor Market=54_00400 Name = Place of Work -Western half of eastern panhandle, WV - GRANT HAMPSHIRE HARDY MINERAL PENDLETON ------ Labor Market=54_00500 Name = Place of Work -East central West Virginia ------- BARBOUR BRAXTON GILMER LEWIS RANDOLPH TUCKER UPSHUR -------- Labor Market=54_00600 Name = Place of Work -Northwest West Virginia -------- CALHOUN JACKSON PLEASANTS RITCHIE ROANE TYLER WIRT WOOD ----------- Labor Market=54_00900 Name = Place of Work -South central WV ------------ FAYETTE GREENBRIER NICHOLAS POCAHONTAS WEBSTER

Appendix G —Places of work names and constituent counties NCES Comparable Wage Index data file
G-46
---------- Labor Market=55_00100 Name = Place of Work -Northwest Wisconsin ---------- ASHLAND BAYFIELD BURNETT IRON PRICE RUSK SAWYER TAYLOR WASHBURN ----------- Labor Market=55_00600 Name = Place of Work -Central Wisconsin ----------- ADAMS FOREST JUNEAU LANGLADE LINCOLN ONEIDA PORTAGE VILAS WOOD -------- Labor Market=55_00700 Name = Place of Work -West central Wisconsin --------- BUFFALO CRAWFORD JACKSON MONROE PEPIN TREMPEALEAU VERNON -------- Labor Market=55_01400 Name = Place of Work -East central Wisconsin --------- FOND DU LAC GREEN LAKE MARQUETTE MENOMINEE SHAWANO WAUPACA WAUSHARA ------------ Labor Market=56_00100 Name = Place of Work -Western Wyoming ------------ LINCOLN PARK SUBLETTE SWEETWATER TETON UINTA

Appendix G —Places of work names and constituent counties NCES Comparable Wage Index data file
G-47
----------- Labor Market=56_00300 Name = Place of Work -Northeast Wyoming ----------- BIG HORN CAMPBELL CONVERSE CROOK GOSHEN HOT SPRINGS JOHNSON NIOBRARA PLATTE SHERIDAN WASHAKIE WESTON