Documentation for the NCES · Documentation for the NCES Comparable Wage Index Data File (EFSC...
39
U.S. Department of Education Institute of Education Sciences EFSC 2006-865 Documentation for the NCES Comparable Wage Index Data Files
Transcript of Documentation for the NCES · Documentation for the NCES Comparable Wage Index Data File (EFSC...
U.S. Department of Education Institute of Education Sciences EFSC 2006-865
Documentation for the NCES Comparable Wage Index Data Files


U.S. Department of Education Institute of Education Sciences EFSC 2006-865
Documentation for the NCES Comparable Wage Index Data Files
May 2006 Lori L. Taylor Bush School of Government and Public Service Texas A&M University Mark C. Glander K-Force Government Solutions William J. Fowler, Jr. Project Officer National Center for Education Statistics

U.S. Department of Education Margaret Spellings Secretary
Institute of Education Sciences Grover J. Whitehurst Director
National Center for Education Statistics Mark Schneider Commissioner
The National Center for Education Statistics (NCES) is the primary federal entity for collecting, analyzing, and reporting data related to education in the United States and other nations. It fulfills a congressional mandate to collect, collate, analyze, and report full and complete statistics on the condition of education in the United States; conduct and publish reports and specialized analyses of the meaning and significance of such statistics; assist state and local education agencies in improving their statistical systems; and review and report on education activities in foreign countries.
NCES activities are designed to address high-priority education data needs; provide consistent, reliable, complete, and accurate indicators of education status and trends; and report timely, useful, and high-quality data to the U.S. Department of Education, the Congress, the states, other education policymakers, practitioners, data users, and the general public. Unless specifically noted, all information contained herein is in the public domain.
We strive to make our products available in a variety of formats and in language that is appropriate to a variety of audiences. You, as our customer, are the best judge of our success in communicating information effectively. If you have any comments or suggestions about this or any other NCES product or report, we would like to hear from you. Please direct your comments to
National Center for Education Statistics Institute of Education Sciences U.S. Department of Education 1990 K Street NW Washington, DC 20006-5651
May 2006
The NCES World Wide Web Home Page address is http://nces.ed.gov. The NCES education finance World Wide Web Home Page address is http://nces.ed.gov/edfin. The NCES World Wide Web Electronic Catalog address is http://nces.ed.gov/pubsearch. Suggested Citation Taylor, L. L., and Glander, M. (2006). Documentation for the NCES Comparable Wage Index Data File (EFSC 2006-865). U.S. Department of Education. Washington, DC: National Center for Education Statistics. For ordering information on this report, write to U.S. Department of Education ED Pubs PO Box 1398 Jessup, MD 20794-1398 Call toll free 1-877-4ED-Pubs or order online at http://www.edpubs.org. Content Contact William J. Fowler, Jr. 202-502-7338 [email protected]
iii
Contents I. Introduction to the NCES Comparable Wage Index Data Files ............................................. 1 II. Background ............................................................................................................................ 3 III. User’s Guide ........................................................................................................................... 5 A. CWI Geography ................................................................................................................. 5 B. Using the Index .................................................................................................................. 5 C. Standard Errors .................................................................................................................. 8 D. School District CWI File ................................................................................................... 8 E. Labor Market CWI File ................................................................................................... 11 F. State CWI File .................................................................................................................. 12 G. Regional CWI File ........................................................................................................... 12 H. Related Data Files ............................................................................................................ 13 I. File Formats and File Names ........................................................................................... 14 IV. References ............................................................................................................................ 17
Appendixes Appendix A— Record Layout and Descriptions of Data Elements:
NCES District CWI Data File ............................................................................ A-1 Appendix B— Record Layout and Descriptions of Data Elements:
NCES Labor Market CWI Data File ...................................................................B-1 Appendix C— Record Layout and Descriptions of Data Elements:
NCES State CWI Data File .................................................................................C-1 Appendix D— Record Layout and Descriptions of Data Elements:
NCES Regional CWI Data File ......................................................................... D-1 Appendix E— Glossary ..............................................................................................................E-1 Appendix F— Frequencies and Ranges.......................................................................................F-1

1
U.S. Department of Education INSTITUTE OF EDUCATION SCIENCES
NATIONAL CENTER FOR EDUCATION STATISTICS 1990 K Street NW, Washington, DC 20006
I. Introduction to the NCES Comparable Wage Index Data Files
The Comparable Wage Index (CWI) is a measure of the systematic, regional variations in the salaries of college graduates who are not educators. It can be used by researchers to adjust district-level finance data at different levels in order to make better comparisons across geographic areas.
The CWI was developed by Dr. Lori L. Taylor at the Bush School of Government and Public Service, Texas A&M University and William J. Fowler, Jr. at NCES. Dr. Taylor’s research was supported by a contract with the National Center for Education Statistics. The complete description of the research is provided in the NCES Research and Development “A Comparable Wage Approach to Geographic Cost Adjustment” (NCES 2006-321).
This documentation describes four geographic levels of the CWI, which are presented in four separate files. These files are the school district, labor market, state, and a combined regional and national file.
The school district file provides a CWI for each local education agency (LEA) in the NCES Common Core of Data (CCD) database. For each LEA there is a series of indexes for the years 1997–2004. The file can be merged with school district finance data, and this merged file can be used to produce finance data adjusted for geographic cost differences. This file also includes four agency typology variables.
The additional files allow for similar cost adjustments for larger geographic areas.
NCES has sponsored the development of other geographic adjustment indexes in the past; the latest was for the 1993–94 school year. For more information on these, and on geographic cost adjustments generally, please see this web site—http://nces.ed.gov/edfin/prodsurv/data.asp.
The remainder of this documentation includes background information, a user’s guide and the following appendixes.
Appendix A—Record layout and descriptions of data elements in the district level file
Appendix B—Record layout and descriptions of data elements in the labor market file
Appendix C—Record layout and descriptions of data elements in the state level file
Appendix D—Record layout and descriptions of data elements in the regional file

2
Appendix E—Glossary of terms particular to this data file.
Appendix F—Frequency counts and descriptive statistics by various categorical variables for the district-level data file.
3
II. Background
Geographic cost data for states, metropolitan areas, and school districts are frequently and widely requested by the public and school finance research community. In response, the National Center for Education Statistics (NCES) has had a long tradition of publishing work that reflects the latest research and development of education geographic cost adjustments.1 This report documents the newly developed Comparable Wage Index (CWI).
The basic premise of a comparable wage index is that all types of workers—including teachers—demand higher wages in areas with a higher cost of living (e.g., San Diego) or a lack of amenities (e.g., Detroit, which has a particularly high crime rate) (Federal Bureau of Investigation 2003). Therefore, one should be able to measure most of the uncontrollable variation in educator pay by observing variations in the earnings of comparable workers who are not educators.2 The CWI reflects systematic, regional variations in the salaries of college graduates who are not educators. Provided that these noneducators are similar to educators in terms of age, educational background, and tastes for local amenities, the CWI can be used to measure the uncontrollable component of variations in the wages paid to educators. Intuitively, if accountants in the Atlanta metro area are paid 5 percent more than the national average accounting wage, Atlanta engineers are paid 5 percent more than the national average engineering wage, Atlanta nurses are paid 5 percent more than the national average nursing wage, and so on, then the CWI predicts that Atlanta teachers should also be paid 5 percent more than the national average teacher wage.
The CWI was developed by combining baseline estimates from the 2000 U.S. census with annual data from the Bureau of Labor Statistics (BLS). The Occupational Employment Statistics (OES) survey is a BLS database that contains average annual earnings by occupation for states and metropolitan areas from about 400,000 nonfarm businesses, and is available from 1997 to 2004. Combining the Census with the OES makes it possible to have yearly CWI estimates for states and local labor markets for each year after 1997. OES data are available each May and permit the construction of an up-to-date, annual CWI. For a complete description of the methodology, see “A Comparable Wage Approach to Geographic Cost Adjustment” (NCES 2006-321).
The CWI offers many advantages over the previous NCES geographic cost adjustment methodologies.3 In addition to its obvious timeliness, the clearest advantage of the CWI is that it measures costs that are beyond the control of school district administrators. Unlike analyses based on school district expenditures, there is no risk that a cost-of-living index confuses high-spending school districts with high-cost school districts, and no need to rely on statistical technique and researcher judgment to separate controllable from uncontrollable costs. The CWI is also appropriate regardless of the competitiveness of teacher labor markets. If a lack of competition in the teacher market distorts teacher compensation patterns, then cost indexes based on teacher compensation will be biased, but a CWI will not (Hanushek 1999; Goldhaber 1999). Another advantage of the comparable wage approach is its general applicability. Because the 1 For example, see Brazer and Anderson 1983; Chambers 1997; Fowler and Monk 2001; Goldhaber 1999; Taylor and Keller 2003. 2 See for example, Rothstein and Smith (1997), Guthrie and Rothstein (1999), Goldhaber (1999), Alexander et al. (2000), Taylor et al. (2002), and Stoddard (2005). 3 For a more detailed discussion of the advantages and disadvantages of the CWI, see Taylor and Fowler (2006).

4
resulting cost index is based on systematic differences in the general wage level, it can be used to measure labor costs not only for public elementary and secondary education, but also for private schools, job training programs, and postsecondary institutions.
There are also a number of disadvantages to using the CWI to measure variations in school district costs. First, the CWI is a labor cost index, and labor cost is only part of the total cost of education—albeit a very large part.4 Therefore, while it is clearly appropriate to use the CWI to adjust for cost variations with respect to teacher salaries or current operating expenditures, it could be problematic to apply a labor cost index such as the CWI to school district expenditures that are largely unaffected by labor cost differentials, such as energy costs (Smith et al. 2003) or capital outlays.
Second, the methodology underlying the CWI presumes that workers are mobile. If moving costs or other barriers to moving slow worker migration, then labor costs may temporarily diverge from what is expected given local amenities and the cost of living. Employers in fast-growing industries and school districts in fast-growing areas may need to pay a temporary premium to attract workers. The CWI cannot capture this effect.
Finally, the CWI may not capture all of the uncontrollable variations in labor cost. By design, the CWI measures cost in a broad labor market like a metropolitan area. It does not capture variations in cost across school districts within a labor market. In particular, it does not reflect any variations in cost attributable to working conditions in specific school districts. All school districts in a given labor market are assigned the same CWI.
Despite its limitations, the CWI should be a particularly useful tool for researchers and policymakers. The CWI offers a timely method for geographic cost adjustment that is undeniably outside of school district control. Furthermore, it demonstrates that the gains from cost adjustment could be substantial. In 2004, the CWI for Washington, DC was 63 percent higher than the CWI for Montana, while the CWI for New York City was 49 percent higher than the CWI for Elmira, New York. Given such large differences in the prevailing wage for college graduates, cost adjustment is crucial to a complete understanding of important school finance issues both across states and within states.
4 Payroll costs comprise more than 80 percent of current school district expenditures (U.S. Census Bureau 2004).

5
III. User’s Guide A. CWI Geography
For this study, 800 labor markets in the U.S. were identified. Except in Hawaii, each labor market includes one or more public school districts. Hawaii has a single, state-wide school district which includes three separate labor markets, so the state-level index was used for this district.
All labor markets are based on “place-of-work areas” defined by the Census Bureau. Census place-of-work areas are geographic regions designed to contain at least 100,000 persons. The place-of-work areas do not cross state boundaries and generally follow the boundaries of county groups, single counties, or census-defined places (Ruggles et al. 2003). Counties in sparsely-populated parts of the country are clustered together into a single census place-of-work area. Whenever possible, places of work in metropolitan areas have been aggregated to correspond to Core Based Statistical Areas (CBSAs) as defined by the Office of Management and Budget.5 Places of work that straddled more than one CBSA were treated as separate labor markets.
The four CWI files provide index values at several geographic levels:
1. The labor market files provide the CWI for each of the 800 U.S. labor markets under analysis.
2. The school district file provides a CWI for each local education agency (LEA) in the NCES Common Core of Data (CCD) database. Each district was matched to its corresponding labor market using geographic information from the CCD. For urban school districts, this would be the CWI for the corresponding CBSA. For rural districts, this would be the CWI for the corresponding census place-of-work. All districts in a census place-of-work area have the same CWI. For example, the 22 rural counties in the Texas Panhandle are clustered together into a single place-of-work area and therefore all districts in those 22 counties have been assigned the same CWI value.
3. The state level file provides an aggregate CWI for each U.S. state. A state’s CWI is a weighted average of the local wages within its borders.
4. The regional and national file presents similarly aggregate CWIs for census regions and the nation as a whole.
B. Using the Index The CWI measures labor cost relative to the national average in 1999 (CWI = 1.0). Therefore, when comparing labor costs across locations within a given year, one must take into account changes in the price level since 1999.
5 In June 2003, Census and OMB began using the term, Core Based Statistical Area (CBSA) instead of Metropolitan Statistical Area (MSA). See Frey, et al. (2004).

6
Geographic Adjustment
To normalize dollar amounts and make them comparable, divide by the index and then multiply by the national average CWI for the relevant year. (This example uses expenditure data from the NCES Common Core of Data (CCD), School District Finance Survey (Form F-33) for fiscal year (FY) 2002). The national CWI for 2002 (from the Regional CWI file) is 1.1547. The CWI for New York City in 2002 is 1.4331 (from the School District CWI file), so wages in New York City were 24 percent above the national average in 2002 (1.4331/1.1547=1.2411). Thus, the $11,605 total current expenditures per pupil in New York City schools for FY 2002, when normalized, are equal to $ 9,354 (($11,605 / 1.4331)* 1.1547=$11,605/1.2411). The 2002 total current expenditures per pupil by Suwannee County School District in Live Oak, FL (near Tallahassee) were $6,050. Normalized to reflect the lower cost of living in this area, they are the equivalent of $ 9,753 (($6,050 / 0.7163)*1.1547). The Suwannee County School District effectively spent $399 more per pupil than did NYC schools in 2002.
Geographic Adjustment applied to State Aid
Since one of the great virtues of the CWI is that it is outside of school district control, another application of the CWI is to adjust state aid to a school district for differences in wages. For example, consider a program intended to provide an additional $100 per pupil in 2002 dollars, adjusted for geographical variations in the cost of education. The national CWI for 2002 is 1.1547. The NYC CWI in 2002 is 1.4331, or 24 percent higher than the national average for 2002 (1.4331 / 1.1547=1.24). Therefore New York City Schools would have to receive $124 per pupil ($100 *(1.4331 / 1.1547)). The 2002 CWI for the Buffalo City School District is 1.0555. That district would need to receive an additional $91 per pupil ($100*(1.0555 / 1.1547)).
Although the School District CWI file provides an index for each school district, it must be remembered that the CWI is a measure of wages in labor markets. It does not capture variations within labor markets or other costs of education. These other factors should be kept in mind when comparing districts in the same labor market, since both the advantaged school district and its disadvantaged cross-town rival will have the same CWI.
Inflation Adjustment
It is tempting to use the CWI as a deflator to correct for inflation. The CWI offers a very different perspective on the changing cost of education than does the Consumer Price Index (CPI). Where the CPI rose nearly 18 percent between 1997 and 2004, the CWI rose by 34
Table 1. National Comparable Wage Index, by fiscal year
1997 1998 1999 2000 2001 2002 2003 2004 0.9161 0.9534 1.0000 1.0562 1.0959 1.1547 1.1850 1.2275
SOURCE: U.S Department of Education, National Center for Education Statistics, Comparable Wage Index, Regional File (v. 1a).

7
percent. (See figure 1.) The rate of change in the CWI is much more consistent with the change in the BLS’ Employment Cost Index (ECI) than with the change in the CPI.6
It is not surprising that the ECI and the CWI yield similar estimates of the rate of increase in wages. Changes over time in the CWI reflect changes in a weighted average of predicted wages by occupation from regression analyses of OES data. (Occupations that are held only rarely by college graduates are given little weight in the construction of the CWI, while occupations that employ college graduates intensively are given greater weight. See Taylor and Fowler 2006.) In turn, the OES relies on occupation-specific estimates of the ECI to adjust its multi-year sample for inflation (BLS 2003). Therefore, much of the information in the ECI is imbedded in the CWI.
The NCES does not recommend the use of the CWI as a deflator because the BLS does not encourage the use of the OES for time series analysis. The BLS is concerned that the OES estimates are based on a multi-year panel and the underlying occupational and industrial
Figure 1. The CWI and Inflation:1997-2004
0%
5%
10%
15%
20%
25%
30%
35%
40%
CWI ECI CPI
NOTE: The ECI is the employment cost index for the wages and salaries of private, white-collar occupations (excluding sales occupations). SOURCE: U.S. Department of Education, National Center for Education Statistics, Comparable Wage Index data file, 2006, Bureau of Labor Statistics, Employment Cost Index data file, 2006, and Bureau of Labor Statistics, Consumer Price Index data file, 2006.
6 The ECI used in this analysis is the employment cost index for wage and salary compensation for white collar workers in the private sector.

8
classification systems have changed over time (http://www.bls.gov/oes/oes_ques.htm). Arguably, the research method used in the construction of the CWI addresses many of the BLS’ concerns. However, the extent of the remaining measurement error is unknown, and caution is warranted.
C. Standard Errors
The CWI is estimated by dividing the predicted wage level in each labor market by the national average predicted wage for 1999, or $47,836. Dividing one standard error of each predicted wage by $47,836 yields the standard error of the baseline CWI. It ranges from 0.003 in Los Angeles to 0.050 in rural Texas.
As discussed in Taylor and Fowler (2006), the log predicted wage for noncensus years is estimated by adding the change in log predicted wages in each labor market to the baseline log predicted wage. Annual regression analysis of OES data yields log predicted wages (population marginal means) and their corresponding standard errors for all U.S. states and for the metropolitan areas covered by the OES survey. Thus, for those labor markets, the log predicted wage in 2000 equals the baseline log predicted wage plus the difference between the OES-based log predicted wages in 2000 and 1999 (the baseline year). Similarly, the standard error of the log predicted wage for 2000 is the quadratic sum of the standard errors for the baseline log predicted wage, the OES-based log predicted wage for 2000 and the OES-based log predicted wage for 1999. As with the baseline estimates, dividing one standard error of the predicted wage by $47,836 yields the standard error of the CWI.
Except in the census year (1999), predicted wages for nonmetropolitan areas cannot be measured directly. Instead, they are imputed by assuming that wage growth in a state is a weighted average of the wage growth in its metropolitan areas and its other places of work. There is no way to accurately report the standard error for those estimates.
D. School District CWI File For the school district CWI file, each CCD school district (local education agency) has been mapped to its corresponding labor market. This file provides the CWIs for each school district. Data Elements There are 27 data elements in the School District CWI file.
• LEAID and name. The LEAID code uniquely identifies each local education agency in the CCD database. It consists of seven characters: the two-digit state FIPS code (see table 1) followed by a five-digit number that is unique to each agency within the state. Also included in the file is the LEA name.
• Labor Market. Labor markets are the units of analysis for the Comparable Wage Index
study. These are geographic regions (either Core Based Statistical Areas (CBSAs) or Places of Work) that have the same value for a comparable wage index. For CBSAs, the labor market is the five digit CBSA code defined by OMB (see

9
Table 2.—Federal Information Processing Standards (FIPS) state codes, by state abbreviation and state name
State abbreviation State name FIPS State code AL Alabama 1 AK Alaska 2 AZ Arizona 4 AR Arkansas 5 CA California 6
CO Colorado 8 CT Connecticut 9 DE Delaware 10 DC District of Columbia 11 FL Florida 12
GA Georgia 13 HI Hawaii 15 ID Idaho 16 IL Illinois 17 IN Indiana 18
IA Iowa 19 KS Kansas 20 KY Kentucky 21 LA Louisiana 22 ME Maine 23
MD Maryland 24 MA Massachusetts 25 MI Michigan 26 MN Minnesota 27 MS Mississippi 28
MO Missouri 29 MT Montana 30 NE Nebraska 31 NV Nevada 32 NH New Hampshire 33
NJ New Jersey 34 NM New Mexico 35 NY New York 36 NC North Carolina 37 ND North Dakota 38
OH Ohio 39 OK Oklahoma 40 OR Oregon 41 PA Pennsylvania 42 RI Rhode Island 44
SC South Carolina 45 SD South Dakota 46 TN Tennessee 47 TX Texas 48 UT Utah 49
VT Vermont 50 VA Virginia 51 WA Washington 53 WV West Virginia 54 WI Wisconsin 55 WY Wyoming 56
SOURCE: U.S. Department of Commerce, National Institute of Standards and Technology, Computer Systems Laboratory. Federal Information Processing Standards Publication 5-2, Codes for the Identification of the States, The District of Columbia and the Outlying Areas of the United States, and Associated Areas. Gaithersburg, MD: 1970.

10
http://www.census.gov/population/estimates/metro-city/0312msa.txt). For Places of Work, the labor market is coded as 8 characters, formatted “ST_99999” where “ST” is the two-digit FIPS state code (see table 2) and “99999” is the five-digit Census code for the place of work.
• CBSA name. The name used for CBSAs are from the Census document, http://www.census.gov/population/estimates/metro-city/0312msa.txt. The CBSA_NAME field is blank for places of work, because there are no names assigned to these places. In lieu of a name for places of work, a sense of the geographic area involved can be obtained from the county names associated with the school districts within the labor market. Note, however, that this is not exact; school districts may span counties and places of work may split counties.
• County code and name. This is the five digit Federal Information Processing Standards
(FIPS) code and name of the county where the school district’s offices are located. The first two digits of the FIPS code indicate the state; the last three digits uniquely identify the county within the state. Table 2 on the previous page lists FIPS state codes by state name and state abbreviation.
• State name.
• Agency typologies. Four agency typology codes are included on this file. The values for these fields are listed in appendix A. CCD agency type is the seven-level typology from the CCD nonfiscal agency universe file. The school level code (F33_SCHLEV) has been carried over from the Local Education Agency Finance Data File (F-33) data file. It is the most recent value for the LEA in the years covered in these data files.
The FINANCE_TYPE was developed for the NCES Longitudinal School District Fiscal-Nonfiscal File (see http://nces.ed.gov/pubsearch/pubsinfo.asp?pubid=2005863). It identifies categories of financially comparable LEAs. It is the most recent value for the LEA in the years covered in these data files. This typology will assist those researchers who wish to perform geographic cost adjustments to a particular class of school districts (such as special education, which are not separately identified from vocational school districts in the CCD F-33 district typology). The government type code (GOVT_TYPE) indicates the LEAs dependency status and level of government. This code is the third digit of the CENSUSID field. (The CENSUSID is the unique school district identifier assigned by the Census Bureau to LEAs in the F-33 survey. It is not included in this data file).
• STD_CWI_yyyy. These 8 fields are the standard errors for the extended comparable wage index, where ‘yyyy’ indicates the year (1997–2004).

11
• CCWI_yyyy. These 8 fields are the extended comparable wage index values, where
‘yyyy’ indicates the year (1997–2004). Missing Data There are several fields that are missing values in some records.
• F33_SCHLEV is missing in 29 records. These LEAs, most of them charter school districts, are part of the CCD universe, but are not included in the Census Bureau’s universe of local government agencies. It is the Census Bureau’s finance survey of local government agencies that is the source of this datum. These records are also missing values for GOVT_TYPE.
• GOVT_TYPE is missing in 727 records. These LEAs, all but 8 of which are charter school districts, are not included in the Census Bureau’s universe of local government agencies. Because of that, these LEAs are not assigned a CENSUSID, from which the GOVT_TYPE is derived.
• STD_CWI_yyyy (standard errors for CWIs) for years other than 1999 are not included for 8,073 LEAs. In these cases, the growth rate used to extend the CWI to these years was imputed from the difference between the state growth rate and the metro growth rate in the state and a meaningful standard error cannot be derived.
• CBSA_NAME is blank for the 8,460 LEAs located in rural places of work or in places of work that straddle more than one CBSA.
E. Labor Market CWI File The Labor Market CWI file includes 18 data elements.
• Labor Market. Labor markets are the units of analysis for the Comparable Wage Index study. These are geographic regions (either Core Based Statistical Areas or Places of Work) that have the same value for a comparable wage index. For CBSAs, the labor market is the five digit CBSA code defined by OMB (see http://www.census.gov/population/estimates/metro-city/0312msa.txt). For Places of Work, the labor market is coded as 8 characters, formatted “ST_99999” where “ST” is the two-digit FIPS state code (see table 2) and “99999” is the five-digit Census code for the place of work.
• CBSA Name. The name used for CBSAs are from the Census document,
http://www.census.gov/population/estimates/metro-city/0312msa.txt. This field is blank for places of work, because there are no names assigned to these places. In lieu of a name for places of work, a sense of the geographic area involved can be had from the district file, using the county name associated with the school districts within the labor market. Note however, that this is not exact; school districts may span counties and places of work may split counties.

12
• STD_CWI_yyyy. These 8 fields are the standard errors for the extended comparable wage index, where ‘yyyy’ indicates the year (1997–2004).
• CWI_yyyy. These 8 fields are the extended comparable wage index values, where ‘yyyy’
indicates the year (1997–2004). F. State CWI File The State CWI file includes 18 data elements.
• State FIPS Code. This is the two-digit Federal Information Processing Standard (FIPS) code for the state.
• State Name. • STD_CWI_yyyy. These 8 fields are the standard errors for the extended comparable wage
index, where ‘yyyy’ indicates the year (1997–2004).
• CWI_yyyy. These 8 fields are the extended comparable wage index values, where ‘yyyy’ indicates the year (1997–2004).
G. Regional CWI File The Regional CWI file includes 17 data elements.
• Region Name. This file provides CWI data at the national level as well as at the four
regional levels (in bold below) and nine divisional levels (in parentheses below) used in the Current Population Survey (CPS). These regions and divisions are as follows.
Northeast Midwest (New England) (East North Central) Maine Ohio New Hampshire Indiana Vermont Illinois Massachusetts Michigan Rhode Island Wisconsin Connecticut (Middle Atlantic) (West North Central)New York Minnesota New Jersey Iowa Pennsylvania Missouri North Dakota South Dakota Nebraska Kansas

13
South West (South Atlantic) (Mountain) Delaware Montana Maryland Idaho District of Columbia Wyoming Virginia Colorado West Virginia New Mexico North Carolina Arizona South Carolina Utah Georgia Nevada Florida (East South Central) (Pacific) Kentucky Washington Tennessee Oregon Alabama California Mississippi Alaska Hawaii (West South Central) Arkansas Louisiana Oklahoma Texas
• STD_CWI_yyyy. These 8 fields are the standard errors for the extended comparable wage
index, where ‘yyyy’ indicates the year (1997–2004).
• CWI_yyyy. These 8 fields are the extended comparable wage index values, where ‘yyyy’ indicates the year (1997–2004).
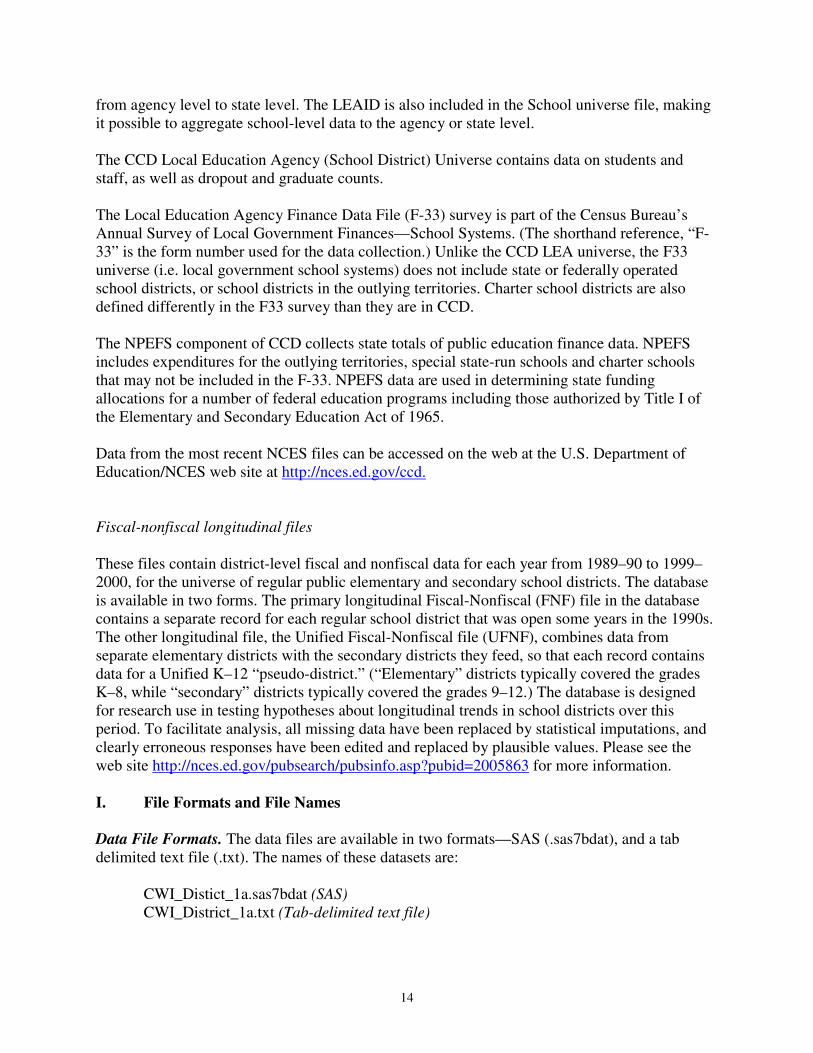
H. Related Data Files Common Core of Data (CCD) The CCD is a comprehensive, annual, national, statistical database of information concerning all public elementary and secondary schools and school districts (LEAs). CCD consists of five surveys: Public Elementary/Secondary School Universe, Local Education Agency (School District) Universe, State Nonfiscal, National Public Education Finance Survey (NPEFS), and the Local Education Agency Finance Data File (F-33) surveys. All CCD data are provided by the state education agencies and are edited by NCES. When merging the F-33 data file with other CCD data files, data users are encouraged to use the F-33 count for student membership. The student membership count has been changed on some records to more closely reflect the count of students enrolled in the schools in the LEA. The LEAID links all these surveys together. It is shared by both the LEA file and the F33 file. The first two digits of the LEAID are the state FIPS code, facilitating the aggregation of data
14
from agency level to state level. The LEAID is also included in the School universe file, making it possible to aggregate school-level data to the agency or state level. The CCD Local Education Agency (School District) Universe contains data on students and staff, as well as dropout and graduate counts. The Local Education Agency Finance Data File (F-33) survey is part of the Census Bureau’s Annual Survey of Local Government Finances—School Systems. (The shorthand reference, “F-33” is the form number used for the data collection.) Unlike the CCD LEA universe, the F33 universe (i.e. local government school systems) does not include state or federally operated school districts, or school districts in the outlying territories. Charter school districts are also defined differently in the F33 survey than they are in CCD. The NPEFS component of CCD collects state totals of public education finance data. NPEFS includes expenditures for the outlying territories, special state-run schools and charter schools that may not be included in the F-33. NPEFS data are used in determining state funding allocations for a number of federal education programs including those authorized by Title I of the Elementary and Secondary Education Act of 1965. Data from the most recent NCES files can be accessed on the web at the U.S. Department of Education/NCES web site at http://nces.ed.gov/ccd. Fiscal-nonfiscal longitudinal files These files contain district-level fiscal and nonfiscal data for each year from 1989–90 to 1999–2000, for the universe of regular public elementary and secondary school districts. The database is available in two forms. The primary longitudinal Fiscal-Nonfiscal (FNF) file in the database contains a separate record for each regular school district that was open some years in the 1990s. The other longitudinal file, the Unified Fiscal-Nonfiscal file (UFNF), combines data from separate elementary districts with the secondary districts they feed, so that each record contains data for a Unified K–12 “pseudo-district.” (“Elementary” districts typically covered the grades K–8, while “secondary” districts typically covered the grades 9–12.) The database is designed for research use in testing hypotheses about longitudinal trends in school districts over this period. To facilitate analysis, all missing data have been replaced by statistical imputations, and clearly erroneous responses have been edited and replaced by plausible values. Please see the web site http://nces.ed.gov/pubsearch/pubsinfo.asp?pubid=2005863 for more information. I. File Formats and File Names Data File Formats. The data files are available in two formats—SAS (.sas7bdat), and a tab delimited text file (.txt). The names of these datasets are:
CWI_Distict_1a.sas7bdat (SAS)
CWI_District_1a.txt (Tab-delimited text file)

15
CWI_Lbr_Mrkt_1a.sas7bdat (SAS) CWI_ Lbr_Mrkt _1a.txt (Tab-delimited text file)
CWI_State_1a.xls (MS Excel)
CWI_State_1a.txt (Tab-delimited text file) CWI_Regional_1a.xls (MS Excel)
CWI_Regional_1a.txt (Tab-delimited text file) The last 2 characters of the file name indicate the file version. “1” indicates a public release by NCES, and “a” indicates this is the first release of this file by NCES. Complete information on layout (variable name, data type—alpha or numeric, and variable description) can be found in the appendixes A–D.


17
IV. References Alexander, C.D., Gronberg, T., Jansen, D., Keller, H., Taylor, L., and Treisman, P.U. (2000). A
Study of Uncontrollable Variations in the Costs of Texas Public Education. Summary report prepared for the 77th Texas Legislature. Austin, TX: Charles A. Dana Center, University of Texas at Austin. Retrieved May 19, 2005, from http://www.utdanacenter.org.
Brazer, H. & Anderson, A. (1983). A Cost Adjustment Index for Michigan School Districts. In
E. Tron (Ed.), Selected Papers in School Finance, 1975. Washington, DC: U.S. Office of Education.
Bureau of Labor Statistics. (2003). Technical Notes for the May 2003 OES Estimates. Retrieved
May 19, 2005, from http://stats.bls.gov/oes/2003/may/oes_tec.htm. Bureau of Labor Statistics (2006). Consumer Price Index. Retrieved April 6, 2006 from
http://stats.bls.gov/cpi/home.htm. Bureau of Labor Statistics (2006). Employment Cost Index. Retrieved April 6, 2006 from
http://data.bls.gov/cgi-bin/dsrv?ec. Chambers, J.G. (1997). Measuring Inflation in Public Schools Costs (NCES 97-43). U.S.
Department of Education. Washington, DC: National Center for Education Statistics Working Paper.
Chambers, J.G. (1998). Geographic Variations in Public Schools Costs (NCES 98-04). U.S.
Department of Education. Washington, DC: National Center for Education Statistics Working Paper.
Federal Bureau of Investigation (2003). Crime in the United States. Uniform Crime Reports.
Retrieved May 19, 2005, from http://www.fbi.gov/ucr/03cius.htm. Fowler, W.J., and Monk, D.H. (2001). A Primer for Making Cost Adjustments in Education
(NCES 2001-323). U.S. Department of Education. Washington, DC: National Center for Education Statistics.
Frey, W.H., Wilson, J.H., Berube, A., and Singer. A. (2004). Tracking Metropolitan America
into the 21st Century: A Field Guide to the New Metropolitan and Micropolitan Definitions. Washington, DC: The Brookings Institution.
Goldhaber, D. (1999). An Alternative Measure of Inflation in Teacher Salaries. In W.J. Fowler
(Ed.), Selected Papers in School Finance (NCES 1999-334) (pp.29-54). U.S. Department of Education. Washington, DC: National Center for Education Statistics.
18
Guthrie, J., and Rothstein, R. (1999). Enabling ‘Adequacy’ to Achieve Reality: Translating Adequacy into State School Finance Distribution Arrangements. In H.F. Ladd, R. Chalk, and J.S. Hansen (Eds.), Equity and Adequacy in Education Finance (pp. 209–259). Washington, DC: National Academy Press.
Hanushek, E.A. (1999). Adjusting for Differences in the Costs of Educational Inputs. In W.J.
Fowler (Ed.), Selected Papers in School Finance, 1997–99 (NCES 1999–334) (pp. 13–28). U.S. Department of Education. Washington, DC: National Center for Education Statistics.
Rothstein, R., and Smith, J.R. (1997). Adjusting Oregon Education Expenditures for Regional
Cost Differences: A Feasibility Study. Submitted to the Confederation of Oregon School Administrators. Sacramento, CA: Management Analysis & Planning Associates, LLC.
Ruggles, S., Sobek, M., Alexander, T., Fitch, C., Goeken, R., Hall, P., King, M., and Ronnander,
C. (2004). Integrated Public Use Microdata Series: Version 3.0 (machine-readable database). Minneapolis, MN: Minnesota Population Center. Available at http://www.ipums.org.
Smith, T., Porch, R., Farris, E., and Fowler, W.J. (2003). Effects of Energy Needs and
Expenditures on U.S. Public Schools (NCES 2003-018). U.S. Department of Education. Washington, DC: National Center for Education Statistics.
Stoddard, C. (2005). Adjusting Teacher Salaries for the Cost of Living: The Effect on Salary
Comparisons and Policy Conclusions. Economics of Education Review, 24(3): 323–339. Taylor, L.L., Alexander, C., Gronberg, T., Jansen, D., and Keller, H. (2002). Updating the Texas
Cost of Education Index. The Journal of Education Finance, 28(2): 267–284. Taylor, L.L., and Fowler, W.J. (2006). A Comparable Wage Approach to Geographic Cost
Adjustment (NCES 2006-321). U.S. Department of Education. Washington, DC: National Center for Education Statistics.
Taylor, L.L., and Keller H. (2003). Competing Perspectives on the Cost of Education. In W.J.
Fowler (Ed.), Developments in School Finance (NCES 2003-403). U.S. Department of Education. Washington, DC: National Center for Education Statistics.
U.S. Census Bureau. (2004). 2002 Census of Governments, Volume 4, Number 1, Government
Finances, GC02(4)-1. U.S. Department of Commerce, Economics and Statistics Administration. Washington, DC: U.S. Government Printing Office.
Appendix A—Record Layout and Descriptions of Data Elements: NCES District CWI Data File
A-1
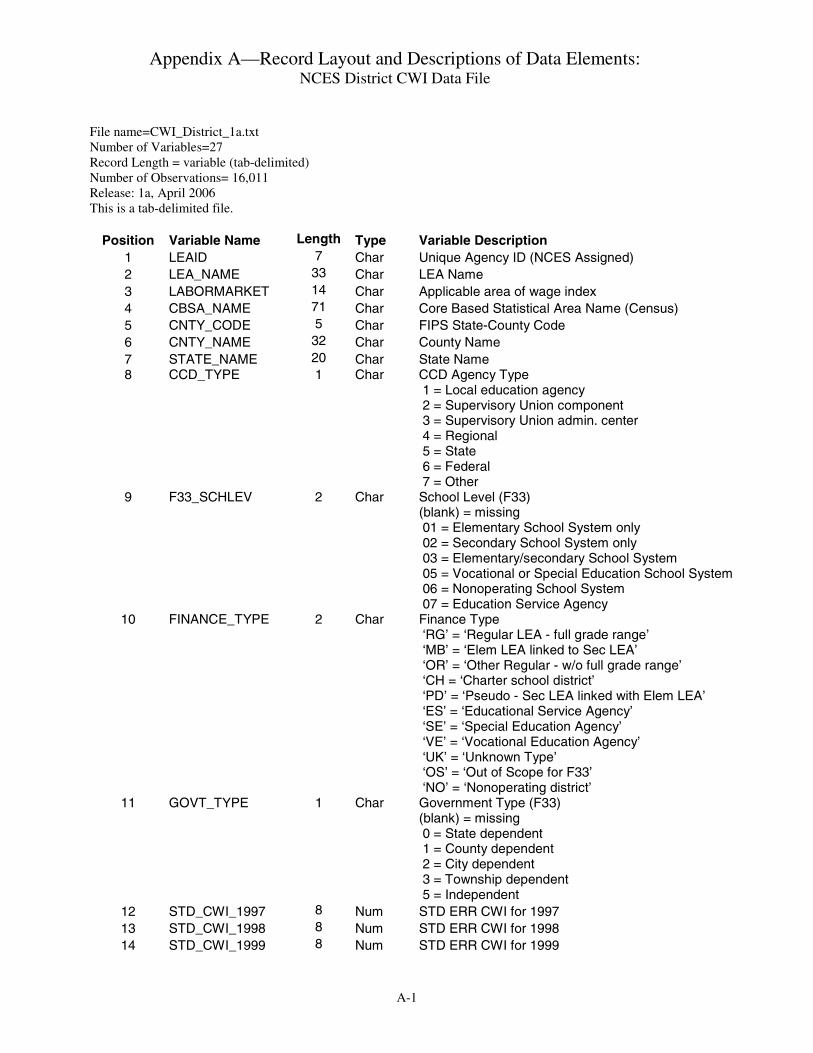
File name=CWI_District_1a.txt Number of Variables=27 Record Length = variable (tab-delimited) Number of Observations= 16,011 Release: 1a, April 2006 This is a tab-delimited file.
Position Variable Name Length Type Variable Description 1 LEAID 7 Char Unique Agency ID (NCES Assigned) 2 LEA_NAME 33 Char LEA Name 3 LABORMARKET 14 Char Applicable area of wage index 4 CBSA_NAME 71 Char Core Based Statistical Area Name (Census) 5 CNTY_CODE 5 Char FIPS State-County Code 6 CNTY_NAME 32 Char County Name 7 STATE_NAME 20 Char State Name 8 CCD_TYPE 1 Char CCD Agency Type
1 = Local education agency 2 = Supervisory Union component 3 = Supervisory Union admin. center 4 = Regional 5 = State 6 = Federal 7 = Other
9 F33_SCHLEV 2 Char School Level (F33) (blank) = missing 01 = Elementary School System only 02 = Secondary School System only 03 = Elementary/secondary School System 05 = Vocational or Special Education School System 06 = Nonoperating School System 07 = Education Service Agency
10 FINANCE_TYPE 2 Char Finance Type ‘RG’ = ‘Regular LEA - full grade range’ ‘MB’ = ‘Elem LEA linked to Sec LEA’ ‘OR’ = ‘Other Regular - w/o full grade range’ ‘CH = ‘Charter school district’ ‘PD’ = ‘Pseudo - Sec LEA linked with Elem LEA’ ‘ES’ = ‘Educational Service Agency’ ‘SE’ = ‘Special Education Agency’ ‘VE’ = ‘Vocational Education Agency’ ‘UK’ = ‘Unknown Type’ ‘OS’ = ‘Out of Scope for F33’ ‘NO’ = ‘Nonoperating district’
11 GOVT_TYPE 1 Char Government Type (F33) (blank) = missing 0 = State dependent 1 = County dependent 2 = City dependent 3 = Township dependent 5 = Independent
12 STD_CWI_1997 8 Num STD ERR CWI for 1997 13 STD_CWI_1998 8 Num STD ERR CWI for 1998 14 STD_CWI_1999 8 Num STD ERR CWI for 1999

Appendix A—Record Layout and Descriptions of Data Elements: NCES District CWI Data File
A-2
Position Variable Name Length Type Variable Description 15 STD_CWI_2000 8 Num STD ERR CWI for 2000 16 STD_CWI_2001 8 Num STD ERR CWI for 2001 17 STD_CWI_2002 8 Num STD ERR CWI for 2002 18 STD_CWI_2003 8 Num STD ERR CWI for 2003 19 STD_CWI_2004 8 Num STD ERR CWI for 2004 20 CWI_1997 8 Num Comparable Wage Index for 1997 21 CWI_1998 8 Num Comparable Wage Index for 1998 22 CWI_1999 8 Num Comparable Wage Index for 1999 23 CWI_2000 8 Num Comparable Wage Index for 2000 24 CWI_2001 8 Num Comparable Wage Index for 2001 25 CWI_2002 8 Num Comparable Wage Index for 2002 26 CWI_2003 8 Num Comparable Wage Index for 2003 27 CWI_2004 8 Num Comparable Wage Index for 2004

Appendix B—Record Layout and Descriptions of Data Elements: NCES Labor Market CWI Data File
B-1
File name=CWI_LBR_MRKT_1a.txt Number of Variables=18 Record Length = variable (tab-delimited) Number of Observations= 800 Release: 1a, April 2006 This is a tab-delimited file.
Position Variable Name Length Type Variable Description 1 LABORMARKET 14 Char Applicable area of wage index 2 CBSA_NAME 71 Char Core Based Statistical Area Name (Census) 3 STD_CWI_1997 8 Num STD ERR CWI for 1997 4 STD_CWI_1998 8 Num STD ERR CWI for 1998 5 STD_CWI_1999 8 Num STD ERR CWI for 1999 6 STD_CWI_2000 8 Num STD ERR CWI for 2000 7 STD_CWI_2001 8 Num STD ERR CWI for 2001 8 STD_CWI_2002 8 Num STD ERR CWI for 2002 9 STD_CWI_2003 8 Num STD ERR CWI for 2003 10 STD_CWI_2004 8 Num STD ERR CWI for 2004 11 CWI_1997 8 Num Comparable Wage Index for 1997 12 CWI_1998 8 Num Comparable Wage Index for 1998 13 CWI_1999 8 Num Comparable Wage Index for 1999 14 CWI_2000 8 Num Comparable Wage Index for 2000 15 CWI_2001 8 Num Comparable Wage Index for 2001 16 CWI_2002 8 Num Comparable Wage Index for 2002 17 CWI_2003 8 Num Comparable Wage Index for 2003 18 CWI_2004 8 Num Comparable Wage Index for 2004


Appendix C—Record Layout and Descriptions of Data Elements: NCES State CWI Data File
C-1
File name=CWI_State_1a.txt Number of Variables=18 Record Length = variable (tab-delimited) Number of Observations= 51 Release: 1a, April 2006 This is a tab-delimited file.
Position Variable Name Length Type Variable Description 1 ST_FIPS 2 Char State FIPS Code 2 ST_NAME 20 Char State Name 3 STD_CWI_1997 8 Num STD ERR CWI for 1997 4 STD_CWI_1998 8 Num STD ERR CWI for 1998 5 STD_CWI_1999 8 Num STD ERR CWI for 1999 6 STD_CWI_2000 8 Num STD ERR CWI for 2000 7 STD_CWI_2001 8 Num STD ERR CWI for 2001 8 STD_CWI_2002 8 Num STD ERR CWI for 2002 9 STD_CWI_2003 8 Num STD ERR CWI for 2003 10 STD_CWI_2004 8 Num STD ERR CWI for 2004 11 CWI_1997 8 Num Comparable Wage Index for 1997 12 CWI_1998 8 Num Comparable Wage Index for 1998 13 CWI_1999 8 Num Comparable Wage Index for 1999 14 CWI_2000 8 Num Comparable Wage Index for 2000 15 CWI_2001 8 Num Comparable Wage Index for 2001 16 CWI_2002 8 Num Comparable Wage Index for 2002 17 CWI_2003 8 Num Comparable Wage Index for 2003 18 CWI_2004 8 Num Comparable Wage Index for 2004

Appendix D—Record Layout and Descriptions of Data Elements: NCES Regional CWI Data File
D-1
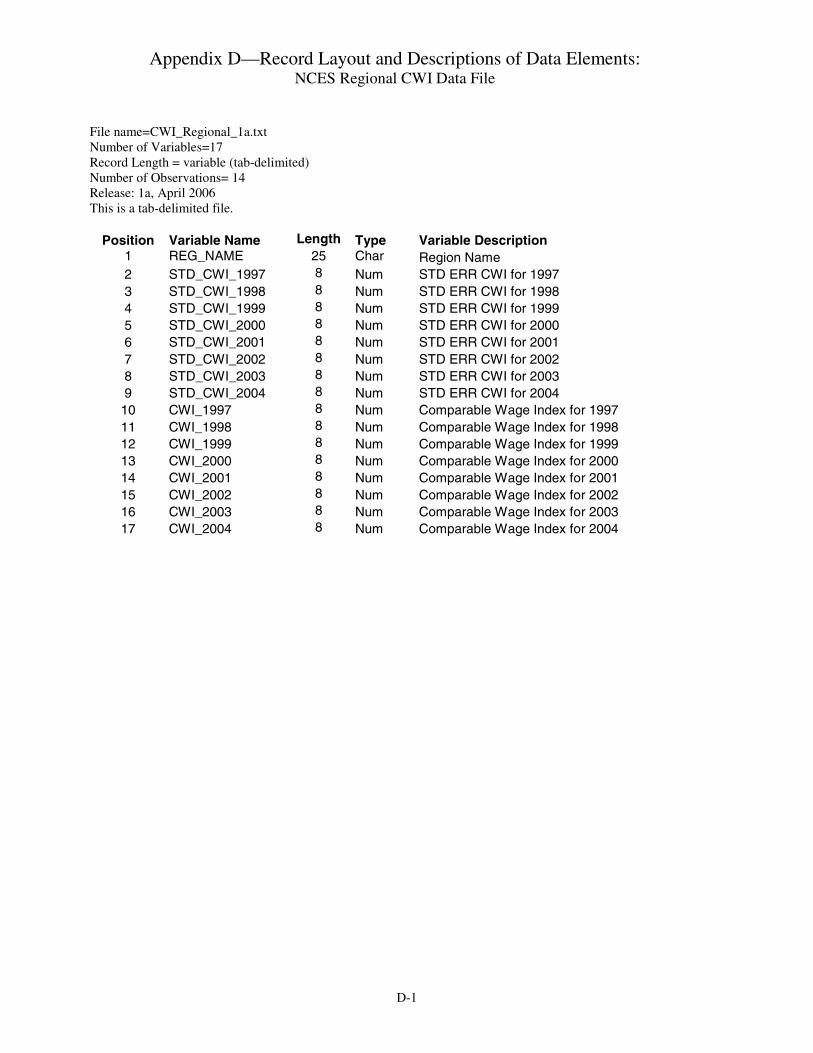
File name=CWI_Regional_1a.txt Number of Variables=17 Record Length = variable (tab-delimited) Number of Observations= 14 Release: 1a, April 2006 This is a tab-delimited file.
Position Variable Name Length Type Variable Description 1 REG_NAME 25 Char Region Name 2 STD_CWI_1997 8 Num STD ERR CWI for 1997 3 STD_CWI_1998 8 Num STD ERR CWI for 1998 4 STD_CWI_1999 8 Num STD ERR CWI for 1999 5 STD_CWI_2000 8 Num STD ERR CWI for 2000 6 STD_CWI_2001 8 Num STD ERR CWI for 2001 7 STD_CWI_2002 8 Num STD ERR CWI for 2002 8 STD_CWI_2003 8 Num STD ERR CWI for 2003 9 STD_CWI_2004 8 Num STD ERR CWI for 2004 10 CWI_1997 8 Num Comparable Wage Index for 1997 11 CWI_1998 8 Num Comparable Wage Index for 1998 12 CWI_1999 8 Num Comparable Wage Index for 1999 13 CWI_2000 8 Num Comparable Wage Index for 2000 14 CWI_2001 8 Num Comparable Wage Index for 2001 15 CWI_2002 8 Num Comparable Wage Index for 2002 16 CWI_2003 8 Num Comparable Wage Index for 2003 17 CWI_2004 8 Num Comparable Wage Index for 2004


Appendix E —Glossary NCES Comparable Wage Index Data File
E-1
Core Based Statistical Area (CBSA). These are the metropolitan statistical areas and metropolitan divisions defined by the Office of Management and Budget, December 2003, and disseminated by the Population Division, U.S. Census Bureau (Last Revised: January 6,2004; Internet Release Date: February 25, 2004 http://www.census.gov/population/estimates/metro-city/0312msa.txt ). Comparable wage indexes are based on Core Based Statistical Areas or Places of Work. Common Core of Data (CCD). A group of public elementary/secondary education surveys of NCES. CCD data are collected from each state’s department of education, from their administrative records data systems. Charter Schools. Charter schools are public schools that are exempted from significant state or local rules that normally govern the operation and management of public schools. A charter school is created by a developer as a public school, or is adapted by a developer from an existing public school. It operates in pursuit of a specific set of education objectives determined by the school’s developer and agreed to by the public chartering agency and provides a program of elementary or secondary education, or both. It meets all applicable federal, state, and local health and safety requirements; complies with federal civil rights laws and operates in accordance with state law. Charter schools may be operated by a regular school district, or they may be self-governing entities. Dependent LEA. A local education agency that lacks either fiscal or administrative independence. Dependent LEAs are classified by the Census Bureau as subunits of other government units, such as a state, county, municipality, or township. See the description of GOVT_TYPE in the User’s Guide and appendix A. Elementary/Secondary Education. Programs providing instruction, or assisting in providing instruction, for students in prekindergarten, kindergarten, grades 1 through 12, and ungraded programs. Fiscal Year. The 12-month period to which the annual operating budget applies. At the end of the fiscal year, the agency determines its financial condition and the results of its operations.

Appendix E —Glossary NCES Comparable Wage Index Data File
E-2
Geographic Region / Division. One of the regions or divisions used by the U.S. Bureau of the Census in Current Population Survey tabulations, as follows: Northeast Midwest (New England) (East North Central) Maine Ohio New Hampshire Indiana Vermont Illinois Massachusetts Michigan Rhode Island Wisconsin Connecticut (Middle Atlantic) (West North Central)New York Minnesota New Jersey Iowa Pennsylvania Missouri North Dakota South Dakota Nebraska Kansas South West (South Atlantic) (Mountain) Delaware Montana Maryland Idaho District of Columbia Wyoming Virginia Colorado West Virginia New Mexico North Carolina Arizona South Carolina Utah Georgia Nevada Florida (East South Central) (Pacific) Kentucky Washington Tennessee Oregon Alabama California Mississippi Alaska Hawaii (West South Central) Arkansas Louisiana Oklahoma Texas

Appendix E —Glossary NCES Comparable Wage Index Data File
E-3
Independent LEA. A local education agency that has both fiscal and administrative independence. See the description of GOVT_TYPE in the User’s Guide and appendix A. Labor Market. Labor markets are the units of analysis for the Comparable Wage Index study. These are geographic regions (either Core Based Statistical Areas or Places of Work) that have the same value for a comparable wage index. LEA. Local Education Agency, often called school districts, an education agency at the local level whose primary responsibility is to operate public schools or to contract for public school services. National Center for Education Statistics (NCES). An organization within the Institute of Education Sciences (IES), part of the U.S. Department of Education. NCES is the primary federal entity for collecting, analyzing, and reporting data related to education. Place of Work. A geographic area defined by the Census Bureau. Comparable wage indexes are based on either Core Based Statistical Areas or Places of Work. Public School Systems. Includes independent school district governments and dependent school systems. Independent school district governments are organized local entities providing public elementary, secondary, special, and vocational/technical education. Dependent school systems are classified by the Census Bureau as sub-units of some other governmental unit such as a county, municipality, township, or the state.

Appendix F —Frequencies and Ranges NCES Comparable Wage Index data file
F-1
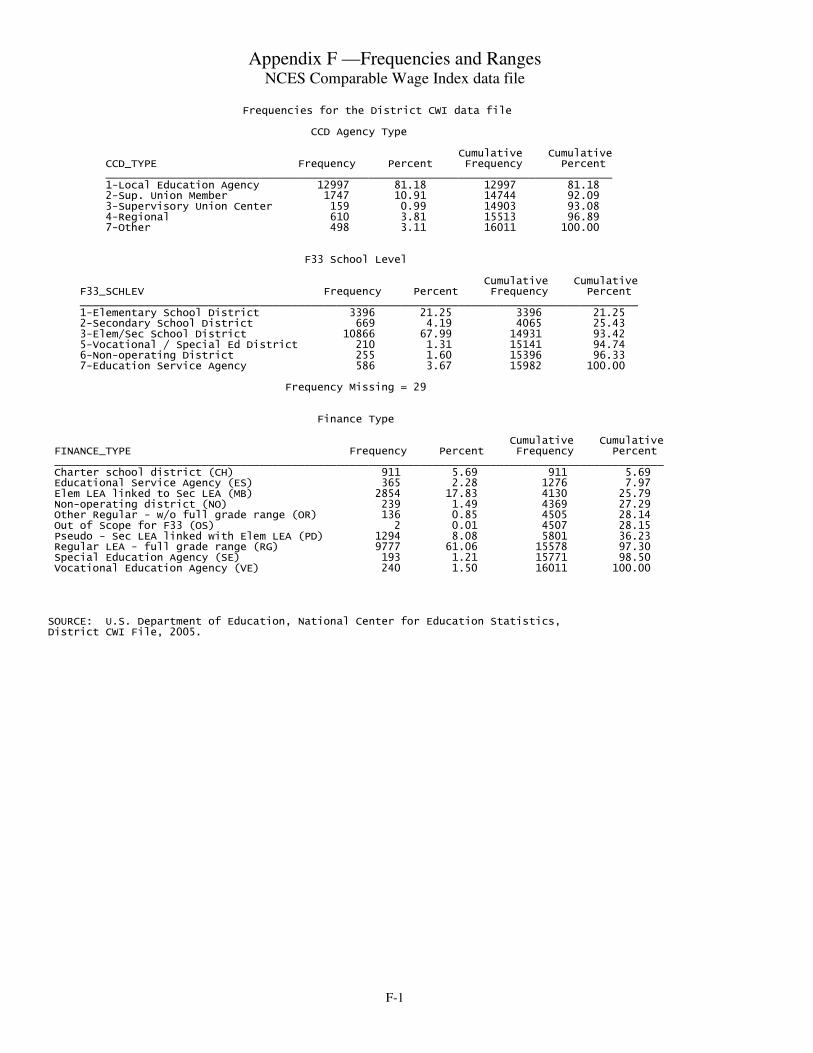
Frequencies for the District CWI data file CCD Agency Type Cumulative Cumulative CCD_TYPE Frequency Percent Frequency Percent _______________________________________________________________________________ 1-Local Education Agency 12997 81.18 12997 81.18 2-Sup. Union Member 1747 10.91 14744 92.09 3-Supervisory Union Center 159 0.99 14903 93.08 4-Regional 610 3.81 15513 96.89 7-Other 498 3.11 16011 100.00 F33 School Level Cumulative Cumulative F33_SCHLEV Frequency Percent Frequency Percent _______________________________________________________________________________________ 1-Elementary School District 3396 21.25 3396 21.25 2-Secondary School District 669 4.19 4065 25.43 3-Elem/Sec School District 10866 67.99 14931 93.42 5-Vocational / Special Ed District 210 1.31 15141 94.74 6-Non-operating District 255 1.60 15396 96.33 7-Education Service Agency 586 3.67 15982 100.00 Frequency Missing = 29 Finance Type Cumulative Cumulative FINANCE_TYPE Frequency Percent Frequency Percent _______________________________________________________________________________________________ Charter school district (CH) 911 5.69 911 5.69 Educational Service Agency (ES) 365 2.28 1276 7.97 Elem LEA linked to Sec LEA (MB) 2854 17.83 4130 25.79 Non-operating district (NO) 239 1.49 4369 27.29 Other Regular - w/o full grade range (OR) 136 0.85 4505 28.14 Out of Scope for F33 (OS) 2 0.01 4507 28.15 Pseudo - Sec LEA linked with Elem LEA (PD) 1294 8.08 5801 36.23 Regular LEA - full grade range (RG) 9777 61.06 15578 97.30 Special Education Agency (SE) 193 1.21 15771 98.50 Vocational Education Agency (VE) 240 1.50 16011 100.00 SOURCE: U.S. Department of Education, National Center for Education Statistics, District CWI File, 2005.
Appendix F —Frequencies and Ranges NCES Comparable Wage Index data file
F-2
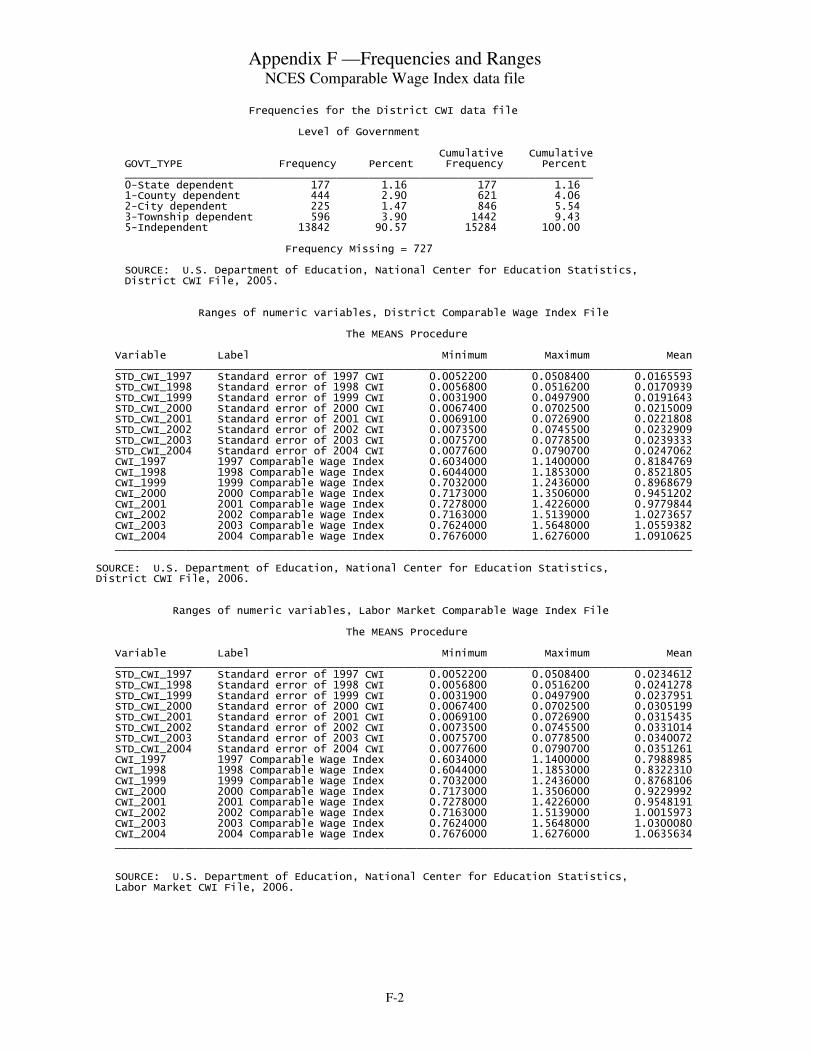
Frequencies for the District CWI data file Level of Government Cumulative Cumulative GOVT_TYPE Frequency Percent Frequency Percent _________________________________________________________________________ 0-State dependent 177 1.16 177 1.16 1-County dependent 444 2.90 621 4.06 2-City dependent 225 1.47 846 5.54 3-Township dependent 596 3.90 1442 9.43 5-Independent 13842 90.57 15284 100.00 Frequency Missing = 727
SOURCE: U.S. Department of Education, National Center for Education Statistics, District CWI File, 2005.
Ranges of numeric variables, District Comparable Wage Index File The MEANS Procedure Variable Label Minimum Maximum Mean __________________________________________________________________________________________ STD_CWI_1997 Standard error of 1997 CWI 0.0052200 0.0508400 0.0165593 STD_CWI_1998 Standard error of 1998 CWI 0.0056800 0.0516200 0.0170939 STD_CWI_1999 Standard error of 1999 CWI 0.0031900 0.0497900 0.0191643 STD_CWI_2000 Standard error of 2000 CWI 0.0067400 0.0702500 0.0215009 STD_CWI_2001 Standard error of 2001 CWI 0.0069100 0.0726900 0.0221808 STD_CWI_2002 Standard error of 2002 CWI 0.0073500 0.0745500 0.0232909 STD_CWI_2003 Standard error of 2003 CWI 0.0075700 0.0778500 0.0239333 STD_CWI_2004 Standard error of 2004 CWI 0.0077600 0.0790700 0.0247062 CWI_1997 1997 Comparable Wage Index 0.6034000 1.1400000 0.8184769 CWI_1998 1998 Comparable Wage Index 0.6044000 1.1853000 0.8521805 CWI_1999 1999 Comparable Wage Index 0.7032000 1.2436000 0.8968679 CWI_2000 2000 Comparable Wage Index 0.7173000 1.3506000 0.9451202 CWI_2001 2001 Comparable Wage Index 0.7278000 1.4226000 0.9779844 CWI_2002 2002 Comparable Wage Index 0.7163000 1.5139000 1.0273657 CWI_2003 2003 Comparable Wage Index 0.7624000 1.5648000 1.0559382 CWI_2004 2004 Comparable Wage Index 0.7676000 1.6276000 1.0910625 __________________________________________________________________________________________ SOURCE: U.S. Department of Education, National Center for Education Statistics, District CWI File, 2006. Ranges of numeric variables, Labor Market Comparable Wage Index File The MEANS Procedure Variable Label Minimum Maximum Mean __________________________________________________________________________________________ STD_CWI_1997 Standard error of 1997 CWI 0.0052200 0.0508400 0.0234612 STD_CWI_1998 Standard error of 1998 CWI 0.0056800 0.0516200 0.0241278 STD_CWI_1999 Standard error of 1999 CWI 0.0031900 0.0497900 0.0237951 STD_CWI_2000 Standard error of 2000 CWI 0.0067400 0.0702500 0.0305199 STD_CWI_2001 Standard error of 2001 CWI 0.0069100 0.0726900 0.0315435 STD_CWI_2002 Standard error of 2002 CWI 0.0073500 0.0745500 0.0331014 STD_CWI_2003 Standard error of 2003 CWI 0.0075700 0.0778500 0.0340072 STD_CWI_2004 Standard error of 2004 CWI 0.0077600 0.0790700 0.0351261 CWI_1997 1997 Comparable Wage Index 0.6034000 1.1400000 0.7988985 CWI_1998 1998 Comparable Wage Index 0.6044000 1.1853000 0.8322310 CWI_1999 1999 Comparable Wage Index 0.7032000 1.2436000 0.8768106 CWI_2000 2000 Comparable Wage Index 0.7173000 1.3506000 0.9229992 CWI_2001 2001 Comparable Wage Index 0.7278000 1.4226000 0.9548191 CWI_2002 2002 Comparable Wage Index 0.7163000 1.5139000 1.0015973 CWI_2003 2003 Comparable Wage Index 0.7624000 1.5648000 1.0300080 CWI_2004 2004 Comparable Wage Index 0.7676000 1.6276000 1.0635634 __________________________________________________________________________________________ SOURCE: U.S. Department of Education, National Center for Education Statistics, Labor Market CWI File, 2006.
Appendix F —Frequencies and Ranges NCES Comparable Wage Index data file
F-3
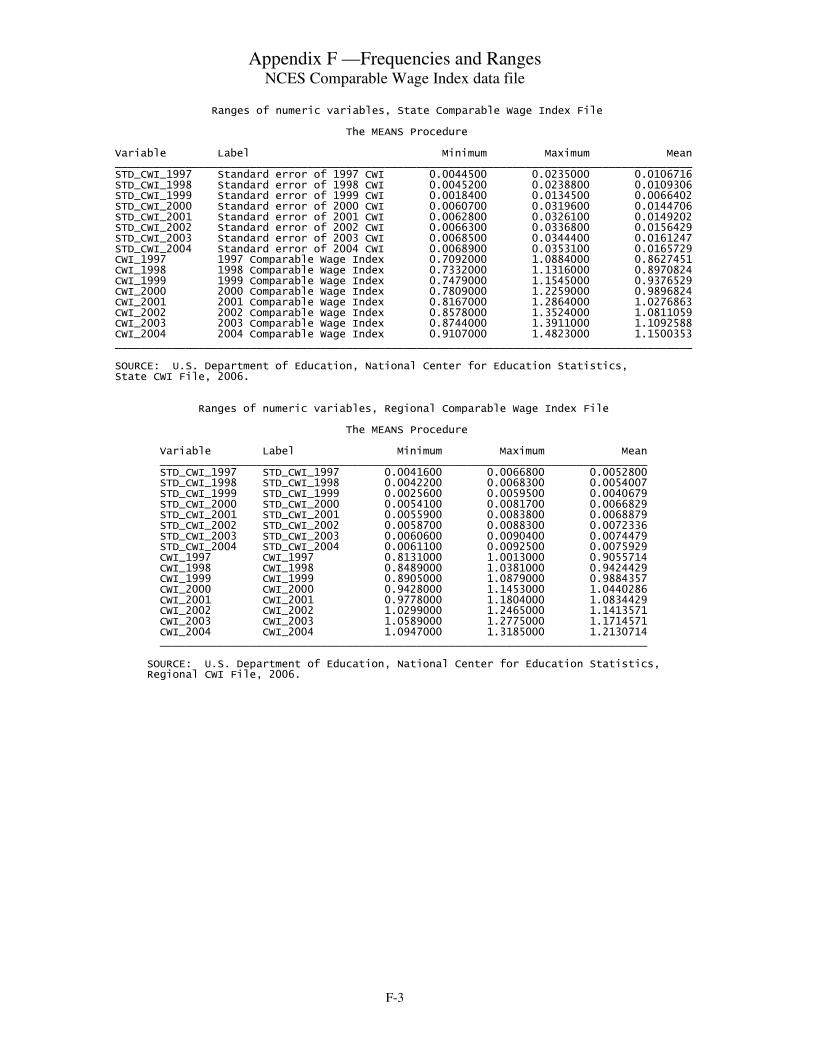
Ranges of numeric variables, State Comparable Wage Index File The MEANS Procedure Variable Label Minimum Maximum Mean __________________________________________________________________________________________ STD_CWI_1997 Standard error of 1997 CWI 0.0044500 0.0235000 0.0106716 STD_CWI_1998 Standard error of 1998 CWI 0.0045200 0.0238800 0.0109306 STD_CWI_1999 Standard error of 1999 CWI 0.0018400 0.0134500 0.0066402 STD_CWI_2000 Standard error of 2000 CWI 0.0060700 0.0319600 0.0144706 STD_CWI_2001 Standard error of 2001 CWI 0.0062800 0.0326100 0.0149202 STD_CWI_2002 Standard error of 2002 CWI 0.0066300 0.0336800 0.0156429 STD_CWI_2003 Standard error of 2003 CWI 0.0068500 0.0344400 0.0161247 STD_CWI_2004 Standard error of 2004 CWI 0.0068900 0.0353100 0.0165729 CWI_1997 1997 Comparable Wage Index 0.7092000 1.0884000 0.8627451 CWI_1998 1998 Comparable Wage Index 0.7332000 1.1316000 0.8970824 CWI_1999 1999 Comparable Wage Index 0.7479000 1.1545000 0.9376529 CWI_2000 2000 Comparable Wage Index 0.7809000 1.2259000 0.9896824 CWI_2001 2001 Comparable Wage Index 0.8167000 1.2864000 1.0276863 CWI_2002 2002 Comparable Wage Index 0.8578000 1.3524000 1.0811059 CWI_2003 2003 Comparable Wage Index 0.8744000 1.3911000 1.1092588 CWI_2004 2004 Comparable Wage Index 0.9107000 1.4823000 1.1500353 __________________________________________________________________________________________ SOURCE: U.S. Department of Education, National Center for Education Statistics, State CWI File, 2006. Ranges of numeric variables, Regional Comparable Wage Index File The MEANS Procedure Variable Label Minimum Maximum Mean ____________________________________________________________________________ STD_CWI_1997 STD_CWI_1997 0.0041600 0.0066800 0.0052800 STD_CWI_1998 STD_CWI_1998 0.0042200 0.0068300 0.0054007 STD_CWI_1999 STD_CWI_1999 0.0025600 0.0059500 0.0040679 STD_CWI_2000 STD_CWI_2000 0.0054100 0.0081700 0.0066829 STD_CWI_2001 STD_CWI_2001 0.0055900 0.0083800 0.0068879 STD_CWI_2002 STD_CWI_2002 0.0058700 0.0088300 0.0072336 STD_CWI_2003 STD_CWI_2003 0.0060600 0.0090400 0.0074479 STD_CWI_2004 STD_CWI_2004 0.0061100 0.0092500 0.0075929 CWI_1997 CWI_1997 0.8131000 1.0013000 0.9055714 CWI_1998 CWI_1998 0.8489000 1.0381000 0.9424429 CWI_1999 CWI_1999 0.8905000 1.0879000 0.9884357 CWI_2000 CWI_2000 0.9428000 1.1453000 1.0440286 CWI_2001 CWI_2001 0.9778000 1.1804000 1.0834429 CWI_2002 CWI_2002 1.0299000 1.2465000 1.1413571 CWI_2003 CWI_2003 1.0589000 1.2775000 1.1714571 CWI_2004 CWI_2004 1.0947000 1.3185000 1.2130714 ____________________________________________________________________________ SOURCE: U.S. Department of Education, National Center for Education Statistics, Regional CWI File, 2006.