Document of The World Bank · 2003 US$1.00 CLP 691.40 2004 US$1.00 CLP 609.53 2005 US$1.00 CLP...
117
Document of The World Bank Report No.: 68251 AN IEG COMPARATIVE REVIEW FOR HIGHER EDUCATION REFORM IN LATIN AMERICA: BASED ON PROJECT PERFORMANCE ASSESSEMENTS OF THREE PROJECTS: CHILE LIFELONG LEARNING AND TRAINING PROJECT ( L71060) SCIENCE FOR THE KNOWLEDGE ECONOMY PROJECT (L71720) AND COLOMBIA HIGHER EDUCATION IMPROVING ACCESS PROJECT (L71550) June 12, 2012 IEG Public Sector Evaluation Independent Evaluation Group
-
Upload
nguyentuyen -
Category
Documents
-
view
222 -
download
2
Transcript of Document of The World Bank · 2003 US$1.00 CLP 691.40 2004 US$1.00 CLP 609.53 2005 US$1.00 CLP...

Document of
The World Bank
Report No.: 68251
AN IEG COMPARATIVE REVIEW FOR HIGHER EDUCATION REFORM IN
LATIN AMERICA:
BASED ON PROJECT PERFORMANCE ASSESSEMENTS OF THREE
PROJECTS:
CHILE
LIFELONG LEARNING AND TRAINING PROJECT ( L71060)
SCIENCE FOR THE KNOWLEDGE ECONOMY PROJECT (L71720)
AND
COLOMBIA
HIGHER EDUCATION IMPROVING ACCESS PROJECT (L71550)
June 12, 2012
IEG Public Sector Evaluation Independent Evaluation Group

ii
Currency Equivalents (annual averages)
Currency Unit = Chilean Peso 2003 US$1.00 CLP 691.40 2004 US$1.00 CLP 609.53 2005 US$1.00 CLP 559.77 2006 US$1.00 CLP 530.28 2007 US$1.00 CLP 522.46 2008 US$1.00 CLP 522.46 2009 US$1.00 CLP 560.86 2010 US$1.00 CLP 510.25 2011 US$1.00 CLP 483.67 Currency Unit = Colombian Peso 2003 US$1.00 COP 2,877.65 2004 US$1.00 COP 2,628.61 2005 US$1.00 COP 2,320.83 2006 US$1.00 COP 2,361.14 2007 US$1.00 COP 2,078.29 2008 US$1.00 COP 1,967.71 2009 US$1.00 COP 2,158.26 2010 US$1.00 COP 1,898.57 2011 US$1.00 COP 1,848.17 Abbreviations and Acronyms
ACCES Access with Quality to Higher Education (Acceso con Calidad a la Educación Superior) ASCUN Asociaci6n Colombiana de Universidades CASCES Comisión Administradora del Sistema de Créditos para Estudios Superiores CASEN Encuesta de Caracterización Socioeconómica Nacional CEIAs Adult education centers CEU Curriculum and Evaluation Unit of the Ministry of Education CFT Technical tertiary institutions CNA Consejo Nacional de Acreditaci6n CNIC Consejo Nacional de Innovacion para la Competitividad COLCIENCIAS Departamento Administrativo de Ciencia, Tecnología e Innovación (New Name) Instituto Colombiano para el Desarrollo de la Ciencia y la Tecnología CONICYT Comisión Nacional de Investigación Científica y Tecnológica CONPES Consejo Nacional de Política Económica y Social CORFO Corporación de Fomento de la Producción DANE Departamento Administrativo Nacional de Estadística DIPRES Budget Directorate within the Ministry of Finance DNP Departamento Nacional de Planeaci6n FEDESAROLLO Fundaci6n para la Educaci6n Superior y el Desarrollo FONDAP Fondo de Investigación Avanzada en Áreas Prioritarias FONDECYT Fondo Nacional de Desarrollo Científico y Tecnológico FONDEF Fondo de Fomento a1 Desarrollo Científico y Tecnológico FONTEC Fondo National de Desarollo Tecnoldgico y Productivo
GDP Gross domestic product ICETEX Instituto Colombiano de Crédito Educativo y Estudios Técnicos en el Exterior ICFES Instituto Colombiano para el Fomento de la Educaci6n Superior (New name - Instituto Colombiano para la Evaluación de la Educación) ICR Implementation Completion and Results Report IEG Independent Evaluation Group IRR Internal rate of return KAWAX Observatorio Chileno de Ciencia, Tecnología e Innovacion M&E Monitoring and evaluation MIS Management information system OECD Organisation for Economic Co-operation and Development PAD Project Appraisal Document PCU Project Coordination Unit PPAR Project Performance Assessment Report R&D Research and development S&T Science and technology SENA Servicio Nacional de Aprendizaje SENCE Servicio Nacional de Capacitación y Empleo (National Training and Employment Service) SIMCE Sistema de Medición de la Calidad de la Educación SNIES Sistema Nacional de Información de la Educación Superior SOFOFA Sociedad de Fomento Fabril TFP Total factor productivity TVET Technical and vocational education and training Fiscal Year
Government of Chile: July 1 – June 30
Government of Colombia: January 1 – December 31
Director-General, Independent Evaluation : Ms. Caroline Heider Director, IEG Public Sector Evaluation : Mr. Emmanuel Jimenez Manager, IEG Public Sector Evaluation : Ms. Martha Ainsworth (Acting) Task Manager : Ms. Pia Helene Schneider

v
Contents
Preface................................................................................................................................ xi
Summary .......................................................................................................................... xiii
1. Introduction and Context ................................................................................................ 1
Issues in Higher Education ............................................................................................. 1
Bank Support for Higher Education and Latin America and the Caribbean Projects .... 4
Project Development Objectives and Design Features ................................................... 6
2. Was the Bank’s Support for Higher Education Reform Relevant? ................................ 6
Relevance to Country Needs ........................................................................................... 7
Relevance of Project Designs ......................................................................................... 7
3. Main Findings ................................................................................................................. 8
Project Comparison ......................................................................................................... 8
Evaluation Questions ...................................................................................................... 8
Broadening Access and improving Equity ..................................................................... 9
Raising the Quality of Higher Education ...................................................................... 13
Improving Skill Levels of the Labor Force................................................................... 13
Improving the Effectiveness of the Innovation System ................................................ 15
4. Lessons .......................................................................................................................... 18
References ......................................................................................................................... 21
Annex A. Chile Lifelong Learning and Training Project, 2002–09 (L71060) ................. 33
Principal Ratings ........................................................................................................... 33
Key Staff Responsible................................................................................................... 33
Summary ....................................................................................................................... 34
1. Background and Context........................................................................................ 35
2. Objectives, Design, and their Relevance ............................................................... 36
Objectives ................................................................................................................. 36
Design ....................................................................................................................... 37
3. Implementation ...................................................................................................... 38
4. Achievement of the Objectives .............................................................................. 40
5. Efficiency ............................................................................................................... 43
6. Ratings ................................................................................................................... 43
This report was prepared by Pia Schneider and Mauricio Carrizosa who assessed the project in April-May 2011. The report was peer reviewed by Toby Linden and panel reviewed by Christopher Gerrard. Viktoriya Yevsyeyeva provided administrative support.

vi
Outcome .................................................................................................................... 43
Risk to Development Outcome ................................................................................. 43
Monitoring and Evaluation ....................................................................................... 44
Bank Performance ..................................................................................................... 46
Borrower Performance .............................................................................................. 46
7. Lessons ................................................................................................................... 47
Appendix A.1. Basic Data Sheet - Chile Lifelong Learning and Training Project (L71060) ....................................................................................................................... 49
Appendix A.2. List of Persons Met .............................................................................. 52
Appendix A.3. Additional Tables ................................................................................ 54
Appendix Table A3.1. Outputs of the Chile Lifelong Learning and Training Program54
Appendix Table A3.2. Adult Education Level Indicators: 2002-08 ............................. 55
Annex B. Chile Science for the Knowledge Economy Project, 2003–07 (L71720) ........ 56
Principal Ratings ........................................................................................................... 56
Key Staff Responsible................................................................................................... 56
Summary ....................................................................................................................... 57
1. Background and Context........................................................................................ 58
2. Objectives, Design, and their Relevance ............................................................... 58
Objectives ................................................................................................................. 58
Design ....................................................................................................................... 60
3. Implementation ...................................................................................................... 61
4. Achievement of the Objectives .............................................................................. 63
Improve the effectiveness of the Chile’s innovation system .................................... 63
Improve the Stock of Human Capital in the S&T Sector ......................................... 66
5. Efficiency ............................................................................................................... 67
6. Ratings ................................................................................................................... 68
Outcome .................................................................................................................... 68
Risk to Development Outcome ................................................................................. 68
Monitoring and Evaluation ....................................................................................... 68
Bank Performance ..................................................................................................... 69
Borrower Performance .............................................................................................. 70
7. Lessons ................................................................................................................... 71
Appendix B.1. Chile – Science for the Knowledge Economy Project (L71720) ......... 72
Appendix B.2. List of Persons Met ............................................................................... 75
Annex C. Colombia Higher Education – Improving Access Project, 2002–08 (L71550) 77
vii
Principal Ratings ........................................................................................................... 77
Key Staff Responsible................................................................................................... 77
Summary ....................................................................................................................... 78
1. Background and Context........................................................................................ 79
2. Objectives and Design ........................................................................................... 79
Objectives ................................................................................................................. 79
Design ....................................................................................................................... 80
3. Implementation ...................................................................................................... 82
4. Achievement of the Objectives .............................................................................. 84
Improving the Equity of the Tertiary Education System .......................................... 84
Improve the Quality of the Higher Education System .............................................. 86
5. Efficiency ............................................................................................................... 88
6. Ratings ................................................................................................................... 89
Outcome .................................................................................................................... 89
Risk to Development Outcome ................................................................................. 89
Monitoring and Evaluation ....................................................................................... 89
Bank Performance ..................................................................................................... 91
Borrower Performance .............................................................................................. 92
7. Lessons ................................................................................................................... 92
Appendix C.1. Colombia - Higher Education Improving Access Project (L71550) .... 94
Appendix C.2. List of Persons Met ............................................................................... 98
Tables
Table 1. Development Objectives of Selected Projects………………………………...…6 Table 2. Projects by Country, Subsector Theme, and Components………….……………9 Table A.1. Lifelong Learning and Training Project: Results Chain……………………..37 Table A.2. Lifelong Learning and Training Project: Planned and Actual Expenditures (US$ millions) ……………………………………………………………………………39 Table A.3. Lifelong Learning and Training Project: M&E Activities…………………...45 Table A3.1. Outputs of the Chile Lifelong Learning and Training Program……………54 Table A3.2. Adult Education Level Indicators: 2002-08………………………………...55 Table B.1. Science for the Knowledge Economy Project: Results Chain……………….61 Table B.2. Chile: CONYCIT and Bank-Funded Scholarships, PhD Enrollment and PhD Labor Force………………………………………………………………………………66 Table C.1. Higher Education - Improving Access Project: Results Chain………………82 Table C.2. Higher Education Improving Access Project: M&E Activities……………...91
viii
Figures
Figure 1. Enrollment in Higher Education: 2002 versus 2009 (% gross)…………………2 Figure 2. Youth Unemployment and Growth, 2001–11…………………………………..3 Figure 3. Chile and Colombia - Per Capita GDP: 1980–2010 (PPP prices, percent of Latin America and the Caribbean per capita GDP)……………………………………………..5 Figure 4. Research and Development Expenditures, Circa 2006 (percent of GDP)……..16 Figure A.1. Chile – Enrollment and Years of Education of the Labor Force, 1990–2008………………………………………………………………………………………41 Figure B.1. Science for the Knowledge Economy: Indicators of Project Outcomes, 1996-2008………………………………………………………………………………………65 Figure C.1. Colombia – Gross Enrollment in Tertiary Education (Percent): 1990-2010..85 Figure C.2. Number of Accredited Higher Education Programs………………………...88

ix
IEG Mission: Improving World Bank Group development results through excellence in evaluation.
About this Report
The Independent Evaluation Group assesses the programs and activities of the World Bank for two purposes: first, to ensure the integrity of the Bank’s self-evaluation process and to verify that the Bank’s work is producing the expected results, and second, to help develop improved directions, policies, and procedures through the dissemination of lessons drawn from experience. As part of this work, IEG annually assesses 20-25 percent of the Bank’s lending operations through field work. In selecting operations for assessment, preference is given to those that are innovative, large, or complex; those that are relevant to upcoming studies or country evaluations; those for which Executive Directors or Bank management have requested assessments; and those that are likely to generate important lessons.
To prepare a Project Performance Assessment Report (PPAR), IEG staff examine project files and other documents, visit the borrowing country to discuss the operation with the government, and other in-country stakeholders, and interview Bank staff and other donor agency staff both at headquarters and in local offices as appropriate.
Each PPAR is subject to internal IEG peer review, Panel review, and management approval. Once cleared internally, the PPAR is commented on by the responsible Bank department. The PPAR is also sent to the borrower for review. IEG incorporates both Bank and borrower comments as appropriate, and the borrowers' comments are attached to the document that is sent to the Bank's Board of Executive Directors. After an assessment report has been sent to the Board, it is disclosed to the public.
About the IEG Rating System for Public Sector Evaluations
IEG’s use of multiple evaluation methods offers both rigor and a necessary level of flexibility to adapt to lending instrument, project design, or sectoral approach. IEG evaluators all apply the same basic method to arrive at their project ratings. Following is the definition and rating scale used for each evaluation criterion (additional information is available on the IEG website: http://worldbank.org/ieg).
Outcome: The extent to which the operation’s major relevant objectives were achieved, or are expected to be achieved, efficiently. The rating has three dimensions: relevance, efficacy, and efficiency. Relevance includes relevance of objectives and relevance of design. Relevance of objectives is the extent to which the project’s objectives are consistent with the country’s current development priorities and with current Bank country and sectoral assistance strategies and corporate goals (expressed in Poverty Reduction Strategy Papers, Country Assistance Strategies, Sector Strategy Papers, Operational Policies). Relevance of design is the extent to which the project’s design is consistent with the stated objectives. Efficacy is the extent to which the project’s objectives were achieved, or are expected to be achieved, taking into account their relative importance. Efficiency is the extent to which the project achieved, or is expected to achieve, a return higher than the opportunity cost of capital and benefits at least cost compared to alternatives. The efficiency dimension generally is not applied to adjustment operations. Possible ratings for Outcome: Highly Satisfactory, Satisfactory, Moderately Satisfactory, Moderately Unsatisfactory, Unsatisfactory, Highly Unsatisfactory.
Risk to Development Outcome: The risk, at the time of evaluation, that development outcomes (or expected outcomes) will not be maintained (or realized). Possible ratings for Risk to Development Outcome: High, Significant, Moderate, Negligible to Low, Not Evaluable.
Bank Performance: The extent to which services provided by the Bank ensured quality at entry of the operation and supported effective implementation through appropriate supervision (including ensuring adequate transition arrangements for regular operation of supported activities after loan/credit closing, toward the achievement of development outcomes. The rating has two dimensions: quality at entry and quality of supervision. Possible ratings for Bank Performance: Highly Satisfactory, Satisfactory, Moderately Satisfactory, Moderately Unsatisfactory, Unsatisfactory, Highly Unsatisfactory.
Borrower Performance: The extent to which the borrower (including the government and implementing agency or agencies) ensured quality of preparation and implementation, and complied with covenants and agreements, toward the achievement of development outcomes. The rating has two dimensions: government performance and implementing agency(ies) performance. Possible ratings for Borrower Performance: Highly Satisfactory, Satisfactory, Moderately Satisfactory, Moderately Unsatisfactory, Unsatisfactory, Highly Unsatisfactory.

xi
Preface
This report provides lessons of experience and reflects the findings from a thematic cluster of Project Performance Assessment Reports on three higher education projects in Chile and Colombia. In both countries, support for higher education has been considered a key ingredient to improve both equity and competiveness. The report also contributes to the Independent Evaluation Group’s (IEG) forthcoming evaluation of the World Bank Group’s support for youth employment, which focuses on contributions of education and other policies to the employability and earnings of the young. Following a summary of the overall report, Chapters 1 and 2 discuss higher education issues and the relevance of the projects to higher education country conditions and Bank strategy. The thematic overview (Chapter 3) pulls together evidence from the analysis of the three operations. These include the Chile Lifelong Learning and Training Project ($219 million, 2002-2009), the Colombia Higher Education Improving Access Project ($460 million, 2002-2008), and the Chile Science for the Knowledge Economy Project ($52 million, 2003-2007). These assessments have not previously been published and form Appendixes A, B, and C of this report. The report was prepared by Mauricio Carrizosa and is based on the Implementation Completion Reports, Staff Appraisal Reports, Loan Agreements, and a review of Bank files for the three projects. An IEG mission visited Colombia and Chile in April–May 2011 and interviewed a number of stakeholders, including representatives of the government and the implementing agencies, local and headquarters Bank staff, former staff in charge of the projects, officials of higher education institutions, academicians, and other higher education experts. Each appendix provides a list of people. Their feedback, cooperation, and assistance are gratefully acknowledged.
Following standard IEG procedures, the draft reports for the three projects were sent separately to the concerned government officials and agencies for their review and comments before being finalized. No comments were received.

xiii
Summary
This report assesses and compares the results of three higher education projects in Chile and Colombia: the Chile Lifelong Learning and Training Project (henceforth “Chile Lifelong Learning Project,” 2002-2009), the Chile Science for the Knowledge Economy Project (henceforth “Chile Knowledge Economy Project,” 2003-2007), and the Colombia Higher Education-Improving Access Project (henceforth “Colombia Higher Education Project,” 2002-2008). They were selected for comparison because their design and implementation suggested that useful lessons could be drawn on the impacts of support for adult and higher education. Although the projects focused on different education levels, their intended impacts on access and quality and their links to the labor market and the knowledge economy offered common ground for comparison.
Project Objectives
The Chile Lifelong Learning Project focused on improving lifelong education to upgrade the skill level of the Chilean workforce. The Colombia Higher Education Project focused on improving the quality and equity of undergraduate and graduate education. And at the highest education levels, the Chile Knowledge Economy Project focused on graduate education and research activities to improve innovation.
Project Achievements
Chile Lifelong Learning and Training Project. To improve skills, the project envisaged three components: (i) a flexible primary and secondary adult education program combined with several adult training initiatives; (ii) provision of technical-professional education through emerging regional networks that were to use technical-curricular pathways (mapping the progression from technical-secondary to technical-professional education); (iii) development of a system of vocational-professional pathways (skill/competencies progression maps to link technical-professional education with training), based on the competencies required by the labor market, and four management information systems to provide information on job vacancies, vocational orientation, labor market research findings, and project services.
The adult education services helped raise adult education levels as well as adult skills, earnings and employability. On the other hand, little progress was achieved in implementing the intended technical education services. The design for the delivery of these services was excessively complex and did not suffice to actually deliver the services.
Chile Science for the Knowledge Economy Project. To improve human capital for science and technology and the effectiveness of its innovation system, this project envisaged three components: (i) technical assistance and capacity-building on strategy, policies and awareness for innovation and human capital, and on monitoring and evaluation capacity; (ii) grants for research conducted by research institutes and research teams, scholarships for doctoral students and grants for acquisition of major scientific equipment; and (iii) grants for cooperative research (consortia and teams), scholarships for doctoral students
xiv
and post-doctoral researchers conducting research in industry, and additional costs of participation by Chilean researchers and industry in international research projects.
Doctoral education and research under the project contributed to human capital formation for the science and technology (S&T) sector. Scholarship recipients benefited from significant increases in earnings and employability and raised the S&T stock of human capital. However, the outcomes from the major modes of research (for example, research consortia) remain uncertain. More importantly, development of an S&T strategy failed to translate into the policies needed to achieve the boost in S&T expenditures that was intended.
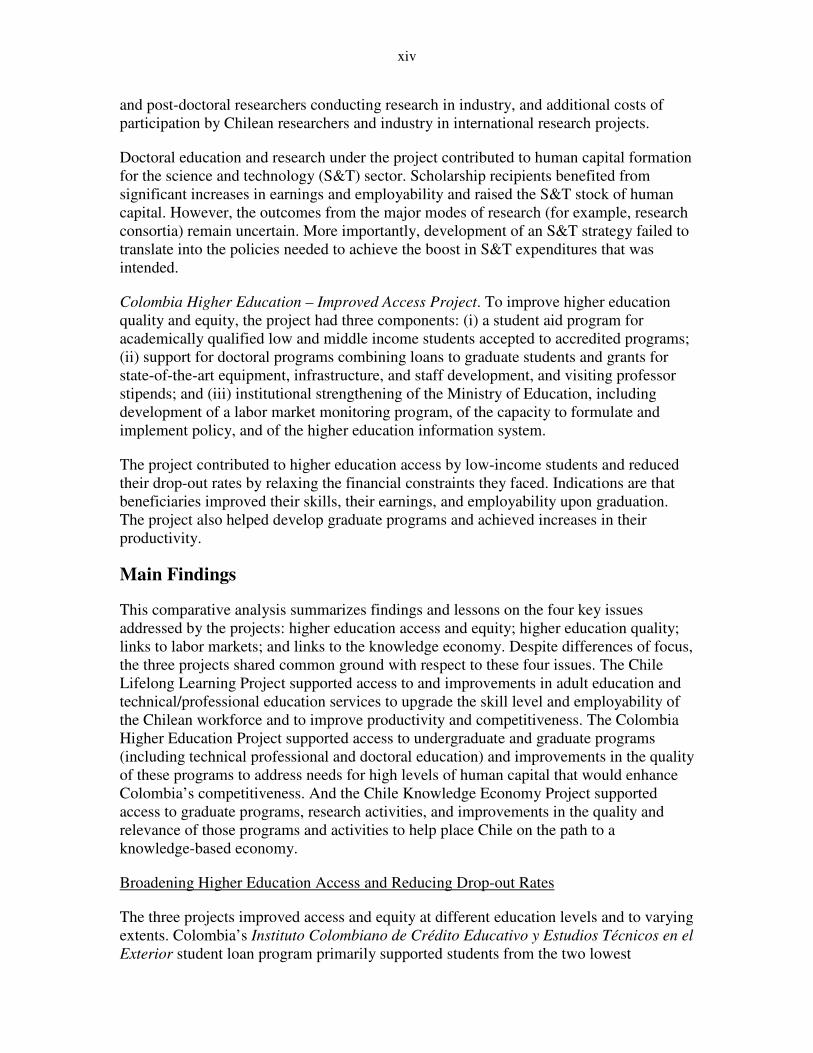
Colombia Higher Education – Improved Access Project. To improve higher education quality and equity, the project had three components: (i) a student aid program for academically qualified low and middle income students accepted to accredited programs; (ii) support for doctoral programs combining loans to graduate students and grants for state-of-the-art equipment, infrastructure, and staff development, and visiting professor stipends; and (iii) institutional strengthening of the Ministry of Education, including development of a labor market monitoring program, of the capacity to formulate and implement policy, and of the higher education information system.
The project contributed to higher education access by low-income students and reduced their drop-out rates by relaxing the financial constraints they faced. Indications are that beneficiaries improved their skills, their earnings, and employability upon graduation. The project also helped develop graduate programs and achieved increases in their productivity.
Main Findings
This comparative analysis summarizes findings and lessons on the four key issues addressed by the projects: higher education access and equity; higher education quality; links to labor markets; and links to the knowledge economy. Despite differences of focus, the three projects shared common ground with respect to these four issues. The Chile Lifelong Learning Project supported access to and improvements in adult education and technical/professional education services to upgrade the skill level and employability of the Chilean workforce and to improve productivity and competitiveness. The Colombia Higher Education Project supported access to undergraduate and graduate programs (including technical professional and doctoral education) and improvements in the quality of these programs to address needs for high levels of human capital that would enhance Colombia’s competitiveness. And the Chile Knowledge Economy Project supported access to graduate programs, research activities, and improvements in the quality and relevance of those programs and activities to help place Chile on the path to a knowledge-based economy.
Broadening Higher Education Access and Reducing Drop-out Rates
The three projects improved access and equity at different education levels and to varying extents. Colombia’s Instituto Colombiano de Crédito Educativo y Estudios Técnicos en el Exterior student loan program primarily supported students from the two lowest

xv
socioeconomic groupings. Higher education enrollment accelerated after the program was introduced. It is likely that a part of this acceleration was attributable to the program for two reasons. First, some of its low-income beneficiaries might not have enrolled at all in the absence of financial assistance that was not available elsewhere, particularly for low income students with no collateral to offer. Second, as shown by two impact evaluations, the program reduced drop-out rates of beneficiaries and therefore contributed to lengthen enrollment. Accordingly, the project contributed to an increase in higher education enrollment (gross basis) from an average of 24.3 percent during 2001-04 to 29.4 percent in 2009. Nevertheless, despite its achievements, higher education drop-out rates remained pervasive and a focus of government higher education policy.
The Chile Lifelong Learning Project made little or no progress in improving higher education access. It intended to develop access to a novel delivery of technical education that linked its different levels from secondary technical to technical professional and, through training, to labor markets. The delivery of this novel technical education and training failed to develop because it depended on a competencies system that was only partially developed during the project; and because the networks lacked capacity or authority to coordinate their multiple constituents (technical secondary schools, tertiary technical-professional institutions, training providers, and employers and unions) that needed to be coordinated. The funding paid for inputs and technical assistance and was hardly linked to actual education delivered. Chile made considerable progress in expanding technical higher education enrollment, but this expansion was due to public funding of existing institutions, not to the networks or under the proposed novel approach.
In contrast, the Chile Lifelong Learning Project helped improve access to adult education. Its ChileCalifica program delivered education to 250,000 low-income students during 2003–08. It provided a flexible adult education alternative with a better curriculum; decentralized and independent testing and certification; free tuition, textbooks, and other educational materials; and flexible hours and close proximity of learning centers. It helped increase overall adult enrollment from 2003 - 2006. Unlike the regional networks, the government continues to sponsor the adult education program.
The Chile Knowledge Economy Project and Colombia Higher Education Project supported PhD (doctorate) students with scholarships (Chile) and loans (Colombia), as part of their strategy to improve science and technology. Although evaluations of the impact of scholarships and loans on access to graduate education are not available, the enrollment data suggest that this support may have contributed to the strong expansion of enrollment in national doctoral programs in both countries.
Increasing Higher Education Quality Outcomes
The three projects also sought better quality of education. Under the Colombia project, student loan beneficiaries performed better in tests than nonloan beneficiaries. The project also contributed to quality through its increased demand for enrollment at accredited institutions, as student eligibility for support hinged on acceptance to such institutions; and through improved faculty and research, a result of the project’s support for doctoral program development. The latter helped increase the share of PhDs in the
xvi
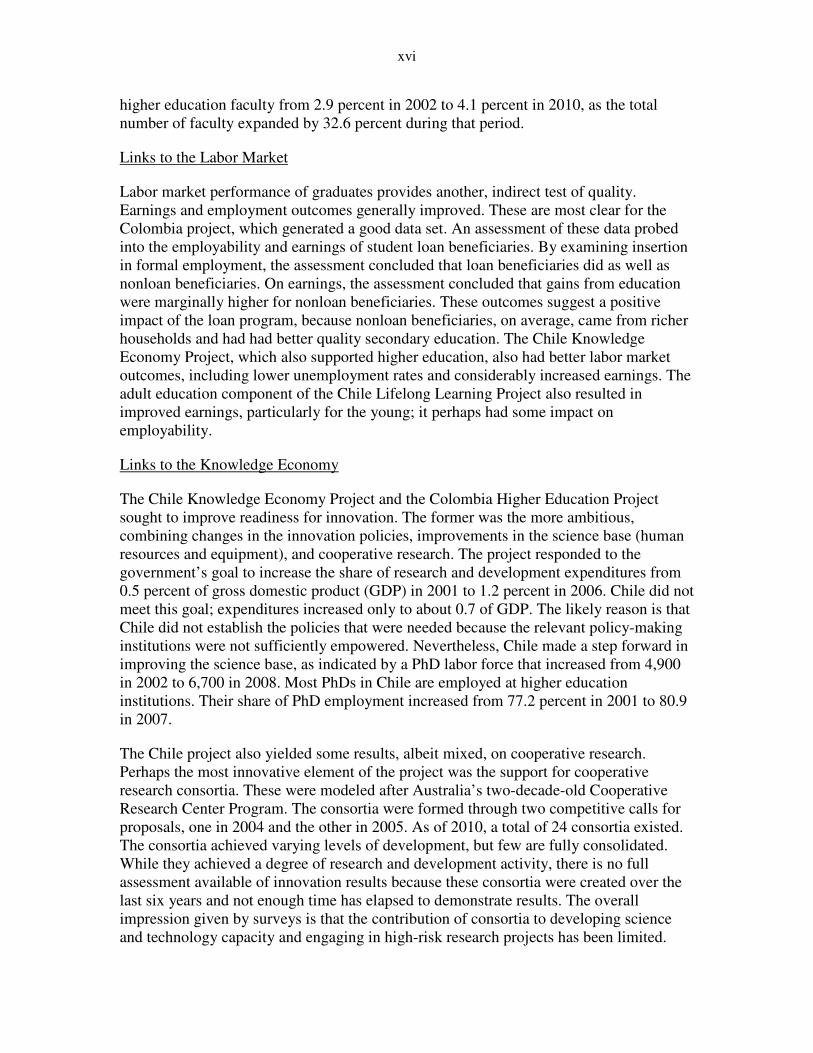
higher education faculty from 2.9 percent in 2002 to 4.1 percent in 2010, as the total number of faculty expanded by 32.6 percent during that period.
Links to the Labor Market
Labor market performance of graduates provides another, indirect test of quality. Earnings and employment outcomes generally improved. These are most clear for the Colombia project, which generated a good data set. An assessment of these data probed into the employability and earnings of student loan beneficiaries. By examining insertion in formal employment, the assessment concluded that loan beneficiaries did as well as nonloan beneficiaries. On earnings, the assessment concluded that gains from education were marginally higher for nonloan beneficiaries. These outcomes suggest a positive impact of the loan program, because nonloan beneficiaries, on average, came from richer households and had had better quality secondary education. The Chile Knowledge Economy Project, which also supported higher education, also had better labor market outcomes, including lower unemployment rates and considerably increased earnings. The adult education component of the Chile Lifelong Learning Project also resulted in improved earnings, particularly for the young; it perhaps had some impact on employability.
Links to the Knowledge Economy
The Chile Knowledge Economy Project and the Colombia Higher Education Project sought to improve readiness for innovation. The former was the more ambitious, combining changes in the innovation policies, improvements in the science base (human resources and equipment), and cooperative research. The project responded to the government’s goal to increase the share of research and development expenditures from 0.5 percent of gross domestic product (GDP) in 2001 to 1.2 percent in 2006. Chile did not meet this goal; expenditures increased only to about 0.7 of GDP. The likely reason is that Chile did not establish the policies that were needed because the relevant policy-making institutions were not sufficiently empowered. Nevertheless, Chile made a step forward in improving the science base, as indicated by a PhD labor force that increased from 4,900 in 2002 to 6,700 in 2008. Most PhDs in Chile are employed at higher education institutions. Their share of PhD employment increased from 77.2 percent in 2001 to 80.9 in 2007.
The Chile project also yielded some results, albeit mixed, on cooperative research. Perhaps the most innovative element of the project was the support for cooperative research consortia. These were modeled after Australia’s two-decade-old Cooperative Research Center Program. The consortia were formed through two competitive calls for proposals, one in 2004 and the other in 2005. As of 2010, a total of 24 consortia existed. The consortia achieved varying levels of development, but few are fully consolidated. While they achieved a degree of research and development activity, there is no full assessment available of innovation results because these consortia were created over the last six years and not enough time has elapsed to demonstrate results. The overall impression given by surveys is that the contribution of consortia to developing science and technology capacity and engaging in high-risk research projects has been limited.

xvii
The Colombia Higher Education Project was less ambitious, as it focused only on developing doctoral programs to improve the science base and the quality of higher education. An assessment suggested increased graduation and publication rates of doctoral programs, as well as rates of graduates entering doctoral programs, all measures of doctoral program development outcomes. The analysis highlighted how program groups (the unit that the project supported) contribute to outcomes, as knowledge is developed in a group environment where individuals interact.
Lessons
This report draws the following lessons that may help in the design and implementation of adult and higher education projects:
Broadening Higher Education Access and Reducing Drop-out Rates
• Student loans to low-income beneficiaries can help increase their enrollment in and graduation from higher education for two reasons. First, some low-income youth may not enroll in higher education in the absence of financial assistance, particularly those with no collateral to submit to commercial lenders. Second, as shown by two impact evaluations, student loans may reduce drop-out rates of beneficiaries and therefore contribute to longer enrollment periods.
• A diagnosis of drop-out rates and of the key measures to address them needs to be a key ingredient of education programs. Student drop-out rates undermine enrollment and links to the labor market, as non-graduation adversely affects individual enrollment duration (the average years of enrollment) and earnings. While student loans helped curb dropout rates, a diagnosis of those rates may help identify, as in Colombia, the need for other actions, including remedial programs and counseling.
• Coordination from the top down to strengthen the links among different levels and providers of technical education may be difficult to implement, as shown by the Chile networks program, due to the multiple stakeholders involved and the difficulty of developing a curricular common ground (i.e., a system of competencies). A better design may focus more strongly on accreditation of providers, while relying more on providers to identify the demand for skills by firms and the demand for technical education and training by students and workers.
Improving Higher Education Quality Outcomes
• Improvements in higher education quality outcomes can be achieved through a variety of policies on the “demand” or student side. Student loans are among these policies. As suggested by the Colombia Higher Education Project, student loans to low-income students may improve test results in part because the loans reduce student workloads and because students are selected based on their academic records and on admittance to accredited institutions. Other policies that may improve higher education quality include support for doctoral programs (to improve the higher education faculty) and a stronger accreditation framework.

xviii
• Projects can improve quality outcomes by linking them to funding. The Chile flexible education program achieved better adult education by linking funding to adult education outcomes. The Chile technical and vocational education and training efforts failed in this respect because those outcomes (improved links between technical education levels and to labor market needs) were not well developed.
Strengthening Links to the Labor Market
• Adult education, often thought to be too costly relative to impact, can be made to work with adequate attention to curricular design, flexibility of delivery, and credibility of testing and certification. In particular, curricular designs need take into account past adult learning; delivery needs to be flexible in terms of class hours and available sites; and the credibility of the program may be strengthened through testing administration by independent parties.
• More efforts are necessary to assess potential impacts of education on earnings. Although education is likely to improve earnings, impact will vary considerably. Project Appraisal Documents assessed returns to education, but these assessments did not allow for project specificities. In the Chile Lifelong Learning Project, for example, little consideration was given to the actual evidence on the impact of adult education on incomes, where the limited cross-country evidence is particularly conflicting. Nevertheless, the projects themselves provided new evidence on earnings, albeit of varying quality. Continuous tracking studies, such as the Labor Market Observatory established in Colombia and a similar arrangement in Chile, have been useful. Impact evaluations are also likely to be useful, particularly if robust data collection strategies are designed from the outset.
Links to the Knowledge Economy
• Support for doctoral programs is likely to result in an increased human capital base for innovation. An assessment of the Higher Education Project concluded that scholarships and investment grants for doctoral programs increased publication and graduation rates. Chile’s Knowledge Economy Project suggests a similar outcome.
• Improvements in the effectiveness of the innovation system are likely to require more than supply driven support for human resources and innovation grants. Although this support is important, increasing innovation will need a wide range of policies to raise demand, including tax, trade, and patent law policies. A report by a Government-appointed Committee highlighted policies covering life–long learning, a science and technology system oriented towards social needs, and a proactive and innovative business enterprise sector.
Marvin Taylor-Dormond Acting Director-General
Evaluation

1
1. Introduction and Context
1.1 This report is a comparative Project Performance Assessment Report of three higher education projects in two Latin American countries (Chile and Colombia), implemented during the last decade and recently completed: the Chile Lifelong Learning and Training Project (henceforth “Chile Lifelong Learning Project,” approved in 2002), the Chile Science for the Knowledge Economy Project (henceforth “Chile Knowledge Economy Project,” approved in 2003), and the Colombia Higher Education-Improving Access Project (henceforth “Colombia Higher Education Project,” approved in 2002).
1.2 The objective of this report is to obtain findings and develop lessons in two areas. The first area is the extent to which these three projects met their stated objectives. The second is the effectiveness of higher education reforms supported by the projects and the adaptation of the lessons from global practice in such reforms to the specific conditions of the two countries. Together with other higher education project assessments covering other regions, it will provide input into the Independent Evaluation Group’s (IEG) ongoing evaluation on youth employment and skills building.
Issues in Higher Education
1.3 Higher education reforms in Chile and Colombia during the first decade of the century addressed similar core issues: low coverage and equity, poor learning outcomes, inadequate skills, and weak links to the knowledge economy.
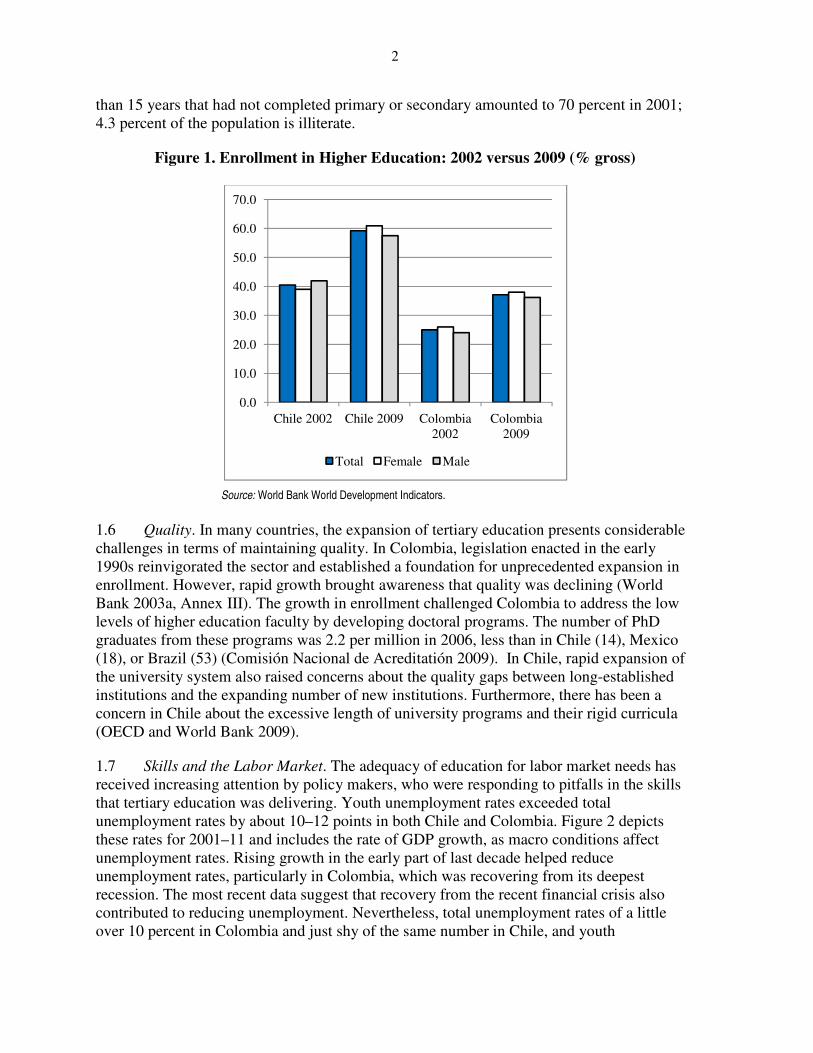
1.4 Coverage and equity. In both Chile and Colombia, tertiary enrollment increased during the last decade Figure 1, with Colombia’s enrollment at around the average for Latin America and Chile’s well above it. In both countries, raising enrollment in higher education was viewed as key to economic development, growth, and equity and a natural response to the advances that had been achieved in basic and secondary education. In Colombia, where the higher education enrollment issue was more acute, the substantial improvements in access to basic and secondary education in the 1990s faced a bottleneck at the gate of post-secondary education. In 2002, secondary enrollment on a gross basis (73.4 percent) was almost three times higher than tertiary enrollment (25.0 percent). This gap was also significant in Chile, with secondary enrollment (85.6 percent) a little more than twice that of tertiary enrollment (40.5 percent). As secondary enrollment in both countries approached full coverage (90 percent today), both countries increasingly focused on raising access to higher education.
1.5 Inequity was closely linked to shortfalls in overall access. Not only low-income youth were being prevented from improving their skills, but a large share of the adult population had been left behind in education. In Colombia, the largest gains in coverage in the 1990s occurred for those students belonging to the highest fifth in the income distribution, where net enrollment had increased from 23 percent to 40 percent; in contrast, less than six percent of the 18- to 24-year-olds from the first quintile attended higher education institutions. This increasing inequality of access corresponded to the experience in other countries that had introduced or raised fees without an effective or well-targeted student aid mechanism in place. In Chile, where secondary enrollment is 90 percent (gross basis), the population older
2
than 15 years that had not completed primary or secondary amounted to 70 percent in 2001; 4.3 percent of the population is illiterate.
Figure 1. Enrollment in Higher Education: 2002 versus 2009 (% gross)
Source: World Bank World Development Indicators.
1.6 Quality. In many countries, the expansion of tertiary education presents considerable challenges in terms of maintaining quality. In Colombia, legislation enacted in the early 1990s reinvigorated the sector and established a foundation for unprecedented expansion in enrollment. However, rapid growth brought awareness that quality was declining (World Bank 2003a, Annex III). The growth in enrollment challenged Colombia to address the low levels of higher education faculty by developing doctoral programs. The number of PhD graduates from these programs was 2.2 per million in 2006, less than in Chile (14), Mexico (18), or Brazil (53) (Comisión Nacional de Acreditatión 2009). In Chile, rapid expansion of the university system also raised concerns about the quality gaps between long-established institutions and the expanding number of new institutions. Furthermore, there has been a concern in Chile about the excessive length of university programs and their rigid curricula (OECD and World Bank 2009).
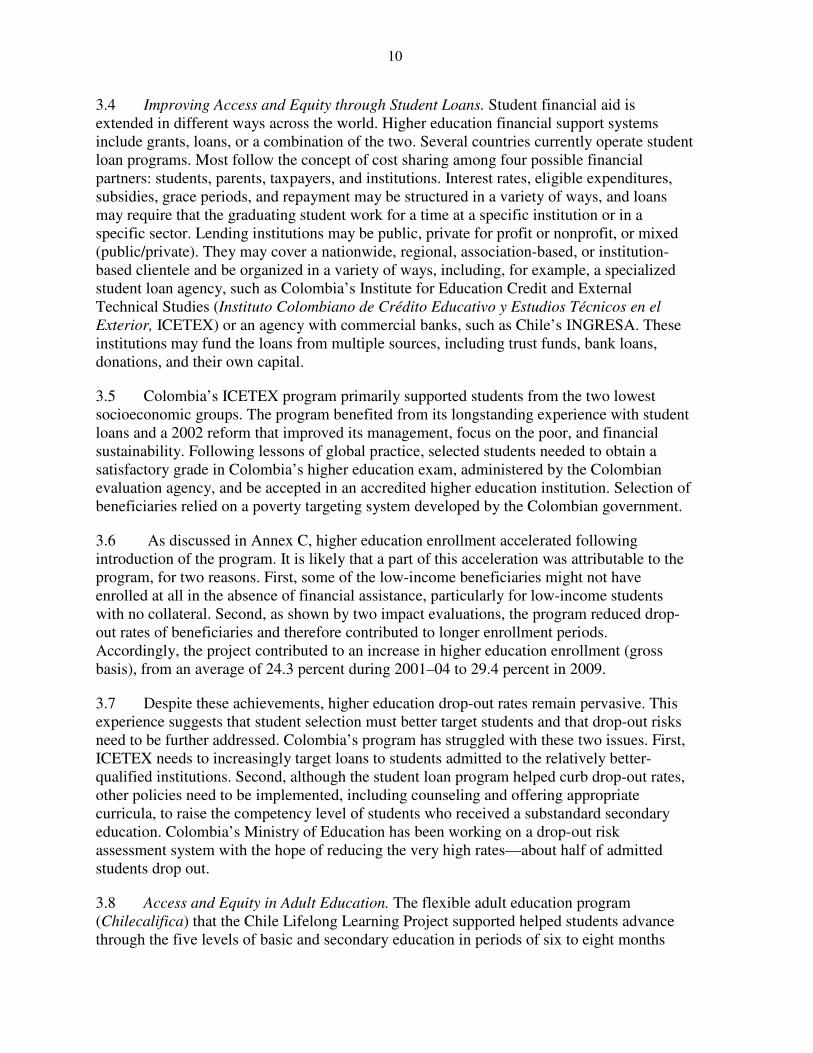
1.7 Skills and the Labor Market. The adequacy of education for labor market needs has received increasing attention by policy makers, who were responding to pitfalls in the skills that tertiary education was delivering. Youth unemployment rates exceeded total unemployment rates by about 10–12 points in both Chile and Colombia. Figure 2 depicts these rates for 2001–11 and includes the rate of GDP growth, as macro conditions affect unemployment rates. Rising growth in the early part of last decade helped reduce unemployment rates, particularly in Colombia, which was recovering from its deepest recession. The most recent data suggest that recovery from the recent financial crisis also contributed to reducing unemployment. Nevertheless, total unemployment rates of a little over 10 percent in Colombia and just shy of the same number in Chile, and youth
0.0
10.0
20.0
30.0
40.0
50.0
60.0
70.0
Chile 2002 Chile 2009 Colombia 2002
Colombia 2009
Total Female Male

3
unemployment of around 20 percent in both countries, have remained rather rigid, and macro or other policies have been unsuccessful in breaking past them.
1.8 Colombia ranked second (only marginally below Puerto Rico) in total unemployment levels among 20 countries in the Americas for which data are available for 2008. It is at the very top in total female unemployment and third in youth female unemployment. Male youth unemployment does not fare much better (fourth). Chile’s unemployment performance is somewhat better, but it still ranks high among those countries.
Figure 2. Youth Unemployment and Growth, 2001–11
Source: INE. Source: DANE.
1.9 Adult unemployment rates depend on educational accomplishment. In Colombia, unemployment rises with education levels until completed secondary education and remains at about the same level through incomplete higher education. It declines sharply for those who complete higher education: from 18.3 percent for those who complete secondary to 10.1 percent for those who get a higher education. For Chile, the decline in unemployment from those with only a secondary education (9.1 percent) to those with higher education (7.5 percent) is much smaller.1
1.10 Employability also depends on the field of study; this reflects differences in relevance to labor markets. In Chile, for 2005 university graduates, the likelihood of getting a job the second year after graduation ranged from 34 percent (actors) to 100 percent (nurses).
1 World Bank World Development Indicators..
Chile Colombia
-5
0
5
10
15
20
25
2001
-I20
01-I
II20
02-I
2002
-III
2002
-I20
03-I
II20
04-I
2004
-III
2005
-I20
05-I
II20
06-I
2006
-III
2007
-I20
07-I
II20
08-I
2008
-III
2009
-I20
09-I
II20
10-I
2010
-III
2011
-I
Year-Quarter
Unemployment (Age 15-24)Unemployment (Total)GDP Growth
0.0
5.0
10.0
15.0
20.0
25.0
30.0
2001
-I20
01-I
II20
02-I
2002
-III
2002
-I20
03-I
II20
04-I
2004
-III
2005
-I20
05-I
II20
06-I
2006
-III
2007
-I20
07-I
II20
08-I
2008
-III
2009
-I20
09-I
II20
10-I
2010
-III
2011
-I
Year-Quarter
Unemployment (Ages 14-26)Unemployment (Total)GDP Growth

4
A similar range applied to technical professional graduates (Government of Chile Ministry of Education 2011).
1.11 In Colombia, graduates from technical institutions experienced difficulties finding a job after graduation because of the low relevance of skills taught and the inferior quality of some of the educational institutions. In Chile, the lack of relevant technical-professional education of appropriate quality also undermined employment. The plight of technical education appeared deeper in Colombia, with undergraduate enrollment only at 11 percent, compared with 27 percent in Chile. Colombia further gave low priority to technical disciplines, with less than 15 percent of students at the master's level enrolled in the natural sciences, engineering, and agricultural sciences, compared with 34 percent for the Latin America and the Caribbean Region and 39 percent for the United States.
1.12 Links to the knowledge economy. In both Chile and Colombia, faltering total factor productivity growth (GDP growth in excess of the level accounted for by increases in labor and capital) raised an interest in policies that would increase innovation, generally thought to be a key source of productivity growth. Although the two countries’ economic growth rates have been quite different during the last three decades, in both countries productivity growth has faltered. As Figure 3 indicates, per capita GDP (measured at purchasing power parity) in both countries in 1980 was at about the same level—about 70 percent of the Latin American average. Driven by total factor productivity growth and trade, GDP growth in Chile reached sustained higher levels from the mid-1980s to the late-1990s. By 2009, Chile’s per capita GDP level was 34.3 percent above Latin America’s average. In contrast, Colombia’s had advanced only to 83.7 percent of the average. But Chile’s relative advance slowed after 2003, and Colombia’s total factor productivity growth was nil during the first half of the 1990s, was negative during the recession of the second half of the 1990s, and then recovered during 2000–06 (Jorgenson 2008, p. 16).
Bank Support for Higher Education and Latin America and the Caribbean Projects
1.13 Bank support for higher education was predicated on a model that the Bank developed in the mid-1990s and refined at the turn of the century. Policies under this model sought several things for higher education institutions: autonomy and accountability; quality assurance and accreditation; transparent financing (formula funding based on student numbers and characteristics), usually under a finance council; competition for research and investment funding (usually under a research council); increased use of information and communication technology in teaching and management; differentiated missions among colleges (short-cycle labor market) and universities (long cycle and research programs); diversified finance (including government subsidies); cost recovery (of tuition) combined with loans and scholarships for needy students; and adequate governance for overall system coordination and oversight (IEG 2011d, p. 8).

5
Figure 3. Chile and Colombia - Per Capita GDP: 1980–2010 (PPP prices, percent of Latin America and the Caribbean per capita GDP)
Source: World Bank Development Indicators. Note: GDP = gross domestic product; PPP = Purchasing Power Parity
1.14 The projects reviewed supported higher education reforms along the lines outlined above, although they were sometimes applied to other education levels. A component of the Chile Lifelong Learning Project, for example, provided financing for low-income adult primary and secondary education based on the number of students completing course modules. Both the Chile Knowledge Economy Project and Colombia Higher Education Project provided competitive research or investment financing under a research council. And the Colombia Higher Education Project offered a mix of grants and loans to help needy students cover tuition and other costs. The Bank has viewed loans as a way to shift public resources from higher to lower education levels and to reduce the regressive fiscal impact of higher education expenditures. Nevertheless, the Bank also advocates grants to support academically qualified poor students.
1.15 But the projects also included innovative approaches that aimed to address their specific issues. The Chile Lifelong Learning Project devised networks to coordinate multiple stakeholders in the provision of better technical education. The Chile Knowledge Economy Project further applied the concept of an innovation system that the Bank had helped develop to help address lagging total factor productivity growth. And the Colombia Higher Education Project designed a package combining scholarships, equipment, and faculty development to improve doctoral programs.
0%
20%
40%
60%
80%
100%
120%
140%
160%
1980198219841986198819901992199419961998200020022004200620082010
Year
Chile Per Capita GDPColombia Per Capita GDP

6
Project Development Objectives and Design Features
1.16 The three projects’ development objectives (Table 1) focused on the relevant education levels as follows. At the lower educational levels, the Chile Lifelong Learning Project focused on improving lifelong education, including primary and secondary adult education and tertiary technical-professional education to upgrade the skill level of the workforce. At a higher level, the Colombia Higher Education Project focused on improving the quality and equity of the undergraduate and graduate education systems. And at the highest level, the Chile Knowledge Economy Project focused on graduate education and research to improve the country’s innovation system.
Table 1. Development Objectives of Selected Projects
Project Name Project Development Objective(s)
Chile Lifelong Learning and Training Project
(a) To reduce the deficit in the provision of lifelong education and training opportunities for young adults and adults, especially those who are unemployed or living in conditions of poverty and those who seek a second chance to improve their employability and quality of life. (b) To upgrade the skill level of the borrower's workforce and improve its productivity and competitiveness.
Colombia Higher Education – Increased Access Project
To improve the quality and equity of the borrower’s tertiary education system.
Chile Science for the Knowledge Economy Project
(a) To improve the effectiveness of the borrower’s innovation system. (b) To improve the stock of human capital in the Borrower’s science and technology sector.
Source: Schedules 2 of Loan Agreements.
1.17 The Chile Lifelong Learning Project was to achieve its objectives by establishing a new system of adult education and regional networks comprised by technical secondary schools, tertiary technical education institutions, training institutions, employers, and workers. The networks were to deliver articulated technical education based on a competency system to be developed under the project. The Chile Knowledge Economy Project was to establish science, technology, and innovation policies; and provide doctoral scholarships and cooperative research grants. And the Colombia Higher Education Project was to meet its objective through loans and grants to low-income students, doctoral program development grants, and institutional development of the Ministry of Education.
2. Was the Bank’s Support for Higher Education Reform Relevant?
2.1 Project relevance is examined from two points of view: (i) Were the project objectives relevant to country conditions and needs and to Bank strategies? (ii) Were the actions supported relevant to the objectives?

7
Relevance to Country Needs
2.2 Project objectives were aimed at the issues described above, with the Chile Lifelong Learning and Training Project objective addressing the existing deficit in the education of the labor force and the deficiencies in technical and vocational education and training (TVET); the Chile Knowledge Economy Project objective addressing Chile’s shortfalls in the resources deployed to science, technology, and innovation; and the Colombia Higher Education Project objective addressing the inequity and weak access to higher education.
2.3 The objectives were also congruent with government programs and Bank strategies and remained so as the projects closed. Since the early 1990s, Chile had launched, with the support of the Bank and other donors, a series of demand and supply-driven interventions to improve the efficiency, quality, and equity of public and private-subsidized basic and secondary education systems. At the turn of the century, the government decided to complement these efforts with an additional emphasis on upgrading skills and competences of the labor force by addressing the educational deficit of the adult population, especially those living below the poverty line. The government further decided to aim for an increase of its investments in research and development (R&D), from 0.5% of GDP to 1.2% by the year 2006, as a means to stimulate innovation and technological development. As the projects closed, the government remained committed to improving access to adult education, the quality of TVET, and science, technology, and innovation. In Colombia, the government that took office in 2002 decided to broaden student loans especially to assist poorer students and improve research capacity and higher education quality; it did this by providing incentives for doctoral students and young faculty to engage in research. Again, these objectives remained in place as the Bank project closed and the Bank approved a follow-up project in 2009. In both countries, Country Assistance Strategy and Country Partnership Strategy objectives throughout the decade were well aligned with the government policies outlined above.
Relevance of Project Designs
2.4 The fit of the projects to the objectives varied. The Chile Lifelong Learning and Training Project devised an effective means to deliver flexible adult education, but its design of regional networks failed to create a strong link to the delivery of improved TVET—the complexity of the networks and the delays in developing the competency system that was at the core of improved TVET did not allow this component to come to fruition. The Chile Knowledge Economy Project design was appropriate to increase human resources in the science and technology (S&T) sector, but its weak link to policy making could hardly achieve the policy changes needed to encourage the increased effectiveness of the innovation system the project sought. The Colombia Higher Education Project relied on a well-designed component that linked funding to increased equity in access to higher education and doctoral program development, its key objectives. Its somewhat weaker institutional component was not critical to the achievement of its objectives, which were already supported by government policies.

8
3. Main Findings
Project Comparison
3.1 Although the three projects focused on different education levels (Table 2), they all addressed the core higher education issues discussed above in one way or another: access and equity to education, quality of education, links to the labor market, and links to innovation and growth. The Chile Lifelong Learning and Training Project supported access to adult learning and improvements in technical professional education services in order to upgrade the skill level and employability of the Chilean workforce as well as improving its productivity and competitiveness. The Colombia Higher Education Project supported student access to undergraduate and graduate programs (including technical professional and doctoral education) and improvements in the quality of these. And the Chile Knowledge Economy Project supported student access to graduate programs and research activities and improvements in the quality and relevance of those programs and activities. Accordingly, the three projects addressed the core access, quality, and skills issues at different education levels: primary, secondary, and technical education in the Chile Lifelong Learning Project; undergraduate and graduate education in the Colombia Higher Education Project; and graduate and postdoctoral education in the Chile Knowledge Economy Project. With their education achievements, the projects expected to improve competitiveness and growth, the link to the knowledge economy.
Evaluation Questions
3.2 The comparative assessment that follows addresses the following two questions as they relate to the key issues that the projects focused on: access and equity of education, quality of education, skill levels of the labor force, and effectiveness of the innovation system:
• To what extent did the projects achieve their intended outcomes?
• What lessons do the projects suggest regarding the effectiveness of the skill-building reforms they supported, and how effective was the application of global practice in the projects?

9
Table 2. Projects by Country, Subsector Theme, and Components
Chile Colombia Chile
Project name
Lifelong Learning and Training Project (2002-2009)
Higher Education – Improving Access Project (2002-2008)
Science for the Knowledge Economy Project (2003-2007)
Actual Cost US$ 219.26 million US$200 million US$51.93 million
Lifelong learning (% of total cost)
Lifelong learning and training services: 48.1% Instruments to support lifelong learning and training services: 3.6%
Tertiary education (% of total cost)
Coverage of technical-professional Education: 30.7%
Student aid: 90.2% M&E: 0.3% Doctoral programs: 7.0%
Education reform and management (% of total cost)
Institutional Strengthening: 17.6%
Labor market monitoring program: 0.3% Institutional capacity to formulate and implement policy: 0.4% Higher education information management system: 0.7%
Research and Development (% of total cost)
Science, Technology And Innovation System: 20.8% Science Base: 62.3% Public private Science Linkages: 16.9%
Main Other Themes(% of total cost)
Project Management: 0.5% PPF Financing: 0.0%
Source: World Bank2007, World Bank 2009, and World Bank 2010.
Broadening Access and improving Equity
3.3 The three projects sought increased access to education, including access to adult education and technical education (Chile Lifelong Learning Project), tertiary education (Colombia Higher Education Project), and graduate education (Chile Knowledge Economy Project). Both the Chile Lifelong Learning Project and the Colombia project also sought improvements in equity of access. The Colombia Higher Education Project had the most visible impact on access, with an impact on equity as well. The Chile Lifelong Learning Project had some impact on access to adult education, which has an equity focus, but did not impact access to the improved technical education that it envisaged. And the Chile Knowledge Economy Project had limited or indirect equity implications.
10
3.4 Improving Access and Equity through Student Loans. Student financial aid is extended in different ways across the world. Higher education financial support systems include grants, loans, or a combination of the two. Several countries currently operate student loan programs. Most follow the concept of cost sharing among four possible financial partners: students, parents, taxpayers, and institutions. Interest rates, eligible expenditures, subsidies, grace periods, and repayment may be structured in a variety of ways, and loans may require that the graduating student work for a time at a specific institution or in a specific sector. Lending institutions may be public, private for profit or nonprofit, or mixed (public/private). They may cover a nationwide, regional, association-based, or institution-based clientele and be organized in a variety of ways, including, for example, a specialized student loan agency, such as Colombia’s Institute for Education Credit and External Technical Studies (Instituto Colombiano de Crédito Educativo y Estudios Técnicos en el Exterior, ICETEX) or an agency with commercial banks, such as Chile’s INGRESA. These institutions may fund the loans from multiple sources, including trust funds, bank loans, donations, and their own capital.
3.5 Colombia’s ICETEX program primarily supported students from the two lowest socioeconomic groups. The program benefited from its longstanding experience with student loans and a 2002 reform that improved its management, focus on the poor, and financial sustainability. Following lessons of global practice, selected students needed to obtain a satisfactory grade in Colombia’s higher education exam, administered by the Colombian evaluation agency, and be accepted in an accredited higher education institution. Selection of beneficiaries relied on a poverty targeting system developed by the Colombian government.
3.6 As discussed in Annex C, higher education enrollment accelerated following introduction of the program. It is likely that a part of this acceleration was attributable to the program, for two reasons. First, some of the low-income beneficiaries might not have enrolled at all in the absence of financial assistance, particularly for low-income students with no collateral. Second, as shown by two impact evaluations, the program reduced drop-out rates of beneficiaries and therefore contributed to longer enrollment periods. Accordingly, the project contributed to an increase in higher education enrollment (gross basis), from an average of 24.3 percent during 2001–04 to 29.4 percent in 2009.
3.7 Despite these achievements, higher education drop-out rates remain pervasive. This experience suggests that student selection must better target students and that drop-out risks need to be further addressed. Colombia’s program has struggled with these two issues. First, ICETEX needs to increasingly target loans to students admitted to the relatively better-qualified institutions. Second, although the student loan program helped curb drop-out rates, other policies need to be implemented, including counseling and offering appropriate curricula, to raise the competency level of students who received a substandard secondary education. Colombia’s Ministry of Education has been working on a drop-out risk assessment system with the hope of reducing the very high rates—about half of admitted students drop out.
3.8 Access and Equity in Adult Education. The flexible adult education program (Chilecalifica) that the Chile Lifelong Learning Project supported helped students advance through the five levels of basic and secondary education in periods of six to eight months

11
each. It allows students 15 years old or older to complete the three levels of the basic education cycle and students 18 years old or older to complete the two levels of the secondary education cycle. The program recognized the contribution of adult education to those adults who were left behind as children, could still profit from education and, through higher education and incomes, might be better able to support their own children’s educational pursuits. A number of features of the program suggest good practices that contributed to its success:
• The program adapted the standard adult education curriculum to the special needs of adults, including increased usefulness and adjustment to the limited time that adults have.
• A National Evaluation and Certification System assessed readiness for entry into the program for those students lacking any certificate, as well as their readiness to receive completion certificates.
• Free tuition, textbooks, and other educational materials helped encourage participation by the low-income population that the program targeted.
• Flexible course periods, teaching methods that considered prior learning and different learning paces, close location of learning centers, and three chances to pass exams also helped to encourage demand.
• Courses were offered by registered teaching institutions that bid for the resources available under the program. There were 2,024 of these in 2008, the last year for which data are available; they covered about 70 percent of municipalities, thereby ensuring geographical proximity to the target population.
• Providers were fully paid on verified (that is, tested) completion of modules, not just based on student attendance.
• Testing for certification was administered by independent licensed examiners; certification allowed students to continue into higher education programs.
3.9 The program delivered education to 250,000 low-income students during 2003–08. Its availability helped increase overall adult enrollment from 2003 through 2006 (Appendix A). However, by 2007, overall adult enrollment had declined to previous levels. Nevertheless, the quality of the flexible education option is better than former offerings that did not lead to secondary education certificates. Adults still have the option of obtaining primary and secondary education certificates by passing exams without taking course work, and some do. But 50,000 students still chose to take the ChileCalifica curriculum during 2008–09, suggesting that the students see value in the program.2
3.10 Despite this achievement, results on drop-out rates also caused concern. About half of the students did not reach certification, with about a quarter quitting before examinations. There is no assessment available regarding why that happens. A lack of policies designed to prevent students from dropping out is the key criticism of the independent evaluation of the program contracted by Chile’s Budget Office (Santiago Consultores y Asociados 2009).
3.11 Access to Technical Education. In contrast to the flexible adult education program, the regional networks program supported by the Chile Lifelong Learning Project failed to
2 More recent data are not available, but the Ministry of Education has recently called for bids from providers of adult education for the 2011–12 school year, suggesting that the government plans to continue this program.
12
provide access to a technical education with better curricular links across education levels and better tailored to labor markets. This program envisaged networks of technical secondary schools, tertiary-level technical-professional institutions, training providers, employers, and unions willing to offer education and training services. They were to use a framework that integrated secondary technical education, tertiary technical education, and the labor market through curricular and skills/vocational progression maps developed from a competencies system.
3.12 This initiative failed to grant new access to technical education. There were three key reasons for its failure. First, the competencies system was only partially developed during the project. Indeed, it remains a work in progress. Second, the networks did not develop because of the multiple stakeholders they were expected to coordinate; the networks were actually coordination boards with limited capacity to lead the actions of their multiple constituents. Third, links between resources and service completion were weak or absent. The networks received the resources without having the responsibility to deliver a product as complex as technical education as it was articulated through curricular and vocational progression maps, which were not well defined. These conditions are in sharp contrast with those of the adult education program supported by the Lifelong Learning Project (discussed above). In that program, the curriculum was well defined, the supply of adult education did not face the coordination challenges of the regional networks, and accountability for results was well established.
3.13 The experience of the networks suggests that efforts at coordination under such a complex arrangement need stronger governance and accountability. Design of these efforts should start with an acknowledgment of the measure of governance and accountability that the education market is likely to provide without budget support for networks. The actors involved (firms, higher education institutions, and workers) already network to a degree, in a spontaneous fashion triggered by market needs. Workers seek the curricular and vocational progression maps that best fit them; higher education institutions respond to the demand for teaching that those pathways require; and firms demand skills and help provide specific training. In those conditions, the appropriate scope for collective action may be more to provide licensing and accreditation of institutions and to support their development. While the networks were trying to develop, enrollment in technical education expanded markedly, doubling between 2002 and 2009. But this was attributable to massive increases in public financial aid for technical education and had little if anything to do with any expansion of the kind of technical education that the project expected to achieve.
3.14 Improving Access to Doctoral Education. Both the Chile Knowledge Economy Project and the Colombia Higher Education – Improving Access Project supported access to doctoral education through loans and scholarships. Although evaluations of impact on doctoral enrollment are not available, the data suggest that this support may have contributed to the expansion of enrollment in national doctoral programs. In Chile, where overall enrollment increased by 72.2 percent between 2003 and 2006, the Bank funded 10.4 percent of enrollment. In Colombia, where enrollment increased fourfold between 2002 and 2007, the Bank also funded about 10.4 percent of enrollment.
13
Raising the Quality of Higher Education
3.15 In addition to increased access and quality, the three projects also sought better quality of education. Improving quality was part of the project development objective in the Colombia Higher Education Project, which intended to improve higher education accreditation, strengthen the requirement that students receiving scholarships be admitted to an accredited institution, and provide support for doctoral programs and scholarships, which would improve primary inputs to tertiary education. Although not explicit in its development objective, the Chile Lifelong Learning Project also sought to raise quality through a better curriculum and more flexible delivery of adult education and through a technical and vocational education and training system based on a system of competencies. Under the proposed technical education system, curricular progression maps were to link technical secondary education with tertiary technical-professional education. Skill/competency progression maps emerging from a national system of competencies were to link technical-professional education with training and the labor market. The proposed technical education was to be implemented by the regional networks established under the project. And as with the Colombia project, the Chile Knowledge Economy Project would raise quality through support for doctoral programs and scholarships.
3.16 In Colombia, an independent assessment found positive impacts of the higher education student loan program on academic achievements. The project may have also increased quality through (i) increased demand for enrollment at accredited institutions, as student eligibility for financial support hinges on acceptance to such institutions and (ii) improved faculty and research, as a result of the project’s support for doctoral program development. The latter supported doctoral scholarships, acquisition of state-of-the art robust equipment and specialized bibliography and access to data bases, and visiting professor stipends to help develop PhD programs. Similarly, the Chile Knowledge Economy Project supported further development of doctoral programs.
3.17 In both Chile and Colombia, the share of PhDs in the faculty and publication rates increased. In Colombia, for example, the share of PhDs in the faculty increased from 2.9 percent in 2002 to 4.1 percent in 2010, as the total number of faculty expanded by 32.6 percent. The share of full-time faculty also expanded, from 23.7 percent in 2002 to 30.1 percent in 2010. The Colombia project also intended to improve quality by improving its fragmented quality assurance system. Although this support did not materialize, the government in fact deepened accreditation efforts that may have contributed to quality. Nevertheless, accredited programs covered only 6.6 percent of licensed programs in 2010. Accreditation efforts in Chile have also been strengthened, and the accreditation agencies in both countries are aiming to get their own accreditation from international agencies.
Improving Skill Levels of the Labor Force
3.18 This section reviews the employment and earnings outcomes of the Chile flexible education, the Colombia student loan, and the Chile’s PhD scholarship program. These programs, by raising education and skill levels, were to contribute to improved earnings and employability.
14
3.19 Employment Outcomes of Chile’s Flexible Education Program. The Chile Flexible Education Program, a part of the Chile Lifelong Learning Project, provided free primary and secondary education with a number of flexible features. Three impact evaluations of this program have been conducted (World Bank 2010). They aimed to gauge the impact on earnings and employability of those program participants. Results suggest fairly high rates of return to adult education, particularly for young adults, and perhaps some impact on employability. Appendix A provides details.
3.20 Development of Chile’s Competency Framework. The Chile Lifelong Learning Project also intended to develop testing and certification of acquired skills, whatever their provenance, based on a system of competencies. An impact evaluation was conducted for workers who were trained in competencies in a pilot, with some tested and certified. The evaluation found a positive but not statistically significant impact. Refinement of the competency system is still in progress (Santiago Consultores y Asociados 2009).
3.21 Employment and Earnings Outcomes of Colombia’s Student Loan Program. The program supported by the Colombia Higher Education Project provided ICETEX loans to low-income higher education students. Using data generated by the Labor Market Observatory and supported by the project as well as a beneficiary survey and a review of quality assurance data, the report—produced by an independent consultant at the request of ICETEX (ICETEX 2010)—addressed the question of how well graduates from the program have performed with regard to employment and earnings. The Observatory data allow this by cross-referencing student IDs with social security contribution data. Being a contributor to social security means that an individual has obtained formal employment, a good indication of success in employment insertion. Using the share of workers with secondary education in formal employment as a benchmark (36 percent), the report finds that ICETEX 2001–08 graduates did as well as other graduates, with the share of formality ranging from 67.1 percent for graduates of technical-professional schools to 100 percent for graduates from doctoral programs. Graduates belonging to richer socioeconomic groups did a little better, suggesting the positive impact of better networks, social capital, perhaps competencies (for example, knowledge of a language), and better secondary schooling.
3.22 The 2010 beneficiary survey identified high labor participation of ICETEX graduates (92.1 percent), with only 16 percent still looking for a job. Fifty-five percent of the employed students needed an average of 9 months to find employment after graduation (the other 45 percent had jobs before graduation). The time it took to find employment depended on GDP growth, which accelerated from 2005 to 2007 and reduced the duration of unemployment from 11 to 8 months.
3.23 Again taking secondary education as a benchmark, improvement in earnings of ICETEX graduates ranged from 43 percent (technical-professional undergraduates) to 168 percent (undergraduate university) and 650 percent (PhDs). These gains were slightly higher for non-ICETEX graduates. A finding of interest is that men’s average earnings are higher than women’s. This is primarily the result of men being employed for more hours than women (Fernandez 2006).

15
3.24 The review of higher education accreditation data looked at the impact of receiving high quality secondary education. It indicated that those ICETEX students in the richest socioeconomic groups, who attend better schools, also attended the higher education institutions with better ratings in a much higher proportion (87 percent) than those from the poorest group (54 percent); that formal employment (as defined above) was more prevalent for graduates from the better institutions, and that earnings for those graduating from the better rated institutions were also significantly higher. Incomes of graduates from the better-rated higher education institutions were higher for all the graduates from nontechnical institutions, with no difference in the incomes of graduates from differently rated technical-professional institutions. ICETEX has endeavored to increase the focus of its loans on students gaining access to the better-rated institutions.
3.25 In sum, the program supported by the Colombia Higher Education Project improved incomes and employability by improving low-income student enrollment in higher education institutions. Furthermore, the impact of better accreditation on incomes suggests that Colombia’s quality assurance system provides useful information, particularly with regard to the nontechnical institutions.
3.26 Chile’s PhD Scholarship Program. The second component of the Chile Knowledge Economy Project included financing of PhD scholarships. This was designed to help improve the stock of human capital in Chile’s science and technology sector. The impact on employability was likely positive, as PhD unemployment rates, estimated at about 3.4 percent (Consejo de Rectores de Universidades Chilenas 2008, p. 60), are lower than unemployment rates for those with first-level tertiary education. Most PhDs are employed at higher education institutions. Their share of PhD employment increased from 77.2 percent in 2000 to 80.9 percent in 2007. A Budget Office impact evaluation indicates that the Comisión Nacional de Investigación Científica y Tecnológica graduate scholarships increased beneficiary incomes by 49–70 percent (Statcom Estadísticos Consultores 2007, p. 431).
Improving the Effectiveness of the Innovation System
3.27 The Chile Knowledge Economy Project and Colombia Higher Education Project —the latter to the more limited extent of supporting doctoral program development—sought to improve readiness for innovation. The Chile Knowledge Economy Project supported efforts to develop an S&T strategy and implement policies, develop monitoring and evaluation (M&E) capacity, accumulate high-level human capital for research activities, improve research infrastructure, and encourage cooperative research through consortia and insertion of Chilean researchers in industry and in international research projects.
3.28 As discussed in Annex B, the project financed doctoral scholarships and cooperative research activities. The aim of the project, to increase the effectiveness of the innovation system, can be gauged by its impact on R&D expenditures, which have been quite low compared with developed economy levels and just shy of the average for Latin America, the latter driven by Brazil (Figure 4). The data suggest a modest increase in the share of R&D expenditures in GDP in 2002 that appears to be sustained at least through 2006, the last year for which there are comparable data. It is likely that this increase was linked to efforts that began well before the project, with the Millennium Science Initiative, which was introduced
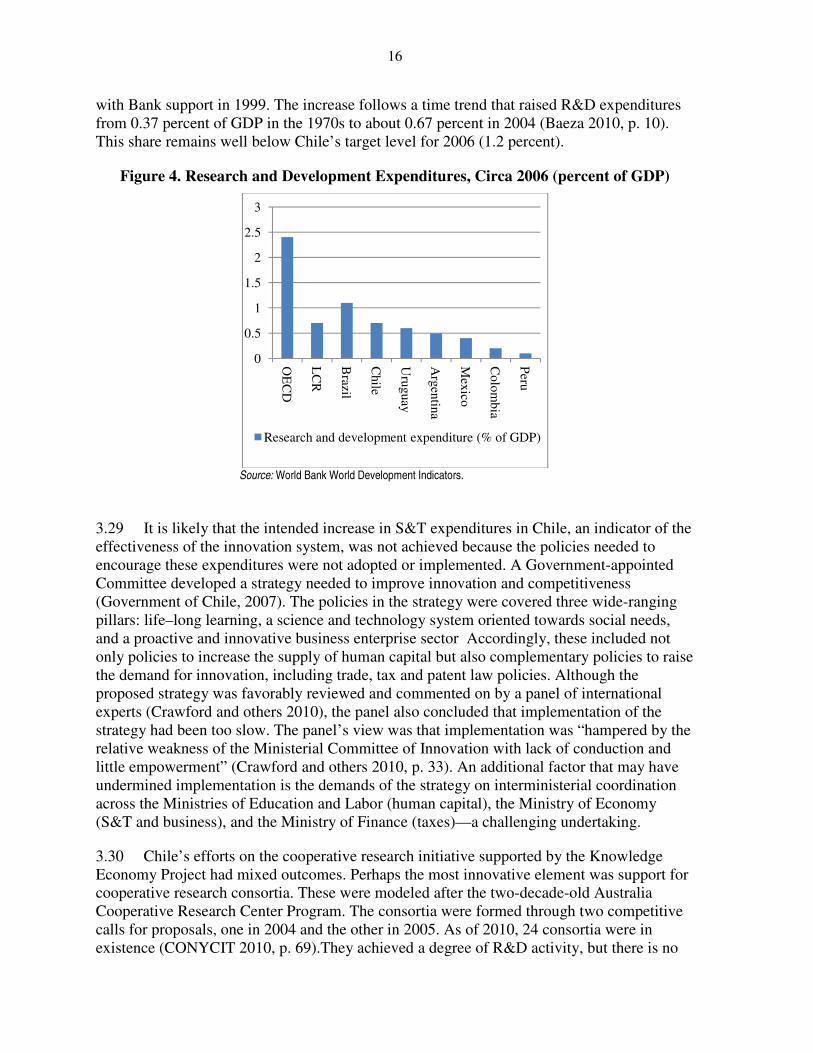
16
with Bank support in 1999. The increase follows a time trend that raised R&D expenditures from 0.37 percent of GDP in the 1970s to about 0.67 percent in 2004 (Baeza 2010, p. 10). This share remains well below Chile’s target level for 2006 (1.2 percent).
Figure 4. Research and Development Expenditures, Circa 2006 (percent of GDP)
Source: World Bank World Development Indicators.
3.29 It is likely that the intended increase in S&T expenditures in Chile, an indicator of the effectiveness of the innovation system, was not achieved because the policies needed to encourage these expenditures were not adopted or implemented. A Government-appointed Committee developed a strategy needed to improve innovation and competitiveness (Government of Chile, 2007). The policies in the strategy were covered three wide-ranging pillars: life–long learning, a science and technology system oriented towards social needs, and a proactive and innovative business enterprise sector Accordingly, these included not only policies to increase the supply of human capital but also complementary policies to raise the demand for innovation, including trade, tax and patent law policies. Although the proposed strategy was favorably reviewed and commented on by a panel of international experts (Crawford and others 2010), the panel also concluded that implementation of the strategy had been too slow. The panel’s view was that implementation was “hampered by the relative weakness of the Ministerial Committee of Innovation with lack of conduction and little empowerment” (Crawford and others 2010, p. 33). An additional factor that may have undermined implementation is the demands of the strategy on interministerial coordination across the Ministries of Education and Labor (human capital), the Ministry of Economy (S&T and business), and the Ministry of Finance (taxes)—a challenging undertaking.
3.30 Chile’s efforts on the cooperative research initiative supported by the Knowledge Economy Project had mixed outcomes. Perhaps the most innovative element was support for cooperative research consortia. These were modeled after the two-decade-old Australia Cooperative Research Center Program. The consortia were formed through two competitive calls for proposals, one in 2004 and the other in 2005. As of 2010, 24 consortia were in existence (CONYCIT 2010, p. 69).They achieved a degree of R&D activity, but there is no
0
0.5
1
1.5
2
2.5
3
OE
CD
LC
R
Brazil
Chile
Uruguay
Argentina
Mexico
Colom
bia
Peru
Research and development expenditure (% of GDP)
17
full assessment available of innovation results, because these consortia were created over the last six years and not enough time has elapsed to demonstrate results. Some preliminary results on their performance are available. One study (Alvarez, Contreras, and Contreras 2010) derives some results from surveys of 11 consortia. The overall impression given by the survey is that the contribution of consortia to developing business S&T capacity and engaging in high-risk research projects has thus far been limited, with many of the members instead seeking improved competitiveness of their sectors. The better outcomes include improved access to knowledge of technology and markets and available skilled manpower.
3.31 Another study reviewed the performance of Chilean consortia at an early stage, as well as the Australian experience, to develop a view or model of good practices as these consortia develop (Busco and others 2008). The model distinguished four stages:
• Preparation—This stage includes close communication among its potential members at the earliest stage to develop clear agreements on legal incorporation of a flexible organization and on distribution of benefits and the appointment of a set of high-level directors.
• During formation, the consortium develops relations with international organizations, a corporate image, close links among members, independence from the public sector, and private sector leadership. It also sets up an office with a manager able to display leadership, knowledge of and experience with technological enterprise, and knowledge of the private sector and academia.
• During consolidation, the consortium launches the actual innovation work with the creation of joint university-business teams while strengthening the organization’s identity and ties.
• Preparation, formation, and consolidation set the basis for sustainability (that is, independence from public funding), growth, and impact, which may begin by about the fifth year after preparation.
3.32 Based on this model, results of the consortia supported by the Bank project ranged across different stages, from failure at the preparation stage in the case of an aeronautics consortium that did not materialize, to growth and impact in the case of a winery consortium (Vinnova). Mission discussions in the field highlighted a tension between the innovation objectives more typical of scientists (sharing, publishing, and perhaps patenting) and the innovation objectives of firms (perhaps patenting, but more likely developing business from trade secrets). Consortia are more likely to engage in patentable innovations, as patents would appear to provide an instrument to formalize the gains from an invention and to distribute them between consortia members, whereas a trade secret is more appropriate for a firm that exploits it for the benefit of its own stockholders.
3.33 Doctoral Program Grants. The Colombia Higher Education Project and Chile Knowledge Economy Project supported grants to develop PhD programs. The grant component of the Colombia project supported investments in state-of-the art robust equipment and access to scientific data bases and visiting professor stipends to help develop

18
PhD programs. Universities financed up to 40 percent of the investments. Grants were awarded to 115 doctoral programs in 26 higher education institutions. The Knowledge Economy Project financed research grants and scholarships; however, intended support for acquisition of robust equipment did not materialize because of delays in determining equipment needs.
3.34 An assessment of the Colombia doctoral development program yielded important lessons on academic productivity. The review included comparisons of students supported by the Bank program with other groups and an econometric analysis of factors that explain student graduation and publication rates (Universidad del Rosario 2010). It concluded that the program focused on the main variables that can be affected for results, namely the strength of research groups and PhD scholarships.
3.35 Specifically, the evaluation concluded that individual productivity (that is, publication rates) was affected by several elements: the quality of the group with which the individual was affiliated (+); the share of researchers in the group; the professor publication rate; the individual’s experience (+); age at enrollment (–); and gender. The likelihood of graduation is affected by age at enrollment (–), gender, publication rate prior to graduation (+), teaching/research project burden (–), and scholarship support (+). Thus, by strengthening research groups and supporting scholarships, the doctoral program grants focused on the key variables that can affect efficacy. This support helped increase the number of programs from 45 in 2003 to 128 in 2008 and the number of PhD graduates from 55 to 98. The central lesson from this experience is that higher education institution development hinges both on characteristics of the individuals affiliated with a program and on the quality of the program or group in providing an appropriate environment for study and research.
4. Lessons
4.1 This review draws the following lessons that may help in the design and implementation for adult and higher education projects::
Broadening Higher Education Access and Reducing Drop-out Rates
• Student loans to low income beneficiaries can help increase their enrollment in and graduation from higher education for two reasons. First, some low-income youth may not enroll in higher education in the absence of financial assistance, particularly those with no collateral to submit to commercial lenders. Second, as shown by two impact evaluations, student loans may reduce drop-out rates of beneficiaries and therefore contribute to longer enrollment periods.
• A diagnosis of drop-out rates and of the key measures to address them needs to be a key ingredient of education programs. Student drop-out rates undermine enrollment and links to the labor market, as nongraduation adversely affects individual enrollment duration (the average years of enrollment) and earnings. While student loans helped curb dropout rates, a diagnosis of those rates may help identify, as in Colombia, the need for other actions, including remedial programs and counseling.
19
• Coordination from the top down to strengthen the links among different levels and providers of technical education may be difficult to implement, as shown by the Chile networks program, due to the multiple stakeholders involved and the difficulty of developing a curricular common ground (a system of competencies., A better design may focus more strongly on accreditation of providers, while relying more on providers to identify the demand for skills by firms and the demand for technical education and training by students and workers.
Improving Higher Education Quality Outcomes
• Improvements in higher education quality outcomes can be achieved through a variety of policies on the “demand” or student side. Student loans are among these policies. As suggested by the Colombia Higher Education Project, student loans to low-income students may improve test results in part because the loans reduce student workloads and because students are selected based on their academic records and on admittance to accredited institutions. Other policies that may improve higher education quality include support for doctoral programs (to improve the higher education faculty) and a stronger accreditation framework.
• Projects can improve quality outcomes by linking them to funding. The Chile flexible education program achieved better adult education by linking funding to adult education outcomes. The Chile technical and vocational education and training efforts failed in this respect because those outcomes (improved links between technical education levels and to labor market needs) were not well developed.
Strengthening Links to the Labor Market
• Adult education, often thought to be too costly relative to impact, can be made to work with adequate attention to curricular design, flexibility of delivery, and credibility of testing and certification. In particular, curricular design needs take into account past adult learning; delivery needs to be flexible in terms of class hours and available sites; and the credibility of the program may be strengthened through testing administration by independent parties.
• More efforts are necessary to assess potential impacts of education on earnings. Although education is likely to improve earnings, impact will vary considerably. Project Appraisal Documents assessed returns to education, but these assessments did not allow for project specificities. In the Chile Lifelong Learning Project, for example, little consideration was given to the actual evidence on the impact of adult education on incomes, where the limited cross-country evidence is particularly conflicting. Nevertheless, the projects themselves provided new evidence on earnings, albeit of varying quality. Continuous tracking studies, such as the Labor Market Observatory established in Colombia and a similar arrangement in Chile, have been useful. Impact evaluations are also likely to be useful, particularly if robust data collection strategies are designed from the outset.
20
Links to the Knowledge Economy
• Support for doctoral programs is likely to result in an increased human capital base for innovation. An assessment of the Higher Education Project concluded that scholarships and investment grants for doctoral programs increased publication and graduation rates. Chile’s Knowledge Economy Project suggests a similar outcome.
• Improvements in the effectiveness of the innovation system are likely to require more than supply driven support for human resources and innovation grants. Although this support is important, increasing innovation will require a wide range of policies to raise demand, including tax, trade, and patent law policies. A report by a Government-appointed Committee highlighted policies covering life–long learning, a science and technology system oriented towards social needs, and a proactive and innovative business enterprise sector.

21
References
Aedo, I. Cristian, and Luis Eduardo González. 2009. La Educación Superior en Chile. Paris: OECD.
Aedo, I. Cristian. 2000. “Educación en Chile: Evaluación y Recomendaciones de Política.” Financiamento De La Eduacación Superior: 127-140. Chile.
Alvarez, Roberto, Contreras, Carmen, and Jose Luis Contreras. 2010. Análisis Institucional de Instrumentos Consorcios Tecnológicos Empresariales (CTE) y Evaluación de Medio Término de Consorcios Conicyt e Innova Chile. Final Report. Santiago de Chile: Intelis Center, University of Chile.
Alvarez, Roberto. 2001. “External Sources of Technological Innovation in Chilean Manufacturing Industry.” Estudios de Economía 28(1): 53-68.
Añon, Higón, 2007. “The impact of R&D spillovers on UK manufacturing TFP: A Dynamic panel approach.” Research Policy 36: 964–979.
Arancibia, Violeta. 1994. “La Educación En Chile: Percepciones De La Opinión Pública Y De Expertos.” Estudios Públicos 54: 125-151.
Arenas de Mesa, Alberto, and Heidi Berner Herrera. 2010. Presupuesto por Resultados y la Consolidación del Sistema de Evaluación y Control de Gestión del Gobierno Central. Publicación de la Dirección de Presupuestos del Ministerio de Hacienda. Chile.
Arnold, Erik, Malkin, Daniel, Good, Barbara, Clark, John, and Miriam Ruiz Yaniz. 2009. Evaluating the National Innovation Strategy for Competitiveness. UK: Technopolis Group.
Ascari, Guido and Valeria Di Cosmo. 2005. “Determinants of Total Factor Productivity in the Italian Regions.” Department of Economics and Quantitative Methods Paper, Pavia, Italy.
Baeza, Jaime H. 2010. El Rol de las Universidades en el Desarrollo Científico-Tecnológico en la Década 1998 – 2007. Chile: Centro Interuniversitario de Desarrollo (CINDA).
Banco Interamericano de Desarrollo (BID). 2010. “La era de la productividad: cómo transformar las economías desde sus cimientos / Carmen Pagés, editora.” Washington, DC: BID.
Barr, Nicholas, and Alison Johnston. 2010. “Interest Subsidies on Student Loans: A Better Class of Drain. Centre for the Economics of Education.” Paper 114, Centre for the Economics of Education, London School of Economics, London, UK.
Barrera-Osorio, Felipe, and Leigh L. Linden. 2009. “The Use and Misuse of Computers in Education : Evidence from a Randomized Experiment in Colombia.” World Bank Policy Research Working Paper 4836, World Bank, Washington, DC.
Barro, Robert, and Jong-Wha Lee. 1996. “International Measures of Schooling Years and Schooling Quality." American Economic Association Papers and Proceedings 86(2): 218-223.
Bas, Tomas Gabriel, Amoros, Ernesto, and Martin Kunc. 2008. “Innovation, Entrepreneurship and Clusters in Latin America Natural Resource – Implication and Future Challenges.” Journal of Technology Management and Innovation 3(3): 52-65.
Basualdo, Cristina. 2006. “La Evaluación del Sistema Educativo de Chile: Una Aproximación Contextual.” Project Paper 1314: Universidad Nacional de Salta, Argentina.
Benavente, José Miguel, and Rodolfo Lauterbach. 2007. “The Effect of Innovation on Employment, Evidence from Chilean Firms.” Paper of Departamento de Economía, Facultad de Economía y Administración, Santiago, Chile.
Benavente, José Miguel, De Gregorio, José, and Marco Núñez. 2005. “Rates of Return for Industrial R&D in Chile.” Study of Department of Economics, University of Chile and Central Bank of Chile, Santiago, Chile.
Benavente, Jose Miguel. 2002. “The Role of Research and Innovation in Promoting Productivity in Chile.” Paper, Department of Economics, University of Chile, Santiago de Chile.

22
_______. 2005. “Innovación Tecnológica en Chile: Dónde Estamos y Qué Se Puede Hacer.” Economía Chilena 8(1): 53-74.
Bernasconi, Andrés, and Fernando Rojas. 2003. “Digital observatory for Higher Education in Latin America and the Caribbean.” Informe sobre la Educación Superior en Chile: 1980-2003. Santiago, Chile.
Beyer, Harald, and Rodrigo Vergara. 2002. “Productivity and Economic Growth: The Case of Chile.” Economic Growth: Sources, Trends, and Cycles, Central Bank of Chile, Santiago, Chile.
Biatour, Bernadette, and Chantal Kegels. 2008. “Determinants of innovation in a small open economy: the case of Belgium.” Working Paper 11-08, Federal Planning Bureau, Brussels.
Bitran Colodro, Eduardo, and Cristian Gonzalez Urrutia. 2010. “Productividat Total de Factores, Crecimiento e Innovación.” Consejo Nacional de Innovación para la Competitividad. Santiago, Chile.
Blanden, Jo, Buscha, Franz, Sturgis, Patrick, and Peter Urwin. 2010. “Measuring the returns to lifelong learning.” CEE discussion papers, CEEDP0110. Centre for the Economics of Education, London School of Economics and Political Science, London, UK.
Bloch, Harry, and Mita Bhattacharya. 2004. “Determinants of Innovation.” Small Business Economics 22(2): 155-162.
Bortagaray, Isabel, and Scott Tiffin. 2000. “Innovation Clusters in Latin America.” Paper presented at 4th International Conference on Technology Policy and Innovation. Curitiba, Brazil.
Bosch, Mariano, Lederman, Daniel, and William F. Maloney. 2005. Patenting and Research and Development: A Global View. Report No. WPS3739. The World Bank. Washington, DC.
Brunello, Giorgio, Fabbri, Daniele, and Margherita Fort. 2009. “Years of Schooling, Human Capital and the Body Mass Index of European Females.” Discussion Paper No. 4667. Institute for the Study of Labor (IZA), Bonn, Germany.
Brunner, Jose Joaquin. 2008. “Chile’s Higher Education System: A Comparative Political Economy Focus.” In Higher Education in Latin America and Caribbean Region 2008, ed. López Segrera, Francisco, Brock, Colin, and José Dias Sobrinho. Caracas: IESALC-UNESCO.
Busco Ramírez, Carolina, Retamal Sáenz, Rosario, and Dario Rodríguez Mancilla. 2008. “Consorcios Tecnológicos: Buenas Practicas y Lecciones Aprendiadas.” Study. Pontificia Universidad Católica de Chile, Vicerrectoría Académica, Vicerrectoría Adjunta de Investigación y Doctorado. Santiago, Chile.
Cárdenas, Mauricio, and Sandra Rozo. 2008. “Crime and Growth in Colombia.” Working Paper 30. The International Bank for Reconstruction and Development / The World Bank on behalf of Commission of Growth and Development, Washington, DC.
Carlson, Beverley. 2001. “Education and the Labor Market in Latin America: Why measurement is important and what it tells us about policies, reforms and performance.” Productive Development Series 114: 1-51. Santiago: Economic Commission for Latin America and the Caribbean of the United Nations.
_______. 2002. “Preparing Workers For The 21st Century: The Importance of Statistical Competencies.” Paper for the Sixth International Conference on Teaching Statistics. Economic Commission for Latin America and the Caribbean of the United Nations, Santiago.
Carnoy, Martin, and Patric McEwan. 2003. “Does privatization improve education? The case of Chile’s national voucher plan.” In Choosing choice: School choice in international perspective, ed. D.N. Plank, and G. Sykes. Teachers College Press, Columbia University, New York & London.
Cassiolato, José E.. 2004. “National Systems of Innovation in Latin America: Development & Structural Reforms.” Presentation, National Systems of Innovation: the Connections between Neo-schumpeterians and ECLA literatures, Globelics, Lisbon.
Castro, Manuel Fernando. 2006. “Colombia’s National System for Evaluation of Management and Results.” In Towards the Institutionalization of Monitoring and Evaluation Systems in Latin America and the Caribbean: Proceedings of a World Bank / Inter–American Development Bank Conference, ed. May,

23
Ernesto, Shand, David, Mackay, Keith, Rojas, Fernando, and Jaime Saavedra. Washington, DC: World Bank.
Centro de Estudios Públicos (CEP). 2006. “Evaluación de la Calidad de la Educación en Chile.” Estudio Nacional de Opinión Pública Nº 52. Parte I. Santiago de Chile.
Centro Interuniversitario de Desarrollo (Cinda). 2007. “Educación Superior en Iberoamérica.” Informe 2007. Santiago, Chile.
_______. 2010. “El Rol de las Universidades en el Desarrollo Cientifico y Tecnologico.” Informe 2010. Santiago, Chile.
Chumacero, Rómulo A., and Rodrigo J. Fuentes. 2006. "Economic growth in Latin America: structural breaks or fundamentals." Estudios de Economia, University of Chile, Department of Economics, vol. 33(2): 141-154.
Colino, Alberto, Myro, Rafael, and Perez Patricio. 2008. Economic Growth in a World of Ideas: The US and the Leading European Countries.” Applied Economics 40: 2901-2009.
Comisión Nacional de Acreditación (CNA). 2009. “Lineamientos para la acreditacion de alta calidad, de programas de maestria y doctorado.” Ministerio de Educación. Bogotá, Colombia.
Comisión Nacional de Investigación Científica y Tecnológica, Gobierno de Chile (CONICYT). 2006. “Hacia una Mayor Contribución del Capital Humano Avanzado al Desarrollo del País: Estudio de Pertinencia de los Programas de Doctorado para el Sistema de Innovación Chileno.” I Concurso De Estudios de Polotiticas y Gestion de la Ciencia, Tecnologia e Innovaction. Paper KEA39. Consejo de Rectores de Universidades Chilenas. Santiago, Chile.
_______. 2009. “Inovacion Cientifica En Chile.” Recopilación de documentos. Santiago de Chile.
_______. 2010. “Diagnóstico de las Capacidades y Oportunidades de Desarrollo de la Ciencia, la Tecnología y la Innovaciónen las 15 Regiones de Chile: Una Visión General.” Santander No. 72, Providencia, Santiago, Chile.
Comisión Nacional de Investigación Científica y Tecnológica, Gobierno de Chile (CONICYT), and Fondo de Fomento al Desarrollo Científico y Tecnológico (Fondef). 2008. “TICs Para Educación en Chile. Resultados del Programa TIC EDU de Fondef.” CONICYT-Fondef, U. de Chile, U. de Concepción, U. T. F. Santa María, PUC. Santiago de Chile.
Comisión Nacional para la Modernización de la Educación. 1994. “Los Desafíos de la Educación Chilena Frente al Siglo 21.” Santiago de Chile.
Consejo Asesor Presidencial Para La Calidad De La Educación. 2006. “Palabras de la Sra. Presidenta de la República al Constituir el Consejo Asesor Presidencial para la Calidad de la Educación.” Informe Final 11. Santiago, Chile.
Consejo Nacional de Innovacion para la Competitividad (CNIC). 2007. “Hacia una Estrategia Nacional de Innovación Para La Competitividad.” Presentación. Santiago de Chile.
Consultores en Economía y Desarrollo, S.A. 2004. “Estudio de Evaluación de Impacto de la Modalidad Flexible de Nivelación de Estudios.” Programa de Educación y Capacitación Permanente Chile Califica. Manuscript. Santiago de Chile.
Cook, Philip, and Olga Memedovic. 2003. “Strategies for Regional Innovation Systems: Learning Transfer and Applications.” Policy Papers. United Nations Industrial Development Organization (UNIDO). Vienna, Austria.
Correa Sutil, Sofía, and Pablo Ruiz-Tagle Vial. 2006. “Reformas al Sistema Educacional Chileno.” Facultad de Derecho de la Universidad de Chile. Santiago de Chile.
Crawford, Michael, Feller, Irwin, Pique, Josep, Sabel, Charles, Sargent, Michael, Arnold, Erik, and Morris Teubal. 2010. Evaluation Report of National Innovation Strategy for Competitiveness, Chile. International Evaluation Panel. Santiago de Chile: Consejo Nacional de Innovacion para la Competitividad (CNIC).

24
Crespi, Gustavo, and Fernando Peirano. 2007. “Measuring Innovation in Latin America: What we did, where we are, and what we want to do.” Paper prepared for the Conference on Micro Evidence on Innovation in Developing Countries, UNO-MERIT, Maastricht, Netherlands.
Crespi, Gustavo, and Pluvia Zuñiga. 2010. “Innovation and Productivity: Evidence from Six Latin American Countries.” Inter-American Development Bank Working Paper Series, ADB-WP-218, IDB, Washington, DC.
Damon , Amy, and Paul Glewwe. 2007. Three Proposals to Improve Education in Latin American and the Caribbean: Estimates of the Costs and Benefits of Each Strategy. Report to the Copenhagen Consensus Center and the Inter-American Development Bank. University of Minnesota. USA.
De Gregorio, Jose, and Jong-Wha Lee. 1999. “Economic Growth in Latin America: Sources and Prospects.” Paper prepared for the Global Development Network Conference, Cairo, Egypt.
Department of Administration. 2008. “Policy on Rating Criteria for Competitive Grant Review.” Office of Grants Management . Policy Number 08-02, Minnesota, USA.
Dodgson, Mark, Kastelle, Tim, and Jason Potts. 2009. “The Evolution of Innovation Systems.” Paper presented at the DRUID Summer Conference on Innovation, Strategy and Knowledge, Copenhagen, Denmark.
Echavarría Soto, Juan José, López Enciso, Enrique, Misas Arango, Martha, Téllez Corredor, Juana, and Juan Carlos Parra Alvarez. 2007. “La Tasa de Interés Natural en Colombia.” Ensayos sobre Política Económica 25(54): 44-89.
Economic Commission for Latin America. 2010. “Panorama social de América Latina.” Documento informativo, Econômica para a América Latina e o Caribe (CEPAL), and Nações Unidas (UN).
EMG Consultores. 2005. “Evaluación del Programa de Capacitación de Microempresarios - Articulación de Demandas Locales de Capacitación.” Servicio Nacional de Capacitación y Empleo. Innovación & Desarrollo – Estudios. Santiago de Chile.
Espinoza, Oscar, and Luis Eduardo Gonzalez. 2009. “Desarrollo de la formación de posgrado en Chile.” Revista CTS 13(5): 207-232.
Espinoza, Oscar, Fecci, Ester, González, Luis Eduardo, Marianov Kluge, Vladimir, Mora Cerna, Arturo, Ocaranza Manterola, Olaya, Prieto, Juan Pablo, and Emilio Rodríguez Ponce. 2006. “Educación Superior en Iberoamérica El Caso De Chile.” Centro Interuniversitario de Desarrollo (CINDA), Santiago de Chile.
European Commission. 2010. New Skills for New Jobs Policy initiatives in the field of education: Short overview of the current situation in Europe. Education, Audiovisual and Culture Executive Agency (EACEA P9 Eurydice), Brussels.
Eyzaguirre, Bárbara, and Carmen Le Foulon. 2001. “La Calidad De La Educación Chilena En Cifras.” Estudios Públicos 84: 85-204.
Eyzaguirre, Nicolás, Marcel, Mario, Rodríguez, Jorge, and Marcelo Tokman. 2005.” Hacia La Economía Del Conocimiento: El Camino Para Crecer Con Equidad En El Largo Plazo.” Estudios Públicos, Working Paper 17-1-2005, Santiago de Chile.
Fasih, Tazeen. 2008. Linking Education Policy to Labor Market Outcomes. Washington, DC: World Bank.
Fernandez, María del Pilar. 2006. “Determinantes del diferencial salarial por género en Colombia, 1997-2003.” Segundo Semestre De 2006 Desarrollo y Sociedad 58: 165-208.
Feser, Edward. 2002. The Relevance of Clusters for Innovation Policy in Latin America and the Caribbean. Background Paper. Washington, DC: World Bank.
Forero R., Nohora, García, Andrés Felipe, and Juan Carlos Guataquí. 2008. “A Quiénes Afecta el Desempleo? Análisis ee la Tasa de Incidencia en Colombia.” Universidad del Rosario. Facultad de Economía. Serie Documentos De Trabajo 42: 1-48.
25
Gallego, Francisco, and Norman Loayza. 2002. “The Golden Period For Growth In Chile: Explanations And Forecasts.” In Economic Growth: Sources, Trends, and Cycles, ed. N. Loayza, and R. Soto. Santiago, Chile: Central Bank of Chile.
García de Fanelli, Ana. 2008. “The Challenges of Funding Higher Education in Latin America.” Paper presented to the Seminar Funding Higher Education: a Comparative Overview, Brasilia, Brazil.
García-Suaza , Andrés Felipe, Guataquí, Juan Carlos, Guerra, José Alberto, and Darío Maldonado. 2009. “Beyond The Mincer Equation: the Internal Rate of Return to Higher Education in Colombia.” Universidad del Rosario. Facultad de Economia. Serie Documentos De Trabajo 68: 1-19.
Gormly, Sarah, and Kenneth A. Swinnerton. 2004. “The Effect of Adult Returns to Schooling on Children’s School Enrollment, Theory and Evidence from South Africa.” U.S. Department of Labor Bureau of International Labor Affairs. Washington, DC.
Greaney, Vincent, and Thomas Kellaghan. 2008. Assessing National Achievement Levels in Education. Washington, DC: World Bank.
Grosse, Robert. 2005. “R&D by TNCs in Latin America.” Paper on the InfoBrief, “Latin America Shows Rapid Rise in S&E Articles,” NSF 04-336 by US National Science Foundation.
Gustafson Backman, Jenny. 2008. “The Role of Education in Chile’s Economic Growth.” University essay from Handelshögskolan i Stockholm/Institutionen för nationalekonomi. School of Economics, Stockholm.
Gutierrez, Mario. 2005. “Economic Growth in Latin America: The Role of Investment and Other Sources.” Economic Development Division. Econômica para a América Latina e o Caribe (CEPAL), and Nações Unidas (UN).
Hall, Bronwyn H. 2005. “Government Policy for Innovation in Latin America.” Revision Paper for the Regional Studies Program of the Office of the Chief Economist for Latin America, World Bank., Washington, DC.
Hanushek, Eric A., and Ludger Woessmann. 2009. “Schooling, Cognitive Skills, and the Latin American Growth Puzzle.” Discussion Paper No. 4576, Institute for the Study of Labor (IZA), Bonn.
Holm-Nielsen, Lauritz, and Natalia Agapitova. 2002. “Chile - Science, Technology and Innovation.” Paper Series No.79. Department of Human Development. Washington, DC: World Bank.
Instituto Colombiano de Crédito y Estudios Técnicos en el Exterior (ICETEX). 2010.” Programa Colombiano de Crédito Educativo: Impactos y Factores de Éxito.” Instituto Colombiano de Credito Educativo y Estudios Técnicos en el Exterior. República de Colombia.
Independent Evaluation Group. 2011a. “Chile Country Partnership Strategy Completion Report.” Washington, DC: World Bank.
_______. 2011b. “Chile Lifelong Learning and Training Project Implementation Completion and Results Report.” Washington, DC: World Bank.
_______. 2011c. “Project Performance Assessment Report: Colombia Social Safety Net Project (LN. 73370 & LN.74330).” Washington, DC: World Bank.
_______. 2011d. “Project Performance Assessment Report: Higher Education Reform in The Middle East and North Africa: An IEG Review of the Performance of Three Projects Including Egypt Higher Education Enhancement Project (Loan 46580), Yemen Higher Education Learning and Innovation Project (Cr. 36740), and A Higher Education Project in the Hashemite Kingdom of Jordan.” Washington, DC: World Bank.
Jorgenson, Dale W.. 2008. “The Role of Latin America in the World Economy.” Presentation for Seminario Internacional Fundacion BBVA , Buenos Aires.
Kharas, Homi, Leipziger, Danny, Maloney, William, Thillainathan, R., and Heiko Hesse. 2008. “Chilean Growth through East Asian Eyes.” Working Paper 31, Commission on Growth and Development, World Bank, Washington, DC.
26
Klinger, Bailey and Daniel Lederman. 2006. “Diversification, Innovation, and Imitation inside the Global Technological Frontier.” Publication WPS 3872, World Bank, Washington, DC.
Larrañaga, Osvaldo. 1995. “Descentralización De La Educación En Chile: Una Evaluación Económica.” Estudios Publicos, No. 60. Santiago de Chile.
Lederman, Daniel and Laura Saenz. 2005. “Innovation and Development around the World, 1960-2000.” Policy Research Working Paper 3774, World Bank, Washington, DC.
Lehtoranta, Olavi. 2005. “Determinants of Innovation and the Economic Growth of Innovators Tracing the evolution of innovative firms over time.” Statistics Finland and VTT Technology Studies. Finland.
Lemaitre, María José . 2004. “Mecanismos de Aseguramiento de la Calidad: Respuesta a los Desafíos del Cambio en la Educación Superior.” Monográfica No. 21. Secretaria técnica. Comisión Nacional de Acreditación de Pregrado (CNAP). Chile.
Lerma Carreño, and Carlos Alberto. 2007. “El Derecho a la Educación en Colombia.” Foro Latinoamericano de Políticas Educativas. Libro digital ISBN 978-987-23507-6-5.
Letelier Gálvez, Maria Eugenia. 2010. “Sistema Nacional de Evaluación y Certificación de Estudios De personas jóvenes y adultas en Chile.” Decision. No. 25. Sistema de Evaluación y Certificación de Estudios, Ministerio de Educación de Chile . Santiago de Chile.
Link, Albert N., and John T. Scott. 2004. “The Role of Public Research Institutions in a National Innovation System: An Economic Perspective.” White Paper, World Bank, Washington, DC.
López-Claros, Augusto and Mata Jasmina. 2010. “The Innovation Capacity Index: Factors, Policies, and Institutions Driving Country Innovation.” Chapter 1.1 in Innovation for Development Report, ed. A. López-Claros. Mdrid.
Magud, Nícolas and Leandro Medina. 2011. “The Chilean Output Gap.” Working Paper WP/11/2, IMF, Washington, DC.
Maloney, William and Guillermo Perry. 2005. “Hacia Una Política De Innovación Eficiente En América Latina.” Revista CEPAL 87: 25-44.
Maloney, William, and Andrés Rodríguez-Clare. 2007. “Innovation Shortfalls.” Review of Development Economics 11(4): 665–684.
Maloney, William. 2002. “Missed Opportunities: Innovation and Resource-Based Growth in Latin America.” Policy Research Working Paper 2935, World Bank, Washington, DC.
Marcel, Mario and Carla Tokman. 2005. “Como se Financia la Educación en Chile?” Ministry of Economy. Santiago de Chile.
Marotta , Daniela, Michael, Mark, Blom, Andreas, and Kristian Thorn. 2007. “Human Capital and University-Industry Linkages’ Role in Fostering Firm Innovation: An Empirical Study of Chile and Colombia.” Policy Research Working Paper 4443, World Bank, Washington, DC.
May, Ernesto, Shand, David, Mackay, Keith, Rojas, Fernando, and Jaime Saavedra. 2006. Colombia’s National System for Evaluation of Management and Results. In Towards the Institutionalization of Monitoring and Evaluation Systems in Latin America and the Caribbean: Proceedings of a World Bank / Inter–American Development Bank Conference. Washington, DC: World Bank.
Meller, Patricio, and Jose Joaquin Brunner. 2009. “Educación Técnico Profesional Y Mercado Laboral En Chile: Un Reader.” Government of Chile, Universidad Diego Portales, and Universidad de Chile.
Ministerio de Educación, Ministerio de Economía, Ministerio del Trabajo y Previsión Social. 2009. “Evaluación en Profundidad Programa Chilecalifica.” Santiago de Chile.
Ministerio de Planificación. 2009. “Educacion: Encuesta CASEN 2009.” Presentation. Santiago de Chile.
Ministry of Economy. 2009. “Evaluación En Profundidad Chile Califica.” Minuta Ejecutiva. Santiago de Chile.

27
_______. 2010. “Resultados de las Encuestas de Innovación e I+D2007-2008.” División de Innovación. Presentation. Santiago de Chile.
Ministry of Education. 2003. “La Revolucion Educativa.” Plan Sectoral 2002 –2006. República de Colombia.
_______. 2006. “Diagnóstico de la Deserción Estudiantil en Colombia.” In Educación Superior. Boletin Informativo No. 7. República de Colombia.
_______. 2011. “Futuro Laboral 2009/2010.” Profesionales y Técnicos en Chile: Información Fundamental. República de Colombia.
Ministry of Education and UNESCO. 2002. “Panorama Educativo de las Amertcas.” Informe Regional. Cumbre de Las Américas. Santiago de Chile.
Ministry of Education. 2004. “Educación Superior en Chile.” Centro Nacional Tuning Chile. Presentación Educación Superior. Santiago de Chile.
_______. 2010a. “Desafios al Sistema Educacional Chileno.” MINEDUC - OCDE - UNESCO. Santiago de Chile.
_______. 2010b. “Educación De Adultos – Chilecalifica.” Guía Ayuda Mineduc. Santiago de Chile.
Montero, Rodrigo. 2007. “Cuánto Dura el Desempleo para la Población más Pobre en Chile?” Cuadernos de Economía Vol. 44: 211-231.
Mora, Jhon James. 2003. “Sheepskin Effects and Screening in Colombia.” Colombian Economic Journal 1: 98-108.
Morck, Randal, and Bernard Yeung. 2001. “The Economic Determinants of Innovation.” Occasional Paper No. 25, Industry Canada Research Publications Program, Ottawa, Canada.
Mullin, James, Adam, Robert M., Halliwell, Janet E., and Larry P Milligan. 2000. “Science, Technology and Innovation in Chile.” International Development Research Centre. Ottawa, Canada.
Myers, Karen, and John Myles. 2005. “Self-assessed Returns to Adult Education: Life-long Learning and the Educationally Disadvantage.” Research Report W 35. Work Network. Canadian Policy Research Networks. Ottawa, Canada.
Narodowski, Mariano, and Milagros Nores. 2002. “Searching for “Neoliberal.” Education Policies. A Comparative Analysis of Argentina and Chile. Documento 72. Argentina.
Núñez Prieto, Ivan. 2002. “La formación de docentes. Notas históricas”, en Beatrice Avalos, Profesores para Chile. Historia de un proyecto, Ministerio de Educación. Santiago de Chile.
OECD and IADB. 2010. “Strengthening Institutional Capacities for Innovation Policy Design and Implementation in Chile Assessment and Proposals.” Santiago de Chile.
OECD-World Bank. 2009. “La educación superior en Chile.” Chile: Ministry of Education.
_______. 2010. “Higher Education in Regional and City Development: The Bio Bio Region Chile: Self-Evaluation Report”, OECD Reviews of Higher Education in Regional and City Development, Programme on Institutional Management in Higher Education (IMHE). Chile: Ministry of Education.
Patrinos, Harry Anthony, and Chris Sakellariou. 2006. “Cognitive Ability, Heterogeneity, Endogeneity and Returns to Schooling in Chile: Outcomes of the 1981 Capitation Grant Scheme.” Second Draft, World Bank, Washington, DC.
Prufer, Patricia, and Gabriele Tondl. 2009. “The FDI-Growth Nexus in Latin America: The Role of Source Countries and Local Conditions.” Austria and the Netherlands.
Psacharopoulos, George. 1986. “Links between Education and the Labor Market: A Broader Perspective.” European Journal of Education 21(4).
Ramirez Sanchez, Carlos. 2004. “La Internacionalización de la Educación Superior en Chile.” Santiago de Chile.
28
Redondo, Jesus, Almonacid, Claudio, Inzunza, Carlos, Mena, Paula, and Loreto De la Fuente. 2007. “El Derecho a la Educación en Chile.” Foro Latinoamericano de Políticas Educativas. Buenos Aires: Fundación Laboratorio de Políticas Públicas.
Redondo, Jesus, Descouvières, Carlos, and Karina Rojas. 2004. “Equidad y Calidad de la Educación en Chile.” Reflexiónese E Investigaciones De Eficiencia De La Educación Obligatoria (1990-2001). Santiago de Chile.
Redondo, Jesus. 2009. “La Educación Chilena en una Encricujada Histórica.” Diversia 1: 13-39.
Riveros, Luis A. 1990. “The Economic Return to Schooling in Chile. An Analysis of Long-term Fluctuations.” Economics o/Education Review 9(2): 111-121.
Rolando M., Rodrigo, Salamanca V., Juan, and Marcelo Q. Aliaga. 2010. “Evolución Matrícula Educación Superior de Chile: Periodo 1990 – 2009.” Ministry of Educación: Chile.
Salas Opazo, Víctor, Campos de Quiroz, Hugo, and Verónica Loewe Muñoz. 2010. “Evaluación Programa Investigación Asociativa (PIA).” Informe Final. Ministerio De Educación, Comisión Nacional De Investigación Científica Y Tecnológica (CONICYT).
Salmi, Jamil. 2003. “Student Loans in and International Perspective: The World Bank Experience.” Paper 27295, World Bank, Washington, DC.
Sanchez Torres, Fabio, Duque, Valentina, and Mauricio Ruiz. 2008. “Estructura, Evolución del Desempleo en Colombia y Obstáculos para su Reducción, 1980-2007.” Universidad de los Andes, Bogotá, mimeo.
Santiago Consultores Asociados S.A. 2009a. “Evaluación en Profundidad Chilecalifica.” Informe Final. Ministry of Finance’s Budget Directorate (Dirección de Presupuestos – DIPRES). Santiago de Chile.
_______. 2009b. “Evaluación en Profundidad Chilecalifica.” Informe Final. Ministry of Finance’s Budget Directorate (Dirección de Presupuestos - DIPRES). Santiago de Chile.
Sapelli, Claudio. 2009. “Los Retornos a la Educación en Chile: Estimaciones por Corte Transversal y por Cohortes.” Pontificia Universidad Catolica de Chile. Instituto De Economia. Documento de Trabajo. No. 349. Santiago de Chile.
Schmidt-Hebbel, Klaus, and Carl E. Walsh. 2009. “Monetary Policy and Key Unobservables: Evidence from Large Industrial and Selected Inflation-Targeting Countries.” Working Paper No. 527, Banco Central de Chile, Santiago de Chile.
Schmidt-Hebbel, Klaus. 2005. “Crecimiento Económico en Chile: Cómo, Cuánto, Cuándo?” Presentation for Seminario en la Academia de Profesores Eméritos Universidad de Concepción Concepción.
_______. 2006. “Chile’s Economic Growth.” Cuadernos De Economía 43: 5-48.
Schoellman, Todd. 2008. “The Causes and Consequences of Cross-Country Differences in Schooling Attainment.” Munich Personal RePEc Archive. Paper 9243. Germany.
_______. 2010. “Education Quality and Development Accounting.” Department of Economics, Arizona State University, Tempe, USA.
Siles, Mary A. 2007. “Adult Education and Earnings: Evidence from Britain.” Bulletin of Economic Research 59(4): 0307-3378.
Singh, Anoop, and Martin Cerisola. 2006. “Sustaining Latin America’s Resurgence: Some Historical Perspectives.” Working paper WP/06/252. International Monetary Fund, Washington, DC.
Sohnesen, Thomas Pave, and Andreas Blom. 2003. “Is Formal Lifelong Learning a Profitable Investment for All of Life?” Report No. WPS3800, World Bank, Washington, DC.
Solimano, Andres, and Raimundo Soto. 2004. “Economic Growth in Latin America in the Late 20th Century: Evidence and Interpretation.” Macroeconomía del Desarrollo. Serie 33. Economic Development Division. Econômica para a América Latina e o Caribe (CEPAL), Economic Development Division, Santiago de Chile.
29
Solimano, Andres. 2009. “Three Decades of Neoliberal Economics in Chile: Achievements, Failures and Dilemmas.” United Nations University. Research Paper No. 2009/37. World Institute for Development Economics Research. UNU-WIDER.
Statcom Estadisticos Consultores. 2007. “Evaluación en Profundidad Programas de Becas de Postgrado.” Ministerio de Educación. Santiago de Chile.
Tokman, Andrea. 2004. “Educación y Crecimiento en Chile.” Working Papers. No. 289, Banco Central de Chile, Santiago de Chile.
UNESCO. 2010a. “World Data on Education: Chile. Donnees mondiales de l’education. Datos Mundiales de Educacion.” VII Ed. 2010/11. International Bureau of Education. Geneva, Switzerland.
_______. 2010b. “World Data on Education: Colombia. Donnees mondiales de l’education. Datos Mundiales de Educacion.” VII Ed. 2010/11. International Bureau of Educación. Geneva, Switzerland.
Unidad de Estudios y Evaluación Programa Chile Califica. 2005. “La modalidad flexible de nivelación de estudios del programa Chile Califica y su impacto en la ocupación e ingresos del trabajo.” Manuscript, Santiago de Chile.
Universidad de Concepción. 2011. “Mirando Hacia el Futuro.” Santiago de Chile.
Universidad de los Andes. 2008. “Segunda Medición de Impacto del Crédito Educativo ACCES sobre el Acceso con Equidad, Permanencia, Desempeño Académico y Graduación en la Educación Superior en Colombia 2003-2008.” Notas de Política No. 1: 1:4. Centro de Estudios sobre Desarrollo Económico (CEDE). República de Colombia.
_______. 2009. “Deserción en Educación Superior: Determinantes y Recomendaciones de Política.” Notas de Política No. 1: 1-4. Centro de Estudios Sobre Desarrollo Económico (CEDE). República de Colombia.
Universidad del Rosario. 2010. “Evaluación del Impacto del Programa ACCESS – Componente 2.” República de Colombia.
Universidad Nacional de Colombia. 2006. Mediación de Impacto del Crédito Educativo ACCES en la Cobertura, la Permanencia y el Desempeño Académico en la Educación Superior en Colombia. Centro de Investigaciones para el Desarrollo (CID). República de Colombia.
University of Florence. 2008. “Enabling the Low Skilled to take their Qualifications "One Step Up": Implementation of Action plan on adult learning.” Italy.
Valenzuela, Juan Miguel, Labarrera, Pía, and Paula Rodríguez. 2008. “Educación En Chile: Entre La Continuidad Y Las Rupturas.” Principales Hitos De Las Políticas Educativas.” Revista Iberoamericana De Educacion 48: 129-145.
Vergara, Rodrigo. 2005. “Productivity Performance in Developing Countries: Country Case Studies: Chile.” Paper. Santiago de Chile.
Villarroel, Katherine. 2009. “Educación Superior en Chile: Revisión del informe de la OECD y el Banco Mundial a la luz de la Estrategia de Innovación. Consejo Nacional de Innovacion para la Competitividad (CNIC). Santiago de Chile.
Watkins, Alfred, and Michael Ehst. 2008b. “Science, Technology, and Innovation Capacity Building for Sustainable Growth and Poverty Reduction.” Washington, DC: World Bank.
Woodhall, Maureen. 2004. “Student Loans: Potential, Problems, and Lessons from International Experience.” JHEA/RESA 2(2): 37–51.
World Bank and OCDE. 2009. “La Educación Superior en Chile.” Paris.
World Bank. 2002a. “Project Appraisal Document on a Proposed Loan in the Amount of US$75.75 Million to the Republic of Chile for a Lifelong Learning and Training Project.” Report No. 23632-CH. Washington, DC.
30
_______. 2002b. “Project Appraisal Document on a Proposed Loan in the Amount of US$200 Million to the Republic of Colombia for a Higher Education – Improving Access Project.” Report No. 23993. Washington, DC.
_______. 2003a. “Tertiary Education in Colombia: Paving the Way for Reform.” Report No. 26289. Washington, DC.
_______. 2003b. “Project Appraisal Document on a Proposed Loan in the Amount of US$25.26 Million to the Republic Of Chile for the Science for the Knowledge Economy Project.” Report No. 25324. Washington, DC.
_______. 2007. “Implementation Completion and Results Report on a Loan in the Amount of US$25.26 Million to the Republic Of Chile for the Science for the Knowledge Economy Project.” Report No. ICR0000491. Washington, DC.
_______. 2008. “Project Appraisal Document on a Proposed Loan in the Amount of US$300 Million to the Instituto Colombiano de Crédito Educativo y Estudios Técnicos en el Exterior (“ICETEX”) with the Guarantee of the Republic of Colombia for a Second Student Loan Support Project in Support of the First Phase of the Improving Access and Quality in Higher Education Program.” Report No. 41309 - CO. Washington, DC.
_______. 2009. “Implementation Completion and Results Report on a Loan in the Amount US$200 Million to the Republic of Colombia for a Higher Education – Improving Access Project.” Report No. ICR00001075. Washington, DC.
_______. 2010. “Implementation Completion and Results Report on a Loan in the Amount of US$75.75 Million to the Republic of Chile for a Lifelong Learning and Training Project.” Report No. ICR1390. Washington, DC.
Zapata, Gonzalo, and Ivo Tejeda. 2009. “Educación Superior y Mecanismos de Aseguramiento de la Calidad.” Académico. Facultad de Educación, Pontificia Universidad Católica de Chile.
Zhang, Xuelin, and Boris Palameta. 2006. “Participation in Adult Schooling and its Earnings Impact in Canada.” Statistics Canada. Business and Labour Market Analysis Division. Analytical Studies Branch Research Paper Series. Ottawa, Canada.
Zuleta, Hernando, Parada, Julián, García, Andrés, and Jacobo Campo. 2010. “Participación factorial y contabilidad del crecimiento económico en Colombia (1984-2005). Una Propuesta de Modificación del Método de Contabilidad del Crecimiento.” Revista Desarrollo y Sociedad 65: 71-121. República de Colombia.
_______. 2002b. “Project Appraisal Document on a Proposed Loan in the Amount of US$200 Million to the Republic of Colombia for a Higher Education – Improving Access Project.” Report No. 23993. Washington, DC.
_______. 2003a. “Tertiary Education in Colombia: Paving the Way for Reform.” Report No. 26289. Washington, DC.
_______. 2003b. “Project Appraisal Document on a Proposed Loan in the Amount of US$25.26 Million to the Republic Of Chile for the Science for the Knowledge Economy Project.” Report No. 25324. Washington, DC.
_______. 2007. “Implementation Completion and Results Report on a Loan in the Amount of US$25.26 Million to the Republic Of Chile for the Science for the Knowledge Economy Project.” Report No. ICR0000491. Washington, DC.
_______. 2008. “Project Appraisal Document on a Proposed Loan in the Amount of US$300 Million to the Instituto Colombiano de Crédito Educativo y Estudios Técnicos en el Exterior (“ICETEX”) with the Guarantee of the Republic of Colombia for a Second Student Loan Support Project in Support of the First Phase of the Improving Access and Quality in Higher Education Program.” Report No. 41309 - CO. Washington, DC.

31
_______. 2009. “Implementation Completion and Results Report on a Loan in the Amount US$200 Million to the Republic of Colombia for a Higher Education – Improving Access Project.” Report No. ICR00001075. Washington, DC.
_______. 2010. “Implementation Completion and Results Report on a Loan in the Amount of US$75.75 Million to the Republic of Chile for a Lifelong Learning and Training Project.” Report No. ICR1390. Washington, DC.
Zapata, Gonzalo, and Ivo Tejeda. 2009. “Educación Superior y Mecanismos de Aseguramiento de la Calidad.” Académico. Facultad de Educación, Pontificia Universidad Católica de Chile.
Zhang, Xuelin, and Boris Palameta. 2006. “Participation in Adult Schooling and its Earnings Impact in Canada.” Statistics Canada. Business and Labour Market Analysis Division. Analytical Studies Branch Research Paper Series. Ottawa, Canada.
Zuleta, Hernando, Parada, Julián, García, Andrés, and Jacobo Campo. 2010. “Participación factorial y contabilidad del crecimiento económico en Colombia (1984-2005). Una Propuesta de Modificación del Método de Contabilidad del Crecimiento.” Revista Desarrollo y Sociedad 65: 71-121. República de Colombia.

33 ANNEX A
Annex A. Chile Lifelong Learning and Training Project, 2002–09 (L71060)
Principal Ratings
ICR* ICR Review* PPAR
Outcome Satisfactory Moderately Satisfactory
Risk to Development Outcome
Moderate Significant
Bank Performance Satisfactory Moderately Satisfactory
Borrower Performance
Satisfactory Moderately Satisfactory
* The Implementation Completion and Results Report (ICR) is a self-evaluation by the responsible Bank department. The ICR Review is an intermediate IEG product that seeks to independently verify the findings of the ICR.
Key Staff Responsible
Project Task Manager/Leader Division Chief/ Sector Director Country Director
Appraisal Juan Prawda Ana Maria Arriagada Myrna Alexander
Completion Alexandria Valerio Chingboon Lee Pedro Alba

34 ANNEX A Summary
The Chile Lifelong Learning and Training Project (US$219 million, 2002-2009) had two relevant objectives: to reduce the deficit in the provision of lifelong education and training for adults, a deficit indicated by the 6.5 million adults (55 percent of adults older than 15 years) who had not completed primary or secondary education and to raise the skill level of the workforce, a level that was low (7.4 years of education) for those adults over 15 years old in the lowest income decile. These aims were aligned with the Bank’s Country Assistance Strategy objective of upgrading human capital to improve competitiveness, reduce education deficits, and improve equity.
The project envisaged four components to achieve these goals: (i) a flexible primary and secondary adult education program combined with several adult training initiatives (planned cost, US$55.1 million; actual cost, US$105.4 million); (ii) provision of technical-professional education through emerging regional networks that were to use technical-curricular progression maps from technical-secondary to technical-professional education (planned cost, US$41.3 million; actual cost, US$67.3 million); and (iii) development of a system of competencies and skill/competency progression maps based on the competencies required by the labor market, combined with four management information systems to provide information on job vacancies, vocational orientation, labor market research findings, and project services (planned cost, US$31.2 million; actual cost, US$7.9 million). A fourth component covered project coordination (planned cost, US$14.6.1 million; actual cost, US$37.8 million). These components aimed to address well-identified constraints on adult and technical education: the lack of a credible flexible adult education arrangement; weak curricular links between the secondary and the tertiary levels of technical education; inadequate financing, relevance, and outreach of small and medium enterprise training; and lack of an accreditation system for skills acquired outside of formal schooling and for improving the portability of learning gains from one educational institution to another and from one job to another.
The link of outputs to intended outcomes was strongest for the flexible primary and secondary adult education and weakest for technical education that was to be delivered by regional networks. Only the flexible primary and secondary education program achieved the expected results. The development of a system of competencies is still in progress. Some regional networks are in existence, but the technical-professional education using curricular and skill/competency progression maps did not materialize. The latter depends on the yet-to-be-completed system of competencies.
IEG rates the outcome of the project as moderately satisfactory. The project objectives were well aligned with country conditions and Bank strategy, and the project achieved its intended adult primary and secondary education outcomes, with a positive effect on skills and earnings. These benefits were primarily seen in low-income adults. The project also made some progress in developing a competency system, including training and/or certification in competencies of 35,000 trainees. Benefits from these components appear commensurate with their costs. However, the intended technical education outcomes did not materialize. Achievement of the objectives from technical education was weak, if not nil, thereby undermining overall efficiency.
35 ANNEX A
Risk to development outcome is rated as significant. Risks of the adult primary and secondary education component are negligible, as the flexible arrangement introduced by the project seems likely to remain. The risk to what little was achieved on technical education is high, because this approach is unlikely to be implemented in the foreseeable future and is subject to the uncertain development of the required competencies framework.
IEG rates Bank performance as moderately satisfactory. Quality at entry was strong on adult primary and secondary education but weak on strengthening links within technical education. Supervision was quite strong, with well-documented, regular supervision missions, a deep midterm review, and proactivity in response to findings.
IEG rates borrower performance as moderately satisfactory. Government performance was strong in providing commitment and budget. Implementing agency performance was strong in developing the adult education program but failed to adequately implement corrective action on the regional networks component.
1. Background and Context
1. The Chile Lifelong Learning and Training Project sought to help address four issues of Chile’s education sector: (i) the inequitable educational attainment of Chile’s population, where the average attainment in the lowest income decile was about 7.4 years, as compared to nearly 13.1 years for the highest decile; (ii) the need to improve the quality of technical education, which suffered from poor links between the secondary and the tertiary level curricula, weak relevance to business needs, lack of accreditation of technical-professional education providers, and lack of student learning and skills assessments; (iii) inadequacies of the small and medium enterprise training arrangements, including financing, business relevance, and outreach; and (iv) lack of a system to provide accreditation of skills acquired outside of formal schooling and poor portability of learning gains from one educational institution to another and from one job center to another. The project supported a government program—known as Chile Califica—that was conceived as a first demonstrative step toward the development of a lifelong learning and training system that would benefit a universe of 500,000 illiterate adults, 6.5 million adults with incomplete secondary education, and about 7 million workers in need of training.
2. When the project was approved in 2002, the Bank had already been engaged in education projects at all levels in Chile, including a 1991 Primary Education Improvement Project, a 1995 Secondary Education Quality Improvement Project, and a 1998 Higher Education Improvement Project. The new project was preceded by considerable technical work and informed by international workshops and study tours. In supporting this project, the Bank expected to bring to bear its technical expertise and its international perspective on adult education; it also expected to learn from a novel multisector project that aimed to bring together Chile’s education and labor sector policies.

36 ANNEX A
2. Objectives, Design, and their Relevance
OBJECTIVES
3. Objectives. The Lifelong Learning and Training Project aimed to: (i) reduce the deficit in the provision of lifelong education and training opportunities for young adults and adults, especially those who were unemployed or living in conditions of poverty and those who sought a second chance to improve their employability and quality of life; and (ii) upgrade the skill level of the borrower's workforce to improve productivity and competitiveness (Loan Agreement, p. 22).3
4. Relevance of the objectives. The relevance of the two project objectives was high. Both objectives remained consistent with the country’s development priorities and with Bank strategies when the project closed.
5. The objectives were consistent with the higher level goals, endorsed by the 1995 Country Assistance Strategy (CAS), of "upgrading” Chile's human capital, with a view to improving the country's competitiveness, reducing poverty levels and the deficits in the provision of education services, and achieving greater social integration and equity through increased and better targeted social expenditures. The focus of the objectives on the skills of the unemployed and the poor addressed the unequal distribution of education among the adult population. In articulating its two objectives, the project rightly distinguished between access to education and actual skills building, as it aimed to provide education that would enable the labor force to become more productive and competitive.
6. The government had singled out education as its highest priority in the mid-1990s, both to increase productivity and to improve social conditions. Research work on Chile’s growth experience and policies from the time the project was being prepared highlighted the potential contribution of education to growth (Beyer and Vergara 2002), with emphasis placed on the need to improve the quality. The Bank’s 2002 CAS reflected the high priority assigned to education and the Project Appraisal Document (PAD) substantiated at some length the expected productivity, employability, growth, and equity benefits of higher skills (World Bank 2002a, annex 4).
7. Education remained a high country priority at the time the project closed, despite an increased attention to rising unemployment. The Chile 2007 CAS maintained the Bank’s strategic focus on raising the quality and relevance of technical-professional education, lifelong learning opportunities, and tertiary education; the 2009 CAS Progress Report indicated the strengthened attention the government afforded to education as a result of student protests directed to improving education quality. The latter led to a 2009 reform of Chile’s education law that provided a solid legal foundation for the development of a lifelong learning and training system.
3 The articulation of the objectives in the Project Appraisal Document are identical.

37 ANNEX A
DESIGN
8. Components. The project had four components:
Component 1: Providing new opportunities for lifelong learning and training (US$55.1 million at appraisal, US$105.4 million actual) – Efforts to promote and increase the private and public supply of basic and secondary education opportunities for adults; establish a learning assessment and certification system for adults seeking to complete their basic and secondary education; and establish new modalities that harmonize adult basic and secondary education with training.
Component 2: Improving the quality and increasing the coverage of technical-professional education (US$41.4 million at appraisal, US$67.4 million actual) – Efforts to link technical secondary with tertiary technical-professional education; link technical secondary and tertiary education to the labor market in selected regions; validate skills acquired on the job and/or in training institutions; improve the quality of technical secondary and tertiary education; increase access to tertiary technical education; and improve the quality and relevance of teacher training institutions for technical-professional education.
Component 3: Establishing instruments to support the provision of a lifelong learning and training service (US$31.2 million at appraisal, US$7.9 million actual) – Efforts to establish a national system of competencies and skill/competency progression maps in nine sectors of the Chilean economy; and to establish four proactive and guiding lifelong learning and training management information systems.
Component 4: Institutional strengthening (US$14.6 million at appraisal, US$37.8 million actual) – Financing of the Project Coordination Unit and equipment, training and technical assistance for the National Training and Employment Service (Servicio Nacional de Capacitación y Empleo, or SENCE).
Table A.1. Lifelong Learning and Training Project: Results Chain
OUTPUTS INTERMEDIATE
OUTCOMES OUTCOME
Primary and secondary education for adults under flexible arrangements Integrated curricula across levels of secondary technical and technical professional education and training Labor market information Vocational training
Reduced deficit in lifelong education and training opportunities for young adults and adults, especially those unemployed and living in poverty Upgraded skills in the workforce
Improved productivity and competitiveness
Source: Author’s construction from World Bank 2002a.
9. Relevance of design. IEG rates relevance of design as substantial. The causal chain between outputs and intended outcomes (Table A.1) is assessed as follows: The funding of the new adult basic and secondary education program was directed to private adult education

38 ANNEX A providers, who received final payment (65 percent of the total payment4) for their services based on the number of adults that completed (that is, passed) learning modules. This substantiated an expectation that the funding would contribute to reduce the deficit in education and raise skill levels and productivity, although not competitiveness as the latter depends on a broad set of factors not addressed by the project. Accordingly, the causal chain from the provision of adult education to attainment of basic and secondary education levels and learning was fairly clear and convincing. On the other hand, the causal chain between funding for networks providing technical education and education and attained technical education and skill levels was neither clear nor convincing. A complex design called for regional networks of technical secondary schools, tertiary technical education institutions, training providers, employers, and workers to better link the different technical education levels, as well as link these with the labor market. These links were to be based on a new competency framework. It was unclear how the regional networks would coordinate their large numbers of stakeholders, develop the training approaches based on an as-yet undetermined competency framework, and become accountable for actually delivering the higher-quality technical education that was based on such approaches. Given these uncertainties, there was little confidence that funding of the networks would increase the coverage of a higher-quality technical education. The labor market (vacancy, training) information and vocational orientation outputs were clearly targeted to results by reaching out to students through municipal labor offices and schools.
10. Implementation arrangements. The project’s complex institutional design made project management a challenging undertaking, more in some areas than in others. At its apex was the Lifelong Learning and Training Steering Policy Board, chaired by the Minister of Economy and including the Ministers of Education and of Labor and Public Welfare. An Advisory Committee was to advise the Board at the Board’s request during implementation. A Project Coordination Unit was to provide the day-to-day management and coordination of the project at the national level. At the regional level, the president’s representative (Intendente, a presidential appointee) was to be in charge of coordinating the ministerial agencies in each region as well as brokering and mediating among the relevant project actors. This design reflected the project’s broad horizontal and vertical scope, covering the purviews of two sectors (education and labor) and implementation at two levels (national and regional). The cost of the project coordination unit, much higher than the costs of Project Coordination Units in the other two projects reviewed in this report, reflects the high complexity of the project.
3. Implementation
11. Dates. The project was approved on March 19, 2002, and declared effective on December 10, 2002, more than eight months after the expected effectiveness date. The delay was primarily because of the processing of the agreed conditions of effectiveness, covering the establishment of the ruling body for the project and of the Project Coordination Unit and its management team; the signing of the subsidiary agreement between the Ministry of Education and SENCE (the official training agency), which would be in charge of 4 This was lowered from the original level of 75 percent in order to make it more attractive for eligible suppliers to respond to the increased demand for adult education and certification.

39 ANNEX A
transferring certain payments; and submission of the first year procurement plan and of the legal opinion by the authorized government representative. Despite the delay in effectiveness, the project was officially launched by the government in April 2002, with implementation of the Lifelong Learning and Training Opportunities component making the most progress. The project was to close in November 2008 but was extended to December 31, 2009 in order to complete implementation.
12. Actions Within and Outside the Control of the Project That Affected Implementation. Perhaps the most significant action affecting implementation was a decision to upscale the program in 2004. As a result, actual expenditures increased (Table A.2). However, the Bank’s financial contribution to the project declined because of a government decision to increase its own contribution. The government cancelled US$28.6 million (equivalent to 37.8 percent of the original loan amount). Objectives remained unchanged throughout the life of the project.
Table A.2. Lifelong Learning and Training Project: Planned and Actual Expenditures
(US$ millions)
Component Planned
Expenditures Actual
Expenditures Actual as a % of Planned
Expenditures
Adult education $55.1 $104.4 191.5
Technical professional education
$41.3 $67.3 162.9
Learning and training services
$31.2 $7.9 25.3
Project coordination $14.6 $37.8 258.5
Total $150.75 $219.30 145.4
Source: World Bank 2010
13. Procurement. Bank funded procurement covered only consultants, mostly firms. Most procurement was based on least-cost selection (US$34.31 million) or consultants’ qualifications (US$31.54 million), followed by quality-based selection ($9.73 million) and individual consultant selection (US$7.77 million). Procurement risk was assessed as low at appraisal. Although project procurement was to benefit by support from the Ministry of Education’s procurement and contracting unit (with experience from two previous bank projects) and from six staff familiar with Bank guidelines, procurement implementation proved challenging because of the multiplicity of national and subnational implementing units. Initial unsatisfactory compliance with Bank rules concerned selection of consultants by the project’s executing entities. There were two reasons for this situation. First, the qualified and experienced staff in the Ministry of Education and the Project Coordination Unit who were to carry out the consultants’ selection process under Bank procedures left their jobs soon after the project began. Second, Chilean legislation required the use of the newly enacted Portal Chile Compra, an e-procurement system that slightly differed from the Bank’s standard documents and procedures. Having lost the experienced staff, no alert was provided to the government that when these discrepancies exist, the Bank rules apply over

40 ANNEX A the national regulations. As a result, the Coordination Unit hired additional staff experienced in Bank procedures and conducted procurement workshops for all executing agencies. These actions resolved the problem, and there were no more deviations with Bank’s procurement practices.
14. Financial Management. An initial slow pace of disbursements of Bank funds that did not match the faster pace of implementation was caused by a government decision to increase local financing; this ultimately led to an extension of the closing date and the cancellation of US$28.6 million in support. A number of financial management weaknesses (for example, on reporting and control) were identified throughout the life of the project and were resolved (World Bank 2007, p. 10).
15. Safeguards. No safeguard policies were triggered by this project.
4. Achievement of the Objectives
REDUCE THE DEFICIT IN THE PROVISION OF LIFELONG EDUCATION AND TRAINING OPPORTUNITIES FOR YOUNG ADULTS AND ADULTS, ESPECIALLY THOSE WHO ARE UNEMPLOYED OR LIVING IN CONDITIONS OF POVERTY AND THOSE WHO SEEK A SECOND CHANCE TO IMPROVE THEIR EMPLOYABILITY AND QUALITY OF LIFE. (Rating – Substantial)
16. Outputs. Project outputs are summarized in Appendix Table A3.1. The most important was the enrollment, assessment and certification under the flexible adult education program. In particular, the adult education program enrolled about 250,000 students, the main output that contributed to the objective. Outputs from the second component were not monitored but it is unlikely that it was significant because the competency framework on which it was to be based was not fully developed during the time of the project.
17. Outcomes. The project aimed to reduce the percentage of adults age 15 to 65 years with incomplete basic and/or secondary education. This indicator declined from 49.0 percent in 2003 to 47.7 in 2006, following declining trends since the early 1990s. The corresponding indicators for the 24-34 and 25+ age groups also declined between those two years and continued to decline through 2008 (Appendix Table A3.2). Accordingly, while the percent of adults with incomplete education declined, it is difficult to link it to project efforts, as the decline is likely to reflect the same forces that drove previous trends.
18. It is more revealing to look at enrollment data. Figure A.1 depicts the time path of adult enrollment as a percent of Chile’s labor force, as well as the gross secondary and tertiary enrollment rates, and the average years of education of the labor force. It shows the acceleration in adult education after the program was initiated (2002), with adult enrollment rates higher than the previous four years (1998-01) and then declining to pre-program levels by 2007. This suggests that the program increased (the flow of) adult education to above the level it otherwise would have attained, at least for a time. Furthermore, as the flexible education program provided an alternative that was unavailable before, the flow of adult education may have remained higher than it would have in the absence of this alternative.
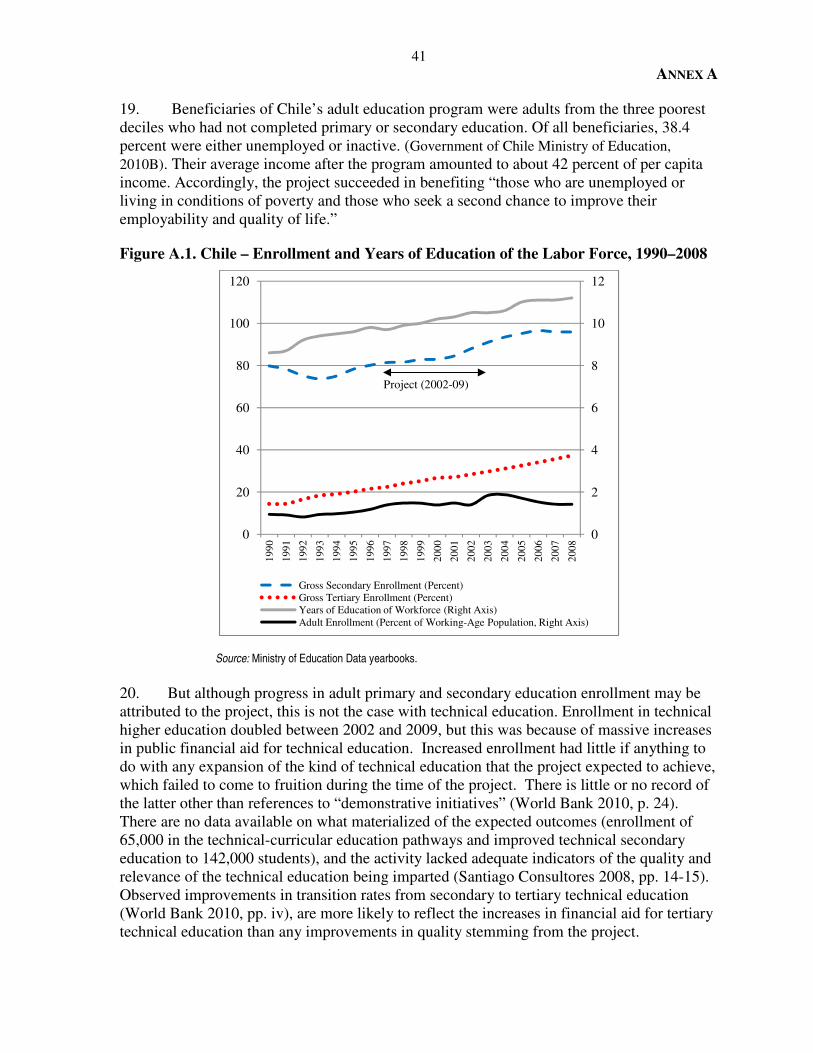
41 ANNEX A
19. Beneficiaries of Chile’s adult education program were adults from the three poorest deciles who had not completed primary or secondary education. Of all beneficiaries, 38.4 percent were either unemployed or inactive. (Government of Chile Ministry of Education, 2010B). Their average income after the program amounted to about 42 percent of per capita income. Accordingly, the project succeeded in benefiting “those who are unemployed or living in conditions of poverty and those who seek a second chance to improve their employability and quality of life.”
Figure A.1. Chile – Enrollment and Years of Education of the Labor Force, 1990–2008
Source: Ministry of Education Data yearbooks.
20. But although progress in adult primary and secondary education enrollment may be attributed to the project, this is not the case with technical education. Enrollment in technical higher education doubled between 2002 and 2009, but this was because of massive increases in public financial aid for technical education. Increased enrollment had little if anything to do with any expansion of the kind of technical education that the project expected to achieve, which failed to come to fruition during the time of the project. There is little or no record of the latter other than references to “demonstrative initiatives” (World Bank 2010, p. 24). There are no data available on what materialized of the expected outcomes (enrollment of 65,000 in the technical-curricular education pathways and improved technical secondary education to 142,000 students), and the activity lacked adequate indicators of the quality and relevance of the technical education being imparted (Santiago Consultores 2008, pp. 14-15). Observed improvements in transition rates from secondary to tertiary technical education (World Bank 2010, pp. iv), are more likely to reflect the increases in financial aid for tertiary technical education than any improvements in quality stemming from the project.
0
2
4
6
8
10
12
0
20
40
60
80
100
12019
90
1991
1992
1993
1994
1995
1996
1997
1998
1999
2000
2001
2002
2003
2004
2005
2006
2007
2008
Gross Secondary Enrollment (Percent)Gross Tertiary Enrollment (Percent)Years of Education of Workforce (Right Axis)Adult Enrollment (Percent of Working-Age Population, Right Axis)
Project (2002-09)
42 ANNEX A 21. The trend in the average years of education, an input indicator of skill levels, slowed down slightly after 2002. Average years of education increased by 0.6 years from 2002 to 2007, compared with a change of 0.8 years for 1997-2002. Figure A.1 suggests that this was partly caused by the leveling of the secondary enrollment rate as it approached 100 percent. The enhanced supply of adult education may have helped sustain progress in average years of education for a time, offsetting the decline in the rate of expansion of secondary education. But the major driving force in raising skill levels was the higher tertiary enrollment rates, including technical tertiary education after 1997, as a result of government support and other factors not related to the project.
UPGRADE THE SKILL LEVEL OF THE WORKFORCE TO IMPROVE ITS PRODUCTIVITY AND COMPETITIVENESS. (Rating – Substantial)
22. Outputs. Adult education enrollment, assessment, and certification of completed studies contributed to raise adult skills. Most important was the adult education program, which trained about 250,000 adults. It is unlikely that the other major output relevant for skills -- technical training by the regional networks -- was delivered in any significance.
23. Outcomes. The adult education program had some effect on the employment and earnings of the beneficiaries, which suggests that the education had an impact on marketable skills and productivity of beneficiaries. There is, however, no indication that these improved overall competitiveness to any significant degree, as the latter depends on a broader set of factors that the project did not cover. Three impact evaluations of this program were conducted (World Bank 2010). These aimed to gauge the impact on earnings and employability of those who participated in the program. Although the evaluations were limited by faulty beneficiary databases (Santiago Consultores 2008, p. 33), results suggest fairly high rates of return to adult education, particularly for the young, and perhaps some impact on employability, as follows:
• The first study, sponsored by the program in 2003-04 (Consultores en Economía y Desarrollo 2004), indicated that the income of participating females was 21.8 percent higher than the control group, with young women (30 and younger) benefiting by 25.9 percent, older women by 20. 4 percent, younger men by 5.8 percent, and older men receiving no income benefit. Impact on employability appeared negative for all groups except younger women.
• The second study, conducted by the program team (Unidad de Estudios y Evaluación de Chile Califica 2005), indicated that the highest impact on income pertained to young men (22-30 percent), followed by young women (12-14 percent) and older men (10 percent). Impact on employability was highest for young men and was still positive for young women.

43 ANNEX A
• The third study, conducted by an independent consultant at the request of Chile’s budget office (Santiago Consultores y Asociados 2009),5 indicated that the program increased female income by 14 percent and did not affect male income significantly. Impact on income was larger on the young (age 35 and less). Impact on the likelihood of continuance to higher education was significant. Impact on employability was not significant.
24. An impact evaluation was also conducted for workers who were trained in competencies, with some tested and certified. The evaluation found a positive but not statistically significant impact on earnings (Santiago Consultores y Asociados 2009).
5. Efficiency
25. IEG rates efficiency as modest. The PAD assessed potential benefits from adult education in terms of increased productivity, faster economic growth, and lesser income inequality and estimated that relatively small increases in adult incomes would be needed to make adult education efficient. The ex post evaluations cited above also indicated positive effects on earnings and an overall positive present value of benefits from the adult education and competency training programs. The delivery arrangements for adult education, including accreditation of providers (procured at fixed-price) and payment based on the number of students successfully completing course work, encouraged cost-effectiveness, although some weaknesses in the quality and reliability of procurement administration were identified during implementation. The funding of regional networks for the delivery of technical education was allocated competitively (based on network proposals), but the effectiveness of those resources was clearly very low, for little or no progress was made in actually delivering the intended technical education.
6. Ratings
OUTCOME
26. With relevance of objectives and design rated respectively “high” and “substantial,” efficacy of both objectives rated “substantial” and efficiency rated “modest”, IEG rates outcome as moderately satisfactory.
RISK TO DEVELOPMENT OUTCOME
27. Risk to development outcome is assessed by considering two dimensions: (i) the likelihood that some changes may occur that are detrimental to the ultimate achievement of the operation’s development outcome and (ii) the impact on the operation’s development outcomes of some or all of these changes. The potential changes to be considered are developments that would reduce the supply or the demand for adult education, which would have a critical impact on outcomes. It is unlikely that either would happen. Chile’s
5 The impact evaluation tracked beneficiaries and their incomes. It was somewhat constrained by inadequacies of the beneficiary database. This suggests that projects need to better anticipate the data needs of their ex post assessments.

44 ANNEX A government has supported adult education for many years. There is every indication that it will continue to do so in the foreseeable future and that the support will continue to entail a flexible arrangement like the adult flexible education option with the opportunity to obtain certification of skills by independent testing. On the demand side, Chile’s record suggests that enrollment in adult education is stable enough to foresee a demand for government services in this area, derived from the growing skills needs of firms.
28. Questions remain, however, on whether secondary and tertiary technical education will develop in the way that the project envisaged (through regional networks incorporating a national framework of competencies). There is a real risk that what little has been achieved of this outcome will not be sustained or develop further. Technical education development is likely to take a different path, perhaps with some role for a competency system (currently under development). Given that an integrated technical education was a major expected project outcome, IEG rates risk to development outcome as significant.
MONITORING AND EVALUATION
29. M&E Design. Table A.3 indicates the project’s M&E activities as listed in the PAD. The PAD’s brief description indicates that impact evaluations or evaluation of outcomes were to be conducted under each component and thereby suggests that planned M&E activities were to reflect project objectives. The one outcome indicator (percentage of adults with incomplete basic and/or secondary education) was inadequate because its trend was driven primarily by other education programs. Defined indicators for the skills objective (enrollment in training centers, transition rates from secondary technical to tertiary technical education and the labor market) did not adequately capture impact on marketable skills. Output indicators reasonably covered project activities and some of these indicators had quantitative targets to be achieved by the project.
30. M&E Implementation. M&E implementation covered primarily adult education. Although implementation of annual plans by the regional networks were also monitored, there was little if any M&E of outcomes from the networks. Participants, activities, and budgets in vocational education plans were also monitored.
31. Furthermore, a number of evaluations of project activities were undertaken:
• A 2003-04 assessment of flexible education that identified positive impacts on the earnings of students that passed tests (Consultores en Economía y Desarrollo 2004)
• A 2004-05 assessment that rejected the proposal to extend the training tax credit to programs combing institutional with on-the-job-training (Centro de Investigación y Desarrollo de la Educación, CIDE 2005)
• A 2004 assessment of pilots on integration of adult basic and secondary education with secondary technical education that found highly satisfied pilot beneficiaries and room for improvement in materials, infrastructure, information submitted by the training institutions (Organismos Técnicos de Capacitación), and targeting of beneficiaries (Universidad Central, 2004).

45 ANNEX A
• A 2005 evaluation of microenterprise training that identified problems in selection of beneficiaries and alignment with demand, but also found high levels of satisfaction among selected beneficiaries and other stakeholders (EMG Consultores 2005)
• A 2007 assessment that validates the independent assessment and certification arrangements in force and rejects an alternative model whereby the government directly assesses and certifies (IGT 2007).
• A 2008 assessment of implementation of vocational orientation activities that identifies training of orientation providers as the best achievement in this area of the project (Guernica Consultores, 2008)
• A 2009 impact assessment of labor competencies certification (Guernica Consultores, 2009)
• A 2009 overall performance assessment of the program, conducted by an independent consultant on behalf of Chile’s budget office (Santiago Consultores, 2009)
• Other evaluations, not concluded at the time the project closed, covered dual education, certification of labor competencies, training of technical education teachers, and technical education.6
Table A.3. Lifelong Learning and Training Project: M&E Activities
Component and Subcomponent Monitoring and Evaluation Activities
1: LIFELONG LEARNING AND TRAINING OPPORTUNITIES
Basic & Secondary Education for Adults Establishment of a monitoring system and impact evaluations
Certification Supervision and monitoring of the assessment units.
Harmonization of adult basic and secondary education with training
Diagnostic studies and impact evaluations
2: TECHNICAL PROFESSIONAL EDUCATION
Articulation of technical secondary education with technical-professional education and the labor market (competitive fund)
Monitoring and impact evaluations.
3: LIFELONG LEARNING AND TRAINING SERVICES
Competency framework (i) Development and implementation of a system to monitor the quality and pertinence of the service provided by technical schools and (ii) Monitoring and evaluation of the sectoral activities and outcomes.
Management information system Evaluation of the systems’ activities and outcomes.
4: PCU AND SENCE (i) Evaluation and impact studies and other specific related research; (ii) Monitoring project implementation, including disbursements and collection of expenditure documentation
Source: Project Appraisal Document
6 It is unclear whether they were eventually completed; the IEG mission could not locate them.

46 ANNEX A 32. An important gap of M&E implementation was the failure to better track the performance of the regional networks, a major project component on which there is no information on outputs.
33. M&E Utilization. The 2004 assessments led to a reformulation of the program that year and the 2009 overall performance assessment contributed to the government’s decision to drop its support for the regional networks approach.
34. With some important pitfalls in design and implementation, IEG rates the quality of M&E as substantial.
BANK PERFORMANCE
35. Quality-at-Entry. The project earned a Quality Assurance Group assessment rating of “highly satisfactory,” highlighting its strategic relevance, technical quality, and poverty and social aspects. Although IEG agrees that the project had design merits, it suggests that the design of Component 2 (the regional networks) suffered from its weak link to an effective delivery of technical education based on curricular progression maps7 and from weak arrangements to develop those maps, and that monitoring and evaluation design could have been more strategic, particularly in monitoring Component 2 and ensuring stronger capabilities to assess the efficiency of the investments on adult education. The weak design regarding delivery of technical education through the regional networks was a critical factor that explains the low or nil efficacy of this component. The weak design of M&E arrangements explains some of the pitfalls in gathering adequate evidence to assess performance, both in adult education and the regional networks component. IEG rates quality at entry as moderately satisfactory.
36. Quality of Supervision. The quality of supervision was quite strong, with a credible and effective task manager carrying out well-documented, regular supervision missions and a deep midterm review and acting with regard to the findings. The quality of supervision is reflected in systematic and substantive terms of reference, aide memoires, and back-to-office reports in the 16 supervision missions that were conducted over the life of the project. Accordingly, IEG rates quality of supervision as highly satisfactory.
37. Accordingly, IEG rates Bank performance as moderately satisfactory.
BORROWER PERFORMANCE
38. Government Performance. Government performance was critical in this project, as its governing body was a board chaired by the Minister of Economy and including the Ministers of Education and of Labor and Public Welfare. As indicated before, the government increased its financial contribution to the program when it decided to expand its size. Their leadership at all times reflected strong ownership, strategic vision, and learning from
7 Progression maps consist of a string of curricular modules mapping the progression from grade 11 of the technical secondary education to tertiary technical-professional education.

47 ANNEX A
experience. More coordination could have been achieved between the Ministry of Education and the Ministry of Labor. IEG rates the government performance as satisfactory.
39. Implementing Agency Performance. Equally critical was the Project Coordination Unit’s performance, given the project complex institutional arrangement that combined two sectors (education and labor) and two government levels (central and regional), with multiple actors in both levels. The Project Coordination Unit was able to provide continuity and achieved considerable successes, particularly in implementing the flexible adult education program and advancing the competency framework. It was, however, unsuccessful in developing the regional networks, although this was partly because of design flaws and the sheer difficulty of coordinating the large number of actors involved. Because of this moderate shortcoming, IEG rates implementing agency performance as moderately satisfactory.
40. IEG rates borrower performance as moderately satisfactory.
7. Lessons
41. The Lifelong Learning and Training Project offers the following lessons:
Broadening Higher Education Access
• Linking payments of education providers to enrollment and completion outcomes of their trainees can enhance the likelihood of delivering those results. The project offers contrasting examples that illustrate this lesson: the successful flexible adult education program, where the link was achieved by paying education providers against the number of students that completed independently tested course work, and the unsuccessful technical education component, where provider budgets were monitored, but payments were made on the basis of inputs and technical assistance, not on delivery of technical education and training based on proposed methods linking education to competencies.
Increasing Higher Education Quality
• Developing a technical and vocational education and training system that links different technical education levels (e.g., secondary and tertiary) and meets market needs may challenge policy making and implementation capacity. The project aimed to achieve this through skill/competencies maps linking different levels of technical education and training programs and in different markets. Experience with the project showed how difficult it is to actually develop and implement a system of competencies from the top and to coordinate the multiple stakeholders involved.
Links to the Labor Market
• Defining separate education supply and skill-building objectives highlights the extent to which education actually contributes to skills building.. Assessing this contribution is critical, particularly in adult education, where research is scant and inconclusive.
48 ANNEX A • An adult education program that adds value through its curriculum, flexibility, and
credibility may raise labor earnings while not affecting employment rates. The available literature is controversial on the rates of return to adult education, with some estimates even pointing to no or very low returns and others being more sanguine. The project shows that attention to the design of the program will make a difference. In the case of the project, the program made efforts to adapt the regular primary and secondary curriculum to adult needs, develop flexible and accessible delivery arrangements, and establish credible testing processes. With some exceptions, returns from higher labor earnings were largely positive, even as the program focused on the most disadvantaged populations.
• Deficiencies in anticipating the information requirements of M&E for education projects are likely to undermine the robustness of impact evaluations. The project envisaged tracer studies to assess outcomes on earnings. The project collected beneficiary information that was less than adequate for the implementation of these studies and thereby undermined the statistical significance of some findings.
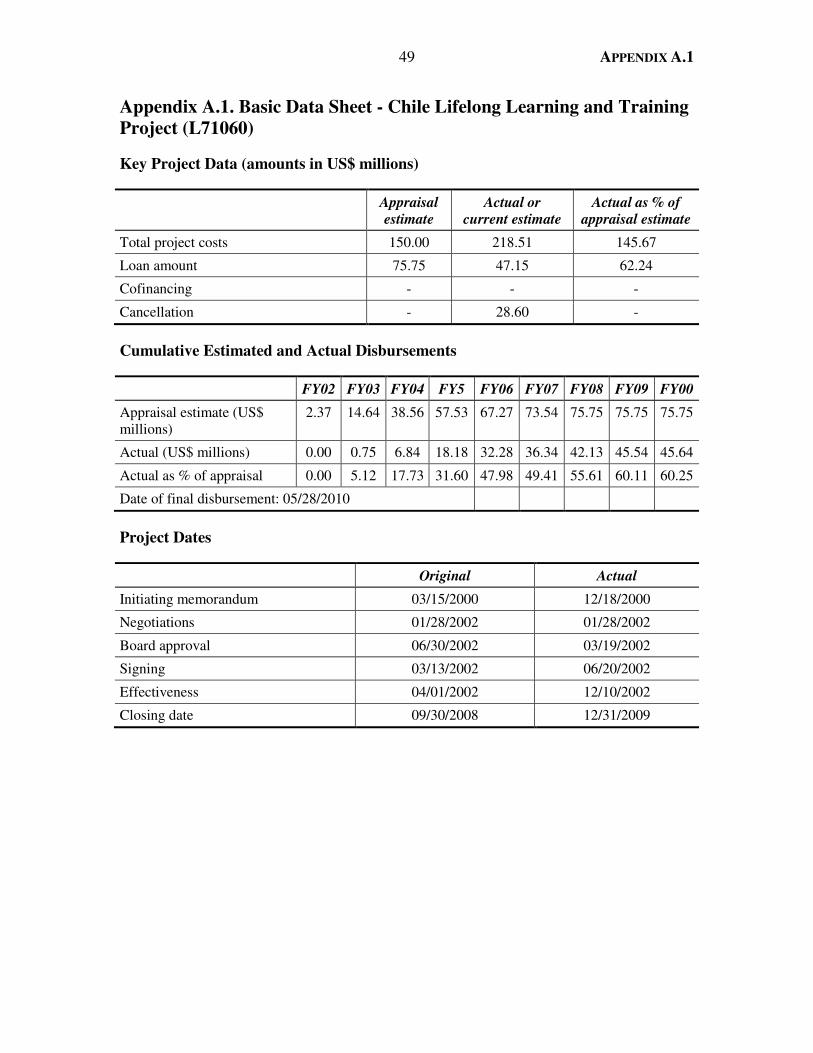
49 APPENDIX A.1
Appendix A.1. Basic Data Sheet - Chile Lifelong Learning and Training Project (L71060)
Key Project Data (amounts in US$ millions)
Appraisal estimate
Actual or current estimate
Actual as % of appraisal estimate
Total project costs 150.00 218.51 145.67
Loan amount 75.75 47.15 62.24
Cofinancing - - -
Cancellation - 28.60 -
Cumulative Estimated and Actual Disbursements
FY02 FY03 FY04 FY5 FY06 FY07 FY08 FY09 FY00
Appraisal estimate (US$ millions)
2.37 14.64 38.56 57.53 67.27 73.54 75.75 75.75 75.75
Actual (US$ millions) 0.00 0.75 6.84 18.18 32.28 36.34 42.13 45.54 45.64
Actual as % of appraisal 0.00 5.12 17.73 31.60 47.98 49.41 55.61 60.11 60.25
Date of final disbursement: 05/28/2010
Project Dates
Original Actual
Initiating memorandum 03/15/2000 12/18/2000
Negotiations 01/28/2002 01/28/2002
Board approval 06/30/2002 03/19/2002
Signing 03/13/2002 06/20/2002
Effectiveness 04/01/2002 12/10/2002
Closing date 09/30/2008 12/31/2009

APPENDIX A.1 50
Staff Time and Cost
Stage of Project Cycle Staff Time and Cost (Bank Budget Only)
Lending
No. of staff weeks
USD Thousands (including travel and consultants costs)
FY00 19 82.86
FY01 22 131.07
FY02 20 165.87
FY03 5.79
FY04 0.00
FY05 0.00
FY06 0.00
FY07 0.00
FY08 0.00
Total: 61 385.59
Supervision/ICR
FY03 7 83.00
FY04 9 126.35
FY05 14 120.67
FY06 19 123.86
FY07 21 108.84
FY08 26 118.31
FY09 5 0.00
Total: 101 681.03
Task Team Members
Names Responsibility/Specialty Unit
Lending
Juan Prawda Task Team Leader/Lead Education Specialist
LCSHE
William Experton Acting Sector Manager AFTED
Suhas Parandekar Economist EASHE
Jacques Mazeran Consultant Technical Education AFTED
Raul Talan Consultant Competency Assessment and Certification System
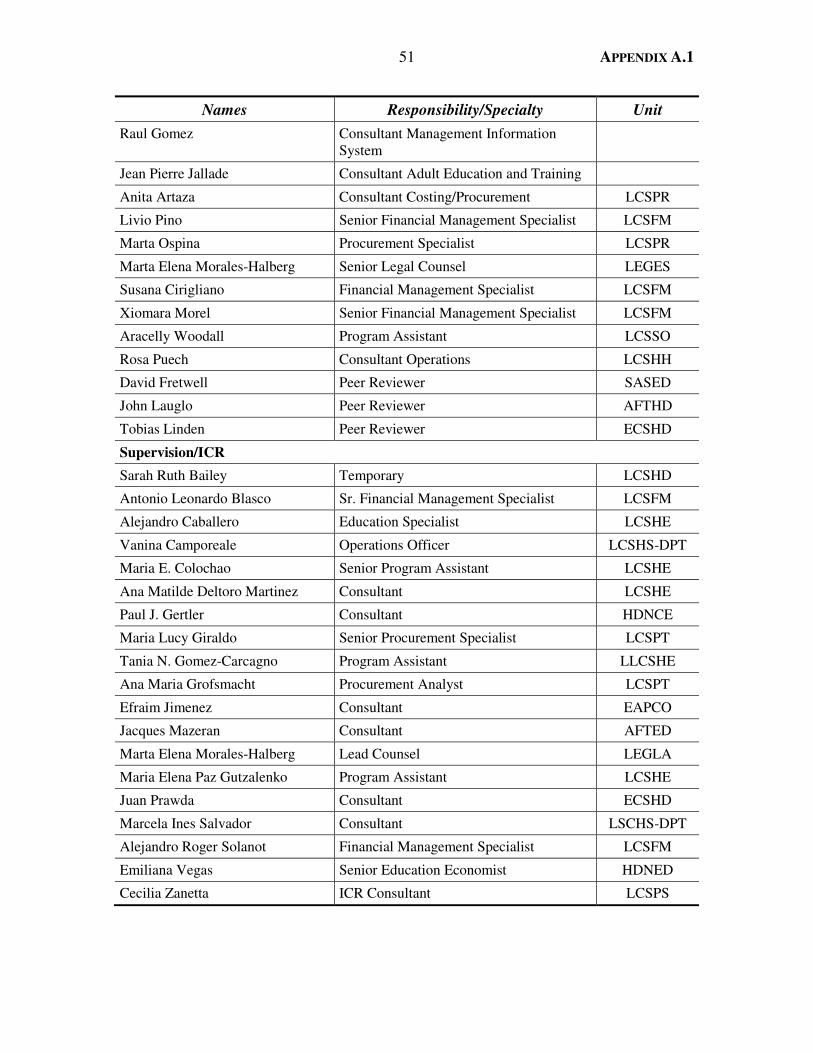
51 APPENDIX A.1
Names Responsibility/Specialty Unit
Raul Gomez Consultant Management Information System
Jean Pierre Jallade Consultant Adult Education and Training
Anita Artaza Consultant Costing/Procurement LCSPR
Livio Pino Senior Financial Management Specialist LCSFM
Marta Ospina Procurement Specialist LCSPR
Marta Elena Morales-Halberg Senior Legal Counsel LEGES
Susana Cirigliano Financial Management Specialist LCSFM
Xiomara Morel Senior Financial Management Specialist LCSFM
Aracelly Woodall Program Assistant LCSSO
Rosa Puech Consultant Operations LCSHH
David Fretwell Peer Reviewer SASED
John Lauglo Peer Reviewer AFTHD
Tobias Linden Peer Reviewer ECSHD
Supervision/ICR
Sarah Ruth Bailey Temporary LCSHD
Antonio Leonardo Blasco Sr. Financial Management Specialist LCSFM
Alejandro Caballero Education Specialist LCSHE
Vanina Camporeale Operations Officer LCSHS-DPT
Maria E. Colochao Senior Program Assistant LCSHE
Ana Matilde Deltoro Martinez Consultant LCSHE
Paul J. Gertler Consultant HDNCE
Maria Lucy Giraldo Senior Procurement Specialist LCSPT
Tania N. Gomez-Carcagno Program Assistant LLCSHE
Ana Maria Grofsmacht Procurement Analyst LCSPT
Efraim Jimenez Consultant EAPCO
Jacques Mazeran Consultant AFTED
Marta Elena Morales-Halberg Lead Counsel LEGLA
Maria Elena Paz Gutzalenko Program Assistant LCSHE
Juan Prawda Consultant ECSHD
Marcela Ines Salvador Consultant LSCHS-DPT
Alejandro Roger Solanot Financial Management Specialist LCSFM
Emiliana Vegas Senior Education Economist HDNED
Cecilia Zanetta ICR Consultant LCSPS
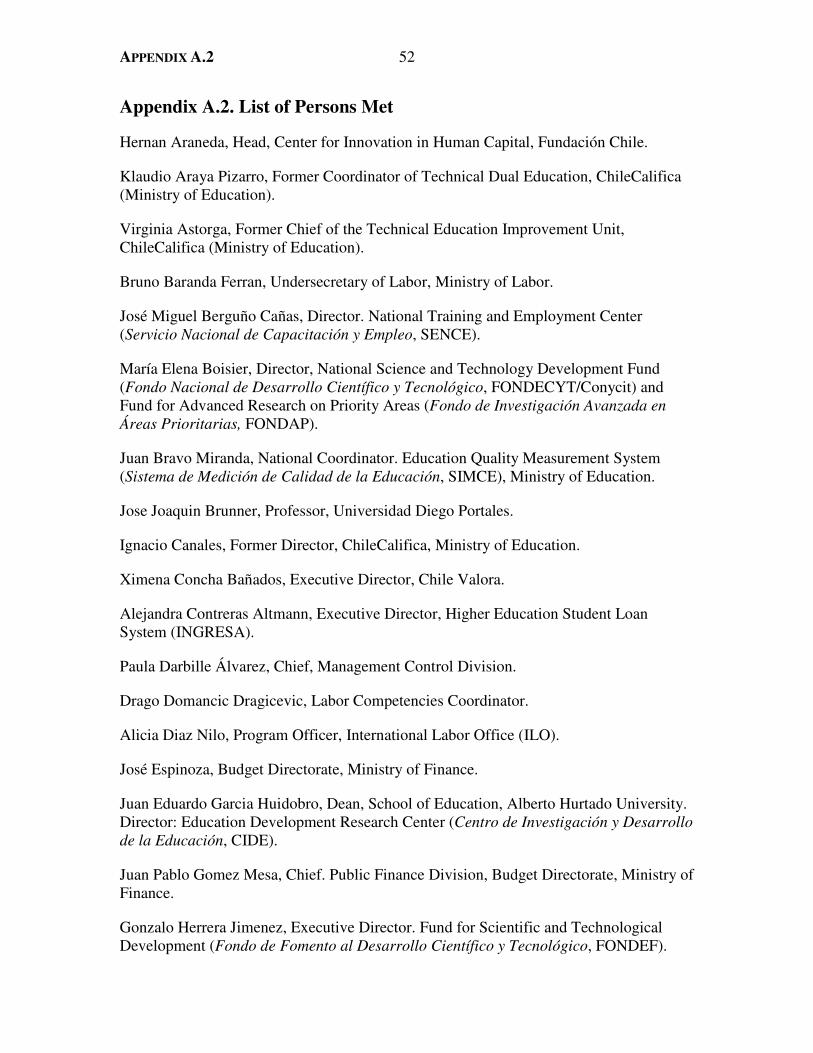
APPENDIX A.2 52
Appendix A.2. List of Persons Met
Hernan Araneda, Head, Center for Innovation in Human Capital, Fundación Chile.
Klaudio Araya Pizarro, Former Coordinator of Technical Dual Education, ChileCalifica (Ministry of Education).
Virginia Astorga, Former Chief of the Technical Education Improvement Unit, ChileCalifica (Ministry of Education).
Bruno Baranda Ferran, Undersecretary of Labor, Ministry of Labor.
José Miguel Berguño Cañas, Director. National Training and Employment Center (Servicio Nacional de Capacitación y Empleo, SENCE).
María Elena Boisier, Director, National Science and Technology Development Fund (Fondo Nacional de Desarrollo Científico y Tecnológico, FONDECYT/Conycit) and Fund for Advanced Research on Priority Areas (Fondo de Investigación Avanzada en Áreas Prioritarias, FONDAP).
Juan Bravo Miranda, National Coordinator. Education Quality Measurement System (Sistema de Medición de Calidad de la Educación, SIMCE), Ministry of Education.
Jose Joaquin Brunner, Professor, Universidad Diego Portales.
Ignacio Canales, Former Director, ChileCalifica, Ministry of Education.
Ximena Concha Bañados, Executive Director, Chile Valora.
Alejandra Contreras Altmann, Executive Director, Higher Education Student Loan System (INGRESA).
Paula Darbille Álvarez, Chief, Management Control Division.
Drago Domancic Dragicevic, Labor Competencies Coordinator.
Alicia Diaz Nilo, Program Officer, International Labor Office (ILO).
José Espinoza, Budget Directorate, Ministry of Finance.
Juan Eduardo Garcia Huidobro, Dean, School of Education, Alberto Hurtado University. Director: Education Development Research Center (Centro de Investigación y Desarrollo de la Educación, CIDE).
Juan Pablo Gomez Mesa, Chief. Public Finance Division, Budget Directorate, Ministry of Finance.
Gonzalo Herrera Jimenez, Executive Director. Fund for Scientific and Technological Development (Fondo de Fomento al Desarrollo Científico y Tecnológico, FONDEF).

53 APPENDIX A.2
Osvaldo Larrañaga, Equity Program Officer (UNDP), Professor (Universidad de Chile).
Maria Eugenia Letelier Gálvez, Former Head. Evaluation y Certification. Chilecalifica, Ministry of Education.
Alejandra Manquilef, Labor Studies Coordinator, Labor Undersecretary, Ministry of Labor.
Patricio Meller, Reseacher, Corporation for Latin American Studies (Corporación de Estudios para Latinoamerica, CIEPLAN), University of Chile, Observatorio de Graduados de la Educación Superior Chilena (www.futurolaboral.cl)
Daniela Meneses Montero, Chief, Higher Education Department, National Education Council (Consejo Nacional de Educación CNED).
Martin Miranda Oraryún, Director, Technical and Technological Education Program, School of Education, University Academy of Christian Humanism.
Juan Prawda, Former Project Task Manager, World Bank.
Ricardo Reich Albertz, General Coordinator, Higher Education Division, Ministry of Education.
Claudio Sapelli, Teaching Director, Economics Institute, Catholic University of Chile.
Francisca Sotomayor Echenique, Coordinator, Flexible Adult Education, Chile Califica, Ministry of Education.
Daniela Torre, National Education Council (Consejo Nacional de Educación CNED).
Erick Vidal, Former Accreditation Officer, Chile Califica, Ministry of Education.
Juan José Ugarte, Chief, Higher Education Division, Ministry of Education.
Alexandra Valerio, Senior Economist, HDNED.
Eduardo Velez Bustillo, Former Latin America and Caribbean Human Development Sector Manager.
José Weinstein, Head of Educación, Fundación Chile.
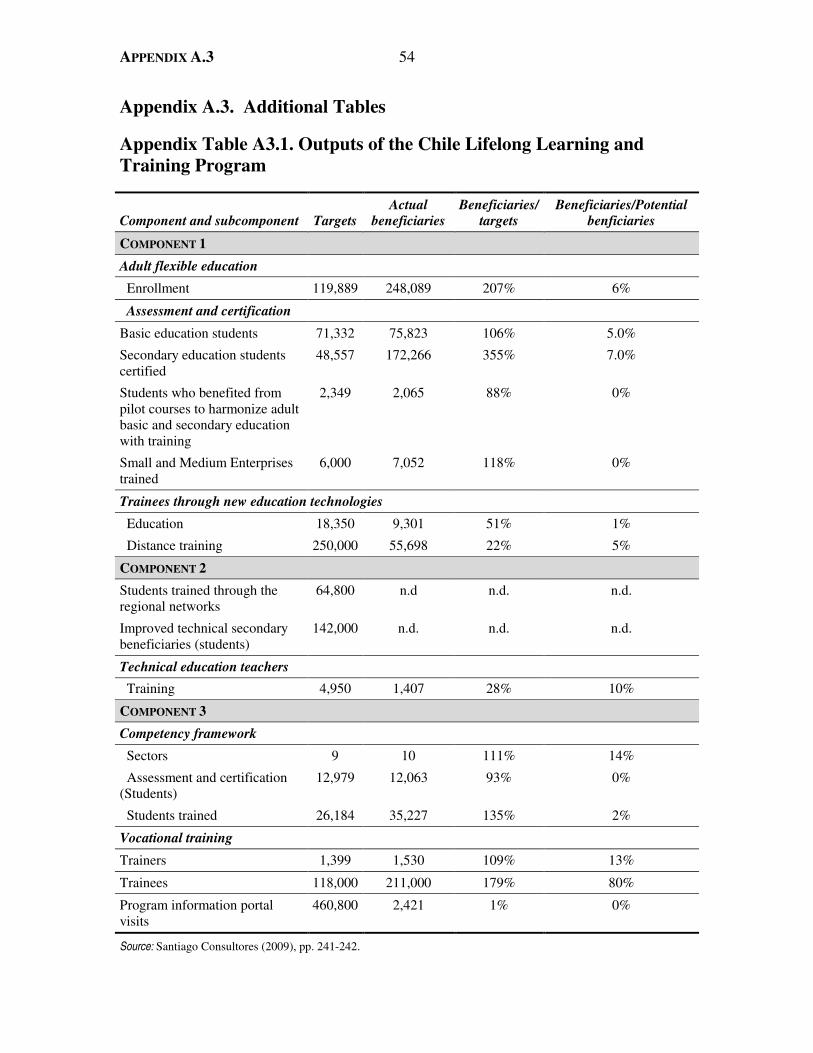
APPENDIX A.3 54
Appendix A.3. Additional Tables
Appendix Table A3.1. Outputs of the Chile Lifelong Learning and Training Program
Component and subcomponent Targets Actual
beneficiaries Beneficiaries/
targets Beneficiaries/Potential
benficiaries
COMPONENT 1
Adult flexible education
Enrollment 119,889 248,089 207% 6%
Assessment and certification
Basic education students 71,332 75,823 106% 5.0%
Secondary education students certified
48,557 172,266 355% 7.0%
Students who benefited from pilot courses to harmonize adult basic and secondary education with training
2,349 2,065 88% 0%
Small and Medium Enterprises trained
6,000 7,052 118% 0%
Trainees through new education technologies
Education 18,350 9,301 51% 1%
Distance training 250,000 55,698 22% 5%
COMPONENT 2
Students trained through the regional networks
64,800 n.d
n.d. n.d.
Improved technical secondary beneficiaries (students)
142,000 n.d. n.d. n.d.
Technical education teachers
Training 4,950 1,407 28% 10%
COMPONENT 3
Competency framework
Sectors 9 10 111% 14%
Assessment and certification (Students)
12,979 12,063 93% 0%
Students trained 26,184 35,227 135% 2%
Vocational training
Trainers 1,399 1,530 109% 13%
Trainees 118,000 211,000 179% 80%
Program information portal visits
460,800 2,421 1% 0%
Source: Santiago Consultores (2009), pp. 241-242.
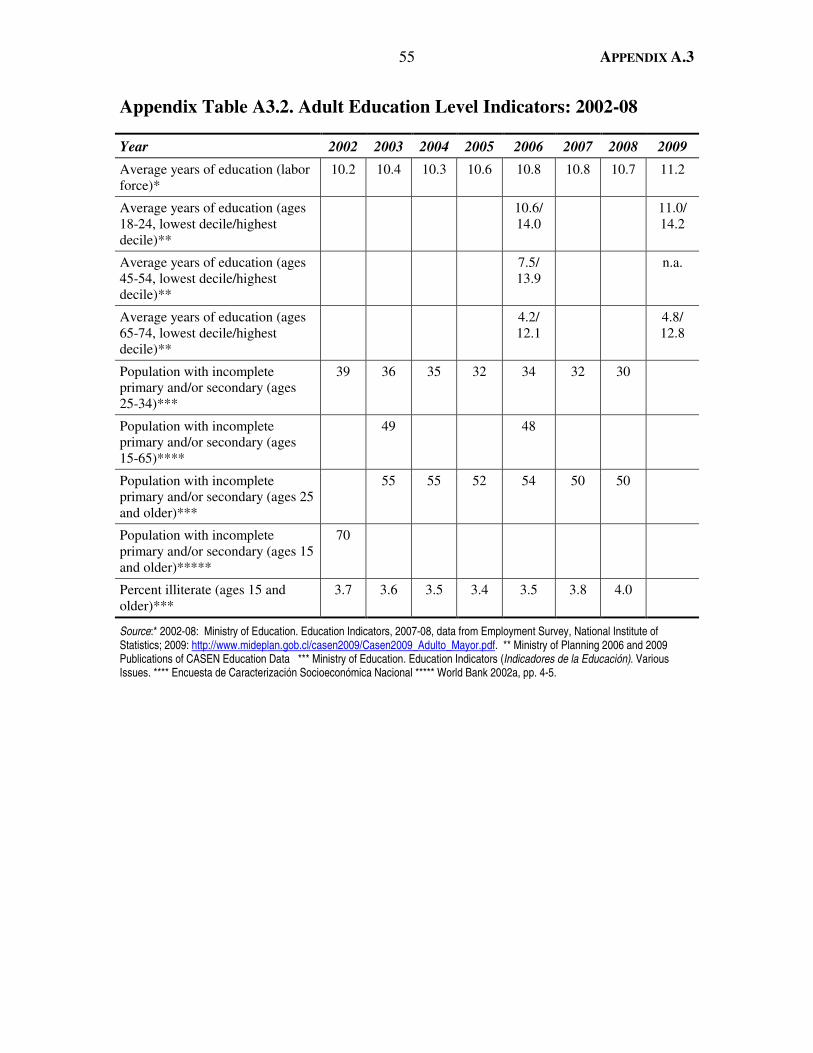
55 APPENDIX A.3
Appendix Table A3.2. Adult Education Level Indicators: 2002-08
Year 2002 2003 2004 2005 2006 2007 2008 2009
Average years of education (labor force)*
10.2 10.4 10.3 10.6 10.8 10.8 10.7 11.2
Average years of education (ages 18-24, lowest decile/highest decile)**
10.6/ 14.0
11.0/ 14.2
Average years of education (ages 45-54, lowest decile/highest decile)**
7.5/ 13.9
n.a.
Average years of education (ages 65-74, lowest decile/highest decile)**
4.2/ 12.1
4.8/ 12.8
Population with incomplete primary and/or secondary (ages 25-34)***
39 36 35 32 34 32 30
Population with incomplete primary and/or secondary (ages 15-65)****
49 48
Population with incomplete primary and/or secondary (ages 25 and older)***
55 55 52 54 50 50
Population with incomplete primary and/or secondary (ages 15 and older)*****
70
Percent illiterate (ages 15 and older)***
3.7 3.6 3.5 3.4 3.5 3.8 4.0
Source:* 2002-08: Ministry of Education. Education Indicators, 2007-08, data from Employment Survey, National Institute of Statistics; 2009: http://www.mideplan.gob.cl/casen2009/Casen2009_Adulto_Mayor.pdf. ** Ministry of Planning 2006 and 2009 Publications of CASEN Education Data *** Ministry of Education. Education Indicators (Indicadores de la Educación). Various Issues. **** Encuesta de Caracterización Socioeconómica Nacional ***** World Bank 2002a, pp. 4-5.

ANNEX B 56
Annex B. Chile Science for the Knowledge Economy Project, 2003–07 (L71720)
Principal Ratings
ICR* ICR Review* PPAR
Outcome Satisfactory Moderately Satisfactory Moderately Satisfactory
Risk to Development Outcome
Low or Negligible Low or Negligible Significant
Bank Performance Satisfactory Satisfactory Moderately Satisfactory
Borrower Performance
Satisfactory Satisfactory Moderately Satisfactory
* The Implementation Completion and Results Report (ICR) is a self-evaluation by the responsible Bank department. The ICR Review is an intermediate IEG product that seeks to independently verify the findings of the ICR.
Key Staff Responsible
Project Task Manager/Leader Division Chief/ Sector Director Country Director
Appraisal Lauritz Holm-Nielsen Marito H. Garcia and Ana Maria Arriagada
Axel van Trotsenburg
Completion Kristian Thorn Eduardo Velez Bustillo Pedro Alba

57 ANNEX B
Summary
The Chile Science for the Knowledge Economy Project sought two relevant objectives: to improve (1) the effectiveness of the Chile’s innovation system and (2) the stock of human capital in Chile’s science and technology (S&T) sector. An effective innovation system, the Project Appraisal Document suggests, is a system that “adapts existing innovations successfully to the economy and expands the existing frontier of knowledge.” Chile’s gaps in the effectiveness of its innovation system were indicated by the low share of its overall research and development (R&D) expenditures in GDP (0.5 percent, well below the 3.0 percent observed in countries like Korea and the United States), the limited private sector R&D (10 percent of the total), the inadequate quality and relevance of research, the low participation in international networks, and the low levels of cooperative research. These shortfalls hinged partly on the low supply of human capital for research, which the second objective aimed to address. Chile aimed to raise R&D expenditures to 1.2 percent of GDP by 2006.
The project focused on policy, high-quality research and human capital, and cooperative research to achieve the two objectives through the following three components: (2) technical assistance and capacity-building on strategy, policies, and awareness for innovation and human capital, and on M&E capacity (planned cost, US$6.4 million; actual cost, US$10.8 million); (2) grants for advanced research conducted by research institutes and research teams, scholarships for doctoral students, and grants for acquisition of major scientific equipment (planned cost, US$19.5 million; actual cost, US$32.4 million); and (3) grants for cooperative research (consortia and teams), scholarships for doctoral students and postdoctoral researchers conducting their research in industry, and additional costs associated with participation by Chilean researchers and industries in international research projects (planned cost, US$22.6 million; actual cost, US$8.8 million). The project was designed to help address three constraints of Chile’s science and technology sector: insufficient coherence of sector policies and strategy; lack of a critical mass of high-quality and relevant scientific research caused by inadequate R&D personnel and equipment; and low research capacity in the private sector and poorly developed linkages between the public and the private sector.
The link of components to results was strong in Components 2 and 3. It was weak in Component 1 because it was designed only to go as far as formulating strategy and policy recommendations and increasing awareness, not actually establishing the policies required to achieve project objectives. The actual policies that the project enabled were scholarships, research grants, and higher education investments, not the legal and regulatory reforms and other policies covering a wide range of issues and actors with a bearing on the innovation system.
IEG rates the project outcome as moderately satisfactory. Objectives were relevant to country conditions and Bank strategy. Design was relevant for both research components, but the policy component lacked a sufficiently strong link to actual policy implementation. The project contributed to human capital formation for the science and technology sector but made only a limited contribution to the effectiveness of Chile’s innovation system. Scholarship recipients benefited from significant increases in earnings and employability. The high rates of return on PhD graduates in the science and
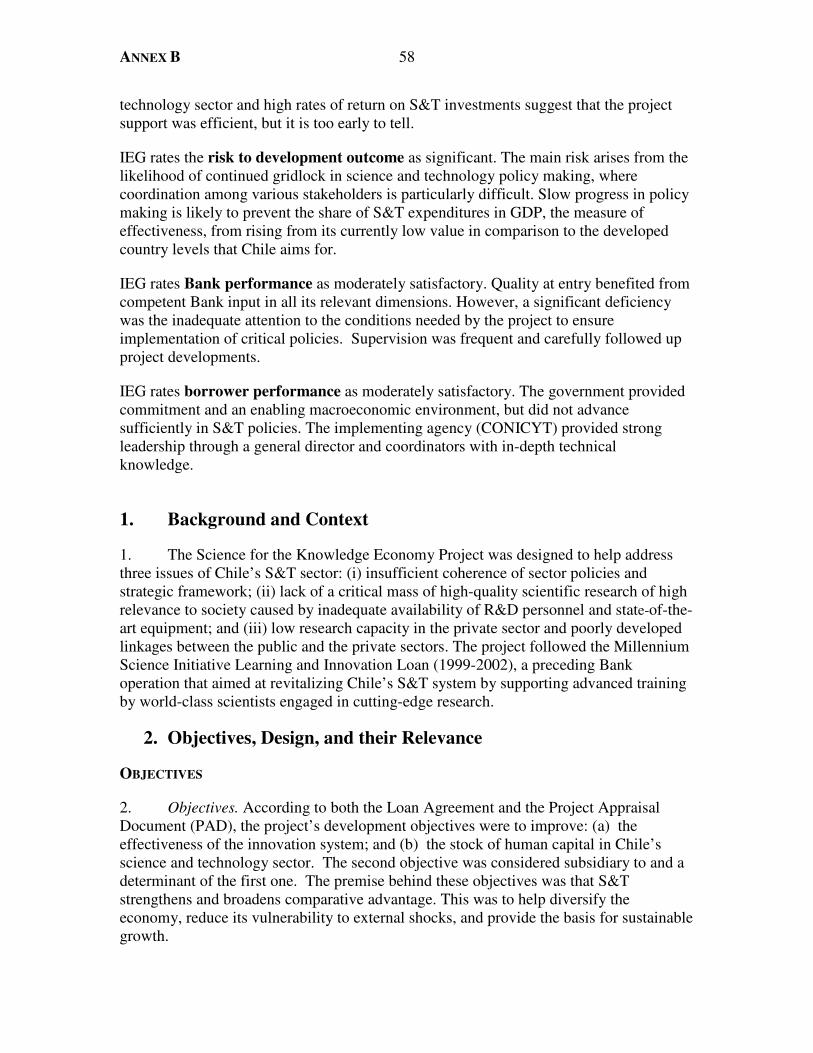
ANNEX B 58
technology sector and high rates of return on S&T investments suggest that the project support was efficient, but it is too early to tell.
IEG rates the risk to development outcome as significant. The main risk arises from the likelihood of continued gridlock in science and technology policy making, where coordination among various stakeholders is particularly difficult. Slow progress in policy making is likely to prevent the share of S&T expenditures in GDP, the measure of effectiveness, from rising from its currently low value in comparison to the developed country levels that Chile aims for.
IEG rates Bank performance as moderately satisfactory. Quality at entry benefited from competent Bank input in all its relevant dimensions. However, a significant deficiency was the inadequate attention to the conditions needed by the project to ensure implementation of critical policies. Supervision was frequent and carefully followed up project developments.
IEG rates borrower performance as moderately satisfactory. The government provided commitment and an enabling macroeconomic environment, but did not advance sufficiently in S&T policies. The implementing agency (CONICYT) provided strong leadership through a general director and coordinators with in-depth technical knowledge.
1. Background and Context
1. The Science for the Knowledge Economy Project was designed to help address three issues of Chile’s S&T sector: (i) insufficient coherence of sector policies and strategic framework; (ii) lack of a critical mass of high-quality scientific research of high relevance to society caused by inadequate availability of R&D personnel and state-of-the-art equipment; and (iii) low research capacity in the private sector and poorly developed linkages between the public and the private sectors. The project followed the Millennium Science Initiative Learning and Innovation Loan (1999-2002), a preceding Bank operation that aimed at revitalizing Chile’s S&T system by supporting advanced training by world-class scientists engaged in cutting-edge research.
2. Objectives, Design, and their Relevance
OBJECTIVES
2. Objectives. According to both the Loan Agreement and the Project Appraisal Document (PAD), the project’s development objectives were to improve: (a) the effectiveness of the innovation system; and (b) the stock of human capital in Chile’s science and technology sector. The second objective was considered subsidiary to and a determinant of the first one. The premise behind these objectives was that S&T strengthens and broadens comparative advantage. This was to help diversify the economy, reduce its vulnerability to external shocks, and provide the basis for sustainable growth.

59 ANNEX B
3. Relevance of the objectives. IEG rates the relevance of the project objectives as high because of high relevance to country conditions and to the Bank’s strategy throughout the period covered by the project.
4. With a minor caveat, the project stated its objectives clearly. The PAD and the Loan Agreement state project objectives similarly. The lower-level objective of the two, to improve the stock of human capital in the S&T sector, is by itself clear enough and is mirrored by one of the defined performance indicators, the number of researchers relative to the size of the population. The higher-level objective, to improve the effectiveness of Chile’s innovation system, is not formulated as clearly, for the PAD does not explicitly define what an effective system would be. However, the PAD suggests that what is meant is a system that “adapts existing innovations successfully to the economy and expands the existing frontier of knowledge” (World Bank 2003b, p. 5). The key performance indicators defined by the PAD are consistent with this reading. These included four indicators for outcomes with time-bound targets: the number of patents granted per 1,000 inhabitants; the ratio of private R&D expenditures to GDP; international rank on firm level innovation; stock of researchers per million inhabitants; and postgraduate enrollment in hard sciences (no target).
5. A strong relevance of these goals to country conditions was linked to Chile’s recent economic growth. Growth in total factor productivity tapered in the late 1990s, following a “golden age” period that had started in the mid-1980s (Magud and Medina 2011). Accordingly, a major concern of Chile’s policy makers was how to refuel total factor productivity, believed to be linked to technological improvements and/or innovation. To spur innovation, the key policy lever is developing an innovation system that would encourage research and development (R&D) expenditures to adapt existing innovations successfully to the economy and expand the existing frontier of knowledge. Such a system needs to provide widespread access to existing knowledge and foster cooperation among stakeholders, including the private sector. Total factor productivity growth remained slow at least through 2009 (Magud and Medina 2011, pp. 7-8). R&D expenditures remained low at least through 2006, the last year for which there are comparable data.
6. Relevance to Bank strategy was also strong, as the project was well-aligned to: (i) the 2002 Country Assistance Strategy (CAS) that sought, as one of its objectives, to sustain overall economic growth and social progress; and (ii) the Bank’s Lifelong Learning and Training Project, which sought to improve country competitiveness, another key element in the quest for a knowledge economy that would help achieve the sustained growth objective. The 2007-10 CAS maintained innovation as a key area of engagement with the new government that took office in 2006. This areas of Bank engagement responded to the increasingly strong role of innovation in the Government’s agenda, from the launching of the Millennium Science Initiative in 1999 to the launching of the National Council of Innovation and Competitiveness in 2006.
7. In achieving these two formal objectives, the project was to contribute to the higher welfare objective of sustaining overall economic growth and social progress as well as to the intermediate outcome of modernization of the state by (i) supporting core capacities such as strategic policy formulation and monitoring and evaluation, and (ii)

ANNEX B 60
identifying main obstacles to innovation and human capital formation and providing capacity building to key government institutions.
DESIGN
8. Components. The project had three components:
Component 1: Improving Chile’s Science, Technology, and Innovation System (US$6.4 million at appraisal, US$10.8 million actual)—Efforts to monitor, manage, and implement the project; efforts to develop a coherent strategy, conducive policies, and S&T awareness; and M&E capacity. This component financed capital and operating expenses for project oversight, management and implementation; development of an overall vision and strategy for Chile’s path toward a more knowledge-based economy (studies, consultants, workshops, travel and disseminating activities), and development of a framework for collection of data necessary to trace the effect of strategy implementation (upgrading Chile’s M&E system, consultants, necessary software and hardware).
Component 2: Strengthening Chile’s Science Base (US$19.5 million at appraisal, US$32.4 million actual)—Efforts to strengthen Chile’s science base, including research institutions, doctoral education, and state-of-the-art equipment. This component financed research grants for institutes and centers of excellence and research teams, doctoral scholarships, and development of a database and competitive grants for the acquisition of major equipment.
Component 3: Enhancing Public-Private Linkages (US$22.5 million at appraisal, US$8.8 million actual) —Efforts to strengthen linkages among the Chilean scientific community, industry, and public sector users of research findings, and between Chile and the global research and business communities. This component financed grants for cooperative research consortia and teams, researchers in industry, international cooperative research.
9. Relevance of design. IEG rates relevance of design as substantial. The project aimed at strengthening the effectiveness of Chile’s innovation system through research activities, improvement in the stock of human capital in the S&T sector (the second, subordinate objective) and consolidation and modernization of existing instruments and programs in S&T (Table B.1). Research activities funded by the project (competitive research grants, competitive scholarships, establishment of a database of major research equipment, and competitive grants for acquisition of major equipment) were directly linked to increasing research, accumulating human capital, and acquiring equipment, key outputs needed to develop Chile’s science base and increase the stock of human capital in Chile’s S&T sector. Similarly, cooperative research (grants for research groups, researchers in industry, and Chilean researchers in international research projects), was directly linked to strengthening linkages among the Chilean scientific community, industry, and public sector users of research findings, and between Chile and the global research and business communities. The resulting cooperation among researchers was considered a key approach in developing the innovation system. Cooperative research also directly targeted an increase in the stock of human capital in Chile’s S&T sector.

61 ANNEX B
10. But the research activities above, the technical assistance to develop a vision and a strategy, and investments for the M&E system did not reach the actual policy implementation (that is, “support the establishment of a coherent policy strategy and a strong policy framework” (World Bank 2003b, p. 3) needed to improve the effectiveness of the Chile’s innovation system. This was a design shortcoming of the project that proved to be critical.
Table B.1. Science for the Knowledge Economy Project: Results Chain
OUTPUTS INTERMEDIATE OUTCOME
OUTCOME
Coherent science and technology strategy Doctoral graduates Advanced and cooperative research
Improved stock of human capital in the science and technology sector
Improved effectiveness of the innovation system
Source: World Bank 2003b.
11. Implementation arrangements. The management arrangements for the project were simpler than in the Lifelong Learning and Training Project, albeit with one critical complexity. Leadership for project management was placed in an advisory board chaired by the Minister of Education and including three other ministers (Economy, Agriculture, and Mining), three high-level representatives from the private sector, and three high representatives from the scientific community. The implementing agency was the National S&T Research Commission (CONYCIT), a well-structured and efficient official organization with long experience in implementing programs in the science and technology field. The simpler implementation arrangement helps explain the far lower operating and administrative costs of this project, compared with the Chile Lifelong Learning and Training Project discussed above.
3. Implementation
12. Dates. The project was approved on May 22, 2003, as the first phase of a two-phase Adaptable Program Loan.8 It was declared effective on November 3, 2003, following preparation of a Financial Management Assessment to assess the capacity within the implementing agency. The project closed on March 31, 2007, as planned.
13. Implementation suffered from lack of S&T policies. The project helped with design of strategy and policies but the key policies needed to improve the effectiveness of the innovation system were not enacted. Policies covering a range of critical areas depended on achieving consensus among various actors, including particularly the Ministry of Economy, the Ministry of Finance, the Ministry of Education, and the Ministry of Labor. The last were among the members of the advisory board that was
8 The second phase did not materialize. It was cancelled soon after approval. The first phase was to cover a 5 year period (2003-07), support the establishment of a coherent policy strategy and a strong policy framework, provide for the continuation of the Millennium Science Initiative, and strengthen the science base. The second phase (2007-10) was to scale up funding for initiatives launched in the first phase, especially to enhancing private sector R&D activities.
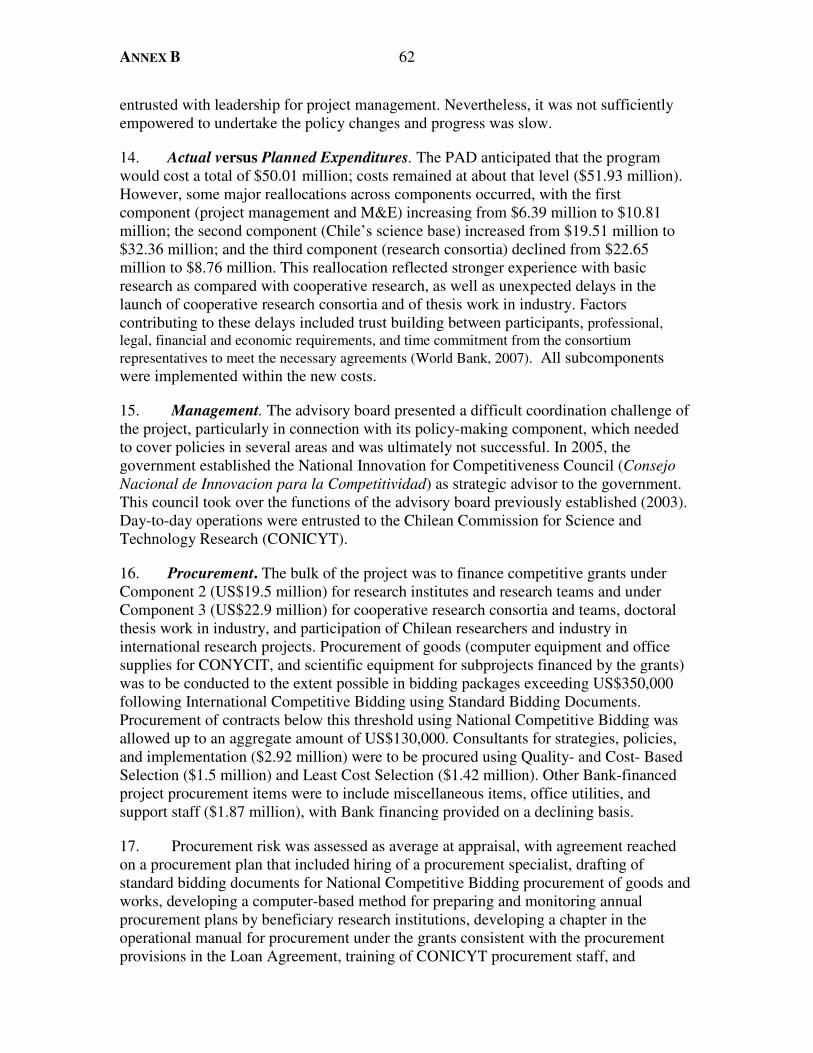
ANNEX B 62
entrusted with leadership for project management. Nevertheless, it was not sufficiently empowered to undertake the policy changes and progress was slow.
14. Actual versus Planned Expenditures. The PAD anticipated that the program would cost a total of $50.01 million; costs remained at about that level ($51.93 million). However, some major reallocations across components occurred, with the first component (project management and M&E) increasing from $6.39 million to $10.81 million; the second component (Chile’s science base) increased from $19.51 million to $32.36 million; and the third component (research consortia) declined from $22.65 million to $8.76 million. This reallocation reflected stronger experience with basic research as compared with cooperative research, as well as unexpected delays in the launch of cooperative research consortia and of thesis work in industry. Factors contributing to these delays included trust building between participants, professional, legal, financial and economic requirements, and time commitment from the consortium representatives to meet the necessary agreements (World Bank, 2007). All subcomponents were implemented within the new costs.
15. Management. The advisory board presented a difficult coordination challenge of the project, particularly in connection with its policy-making component, which needed to cover policies in several areas and was ultimately not successful. In 2005, the government established the National Innovation for Competitiveness Council (Consejo Nacional de Innovacion para la Competitividad) as strategic advisor to the government. This council took over the functions of the advisory board previously established (2003). Day-to-day operations were entrusted to the Chilean Commission for Science and Technology Research (CONICYT).
16. Procurement. The bulk of the project was to finance competitive grants under Component 2 (US$19.5 million) for research institutes and research teams and under Component 3 (US$22.9 million) for cooperative research consortia and teams, doctoral thesis work in industry, and participation of Chilean researchers and industry in international research projects. Procurement of goods (computer equipment and office supplies for CONYCIT, and scientific equipment for subprojects financed by the grants) was to be conducted to the extent possible in bidding packages exceeding US$350,000 following International Competitive Bidding using Standard Bidding Documents. Procurement of contracts below this threshold using National Competitive Bidding was allowed up to an aggregate amount of US$130,000. Consultants for strategies, policies, and implementation ($2.92 million) were to be procured using Quality- and Cost- Based Selection ($1.5 million) and Least Cost Selection ($1.42 million). Other Bank-financed project procurement items were to include miscellaneous items, office utilities, and support staff ($1.87 million), with Bank financing provided on a declining basis.
17. Procurement risk was assessed as average at appraisal, with agreement reached on a procurement plan that included hiring of a procurement specialist, drafting of standard bidding documents for National Competitive Bidding procurement of goods and works, developing a computer-based method for preparing and monitoring annual procurement plans by beneficiary research institutions, developing a chapter in the operational manual for procurement under the grants consistent with the procurement provisions in the Loan Agreement, training of CONICYT procurement staff, and

63 ANNEX B
developing and implementing a project filing system. All annual procurement ex post reviews rated the project’s procurement performance to be satisfactory.
18. Financial Management. The implementing agency had extensive experience with S&T projects but no direct experience with Bank-financed projects. All audit reports issued every year by the government’s Comptroller Office rated the project’s financial management performance satisfactory.
19. Safeguards. No safeguard policies were triggered by the project. The project had an environmental category C. The Implementation Completion and Results Report (ICR) indicated that support was provided only to proposals that were considered to be environmentally sound. CONICYT submitted national guidelines for laboratory safety, disposal of environmentally hazardous material, bioethics, and biosafety to the Bank during preparation; they were found to be in accordance with international best practice. The ICR considered the project to have had a neutral or positive environmental impact.
4. Achievement of the Objectives
20. The project’s outputs contributed to increase human capital in the S&T sector but were not sufficient to raise the effectiveness of Chile’s innovation system. The achievements in these two areas are discussed below.
IMPROVE THE EFFECTIVENESS OF THE CHILE’S INNOVATION SYSTEM. (Rating – Modest)
21. The activities that the project financed helped sustain S&T expenditures. However, there is no indication of a significant increase in effectiveness of the innovation system that is attributable to these expenditures.
22. Outputs. An effective innovation system, as the PAD suggests, is a system that “adapts existing innovations successfully to the economy and expands the existing frontier of knowledge.” (World Bank 2003b) To help achieve this, and in addition to contributing to the human capital base, the project was to support improvements in strategy, policy, and M&E; grants for investments in robust equipment for research; and grants for research activities.
23. The project contributed to design of an innovation strategy and policy, but this has not led yet to significant policy changes. With the formation of the National Innovation Council for Competitiveness in 2005, Chile took an important step toward the formulation of an S&T strategy. It is likely that the activities under Component 1, which included studies covering technological maps, benchmarking and lessons learned, and S&T policies, contributed to informing the work of this commission. The Commission completed a set of proposals for fostering innovation. These covered human resources, S&T, and business policies. An independent panel favorably reviewed the proposed strategy but also argued that implementation had been too slow because of weak empowerment to implement policies. In addition to support for strategy and policies, the project funded seminars, courses, and camps that improved country knowledge and awareness of S&T issues. But policies were never enacted that could improve the

ANNEX B 64
innovation system, possibly due to the difficulty of coordinating the multiple sectors that these policies had to cover and the weak empowerment of the Committee of Ministers of Innovation that had been established in 2007 to coordinate policy design and implementation of the strategy. In sum, the project contributed to develop ideas and awareness but did not result in any of the major changes that would bring S&T expenditures to the higher levels that Chile aims for..
24. The grants for investments in robust equipment did not materialize because of delays in determining equipment needs.
25. The project supported numerous research activities, including support for cooperative research consortia, 34 research teams, and the insertion of 55 postdoctoral researchers in industry. The doctoral thesis in industry component was not launched. However, the project supported Chile’s participation in the European 6th framework program, the formation of ChileGlobal, a network that connects domestic businesses with successful Chilean entrepreneurs abroad, and Science Technology and Innovation workshops that helped link Chile’s scientific community with its international peers.
26. Support of research teams and consortia was perhaps the most significant of the support instruments. According to the mid-term review, research team members felt that support to teams contributed to S&T activities in a number of areas, by allowing teams to address more ambitious objectives, carry out better experiments, interface with international peers, disseminate results, and engage PhD students (World Bank 2007). Nevertheless, an evaluation report by Chile’s Budget Office did not find much difference in the productivity of team members before and after they joined the teams, but uncovered a decline in their bibliographic citation rates (Salas Opazo, Campos de Quiroz, and Loewe-Muñoz 2010).
27. The project supported six consortia (World Bank 2007, Table 12, p. 28). These were structured as partnerships with intellectual property agreements. Evidence for Chile and Colombia based on innovation surveys suggests that these linkages increase the likelihood that firms introduce new products (Marotta and others 2007). The consortia supported by the project are still fairly young to generate new research and innovations.
28. A review of these and a few other consortia suggests a weak impact on R&D activity. The contribution of consortia to developing business S&T capacity and engaging in high-risk research projects has thus far been limited (Alvarez, Contreras, and Contreras 2010). Several of the consortia are active in a number of projects, but there is no account of innovation achievements. The Budget Office evaluation (Alvarez and others 2010) estimates that consortia researchers publish a bit more after joining the consortia, albeit less in high-impact publications. Consortia span a wide range of development, from one that never took off to a few that are consolidated going concerns and face a varying set of challenges as they advance from inception to consolidation.
29. Mission discussions in the field highlighted a tension between the innovation objectives more typical of scientists (sharing, publishing, and perhaps patenting) and innovation objectives of firms (perhaps patenting, but more likely developing business from trade secrets). Consortia are more likely to engage in patentable innovations, as
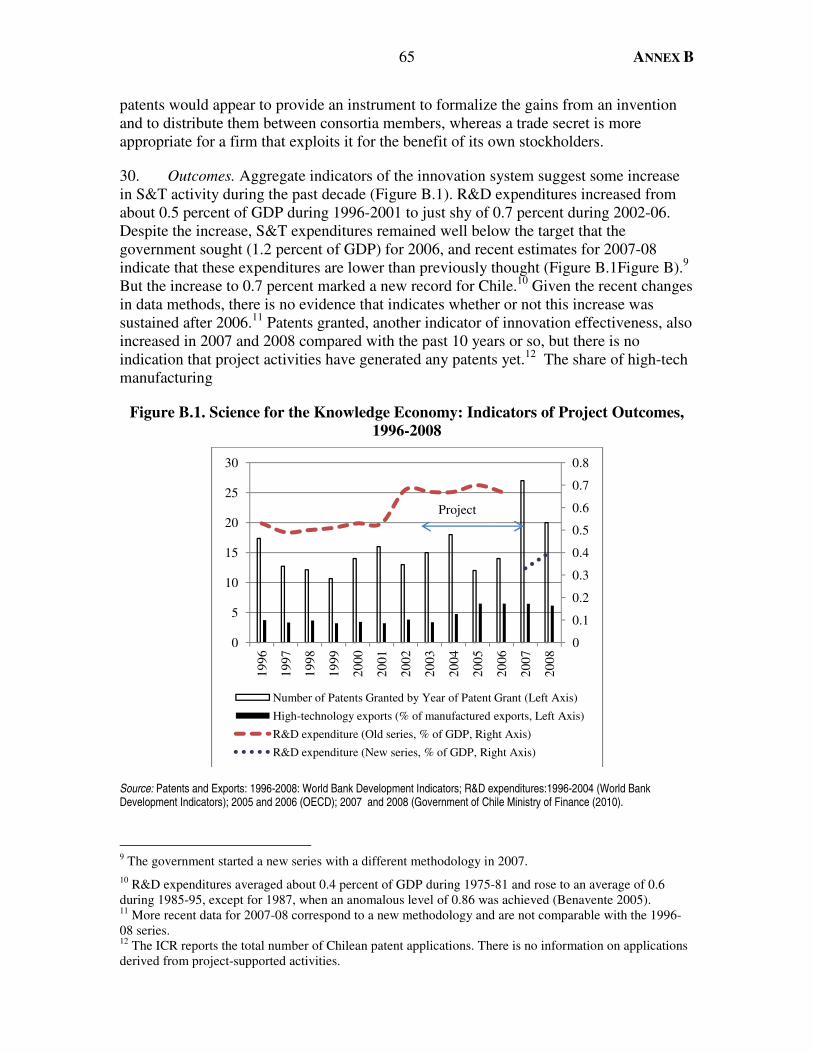
65 ANNEX B
patents would appear to provide an instrument to formalize the gains from an invention and to distribute them between consortia members, whereas a trade secret is more appropriate for a firm that exploits it for the benefit of its own stockholders.
30. Outcomes. Aggregate indicators of the innovation system suggest some increase in S&T activity during the past decade (Figure B.1). R&D expenditures increased from about 0.5 percent of GDP during 1996-2001 to just shy of 0.7 percent during 2002-06. Despite the increase, S&T expenditures remained well below the target that the government sought (1.2 percent of GDP) for 2006, and recent estimates for 2007-08 indicate that these expenditures are lower than previously thought (Figure B.1Figure B).9 But the increase to 0.7 percent marked a new record for Chile.10 Given the recent changes in data methods, there is no evidence that indicates whether or not this increase was sustained after 2006.11 Patents granted, another indicator of innovation effectiveness, also increased in 2007 and 2008 compared with the past 10 years or so, but there is no indication that project activities have generated any patents yet.12 The share of high-tech manufacturing
Figure B.1. Science for the Knowledge Economy: Indicators of Project Outcomes, 1996-2008
Source: Patents and Exports: 1996-2008: World Bank Development Indicators; R&D expenditures:1996-2004 (World Bank Development Indicators); 2005 and 2006 (OECD); 2007 and 2008 (Government of Chile Ministry of Finance (2010).
9 The government started a new series with a different methodology in 2007. 10 R&D expenditures averaged about 0.4 percent of GDP during 1975-81 and rose to an average of 0.6 during 1985-95, except for 1987, when an anomalous level of 0.86 was achieved (Benavente 2005). 11 More recent data for 2007-08 correspond to a new methodology and are not comparable with the 1996-08 series. 12 The ICR reports the total number of Chilean patent applications. There is no information on applications derived from project-supported activities.
0
0.1
0.2
0.3
0.4
0.5
0.6
0.7
0.8
0
5
10
15
20
25
30
1996
1997
1998
1999
2000
2001
2002
2003
2004
2005
2006
2007
2008
Number of Patents Granted by Year of Patent Grant (Left Axis)
High-technology exports (% of manufactured exports, Left Axis)
R&D expenditure (Old series, % of GDP, Right Axis)
R&D expenditure (New series, % of GDP, Right Axis)
Project
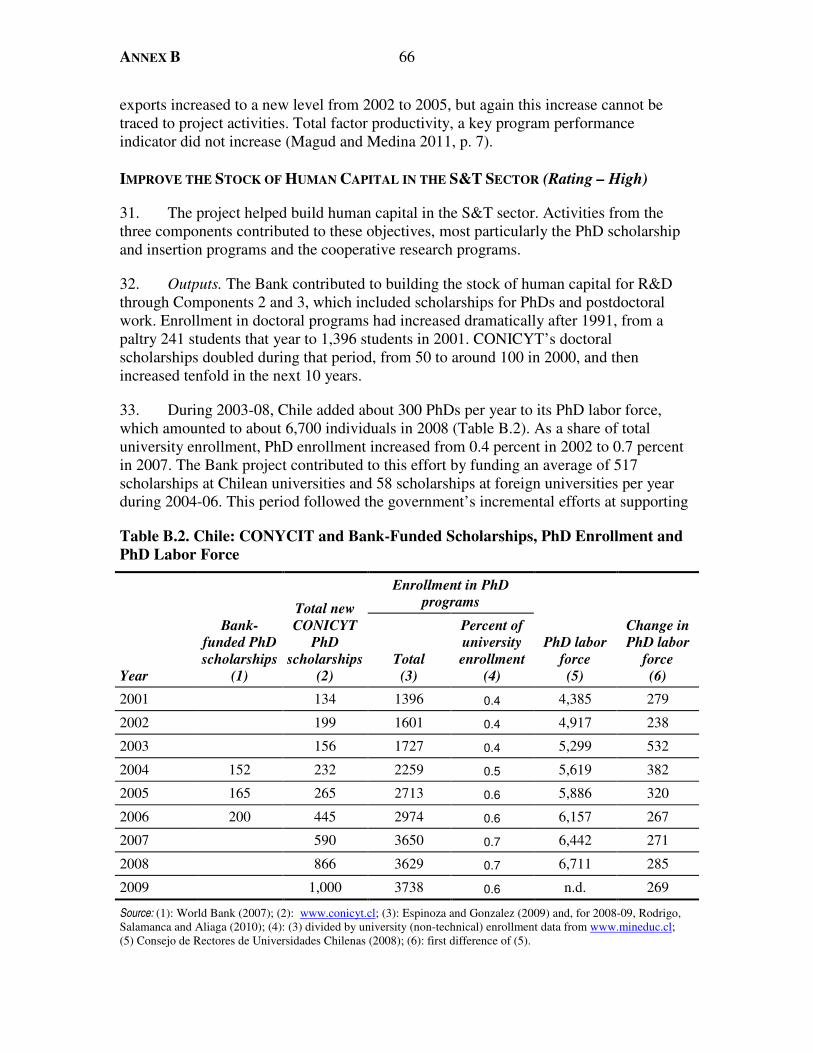
ANNEX B 66
exports increased to a new level from 2002 to 2005, but again this increase cannot be traced to project activities. Total factor productivity, a key program performance indicator did not increase (Magud and Medina 2011, p. 7).
IMPROVE THE STOCK OF HUMAN CAPITAL IN THE S&T SECTOR (Rating – High)
31. The project helped build human capital in the S&T sector. Activities from the three components contributed to these objectives, most particularly the PhD scholarship and insertion programs and the cooperative research programs.
32. Outputs. The Bank contributed to building the stock of human capital for R&D through Components 2 and 3, which included scholarships for PhDs and postdoctoral work. Enrollment in doctoral programs had increased dramatically after 1991, from a paltry 241 students that year to 1,396 students in 2001. CONICYT’s doctoral scholarships doubled during that period, from 50 to around 100 in 2000, and then increased tenfold in the next 10 years.
33. During 2003-08, Chile added about 300 PhDs per year to its PhD labor force, which amounted to about 6,700 individuals in 2008 (Table B.2). As a share of total university enrollment, PhD enrollment increased from 0.4 percent in 2002 to 0.7 percent in 2007. The Bank project contributed to this effort by funding an average of 517 scholarships at Chilean universities and 58 scholarships at foreign universities per year during 2004-06. This period followed the government’s incremental efforts at supporting
Table B.2. Chile: CONYCIT and Bank-Funded Scholarships, PhD Enrollment and PhD Labor Force
Year
Bank-funded PhD scholarships
(1)
Total new CONICYT
PhD scholarships
(2)
Enrollment in PhD programs
PhD labor force (5)
Change in PhD labor
force (6)
Total (3)
Percent of university enrollment
(4)
2001 134 1396 0.4 4,385 279
2002 199 1601 0.4 4,917 238
2003 156 1727 0.4 5,299 532
2004 152 232 2259 0.5 5,619 382
2005 165 265 2713 0.6 5,886 320
2006 200 445 2974 0.6 6,157 267
2007 590 3650 0.7 6,442 271
2008 866 3629 0.7 6,711 285
2009 1,000 3738 0.6 n.d. 269
Source: (1): World Bank (2007); (2): www.conicyt.cl; (3): Espinoza and Gonzalez (2009) and, for 2008-09, Rodrigo, Salamanca and Aliaga (2010); (4): (3) divided by university (non-technical) enrollment data from www.mineduc.cl; (5) Consejo de Rectores de Universidades Chilenas (2008); (6): first difference of (5).

67 ANNEX B
doctoral education, with overall CONICYT scholarships accelerating from about 100 each year during 1995-2000 to 1,000 by 2009. New PhD graduates in natural science, math, and social science increased from 63 in 2001 to 158 in 2006, adding a total of 957 PhDs in those areas. In addition, the project financed 148 doctoral graduates in Chilean universities for limited periods of time.
34. Outcomes. Data on the stock of human capital in the S&T sector is outdated, but shows an increase in the stock of full-time equivalent researchers per 1,000 people in the workforce (a project key performance indicator), from 1.44 in 2002 to 2.96 in 2004. About 10 percent work in industry. New PhD graduates in natural science, math, and social science increased from 63 in 2001 to 158 in 2006, adding a total of 957 PhDs in those areas. Most PhDs are employed at higher education institutions. Their share of PhD employment increased from 77.2 percent in 2001 to 80.9 percent in 2007. About 64 percent are employed at Chile’s traditional universities, where most academic research is conducted.
5. Efficiency
35. IEG rates efficiency as substantial. Neither the PAD nor the ICR conducted calculations of economic rates of return (ERR) or cost-effectiveness indicators of the project. The analysis in the PAD offers references to international experience and cross-country work, including work on R&D that had recently been completed in the Bank’s Latin America region. The PAD suggested, based on cross-country work, that the social ERR of R&D expenditures in Chile was on the order of 50 percent, while pointing out that “the actual return to the resources invested by this project evidently and crucially depends on context specific circumstances such as institutional arrangements, incentive structure and choice of intervention.” Of a closer specificity to the project are the IRR estimates in Benavente, De Gregorio, and Núñez (2005), which suggest an average industrial R&D ERR on the order of 30 percent during the 1990s. Nevertheless, these estimates only provide an expectation of efficiency on projects that have not yet resulted in much actual innovation and are therefore uncertain. The ICR estimated operating and administrative costs of the project at 6.8 per cent of its total cost and suggested that these were low for project with substantial institutional demands. All reviews rated the Project’s performance in regard to procurement to be satisfactory.
36. The evidence suggests that PhD training is an efficient investment. Returns in Chile, such as those calculated by Sapelli (2009), point to this conclusion. The cross-country and country-specific findings provide some comfort that the project meets a reasonable efficiency bar as far as the human capital building objective of the project is concerned.
37. The efficiency of investments on strategy and policy design raises a more complex question. While Chile certainly knows today more about its S&T policy needs and challenges than before the project, there is considerable uncertainty as to when and how that knowledge will translate into the actual policies that will raise R&D activity. Given the slow progress in strengthening Chile’s policy framework, the ultimate benefits of these resources are yet to fully materialize.

ANNEX B 68
6. Ratings
OUTCOME
38. The overall outcome of the project is rated Moderately Satisfactory, based on relevance ratings that are high for objectives and substantial for design; efficacy ratings of modest for improving effectiveness of the innovation system and high for improving human capital; and an efficiency rating of substantial.
RISK TO DEVELOPMENT OUTCOME
39. IEG rates risk to development outcome as significant. Risk to development outcome is assessed by considering two dimensions: (i) the likelihood that some changes may occur that are detrimental to the ultimate achievement of the operation’s development outcome; and (ii) the impact on the operation’s development outcomes of some or all of these changes.
40. Detrimental changes would originate in a deterioration of one or more of the four critical pillars of a knowledge economy, including the efficiency of the policy framework and strength of its economic incentives that induce human capital formation and innovation; the level of human capital needed to take advantage of scientific and technological progress; the effective innovation system, which adapts existing innovations successfully to the economy and expands the existing frontier of knowledge; and a high penetration of information and communications technologies, which reduces the costs of transaction and increases flows of information.
41. Chile is perhaps the Latin American economy where adverse changes in those areas are least likely. Nevertheless, there is a significant risk of further delay in adopting needed policies to improve the national innovation system, with R&D expenditures failing to rise to intended levels despite increased publishing and patenting, the most open trade and investment regime in the region, and an increasing share of high-tech exports that suggests relevance of research. R&D expenditures remain low compared with Organization for Economic Co-operation and Development (OECD) levels, and recent evidence suggests that they might be lower than originally believed. Furthermore, the pace of needed policy reforms has been slow, and there is no indication that it might accelerate. If policy gridlock in this area were to be sustained, a real risk to achievement of the project objectives might materialize.
MONITORING AND EVALUATION
42. Design. The PAD diagnosed that Chile lacked experience and tradition for monitoring and evaluating policies on science, technology, and innovation because these areas had enjoyed less prominence than other policy areas such as basic education, where a successful monitoring system was in place. A subcomponent of Component 1 covered the project’s M&E activities. The project expected to develop a comprehensive M&E arrangement that, based on both qualitative and quantitative indicators, would trace sector developments and assess the impact of implemented S&T initiatives, with a view to improving effectiveness. The PAD listed indicators, data sources, and some baseline

69 ANNEX B
values. It discussed at length the strategy to develop M&E, which is aimed at measuring outcomes, assessing the need for corrective action, and collecting lessons learned. Specifically, the project was to apply the OECD Frascati and Oslo Manuals together with an established set of qualitative and quantitative indicators as a point of reference. Data and analysis provided through M&E were to be shared among government agencies and stakeholders to facilitate policy discussion as well as to disseminate to the general public.
43. Implementation. Innovation and R&D data are available, but they are not up to date. The Ministry of Economy has conducted, through the National Institute of Statistics, a series of surveys covering innovation activity and R&D expenditures. At this point, no place offers a consistent and updated time series of expenditure data, staffing, innovation rates, cooperation, and patenting. The project supported KAWAX, a science and technology portal that provides access to a series of studies on science and technology issues, but does not provide the national indicators for science, technology, and innovation for which it was established. Accordingly, the project failed to establish an information system for tracking results in supported subprojects. A number of independent studies evaluated some of the programs supported by the project (Statcom Estadísticos Consultores 2007, p. 431; Busco and others 2008; Alvarez, Contreras, and Contreras 2010; Salas Opazo, Campos de Quiroz, and Loewe-Muñoz 2010).
44. Utilization. The limited M&E outputs have been used in devising an innovation strategy, including a 2006 report on innovation for competitiveness (Government of Chile, 2006) and a 2007 report with a proposal for a national strategy (Government of Chile, 2007). The proposals in that strategy have not yet been implemented.
45. With strong design and poor implementation and utilization, IEG rates the quality of monitoring and evaluation as modest.
BANK PERFORMANCE
46. Quality at Entry. Quality at entry benefited from the project’s focus on a relevant development issue—how to encourage innovation to sustain growth—and from using an approach that combined demand with supply driven actions to encourage research and innovation. The PAD’s coverage of technical issues included reference to the rate of return on research, a solid rationale for public investment in the S&T sector, and a comprehensive view of the requirements of a successful knowledge economy. The project benefited from consultation with private sector stakeholders and from a series of seminars to raise awareness and disseminate information on the instruments that the project was to use. The design gave considerable attention to institutional development of Chile’s innovation system, and the implementation arrangements were manageable, with CONICYT, the S&T agency, at the center reporting to a board chaired by the Minister of Education and including three other ministers (Economy, Agriculture, and Mining), three high-level representatives from the private sector, and three high representatives from the scientific community. M&E design was well thought through and tailored to the specific needs of the S&T sector, albeit not well implemented or utilized.
47. Despite these qualities, the design of the project did not provide for establishing the needed policies to increase the effectiveness of the innovation system. The needed

ANNEX B 70
policies were indentified in a strategy developed by the government and covered high-quality life-long learning, an S&T system oriented toward economic and social needs, and a proactive and innovative business enterprise sector complemented by a cluster policy. A panel of international experts concluded that implementation of the strategy has been too slow (Crawford and others 2010). IEG rates quality at entry moderately satisfactory.
48. Quality of Supervision. The project benefited from continuous and interactive supervision. Missions were carried out every six months and included a including a mid-term review in March 2006 and an ICR mission in January 2007. Supervision missions discussed progress with a wide set of stakeholders, assisted CONICYT in addressing key issues, and provided technical advice. The supervision process included aide memoires, where conclusions were recorded and next steps formulated. The aide memoires were used as a monitoring and follow-up instrument. The supervision team was composed of a stable group of Bank specialists and international experts. Despite Bank team efforts resulting in a follow-up project approved by the Board in July 2008, the new government cancelled the project a few months after it began because of a change of focus in its own innovation strategy. IEG rates the quality of supervision as satisfactory.
49. Accordingly, IEG rates Bank performance as moderately satisfactory.
BORROWER PERFORMANCE
50. Government Performance. The government supplied commitment, one of the best enabling environments in the region, and momentum by consulting and involving key stakeholders. Nevertheless, the government was slow to implement needed policies in the S&T sector.13 IEG rates government performance as moderately satisfactory.
51. Implementing Agency Performance. CONICYT, the implementing agency, provided strong leadership through a general director and coordinators with in-depth technical knowledge. Project implementation, although slower than expected, benefited from the agency’s familiarity with Bank procedures and its mix of skills. The agency could have placed more emphasis on implementation of the M&E results framework. IEG rates government performance as moderately satisfactory.
52. Accordingly, IEG rates borrower performance as moderately satisfactory.
13 The governance structure established for the strategy involved the Ministry of Economy, the National Innovation for Competitiveness Council (established in November 2005) as strategic advisor to the government, and the Committee of Ministers of Innovation (established in 2007) to coordinate policy design and implementation of the strategy. The Council took over the functions of the advisory board preciously established with support from the project. The view of the panel of experts that reviewed the strategy and its implementation was that, although the Council developed a well-considered strategy, implementation “has been hampered by the relative weakness of the Ministerial Committee of Innovation with lack of conduction and little empowerment” (Crawford and others 2010, p. 33).
71 ANNEX B
7. Lessons
53. Although the Science for Knowledge Economy project had some bearing on access to higher education (PhD students), quality of education (doctoral programs) and links to the labor market (R&D human resources and returns to doctoral education), the lessons it offers pertain primarily to the links with the knowledge economy. These are as follows:
• Achieving an effective innovation system, one that “adapts existing innovations successfully to the economy and expands the existing frontier of knowledge,” requires not only actions to raise the supply of innovation resources (for example, human capital), but also a cross-sectoral set of policies to increase the demand for innovation projects. These include taxes, patent law, public expenditure, and human resource polices among other things. Several government ministries and agencies need to coordinate to put them in place and implement them.
• Project objectives that hinge on major policy changes will be difficult to achieve with financing that only reaches the design of those policies, with no adequate allowance for how or when the policies will be implemented. The project made headway on design and awareness through various S&T activities but failed to coordinate policy-making actors in putting policies into place.
• In addition to public financing, sustainability of an innovation system needs strong private sector resources and engagement. Consortia of researchers and industry and other arrangements tried in the project provide examples of vehicles that can be used to achieve private sector engagement, which in turn improves the prospects of the usefulness of innovations for the productive sector and may provide expert enterprise and managerial skills to the projects that bring about the innovations.
• Nevertheless, cooperative research arrangements need to address a number of challenges, including conflicting interests among parties, adequate capital to finance uncertain prospects of success, and fairly long time horizons needed to achieve actual innovations. Upfront agreements on allocation of gains, public financing for what is essentially a public good (innovation), and professional management of the different stages of an arrangement from inception through development are some of the approaches that need to be considered to address these challenges.
• Adequate M&E in R&D is likely to require annual surveys of firms, as private sector expenditures in this area are not easy to measure. Although the M&E aims of the project were not quite achieved, Chile’s efforts at improving data collection though a biannual survey provide a useful step forward towards a better understanding of the sector.

APPENDIX B.1 72
Appendix B.1. Chile – Science for the Knowledge Economy Project (L71720)
Key Project Data (amounts in US$ millions)
Appraisal estimate
Actual or current estimate
Actual as % of appraisal estimate
Total project costs 50.01 51.93 103.84
Loan amount 25.26 25.26 100.00
Cofinancing - - -
Cancellation - - -
Cumulative Estimated and Actual Disbursements
FY04 FY05 FY06 FY07
Appraisal estimate (US$ millions) 5.56 16.07 25.26 25.26
Actual (US$ millions) 0.75 5.50 16.48 25.26
Actual as % of appraisal 13.48 34.22 65.24 100.00
Date of final disbursement: 02/15/2007
Project Dates
Original Actual
Initiating memorandum 07/15/2002 11/19/2002
Negotiations 12/17/2002 04/01/2003
Board approval 01/14/2003 05/22/2003
Signing 08/05/2003 08/05/2003
Effectiveness 09/30/2003 11/03/2003
Closing date 03/31/2007 03/31/2007
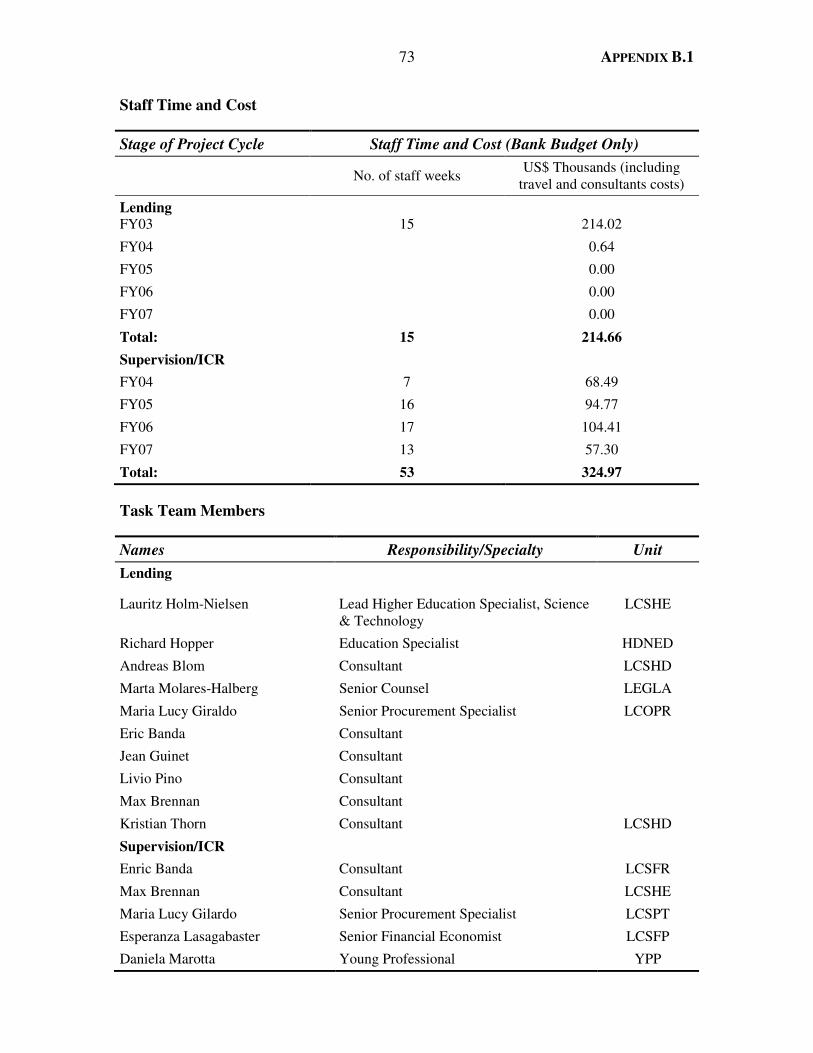
73 APPENDIX B.1
Staff Time and Cost
Stage of Project Cycle Staff Time and Cost (Bank Budget Only)
No. of staff weeks
US$ Thousands (including travel and consultants costs)
Lending FY03
15
214.02
FY04 0.64
FY05 0.00
FY06 0.00
FY07 0.00
Total: 15 214.66
Supervision/ICR
FY04 7 68.49
FY05 16 94.77
FY06 17 104.41
FY07 13 57.30
Total: 53 324.97
Task Team Members
Names Responsibility/Specialty Unit
Lending
Lauritz Holm-Nielsen Lead Higher Education Specialist, Science & Technology
LCSHE
Richard Hopper Education Specialist HDNED
Andreas Blom Consultant LCSHD
Marta Molares-Halberg Senior Counsel LEGLA
Maria Lucy Giraldo Senior Procurement Specialist LCOPR
Eric Banda Consultant
Jean Guinet Consultant
Livio Pino Consultant
Max Brennan Consultant
Kristian Thorn Consultant LCSHD
Supervision/ICR
Enric Banda Consultant LCSFR
Max Brennan Consultant LCSHE
Maria Lucy Gilardo Senior Procurement Specialist LCSPT
Esperanza Lasagabaster Senior Financial Economist LCSFP
Daniela Marotta Young Professional YPP
APPENDIX B.1 74
Names Responsibility/Specialty Unit
Kristian Thorn Education Specialist LCSHE
Martha P. Vargas Program Assistant LCSLU

75 APPENDIX B.2
Appendix B.2. List of Persons Met
José Miguel Aguilera Radic, President. National Commision for Scientific and Technological Research (Comisión Naciuonal de Investigacion Científica y Tecnologica, CONICYT).
Alfredo Barriga, Ministry of Economy.
Jose Miguel Benavente, Director, Productivity Centre, Adolfo Ibañez University.
María Elena Boisier, Director, National Science and Technology Development Fund (Fondo Nacional de Desarrollo Científico y Tecnológico, FONDECYT/Conycit) and Fund for Advanced Research on Priority Areas (Fondo de Investigación Avanzada en Áreas Prioritarias, FONDAP).
Claudio Bravo-Ortega, Asistant Professor, Department of Economics, University of Chile.
Andres Concha Rodriguez, President, Sociedad de Fomento Fabril (SOFOFA).
Alejandra Contreras Altmann, Executive Director, Higher Education Student Loan System (INGRESA).
Paula Darbille Álvarez, Chief, Management Control Division.
Joé Espinoza, Budget Directorate, Ministry of Finance.
Juan Pablo Gomez Mesa, Chief, Public Finance Division, Budget Directorate, Ministry of Finance.
Bernardo Gonzalez, National Science and Technology Development Fund (Fondo Nacional de Desarrollo Científico y Tecnológico, FONDECYT).
Jorge Hermann Anguila, Chief Economist, Research Department, Ministry of Economy.
Gonzalo Herrera Jimenez, Executive Director, Fund for Scientific and Technological Development (Fondo de Fomento al Desarrollo Científico y Tecnológico, FONDEF).
Osvaldo Larrañaga, Equity Program Officer (UNDP), Professor (University of Chile).
Maria Jose Lemaitre, Executive Director, University Development Center (Centro Interuniversitario de Desarrollo, CINDA).
Daniela Meneses Montero, Chief Higher Education Department, National Education Council (Consejo Nacional de Educación CNED).
Cristian Moreno Terrazas, Innovation and Enterprise Manager, Sociedad de Fomento Fabril (SOFOFA).
Jorge Martinez, Executive Director, CONICYT (Apoyo a Ciencia y Tecnologia).

APPENDIX B.2 76
Isabel Meneses, Coordinator, Scientifica and Technical Management, National Commision for Scientific and Technological Research (Comisión Naciuonal de Investigacion Científica y Tecnologica, CONICYT).
Eugenia Muchnik, Executive Director, Foundation for Agrarian Innovation.
Ricardo Reich Albertz, General Coordinator, Higher Education Division, Ministry of Education.
Denise Saint-Jean, Director, Advanced Human Capital Development Program, National Commision for Scientific and Technological Research (Comisión Naciuonal de Investigacion Científica y Tecnologica, CONICYT).
Daniela Torre, National Education Council (Consejo Nacional de Educación CNED).
Juan José Ugarte, Chief, Higher Education Division, Ministry of Education.
Cristóbal Undurraga Vergara, Gerente Emprendimiento e Innovacion, CORFO, Consorcios de Investigacion y Desarrollo.
Cristobal Undurraga, Executive Director, Innova Chile, Concursos de Investigacion y Desarrollo.
Alexandra Valerio, Senior Economist, HDNED, World Bank.
Eduardo Velez Bustillo, Former Latin America and Caribbean Human Development Sector Manager, World Bank.
Roberto Zahler, President, Zahler and Company.
Elizabeth Zapata, Production Development Corporation (Corporación de Fomento de la Producción, CORFO.
Gonzalo Zapata, Researcher, Catholic University of Chile.

77 ANNEX C
Annex C. Colombia Higher Education – Improving Access Project, 2002–08 (L71550)
Principal Ratings
ICR* ICR Review* PPAR
Outcome Satisfactory Satisfactory Satisfactory
Risk to Development Outcome
Moderate Moderate Moderate
Bank Performance Satisfactory Moderately Satisfactory
Satisfactory
Borrower Performance
Highly Satisfactory Satisfactory Satisfactory
* The Implementation Completion and Results Report (ICR) is a self-evaluation by the responsible Bank department. The ICR Review is an intermediate IEG product that seeks to independently verify the findings of the ICR.
Key Staff Responsible
Project Task Manager/Leader Division Chief/ Sector Director Country Director
Appraisal Lauritz Holm-Nielsen Ana Maria Arriagada Olivier Lafourcade
Completion Barbara Bruns and
Alejandro Caballero Chingboon Lee Axel van Trotsenburg

ANNEX C 78
Summary
The Colombia Higher Education – Improving Access Project sought to “improve the quality and equity of Colombia’s Tertiary Education system.” This objective was motivated by the pressure on higher education created by past advances in access to basic and secondary education and the prevailing inequality in access to higher education. The number of graduates from secondary school who took the entry exam for tertiary education increased from 134,000 (26 percent of a cohort of 17-year-olds of 523,000) in 1980 to 583,000 (60 percent of a cohort of 752,000) in 2000. Gross enrollment in higher education had expanded from 9 percent in 1980 to 24 percent in 2000 but with wide disparities. Enrollment of the lowest quintile of the income distribution had expanded to about 2 percent of the 18- to 24-year-olds during the 1990s, and enrollment of the highest quintile had expanded from 20 percent to about 40 percent. Low access of the poorest reflected their financing constraints, which had become more binding during the recession of the late 1990s.
The project envisaged three components to achieve its goal: (i) a student aid program combining loans and grants targeted to academically qualified low- and middle-income students accepted to study in accredited programs relevant to the labor market (planned cost, US$252.1 million; actual cost, US$416.6 million); (ii) support for doctoral programs combining loans to graduate students and grants for higher education state-of-the-art equipment, infrastructure, and staff development and visiting professor stipends (planned cost, US$25.0 million; actual cost, US$32.2 million); and (iii) institutional strengthening of the Ministry of Education including development of a labor market monitoring program, of the Ministry’s capacity to formulate and implement policy and of the higher education information system. A fourth component covered project management and monitoring and evaluation (M&E) studies (planned cost, US$7.1 million; actual cost, US$6.6 million). These components aimed to address three of Colombia’s higher education constraints: the limited access of low- and middle-income youth to study programs of good quality; the incipient development of graduate programs; and the need to improve the higher education sector governance.
The project improved equity by expanding access to higher education through student loans to low income students. It improved the quality of higher education primarily by targeting loans to students admitted to accredited institutions, and also by supporting development of doctoral programs. Intended project support for the quality assurance system did not materialize, but the pace of accreditation increased. Quality improvements are also suggested by better learning outcomes of loan beneficiaries, possibly due to financial assistance allowing low-income students to reduce their workloads.
IEG rates the project’s outcome as satisfactory. Objectives were relevant to country conditions and Bank strategy. Design was relevant, particularly for the link between student loans and equity in access to higher education. The project made a significant contribution to access to higher education by relaxing the financial constraints faced by low-income students. The project also helped develop graduate programs and achieved increases in their productivity. An economic analysis of the project carried out by an external consultant estimated the economic rate of return at 14.8 percent (World Bank 2008a).

79 ANNEX C
IEG rates the risk to development outcome as moderate. The chief risk lies in a possible deterioration in student ability to repay loans that might arise from macroeconomic shocks affecting higher education completion rates, the returns to education, and the rate of unemployment, which would have a critical adverse impact on access and/or equity. A second risk relates to a recently changed policy that excluded funding for equipment, bibliography, databases and visiting professor stipends from support for doctoral programs. This exclusion may forestall progress in strengthening graduate programs, which benefited from the more integral line of support offered by the project that included these items in addition to funding graduate student loans.
IEG rates Bank performance as satisfactory. Quality at entry benefited from satisfactory quality at entry and satisfactory quality of supervision.
IEG rates borrower performance as satisfactory, with the government providing adequate fiscal space and an enabling macroeconomic environment and the implementing agency (Instituto Colombiano de Crédito Educativo y Estudios Técnicos en el Exterior, or ICETEX) undergoing an institutional reform that converted it into a professional student loan institution.
1. Background and Context
1. The Colombia Higher Education – Improving Access Project was prepared to help address three of Colombia’s higher education sector issues: (i) the limited access of low and middle income youth to study programs of good quality, an access that was adversely affected by a student loan system that served only 6 percent of students; (ii) the need to expand graduate programs; and (iii) the need to improve the higher education sector governance.
2. When the project was approved in 2002, the Bank had already been engaged in a number of successful primary and secondary education projects. The new project was the first focusing on higher education and was preceded by economic and sector work (particularly, World Bank 2003a); eight background papers; and a two-day, high-level workshop for key stakeholders to discuss how to improve access, quality, and responsiveness of the tertiary education system. In supporting this project, the Bank expected to bring to bear its international experience in higher education and education financing reform.
2. Objectives and Design
OBJECTIVES
3. Objectives. The project sought to “improve the quality and equity of Colombia’s tertiary education system.” Improving equity necessarily entails increasing access to groups with low enrollment. Accordingly, relevance of the objective would hinge on quality and access development opportunities in Colombia’s tertiary education (World Bank 2002b, p. 3; and Loan Agreement, p. 22).

ANNEX C 80
4. Relevance of the objectives. IEG rates the relevance of the project objectives as high. As discussed below, the operation’s objective remained consistent with the country’s development priorities and with Bank strategies when the project closed.
5. The PAD substantiated its two objectives (access and quality) by noting that the proposed project would support three of the six areas the CAS identified as important for Colombia: (i) developing human capital, (ii) attaining public sector responsiveness and efficiency, and (iii) ensuring sustainable development. In these regards, it stated that increased tertiary education was key to its economic competitiveness and growth, reducing poverty and inequity in income distribution; that capacity building, supervision, and increased demand-side financing would improve the effectiveness and efficiency of the public student loan system; and that improving the provision of tertiary education by expanding equitable access and enhancing the responsiveness of the sector would help establish a basis for sustainable development. The 2008 and 2011 Bank Country Assistance Strategies maintained the expansion of higher education access and improvement of quality as objectives, with a follow-on project approved in 2008.
6. Colombia’s growth had in fact relied significantly on human capital accumulation, and increased access to tertiary education accounted for part of it, with tertiary enrollment rates increasing from 14.2 percent in 1990 to 24.9 percent in 2002, the year the Bank approved the loan. Past incremental efforts in coverage placed Colombia at about the average for the region, just as its per capita GDP was also at about the average for the region. Investments in higher education were further warranted by quality gaps and a high rate of return. The Program for International Student Assessment (PISA) tests for 2006 placed Colombia toward the bottom among six Latin American countries (Colombia, Brazil, Argentina, Mexico, Uruguay, and Chile), yet the rate of return to tertiary education in Colombia still exceeded the opportunity cost of capital.14 Accordingly, investments to increase quality and access were likely to contribute to economic growth. As documented in the PAD for the 2008 follow-on project, the Second Student Loan Support, support for access and quality of tertiary education continued to address development priorities.
DESIGN
7. Components. The project had three components:
Component 1: Student aid (US$252.1 million at appraisal, US$416.6 million actual) – Efforts to promote the expansion, equity, and quality of tertiary education by allowing meritorious students from the poorest backgrounds to receive a mix of grants (25 percent) and nonsubsidized loans (75 percent) for studying at the tertiary level and allowing middle-income students to receive loans and therefore defer the cost of education until the benefits from the education begin.
14 Recent estimates point to a domestic internal rate of return on tertiary education for a pooled sample from the 2001-05 Colombian Household Surveys within a 7.4 percent to 12.8 percent range, higher than the cost of capital (García Suaza and others 2009).

81 ANNEX C
Component 2: Support to doctoral programs (US$25.0 million at appraisal, US$32.2 million actual) – Efforts to improve the stock of advanced human capital at the graduate level, thus improving the faculty of tertiary education and to provide top Colombian researchers with adequate resources, including a critical mass of the most talented young people, to induce them to remain in the country and strengthen the national innovation system through a consolidation of Colombian centers of excellence.
Component 3: Institutional Strengthening (US$7.1 million at appraisal, US$6.6 million actual) – Efforts to improve tertiary education's linkages to the labor market and improve the quality of their offerings through the creation of the Labor Market Observatory (Observatorio Laboral);improve higher education quality by improving and expanding the current quality assurance system to bring it into line with internationally recognized standards and to increase the number of accredited programs; and building capacity of the Ministry of Education and other governing bodies to improve the higher education framework.
Component 4: Project Implementation Unit (US$1.4 million at appraisal, US$2.4 million actual) - Establishment of a Project Coordination Unit and technical assistance for agencies, coordination and implementation of the activities in the first three project components.
8. Relevance of design. IEG rates relevance of design as substantial. Relevance of design hinges on the extent to which: (i) the project includes a clear statement of objectives and time-bound targets at both the intermediate and outcome levels; (ii) the causal chain between funding and intended outcomes was clear and convincing; and (iii) exogenous factors and unintended (positive and negative) effects were well identified.
9. The project objectives, formulated equivalently in the PAD and in the Loan Agreement, were clearly stated. The PAD defined key performance indicators on intermediate outcomes and the equity (but not the quality) development objective outcomes, but did not define time-bound targets. It indicated it would establish targets in the operational manual. Only a few indicative programmatic targets were included, many of which were unrelated to the outcome indicators.
10. The causal chain between funding and intended outcomes (Table C.1) is assessed as follows:
• The project sought to improve higher education equity by providing the lowest-income students, the major beneficiaries of the operation, with grants for 25 percent of the tuition cost and loans for 75 percent. Other students received only loans. This is financing that financial institutions were not providing, particularly regarding the long terms to maturity that student financing requires. Accordingly, the loan/grant and loan-only credit lines could be expected to increase higher education enrollment by addressing the student financing constraint.
• The project sought to improve higher education quality by (i) requiring loan beneficiaries to be admitted in pertinent and accredited study programs; (ii) developing doctoral programs and thereby improve the faculty; and (iii) strengthening linkages between higher education and the labor market, the quality assurance system, and the higher education information system (SNIES). Although this

ANNEX C 82
financing targeted well-identified institutional constraints (for example, the fragmented quality assurance system), its impact on quality and equity hinged on actual policy-making changes to which the component did not provide a clear link.
Table C.1. Higher Education - Improving Access Project: Results Chain
OUTPUTS OUTCOMES
Student Loans and Grants Improved equity of the tertiary education
system
Small civil works Staff development Visiting Professors for Doctoral Programs Capacity to monitor and implement higher education policy
Improved quality of the tertiary education system
Source: World Bank 2002b.
11. The PAD’s cost-effectiveness annex discussed factors that affect student ability to repay loans and the sustainability section briefly mentions the risk that higher education institutions fail to improve education quality and relevance (World Bank 2002b, Annex 4).
12. Implementation arrangements. The Project Coordination Unit was housed in the main executing agency (ICETEX) and coordinated with ICETEX’s head ministry, the Ministry of Education.
3. Implementation
13. Dates. The project was approved on December 23, 2002, and declared effective on July 16, 2003, about four months after the expected effectiveness date of March 3l, 2003. This four-month period was needed by the government to meet effectiveness conditions covering issuance of the Operational Manual, contracting of independent auditors by the implementing agency (to monitor student and higher education beneficiary eligibility, comply with the Operational Manual and loan agreement requirements in regard to project loans and grants, and meet financial reporting requirements), staffing the Project Coordination Unit and establishing its financial management system, submitting a consultant selection plan, and signing the subsidiary agreements. The project closed in November 2008, as anticipated in appraisal.
14. Actual versus Planned Expenditures. The PAD anticipated that the program would cost $287.72 million. The total cost increased to $460.03 million primarily because of the scaling-up of the first component from $252.14 million to $416.64 million. The government provided the additional funding ($172.32 million). This increase was driven by the number of students receiving financial assistance from the program (147,410), which exceeded expectations (100,000). The costs of the second and fourth components also increased. Costs of the second component (doctoral programs) increased from $25.00 million to $32.24 million, which was also driven by the number of doctoral
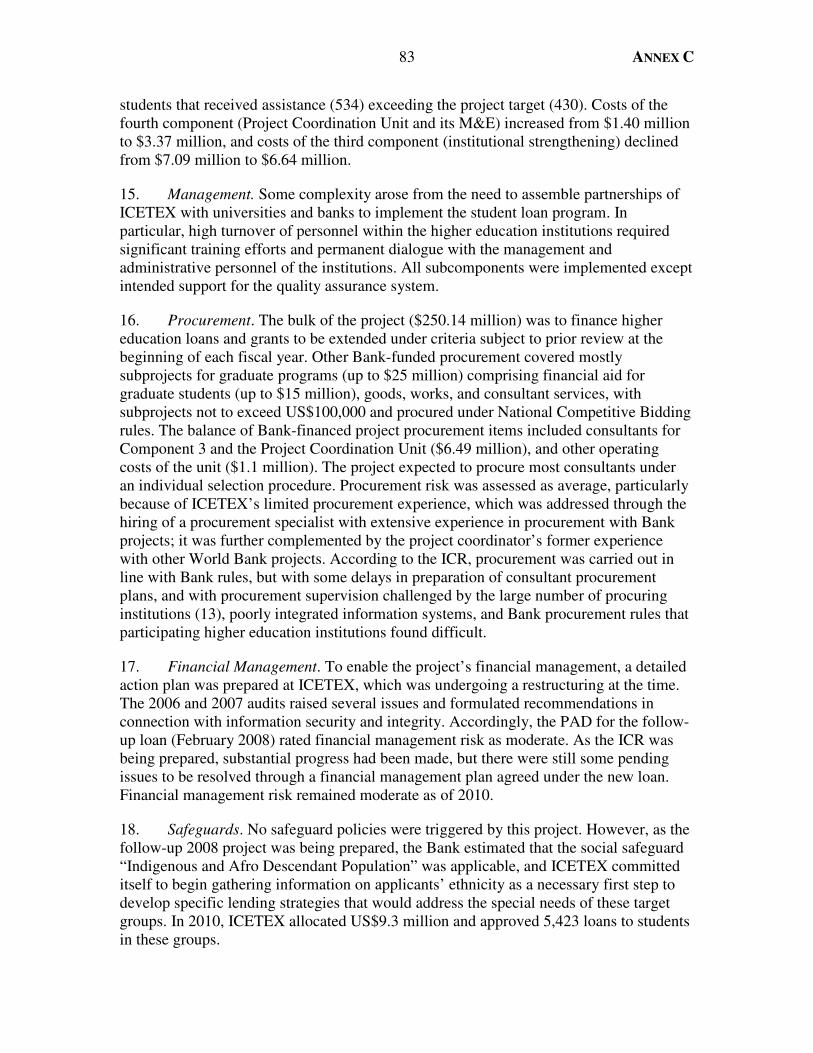
83 ANNEX C
students that received assistance (534) exceeding the project target (430). Costs of the fourth component (Project Coordination Unit and its M&E) increased from $1.40 million to $3.37 million, and costs of the third component (institutional strengthening) declined from $7.09 million to $6.64 million.
15. Management. Some complexity arose from the need to assemble partnerships of ICETEX with universities and banks to implement the student loan program. In particular, high turnover of personnel within the higher education institutions required significant training efforts and permanent dialogue with the management and administrative personnel of the institutions. All subcomponents were implemented except intended support for the quality assurance system.
16. Procurement. The bulk of the project ($250.14 million) was to finance higher education loans and grants to be extended under criteria subject to prior review at the beginning of each fiscal year. Other Bank-funded procurement covered mostly subprojects for graduate programs (up to $25 million) comprising financial aid for graduate students (up to $15 million), goods, works, and consultant services, with subprojects not to exceed US$100,000 and procured under National Competitive Bidding rules. The balance of Bank-financed project procurement items included consultants for Component 3 and the Project Coordination Unit ($6.49 million), and other operating costs of the unit ($1.1 million). The project expected to procure most consultants under an individual selection procedure. Procurement risk was assessed as average, particularly because of ICETEX’s limited procurement experience, which was addressed through the hiring of a procurement specialist with extensive experience in procurement with Bank projects; it was further complemented by the project coordinator’s former experience with other World Bank projects. According to the ICR, procurement was carried out in line with Bank rules, but with some delays in preparation of consultant procurement plans, and with procurement supervision challenged by the large number of procuring institutions (13), poorly integrated information systems, and Bank procurement rules that participating higher education institutions found difficult.
17. Financial Management. To enable the project’s financial management, a detailed action plan was prepared at ICETEX, which was undergoing a restructuring at the time. The 2006 and 2007 audits raised several issues and formulated recommendations in connection with information security and integrity. Accordingly, the PAD for the follow-up loan (February 2008) rated financial management risk as moderate. As the ICR was being prepared, substantial progress had been made, but there were still some pending issues to be resolved through a financial management plan agreed under the new loan. Financial management risk remained moderate as of 2010.
18. Safeguards. No safeguard policies were triggered by this project. However, as the follow-up 2008 project was being prepared, the Bank estimated that the social safeguard “Indigenous and Afro Descendant Population” was applicable, and ICETEX committed itself to begin gathering information on applicants’ ethnicity as a necessary first step to develop specific lending strategies that would address the special needs of these target groups. In 2010, ICETEX allocated US$9.3 million and approved 5,423 loans to students in these groups.

ANNEX C 84
4. Achievement of the Objectives
IMPROVING THE EQUITY OF THE TERTIARY EDUCATION SYSTEM (High)
19. Outputs. The number of beneficiaries exceeded targets, in part as a result of the additional government funding of the project. The project benefited 147,410 students between 2003 and 2008, exceeding the target (100,000). Similarly, graduate student loan beneficiaries (534) exceeded the target (430), and the number of supported graduate programs (72 by 2007) also exceeded expectations (21). The loan program was focused on students from low-income families, who would have been most affected by credit constraints. Student selection was based on a national system for identifying poor households (SISBEN), a system that has a recognized targeting effectiveness.15 ICETEX tracks the SISBEN category of credit recipients, with more than 90 percent of them falling in the three lowest income categories (out of six) and more than 80 percent falling within the two lowest income categories. On institutional development, project outputs included establishment of the Labor Market Observatory that tracks information on higher education graduates and development of the higher education information system, both up and running today.
20. Outcomes. By increasing higher education access to the poor, the project improved equity. Prior estimates indicated an expansion in gross enrollment from 24.4 percent in 2002 to 37.3 percent in 2010. These estimates exaggerated the expansion in coverage because they included, beginning in 2003, the rapidly expanding enrollment in the National Learning Center (SENA, Servicio Nacional de Aprendizaje), Colombia’s foremost public technical education institution. SENA currently provides around 370 programs in a wide range of areas, ranging from cooking to Bioinformatics of Genomic Sequences. Only a few SENA programs have been licensed by the National Higher Education Quality Assurance Commission to operate as higher education programs. In the prior estimates, SENA’s inclusion in tertiary education data accounted for 88.3 percent of the expansion in technical education enrollment from 2002 to 2010, and technical education enrollment accounted for 53.2 percent of overall higher education enrollment. The student loan program supported by the project did not cover SENA trainees or students at public institutions. The latter are supported through lower fees allowed by government budget allocations.
21. New estimates, shown in Figure C.1, allow comparability of the period after 2002 to the prior years. These new estimates still show an expansion in coverage, from 24.4 percent in 2002 percent to 30.3 percent in 2010, with some acceleration detected following introduction of the Bank supported student loan program (named ACCES). As Figure C.1 shows, the Bank-supported student loan program covered from 6.8 percent to 10.7 percent of first-year undergraduates, depending on the year. The coverage of all ICETEX student loan programs raises this range to 8.4-15.3 percent. As a result of these efforts, the number of ICETEX new and renewed loans increased from 4.1 percent of total enrollment in 2002 to 16.5 percent in 2010. About three quarters of 2010
15 See IEG 2011c, which acknowledged SISBEN’s credibility, indicating that “SISBEN was well known and credible to the poor, and incidence analysis found it to be the most effective targeting system in Colombia.”

85 ANNEX C
beneficiaries belonged to the students from the lowest income families. Two impact evaluation studies, conducted by two of Colombia’s foremost universities, were financed by the project and concluded that the availability of credit reduced drop-out rates (Universidad Nacional de Colombia 2006; Universidad de los Andes 2008). The 2008 study estimated that the average beneficiary drop-out rate was 9.4 percent, much lower than the average rate for otherwise comparable non-beneficiaries (34.4 percent). Average drop-out rates remain high because they depend also on academic, individual, and institutional factors. Accordingly, student loans appear to have contributed to raising enrollment.
22. The increased equity in access to non-SENA higher education institutions is likely to be reinforced by the faster expansion of the lower cost public universities, where attendance of low income students is relatively more concentrated. The share of enrollment in non-SENA public institutions increased from 41.7 percent in 2002 to 45.8 percent in 2010.
Figure C.1. Colombia – Gross Enrollment in Tertiary Education (Percent): 1990-2010
Source: World Bank. World Development Indicators. ECLA.
0.0
5.0
10.0
15.0
20.0
25.0
30.0
35.0
2000
2001
2002
2003
2004
2005
2006
2007
2008
2009
2010
School Enrollment, tertiary (Percent Gross)-Excludes SENA
New Acces Benficiaries/First Year Undergraduates
Outstanding Number of Loans/Non-SENA HE Enrollment
Project
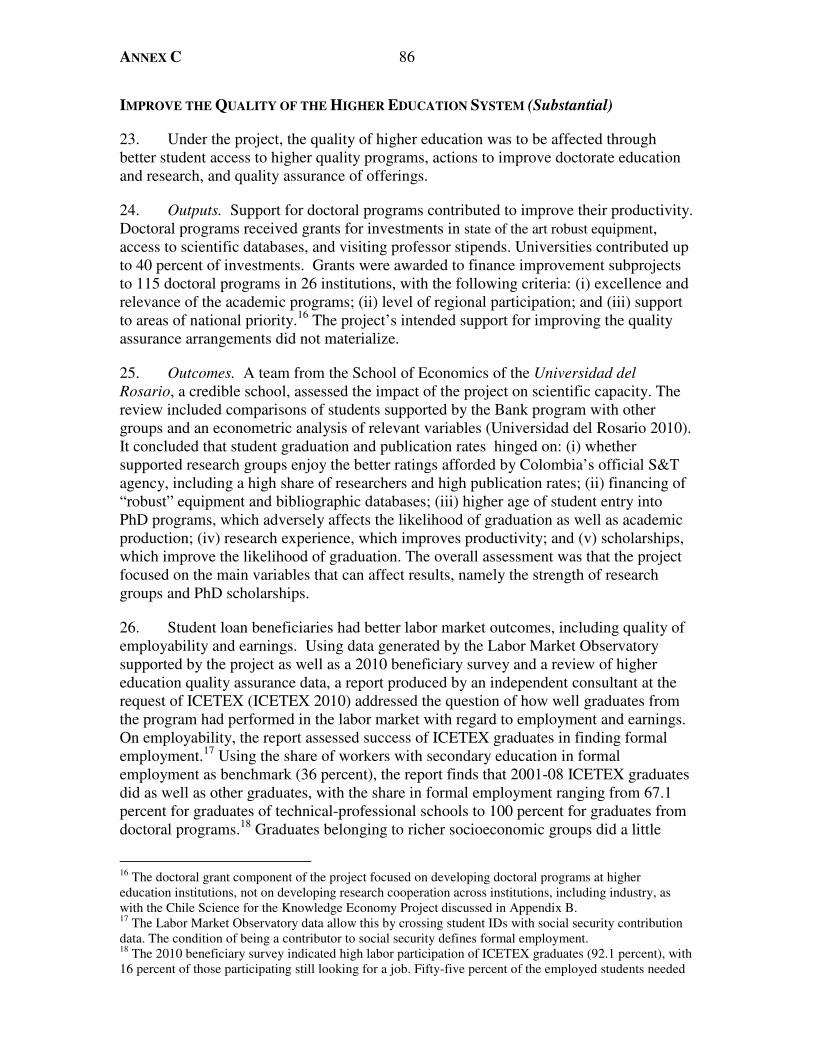
ANNEX C 86
IMPROVE THE QUALITY OF THE HIGHER EDUCATION SYSTEM (Substantial)
23. Under the project, the quality of higher education was to be affected through better student access to higher quality programs, actions to improve doctorate education and research, and quality assurance of offerings.
24. Outputs. Support for doctoral programs contributed to improve their productivity. Doctoral programs received grants for investments in state of the art robust equipment, access to scientific databases, and visiting professor stipends. Universities contributed up to 40 percent of investments. Grants were awarded to finance improvement subprojects to 115 doctoral programs in 26 institutions, with the following criteria: (i) excellence and relevance of the academic programs; (ii) level of regional participation; and (iii) support to areas of national priority.16 The project’s intended support for improving the quality assurance arrangements did not materialize.
25. Outcomes. A team from the School of Economics of the Universidad del Rosario, a credible school, assessed the impact of the project on scientific capacity. The review included comparisons of students supported by the Bank program with other groups and an econometric analysis of relevant variables (Universidad del Rosario 2010). It concluded that student graduation and publication rates hinged on: (i) whether supported research groups enjoy the better ratings afforded by Colombia’s official S&T agency, including a high share of researchers and high publication rates; (ii) financing of “robust” equipment and bibliographic databases; (iii) higher age of student entry into PhD programs, which adversely affects the likelihood of graduation as well as academic production; (iv) research experience, which improves productivity; and (v) scholarships, which improve the likelihood of graduation. The overall assessment was that the project focused on the main variables that can affect results, namely the strength of research groups and PhD scholarships.
26. Student loan beneficiaries had better labor market outcomes, including quality of employability and earnings. Using data generated by the Labor Market Observatory supported by the project as well as a 2010 beneficiary survey and a review of higher education quality assurance data, a report produced by an independent consultant at the request of ICETEX (ICETEX 2010) addressed the question of how well graduates from the program had performed in the labor market with regard to employment and earnings. On employability, the report assessed success of ICETEX graduates in finding formal employment.17 Using the share of workers with secondary education in formal employment as benchmark (36 percent), the report finds that 2001-08 ICETEX graduates did as well as other graduates, with the share in formal employment ranging from 67.1 percent for graduates of technical-professional schools to 100 percent for graduates from doctoral programs.18 Graduates belonging to richer socioeconomic groups did a little
16 The doctoral grant component of the project focused on developing doctoral programs at higher education institutions, not on developing research cooperation across institutions, including industry, as with the Chile Science for the Knowledge Economy Project discussed in Appendix B. 17 The Labor Market Observatory data allow this by crossing student IDs with social security contribution data. The condition of being a contributor to social security defines formal employment. 18 The 2010 beneficiary survey indicated high labor participation of ICETEX graduates (92.1 percent), with 16 percent of those participating still looking for a job. Fifty-five percent of the employed students needed
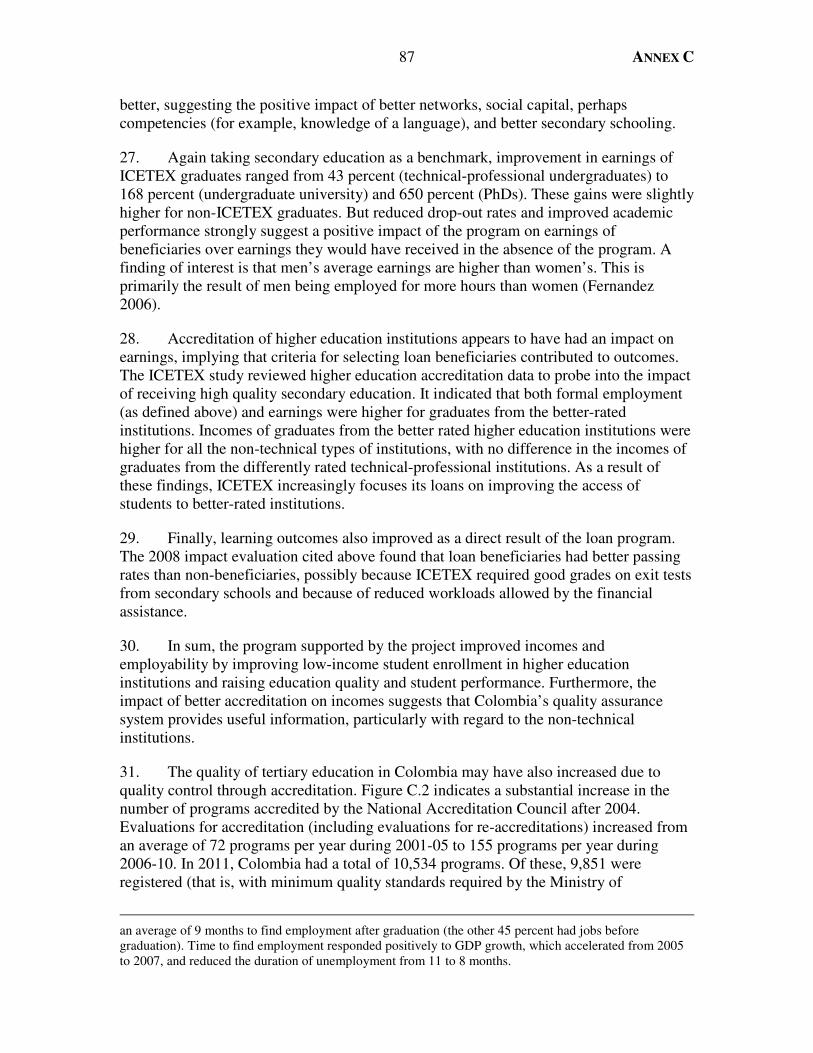
87 ANNEX C
better, suggesting the positive impact of better networks, social capital, perhaps competencies (for example, knowledge of a language), and better secondary schooling.
27. Again taking secondary education as a benchmark, improvement in earnings of ICETEX graduates ranged from 43 percent (technical-professional undergraduates) to 168 percent (undergraduate university) and 650 percent (PhDs). These gains were slightly higher for non-ICETEX graduates. But reduced drop-out rates and improved academic performance strongly suggest a positive impact of the program on earnings of beneficiaries over earnings they would have received in the absence of the program. A finding of interest is that men’s average earnings are higher than women’s. This is primarily the result of men being employed for more hours than women (Fernandez 2006).
28. Accreditation of higher education institutions appears to have had an impact on earnings, implying that criteria for selecting loan beneficiaries contributed to outcomes. The ICETEX study reviewed higher education accreditation data to probe into the impact of receiving high quality secondary education. It indicated that both formal employment (as defined above) and earnings were higher for graduates from the better-rated institutions. Incomes of graduates from the better rated higher education institutions were higher for all the non-technical types of institutions, with no difference in the incomes of graduates from the differently rated technical-professional institutions. As a result of these findings, ICETEX increasingly focuses its loans on improving the access of students to better-rated institutions.
29. Finally, learning outcomes also improved as a direct result of the loan program. The 2008 impact evaluation cited above found that loan beneficiaries had better passing rates than non-beneficiaries, possibly because ICETEX required good grades on exit tests from secondary schools and because of reduced workloads allowed by the financial assistance.
30. In sum, the program supported by the project improved incomes and employability by improving low-income student enrollment in higher education institutions and raising education quality and student performance. Furthermore, the impact of better accreditation on incomes suggests that Colombia’s quality assurance system provides useful information, particularly with regard to the non-technical institutions.
31. The quality of tertiary education in Colombia may have also increased due to quality control through accreditation. Figure C.2 indicates a substantial increase in the number of programs accredited by the National Accreditation Council after 2004. Evaluations for accreditation (including evaluations for re-accreditations) increased from an average of 72 programs per year during 2001-05 to 155 programs per year during 2006-10. In 2011, Colombia had a total of 10,534 programs. Of these, 9,851 were registered (that is, with minimum quality standards required by the Ministry of
an average of 9 months to find employment after graduation (the other 45 percent had jobs before graduation). Time to find employment responded positively to GDP growth, which accelerated from 2005 to 2007, and reduced the duration of unemployment from 11 to 8 months.

ANNEX C 88
Education) and about 1,101 were accredited by the National Accreditation Commission) However, any changes in quality resulting from this accreditation effort would not be attributable to the Bank-supported program, as it did not provide technical assistance for that purpose.
Figure C.2. Number of Accredited Higher Education Programs
Source: National Accreditation Council
5. Efficiency
32. IEG rates project efficiency as substantial. Neither the PAD not the ICR calculated economic rates of return for the project. The economic analysis in the PAD provided a comparison of the cost-effectiveness of the selected student loan scheme with a full grant scheme. The project choice of 6 percent real interest rate on the student loans suggests that a minimum financial rate of return on education of that order was being assumed. The ICR cites Evidence from preparation of the follow-up project (Second Student Loan Support Project Adaptable Program Loan Phase I) that pointed to internal rates of return from 13.8 to 27.9 percent, depending on the beneficiary for which it was calculated (the economy as a whole, the government, or the students). From the perspective of the economy as a whole, the estimated economic rate of return (ERR) was 14.8 percent, higher than any estimate of Colombia’s real interest rate (see Echavarria and others 2007). From the perspective of the students, the estimated internal rate of return (IRR) was 27.9 percent. This high return is well above the top of the 7.4–12.8 percent range cited from a recent study (García Suaza and others 2009) based on household surveys. The higher return reflects the additional benefits received by students from the subsidized loans. The findings of the ICETEX report (ICETEX 2010) also suggest a high IRR.
33. There is little or no evidence on the efficiency of project investments in strengthening institutions or in monitoring and evaluation, the other key project outputs.
0
20
40
60
80
100
120
140
160
180
1998
1999
2000
2001
2002
2003
2004
2005
2006
2007
2008
2009
2010
Project

89 ANNEX C
6. Ratings
OUTCOME
34. The overall outcome of the project is rated Satisfactory, based on relevance ratings that are high for objectives and substantial for design, efficacy ratings of high for equity of access and substantial for quality, and an efficiency rating of substantial.
RISK TO DEVELOPMENT OUTCOME
35. IEG rates the risk to development outcome as moderate. Risk to development outcome is assessed by considering two dimensions: (i) the likelihood that some changes may occur that are detrimental to the ultimate achievement of the operation’s development outcome; and (ii) the impact on the operation’s development outcomes of some or all of these changes materializing.
36. The chief risk lies in a possible deterioration in student ability to repay loans that might arise from macroeconomic shocks affecting higher education completion rates, the return to education and the rate of unemployment, which would have a critical adverse impact on access and/or equity. This risk is limited by the 16 percent cap on the share of income that students need to repay. Even then, though, conditions like the deep recession of the late 1990s are likely to both reduce both university attendance and earnings. But the low historical frequency of such conditions (once in several decades) suggests that the likelihood of their arising again is limited. Although the recent global financial crisis affected Colombia’s growth, its impact was considerably muted compared with the crisis of the late 1990s.
37. A second risk relates to recently changed policies on financing doctoral programs. Under the new policy, support for doctoral programs is limited to PhD scholarships, thereby excluding support for equipment scientific data bases, and visiting professor stipends. Based on the findings of the assessment, which assigns a positive impact to the now excluded support, there is a possible adverse impact on the further development of doctoral programs. There is little empirical basis to indicate the size of the possible impact, which will depend on the ability of higher education institutions to find other sources of finance and/or grants for those basic components of doctoral research and development.
MONITORING AND EVALUATION
38. M&E Design. The M&E activities envisaged by the project are summarized in Table C.2Table C. M&E design was fairly thorough. It covered demand side and financial indicators of the student loan program, labor market data, and analysis of its use to universities in tailoring their programs to the market, development of the Ministry of Education’s M&E capacity to formulate policy and higher education statistics, and financing of M&E studies.
39. Demand-side indicators were to cover the income level of beneficiaries, a key indicator of the equity dimension of the project objective, and the academic results of beneficiaries versus non-beneficiaries, an indicator of quality effects of the component.

ANNEX C 90
The Labor Market Observatory was to gather data and produce and disseminate labor market analysis of use to universities in tailoring their programs to the market. The Ministry of Education was to develop its own higher education M&E capacity. In particular, financing of improvements in the National Information System for Higher Education responded to the PAD’s diagnosis that the tertiary education M&E system was inadequate, with only a limited number of input indicators, and no systematic information on output or impact. The Project Coordination Unit envisaged financing of M&E studies.
40. M&E Implementation. Implementation of M&E covered the planned areas. ICETEX developed the student loan M&E system. The information monitored included beneficiary, operational, and financial information, including portfolio management data. ICETEX uses the system for its own business and student loan policy-making. The Labor Market Observatory established under the project disseminates data on occupational profiles and incomes of graduates from different levels, as well as employer-related information for students, parents, and professional counselors. The Ministry of Education has demonstrated an enhanced capacity for M&E through an improvement in available indicators (including higher education indicators) and in reporting of education results. Impact evaluation studies focused on drop-out rates, but did not establish more firmly the extent to which overall higher education quality changed and the improved outcomes were attributable to the project’s investments in quality.
41. The Project Coordination Unit included two impact evaluations of the student loan activities. ICETEX contracted for the two studies. The first study (2004) used 2003-04 data to conclude that drop-out rates were lower and access higher among beneficiaries than non-beneficiaries who applied for but did not receive, or did not apply for, the financial assistance. Furthermore, most beneficiaries (86 percent) felt that credit had been very important for their academic performance.19 The second study (2008) confirmed the impact on drop-out rates and developed a tool to identify those students with a high risk of dropping out and any causes so that preventive measures could be adopted. Both studies also probed into impacts on academic achievements and suggested that the loan program may have improved academic performance.20 A comprehensive report covering ICETEX’s experience as well as the outcomes regarding access, equity, employment and earnings was completed in 2010 (ICETEX 2010).
42. M&E Utilization. ICETEX uses its M&E system as a continuous source for its policy decision. There is no indication yet that the Labor Market Observatory is yet a central source of information for universities to tailor their programs to labor market conditions. The SNIES, the higher education information system, is now an indispensable source of information for higher education policy. The results of the impact evaluations and other studies relating to student drop-out rates increased the focus of the Ministry of Education on policies and programs to reduce these rates.
43. Accordingly, IEG rates the quality of monitoring and evaluation as substantial.
19 See the summary of the study in http://www.mineducacion.gov.co/cvn/1665/fo-article-100776.pdf. 20 The 2008 study found that passing rates in the first semester were 15 percent higher for beneficiaries of the loan program than for non-beneficiaries. This finding was statistically significant in that study, but non-significant in the earlier, 2004 study (World Bank 2009, p. 26).
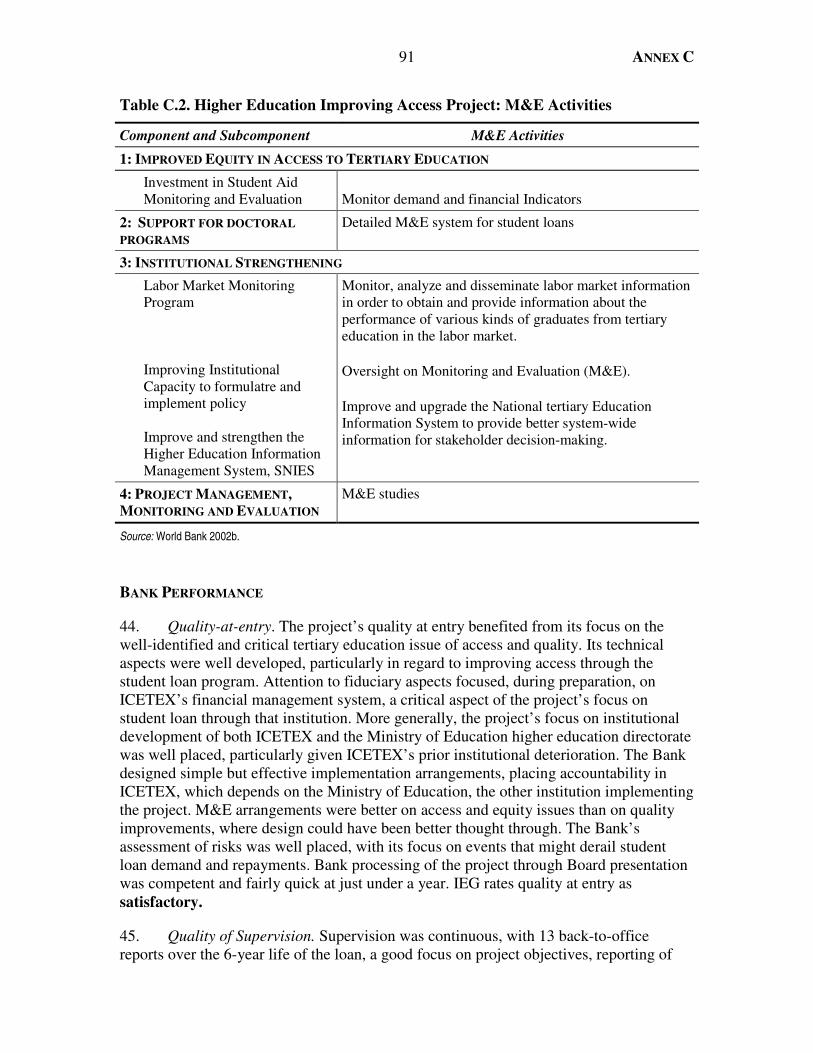
91 ANNEX C
Table C.2. Higher Education Improving Access Project: M&E Activities
Component and Subcomponent M&E Activities
1: IMPROVED EQUITY IN ACCESS TO TERTIARY EDUCATION
Investment in Student Aid Monitoring and Evaluation
Monitor demand and financial Indicators
2: SUPPORT FOR DOCTORAL
PROGRAMS Detailed M&E system for student loans
3: INSTITUTIONAL STRENGTHENING
Labor Market Monitoring Program Improving Institutional Capacity to formulatre and implement policy Improve and strengthen the Higher Education Information Management System, SNIES
Monitor, analyze and disseminate labor market information in order to obtain and provide information about the performance of various kinds of graduates from tertiary education in the labor market. Oversight on Monitoring and Evaluation (M&E). Improve and upgrade the National tertiary Education Information System to provide better system-wide information for stakeholder decision-making.
4: PROJECT MANAGEMENT, MONITORING AND EVALUATION
M&E studies
Source: World Bank 2002b.
BANK PERFORMANCE
44. Quality-at-entry. The project’s quality at entry benefited from its focus on the well-identified and critical tertiary education issue of access and quality. Its technical aspects were well developed, particularly in regard to improving access through the student loan program. Attention to fiduciary aspects focused, during preparation, on ICETEX’s financial management system, a critical aspect of the project’s focus on student loan through that institution. More generally, the project’s focus on institutional development of both ICETEX and the Ministry of Education higher education directorate was well placed, particularly given ICETEX’s prior institutional deterioration. The Bank designed simple but effective implementation arrangements, placing accountability in ICETEX, which depends on the Ministry of Education, the other institution implementing the project. M&E arrangements were better on access and equity issues than on quality improvements, where design could have been better thought through. The Bank’s assessment of risks was well placed, with its focus on events that might derail student loan demand and repayments. Bank processing of the project through Board presentation was competent and fairly quick at just under a year. IEG rates quality at entry as satisfactory.
45. Quality of Supervision. Supervision was continuous, with 13 back-to-office reports over the 6-year life of the loan, a good focus on project objectives, reporting of

ANNEX C 92
emerging issues, and addressing resolution of those issues. Transition arrangements resulted in a new operation, this time directly to ICETEX, the institution that the project helped improve. IEG rates quality of supervision as satisfactory.
46. Accordingly, IEG rates Bank performance as satisfactory.
BORROWER PERFORMANCE
47. Government Performance. The government acted primarily through the Ministry of Education. Apart from this representation, the government provided the fiscal space for the project loan as well as an enabling environment, particularly with regard to economic recovery policies, following the deep recession of the late 1990s. This recovery was to be a critical input for the student loan program, where attendance to tertiary education, graduation, and loan repayment are sensitive to economic conditions. From these perspectives, IEG rates government performance as highly satisfactory.
48. Implementing Agency Performance. ICETEX’s performance was particularly noteworthy, with a reform program that enabled it to implement the loan successfully, including fiduciary aspects (financial management) and the development of a student loan monitoring system. The reforms program included an increased focus on low-income students with a good academic performance record and admitted to an accredited program; subsidized long-term loans to enable repayment, with the subsidy covered by the government budget; a reform of its information systems to manage relations with beneficiaries and higher education institutions, with strong reliance on Web-based systems; a resource mobilization strategy to ensure long-term sustainability of the student loan program, including resources from private sources; and strengthening of loan portfolio administration and risks. This reform proved critical for ensuring transition into the new Bank operation that extended the loan directly to ICETEX. Nevertheless, project implementation suffered from the procurement and financial management issues raised above.
49. The Ministry of Education successfully implemented the subcomponent of development grants to higher education institutions, the Labor Market Observatory, and improvements of the higher education information system. Higher education accreditation improved despite the absence of the intended Bank support. IEG rates implementing agency (ICETEX and the Ministry of Education) performance as satisfactory.
50. Accordingly, IEG rates borrower performance as satisfactory.
7. Lessons
51. The Higher Education – Improving Access Project offers the following lessons:
Broadening Higher Education Access
• Student loans may be an effective instrument to curb student dropout rates in higher education and increase learning. An impact evaluation of the project suggests this strongly by comparing drop-out rates of beneficiaries with those of

93 ANNEX C
otherwise similar non-beneficiaries. Since beneficiaries were generally poor, the program also improved equity through lowering dropout rates. However, as drop- out rates remain high, addressing student drop-out rates may need other actions, including adequate remedial programs and counseling.
• A critical driver of success in a student loan program is the institutional development of the student loan agency. Such development covers systems to ensure financial sustainability, effective identification of the targeted population, managerial stability, and adequate loan recovery arrangements. ICETEX made considerable progress in these areas.
Increasing Higher Education Quality
• Combining quality accreditation with support for those students admitted to accredited higher education institutions may help foster higher education quality. The pace of program accreditation accelerated and student loans primarily targeted students admitted to accredited institutions. Although the evidence is fragmentary, it appears that the supply of better quality programs has increased.
• Student loans can help increase test results. Impact evaluations suggested that student loans raise test results, which may be due to the reduction in student work load enabled by the loans and the selection of students with a good academic performance record.
Links to the Labor Market
• Student loans can help improve quality of employment and earnings. Colombia’s student loan program increased the quality of employment, as indicated by access to formal employment, and raised the earnings of beneficiaries, who were primarily among the poor.
Links to the Knowledge Economy
• Combined support for doctoral scholarships, equipment, and visiting scholars may raise publication rates and other indicators of scientific activity, as was shown by an impact evaluation of the program.
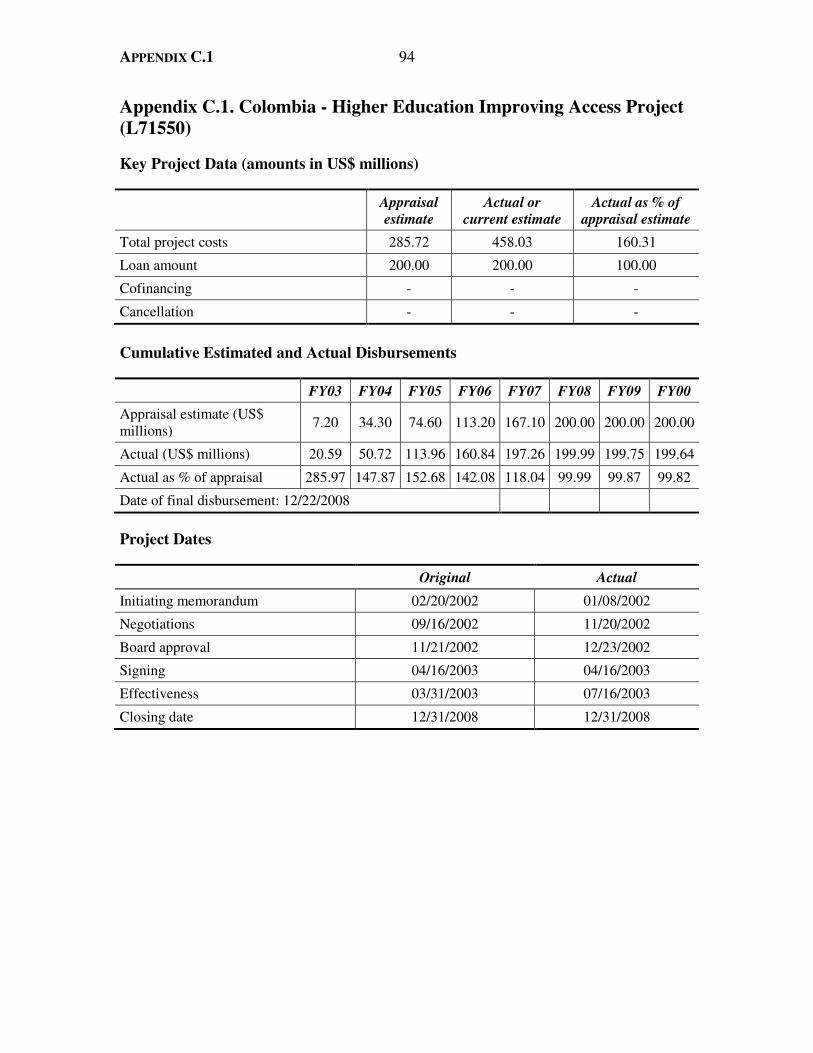
APPENDIX C.1 94
Appendix C.1. Colombia - Higher Education Improving Access Project (L71550)
Key Project Data (amounts in US$ millions)
Appraisal estimate
Actual or current estimate
Actual as % of appraisal estimate
Total project costs 285.72 458.03 160.31
Loan amount 200.00 200.00 100.00
Cofinancing - - -
Cancellation - - -
Cumulative Estimated and Actual Disbursements
FY03 FY04 FY05 FY06 FY07 FY08 FY09 FY00
Appraisal estimate (US$ millions)
7.20 34.30 74.60 113.20 167.10 200.00 200.00 200.00
Actual (US$ millions) 20.59 50.72 113.96 160.84 197.26 199.99 199.75 199.64
Actual as % of appraisal 285.97 147.87 152.68 142.08 118.04 99.99 99.87 99.82
Date of final disbursement: 12/22/2008
Project Dates
Original Actual
Initiating memorandum 02/20/2002 01/08/2002
Negotiations 09/16/2002 11/20/2002
Board approval 11/21/2002 12/23/2002
Signing 04/16/2003 04/16/2003
Effectiveness 03/31/2003 07/16/2003
Closing date 12/31/2008 12/31/2008

95 APPENDIX C.1
Staff Time and Cost
Stage of Project Cycle Staff Time and Cost (Bank Budget Only)
Lending
No. of staff weeks US$ Thousands (including
travel and consultants costs)
FY02 4.55 80.34
FY03 26.32 173.18
Total: 30.87 253.52
Supervision/ICR
FY03 48.45
FY04 23.87 120.14
FY05 17.63 94.14
FY06 19.11 151.62
FY07 35.20 176.87
FY08 17.84 68.67
FY09 10.18 63.62
Total: 123.83 723.51
Task Team Members
Names Title Unit Responsibility/
Specialty
Lending
Lauritz Holm-Nielsen Lead Higher Education, Science and Technology Specialist
LCSDF Education
Martha Laverde Sr. Education Specialist LCSHD Education
Andreas Blom Consultant LCSHD Education
Obin De Pietro-Jurand Consultant LCSHD Education
Samia Benbouzid Language Team Assistant LCSHD Assistant
Maria Lucy Gilardo/Marcelo Osorio/Jose Martinez
Sr. Procurement Specialist/Procurement Consultant/Procurement Specialist
LCOPR Procurement
Luis Schwartz/Otto Bolanhos
Sr. Financial Management Specialist LCOAA Financial Management
Joseph Formoso Sr. Financial Officer LOAG3 Financial Management
Eduardo Brito Sr. Counsel LEGLA Legal
William Saint Lead Education Specialist AFTH3 Education
Eduardo Velez Sr. Economist LCSPP
Jamil Salmi Education Sector Manager HDNED Education

APPENDIX C.1 96
Names Title Unit Responsibility/
Specialty
Patricia McEnzie Sr. Financial Management Specialist LCOAA Financial Management
Eduardo Aldana Consultant LCSHE Education
Jose Joaquin Brunner Consultant LCSHE Education
Maria Jose Lemaitre Consultant LCSHE Education
Juan Carlos del Bello Consultant LCSHE Education
IsabelCristina Jaramillo Education
Supervision/ICR
Lauritz Holm-Nielsen Lead Higher Education, Science and Technology Specialist
LCSHD Education
Samia Benbouzid Program Assistant CESGM Assistant
Patricia M. Bernedo Senior Program Assistant LCSHS-DPT
Assistant
Andreas Blom Sr. Education Economist SASHD Education
Alejandro Caballero Education Specialist LCSHE Education
Christoph Kurowski Sector Leader LCSHD Education
Claudia Mylenna Cardenas Garcia
Consultant LCSFM Financial Management
Pedro Cerdan-Infantes Junior Professional Associate LSCHD Education
Elsa Coy E T Temporary LCCCO Assistant
Michael F. Crawford Sr. Education Specialist LCSHE Education
Jeannette Estupinan Financial Management Specialist LCSFM Financial Management
Martha Laverde Sr. Education Specialist LCSHE Education
Jose. M. Martinez Sr. Procurement Specialist LCSPT Procurement
Gabriel Penaloza Procurement Specialist LCSPT Procurement
Alberto Rodriguez Country Sector Coordinator EASHD Education
Eduardo Velez Bustillo Sector Manager EASHD Education
Andrea Welsh Consultant LCSHE Education
Aracelly G. Woodall Senior Program Assistant LCSHE Assistant

97 APPENDIX C.1
Other Project Data
Borrower/Executing Agency: Government of Colombia/ICETEX/Ministry of Education/Colciencias
Follow-on Operations
Operation
Credit no.
Amount (US$ million)
Board date
Colombia – Second Student Loan Support Project 7515-CO 300 04/03/2008

APPENDIX C.2 98
Appendix C.2. List of Persons Met
Eduardo Aldana, Professor Emeritus, University of the Andes.
Marta Angel Salazar, Department of Science Technology and Innovation (Departamento Administrativo de Ciencia, Tecnología e Innovación, Colciencias).
Jaime Eduardo Bernal Villegas, Coordinator. National Accreditation Council.
Geoeffrey H. Bergen, Country Manager, Colombia, World Bank.
Alejandro Caballero, Task Manager, Higher Education – Improving Access Project, World Bank.
María Gloria Cano, Consultant, Econometría Consultores.
Angel Amparo Cuellar Chavez, Advisor to the General Directorate of Public Credit and National Treasury, Ministry of Finance.
Raquel Diaz, Head of ACCES Facility, ICETEX.
Juan José Echavarría, Director, Central Bank of Colombia (Banco de la República).
Angel Humberto Facundo Diaz, Consultant.
Isabel Fernandez, SubDirector, Analysis and Dissemination, Instituto Colombiano para la Evaluación de la Educación, ICFES.
Juan Manuel Garcia, Consultant, Econometría Consultores.
Luz Fabiola Gómez, Program Manager, Department of Science Technology and Innovation (Departamento Administrativo de Ciencia, Tecnología e Innovación, Colciencias).
Carolina Guzman.SubDirector, Higher Education Sector Development.
José Fernando Isaza Delgado, Rector, Jorge Tadeo Lozano University, President, Colombian University Association (Asociacion Colombiana de Universidades, ASCUN).
Hernan Jaramillo, Dean, Department of Economics, University of el Rosario, Colombia.
Salomon Kalmanovitz, Professor, Department of Economics, Jorge Tadeo Lozano University.
Marta Laverde, Senior Education Specialist, HDNED, World Bank.
Cesar Mauricio Lopez Alfonso, Coordinator, Higher Education Information System, Ministry of Education.
Manuel Ramirez, Professor, Department of Economics, University of el Rosario, Colombia.

99 APPENDIX C.2
Alvaro Reyes, Consultant, Econometría Consultores.
Doris Yaneth Rodriguez, Director, Knowledge Networks, Department of Science Technology and Innovation (Departamento Administrativo de Ciencia, Tecnología e Innovación, Colciencias).
Carolina Mary Rojas Hayes, Deputy Director, Multilateral and Bilateral Debt, Ministry of Finance.
Diego Sandoval, Head, Econometría Consultores.
Ana Beatriz Sanchez, Program Manager, Department of Science Technology and Innovation (Departamento Administrativo de Ciencia, Tecnología e Innovación, Colciencias).
Fabio Sanchez Torres, Professor, University of the Andes.
Alfredo Sarmiento Gomez, Consultant.
Eduardo Velez, Former Sector Manager, Human Development, Latin America and the Caribbean Region, World Bank.
Alejandro Venegas, Higher Education Vice-Ministry, Ministry of Education