Do You Want Your Autonomous Car to Drive Like You?anca/papers/HRI2017_styleprefere… · Do You...
9
Do You Want Your Autonomous Car to Drive Like You? Chandrayee Basu UC Merced [email protected] Qian Yang Carnegie Mellon Univ. [email protected] David Hungerman UC Merced [email protected] Mukesh Singhal UC Merced [email protected] Anca D. Dragan UC Berkeley [email protected] ABSTRACT With progress in enabling autonomous cars to drive safely on the road, it is time to start asking how they should be driving. A common answer is that they should be adopting their users’ driving style. This makes the assumption that users want their autonomous cars to drive like they drive – aggressive drivers want aggressive cars, defensive drivers want defensive cars. In this paper, we put that assumption to the test. We find that users tend to prefer a significantly more defensive driving style than their own. Interestingly, they prefer the style they think is their own, even though their actual driving style tends to be more aggressive. We also find that preferences do depend on the specific driving scenario, opening the door for new ways of learning driving style preference. Keywords autonomous cars; driving preferences; driving style 1. INTRODUCTION In the age of autonomous driving, researchers and com- panies are getting ever-so-close to enabling cars to gener- ate driving behavior that includes reaching the destination while satisfying safety constraints, like not colliding with other cars or pedestrians. Once autonomous cars attain that level of capability, ini- tially, they might be able to generate, for each driving sit- uation, only one solution trajectory (or behavior) that satis- fies these safety and feasibility constraints. But really, many solutions exist – there are many ways to drive. This de- pend on the individual trade-offs that each driver makes. We have an existence proof for that. Some of us are more aggressive drivers, valuing efficiency and being comfortable getting close to other cars on the road. Others are more de- fensive, a bit more conservative when it comes to safety, leav- ing a large distance to the next car for example, or quickly braking when someone attempts to merge in front. Permission to make digital or hard copies of all or part of this work for personal or classroom use is granted without fee provided that copies are not made or distributed for profit or commercial advantage and that copies bear this notice and the full cita- tion on the first page. Copyrights for components of this work owned by others than ACM must be honored. Abstracting with credit is permitted. To copy otherwise, or re- publish, to post on servers or to redistribute to lists, requires prior specific permission and/or a fee. Request permissions from [email protected]. HRI ’17, March 06-09, 2017, Vienna, Austria c 2017 ACM. ISBN 978-1-4503-4336-7/17/03. . . $15.00 DOI: http://dx.doi.org/10.1145/2909824.3020250 aggressive defensive user’s style þ ☐ ☐ Figure 1: We first get data from user driving in different scenarios, and in a second session ask them to compare their own style (with- out knowing it is theirs), a more defensive style, and a more aggres- sive style. Participants tended to prefer a more defensive style than their own, but mistakenly thought they were actually picking their own. Soon after we are able to generate one feasible behavior, we will be asking ourselves which behavior we should try to generate: what driving style should an autonomous car have? There is a natural answer to this question: cars should do what users want them to [9, 6, 22]. If the user drives aggressively, so should the car. The car should borrow the user’s driving style (though not the imperfections). This is very apparent from the expression “back seat driving”, which suggests that people want the driver to do what they would do. Prior work has focused on identifying the user’s driv- ing style, via Inverse Reinforcement Learning [9, 14, 10]. Throughout it all, the underlying assumption is that we want cars to match our driving style: that we want them to drive like us. In this paper, we challenge this assumption, and hypoth- esize that users want a driving style that is different from their own. We design and conduct a user study to start an- alyzing the potential differences between how users drive and how they want to be driven. Our study, conducted in a
Transcript of Do You Want Your Autonomous Car to Drive Like You?anca/papers/HRI2017_styleprefere… · Do You...
Do You Want Your Autonomous Car to Drive Like You?
Chandrayee BasuUC Merced
Qian YangCarnegie Mellon Univ.
David HungermanUC Merced
Mukesh SinghalUC Merced
Anca D. DraganUC Berkeley
ABSTRACTWith progress in enabling autonomous cars to drive safelyon the road, it is time to start asking how they should bedriving. A common answer is that they should be adoptingtheir users’ driving style. This makes the assumption thatusers want their autonomous cars to drive like they drive– aggressive drivers want aggressive cars, defensive driverswant defensive cars. In this paper, we put that assumptionto the test. We find that users tend to prefer a significantlymore defensive driving style than their own. Interestingly,they prefer the style they think is their own, even thoughtheir actual driving style tends to be more aggressive. Wealso find that preferences do depend on the specific drivingscenario, opening the door for new ways of learning drivingstyle preference.
Keywordsautonomous cars; driving preferences; driving style
1. INTRODUCTIONIn the age of autonomous driving, researchers and com-
panies are getting ever-so-close to enabling cars to gener-ate driving behavior that includes reaching the destinationwhile satisfying safety constraints, like not colliding withother cars or pedestrians.
Once autonomous cars attain that level of capability, ini-tially, they might be able to generate, for each driving sit-uation, only one solution trajectory (or behavior) that satis-fies these safety and feasibility constraints. But really, manysolutions exist – there are many ways to drive. This de-pend on the individual trade-offs that each driver makes.We have an existence proof for that. Some of us are moreaggressive drivers, valuing efficiency and being comfortablegetting close to other cars on the road. Others are more de-fensive, a bit more conservative when it comes to safety, leav-ing a large distance to the next car for example, or quicklybraking when someone attempts to merge in front.
Permission to make digital or hard copies of all or part of this work for personal orclassroom use is granted without fee provided that copies are not made or distributedfor profit or commercial advantage and that copies bear this notice and the full cita-tion on the first page. Copyrights for components of this work owned by others thanACM must be honored. Abstracting with credit is permitted. To copy otherwise, or re-publish, to post on servers or to redistribute to lists, requires prior specific permissionand/or a fee. Request permissions from [email protected].
HRI ’17, March 06-09, 2017, Vienna, Austriac© 2017 ACM. ISBN 978-1-4503-4336-7/17/03. . . $15.00
DOI: http://dx.doi.org/10.1145/2909824.3020250
a. Simulator set-up showing projection screen and driver at the wheel
b. Snapshot of autonomous driving task 1 showing the same segment of the track as above.
aggressive defensiveuser’s style
þ☐☐
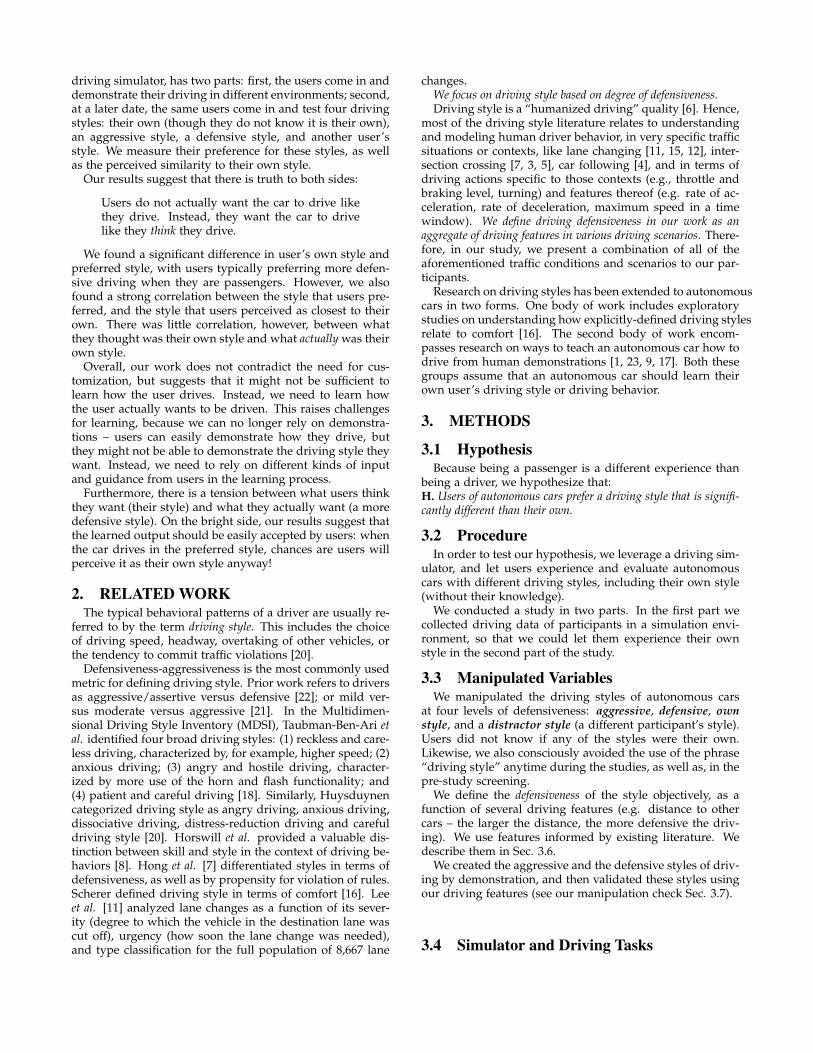
Figure 1: We first get data from user driving in different scenarios,and in a second session ask them to compare their own style (with-out knowing it is theirs), a more defensive style, and a more aggres-sive style. Participants tended to prefer a more defensive style thantheir own, but mistakenly thought they were actually picking theirown.
Soon after we are able to generate one feasible behavior,we will be asking ourselves which behavior we should tryto generate: what driving style should an autonomous carhave? There is a natural answer to this question: cars shoulddo what users want them to [9, 6, 22]. If the user drivesaggressively, so should the car. The car should borrow theuser’s driving style (though not the imperfections). Thisis very apparent from the expression “back seat driving”,which suggests that people want the driver to do what theywould do.
Prior work has focused on identifying the user’s driv-ing style, via Inverse Reinforcement Learning [9, 14, 10].Throughout it all, the underlying assumption is that wewant cars to match our driving style: that we want themto drive like us.
In this paper, we challenge this assumption, and hypoth-esize that users want a driving style that is different fromtheir own. We design and conduct a user study to start an-alyzing the potential differences between how users driveand how they want to be driven. Our study, conducted in a
driving simulator, has two parts: first, the users come in anddemonstrate their driving in different environments; second,at a later date, the same users come in and test four drivingstyles: their own (though they do not know it is their own),an aggressive style, a defensive style, and another user’sstyle. We measure their preference for these styles, as wellas the perceived similarity to their own style.
Our results suggest that there is truth to both sides:
Users do not actually want the car to drive likethey drive. Instead, they want the car to drivelike they think they drive.
We found a significant difference in user’s own style andpreferred style, with users typically preferring more defen-sive driving when they are passengers. However, we alsofound a strong correlation between the style that users pre-ferred, and the style that users perceived as closest to theirown. There was little correlation, however, between whatthey thought was their own style and what actually was theirown style.
Overall, our work does not contradict the need for cus-tomization, but suggests that it might not be sufficient tolearn how the user drives. Instead, we need to learn howthe user actually wants to be driven. This raises challengesfor learning, because we can no longer rely on demonstra-tions – users can easily demonstrate how they drive, butthey might not be able to demonstrate the driving style theywant. Instead, we need to rely on different kinds of inputand guidance from users in the learning process.
Furthermore, there is a tension between what users thinkthey want (their style) and what they actually want (a moredefensive style). On the bright side, our results suggest thatthe learned output should be easily accepted by users: whenthe car drives in the preferred style, chances are users willperceive it as their own style anyway!
2. RELATED WORKThe typical behavioral patterns of a driver are usually re-
ferred to by the term driving style. This includes the choiceof driving speed, headway, overtaking of other vehicles, orthe tendency to commit traffic violations [20].
Defensiveness-aggressiveness is the most commonly usedmetric for defining driving style. Prior work refers to driversas aggressive/assertive versus defensive [22]; or mild ver-sus moderate versus aggressive [21]. In the Multidimen-sional Driving Style Inventory (MDSI), Taubman-Ben-Ari etal. identified four broad driving styles: (1) reckless and care-less driving, characterized by, for example, higher speed; (2)anxious driving; (3) angry and hostile driving, character-ized by more use of the horn and flash functionality; and(4) patient and careful driving [18]. Similarly, Huysduynencategorized driving style as angry driving, anxious driving,dissociative driving, distress-reduction driving and carefuldriving style [20]. Horswill et al. provided a valuable dis-tinction between skill and style in the context of driving be-haviors [8]. Hong et al. [7] differentiated styles in terms ofdefensiveness, as well as by propensity for violation of rules.Scherer defined driving style in terms of comfort [16]. Leeet al. [11] analyzed lane changes as a function of its sever-ity (degree to which the vehicle in the destination lane wascut off), urgency (how soon the lane change was needed),and type classification for the full population of 8,667 lane
changes.We focus on driving style based on degree of defensiveness.Driving style is a “humanized driving” quality [6]. Hence,
most of the driving style literature relates to understandingand modeling human driver behavior, in very specific trafficsituations or contexts, like lane changing [11, 15, 12], inter-section crossing [7, 3, 5], car following [4], and in terms ofdriving actions specific to those contexts (e.g., throttle andbraking level, turning) and features thereof (e.g. rate of ac-celeration, rate of deceleration, maximum speed in a timewindow). We define driving defensiveness in our work as anaggregate of driving features in various driving scenarios. There-fore, in our study, we present a combination of all of theaforementioned traffic conditions and scenarios to our par-ticipants.
Research on driving styles has been extended to autonomouscars in two forms. One body of work includes exploratorystudies on understanding how explicitly-defined driving stylesrelate to comfort [16]. The second body of work encom-passes research on ways to teach an autonomous car how todrive from human demonstrations [1, 23, 9, 17]. Both thesegroups assume that an autonomous car should learn theirown user’s driving style or driving behavior.
3. METHODS
3.1 HypothesisBecause being a passenger is a different experience than
being a driver, we hypothesize that:H. Users of autonomous cars prefer a driving style that is signifi-cantly different than their own.
3.2 ProcedureIn order to test our hypothesis, we leverage a driving sim-
ulator, and let users experience and evaluate autonomouscars with different driving styles, including their own style(without their knowledge).
We conducted a study in two parts. In the first part wecollected driving data of participants in a simulation envi-ronment, so that we could let them experience their ownstyle in the second part of the study.
3.3 Manipulated VariablesWe manipulated the driving styles of autonomous cars
at four levels of defensiveness: aggressive, defensive, ownstyle, and a distractor style (a different participant’s style).Users did not know if any of the styles were their own.Likewise, we also consciously avoided the use of the phrase“driving style” anytime during the studies, as well as, in thepre-study screening.
We define the defensiveness of the style objectively, as afunction of several driving features (e.g. distance to othercars – the larger the distance, the more defensive the driv-ing). We use features informed by existing literature. Wedescribe them in Sec. 3.6.
We created the aggressive and the defensive styles of driv-ing by demonstration, and then validated these styles usingour driving features (see our manipulation check Sec. 3.7).
3.4 Simulator and Driving Tasks
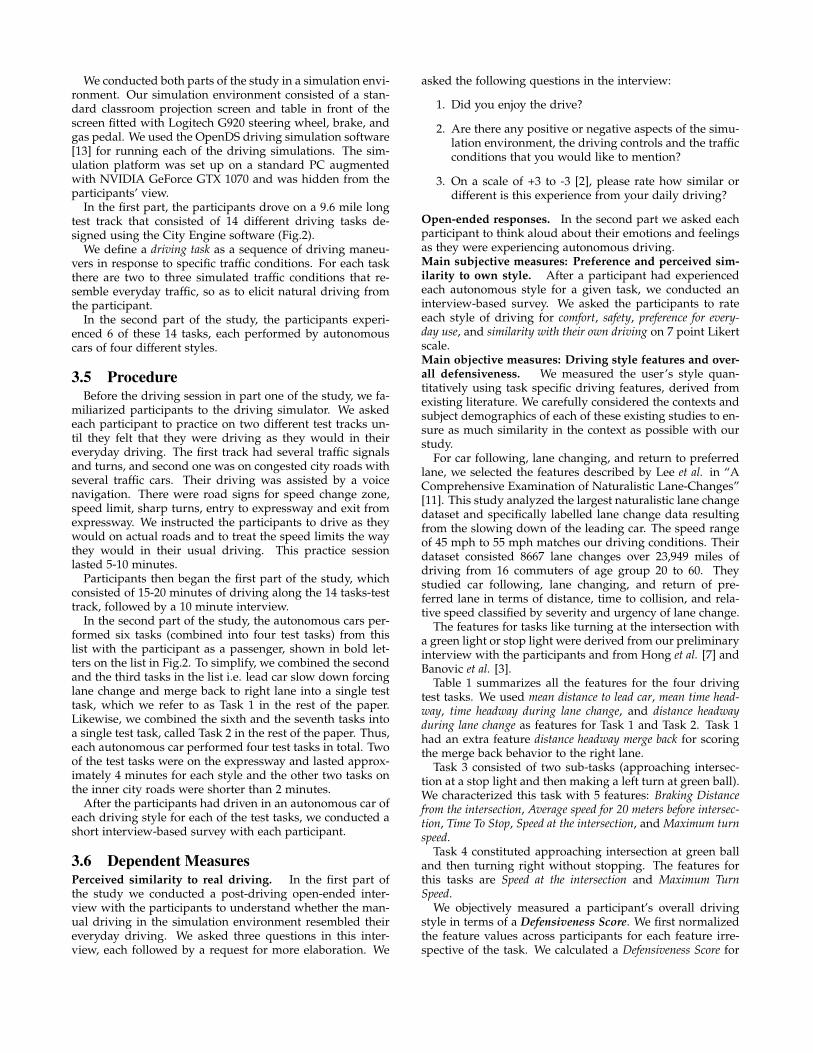
We conducted both parts of the study in a simulation envi-ronment. Our simulation environment consisted of a stan-dard classroom projection screen and table in front of thescreen fitted with Logitech G920 steering wheel, brake, andgas pedal. We used the OpenDS driving simulation software[13] for running each of the driving simulations. The sim-ulation platform was set up on a standard PC augmentedwith NVIDIA GeForce GTX 1070 and was hidden from theparticipants’ view.
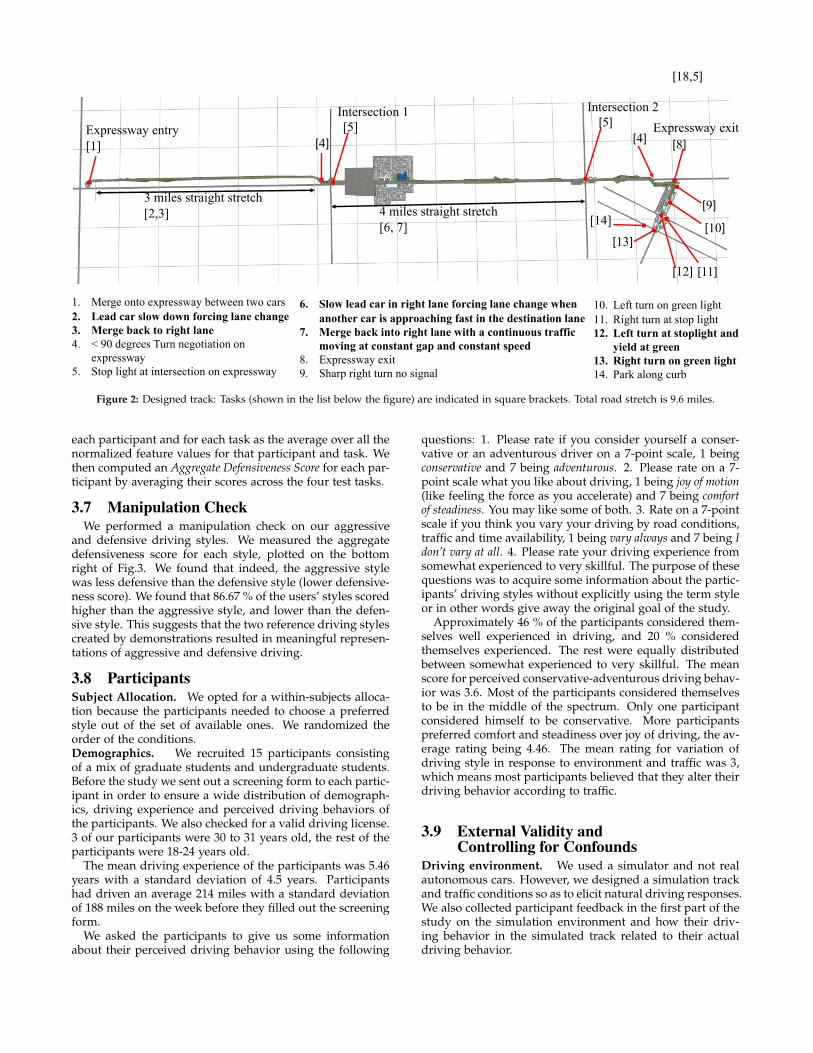
In the first part, the participants drove on a 9.6 mile longtest track that consisted of 14 different driving tasks de-signed using the City Engine software (Fig.2).
We define a driving task as a sequence of driving maneu-vers in response to specific traffic conditions. For each taskthere are two to three simulated traffic conditions that re-semble everyday traffic, so as to elicit natural driving fromthe participant.
In the second part of the study, the participants experi-enced 6 of these 14 tasks, each performed by autonomouscars of four different styles.
3.5 ProcedureBefore the driving session in part one of the study, we fa-
miliarized participants to the driving simulator. We askedeach participant to practice on two different test tracks un-til they felt that they were driving as they would in theireveryday driving. The first track had several traffic signalsand turns, and second one was on congested city roads withseveral traffic cars. Their driving was assisted by a voicenavigation. There were road signs for speed change zone,speed limit, sharp turns, entry to expressway and exit fromexpressway. We instructed the participants to drive as theywould on actual roads and to treat the speed limits the waythey would in their usual driving. This practice sessionlasted 5-10 minutes.
Participants then began the first part of the study, whichconsisted of 15-20 minutes of driving along the 14 tasks-testtrack, followed by a 10 minute interview.
In the second part of the study, the autonomous cars per-formed six tasks (combined into four test tasks) from thislist with the participant as a passenger, shown in bold let-ters on the list in Fig.2. To simplify, we combined the secondand the third tasks in the list i.e. lead car slow down forcinglane change and merge back to right lane into a single testtask, which we refer to as Task 1 in the rest of the paper.Likewise, we combined the sixth and the seventh tasks intoa single test task, called Task 2 in the rest of the paper. Thus,each autonomous car performed four test tasks in total. Twoof the test tasks were on the expressway and lasted approx-imately 4 minutes for each style and the other two tasks onthe inner city roads were shorter than 2 minutes.
After the participants had driven in an autonomous car ofeach driving style for each of the test tasks, we conducted ashort interview-based survey with each participant.
3.6 Dependent MeasuresPerceived similarity to real driving. In the first part ofthe study we conducted a post-driving open-ended inter-view with the participants to understand whether the man-ual driving in the simulation environment resembled theireveryday driving. We asked three questions in this inter-view, each followed by a request for more elaboration. We
asked the following questions in the interview:
1. Did you enjoy the drive?
2. Are there any positive or negative aspects of the simu-lation environment, the driving controls and the trafficconditions that you would like to mention?
3. On a scale of +3 to -3 [2], please rate how similar ordifferent is this experience from your daily driving?
Open-ended responses. In the second part we asked eachparticipant to think aloud about their emotions and feelingsas they were experiencing autonomous driving.Main subjective measures: Preference and perceived sim-ilarity to own style. After a participant had experiencedeach autonomous style for a given task, we conducted aninterview-based survey. We asked the participants to rateeach style of driving for comfort, safety, preference for every-day use, and similarity with their own driving on 7 point Likertscale.Main objective measures: Driving style features and over-all defensiveness. We measured the user’s style quan-titatively using task specific driving features, derived fromexisting literature. We carefully considered the contexts andsubject demographics of each of these existing studies to en-sure as much similarity in the context as possible with ourstudy.
For car following, lane changing, and return to preferredlane, we selected the features described by Lee et al. in “AComprehensive Examination of Naturalistic Lane-Changes”[11]. This study analyzed the largest naturalistic lane changedataset and specifically labelled lane change data resultingfrom the slowing down of the leading car. The speed rangeof 45 mph to 55 mph matches our driving conditions. Theirdataset consisted 8667 lane changes over 23,949 miles ofdriving from 16 commuters of age group 20 to 60. Theystudied car following, lane changing, and return of pre-ferred lane in terms of distance, time to collision, and rela-tive speed classified by severity and urgency of lane change.
The features for tasks like turning at the intersection witha green light or stop light were derived from our preliminaryinterview with the participants and from Hong et al. [7] andBanovic et al. [3].
Table 1 summarizes all the features for the four drivingtest tasks. We used mean distance to lead car, mean time head-way, time headway during lane change, and distance headwayduring lane change as features for Task 1 and Task 2. Task 1had an extra feature distance headway merge back for scoringthe merge back behavior to the right lane.
Task 3 consisted of two sub-tasks (approaching intersec-tion at a stop light and then making a left turn at green ball).We characterized this task with 5 features: Braking Distancefrom the intersection, Average speed for 20 meters before intersec-tion, Time To Stop, Speed at the intersection, and Maximum turnspeed.
Task 4 constituted approaching intersection at green balland then turning right without stopping. The features forthis tasks are Speed at the intersection and Maximum TurnSpeed.
We objectively measured a participant’s overall drivingstyle in terms of a Defensiveness Score. We first normalizedthe feature values across participants for each feature irre-spective of the task. We calculated a Defensiveness Score for
Expressway entry[1]
3 miles straight stretch[2,3]
[4][5]
Intersection 1
4 miles straight stretch[6, 7]
[5][4]
Intersection 2
[8]Expressway exit
[18,5]
[9]
[12]
[13][14]
[11]
[10]
1. Merge onto expressway between two cars2. Lead car slow down forcing lane change3. Merge back to right lane4. < 90 degrees Turn negotiation on
expressway5. Stop light at intersection on expressway
6. Slow lead car in right lane forcing lane change when another car is approaching fast in the destination lane
7. Merge back into right lane with a continuous traffic moving at constant gap and constant speed
8. Expressway exit9. Sharp right turn no signal
10. Left turn on green light11. Right turn at stop light12. Left turn at stoplight and
yield at green13. Right turn on green light14. Park along curb
Figure 2: Designed track: Tasks (shown in the list below the figure) are indicated in square brackets. Total road stretch is 9.6 miles.
each participant and for each task as the average over all thenormalized feature values for that participant and task. Wethen computed an Aggregate Defensiveness Score for each par-ticipant by averaging their scores across the four test tasks.
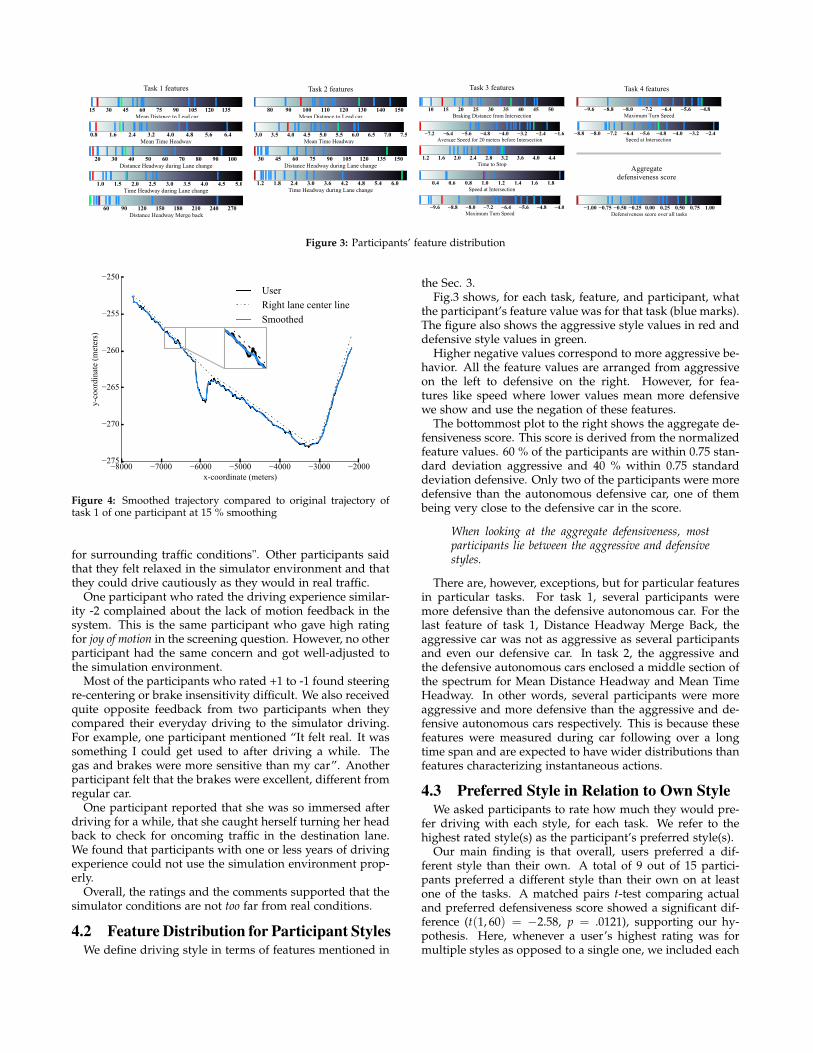
3.7 Manipulation CheckWe performed a manipulation check on our aggressive
and defensive driving styles. We measured the aggregatedefensiveness score for each style, plotted on the bottomright of Fig.3. We found that indeed, the aggressive stylewas less defensive than the defensive style (lower defensive-ness score). We found that 86.67 % of the users’ styles scoredhigher than the aggressive style, and lower than the defen-sive style. This suggests that the two reference driving stylescreated by demonstrations resulted in meaningful represen-tations of aggressive and defensive driving.
3.8 ParticipantsSubject Allocation. We opted for a within-subjects alloca-tion because the participants needed to choose a preferredstyle out of the set of available ones. We randomized theorder of the conditions.Demographics. We recruited 15 participants consistingof a mix of graduate students and undergraduate students.Before the study we sent out a screening form to each partic-ipant in order to ensure a wide distribution of demograph-ics, driving experience and perceived driving behaviors ofthe participants. We also checked for a valid driving license.3 of our participants were 30 to 31 years old, the rest of theparticipants were 18-24 years old.
The mean driving experience of the participants was 5.46years with a standard deviation of 4.5 years. Participantshad driven an average 214 miles with a standard deviationof 188 miles on the week before they filled out the screeningform.
We asked the participants to give us some informationabout their perceived driving behavior using the following
questions: 1. Please rate if you consider yourself a conser-vative or an adventurous driver on a 7-point scale, 1 beingconservative and 7 being adventurous. 2. Please rate on a 7-point scale what you like about driving, 1 being joy of motion(like feeling the force as you accelerate) and 7 being comfortof steadiness. You may like some of both. 3. Rate on a 7-pointscale if you think you vary your driving by road conditions,traffic and time availability, 1 being vary always and 7 being Idon’t vary at all. 4. Please rate your driving experience fromsomewhat experienced to very skillful. The purpose of thesequestions was to acquire some information about the partic-ipants’ driving styles without explicitly using the term styleor in other words give away the original goal of the study.
Approximately 46 % of the participants considered them-selves well experienced in driving, and 20 % consideredthemselves experienced. The rest were equally distributedbetween somewhat experienced to very skillful. The meanscore for perceived conservative-adventurous driving behav-ior was 3.6. Most of the participants considered themselvesto be in the middle of the spectrum. Only one participantconsidered himself to be conservative. More participantspreferred comfort and steadiness over joy of driving, the av-erage rating being 4.46. The mean rating for variation ofdriving style in response to environment and traffic was 3,which means most participants believed that they alter theirdriving behavior according to traffic.
3.9 External Validity andControlling for Confounds
Driving environment. We used a simulator and not realautonomous cars. However, we designed a simulation trackand traffic conditions so as to elicit natural driving responses.We also collected participant feedback in the first part of thestudy on the simulation environment and how their driv-ing behavior in the simulated track related to their actualdriving behavior.
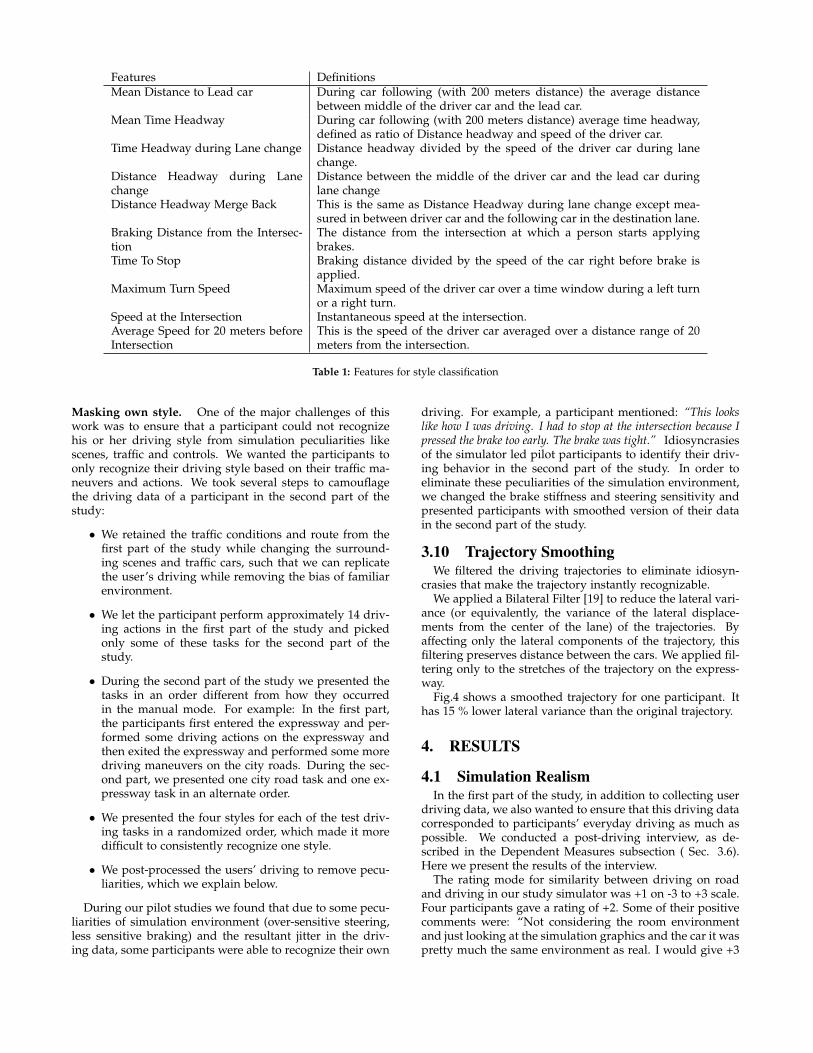
Features DefinitionsMean Distance to Lead car During car following (with 200 meters distance) the average distance
between middle of the driver car and the lead car.Mean Time Headway During car following (with 200 meters distance) average time headway,
defined as ratio of Distance headway and speed of the driver car.Time Headway during Lane change Distance headway divided by the speed of the driver car during lane
change.Distance Headway during Lanechange
Distance between the middle of the driver car and the lead car duringlane change
Distance Headway Merge Back This is the same as Distance Headway during lane change except mea-sured in between driver car and the following car in the destination lane.
Braking Distance from the Intersec-tion
The distance from the intersection at which a person starts applyingbrakes.
Time To Stop Braking distance divided by the speed of the car right before brake isapplied.
Maximum Turn Speed Maximum speed of the driver car over a time window during a left turnor a right turn.
Speed at the Intersection Instantaneous speed at the intersection.Average Speed for 20 meters beforeIntersection
This is the speed of the driver car averaged over a distance range of 20meters from the intersection.
Table 1: Features for style classification
Masking own style. One of the major challenges of thiswork was to ensure that a participant could not recognizehis or her driving style from simulation peculiarities likescenes, traffic and controls. We wanted the participants toonly recognize their driving style based on their traffic ma-neuvers and actions. We took several steps to camouflagethe driving data of a participant in the second part of thestudy:
• We retained the traffic conditions and route from thefirst part of the study while changing the surround-ing scenes and traffic cars, such that we can replicatethe user’s driving while removing the bias of familiarenvironment.
• We let the participant perform approximately 14 driv-ing actions in the first part of the study and pickedonly some of these tasks for the second part of thestudy.
• During the second part of the study we presented thetasks in an order different from how they occurredin the manual mode. For example: In the first part,the participants first entered the expressway and per-formed some driving actions on the expressway andthen exited the expressway and performed some moredriving maneuvers on the city roads. During the sec-ond part, we presented one city road task and one ex-pressway task in an alternate order.
• We presented the four styles for each of the test driv-ing tasks in a randomized order, which made it moredifficult to consistently recognize one style.
• We post-processed the users’ driving to remove pecu-liarities, which we explain below.
During our pilot studies we found that due to some pecu-liarities of simulation environment (over-sensitive steering,less sensitive braking) and the resultant jitter in the driv-ing data, some participants were able to recognize their own
driving. For example, a participant mentioned: “This lookslike how I was driving. I had to stop at the intersection because Ipressed the brake too early. The brake was tight.” Idiosyncrasiesof the simulator led pilot participants to identify their driv-ing behavior in the second part of the study. In order toeliminate these peculiarities of the simulation environment,we changed the brake stiffness and steering sensitivity andpresented participants with smoothed version of their datain the second part of the study.
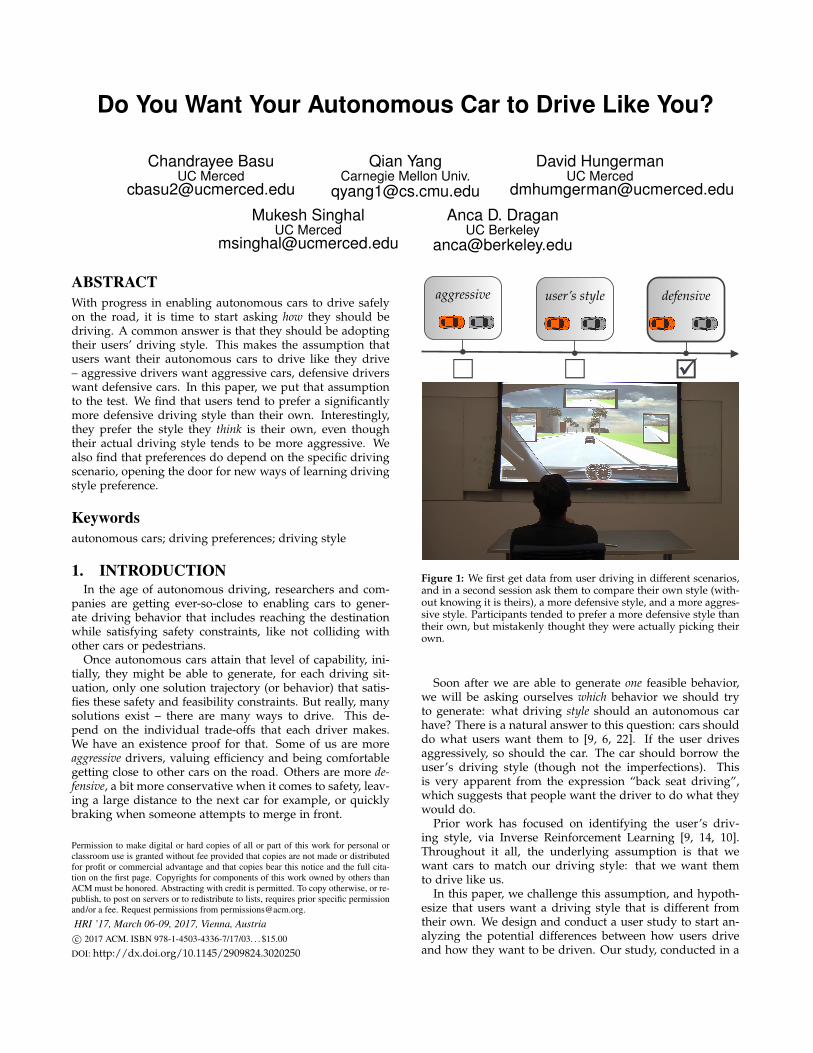
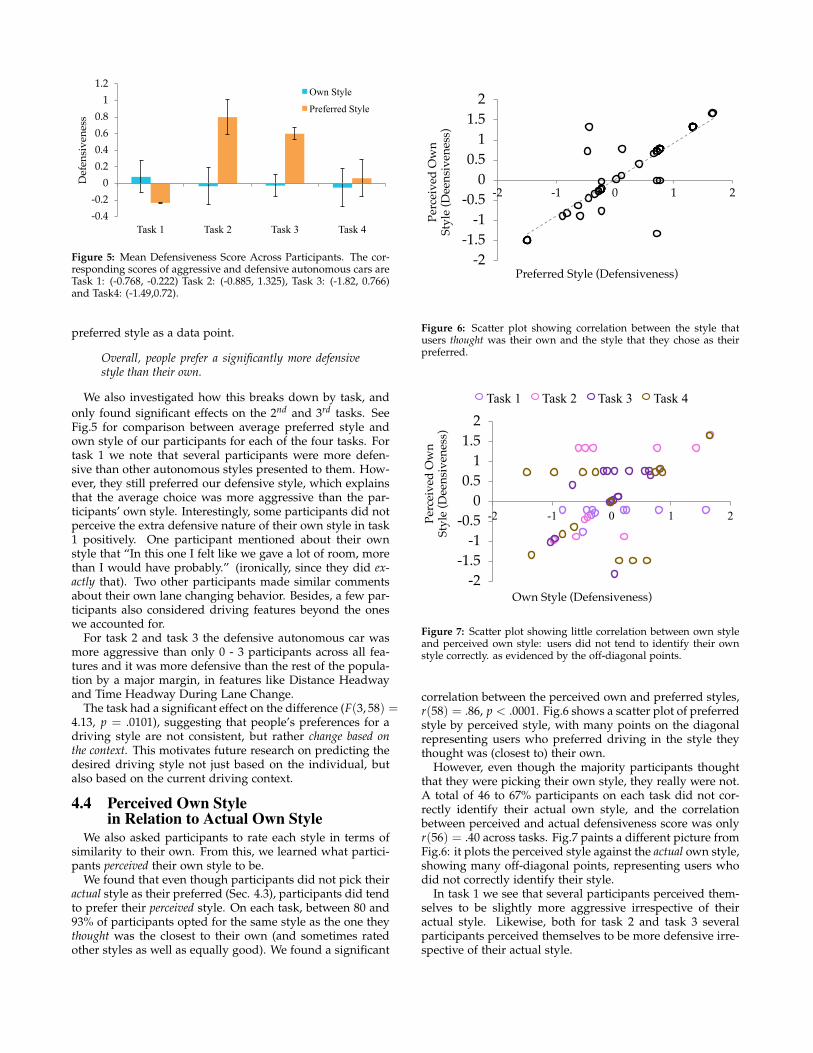
3.10 Trajectory SmoothingWe filtered the driving trajectories to eliminate idiosyn-
crasies that make the trajectory instantly recognizable.We applied a Bilateral Filter [19] to reduce the lateral vari-
ance (or equivalently, the variance of the lateral displace-ments from the center of the lane) of the trajectories. Byaffecting only the lateral components of the trajectory, thisfiltering preserves distance between the cars. We applied fil-tering only to the stretches of the trajectory on the express-way.
Fig.4 shows a smoothed trajectory for one participant. Ithas 15 % lower lateral variance than the original trajectory.
4. RESULTS
4.1 Simulation RealismIn the first part of the study, in addition to collecting user
driving data, we also wanted to ensure that this driving datacorresponded to participants’ everyday driving as much aspossible. We conducted a post-driving interview, as de-scribed in the Dependent Measures subsection ( Sec. 3.6).Here we present the results of the interview.
The rating mode for similarity between driving on roadand driving in our study simulator was +1 on -3 to +3 scale.Four participants gave a rating of +2. Some of their positivecomments were: “Not considering the room environmentand just looking at the simulation graphics and the car it waspretty much the same environment as real. I would give +3
Task 1 features
Task 2 features Task 3 features Task 4 features
Task 2 features Task 3 features Task 4 features
Aggregate defensiveness score
Figure 3: Participants’ feature distribution
Figure 4: Smoothed trajectory compared to original trajectory oftask 1 of one participant at 15 % smoothing
for surrounding traffic conditions". Other participants saidthat they felt relaxed in the simulator environment and thatthey could drive cautiously as they would in real traffic.
One participant who rated the driving experience similar-ity -2 complained about the lack of motion feedback in thesystem. This is the same participant who gave high ratingfor joy of motion in the screening question. However, no otherparticipant had the same concern and got well-adjusted tothe simulation environment.
Most of the participants who rated +1 to -1 found steeringre-centering or brake insensitivity difficult. We also receivedquite opposite feedback from two participants when theycompared their everyday driving to the simulator driving.For example, one participant mentioned “It felt real. It wassomething I could get used to after driving a while. Thegas and brakes were more sensitive than my car”. Anotherparticipant felt that the brakes were excellent, different fromregular car.
One participant reported that she was so immersed afterdriving for a while, that she caught herself turning her headback to check for oncoming traffic in the destination lane.We found that participants with one or less years of drivingexperience could not use the simulation environment prop-erly.
Overall, the ratings and the comments supported that thesimulator conditions are not too far from real conditions.
4.2 Feature Distribution for Participant StylesWe define driving style in terms of features mentioned in
the Sec. 3.Fig.3 shows, for each task, feature, and participant, what
the participant’s feature value was for that task (blue marks).The figure also shows the aggressive style values in red anddefensive style values in green.
Higher negative values correspond to more aggressive be-havior. All the feature values are arranged from aggressiveon the left to defensive on the right. However, for fea-tures like speed where lower values mean more defensivewe show and use the negation of these features.
The bottommost plot to the right shows the aggregate de-fensiveness score. This score is derived from the normalizedfeature values. 60 % of the participants are within 0.75 stan-dard deviation aggressive and 40 % within 0.75 standarddeviation defensive. Only two of the participants were moredefensive than the autonomous defensive car, one of thembeing very close to the defensive car in the score.
When looking at the aggregate defensiveness, mostparticipants lie between the aggressive and defensivestyles.
There are, however, exceptions, but for particular featuresin particular tasks. For task 1, several participants weremore defensive than the defensive autonomous car. For thelast feature of task 1, Distance Headway Merge Back, theaggressive car was not as aggressive as several participantsand even our defensive car. In task 2, the aggressive andthe defensive autonomous cars enclosed a middle section ofthe spectrum for Mean Distance Headway and Mean TimeHeadway. In other words, several participants were moreaggressive and more defensive than the aggressive and de-fensive autonomous cars respectively. This is because thesefeatures were measured during car following over a longtime span and are expected to have wider distributions thanfeatures characterizing instantaneous actions.
4.3 Preferred Style in Relation to Own StyleWe asked participants to rate how much they would pre-
fer driving with each style, for each task. We refer to thehighest rated style(s) as the participant’s preferred style(s).
Our main finding is that overall, users preferred a dif-ferent style than their own. A total of 9 out of 15 partici-pants preferred a different style than their own on at leastone of the tasks. A matched pairs t-test comparing actualand preferred defensiveness score showed a significant dif-ference (t(1, 60) = −2.58, p = .0121), supporting our hy-pothesis. Here, whenever a user’s highest rating was formultiple styles as opposed to a single one, we included each
-0.4-0.2
00.20.40.60.8
11.2
Task 1 Task 2 Task 3 Task 4
Def
ensi
vene
ssOwn Style
Preferred Style
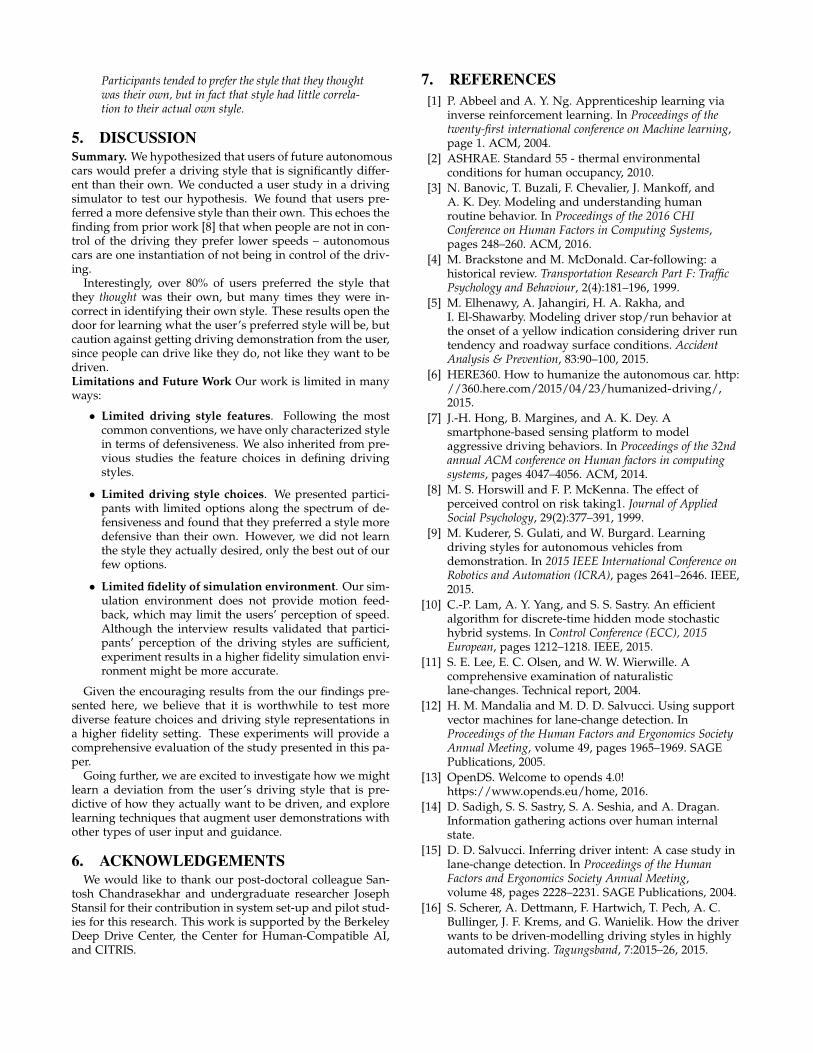
Figure 5: Mean Defensiveness Score Across Participants. The cor-responding scores of aggressive and defensive autonomous cars areTask 1: (-0.768, -0.222) Task 2: (-0.885, 1.325), Task 3: (-1.82, 0.766)and Task4: (-1.49,0.72).
preferred style as a data point.
Overall, people prefer a significantly more defensivestyle than their own.
We also investigated how this breaks down by task, andonly found significant effects on the 2nd and 3rd tasks. SeeFig.5 for comparison between average preferred style andown style of our participants for each of the four tasks. Fortask 1 we note that several participants were more defen-sive than other autonomous styles presented to them. How-ever, they still preferred our defensive style, which explainsthat the average choice was more aggressive than the par-ticipants’ own style. Interestingly, some participants did notperceive the extra defensive nature of their own style in task1 positively. One participant mentioned about their ownstyle that “In this one I felt like we gave a lot of room, morethan I would have probably.” (ironically, since they did ex-actly that). Two other participants made similar commentsabout their own lane changing behavior. Besides, a few par-ticipants also considered driving features beyond the oneswe accounted for.
For task 2 and task 3 the defensive autonomous car wasmore aggressive than only 0 - 3 participants across all fea-tures and it was more defensive than the rest of the popula-tion by a major margin, in features like Distance Headwayand Time Headway During Lane Change.
The task had a significant effect on the difference (F(3, 58) =4.13, p = .0101), suggesting that people’s preferences for adriving style are not consistent, but rather change based onthe context. This motivates future research on predicting thedesired driving style not just based on the individual, butalso based on the current driving context.
4.4 Perceived Own Stylein Relation to Actual Own Style
We also asked participants to rate each style in terms ofsimilarity to their own. From this, we learned what partici-pants perceived their own style to be.
We found that even though participants did not pick theiractual style as their preferred (Sec. 4.3), participants did tendto prefer their perceived style. On each task, between 80 and93% of participants opted for the same style as the one theythought was the closest to their own (and sometimes ratedother styles as well as equally good). We found a significant
-2-1.5
-1-0.5
00.5
11.5
2
-2 -1 0 1 2
Perc
eive
d O
wn
Styl
e (D
eens
iven
ess)
Preferred Style (Defensiveness)
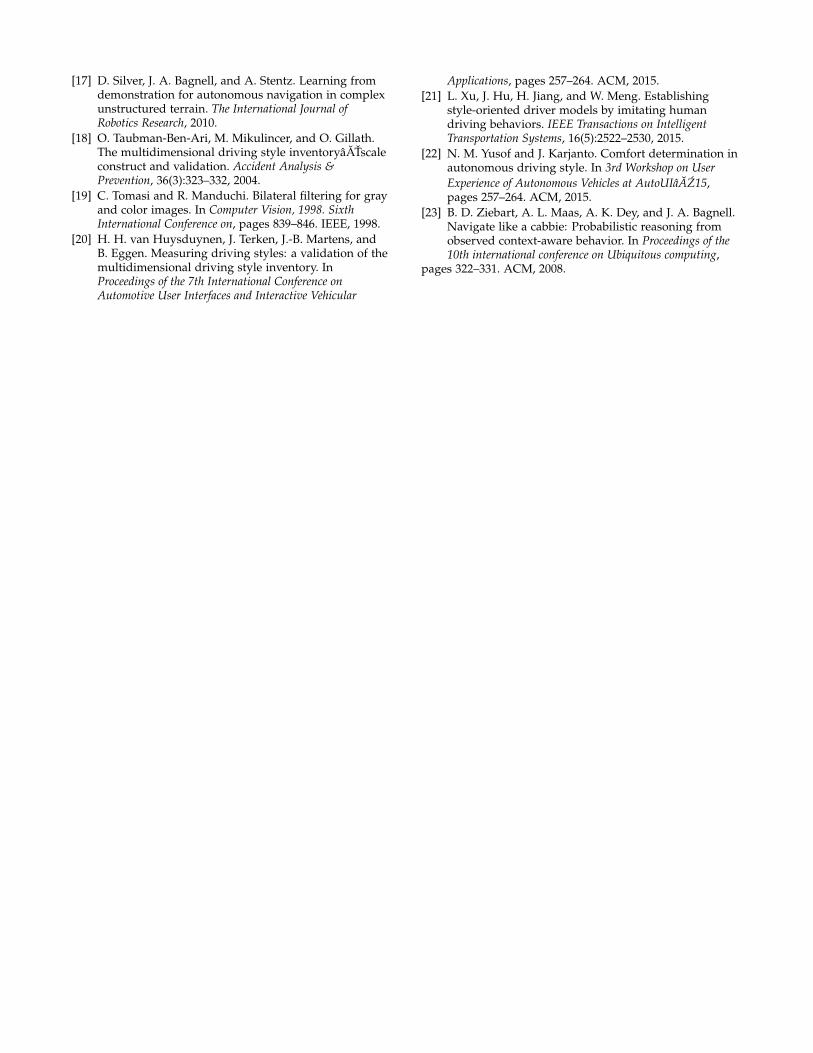
Figure 6: Scatter plot showing correlation between the style thatusers thought was their own and the style that they chose as theirpreferred.
-2-1.5
-1-0.5
00.5
11.5
2
-2 -1 0 1 2Perc
eive
d O
wn
Styl
e (D
eens
iven
ess)
Own Style (Defensiveness)
Task 1 Task 2 Task 3 Task 4
Figure 7: Scatter plot showing little correlation between own styleand perceived own style: users did not tend to identify their ownstyle correctly. as evidenced by the off-diagonal points.
correlation between the perceived own and preferred styles,r(58) = .86, p < .0001. Fig.6 shows a scatter plot of preferredstyle by perceived style, with many points on the diagonalrepresenting users who preferred driving in the style theythought was (closest to) their own.
However, even though the majority participants thoughtthat they were picking their own style, they really were not.A total of 46 to 67% participants on each task did not cor-rectly identify their actual own style, and the correlationbetween perceived and actual defensiveness score was onlyr(56) = .40 across tasks. Fig.7 paints a different picture fromFig.6: it plots the perceived style against the actual own style,showing many off-diagonal points, representing users whodid not correctly identify their style.
In task 1 we see that several participants perceived them-selves to be slightly more aggressive irrespective of theiractual style. Likewise, both for task 2 and task 3 severalparticipants perceived themselves to be more defensive irre-spective of their actual style.
Participants tended to prefer the style that they thoughtwas their own, but in fact that style had little correla-tion to their actual own style.
5. DISCUSSIONSummary. We hypothesized that users of future autonomouscars would prefer a driving style that is significantly differ-ent than their own. We conducted a user study in a drivingsimulator to test our hypothesis. We found that users pre-ferred a more defensive style than their own. This echoes thefinding from prior work [8] that when people are not in con-trol of the driving they prefer lower speeds – autonomouscars are one instantiation of not being in control of the driv-ing.
Interestingly, over 80% of users preferred the style thatthey thought was their own, but many times they were in-correct in identifying their own style. These results open thedoor for learning what the user’s preferred style will be, butcaution against getting driving demonstration from the user,since people can drive like they do, not like they want to bedriven.Limitations and Future Work Our work is limited in manyways:
• Limited driving style features. Following the mostcommon conventions, we have only characterized stylein terms of defensiveness. We also inherited from pre-vious studies the feature choices in defining drivingstyles.
• Limited driving style choices. We presented partici-pants with limited options along the spectrum of de-fensiveness and found that they preferred a style moredefensive than their own. However, we did not learnthe style they actually desired, only the best out of ourfew options.
• Limited fidelity of simulation environment. Our sim-ulation environment does not provide motion feed-back, which may limit the users’ perception of speed.Although the interview results validated that partici-pants’ perception of the driving styles are sufficient,experiment results in a higher fidelity simulation envi-ronment might be more accurate.
Given the encouraging results from the our findings pre-sented here, we believe that it is worthwhile to test morediverse feature choices and driving style representations ina higher fidelity setting. These experiments will provide acomprehensive evaluation of the study presented in this pa-per.
Going further, we are excited to investigate how we mightlearn a deviation from the user’s driving style that is pre-dictive of how they actually want to be driven, and explorelearning techniques that augment user demonstrations withother types of user input and guidance.
6. ACKNOWLEDGEMENTSWe would like to thank our post-doctoral colleague San-
tosh Chandrasekhar and undergraduate researcher JosephStansil for their contribution in system set-up and pilot stud-ies for this research. This work is supported by the BerkeleyDeep Drive Center, the Center for Human-Compatible AI,and CITRIS.
7. REFERENCES[1] P. Abbeel and A. Y. Ng. Apprenticeship learning via
inverse reinforcement learning. In Proceedings of thetwenty-first international conference on Machine learning,page 1. ACM, 2004.
[2] ASHRAE. Standard 55 - thermal environmentalconditions for human occupancy, 2010.
[3] N. Banovic, T. Buzali, F. Chevalier, J. Mankoff, andA. K. Dey. Modeling and understanding humanroutine behavior. In Proceedings of the 2016 CHIConference on Human Factors in Computing Systems,pages 248–260. ACM, 2016.
[4] M. Brackstone and M. McDonald. Car-following: ahistorical review. Transportation Research Part F: TrafficPsychology and Behaviour, 2(4):181–196, 1999.
[5] M. Elhenawy, A. Jahangiri, H. A. Rakha, andI. El-Shawarby. Modeling driver stop/run behavior atthe onset of a yellow indication considering driver runtendency and roadway surface conditions. AccidentAnalysis & Prevention, 83:90–100, 2015.
[6] HERE360. How to humanize the autonomous car. http://360.here.com/2015/04/23/humanized-driving/,2015.
[7] J.-H. Hong, B. Margines, and A. K. Dey. Asmartphone-based sensing platform to modelaggressive driving behaviors. In Proceedings of the 32ndannual ACM conference on Human factors in computingsystems, pages 4047–4056. ACM, 2014.
[8] M. S. Horswill and F. P. McKenna. The effect ofperceived control on risk taking1. Journal of AppliedSocial Psychology, 29(2):377–391, 1999.
[9] M. Kuderer, S. Gulati, and W. Burgard. Learningdriving styles for autonomous vehicles fromdemonstration. In 2015 IEEE International Conference onRobotics and Automation (ICRA), pages 2641–2646. IEEE,2015.
[10] C.-P. Lam, A. Y. Yang, and S. S. Sastry. An efficientalgorithm for discrete-time hidden mode stochastichybrid systems. In Control Conference (ECC), 2015European, pages 1212–1218. IEEE, 2015.
[11] S. E. Lee, E. C. Olsen, and W. W. Wierwille. Acomprehensive examination of naturalisticlane-changes. Technical report, 2004.
[12] H. M. Mandalia and M. D. D. Salvucci. Using supportvector machines for lane-change detection. InProceedings of the Human Factors and Ergonomics SocietyAnnual Meeting, volume 49, pages 1965–1969. SAGEPublications, 2005.
[13] OpenDS. Welcome to opends 4.0!https://www.opends.eu/home, 2016.
[14] D. Sadigh, S. S. Sastry, S. A. Seshia, and A. Dragan.Information gathering actions over human internalstate.
[15] D. D. Salvucci. Inferring driver intent: A case study inlane-change detection. In Proceedings of the HumanFactors and Ergonomics Society Annual Meeting,volume 48, pages 2228–2231. SAGE Publications, 2004.
[16] S. Scherer, A. Dettmann, F. Hartwich, T. Pech, A. C.Bullinger, J. F. Krems, and G. Wanielik. How the driverwants to be driven-modelling driving styles in highlyautomated driving. Tagungsband, 7:2015–26, 2015.
[17] D. Silver, J. A. Bagnell, and A. Stentz. Learning fromdemonstration for autonomous navigation in complexunstructured terrain. The International Journal ofRobotics Research, 2010.
[18] O. Taubman-Ben-Ari, M. Mikulincer, and O. Gillath.The multidimensional driving style inventoryâATscaleconstruct and validation. Accident Analysis &Prevention, 36(3):323–332, 2004.
[19] C. Tomasi and R. Manduchi. Bilateral filtering for grayand color images. In Computer Vision, 1998. SixthInternational Conference on, pages 839–846. IEEE, 1998.
[20] H. H. van Huysduynen, J. Terken, J.-B. Martens, andB. Eggen. Measuring driving styles: a validation of themultidimensional driving style inventory. InProceedings of the 7th International Conference onAutomotive User Interfaces and Interactive Vehicular
Applications, pages 257–264. ACM, 2015.[21] L. Xu, J. Hu, H. Jiang, and W. Meng. Establishing
style-oriented driver models by imitating humandriving behaviors. IEEE Transactions on IntelligentTransportation Systems, 16(5):2522–2530, 2015.
[22] N. M. Yusof and J. Karjanto. Comfort determination inautonomous driving style. In 3rd Workshop on UserExperience of Autonomous Vehicles at AutoUIâAZ15,pages 257–264. ACM, 2015.
[23] B. D. Ziebart, A. L. Maas, A. K. Dey, and J. A. Bagnell.Navigate like a cabbie: Probabilistic reasoning fromobserved context-aware behavior. In Proceedings of the10th international conference on Ubiquitous computing,
pages 322–331. ACM, 2008.