Do Natural Resources Fuel Authoritarianism
59
Do Natural Resources Fuel Authoritarianism? A Reappraisal of the Resource Curse Stephen Haber and Victor Menaldo Date of this Draft: December 24, 2008 Abstract: Is there a relationship between economic dependence on oil or minerals and authoritarianism? In order to answer this question we develop unique historical datasets that allow us to focus on within-country variance in resource dependence and regime types, test for long-run relationships between resource reliance and regime type, and estimate dynamic panel models. Our results indicate that dependence on oil and minerals is not associated with the undermining of democracy or less complete transitions to democracy. Our results are at variance with a large body of scholarship that finds a negative relationship between oil or mineral dependence and democracy using pooled, time-series cross-sectional techniques centered on the variation between countries using data substantially truncated with respect to time. We surmise that the reason for this discrepancy is that countries’ underlying institutions jointly determine their resource reliance and regime types. Research support was provided by the Stanford University President’s Fund for Innovation in International Studies, the Vice Provost for Undergraduate Education, the Social Science History Institute, and the Institute for Research in the Social Sciences. We also thank Nikki Velasco, who not only helped conceptualize the construction and standardization of the data sets, but also coordinated an exceptionally talented team of undergraduate research assistants: Aaron Berg, Ishan Bhadkamkar, Nicole Bonoff, Pamela Evers, Andrew Hall, Joanna Hansen, Meryl Holt, Sin Jae Kim, Gabriel Kohan, Ruth Levine, José Armando Perez-Gea, Aaron Polhamus, Diane Raub, Jennifer Romanek, Eric Showen, Daniel Slate, Anne Sweigart, Ardalan Tajalli, Hamilton Ulmer, and Aram Zinzalian. Michael Herb generously shared his insights on data sources and methods with us. Earlier drafts of this paper were presented at the Harvard University Conference on Latin American Economic History, the Stanford Social Science History Workshop, the Stanford Workshop in Comparative Politics, and the National Bureau of Economic Research workshop in Political Economy. We thank Ran Abramitzky, James Fearon, Jeff Frieden, Miriam Golden, Avner Greif, Michael Herb, David Laitin, Pauline Jones-Luong, Ross Levine, Francisco Monaldi, Elias Papaioannou, Michael Ross, Paul Sniderman, William Summerhill, Nikki Velasco, Romain Wacziarg, and Gavin Wright for their helpful comments on an earlier draft. 1
Transcript of Do Natural Resources Fuel Authoritarianism
Do Natural Resources Fuel Authoritarianism
A Reappraisal of the Resource Curse
Stephen Haber and Victor Menaldo
Date of this Draft December 24 2008
Abstract Is there a relationship between economic dependence on oil or minerals and authoritarianism In order to answer this question we develop unique historical datasets that allow us to focus on within-country variance in resource dependence and regime types test for long-run relationships between resource reliance and regime type and estimate dynamic panel models Our results indicate that dependence on oil and minerals is not associated with the undermining of democracy or less complete transitions to democracy Our results are at variance with a large body of scholarship that finds a negative relationship between oil or mineral dependence and democracy using pooled time-series cross-sectional techniques centered on the variation between countries using data substantially truncated with respect to time We surmise that the reason for this discrepancy is that countriesrsquo underlying institutions jointly determine their resource reliance and regime types
Research support was provided by the Stanford University Presidentrsquos Fund for Innovation in International Studies the Vice Provost for Undergraduate Education the Social Science History Institute and the Institute for Research in the Social Sciences We also thank Nikki Velasco who not only helped conceptualize the construction and standardization of the data sets but also coordinated an exceptionally talented team of undergraduate research assistants Aaron Berg Ishan Bhadkamkar Nicole Bonoff Pamela Evers Andrew Hall Joanna Hansen Meryl Holt Sin Jae Kim Gabriel Kohan Ruth Levine Joseacute Armando Perez-Gea Aaron Polhamus Diane Raub Jennifer Romanek Eric Showen Daniel Slate Anne Sweigart Ardalan Tajalli Hamilton Ulmer and Aram Zinzalian Michael Herb generously shared his insights on data sources and methods with us Earlier drafts of this paper were presented at the Harvard University Conference on Latin American Economic History the Stanford Social Science History Workshop the Stanford Workshop in Comparative Politics and the National Bureau of Economic Research workshop in Political Economy We thank Ran Abramitzky James Fearon Jeff Frieden Miriam Golden Avner Greif Michael Herb David Laitin Pauline Jones-Luong Ross Levine Francisco Monaldi Elias Papaioannou Michael Ross Paul Sniderman William Summerhill Nikki Velasco Romain Wacziarg and Gavin Wright for their helpful comments on an earlier draft
1
Introduction
Are countries with abundant oil or minerals cursed by their resource wealth
Parallel literatures in political science and economics suggest that they are economic
dependence on oil or minerals according to these literatures is positively correlated with
the onset of civil war slow economic growth and authoritarian government These ideas
about a ldquoresource curserdquo have had an impact well beyond the academy They are taken
almost as self-evident truths at multilateral aid organizations such as the United Nations
and the World Bank (eg Harford and Klein 2005) are presented as robust facts in
popular books on the alleviation of world poverty and inequality (eg Collier 2007) and
are disseminated in the news media as a consensus finding of social science research
(eg Rosenberg 2007) Indeed New York Times columnist Thomas Friedman (2006)
has gone so far as to decree a ldquofirst law of petro-politicsrdquo in which the price of oil and
the spread of political freedom are said to be inversely correlated The normative
implications are obvious and non-trivial Some researchers have even suggested that
developing countries might consider leaving their resources in the ground in order to
avoid their pernicious effects (eg Ross 2001b)
In this paper we question the evidence and methods supporting the idea that
economic dependence on oil or minerals is causally related to authoritarianism1 Our
basic point is that the resource curse is about a time series processmdashthe discovery of oil
or minerals is hypothesized to send a country down a different path of institutional
development than it would have followed otherwisemdashand thus the theory should be
1 We note that there is a parallel literature in economics that questions the evidence and methods supporting the link between oil or minerals and slow growth (Wright and Czelusta 2004 Lederman and Maloney 2007 2008 Manzano and Rigobon 2007) That literature proceeds along somewhat different empirical lines than our time-series approach
2
evaluated using time series evidence and methods The extant literature however relies
on pooled time series cross-sectional regressions without country fixed effects estimated
on datasets that are considerably truncated with respect to time The implicit theory
underlying these regressionsmdasheven those that control for possible endogeneities with
instrumental variablesmdash is that after holding the covariates associated with regime type
constant authoritarian resource dependent countries were on a path of political
development that would have led to the same outcome as that obtained in democratic
non-resource dependent countries Venezuela could have followed the same institutional
trajectory as Denmark ndash if it had not discovered extracted and exported oil2
Researchers are in short drawing causal inferences about processes that are purporte
happen within countries over time from a technique that is primarily driven by the
variation between cou
d to
ntries
We therefore build upon and go beyond the extant literature in four ways First
we build long-run historical datasets that allow us observe countries both before and after
they became major oil or mineral producers Second we employ econometric techniques
that are centered on the dynamic modeling of time-series processes Third in order to
mitigate possible measurement error in the dependent and independent variables a salient
concern when relegating attention to within country variation we estimate our
regressions using three different measures of oil and mineral dependence and three
different measures of regime type Fourth we draw explicit counterfactual comparisons
2 Researchers realize of course that the regressions have this quality and they therefore add control variables such as regional dummies or the initial level of per capita GDP to mitigate the problem of unobserved heterogeneity But this step does not really solve the problem the implicit counterfactual to Venezuela is now a fictional Denmark with a much lower per capita income located in Latin America
3
The body of evidence that we develop and the set of methods that we employ
allow us to control for factors and model relationships between variables in ways that
have not been accomplished in the literature to date First our data and methods allow us
to determine if there are persistent effects of resource shocks on regime types Second
they allow us to determine if resource shocks influence regime types with a time lag
Third they allow us to control for long-run differences across countries in terms of their
fundamental institutions The ability to control for time-invariant heterogeneity is
particularly critical given the fact that historically-persistent institutions may jointly
determine both countriesrsquo regime types and the numerators and denominators typically
used to compute measures of resource reliance3
Regardless of how we measure the dependent and independent variables specify
the regressions or frame the counterfactual comparisons we cannot detect the
relationship between oil or mineral dependence and authoritarianism posited by the
resource curse In fact in some specifications we detect short-run benefits from increases
in resource reliance on democratization These results do not suggest that there may not
be specific cases in which a dictator successfully used oil or mineral revenues to 3 The numerators are either measures of resource production resource exports or the rents extracted from resources The levels of all three of these metrics are often driven by political decisions made by governments that have inherited inveterately weak institutions these governments may have short time horizons and pressing fiscal needs causing them to exploit resources today rather than save them for tomorrow This is even the case when the numerator is proven oil and mineral reserves governments that inherit weak fiscal and political institutions may have strong incentives to frantically search for new resources Recent examples include Sudanrsquos and many sub-Saharan African countriesrsquo willingness to allow China to leave no rock unturned within their borders in the search for untapped oil A similar logic affects the denominators used to compute resource reliance One recent improvement made in the literature is to normalize resource wealth by population rather than GDP in order to avoid introducing simultaneous causation running from regime types to income levels (see Ross 2006 2008 Dunning 2008) Even this innovation however does not resolve the problem of unobserved heterogeneity a countryrsquos persistent institutions may jointly determine its regime type and the size and rate of growth of its population ndasheven after controlling for its level of income (see Culter et al 2006 Soares 2007)
4
consolidate his hold on power It is to say however that the evidence does not support
the notion of generalizable lawsmdasheven conditional ones
The remainder of this paper proceeds as follows Section Two reviews the
literature on the political resource curse discusses the logical flaws in its underlying
theory and provides a critical discussion of the empirical strategies employed in the
literature to date Section Three presents a discussion of the historical datasets we
develop and the methods we employ to analyze them Section Four presents our results
providing both graphical analysis of individual cases as well as panel data analysis
Section Five concludes and discusses the implications of the kind of time series approach
to evidence that we employ here for a wide variety of questions in comparative politics
II Literature Review
The idea that there is a causal connection between economic dependence on oil or
minerals and authoritarian government goes back to Mahdavy (1970 466-67) who noted
that petroleum revenues in Middle Eastern countries constituted an external source of rent
that was directly captured by governments He hypothesized that ldquoA government that
can expand its services without resorting to heavy taxation acquires an independence
from people seldom found in other countrieshellip In political terms the power of the
government to bribe pressure groups or to coerce dissidents may be greater than
otherwiserdquo What Mahdavy advanced as a hypothesis to be tested was soon recast by
other researchers as a robust fact Consider for example the shift in tone in Luciani
(1987) ldquoDemocracy is not a problem for allocation stateshellipThe fact is that there is lsquono
representation without taxationrsquo and there are no exceptions to this version of the rulerdquo
5
The idea that oil begets rentier states which are inconsistent with democracy soon became
one of the major organizing themes of the literature about authoritarianism in the Middle
East and Africa (Skocpol 1982 Anderson 1987 Beblawi 1987 Luciani 1987 Davis
1987 Crystal 1989 1990 Chaudry 1994 1997 Van de Walle 1994 Khan 1994 Yates
1996 Clark 1997 1998 Gardinier 2000 Dillman 2000 Hodges 2001 Bellin 2004
Vandewalle 1998 2006) Huntington (1991 65) went so far as to generalize the lessons
from this case study literature to the entire developing world
One of the obvious weaknesses of this literature was that its case study approach
limited its ability to draw clear causal inferences As Herb (1999 256) put it ldquohellipthe
lack of democracy is noted oil is proffered as the culprit lsquono representation without
taxationrsquo cited as the mechanism and the matter is closedrdquoAnother obvious weakness
was that any argument made about a causal relationship between oil abundance and
authoritarianism also had to be true for hard rock minerals both are extracted using
capital and technology intensive methods are sold on an international market and can be
directly taxed by governments as they come out of the ground or are exported
Researchers therefore began to subject the hypothesis that oil and mineral
abundance are associated with authoritarianism to tests against large-N datasets (Barro
1999 Ross 2001a Wantchekon 2002 Jenson and Wantchekon 2004) Over time this
large-N literature has grown increasingly sophisticated researchers have developed better
proxies for oil and mineral reliance (Ross 2008) employed techniques to control for
possible reverse causality (Ramsey 2008) exploited variance at the sub-national level
(Goldberg Wibbels and Myukiyehe 2008) and explored the effects of oil wealth on the
durability of authoritarian regimes using survival analysis or dynamic probit regressions
6
(Smith 2004 2007 Ulfelder 2007 Ross 2008 Papaioannou and Siourounis 2008)
While the specific findings vary from study to study the literature finds an association
between oil or mineral reliance and authoritarianism
The adoption of large-N frameworks did not however resolve an underlying
weakness of the theory which is that the mechanism that putatively links oil or mineral
dependence to authoritarianismmdashthe development of rentier statesmdashwas rooted in a
logical fallacy The idea that there is no taxation without representation does not logically
imply that there is no representation without taxation 4 In point of fact as both research
in public choice economics and in the history of democratization show a ruler trading
taxation for representation is only one of several paths by which representative
governments arisemdashand those specific examples of those alternative pathways include
countries that are highly dependent on oil or minerals One alternative path to
democratization is a rivalry between enfranchised and disenfranchised groups that
induces democratization from below (Conley and Temimi 2001) as occurred in oil-rich
Mexico for example A second path is when economic elites are split and the ruling
elite extends suffrage strategically to advance its interest against rival elites (Llavador
and Oxoby 2005) as occurred in nitrate-rich Chile in the nineteenth century A third path
is when political elites split and agree to democratize in order to avoid violence (Bardhan
1993) such as occurred in Colombia A final path is that democratic institutions develop
4 Researchers have also suggested two other transmission channels but tend to afford them less importance In some early versions of the theory (eg Ross 2001a) oil and minerals were claimed to generate autocracy by allowing dictators to finance a repressive state apparatus Later work by Ross (2008) suggests little empirical support for the existence of this mechanism In other versions of the theory (eg Ross 2001a) reliance on natural resources is said to have an indirect effect on regime types by retarding modernization and hence preventing Lipsetrsquos (1959) prerequisites of democracy from emerging ndash a large middle class an educated population and higher living standards
7
and thrive when public goods become more highly valued than pork (Lizzeri and Persico
2004) in the case of Trinidad and Tobago public goods financed by oil rents achieved
this status and helped sustain democracy Indeed as Herbst (2000) has pointed out the
idea that democracy develops because rulers trade representation for taxation appears to
be completely inapplicable to the developing world The historical record indicates that it
may not even be applicable to most Western European democracies5
The adoption of large-N frameworksmdashspecifically statistical methods that
primarily exploit variance across countries rather than within countries over timemdash
introduced an additional weakness into the literature a mismatch between the theory and
the empirical strategies used to test it The hypothesis that oil or mineral wealth fuels
authoritarianism implies that the discovery of oil or minerals sent countries down
different paths of institutional development than they would have followed otherwise in
the absence of resource discoveries Specifically the resource curse implies three
possible counterfactuals 1) Authoritarian country X would have become democratic
had it not found oil or minerals 2) Democratic country Y would have remained
democratic instead of lapsing into authoritarianism had it not found oil or minerals 3)
Democratic country Z would have made the transition from authoritarianism even faster
had it not found oil or minerals The methods of analysis employed in the literature do
not however allow for the direct observation of these inflection points in countriesrsquo
5 The canonical case that resource curse theorists seem to have in mind about rulers conceding representation for taxationmdashEngland after the Glorious Revolutionmdashis not in fact an example of the phenomenon The British Crown as North and Weingast (1989) make clear did not trade anything in exchange for revenuesmdashit demanded forced loans and confiscated property to fund foreign wars It was only after a protracted and bloody civil war that a coalition of nobles and citizens forcibly imposed constraints on the executive in order to prevent the crown from plundering their wealth in the future Higher tax revenues were only an incidental unintended consequence of the strengthened legislature and judiciary ndash a byproduct of more secure property rights ndash that considerably lagged increased representation (Stasavage 2003)
8
paths of institutional development Instead the extant methods pool all countries
together implicitly treating them as identical units and then look for variance across the
countries The problem with this approach is that country-years are not isomorphic
Denmark is not Venezuela without oil endemic and time-invariant institutions
differentiate these countries and those institutions constrain the possible set of political
institutions and the possible set of economic sectors that can emerge and be sustained
Some researchers have begun to acknowledge these problems Norman
(forthcoming) makes the point that resources whether they are measured as stocks or
flows may themselves be endogenous to a countryrsquos underlying legal political and
cultural institutions McSherry (2006) and Smith (2007) suggest that the blame for bad
policy choices and authoritarian political structures may lie with a countryrsquos pre-oil
institutions rather than with the oil discoveries themselves Engelbert (2000) gets to the
heart of the matter in his comparison of democratic and prosperous Botswana and
authoritarian and impoverished Democratic Republic of the Congo economic reliance on
natural resources cannot explain the differences between the two because both are
mineral rich the differences are a product of their colonial institutions
The key to any meaningful analysis of the resource curse is to specify the right
counterfactual what would a resource reliant country have looked like had it not
discovered oil or minerals One important step in this regard was made by Herb (2005)
who reasoned that resource dependent countries would have been substantially poorer
had they not found oil or minerals and would therefore have obtained lower levels of
democracymdashunder the modernization theory assumption that the growth of income
catalyzes social and political changes that result in democratization He therefore
9
calculated the per capita GDP loss from eliminating a countryrsquos oil or mineral sector and
then estimated its level of democracy at the counterfactual level of GDP His estimates
indicate that the net negative effect of resource dependence on democracy is negligible
One drawback to Herbrsquos approach is that following the traditions in the resource curse
literature it employs pooled time series cross sectional regressions without country fixed
effects on a data set that is truncated with respect to timemdashin this case 1972 to 1999 That
is it does not compare countries to themselves before and after they found resources but
rather infers what the time-series process would have looked like on the basis of cross-
sectional evidence
Dunning (2008) takes another important step in the specification of appropriate
counterfactuals by introducing country fixed effects in his regressions of polity scores on
per capita windfall profits from oil in 17 Latin American countries covering the period
1960-20016 These regressions capture how increases in resource reliance affect polity
scores within countries over time and they indicate that reliance on oil has conditional
effects on regime types when a country has a high level of inequality increased oil
reliance exerts a positive effect on democratization but when a country has a low level of
inequality increased reliance on oil exerts a negative effect7 There is a reasonable
6 In a panel of the entire world he continues the tradition in the literature of pooling all countries together We also note that Ross (2001 341fn 58) who tests the resource curse hypothesis on a global panel of countries observed between 1972 and 1997 notes that the statistical significance of the negative impact of oil and mineral exports as a share of GDP on democracy disappears if country fixed effects are introduced 7 Jones Luong and Weinthal (2006) on the basis of case study evidence also make a conditional argument about the resource curse when petroleum industries are privately owned oil exerts a positive impact on democracy when publicly owned a negative effect Their case study approach does not however permit them to control for a possible endogeneity running from regime type to the ownership structure of the oil sector nationalizations usually occurs ndash and are sustained ndash in autocratic regimes Similar methodological issues also mean that they cannot
10
likelihood however that Dunningrsquos reported results are spurious When estimating time-
series regressions it is crucial that the series are either stationary ndash which means searching
for unit roots if the data is in levels ndash or if non-stationary that they are co-integrated (see
Granger and Newbold 1974 Phillips 1986)8 Work we have done with the same
measures Dunning uses and which we discuss later in this paper indicates that the series
in levels are not stationary but not co-integrated
III Research Design
We frame the resource curse hypothesis as a counter-factual in the absence of the
discovery of oil or minerals would countriesrsquo regimes have looked all that different In
order to answer this question we focus on longitudinal change within countries over
time A dynamic within country approach is ideal because the variables of interest
exhibit considerable temporal variation and that variance is not always monotonic
democratization may be either discontinuous or fitful while oil and mineral sectors go
through booms and busts and countries both modify the amount of natural resources they
choose to produce and change the way they tax natural resources In other words history
ndashnot scatter plots ndash provides the best way to tell the story
control for pre-existing institutions that may jointly determine autocracy and state-owned enterprises 8 There is also an issue of the validity of the independent variable in terms of the theory being testedmdashan issue that we hasten to add affects most of the literature with the exception of Herb (2005) The causal mechanism that links oil to regime types is assumed to be the rents captured by the government from the production of oil but the most popular variable employed captures total rents producedmdashsome of which are captured by the government and some of which accrue to the rest of society How the rents are divvied up depends crucially on the type of taxes and royalties that are levied as well as on the tax rate and the enforcement of direct taxes on resources such as corporate taxes on oil and mining companies These factors not only vary across countries but they vary within countries over time
11
We therefore build long-run historical datasets from primary sources draw
explicit counterfactual comparisons graph the trajectory of political institutions against
resource reliance over time and employ dynamic time series-centric econometric
techniquesmdashmost particularly autoregressive distributed lag panel models We employ
cross-section time-series data instead of country-by-country time-series for two reasons
First we are better able to detect whether the variables of interest have unit roots and by
extension exhibit a long-run relationship (are co-integrated) This is because the
augmented Dickey Fuller tests used to identify the stationarity of the data is more
powerful in the panel context (see Levin and Lin 1992 Quah 1994) Second panel
estimators have been shown to militate against measurement error more effectively than
time-series regressions (Baltagi 1995)9
Measuring Regime Types
Polity Score
Our primary measure of regime type is the Combined Polity 2 scoremdashan index
that measures the competitiveness of political participation the openness and
competitiveness of executive recruitment and constraints on the chief executive (see
Gurr and Marshall 2005 pp 15-6)mdashfrom the Polity IV dataset For simplicity we refer
to this measure throughout this paper as the Polity Score We center our analysis on the
9 One could argue that the assumption of parameter heterogeneity implied by our cross-country time-series framework is unduly strong We note that if we run individual time-series co-integration tests and regressions for seventeen of the largest oil and mineral producers in the world (see below) we attain materially similar results We will discuss some of these results below when we reevaluate Dunningrsquos (2008) evidence for a ldquoresource blessingrdquo ndash ie that high levels of resource reliance in highly unequal societies is favorable to democracy We also note thatwe do not employ the Pesaran and Shin (1999) pooled mean group estimator which allows for slope heterogeneity in the short-run effect across panels because this framework requires that the data be stationary
12
Polity Score because it is the standard measure of democracyautocracy employed in the
resource curse literature as well as in the field of comparative politics more broadly In
addition the Polity Score is measured for each country in the world going back to its first
year of independence through 2006 Following conventions in the literature and in
order to make the regression coefficients easier to interpret we normalize these scores to
run from 0 (complete autocracy) to 100 (complete democracy)
Binary REGIME
The second measure we employ is the binary measure of democracy originally
created by Przeworski et al (2000) for the period 1950-1990 popularly known as
REGIME It is an ldquoelectoralrdquo measure of democracy that is coded as a ldquo1rdquo if (1) the
executive is directly or indirectly elected (2) the legislature is directly elected (3) there
is more than one party and (4) control of the executive alternates between different
parties under the same electoral rule REGIME has been extended by Boix and Rosato
(2005) from 1800 to 1999 and by Cheibub and Ghandi (2004) from 1946 to 200210
Counterfactual Polity
One potential concern with both of these measures is that they do not measure a
countryrsquos level of democracyautocracy relative to what it might have become had it not
discovered oil or minerals In order to address this concern we develop a third measure
of regime typemdashCounterfactual Polity We construct this variable by assuming that if a
resource dependent country did not develop its resource sector it would have obtained
the same level of democracy as that achieved by the typical non-resource dependent 10 We use the Cheibub and Ghandi (2004) data set but fill in missing observations observations for some country years during the 1946-2002 period by using Boix and Rosato (2005)
13
country in their same geographiccultural region We therefore calculate for each year a
synthetic hypothetical Polity Score for each resource reliant country and then calculate
how much that countryrsquos observed Polity Score differs from its hypothesized Polity
Score Specifically Counterfactual Polity is the average Polity Score of the non-resource
dependent countries computed by region and then subtracted from the resource
dependent countryrsquos Polity Score11 Decreases in the gap between the hypothesized and
observed Polity Scores over time bespeak convergence between a resource dependent
country and its regionrsquos average Polity Score while increases represent divergence
Measuring Oil and Mineral Dependence
Fiscal Reliance on Resource Revenues
The first measure or resource reliance we employ is Fiscal Reliance on Resource
Revenues the percentage of government revenues from oil or minerals These revenue
streams include taxes and royalties paid by oil or mineral companies as well as dividend
payments or direct transfers from government-owned oil and mining enterprises This
measure has both theoretical and practical advantages The theoretical advantage is that
by capturing the extent to which natural resource rents are directly absorbed by regimes
this measure provides a direct test of the resource curse hypothesis that increased
11 We specify a country as being non-resource dependent if its level of fiscal reliance on oil and minerals during the period 1972-1999 as measured by Herb (2005) was less than five percent We code those few cases not treated by Herb (2005) on the basis of their ratio of oil and mineral exports to GDP (a ratio of less than five percent is coded as non-resource dependent) We note that when we compare the countries for which we have both measures our method produces few false negatives countries that export oil and minerals worth more than five percent of GDP tend to obtain more than five percent of government revenues from those same resources Finally in the handful of cases where both measures of resource reliance are unavailable we verify that they produce no or extremely modest amounts of petroleum from our dataset on per capita oil production We also verify that they produce no or extremely modest levels of minerals from information in the Central Intelligence Agencyrsquos World FactBook
14
revenues from resources induce or protract authoritarianism by allowing governments to
operate autonomously from citizens The practical advantage is that this measure has
generous longitudinal coverage By retrieving and standardizing countriesrsquo fiscal
statistics from the annual reports and retrospective series of central banks statistical
offices and treasury ministries we are generally able to construct this measure from
independence to 2006 In most cases this means that our measure extends back to the
period before countries became major oil or mineral producers12
There is one practical disadvantage to this measure however the retrieval and
standardization of idiosyncratically organized fiscal data from historical sources is not an
enterprise characterized by economies of scale We therefore have to truncate our
coverage of Fiscal Reliance with respect to the number of countries We do so by
applying three criteria 1) a country had to have oil or mineral revenues equal to at least
five percent of total government revenues during the period 1972-1999 based on data
from Herb (2005) 2) we had to be able to obtain uninterrupted volumes of the serial
publications that contain countriesrsquo fiscal data and 3) those records had to be transparent
enough to allow for the identification of oil and mineral revenue streams as well as total
government revenues
Seventeen major resource exporters met these criteria fifteen oil producers and
two of the worldrsquos major copper producers The fifteen oil producers are Mexico
Venezuela Ecuador Trinidad and Tobago Nigeria Angola Indonesia Iran Algeria
Bahrain Yemen Oman Saudi Arabia Kuwait and Norway As a group they accounted 12 One concern is that by relying on central bank or treasury records we are potentially omitting oil or mineral revenues that are available to rulers but not captured via taxation royalties or dividends from state-owned oil or mining enterprises We recognize this potential shortcoming and try to mitigate it by reviewing where possible the records of state-owned oil or mineral companies in order to detect off-budget government expenditures
15
for 45 percent of the worldrsquos oil output in 2006 The two copper producers are Chile
which is the worldrsquos most important producer (accounting for 35 percent or world output
in 2005) and Zambia which is the worldrsquos tenth most important copper producer
(accounting for 3 percent of world output)
One might worry that our restrictions have yielded cases that are potentially
unrepresentative and thus that our time-series results on the relationship between Fiscal
Reliance and regime type cannot be extrapolated to the history of other resource
producers There are two reasons why we doubt this to be true The first is that many of
the major petroleum and copper producers that we have excluded are now robust
democracies that have achieved the highest possible democracy score across the popular
measures of regime type13 Therefore if there is sample selection bias engendered by our
incomplete coverage of fiscal reliance on resource revenues with respect to countries it is
likely to run in the direction of the resource curse making it easier to find a relationship
between natural resources and authoritarianism The second reason is that we develop
two other measures of resource reliance (see below) for panels covering the entire world
and they yield regression results that are not materially different from those we obtain
with Fiscal Reliance on Resource Revenues
Per Capita Gross Petroleum Rents
13 These countries include but are not restricted to the United States Great Britain Canada and Australia The United States is a particularly poignant case from the middle of the nineteenth century until 1975 when it was finally passed by Saudi Arabia it was the worldrsquos leading producer of petroleum It remains the worldrsquos third largest producer of petroleum accounting for seven percent of world output From the 1870s until 1910 the United States was also the worldrsquos leading mineral producer (David and Wright 1997) To this day it remains the worldrsquos second most important producer of copper accounting for 75 percent of world outputmdashfollowing only Chile which is also democratic
16
The second measure we employ is Per Capita Gross Petroleum Rents which we
compute as the output of oil in barrels multiplied by the world price of petroleum in
constant 2007 US dollars divided by population14 Petroleum production for every
country-year was obtained from yearbooks produced by petroleum consulting companies
producers associations and government agencies This measure has two main
advantages The first is longitudinal coverage our observations start with the first year
of a countryrsquos independence and extend to 2006 With the exception of a few producers
in the Middle East and Central Asia this means that we can observe countries before they
became major oil producers The second is that we do not confront issues of country
selection this variable covers 166 countriesmdashvirtually every country in the world Of
these as many as 94 produce oil in any given year The chief disadvantages of this
variable are that it does not include rents from non-fuel minerals and does not reflect
differences across countries and time in petroleum extraction and refining costs15
Per Capita Windfall Profits from Natural Resources
In order to mitigate potential problems of measurement error in Gross Oil Rents
Per Capita we develop a third measure Per Capita Windfall Profits from Natural
Resources This measure is calculated from data retrieved from the World Bankrsquos World
Development Indicators It is the value of the oil gas coal hard rock minerals and
precious metals produced minus the costs of production and the opportunity cost of
14 This measure as well as any of the measures normalized by population that we employ is measured in thousands in the regressions that follow in order to facilitate interpretation 15 To some extent this problem is mitigated by the fact that the decision to produce each marginal unit of oil is at least in the medium run a function of the rents available to producers if production costs are too high relative to the world price countries cut back on output which is implicitly incorporated into this measure
17
capital converted to constant 2007 US dollars divided by population This measure
originally developed by Hamilton and Clemens (1999) has two clear advantages over
Gross Oil Rents Per Capita it includes hard rock minerals as well as oil and it implicitly
controls for production costs16 Like Gross Oil Rents Per Capita its coverage is global
our data set includes 146 countries of which 104 exhibit positive values for windfall
profits from oil or minerals in any given year This measure does however have an
obvious disadvantage it is considerably longitudinally truncated the first World Bank
estimates of the components of this measure are not available until 1970 Thus while our
other measures of resource reliance run from a countryrsquos first year of independence to
2006 this measure only runs from 1970 to 2006
Control Variables
The unrestricted specifications that follow include several control variables
Following modernization theory ndash increasing wealth drives democratization (Lipset
1959) or at least protects it (Pzeworski et al 2000) ndash we include the log of Real Per
Capita GDP We take this data from the Penn World Tables version 61 and update it to
2006 using data on the rate of economic growth from the World Bank Development
Indicators (2008) We also include the Growth Rate of GDP Per Capita following the
widely held belief that economic performance (high growth) can lead to regime stability
and economic crises (negative growth) can catalyze regime transitions (eg Gasiorowski
1995) Finally in order to hold democratic diffusion effects constant we control for
regional and world trends in democratization as well as the possible contagion effects of
16 It also provides an advantage over other measures that can be developed from online data such as oil and mineral exports as a percent of GDP in that it measures production that is both consumed domestically and exported (Ross 2008)
18
nearby democratic transitions Following Gleditsch and Ward (2006) we add three
variables to the regressions the percentage of democracies in a countryrsquos geographic-
cultural region (with democracy measured as a score of 85 or higher on the normalized
Polity Score) the percentage of democracies in the world and a dummy variable coded
ldquo1rdquo for country-years in which a democratic transition occurs within the countryrsquos region
IV Data Analysis Hypothesis One Natural Resources Undermine Democracy
There are occasions in social science research when descriptive information and
simple graphs are enough to cast serious doubt on a hypothesismdashand this is one of those
occasions Before diagnosing the time-series properties of our data and reviewing the
results of several multivariate analyses we first conduct some simple tests by inspecting
and graphing the data Of the 164 countries for which we have data 33 enter the data set
with a Polity Score that meets Gleditsch and Wardrsquos (2006) criteria for a stable
democracy (a Polity Score of at least 85 on our normalized scale) Of those 33 countries
seven display non-trivial values on any of our three measures of oil and mineral reliance
Of those seven resource reliant democracies fivemdashAustralia Botswana Trinidad and
Tobago Jamaica and Papua New Guineamdashremained democratic The data for Trinidad
and Tobago displayed in Figure 1 illustrate the general pattern even during a period in
which petroleum rents increased dramatically and 60 to 70 percent of government
revenues derived from oil and gas the countryrsquos Polity Score actually ticked up
One might be tempted to argue that the remaining two casesmdashMalaysia and
Nigeria which are oil producers and which underwent periods of authoritarianismmdash
provide evidence consistent with the resource curse The problem with this reading of the
19
facts is that democracy broke down in these countries before they ever became significant
oil producers Figure 2 graphs the Nigerian data and it makes clear that oil accounted for
only seven percent of government revenues and gross oil rents were only $36 per person
in 1966 when a coup ended democracy In order to make a convincing case for the
resource curse one would have to believe that the military officers behind the 1966 coup
foresaw the run-up in world oil prices in 1973 that ushered in Nigeriarsquos petroleum boom
In addition one would also have to account for the fact that Nigeria has been trending
towards greater democracy since 1998 Between 1998 and 2006 its fiscal reliance on
petroleum grew by 40 percent its gross rents from oil per capita more than tripled and its
windfall profits from oil increased almost five-fold
Hypothesis Two Natural Resources Impede Democratic Transitions
As with hypothesis 1 we begin our analysis by visually inspecting the data and
present some representative graphs that plot the longitudinal relationship between our
three measures of resource reliance and a countryrsquos Polity Score We do not find
compelling evidence in favor of the hypothesis that resources impedes democratization
One of the first features of the data that jumps off the page is that there is a set of
countries that were authoritarian prior to the exploitation of oil or minerals and which
then democratized during a period in which their oil or mineral sectors boomed Such
cases include Ecuador Chile Peru Venezuela and Mexico To provide a sense of what
the data looks like Figure 3 graphs the data for Mexico The increase in Mexicorsquos Polity
Score from 20 in 1976 to 90 in 2000 captures the countryrsquos transition from a long-lived
authoritarian regime to a multiparty democracy What is particularly striking about the
increase in Mexicorsquos Polity Score is that it was coterminous with the rebirth of the
20
Mexican petroleum industry which had been stagnant since the late 1920s During the
heyday of one party rule in Mexicomdashthe 1950s and 1960smdashincome from oil typically
accounted for less than five percent of government revenue and real gross rents from oil
typically amounted to only $35 per capita In 2000 when the PRI finally lost its grip on
power oil income accounted for 23 percent of government revenues and real gross oil
rents had jumped to almost $400 per capita By 2006 when Mexico held a second free
and fair election the percentage of government revenues derived from oil and real gross
rents from oil stood at historic highs 37 percent and $865 per person respectively
The second surprising pattern revealed by visually inspecting the data is that there
is a set of countries that were highly authoritarian prior to the exploitation of oil or
minerals and which while they did not fully democratize saw at least a twofold increase
in their Polity Scores during the period in which their resource sectors grew rapidly
These cases include Chad Iran Egypt Yemen Algeria and Angola Figure 4 which
graphs the time-series relationship between our measures of resource reliance and Polity
for Angola provides a representative example The Polity Score Fiscal Reliance Real
Gross Rents from Oil Per Capita and Real Windfall Profits from Oil and Minerals Per
Capita all trend together and the trend is a monotonic secular increase
The third pattern that emerges is that there is a group of countries most of which
are clustered around the Persian Gulf that have persistently low Polity Scores and that
are highly reliant on oil The majority of these countries however ndash as Herb (1999) has
pointed out with respect to Kuwait ndash had authoritarian political structures in place for
decades before the first drop of oil ever flowed Other examples include Saudi Arabia
Iraq Libya Oman and Equatorial Guinea This suggests that the number of countries
21
born as autocratic ldquopetro-statesrdquo in which one can claim that oil fundamentally
conditioned the new nationrsquos political institutions is actually quite small candidates
include Qatar the United Arab Emirates Bahrain Azerbaijan and Turkmenistan
There is a final group of countries whose data display a pattern that accords with
the resource curse when resource dependence is at low levels irrespective of the way in
which it is measured the country has a high Polity Score conversely when resource
reliance is high the country exhibits a low Polity Score An example is Indonesia whose
data we graph in Figure 5 The number of such cases however appears to be
exceedingly small Besides Indonesia potential candidates include Syria and Gabon
Multivariate Analysis
When the central objective of the estimation approach lies with the datarsquos time-
series processes two issues must be addressed before moving to regression analysis The
first is the stationarity of each data series do the data have the same mean variance and
co-variance over time The second is specifying the datarsquos correct lag structure One
might imagine that political actors and institutions do not automatically react to changes
in resource dependence One might also imagine that changes in resource dependence
come in two flavors and each has a differential effect on political actors and institutions
Changes in resource reliance may be transitory if they are a product of a short-lived
increase in the price of oil for example or permanent if they arise from a technological
innovation that improves resource extraction It is important to model these dynamics
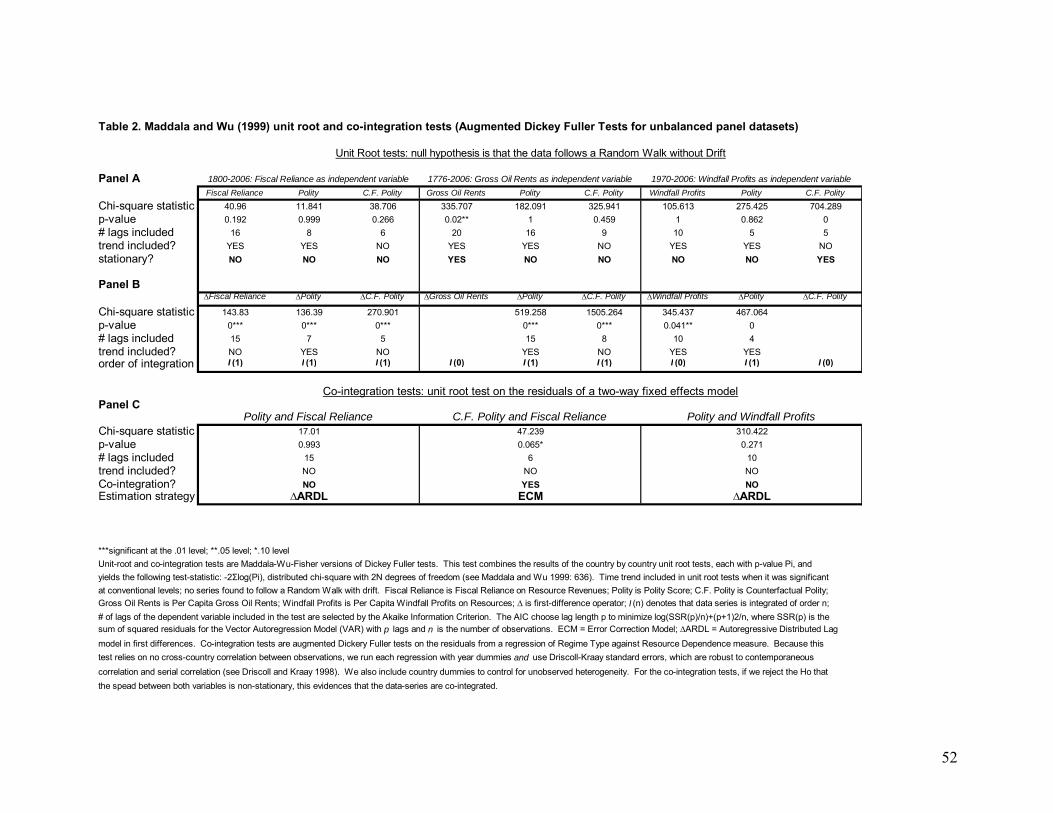
Unit Root and Co-integration Tests
22
Our graphed data (not all of which we reproduce here) indicate that the various
measures of resource dependence tend not to be mean-revertingmdashthere is an upward
trend This is also the case for several countriesrsquo Polity Scores The implication is that
the data are non-stationary Therefore we first apply a series of diagnostics to determine
whether the data are non-stationary and if they are indeed not stationary whether they
are co-integrated We conduct a series of Maddala and Wu (1999) based augmented
Dickey-Fuller tests for unbalanced panel data (based on Fuller 1932) and we do so for
each resource dependent measure and for Polity with separate diagnostics for each
distinct time period covered by our resource dependence measures For example
because Fiscal Reliance covers seventeen countries between 1800 and 2006 we check to
see if Polity is stationary during this time period and across these particular countries
Conversely because Windfall Profits on Oil or Minerals Per Capita has global coverage
but is truncated to the years 1970-2006 we check to see if Polity is stationary during this
time period and across the countries covered by this variable Table 2 Panels A and B
presents the results (Table 1 presents summary statistics for the variables in the dataset)
The null hypothesis is that the data are non-stationary
The tests performed on the data in levels (Panel A) indicate that in the majority of
cases both the dependent and independent variables are non-stationary The sole
exception is Per Capita Gross Oil Rents The augmented Dickey Fuller tests in Panel B
of Table 2 show that the series that are not stationary are integrated of order 1 first
differencing the data makes these series stationary
The non-stationarity of most of our series means that unless the series are
cointegrated it is inappropriate to estimate regression in levels To discover if Polity is
23
co-integrated with the non-stationary measures of resource dependence we test for unit
roots in the residuals of static models in which Polity is regressed against Fiscal Reliance
and Per Capita Windfall Profits respectively17 We again apply the Maddala and Wu
(1999) augmented Dickey-Fuller tests Since these unit root tests are conducted on the
aforementioned regressionsrsquo residuals the null hypothesis is that the variables are not co-
integrated The results for these co-integration tests are documented in Table 2 Panel C
All of the tests on the non-stationary series produce insignificant results This means that
there is no evidence for a long-run relationship between countriesrsquo Polity Scores and their
resource dependence Failure to find evidence for a long-run relationship between the
level of democracy and the degree of natural resource dependence casts strong doubt on
the claim that resource reliance is causally associated with autocracy
Regression Specification
Because the diagnostics described above reveal that our series are either non-
stationary and not co-integrated or are a mix of stationary and non-stationary series the
implication is that we should estimate a specification in first differences18 Despite the
lack of co-integration however our regressions should still account for both short and
long-term effects made by changes in resource dependence on changes in Polity We
17 Granger (1981) argues that two or more non-stationary time series that become stationary after first-differencing may have linear combinations that are stationary without differencing If such a relationship in levels exists these non-stationary variables are said to be co-integrated The existence of a stationary long-run relationship between series that are individually non-stationary justifies an evaluation of the relationship in levels between non-stationary variables 18 See Beck and Katz 2004 26 Kittel and Winner 2005 footnote 10 Wooldridge 2006 652-53) We note that An Error Correction Model (ECM) is not appropriate in these situations because though the dependent variable is first differenced in an ECM and thus stationary the introduction of covariates measured in levels may lead to spurious relationships when they are not stationary
24
therefore adopt an Autoregressive Distributed Lag (ARDL) framework in first
differences19 In order to select the right number of lags of Polity we choose a vector
autoregressive model with the lowest AIC statistic In order to select the right number of
lags of resource dependence we choose the number of lags that minimizes the AIC
statistic Since we introduce country dummies into the regressions the coefficients on
the independent variables represent a cross-country average of the longitudinal effect20
Specifically we run a model with the following functional form
∆Yit = ∆Xitβ + niφ+ vtλ+ uit (1)
where Y is a (ntimes1) vector of observations on the dependent variable X is a (ntimesk) matrix
of n observations on k explanatory variables Variables included in X include the one
year lag of the dependent variable as well as higher order lags of the DV as selected by
the AIC statistic and the contemporaneous value of the measure of resource reliance
19 First-differencing significantly affects the interpretation of the results Most crucially we forfeit the information about the degree of reliance on minerals and oil and retain only the information about its change This implies that we are relegated to making inferences about the effect that the size of the change in resource reliance has on the size of the change in regime type Conversely the resource curse implies that autocracy observed during any particular year is not necessarily related to short-run fluctuations in resource reliance ndash in or before that year ndash but to the accumulation of resource reliance since the discovery of resources We stress that we have ruled this type of relationship out however via the co-integration tests described above 20 Although first differencing the data expunges country fixed effects and therefore controls for countriesrsquo unobserved time-invariant heterogeneity we also include country dummies The country dummies control for systematic cross-country differences in the annual changes in Polity in other words for country-specific time trends (see Kittel and Winner 2005 280 Daveri and Tabellini 1997 26) We also note that across our models AR(1) serial correlation is eliminated by introducing one or more lags of the DV ndash according to Arellano Bond serial correlation tests (see Arellano and Bond 1991) ndash higher order serial correlation is not always eliminated (detected via the same Arellano Bond tests) Therefore across our models we estimate robust standard errors clustered by country Robust standard errors clustered by country are estimated via a variant of the HuberWhiteSandwich technique and yield estimates that are robust to both groupwise and within-country heteroskedasticity as well as correct coverage in the presence of any arbitrary correlation structure among errors within the country panels (Williams 2000 645) Shocks that are common across countries in any given year are estimated by introducing year dummies (also since robust standard errors clustered by country are not robust to contemporaneous correlation between panels the year dummies address this issue)
25
used as well as lags of resource reliance as selected by the AIC statistic X includes
∆regime type measuret-1 through ∆regime type measuret-k as well as ∆resource reliance
measuret and ∆resource reliance measuret-1 through ∆resource reliance measuret-m Also
in some specifications contemporaneous values of several control variables and in some
cases their values at relevant lags are also included Finally in some specifications the
interaction of the measure of resource reliance used and log(Per Capita GDP) are also
entered into the equation either contemporaneously (∆resource reliance measuret X
∆log(Per Capita GDP)t) or at some lag of both variables (∆resource reliance measuret-m
X ∆log(Per Capita GDP)t-m) Meanwhile β is a (ktimes1) vector of parameters n is a
country fixed effect potentially correlated with variables in X v is a year fixed effect
potentially correlated with variables in X and u is a (ntimes1) vector of disturbance terms that
are unique to each country and assumed to be possibly heteroskedastic and correlated
within countries Both n and v imply that a dummy variable for each country in the data
set (except for one) are included in the equation and a year dummy for each year in the
panel data set (except for one) are also included Heterogeneous intercepts are estimated
by country and year (the φ and λ vectors respectively)21
21 Because of the terms discussed above Equation (1) depicts an ARDL(pq) with p equal to the number of lags of Polity that are selected by the AIC statistic and q equal to the number of lags of the measure of resource dependence selected Moreover Equation (1) is a rational distributed lag model with an infinite lag Because country dummies are also estimated there is the concern that bias is induced via the correlation between the lagged dependent variable(s) and the individual effects (see Nickell 1981) The biasrsquos severity is a function of the sample size and the magnitude of the autoregressive coefficient and decreases as T grows Monte Carlo evidence uncovered by Judson and Owen (1999) show that a fixed effect estimator performs as well or better than alternative approaches that use instrumental variables or a methods of moments (GMM) approach to address this bias Because T is always greater than 30 across our regressions we do not think it necessary to move beyond the Ordinary Least Squares context We note however that after running a series of so-called Arellano Bond difference GMM dynamic panel data regressions in which first differencing the data expunges the country fixed effects and the lagged dependent variable(s) are instrumented with all of their available lags materially similar results are returned
26
Several values hold interest the Impact Multiplier (the coefficient on the
contemporaneous value of resource dependence) the coefficients on the lags of resource
dependence and the Long-run Multiplier (the total long-run effect) The Impact
Multiplier is the immediate change in Polity due to a one-unit temporary change in
resource dependence The coefficients on any of the lags of resource dependence are the
delayed changes in Polity that occur after a temporary one-unit change in resource
dependence Finally the Long-run Multiplier depicts the total changes in Polity due to a
permanent change in resource reliance at an indeterminate time in the past22
Empirical Findings
We begin with a set of regressions in which resource dependence is proxied by
Fiscal Reliance on Oil or Minerals We present the results of a base specification of this
regression in Table 3 Column 1 If there is a resource curse we would expect to find a
negative coefficient on the Long Run Multiplier We would also expect the majority of
the coefficients on the lagged independent variable to be negative with many of them
significant The theoretical predictions on the Impact Multiplier are somewhat
ambiguous but one would probably not expect to find systematic positive coefficients
The regression results however yield coefficients with the ldquowrongrdquo signs The
Long Run Multiplier the Impact Multiplier and the majority of the coefficients on the 22 The Long-run Multiplier is calculated by setting the dependent and independent variables at their long-run values for all t and then finding the change in the long run value of the dependent variable with respect to the long run value of the independent variable See Wooldridge (2006) 638 Since the Long-run multiplier is non-linear function of the estimated coefficients its standard error is computed via the Delta Method Because of the correlation in changes in resource reliance at different lags it is often hard to gain precise estimates of the individual coefficients for each lag Therefore for each distributed lag model we also calculate an F-test on the hypothesis that the contemporaneous value of resource reliance and its lags are jointly statistically significant
27
lagged independent variable are positive To the degree that any variables yield a
statistically significant result it is that the coefficient on the sixth lag of the independent
variable ndash yet it is positive23 One might be tempted to argue that our results are an
artefact of our (very) long time series Perhaps the resource curse is a post-World War II
phenomenon only Column 2 of Table 3 therefore truncates the estimation to the 1950-
2006 period This move has no material effect on the results
One might also be tempted to argue that the positive coefficients we obtain are the
product of concomitant increases in GDP per capita that accompany the creation of
economies that experience increases in their resource dependence Specification 3
therefore adds controls for the log of GDP Per Capita and the Growth Rate of GDP Per
Capita One might also argue that the positive coefficients we obtain are the product of
the fact that there has been a world-wide trend towards increased democracy We
thereforecontrol for the possibility of contagion effects in specification 3 with three
variables following Gleditsch and Ward (2006) the percentage of countries in the world
that are democratic the percentage of countries in a resource producerrsquos geographic
region that are democratic and a dummy for a democratic transition in a resource
producerrsquos geographic region If anything these controls strengthen our earlier results
the coefficient on the Long Run Multiplier is now positive and significant at the 90
percent confidence level
A sceptical reader might argue that there are conditional effects For example
she might suggest that resource dependent countries with low per capita incomes (such as
Equatorial Guinea) might be affected by the resource curse while wealthy resource
23 For clarity of presentation we do not report the coefficients on every lag but only the last lag and any before the last lag that comes up as statistically significant in any specification
28
dependent countries (such as Canada) might be immune We therefore add interactions
of Per capita GDP and Fiscal Reliance on Oil or Minerals in specification 4 of Table 3
and calculate the marginal effects of Fiscal Reliance at the 25th 50th and 75th percentiles
of Per Capita GDP The results are inconsistent with this conditional resource curse
view the coefficients on the lower values of GDP Per Capita have the wrong sign and
none of the coefficients are statistically significant An even greater sceptic might argue
that the conditional effects occur with a lag We therefore interact per Capita GDP in t-6
and Fiscal Reliance on Oil or Minerals in t-6 (we choose t-6 because it is the one lag of
Fiscal Reliance that is statistically significant across our regressions) This step reported
in specification 5 increases the statistical significance of the marginal effects of Fiscal
Reliance as GDP Per Capita increases Nevertheless we still cannot obtain the negative
coefficient that one would expect at the 25th percentile of GDP (nor at lower values of Per
Capita Income that we do not report)
A diehard advocate of the resource curse might still insist that the resource curse
is actually a result of recent geo-strategic developments She might argue that the
dramatic increase in oil prices after 1973 gave significant leverage to oil producing
countries allowing them to become price setters and deploy the resulting rents to make
their governments accountability-proof knowing that uninterrupted access to oil trumps
any concern about democracy She might also point to the fact that increasing numbers
of oil producing governments nationalized their oil industries in those same decades
giving them greater control over oil rents We therefore test the hypothesis that the
resource curse is conditional with respect to this particular time period by truncating the
29
dataset to the period 1973-2006 This experiment reported in specification 6 of Table 3
has no material effect on any our results
One might argue that the results in Table 3 are a product of sample selection bias
because our panel dataset with Fiscal Reliance is truncated with respect to the number of
country cases We therefore substitute Gross Oil Rents Per Capita whose coverage is
global as the independent variable in Table 4 and re-run all of the regressions The
material results do not change appreciably when we substitute this new independent
variable Five the six specifications yield Long Run Multipliers with the wrong (positive)
sign We never detect statistically significant coefficients on the lagged independent
variable In fact in some specifications the coefficients on the lagged independent
variable are positive and statistically significant There is only one specification that
produces a result that is at all consistent with the Resource Cursemdashspecification 1 which
is run on the entire length of the panel and includes none of the conditioning variables In
this specification the Long Run Multiplier is negative (but far from significant) and the
Impact Multiplier is negative and significant This result is curious given the non-results
in the other regressions We therefore split the sample to the pre-1950 period and the
post-1950 period and allow the AIC to choose the most appropriate lag structure for each
sub-sample When we do so we find that the Long Run Multipliers are positive in both
specifications while the Impact Multiplier is positive and highly significant in the pre-
1950 period (results not shown) and negative in the post-1950 period It is however not
statistically significant (see Table 3 specification 2)
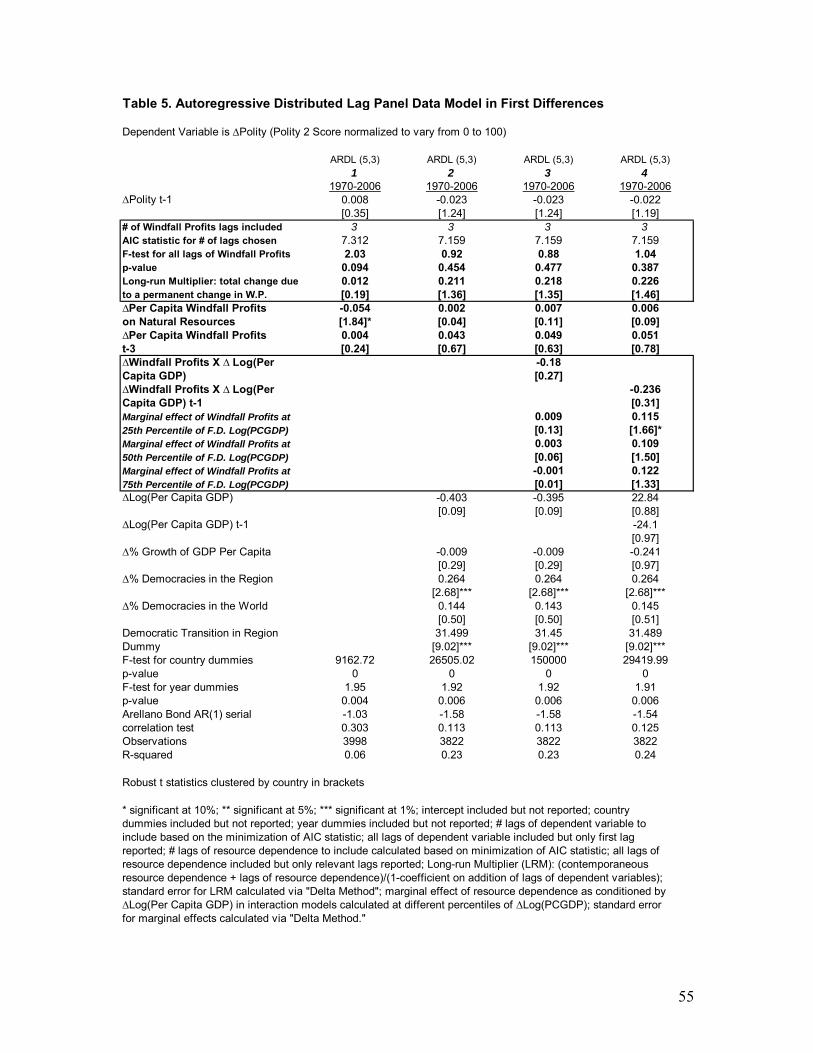
As a robustness check we re-estimate all the regressions run in Tables 3 and 4
substituting Windfall Profits from Oil and Minerals Per Capita as the independent
30
variable The results reported in Table 5 are not materially different from the results in
Tables 3 and 4 All the specifications yield Long Run Multipliers that have the wrong
(positive) sign The lagged independent variables are consistently positive Although the
Impact Multiplier is negative in specification 1 and significant at the 90 percent level
once we introduce control variables (specifications 2 through 4) the sign of the Impact
Multiplier turns positive
Robustness of Results Democracy as a Binary Variable
Several researchers claim that regime types are best modelled as binary variables
instead of continuous ones (see Przeworski et al 2000 chapter 1) We therefore re-run
the regressions on the Gross Oil Rents Per Capita and Windfall Profits from Oil and
Minerals Per Capita as dynamic conditional fixed effects logit regressions with a binary
measure of democracy REGIME Because we need to include the Per Capita GDP and
the Growth Rate of GDP Per Capita the dataset is truncated to post-1950 observations24
The estimation technique we adopt affords many advantages First it allows us to
calculate separate estimates for those countries observed as democratic and those
observed as autocraticmdashand then see whether they switch regime type as a result of
increased resource reliance Second we can include the independent variables in levels
Third departing from dynamic probit based approaches without country fixed effects
(eg Ross 2008) we can control for time-invariant heterogeneity between countries
A dynamic conditional logit model can estimate a first-order Markov chain
transition process between different states over time where the probability distribution of
yit for observation i at time t is modelled as a function of irsquos prior state at previous time 24 We do not run these logit regressions on the dataset on Fiscal Reliance on Oil or Minerals because there is not enough switching from one regime type to the next with only 17 countries
31
periods t -1hellip t-T Specifically if we invert REGIME so that autocracies are coded as
a ldquo1rdquo we can evaluate the conditional transition probabilities while expunging country
specific fixed effects via the following functional form
Pr(yit = 1 | yit-1 Xit-1) = Λ[αi + Xit-1β + yit-1ρ + ξ(yit-1Xit-1)+ vtλ+ uit] (2)
where Λ() is the logistic cumulative distribution α is the intercept term for country i and
depicts the fact that the country fixed effects are potentially correlated with variables in X
(although these coefficients are not actually estimated) X is a (ntimesk) matrix of n
observations on k explanatory variables β is a vector of estimated parameters that
indicate the effects of the covariates on the probability of a 1 at time t given a 0 at time t-
1 and ρ is the estimated coefficient on the lagged dependent variable meanwhile the
effects on the probability of a 1 at time t given a 1 at time t-1 are given by β + ξ (the
coefficients on the interactions between yit-1 and Xit) Meanwhile v is a year fixed effect
potentially correlated with variables in X and u is a (ntimes1) vector of disturbance terms that
are unique to each country and assumed to be possibly heteroskedastic and correlated
within countries Finally v implies that a dummy variable for each year (except for one)
are also included represented by the heterogeneous intercepts in vector λ25
The first set of coefficients evaluates the hypothesis that oil undermines democracy
and the addition of these coefficients and their respective interaction terms evaluates the
hypothesis that oil prevents democratization Therefore the coefficient on the measure of
resource reliance (un-interacted with the lagged dependent variable) is the effect of
resources on the likelihood that a democracy will revert to authoritarianism Conversely 25 We note that if a country did not experience a regime change during the time period under consideration the estimation procedure drops the panelrsquos observations because countries that do not switch from one state to another do not contribute any information towards the optimization of the log-likelihood function
32
because the addition of this coefficient and its interaction term represents the effect of
resource reliance on the likelihood that an autocracy will remain autocratic if we subtract
the product of this addition from 1 we can identify the impact of resource reliance on the
odds of democratic transition26
We present the results in Table 6 Specification 1 models the effect of increases in
Per Capita Oil Rents on countries that are observed in any year as democratic Per Capita
Resource Reliance t-1 tells us the effect of an increase in Per Capita Oil Rents on the
probability that those countries will become autocratic If increases in resource dependence
are associated with the breakdown of democracy the coefficient should have a positive sign
Our results however tell the opposite story the coefficient is negative although not
significant Specification 2 models the effect of increases in Per Capita Oil Rents on
countries that are observed in any year as authoritarian Here the resource curse would
predict a negative coefficient as Per Capita Oil Rents increase authoritarian countries
should be less likely to transition to democracy Once again however our results yield the
opposite result the coefficient is positive (although not significant)
We repeat these operations in specifications 3 and 4 substituting Windfall Profits
Per Capita as the independent variable We can now no longer use Cheibub and Gandhirsquos
(2004) version of the Przeworski et al (2000) REGIME variable This is because between
1970 and 2002 the years for which Cheibub and Gandhi provide data coverage most
countries exhibit a strictly monotonic trend in Windfall Profits Per Capita and thus the
26 To calculate the z-statistics and p-values for the coefficients that gauge the probability of transitions from autocracy to democracy we use the Delta Method because we are calculating the statistical significance for the addition of a linear term and its interaction with the lagged DV (Alternatively a Wald test of the hypothesis that β+ ξ = 0 returns the same results) All z-statistics are derived from robust standard errors clustered by country to address serial correlation and heteroskedasticity (see Beck et al 1998)
33
maximum likelihood estimation fails because convergence does not occur If we extend the
dataset to 2006 however the dominant pattern in Windfall Profits is no longer secularly
monotonic We therefore construct a binary measure from 1970 to 2006 derived from Polity
(following Gleditsch and Ward 2006) Specification 3 models the effect of increases in
Windfall Profits Per Capita on countries observed as democratic Once again the regression
produces a result with the wrong sign Specification 4 models the effect of increases in
Windfall Profits on countries that are observed as autocratic It produces a coefficient with
the predicted (negative) sign but it is very far from statistical significance
Multivariate Analyses of Hypothesis III
One potential criticism of our analyses so far is that because they estimate
country fixed effects they do not take into account countries whose Polity Scores or
binary democracy measure do not vary over time (see Ross 2008) Another potential
criticism of our tests is that they only measure countries against themselves through
before and after comparisons They therefore do not measure countries against what they
could have become during the period in which they have resources had they never
developed their oil or mineral sectors
In order to address these concerns we developed Counterfactual Polity which
measures the gap between the Polity Score of a resource dependent country and the
average Polity Score of the non-resource dependent countries in their respective regions
Therefore it exhibits time series variance even if the resource dependent countryrsquos Polity
Score does not vary Counterfactual Polity also addresses the criticism about measuring
countries against what they could have become The logic is that a resource dependent
34
country could have obtained the average Polity Score of the non-resource dependent
countries in its geographic region
Unit root and co-integration tests
We conduct the same diagnostic tests on Counterfactual that we did on Polity in
order to choose the correct functional form for the regressions We begin with
augmented Dickey-Fuller tests to investigate whether the data is stationary (see Table 2
Panels A and B) These test indicate that Counterfactual Polity is non-stationary except
for the particular sub-period 1970-2006 when it is included in a regression against
Windfall Profits on Oil or Minerals To identify if there is co-integration between
Counterfactual Polity and our resource dependence measures we again apply Maddala
and Wu (1999) augmented Dickey-Fuller tests on the residuals of a regression in which
Counterfactual Polity is regressed against resource dependence The results of these co-
integration tests are shown in Table 2 Panel C In only one of these specifications (Panel
C Column 2) do we find evidence of a long-run relationship Counterfactual Polity and
Fiscal Reliance on Resource Revenues appear to be co-integrated
Regression Specification
Our diagnostic tests indicate that the regressions of Counterfactual Polity against
Gross Oil Rents Per Capita and against Windfall Profits Per Capita should be estimated
using the ARDL framework in first differences we introduced earlier Our tests also
indicate that it is possible to model the relationship between Counterfactual Polity and
35
Fiscal Reliance on Oil or Minerals under this same ARDL framework but with a slight
twist via an Error Correction Model (ECM) interpretation27
The ECM interpretation makes three improvements to the purely first-differenced
ARDL model First it allows us to model the relationship in levels between Polity and
resource dependence Second the ECM not only allows for the evaluation of both short
and long run impacts of changes in the independent variable it also allows the estimation
of the speed at which the long-run equilibrium between the variables is restored ndash or
ldquocorrectedrdquo ndash after a short-term shock We therefore estimate a regression that can be
expressed with the following functional form
∆Yit = ∆Yit-1ρ0 +hellip+ ∆Yit-kρk + ∆Xitβ1 + ∆Xit-1β2 +hellip+ ∆Xit-kβk +δ(Yit-1 - Xit-1γ) +
niφ+ vtλ+ uit (3)
where short-run changes in Y that take a yearrsquos time to elapse are captured by the
coefficients on the differenced independent variables increases in X produce a change in
Y that also disrupts the long-term equilibrium relationship between the level of X and Y
and subsequent (lagged) changes in Y are conditioned by deviations from the long-run
equilibrium Y will respond by gradually returning to this relationship registering a total
change equal to γ Specifically when Yit-1 gt Xit-1γ (the coefficient on the lagged
independent variable in levels is negative) then Y has overshot the equilibrium in the
27 In the case of non-stationary variables that stationary after first-differencing such as Counterfactual Polity and Fiscal Reliance Engle and Granger (1987) have shown that if there is a linear combination of the non-stationary processes that is itself stationary call it yit ndash γxit then yit and xit are co-integrated with parameter γ and their time-series relationship can be depicted through an ECM framework Furthermore the latter is equivalent to an ARDL approach (see DeBoef and Keele 2008) These innovations are made possible by simply adding the stationary variable identified above yit ndash γxit to equation (1) More specifically lags of each constituent part are added so that the model now also includes yit-1 and γxit-1 and the equation (excluding control variables for simplicity) DeBoef and Keele also argue that an ECM framework is the most valid way to model the relationship between stationary time series when complex dynamics at work
36
previous period and the error correction term works to push Y back towards the equilibrium
by inducing negative changes in subsequent periods at a rate determined by δ
Alternatively when Yit-1 lt Xit-1γ (the coefficient on the lagged independent variable in
levels is positive) then Y has remained below the equilibrium in the previous period and the
error correction term induces positive changes in subsequent periods The δ term is lt 0 and
is the error correction rate so that a δ proportion of this discrepancy (or ldquoerrorrdquo) is
corrected by a movement in the dependent variable each subsequent period Finally if
Yit-1 = Xit-1γ the dependent and independent variable are in a long-run equilibrium
Table 7 presents the results of these estimations repeating the order of
specification from Table 3 The Resource Curse would predict that Counterfactual Polity
and Fiscal Reliance on Oil or Minerals will tend to revert back to their long-run
relationship over time higher fiscal reliance will lead to lower Counterfactual Polity
Capturing the process by which these two variables remain in equilibrium requires three
terms the short run shocks (represented in our model as the first-differenced versions of
Fiscal Reliance) the error correction term which is the rate at which the equilibrium is
restored (represented in our model by the lagged dependent variable in levels) and the
Long Run Multiplier which is the total effect that an increase in Fiscal Reliance has on
Counterfactual Polity spread over future time periods The resource curse would predict
negative coefficients for the first-differenced Fiscal Reliance terms as well for the Long
Run Multiplier28 Meanwhile whether there is a resource curse or a resource blessing
the error correction term should be negative since it depicts the restoration to equilibrium
28 We constructed Counterfactual Polity so that its values shrink as the average Polity Score for non resource producers becomes greater than the resource producersrsquo Polity Score
37
The coefficients in Table 7 do not yield the predicted signs The coefficients for
the short-run changes in Fiscal Reliance and for the Long Run Multiplier are positive in
every specification There also appears to be a positive short run effect (at the sixth year
lag) that enters as significant in some specifications That is regardless of how we
truncate the data set or add conditioning variables we cannot find a result that is
consistent with the resource curse None of the specifications that look for the marginal
effects of Fiscal Reliance at different levels of Per Capita Income (columns 4 5 and 6)
produce the predicted results either poor countries that become increasingly resource
dependent do not see a decline in Counterfactual Polity
As we did for our regressions on Polity we repeat the regressions on
Counterfactual Polity substituting in Gross Oil Rents Per Capita Because the latter series
is not cointegrated with Counterfactual Polity we revert to the ARDL framework in first
differences that we employed in our regressions on Polity The results of these
regressions are presented in Table 8 and are not materially different from the regression
that used Fiscal Reliance as the independent variable Some of the independent variables
that capture short run effects (lagged Gross Oil Rents) are negative and significant but
they are matched by even larger positive and significant coefficients on other lagged
terms For example in specification 1 the contemporaneous effect of a change in Gross
Oil Rents on Counterfactual Polity is negative as is the effect of a change in Gross Oil
Rents on Counterfactual Polity with a four year lag The effect of a change in Gross Oil
Rents on Counterfactual Polity with a one year lag is however positive significant and
of large magnitude relative to the other lags The net effect is captured by the Long Run
38
Multiplier which is positive In fact the LRM is positive in every specification and is
almost always significant at the 95 percent level
Table 9 repeats this process substituting Windfall Profits from Oil and Minerals
Per Capita as the independent variable If anything these results cast even stronger doubt
on the notion of a resource curse Indeed the regressions produce results that are
consistent with an argument for a resource blessing the Long Run Multipliers are always
positive and significant the independent variable lagged one period is always positive
and significant and it dwarfs any negative coefficients revealed in any other year
V Conclusion
We have developed new datasets to analyze the relationship between oil or
mineral dependence and regime types within countries over the time We observe
countries prior to their becoming resource dependent and evaluate whether increasing
resource dependence over time affected their regime type ndash both relative to their level of
democracy before resource dependence and relative to the democratization experiences of
countries that were similar to them save for resource dependence Our results indicate
that natural resource dependence does not undermine democracy preclude democratic
transitions or protract democratic transitions Our evidence also does not support the
view that there are conditional resource curse effects that are systematicmdashat least to the
degree that these conditions are captured by differences in per capita incomes This is
not to say that there may not be cases in which natural resources contributed to the
maintenance of an authoritarian regime in a particular time and placemdashindeed it would
be surprising if this never happened It is to say however that the evidence does not
39
support generalizable law-like statements about the impact of natural resources on
regime types
The implications of our analysis are clear It is not the case that oil or mineral
abundance causes countries to become autocratic It is also not the case that oil or
mineral abundance in the presence low GDP causes autocracy Rather autocracy as
well as economic reliance on oil or minerals is often jointly determined by a countryrsquos
fundamental institutions
Our results have significant methodological implications Researchers in
comparative politics are intensely interested in explaining processes that occur within
countries over time such as the rise of the welfare state transitions to democracy and the
onset of domestic conflict In studying these processes however comparativists have
tended to rely on datasets that have limited longitudinal coverage They therefore employ
pooled regression techniques treating countries as homogenous units Our results
suggest that when the theory in question is not about static cross-sectional differences
between countries but about changes that take place within countries over time
assembling and using long-run time-series datasets designed to operationalize explicitly
specified counterfactuals is a better match between theory and empirics than regressions
centered on the cross-sectional analysis of longitudinally truncated data
40
References Anderson Lisa 1987 ldquoThe State in the Middle East and North Africardquo Comparative
Politics 20 (1) 1-18 Arellano Manuel and Stephen Bond 1991 ldquoSome tests of specification for panel data
Monte Carlo evidence and an application to employment equationrdquo Review of Economic Studies 58 277-97
Bardhan Pranab 1993 ldquoSymposium on Democracy and Developmentrdquo Journal of Economic Perspectives 7 (3) 45-49
Beblawi Hazem 1987 ldquoThe Rentier State in the Arab Worldrdquo In Hazem Beblawi and Giacomo Luciani eds The Rentier State (New York Croom Helm)
Beck Nathaniel and Jonathan Katz 2004 ldquoTime-Series Cross-Section Issues Dynamicsrdquo Unpublished Manuscript
Beck Nathaniel Jonathan Katz and Richard Tucker 1998 ldquoTaking Time Seriously
Time-Series Cross-Section Analysis with a Binary Dependent Variablerdquo American Journal of Political Science 42 1260-88
Bellin Eva 2004 ldquoThe Robustness of Authoritarianism in the Middle East Exceptionalism in Comparative Perspectiverdquo Comparative Politics 36 (2) 139-57
Boix Carles and Sebastian Rosato 2001 ldquoA Complete Data Set of Political Regimes 1800-1999rdquo Department of Political Science University of Chicago
Central Intelligence Agency The World Factbook 2008 httpswwwciagovlibrarypublicationsthe-world-factbook
Chaudhry Kiren Aziz 1989 ldquoThe Price of Wealth Business and State in Labor Remittance and Oil Economiesrdquo International Organization 43 (1) 101ndash45
Chaudhry Kiren Aziz 1994 ldquoEconomic Liberalization and the Lineages of the Rentier Staterdquo Comparative Politics 27 1-25
Chaudry Kiren Aziz 1997 The Price of Wealth Economies and Institutions in the Middle East Ithaca NY Cornell University Press
Cheibub Jose-Antonio and Jennifer Gandhi 2004 ldquoClassifying Political Regimes A Six-Fold Classification of Democracies and Dictatorshipsrdquo Department of Political Science Yale University
Clark John 1997 ldquoPetro-Politics in Congordquo Journal of Democracy 8 (3) 62-76 Clark John 1998 ldquoThe Nature and Evolution of the State in Zairerdquo Studies in
Comparative International Development 32 (4) Collier Paul 2007 The Bottom Billion Why the Poorest Countries Are Falling Behind
and What Can Be Done About It Oxford Oxford University Press Conley John and Akram Temini 2001 ldquoEndogenous Enfranchisement When Groups
Preferences Conflictrdquo Journal of Political Economy 109 (1) 79-102 Crystal Jill 1989 ldquoCoalitions in Oil monarchies Kuwait and Qatarrdquo Comparative
Politics 21 427ndash43 Crystal Jill 1990 Oil and Politics in the Gulf Rulers and Merchants in Kuwait and
Qatar New York Cambridge University Press Cutler David Angus Deaton and Adriana Lleras-Muney 2006 ldquoThe Determinants of
Mortalityrdquo Journal of Economic Perspectives Volume 20 (3) 97-120
41
Daveri Francesco and Guido Tabellini 1997 ldquoUnemployment Growth and Taxation in Industrial Countriesrdquo London Centre for Economic Policy Research Discussion Paper 1681
David Paul and Gavin Wright 1997 ldquoIncreasing Returns and the Genesis of American Resource Abundancerdquo Industrial and Corporate Change 6 (2) 203-45
DeBoef Suzanna and Luke Keele 2008 ldquoTaking Time Seriouslyrdquo American Journal of Political Science Volume 52(1) 184-200
Dillman Bradford L 2000 State and Private Sector in Algeria The Politics of Rent-Seeking and Failed Development Boulder CO Westview Press
Driscoll John and Aart Kraay 1998 ldquoConsistent Covariance Matrix Estimation with Spatially Dependent Panel Datardquo Review of Economics and Statistics 80 549-560
Dunning Thad 2008 Crude Democracy Natural Resource Wealth and Political Regimes New York Cambridge University Press Engle Robert and Clive Granger 1987 ldquoCointegration and Error Correction
Representation Estimation and Testingrdquo Econometrica Volume 55(2) 251-76 Englebert Pierre 2000 State Legitimacy and Development in Africa Boulder Lynne
Rienner Publishers Fisher RA 1932 Statistical Methods for Research Workers Edinburgh England Oliver
and Boyd Gardinier David E 2000 ldquoFrance and Gabon Since 1993 The Reshaping of the Neo-
Colonial Relationshiprdquo Journal of Contemporary African Studies 18 225-42 Gasiorowski Mark 1995 ldquoEconomic Crisis and Political Regime Change An Event
History Analysisrdquo American Political Science Review 89 (December) 882-97 Gleditsch Kristian and Michael D Ward 2006 Diffusion and the International
Context of Democratization International Organization 60 (4) 911-933 Goldberg Ellis Eric Wibbels and Eric Myukiyehe 2008 ldquoLessons from Strange
Cases Democracy Development and the Resource Curse in the US Statesrdquo Comparative Political Studies 41 477-514
Granger Clive 1981 ldquoSome Time-Series Data and their use in Econometric Model Specificationrdquo Journal of Econometrics 16 121-130
Granger CWJ and P Newbold 1974 ldquoSpurious Regressions in Econometricsrdquo Journal of Econometrics 2 111-120
Jaggers Keith and Marshall Monty 2005 Polity IV Codebook George Mason University Arlington VA
Haber Stephen 2006 ldquoAuthoritarian Governmentrdquo In Barry Weingast and Donald Wittman eds The Oxford Handbook of Political Economy (Oxford University Press) pp 693-707
Haber Stephen Armando Razo and Noel Maurer 2003 The Politics of Property Rights Political Instability Credible Commitments and Economic Growth in Mexico 1876-1929 New York Cambridge University Press
Haber Stephen Noel Maurer and Armando Razo 2003 ldquoWhen the Law Does Not Matter The Rise and Decline of the Mexican Oil Industryrdquo The Journal of Economic History 63 (1) 1-31
Hamilton Kirk and Michael Clemens 1999 ldquoGenuine Savings Rates in Developing Countriesrdquo World Bank Economic Review 13 333-56
42
Harford Tim and Michael Klein 2005 ldquoAid and the Resource Curserdquo Public Policy for the Private Sector 291
Herb Michael 1999 All in the Family Absolutism Revolution and Democracy in the Middle Eastern Monarchies Albany NY State University of New York Press
Herb Michael 2005 ldquoNo Representation without Taxation Rents Development and Democracyrdquo Comparative Politics 37 297-317
Herbst Jeffrey 2000 States and Power in Africa Comparative Lessons in Authority and Control (Princeton University Press)
Heston Alan Robert Summers and Bettina Aten 2004 Penn World Table Version 61 Center for International Comparisons at the University of Pennsylvania (CICUP)
Hodges Tony 2001 Angola From Afro-Stalinism to Petro-Diamond Capitalism Bloomington IN Indiana University Press
Huntington Samuel 1991 The Third Wave Democratization in the Late Twentieth Century Norman OK University of Oklahoma Press
Jensen Nathan and Leonard Wantchekon 2004 ldquoResource Wealth and Political Regimes in Africardquo Comparative Political Studies 37 816ndash41
Jones Luong Pauline and Erica Weinthal 2006 ldquoRethinking the Resource Curse Ownership Structure Institutional Capacity and Domestic Constraintsrdquo Annual Review of Political Science 9 241-63
Judson Ruth and Ann Owen 1999 ldquoEstimating dynamic panel data models a guide for macroeconomistsrdquo Economic Letters 65 9-15
Karl Terry Lynn 1997 The Paradox of Plenty Oil Booms and Petro-States Berkeley CA University of California Press
Khan Sara Ahmad 1994 Nigeria The Political Economy of Oil Oxford Oxford University Press
Kittel Bernhard and Hannes Winner 2005 ldquoHow Reliable is Pooled Analysis in Political Economy The Globalization-Welfare State Nexus Revisitedrdquo European Journal of Political Research 44 269-293
Lederman Daniel and William F Maloney (eds) 2007 Natural Resources Neither Curse nor Destiny World BankStanford University Press
Lederman Daniel and William F Maloney 2008 In Search of the Missing Resource Curse Economiacutea 9(1) 1-53
Lees GM 1940 ldquoThe Search for Oilrdquo The Geographical Journal Volume XCV(1) 1- 16
Lipset Seymour Martin 1959 ldquoSome Social Requisites of Democracy Economic Development and Political Legitimacyrdquo American Political Science Review 53 69-105
Lizzeri Alessandro and Nicola Persico 2004 ldquoWhy did the Elites Extend the Suffrage Democracy and the Scope of Government with an Application to Britainrsquos lsquoAge of Reformrsquordquo The Quarterly Journal of Economics 119 (2) 707-765
Llavador Humberto and Robert Oxoby 2005 ldquoPartisan Competition Growth and the Franchiserdquo The Quarterly Journal of Economics 120 (3) 1155-1189
Luciani Giacomo 1987 ldquoAllocation versus Production States A Theoretical Frameworkrdquo In Hazem Beblawi and Giacomo Luciani eds The Rentier State (New York Croom Helm)
Lusigi Angela and Colin Thirtle 1997 ldquoTotal Factor Productivity and the Effects of
43
RampD in African Agriculturerdquo Journal of International Development 9 529-538 Maddala GS and Shaowen Wu 1999 ldquoA Comparative Study of Unit Root Tests with
Panel Data and a New Simple Testrdquo Oxford Bulletin of Economics and Statistics Special Issue 631-652
Mahdavy Hussein 1970 ldquoThe Patterns and Problems of Economic Development in Rentier States The Case of Iranrdquo In MA Cook ed Studies in the Economic History of the Middle East (London England Oxford University Press)
Manzano Osmel and Roberto Rigobon 2007 ldquoResource Curse or Debt Overhangrdquo In Daniel Lederman and William F Maloney eds Natural Resources Neither Curse nor Destiny World BankStanford University Press
Marshall Monty and Keith Jaggers 2008 ldquoPolity IV Project Political Regime Characteristics and Transitions 1800-2006rdquo University of Maryland
McSherry Brendan 2006 ldquoThe Political Economy of Oil in Equatorial Guineardquo African Studies Quarterly 8 23-45
Nickell Stephen 1981 ldquoBiases in Dynamic Models with Fixed Effectsrdquo Econometrica 49 1417ndash26
Norman Catherine Forthcoming ldquoRule of Law and the Resource Curse Abundance Versus Intensityrdquo Environmental Resource Economics
North Douglass and Barry Weingast 1989 ldquoConstitutions and Commitment The Evolution of Institutional Governing Public Choice in Seventeenth-Century England The Journal of Economic History Volume 49(4) 803-832
Papaioannou Elias and Gregorios Siourounis 2008 ldquoEconomic and Social Factors Driving the Third Wave of Democratizationrdquo CEPR Discussion Paper DP6986
Pesaran M Hashiem Yongcheol Shin and Richard Smith 1999 ldquoPooled Mean Group Estimation of Dynamic Heterogeneous Panelsrdquo Journal of the American Statistical Association 94 621-634
Pesaran M Hashiem Yongcheol Shin and Richard Smith 2001 ldquoBounds Testing Approaches to the Analysis of Level Relationshipsrdquo Journal of Applied Econometrics 16 289-326
Phillips PCB 1986 ldquoUnderstanding Spurious Regressions in Econometricsrdquo Journal of Econometrics 33 311-340
Przeworski Adam Michael Alvarez Joseacute Antonio Cheibub and Fernando Limongi (2000) Democracy and Development Political Institutions and Well-Being in the World 1950-1990 New York Cambridge University Press
Ramsey Kevin 2008 ldquoThe Price of Oil and Democracyrdquo Mimeo Princeton University Update citation
Rosenberg Tina 2007 ldquoThe Perils of Petrocracyrdquo The New York Times Magazine (November 4)
Ross Michael 1999 ldquoThe Political Economy of the Resource Curserdquo World Politics 51 297-322
Ross Michael 2001a ldquoDoes Oil Hinder Democracyrdquo World Politics 53 325-61 Ross Michael 2001b Extractive Sectors and the Poor Washington DC Oxfam
America Ross Michael 2004 ldquoDoes Taxation Lead to Representationrdquo British Journal of
Political Science 34 229-49 Ross Michael 2006 ldquoA Closer Look at Oil Diamonds and Civil Warrdquo Annual Review
44
of Political Science 9 265-300 Skocpol Theda 1982 ldquoState and Shirsquoa Islam in the Iranian Revolutionrdquo Theory and
Society 11 (3) 265-83 Smith Benjamin 2004 ldquoOil Wealth and Regime Survival in the Developing World
1960-1999rdquo American Journal of Political Science 48 (2) 232-46 Smith Benjamin 2007 Hard Times in the Land of Plenty Oil Politics in Iran and
Indonesia Ithaca NY Cornell University Press Soares Rodrigo 2007 ldquoOn the Determinants of Mortality Reductions in the Developing
Worldrdquo Population and Development Review 33(2) 247-287 Stasavage David 2003 Public Debt and the Birth of the Democratic State France and
Great Britain 1688-1789 Cambridge England Cambridge University Press Summerhill William 1997 ldquoTransport Improvements and Economic Growth in Brazil
and Mexicordquo In Stephen Haber ed How Latin America Fell Behind Essays on the Economic Histories of Brazil and Mexico 1800-1914 (Stanford University Press Stanford CA pp 93-117)
Ulfelder Jay 2007 ldquoNatural Resource Wealth and the Survival of Autocraciesrdquo Comparative Political Studies 40 (8) 995-1018
Van de Walle Nicolas 1994 ldquoNeopatrimonialism and Democracy in Africardquo In Jennifer Widner ed Economic Change and Political Liberalization in Sub-Saharan Africa (Baltimore Maryland Johns Hopkins University Press)
Vandewalle Dirk 1998 Libya since Independence Oil and State-Building Ithaca NY Cornell University Press
Vandewalle Dirk 2006 A History of Modern Libya New York Cambridge University Press
Wantchekon Leonard 2002 ldquoWhy do Resource Dependent Countries Have Authoritarian Governmentsrdquo Journal of African Finance and Economic Development 2 57ndash77
Williams Rick 2000 ldquoA Note on Robust Variance Estimation for Cluster-correlated Datardquo Biometrics 56 645-646
Woodridge Jeffrey 2006 Introductory Econometrics A Modern Approach Mason OH Thompson South-Western
World Bank 2008 World Development Indicators Washington DC World Bank httpddp-extworldbankorgextDDPQQmemberdomethod=getMembers
Wright Gavin and Jessie Czelusta 2004 The Myth of the Resource Curse Challenge 47 6-38
Yates Douglas A 1996 The Rentier State in Africa Oil Rent Dependency and Neocolonialism in the Republic of Gabon Trenton NJ Africa World Press
45
Figure 1Trinidad and Tobago Resource Reliance and Polity 1960-2006
Polity (left axis)
Fiscal Reliance (left axis)
Gross Oil Rents (right axis)
Windfall Profits (right axis)
0
10
20
30
40
50
60
70
80
90
10019
6219
6319
6419
6519
6619
6719
6819
6919
7019
7119
7219
7319
7419
7519
7619
7719
7819
7919
8019
8119
8219
8319
8419
8519
8619
8719
8819
8919
9019
9119
9219
9319
9419
9519
9619
9719
9819
9920
0020
0120
0220
0320
0420
0520
06
Polit
y an
d Fi
scal
Rel
ianc
e
0
1000
2000
3000
4000
5000
6000
7000
8000
Win
dfal
l Pro
fits
and
Gro
ss O
il R
ents
Per
Cap
ita 2
007
US$
Polity Fiscal Reliance Gross Oil Rents Per Capita Windfall Profits Oil and Minerals Per Capita
46
Figure 2Nigeria Resource Reliance and Polity 1960-2006
Polity (left axis) Fiscal Reliance on Oil (left axis)
Gross Oil Rents (right axis)
Windfall Profits (right axis)
0
10
20
30
40
50
60
70
80
90
100
196019
6119
6219
6319
6419
6519
6619
6719
6819
6919
7019
7119
7219
7319
7419
7519
7619
7719
7819
7919
8019
8119
8219
8319
8419
8519
8619
8719
8819
8919
9019
9119
9219
9319
9419
9519
9619
9719
9819
9920
0020
0120
0220
0320
0420
0520
06
Polit
y an
d Fi
scal
Rel
ianc
e on
Oil
0
200
400
600
800
1000
1200
Win
dfal
l Pro
fits
and
Gro
ss O
il R
ents
Per
Cap
ita 2
007
US$
Polity Fiscal Reliance Gross Oil Rents Per Capita Windfall Profits Oil and Minerals Per Capita
47
Figure 3Mexico Resource Reliance and Polity 1822-2006
Polity (left axis)
Fiscal Reliance (left axis)
Gross Oil Rents (right axis)
Windfall Profits (right axis)
0
10
20
30
40
50
60
70
80
90
10018
2218
2618
3018
3418
3818
4218
4618
5018
5418
5818
6218
6618
7018
7418
7818
8218
8618
9018
9418
9819
0219
0619
1019
1419
1819
2219
2619
3019
3419
3819
4219
4619
5019
5419
5819
6219
6619
7019
7419
7819
8219
8619
9019
9419
9820
0220
06
Polit
y an
d Fi
scal
Rel
ianc
e
0
200
400
600
800
1000
1200
Win
dfal
l Pro
fits
and
Gro
ss O
il R
ents
Per
Cap
ita 2
007
US$
Polity Fiscal Reliance Gross Oil Rents Per Capita Windfall Profits Oil and Minerals Per Capita
48
Figure 4Angola Resource Reliance and Polity 1970-2006
Polity (left axis)
Fiscal Reliance (left axis)
Gross Oil Rents (right axis)
Windfall Profits (right axis)
0
10
20
30
40
50
60
70
80
90
10019
70
1972
1974
1976
1978
1980
1982
1984
1986
1988
1990
1992
1994
1996
1998
2000
2002
2004
2006
Polit
y an
d Fi
scal
Rel
ianc
e
0
400
800
1200
1600
2000
2400
Win
dfal
l Pro
fits
and
Gro
ss O
il R
ents
200
7 U
S$
Polity Fiscal Reliance Gross Oil Rents Per Capita Oil and Mineral Windfall Profits Per Capita
49
50
Figure 5 Indonesia Resource Reliance and Polity 1945-2006
Polity (left axis)
Fiscal Reliance (left axis)
Gross Oil Rents (right axis)
Windfall Profits(right axis)30
40
50
60
70
80
90
100
1989
1991
1993
1995
1997
1999
2001
2003
2005
Polit
y an
d Fi
scal
Rel
ianc
e
0
50
100
150
200
250
300
350
400
Win
dfal
l Pro
fits
and
Gro
ss O
il R
ents
200
7 U
S$
0
10
20
1945
1947
1949
1951
1953
1955
1957
1959
1961
1963
1965
1967
1969
1971
1973
1975
1977
1979
1981
1983
1985
1987
Polity Fiscal Reliance Gross Oil Rents Per Capita Windfall Profits Oil and Minerals Per Capita
Table 1 Summary Statistics of the within variation for Dependent Variables and Co-variates included in Regression Models
Summary Statistics for Resource Dependence and Regime Type measures
Panel A 1800-2006 Fiscal Reliance as independent variable 1776-2006 Gross Oil Rents as independent variable 1970-2006 Windfall Profits as independent variableFiscal Reliance Polity CF Polity Gross Oil Rents Polity CF Polity Windfall Profits Polity CF Polity
Mean 21 34 -6664 $3083 46 -1763 $677 56 -0673Minimum 0 0 -60 0 0 -83947 0 0 -8025Maximum 978 100 85 $79093 100 95 $6286 100 91667Standard Deviation 214 22937 18389 1675 24475 18742 2157 20242 15769
Resource measure observations of countries Mean of T observations of countries Mean of T observations of countries Mean of Tpanel statistics 1654 17 97 14111 164 86 4695 153 31
Panel B∆Fiscal Reliance ∆Polity ∆CF Polity ∆Gross Oil Rents ∆Polity ∆CF Polity ∆Windfall Profits ∆Polity ∆CF Polity
Mean 0324 0354 -0073 $783 0237 -0136 $16 0688 -0088Minimum -3768 -70 -70623 -$22822 -95 -89515 -$18623 -75 -775Maximum 67857 75 66379 $46942 80 76666 $3691 80 73462Standard Deviation 5802 6531 7674 1000 7505 7433 1433 8883 8627
Resource measure observations of countries Mean of T observations of countries Mean of T observations of countries Mean of Tpanel statistics 1610 17 95 13879 164 85 4529 152 30
Summary Statistics for Control Variables (observed over Gross Oil Rents panel)Panel C
Per Capita GDP Econ Growth Rate Democ World Democ Region ∆Per Capita GDP ∆Growth Rate ∆ Dem World ∆ Dem Region
Mean $5981 2 24 25 $1329 0111 03 04Minimum $256 78 0 0 -$3469 -75 -6 -67Maximum $37304 -46 49 100 $3570 110 6 67Standard Deviation 3069 634 10 21 324 7977 1385 3368
Fiscal Reliance is Fiscal Reliance on Resource Revenues Polity is Polity 2 Score normalized to run from 0 to 100 CF Polity is Counterfactual Polity Polity - Polity Score of non-resourceproducers average Polity Score in the countrys geographic-cultural region (see text for coding critera) Gross Oil Rents is Per Capita Gross Oil Rents (see text for construction) Windfall Profits is Per Capita Windfall Profits on Resources (see text for construction) Per Capita GDP is Real Per Capita GDP Econ Growth Rate is the yearly rate of growth of GDP Per Capita Democ World is the percent of democracies in the world in year t Democ Region is the percent of democracies in the region of the world of each country by year ∆ is the first-difference operator Summary statistics for resource dependence measures only for country-years in which Polity Score values are not set to missing summary statistics for Polity only for country-years in which the relevant resource dependence measure is not set to missing summary statistics for control variables only for country-years in which Polity Scores are not set to missing and Gross OilRents are not set to missing
51
52
Table 2 Maddala and Wu (1999) unit root and co-integration tests (Augmented Dickey Fuller Tests for unbalanced panel datasets)
Unit Root tests null hypothesis is that the data follows a Random Walk without Drift
Panel A 1800-2006 Fiscal Reliance as independent variable 1776-2006 Gross Oil Rents as independent variable 1970-2006 Windfall Profits as independent variableFiscal Reliance Polity CF Polity Gross Oil Rents Polity CF Polity Windfall Profits Polity CF Polity
Chi-square statistic 4096 11841 38706 335707 182091 325941 105613 275425 704289p-value 0192 0999 0266 002 1 0459 1 0862 0 lags included 16 8 6 20 16 9 10 5 5trend included YES YES NO YES YES NO YES YES NOstationary NO NO NO YES NO NO NO NO YES
Panel B∆Fiscal Reliance ∆Polity ∆CF Polity ∆Gross Oil Rents ∆Polity ∆CF Polity ∆Windfall Profits ∆Polity ∆CF Polity
Chi-square statistic 14383 13639 270901 519258 1505264 345437 467064p-value 0 0 0 0 0 0041 0 lags included 15 7 5 15 8 10 4trend included NO YES NO YES NO YES YESorder of integration I (1) I (1) I (1) I (0) I (1) I (1) I (0) I (1) I (0)
Co-integration tests unit root test on the residuals of a two-way fixed effects modelPanel C
Polity and Fiscal Reliance CF Polity and Fiscal Reliance Polity and Windfall ProfitsChi-square statistic 1701 47239 310422p-value 0993 0065 0271 lags included 15 6 10trend included NO NO NOCo-integration NO YES NOEstimation strategy ∆ARDL ECM ∆ARDL
significant at the 01 level 05 level 10 levelUnit-root and co-integration tests are Maddala-Wu-Fisher versions of Dickey Fuller tests This test combines the results of the country by country unit root tests each with p-value Pi and yields the following test-statistic -2Σlog(Pi) distributed chi-square with 2N degrees of freedom (see Maddala and Wu 1999 636) Time trend included in unit root tests when it was significant at conventional levels no series found to follow a Random Walk with drift Fiscal Reliance is Fiscal Reliance on Resource Revenues Polity is Polity Score CF Polity is Counterfactual Polity Gross Oil Rents is Per Capita Gross Oil Rents Windfall Profits is Per Capita Windfall Profits on Resources ∆ is first-difference operator I (n) denotes that data series is integrated of order n of lags of the dependent variable included in the test are selected by the Akaike Information Criterion The AIC choose lag length p to minimize log(SSR(p)n)+(p+1)2n where SSR(p) is the sum of squared residuals for the Vector Autoregression Model (VAR) with p lags and n is the number of observations ECM = Error Correction Model ∆ARDL = Autoregressive Distributed Lagmodel in first differences Co-integration tests are augmented Dickery Fuller tests on the residuals from a regression of Regime Type against Resource Dependence measure Because thistest relies on no cross-country correlation between observations we run each regression with year dummies and use Driscoll-Kraay standard errors which are robust to contemporaneous correlation and serial correlation (see Driscoll and Kraay 1998) We also include country dummies to control for unobserved heterogeneity For the co-integration tests if we reject the Ho thatthe spead between both variables is non-stationary this evidences that the data-series are co-integrated
Table 3 Autoregressive Distributed Lag Panel Data Model in First Differences
Dependent Variable is ∆Polity (Polity 2 Score normalized to vary from 0 to 100)
ARDL (115) ARDL (16) ARDL (16) ARDL (16) ARDL (16) ARDL (16)1 2 3 4 5 6
1800-2006 1950-2006 1950-2006 1950-2006 1950-2006 1973-2006∆Polity t-1 0059 0055 0027 0026 0026 0027
[145] [166] [091] [092] [085] [073] of Fiscal Reliance lags included 15 6 6 6 6 6AIC statistic for of lags chosen 6603 7719 7664 7668 7824 8039F-test for all lags of Fiscal Reliance 17523 146 173 138 157 184p-value 0 025 01711 0278 0216 0147Long-run Multiplier total change due 0354 0349 033 0328 0331 0337to a permanent change in Fiscal Rel [138] [155] [186] [182] [164] [153]∆Fiscal Reliance on 0002 0009 002 0019 004 0066Natural Resources [006] [036] [068] [048] [096] [120]∆Fiscal Reliance t-6 0157 016 0147 0147 0152 015
[219] [223] [231] [229] [210] [199]∆Fiscal Reliance t-15 004
[064]∆Fiscal Reliance X ∆ Log(Per 0015Capita GDP) [008]∆Fiscal Reliance X ∆ Log(Per 1202 1089Capita GDP) t-6 [122] [118]Marginal effect of Fisc Rel at 0019 0141 013325th Percentile of FD Log(PCGDP) [046] [186] [166]Marginal effect of Fisc Rel at 0018 0128 016750th Percentile of FD Log(PCGDP) [044] [158] [228]Marginal effect of Fisc Rel at 0019 0208 01975th Percentile of FD Log(PCGDP) [059] [283] [257]∆Log(Per Capita GDP) 3777 3641 3023 6329
[057] [050] [041] [068]∆Log(Per Capita GDP) t-6 1241 1931
[018] [026]∆ Growth of GDP Per Capita -0013 -0013 -0016 -0018
[019] [019] [021] [021]∆ Democracies in the Region 001 001 -0007 -0043
[012] [012] [008] [043]∆ Democracies in the World -1743 -1742 0173 0525
[098] [098] [048] [099]Democratic Transition in Region 25336 2534 25208 29608Dummy [322] [323] [336] [339]F-test for country dummies 5459312 69793 100205 1156801 82000 5095767p-value 0 0 0 0 0 0F-test for year dummies 583 488 757 86 2857 862p-value 00004 00014 00001 0 0 0Arellano Bond AR(1) serial 064 007 01 011 009 062correlation test 05239 09466 0924 0914 0931 0532Observations 1226 577 567 517 567 431R-squared 016 016 024 025 024 027
Robust t statistics clustered by country in brackets
included but not reported year dummies included but not reported lags of dependent variable to include based onthe minimization of AIC statistic only 1 lag selected which fully eliminates AR(1) and higher-order serial correlation lags of Fiscal Reliance to include calculated based on minimization of AIC statistic all lags of Fiscal Relianceincluded but only relevant lags reported Long-run Multiplier (LRM)(contemporaneous Fiscal Reliance + lags of Fiscal Reliance)(1-coefficient on lagged dependent variable) standarderror for LRM calculated via Delta Method marginal effect of Fiscal Reliance conditioned by ∆Log(Per Capita GDP)in interaction models calculated at different percentiles of ∆Log(PCGDP) standard error for marginal effectscalculated via Delta Method
53
Table 4 Autoregressive Distributed Lag Panel Data Model in First Differences
Dependent Variable is ∆Polity (Polity 2 Score normalized to vary from 0 to 100)
ARDL (94) ARDL (75) ARDL (75) ARDL (75) ARDL (75) ARDL (75)1 2 3 4 5 6
1778-2006 1950-2006 1950-2006 1950-2006 1950-2006 1973-2006∆Polity t-1 0012 -0009 -0039 -0039 -0039 -0032
[071] [037] [183] [183] [182] [168] of Gross Oil Rents lags included 4 5 5 5 5 5AIC statistic for of lags chosen 6861 727 7092 7092 7093 7152F-test for all lags of Gross Oil Rents 158 062 111 099 111 098p-value 016 0712 0357 0431 0359 0442Long-run Multiplier total change due -002 0175 0139 0152 0139 0138to a permanent change in Oil Rents [028] [120] [110] [111] [113] [106]∆Per Capita Gross Oil Rents -0058 -0042 -0061 -0054 -0057 -0042
[239] [077] [100] [097] [089] [067]∆Per Capita Gross Oil Rents 0013 0084 0104 0101 01 0103t-1 [052] [160] [200] [188] [204] [196]∆Per Capita Gross Oil Rents 0001 -0011 -0036 -0034 -004 -0037t-4 [007] [017] [058] [055] [063] [059]∆Per Capita Gross Oil Rents 0076 0036 0038 0033 0026t-5 [066] [034] [034] [030] [024]∆Gross Oil Rents X ∆ Log(Per -0253Capita GDP) [055]∆Gross Oil Rents X ∆ Log(Per 0115 0028Capita GDP) t-1 [022] [005]Marginal effect of Oil Rents at -0053 01 010225th Percentile of FD Log(PCGDP) [095] [203] [194]Marginal effect of Oil Rents at -006 0102 010350th Percentile of FD Log(PCGDP) [100] [201] [195]Marginal effect of Oil Rents at -0066 0105 010475th Percentile of FD Log(PCGDP) [100] [188] [185]∆Log(Per Capita GDP) -036 -0336 8958 18222
[011] [010] [056] [094]∆Log(Per Capita GDP) t-1 -9723 -19061
[065] [103]∆ Growth of GDP Per Capita 001 001 -0084 -019
[038] [038] [055] [101]∆ Democracies in the Region 0261 0261 0261 0277
[332] [332] [332] [297]∆ Democracies in the World -0092 -0092 -0093 0109
[029] [029] [029] [039]Democratic Transition in Region 32708 32708 32704 31215Dummy [1136] [1136] [1136] [978]F-test for country dummies 16000000 13000000 160000 130000 370000 68138p-value 0 0 0 0 0 0F-test for year dummies 15000000 264 258 258 259 221p-value 0 0 0 0 0 0001Arellano Bond AR(1) serial 013 -01 022 022 023 -095correlation test 0894 092 0828 0828 0821 0341Observations 12037 5435 5376 5376 5376 4109R-squared 005 006 022 022 022 024
Robust t statistics clustered by country in brackets
significant at 10 significant at 5 significant at 1 intercept included but not reported country dummies included but not reported year dummies included but not reported lags of dependent variable toinclude based on the minimization of AIC statistic all lags of dependent variable included but only first lag reported lags of resource dependence to include calculated based on minimization of AIC statistic all lags ofresource dependence included but only relevant lags reported Long-run Multiplier (LRM) (contemporaneousresource dependence + lags of resource dependence)(1-coefficient on addition of lags of dependent variables) standard error for LRM calculated via Delta Method marginal effect of resource dependence as conditioned by ∆Log(Per Capita GDP) in interaction models calculated at different percentiles of ∆Log(PCGDP) standard error for marginal effects calculated via Delta Method
54
55
Table 5 Autoregressive Distributed Lag Panel Data Model in First Differences
Dependent Variable is ∆Polity (Polity 2 Score normalized to vary from 0 to 100)
ARDL (53) ARDL (53) ARDL (53) ARDL (53)1 2 3 4
1970-2006 1970-2006 1970-2006 1970-2006∆Polity t-1 0008 -0023 -0023 -0022
[035] [124] [124] [119] of Windfall Profits lags included 3 3 3 3AIC statistic for of lags chosen 7312 7159 7159 7159F-test for all lags of Windfall Profits 203 092 088 104p-value 0094 0454 0477 0387Long-run Multiplier total change due 0012 0211 0218 0226to a permanent change in WP [019] [136] [135] [146]∆Per Capita Windfall Profits -0054 0002 0007 0006on Natural Resources [184] [004] [011] [009]∆Per Capita Windfall Profits 0004 0043 0049 0051t-3 [024] [067] [063] [078]∆Windfall Profits X ∆ Log(Per -018Capita GDP) [027]∆Windfall Profits X ∆ Log(Per -0236Capita GDP) t-1 [031]Marginal effect of Windfall Profits at 0009 011525th Percentile of FD Log(PCGDP) [013] [166]Marginal effect of Windfall Profits at 0003 010950th Percentile of FD Log(PCGDP) [006] [150]Marginal effect of Windfall Profits at -0001 012275th Percentile of FD Log(PCGDP) [001] [133]∆Log(Per Capita GDP) -0403 -0395 2284
[009] [009] [088]∆Log(Per Capita GDP) t-1 -241
[097]∆ Growth of GDP Per Capita -0009 -0009 -0241
[029] [029] [097]∆ Democracies in the Region 0264 0264 0264
[268] [268] [268]∆ Democracies in the World 0144 0143 0145
[050] [050] [051]Democratic Transition in Region 31499 3145 31489Dummy [902] [902] [902]F-test for country dummies 916272 2650502 150000 2941999p-value 0 0 0 0F-test for year dummies 195 192 192 191p-value 0004 0006 0006 0006Arellano Bond AR(1) serial -103 -158 -158 -154correlation test 0303 0113 0113 0125Observations 3998 3822 3822 3822R-squared 006 023 023 024
Robust t statistics clustered by country in brackets
significant at 10 significant at 5 significant at 1 intercept included but not reported country dummies included but not reported year dummies included but not reported lags of dependent variable toinclude based on the minimization of AIC statistic all lags of dependent variable included but only first lag reported lags of resource dependence to include calculated based on minimization of AIC statistic all lags ofresource dependence included but only relevant lags reported Long-run Multiplier (LRM) (contemporaneousresource dependence + lags of resource dependence)(1-coefficient on addition of lags of dependent variables) standard error for LRM calculated via Delta Method marginal effect of resource dependence as conditioned by ∆Log(Per Capita GDP) in interaction models calculated at different percentiles of ∆Log(PCGDP) standard errorfor marginal effects calculated via Delta Method
56
Table 6 Determinants of Transition from Democracy to Autocracy and from Autocracy to Democracy (Dynamic Conditional Fixed Effects Logit Transition Model First-order Markov Chain)
Dependent Variable is Binary Measure of Democracy (coded 1 if regime is autocracy and 0 if regime is democracy)
Model 1 Model 2Measure of Democracy used REGIME Polity binary regime transitioning from Democracy Autocracy Democracy Autocracyregime transitioning to Autocracy Democracy Autocracy DemocracyMeasure of Resources used Gross Oil Rents Windfall Profits
1950-2002 1970-2006
Per Capita Resource Reliance -1588 0357 -1332 -0891t-1 [142] [043] [086] [043]Log(Per Capita GDP) -0243 0746 -1235 1083t-1 [036] [116] [105] [077] Growth of GDP Per Capita -0081 -0051 0027 -0036t-1 [255] [191] [092] [150] Democracies in the Region -0015 -0005 -0033 0035t-1 [086] [026] [138] [155] Democracies in the World -0171 018 0001 0209t-1 [175] [006] [002] [312]Democratic Transition in Region -0482 1767 -14581 droppedt-1 [043] [250] [2793]
Year dummies Yes Yes
Pseudo R-squared 0764 0783Observations 2556 1681
Robust z statistics clustered by country in brackets
significant at 10 significant at 5 significant at 1 intercept included but not reported year dummies included but not reported REGIME iselectoral measure of democracy as developed by Przeworski et al (2000) and coded and expanded by Cheibub and Ghandi (2004) and Boix and Rosato (2001) Polity binary is coded as 1 if the Polity Score is less than 6 on the -10 to +10 Combined Polity 2 scale and coded 0 if it is 7 or morePolity-based measure of democracy used in Model 4 instead of REGIME because there is not enough within-country variance for Per Capita WindfallProfits between 1970 and 2002 most countries exhibit a monotonic trend and therefore convergence fails to occur when REGIME is the dependentvariable
Table 7 Autoregressive Distributed Lag Panel Data Model Error Correction Framework
Dependent Variable is ∆Counterfactual Polity (see text for construction)
ARDL (36) ARDL (36) ARDL (36) ARDL (36) ARDL (36) ARDL (36)1 2 3 4 5 6
1800-2006 1950-2006 1950-2006 1950-2006 1950-2006 1973-2006Long-run EffectsFiscal Reliance t-1 0011 0045 0026 0053 0075 0007
[051] [120] [058] [100] [137] [008]Long-run Multiplier total effect due to 0195 0314 0184 0379 0475 0042a permanent change in Fiscal Reliance [049] [121] [061] [107] [143] [008]Fiscal Reliance t-1 X Log(Per -0023 -0025 0008Capita GDP t-1) [118] [121] [027]Marginal effect of Fisc Rel at 0035 0055 001525th Percentile of Log(PCGDP) [078] [119] [023]Marginal effect of Fisc Rel at 015 0034 002250th Percentile of Log(PCGDP) [037] [080] [038]Marginal effect of Fisc Rel at 0001 0019 002775th Percentile of Log(PCGDP) [002] [043] [048]Log(Per Capita GDP) t-1 3091 4395 5991 5287
[161] [211] [261] [142] Growth of GDP Per Capita -0106 -0144 -0071 -0531t-1 [038] [040] [017] [071] Democracies in the Region 0028 0032 0018 0013t-1 [068] [078] [034] [019] Democracies in the World -0075 -0101 -008 0022t-1 [033] [043] [029] [010]Short-run EffectsCounterfactual Polity t-1 -0057 -0142 -014 -0139 -0158 -0169(Error Correction) [249] [428] [414] [405] [447] [385]∆Fiscal Reliance on 0023 0017 0048 0048 0076 0095Natural Resources [066] [034] [099] [086] [134] [173]Number of Fisc Rel lags included 6 6 6 6 6 6AIC statistic for of lags chosen 6895 7827 7738 7744 7892 8103F-test for all lags of Fisc Rel 246 213 184 176 121 138p-value 0071 01 0148 0165 0351 0279∆Fiscal Reliance t-6 0127 0119 0133 0138 0126 0128
[173] [162] [249] [257] [212] [189]∆Fiscal Reliance X ∆ Log(Per -0023Capita GDP) [008]∆Fiscal Reliance X ∆ Log(Per 0768 0712Capita GDP) t-6 [081] [073]∆Log(Per Capita GDP) 8967 12483 626 51739
[030] [036] [015] [082]∆Log(Per Capita GDP) t-6 -3147 -3036
[036] [035]∆ Growth of GDP Per Capita -0077 -0114 -0041 -0473
[027] [032] [010] [067]∆ Democracies in the Region -0565 -0566 -0567 -0635
[691] [708] [713] [537]∆ Democracies in the World -2334 -2397 -2604 -0542
[108] [114] [120] [098]Democratic Transition in Region 27372 27322 268 31528Dummy [408] [408] [400] [418]F-test for country dummies 413297 22985 22985 32735 5442 328876p-value 0 0 0 0 0 0F-test for year dummies 5011 2059 2059 355 582 10068p-value 0 0 0 0 0001 0Arellano Bond AR(1) serial 002 007 -003 -007 001 01correlation test 0983 0945 0973 107 0989 0923Observations 1411 577 567 567 517 431R-squared 023 023 034 034 035 037
Robust t statistics clustered by country in brackets
significant at 10 significant at 5 significant at 1 intercept included but not reported countrydummies included but not reported year dummies included not reported lags of dependent variable to includecalculated based on the minimization of AIC statistic all lags of DV included but not reported lags of FiscalReliance to include calculated based on minimization of AIC statistic all lags of Fiscal Reliance included but only relevant lags reported Long-run Multiplier (LRM) (coefficient of Fiscal Reliance t-1)(1-coefficient on LDV)standard error for LRM calculated via Delta Method marginal effect of Fiscal Reliance as conditioned byLog(Per Capita GDP) in interaction models calculated at different percentiles of Log(PCGDP) standard error formarginal effects calculated via Delta Method
57
Table 8 Autoregressive Distributed Lag Panel Data Model in First Differences
Dependent Variable is ∆Counterfactual Polity (see text for construction)
ARDL (94) ARDL (75) ARDL (75) ARDL (75) ARDL (75) ARDL (75)1 2 3 4 5 6
1778-2006 1950-2006 1950-2006 1950-2006 1950-2006 1973-2006∆Counterfactual Polity t-1 -0005 -0026 -0048 -0048 -0048 -0043
[029] [113] [235] [235] [234] [228] of Gross Oil Rents included 4 5 5 5 5 5AIC statistic for of lags chosen 6841 7224 707 707 707 7121F-test for all lags of Oil Rents 942 815 797 752 801 765p-value 0 0 0 0 0 0Long-run Multiplier total change due 0137 0358 0301 0306 0342 0316to a permanent change in Oil Rents [166] [244] [211] [211] [238] [217]∆Per Capita Gross Oil Rents -015 -0125 -0169 -0166 -0177 -0172
[436] [158] [190] [214] [205] [201]∆Per Capita Gross Oil Rents 0329 0559 0516 0515 0541 0535t-1 [412] [579] [547] [529] [566] [553]∆Per Capita Gross Oil Rents -0133 -0154 -0147 -0147 -0115 -0108t-4 [345] [190] [185] [186] [134] [126]∆Per Capita Gross Oil Rents 0063 0059 006 0067 0064t-5 [054] [053] [053] [059] [055]∆Gross Oil Rents X ∆ Log(Per -01Capita GDP) [012]∆Gross Oil Rents X ∆ Log(Per -0903 -0735Capita GDP) t-1 [150] [118]Marginal effect of Oil Rents at -0166 0547 054225th Percentile of FD Log(PCGDP) [218] [569] [557]Marginal effect of Oil Rents at -0168 0521 05250th Percentile of FD Log(PCGDP) [195] [550] [538]Marginal effect of Oil Rents at -0171 0499 050375th Percentile of FD Log(PCGDP) [172] [520] [509]∆Log(Per Capita GDP) 1276 1286 13199 197
[041] [041] [089] [114]∆Log(Per Capita GDP) t-1 -12309 -17981
[090] [111]∆ Growth of GDP Per Capita 0013 0013 -0106 -0171
[056] [056] [077] [104]∆ Democracies in the Region -0235 -0235 -0235 -0212
[341] [341] [341] [301]∆ Democracies in the World -0554 -0554 -0556 -0318
[178] [178] [179] [117]Democratic Transition in Region 32002 32002 31997 30432Dummy [1256] [1256] [1256] [1091]F-test for country dummies 16000000 9013958 120000 120000 290000 230000p-value 0 0 0 0 0 0F-test for year dummies 15000000 215 146 146 146 093p-value 0 0 004 004 004 0577Arellano Bond AR(1) serial -017 -026 -017 -017 -015 -131correlation test 0862 0793 0868 0867 088 0189Observations 11973 5435 5376 5376 5376 4109R-squared 004 005 019 019 019 02
Robust t statistics clustered by country in brackets
significant at 10 significant at 5 significant at 1 intercept included but not reported country dummies included but not reported year dummies included but not reported lags of dependent variable toinclude based on the minimization of AIC statistic all lags of dependent variable included but only first lag reported lags of resource dependence to include calculated based on minimization of AIC statistic all lags ofresource dependence included but only relevant lags reported Long-run Multiplier (LRM) (contemporaneousresource dependence + lags of resource dependence)(1-coefficient on addition of lags of dependent variables) standard error for LRM calculated via Delta Method marginal effect of resource dependence as conditioned by ∆Log(Per Capita GDP) in interaction models calculated at different percentiles of ∆Log(PCGDP) standard errorfor marginal effects calculated via Delta Method
58
Table 9 Autoregressive Distributed Lag Panel Data Model in First Differences
Dependent Variable is ∆Counterfactual Polity (see text for construction)
ARDL (93) ARDL (93) ARDL (93) ARDL (93)1 2 3 4
1970-2006 1970-2006 1970-2006 1970-2006∆Counterfactual Polity t-1 -0018 -0043 -0043 -0042
[074] [222] [222] [219] of Windfall Profits lags included 3 3 3 3AIC statistic for of lags chosen 7246 7132 7132 7132F-test for all lags of Windfall Profits 1215 1054 1076 104p-value 0 0 0 0Long-run Multiplier total change due 0433 0541 0526 055to a permanent change in WP [418] [352] [315] [352]∆Per Capita Windfall Profits -009 -0094 -0105 -0105on natural resources [244] [100] [127] [114]∆Per Capita Windfall Profits 0449 0659 0664 0681t-1 [419] [623] [611] [630]∆Per Capita Windfall Profits 0087 0011 0009 0001t-2 [169] [015] [013] [001]∆Per Capita Windfall Profits 0158 0183 0168 0194t-3 [483] [146] [106] [155]∆Windfall Profits X ∆ Log(Per 0412Capita GDP) [039]∆Windfall Profits X ∆ Log(Per -1086Capita GDP) t-1 [132]Marginal effect of Oil Rents at -0108 068925th Percentile of FD Log(PCGDP) [135] [632]Marginal effect of Oil Rents at -0096 065850th Percentile of FD Log(PCGDP) [105] [612]Marginal effect of Oil Rents at -0086 063375th Percentile of FD Log(PCGDP) [081] [573]∆Log(Per Capita GDP) 2089 2068 24246
[047] [047] [102]∆Log(Per Capita GDP) t-1 -22881
[103]∆ Growth of GDP Per Capita -0002 0 -0221
[001] [001] [099]∆ Democracies in the Region -0192 -0192 -0191
[256] [256] [256]∆ Democracies in the World -0209 -0207 -0211
[075] [074] [076]Democratic Transition in Region 3019 30189 30182Dummy [960] [960] [961]F-test for country dummies 130000 565075 406292 2419929p-value 0 0 0 0F-test for year dummies 08 098 098 098p-value 0772 0507 0507 0504Arellano Bond AR(1) serial 032 -06 -061 -057correlation test 0749 0546 0544 0569Observations 3865 3702 3702 3702R-squared 007 02 021 02
Robust t statistics clustered by country in brackets
significant at 10 significant at 5 significant at 1 intercept included but not reported country dummies included but not reported year dummies included but not reported lags of dependent variable toinclude based on the minimization of AIC statistic all lags of dependent variable included but only first lag reported lags of resource dependence to include calculated based on minimization of AIC statistic all lags ofresource dependence included but only relevant lags reported Long-run Multiplier (LRM) (contemporaneousresource dependence + lags of resource dependence)(1-coefficient on addition of lags of dependent variables) standard error for LRM calculated via Delta Method marginal effect of resource dependence as conditioned by ∆Log(Per Capita GDP) in interaction models calculated at different percentiles of ∆Log(PCGDP) standard errorfor marginal effects calculated via Delta Method
59

Introduction
Are countries with abundant oil or minerals cursed by their resource wealth
Parallel literatures in political science and economics suggest that they are economic
dependence on oil or minerals according to these literatures is positively correlated with
the onset of civil war slow economic growth and authoritarian government These ideas
about a ldquoresource curserdquo have had an impact well beyond the academy They are taken
almost as self-evident truths at multilateral aid organizations such as the United Nations
and the World Bank (eg Harford and Klein 2005) are presented as robust facts in
popular books on the alleviation of world poverty and inequality (eg Collier 2007) and
are disseminated in the news media as a consensus finding of social science research
(eg Rosenberg 2007) Indeed New York Times columnist Thomas Friedman (2006)
has gone so far as to decree a ldquofirst law of petro-politicsrdquo in which the price of oil and
the spread of political freedom are said to be inversely correlated The normative
implications are obvious and non-trivial Some researchers have even suggested that
developing countries might consider leaving their resources in the ground in order to
avoid their pernicious effects (eg Ross 2001b)
In this paper we question the evidence and methods supporting the idea that
economic dependence on oil or minerals is causally related to authoritarianism1 Our
basic point is that the resource curse is about a time series processmdashthe discovery of oil
or minerals is hypothesized to send a country down a different path of institutional
development than it would have followed otherwisemdashand thus the theory should be
1 We note that there is a parallel literature in economics that questions the evidence and methods supporting the link between oil or minerals and slow growth (Wright and Czelusta 2004 Lederman and Maloney 2007 2008 Manzano and Rigobon 2007) That literature proceeds along somewhat different empirical lines than our time-series approach
2
evaluated using time series evidence and methods The extant literature however relies
on pooled time series cross-sectional regressions without country fixed effects estimated
on datasets that are considerably truncated with respect to time The implicit theory
underlying these regressionsmdasheven those that control for possible endogeneities with
instrumental variablesmdash is that after holding the covariates associated with regime type
constant authoritarian resource dependent countries were on a path of political
development that would have led to the same outcome as that obtained in democratic
non-resource dependent countries Venezuela could have followed the same institutional
trajectory as Denmark ndash if it had not discovered extracted and exported oil2
Researchers are in short drawing causal inferences about processes that are purporte
happen within countries over time from a technique that is primarily driven by the
variation between cou
d to
ntries
We therefore build upon and go beyond the extant literature in four ways First
we build long-run historical datasets that allow us observe countries both before and after
they became major oil or mineral producers Second we employ econometric techniques
that are centered on the dynamic modeling of time-series processes Third in order to
mitigate possible measurement error in the dependent and independent variables a salient
concern when relegating attention to within country variation we estimate our
regressions using three different measures of oil and mineral dependence and three
different measures of regime type Fourth we draw explicit counterfactual comparisons
2 Researchers realize of course that the regressions have this quality and they therefore add control variables such as regional dummies or the initial level of per capita GDP to mitigate the problem of unobserved heterogeneity But this step does not really solve the problem the implicit counterfactual to Venezuela is now a fictional Denmark with a much lower per capita income located in Latin America
3
The body of evidence that we develop and the set of methods that we employ
allow us to control for factors and model relationships between variables in ways that
have not been accomplished in the literature to date First our data and methods allow us
to determine if there are persistent effects of resource shocks on regime types Second
they allow us to determine if resource shocks influence regime types with a time lag
Third they allow us to control for long-run differences across countries in terms of their
fundamental institutions The ability to control for time-invariant heterogeneity is
particularly critical given the fact that historically-persistent institutions may jointly
determine both countriesrsquo regime types and the numerators and denominators typically
used to compute measures of resource reliance3
Regardless of how we measure the dependent and independent variables specify
the regressions or frame the counterfactual comparisons we cannot detect the
relationship between oil or mineral dependence and authoritarianism posited by the
resource curse In fact in some specifications we detect short-run benefits from increases
in resource reliance on democratization These results do not suggest that there may not
be specific cases in which a dictator successfully used oil or mineral revenues to 3 The numerators are either measures of resource production resource exports or the rents extracted from resources The levels of all three of these metrics are often driven by political decisions made by governments that have inherited inveterately weak institutions these governments may have short time horizons and pressing fiscal needs causing them to exploit resources today rather than save them for tomorrow This is even the case when the numerator is proven oil and mineral reserves governments that inherit weak fiscal and political institutions may have strong incentives to frantically search for new resources Recent examples include Sudanrsquos and many sub-Saharan African countriesrsquo willingness to allow China to leave no rock unturned within their borders in the search for untapped oil A similar logic affects the denominators used to compute resource reliance One recent improvement made in the literature is to normalize resource wealth by population rather than GDP in order to avoid introducing simultaneous causation running from regime types to income levels (see Ross 2006 2008 Dunning 2008) Even this innovation however does not resolve the problem of unobserved heterogeneity a countryrsquos persistent institutions may jointly determine its regime type and the size and rate of growth of its population ndasheven after controlling for its level of income (see Culter et al 2006 Soares 2007)
4
consolidate his hold on power It is to say however that the evidence does not support
the notion of generalizable lawsmdasheven conditional ones
The remainder of this paper proceeds as follows Section Two reviews the
literature on the political resource curse discusses the logical flaws in its underlying
theory and provides a critical discussion of the empirical strategies employed in the
literature to date Section Three presents a discussion of the historical datasets we
develop and the methods we employ to analyze them Section Four presents our results
providing both graphical analysis of individual cases as well as panel data analysis
Section Five concludes and discusses the implications of the kind of time series approach
to evidence that we employ here for a wide variety of questions in comparative politics
II Literature Review
The idea that there is a causal connection between economic dependence on oil or
minerals and authoritarian government goes back to Mahdavy (1970 466-67) who noted
that petroleum revenues in Middle Eastern countries constituted an external source of rent
that was directly captured by governments He hypothesized that ldquoA government that
can expand its services without resorting to heavy taxation acquires an independence
from people seldom found in other countrieshellip In political terms the power of the
government to bribe pressure groups or to coerce dissidents may be greater than
otherwiserdquo What Mahdavy advanced as a hypothesis to be tested was soon recast by
other researchers as a robust fact Consider for example the shift in tone in Luciani
(1987) ldquoDemocracy is not a problem for allocation stateshellipThe fact is that there is lsquono
representation without taxationrsquo and there are no exceptions to this version of the rulerdquo
5
The idea that oil begets rentier states which are inconsistent with democracy soon became
one of the major organizing themes of the literature about authoritarianism in the Middle
East and Africa (Skocpol 1982 Anderson 1987 Beblawi 1987 Luciani 1987 Davis
1987 Crystal 1989 1990 Chaudry 1994 1997 Van de Walle 1994 Khan 1994 Yates
1996 Clark 1997 1998 Gardinier 2000 Dillman 2000 Hodges 2001 Bellin 2004
Vandewalle 1998 2006) Huntington (1991 65) went so far as to generalize the lessons
from this case study literature to the entire developing world
One of the obvious weaknesses of this literature was that its case study approach
limited its ability to draw clear causal inferences As Herb (1999 256) put it ldquohellipthe
lack of democracy is noted oil is proffered as the culprit lsquono representation without
taxationrsquo cited as the mechanism and the matter is closedrdquoAnother obvious weakness
was that any argument made about a causal relationship between oil abundance and
authoritarianism also had to be true for hard rock minerals both are extracted using
capital and technology intensive methods are sold on an international market and can be
directly taxed by governments as they come out of the ground or are exported
Researchers therefore began to subject the hypothesis that oil and mineral
abundance are associated with authoritarianism to tests against large-N datasets (Barro
1999 Ross 2001a Wantchekon 2002 Jenson and Wantchekon 2004) Over time this
large-N literature has grown increasingly sophisticated researchers have developed better
proxies for oil and mineral reliance (Ross 2008) employed techniques to control for
possible reverse causality (Ramsey 2008) exploited variance at the sub-national level
(Goldberg Wibbels and Myukiyehe 2008) and explored the effects of oil wealth on the
durability of authoritarian regimes using survival analysis or dynamic probit regressions
6
(Smith 2004 2007 Ulfelder 2007 Ross 2008 Papaioannou and Siourounis 2008)
While the specific findings vary from study to study the literature finds an association
between oil or mineral reliance and authoritarianism
The adoption of large-N frameworks did not however resolve an underlying
weakness of the theory which is that the mechanism that putatively links oil or mineral
dependence to authoritarianismmdashthe development of rentier statesmdashwas rooted in a
logical fallacy The idea that there is no taxation without representation does not logically
imply that there is no representation without taxation 4 In point of fact as both research
in public choice economics and in the history of democratization show a ruler trading
taxation for representation is only one of several paths by which representative
governments arisemdashand those specific examples of those alternative pathways include
countries that are highly dependent on oil or minerals One alternative path to
democratization is a rivalry between enfranchised and disenfranchised groups that
induces democratization from below (Conley and Temimi 2001) as occurred in oil-rich
Mexico for example A second path is when economic elites are split and the ruling
elite extends suffrage strategically to advance its interest against rival elites (Llavador
and Oxoby 2005) as occurred in nitrate-rich Chile in the nineteenth century A third path
is when political elites split and agree to democratize in order to avoid violence (Bardhan
1993) such as occurred in Colombia A final path is that democratic institutions develop
4 Researchers have also suggested two other transmission channels but tend to afford them less importance In some early versions of the theory (eg Ross 2001a) oil and minerals were claimed to generate autocracy by allowing dictators to finance a repressive state apparatus Later work by Ross (2008) suggests little empirical support for the existence of this mechanism In other versions of the theory (eg Ross 2001a) reliance on natural resources is said to have an indirect effect on regime types by retarding modernization and hence preventing Lipsetrsquos (1959) prerequisites of democracy from emerging ndash a large middle class an educated population and higher living standards
7
and thrive when public goods become more highly valued than pork (Lizzeri and Persico
2004) in the case of Trinidad and Tobago public goods financed by oil rents achieved
this status and helped sustain democracy Indeed as Herbst (2000) has pointed out the
idea that democracy develops because rulers trade representation for taxation appears to
be completely inapplicable to the developing world The historical record indicates that it
may not even be applicable to most Western European democracies5
The adoption of large-N frameworksmdashspecifically statistical methods that
primarily exploit variance across countries rather than within countries over timemdash
introduced an additional weakness into the literature a mismatch between the theory and
the empirical strategies used to test it The hypothesis that oil or mineral wealth fuels
authoritarianism implies that the discovery of oil or minerals sent countries down
different paths of institutional development than they would have followed otherwise in
the absence of resource discoveries Specifically the resource curse implies three
possible counterfactuals 1) Authoritarian country X would have become democratic
had it not found oil or minerals 2) Democratic country Y would have remained
democratic instead of lapsing into authoritarianism had it not found oil or minerals 3)
Democratic country Z would have made the transition from authoritarianism even faster
had it not found oil or minerals The methods of analysis employed in the literature do
not however allow for the direct observation of these inflection points in countriesrsquo
5 The canonical case that resource curse theorists seem to have in mind about rulers conceding representation for taxationmdashEngland after the Glorious Revolutionmdashis not in fact an example of the phenomenon The British Crown as North and Weingast (1989) make clear did not trade anything in exchange for revenuesmdashit demanded forced loans and confiscated property to fund foreign wars It was only after a protracted and bloody civil war that a coalition of nobles and citizens forcibly imposed constraints on the executive in order to prevent the crown from plundering their wealth in the future Higher tax revenues were only an incidental unintended consequence of the strengthened legislature and judiciary ndash a byproduct of more secure property rights ndash that considerably lagged increased representation (Stasavage 2003)
8
paths of institutional development Instead the extant methods pool all countries
together implicitly treating them as identical units and then look for variance across the
countries The problem with this approach is that country-years are not isomorphic
Denmark is not Venezuela without oil endemic and time-invariant institutions
differentiate these countries and those institutions constrain the possible set of political
institutions and the possible set of economic sectors that can emerge and be sustained
Some researchers have begun to acknowledge these problems Norman
(forthcoming) makes the point that resources whether they are measured as stocks or
flows may themselves be endogenous to a countryrsquos underlying legal political and
cultural institutions McSherry (2006) and Smith (2007) suggest that the blame for bad
policy choices and authoritarian political structures may lie with a countryrsquos pre-oil
institutions rather than with the oil discoveries themselves Engelbert (2000) gets to the
heart of the matter in his comparison of democratic and prosperous Botswana and
authoritarian and impoverished Democratic Republic of the Congo economic reliance on
natural resources cannot explain the differences between the two because both are
mineral rich the differences are a product of their colonial institutions
The key to any meaningful analysis of the resource curse is to specify the right
counterfactual what would a resource reliant country have looked like had it not
discovered oil or minerals One important step in this regard was made by Herb (2005)
who reasoned that resource dependent countries would have been substantially poorer
had they not found oil or minerals and would therefore have obtained lower levels of
democracymdashunder the modernization theory assumption that the growth of income
catalyzes social and political changes that result in democratization He therefore
9
calculated the per capita GDP loss from eliminating a countryrsquos oil or mineral sector and
then estimated its level of democracy at the counterfactual level of GDP His estimates
indicate that the net negative effect of resource dependence on democracy is negligible
One drawback to Herbrsquos approach is that following the traditions in the resource curse
literature it employs pooled time series cross sectional regressions without country fixed
effects on a data set that is truncated with respect to timemdashin this case 1972 to 1999 That
is it does not compare countries to themselves before and after they found resources but
rather infers what the time-series process would have looked like on the basis of cross-
sectional evidence
Dunning (2008) takes another important step in the specification of appropriate
counterfactuals by introducing country fixed effects in his regressions of polity scores on
per capita windfall profits from oil in 17 Latin American countries covering the period
1960-20016 These regressions capture how increases in resource reliance affect polity
scores within countries over time and they indicate that reliance on oil has conditional
effects on regime types when a country has a high level of inequality increased oil
reliance exerts a positive effect on democratization but when a country has a low level of
inequality increased reliance on oil exerts a negative effect7 There is a reasonable
6 In a panel of the entire world he continues the tradition in the literature of pooling all countries together We also note that Ross (2001 341fn 58) who tests the resource curse hypothesis on a global panel of countries observed between 1972 and 1997 notes that the statistical significance of the negative impact of oil and mineral exports as a share of GDP on democracy disappears if country fixed effects are introduced 7 Jones Luong and Weinthal (2006) on the basis of case study evidence also make a conditional argument about the resource curse when petroleum industries are privately owned oil exerts a positive impact on democracy when publicly owned a negative effect Their case study approach does not however permit them to control for a possible endogeneity running from regime type to the ownership structure of the oil sector nationalizations usually occurs ndash and are sustained ndash in autocratic regimes Similar methodological issues also mean that they cannot
10
likelihood however that Dunningrsquos reported results are spurious When estimating time-
series regressions it is crucial that the series are either stationary ndash which means searching
for unit roots if the data is in levels ndash or if non-stationary that they are co-integrated (see
Granger and Newbold 1974 Phillips 1986)8 Work we have done with the same
measures Dunning uses and which we discuss later in this paper indicates that the series
in levels are not stationary but not co-integrated
III Research Design
We frame the resource curse hypothesis as a counter-factual in the absence of the
discovery of oil or minerals would countriesrsquo regimes have looked all that different In
order to answer this question we focus on longitudinal change within countries over
time A dynamic within country approach is ideal because the variables of interest
exhibit considerable temporal variation and that variance is not always monotonic
democratization may be either discontinuous or fitful while oil and mineral sectors go
through booms and busts and countries both modify the amount of natural resources they
choose to produce and change the way they tax natural resources In other words history
ndashnot scatter plots ndash provides the best way to tell the story
control for pre-existing institutions that may jointly determine autocracy and state-owned enterprises 8 There is also an issue of the validity of the independent variable in terms of the theory being testedmdashan issue that we hasten to add affects most of the literature with the exception of Herb (2005) The causal mechanism that links oil to regime types is assumed to be the rents captured by the government from the production of oil but the most popular variable employed captures total rents producedmdashsome of which are captured by the government and some of which accrue to the rest of society How the rents are divvied up depends crucially on the type of taxes and royalties that are levied as well as on the tax rate and the enforcement of direct taxes on resources such as corporate taxes on oil and mining companies These factors not only vary across countries but they vary within countries over time
11
We therefore build long-run historical datasets from primary sources draw
explicit counterfactual comparisons graph the trajectory of political institutions against
resource reliance over time and employ dynamic time series-centric econometric
techniquesmdashmost particularly autoregressive distributed lag panel models We employ
cross-section time-series data instead of country-by-country time-series for two reasons
First we are better able to detect whether the variables of interest have unit roots and by
extension exhibit a long-run relationship (are co-integrated) This is because the
augmented Dickey Fuller tests used to identify the stationarity of the data is more
powerful in the panel context (see Levin and Lin 1992 Quah 1994) Second panel
estimators have been shown to militate against measurement error more effectively than
time-series regressions (Baltagi 1995)9
Measuring Regime Types
Polity Score
Our primary measure of regime type is the Combined Polity 2 scoremdashan index
that measures the competitiveness of political participation the openness and
competitiveness of executive recruitment and constraints on the chief executive (see
Gurr and Marshall 2005 pp 15-6)mdashfrom the Polity IV dataset For simplicity we refer
to this measure throughout this paper as the Polity Score We center our analysis on the
9 One could argue that the assumption of parameter heterogeneity implied by our cross-country time-series framework is unduly strong We note that if we run individual time-series co-integration tests and regressions for seventeen of the largest oil and mineral producers in the world (see below) we attain materially similar results We will discuss some of these results below when we reevaluate Dunningrsquos (2008) evidence for a ldquoresource blessingrdquo ndash ie that high levels of resource reliance in highly unequal societies is favorable to democracy We also note thatwe do not employ the Pesaran and Shin (1999) pooled mean group estimator which allows for slope heterogeneity in the short-run effect across panels because this framework requires that the data be stationary
12
Polity Score because it is the standard measure of democracyautocracy employed in the
resource curse literature as well as in the field of comparative politics more broadly In
addition the Polity Score is measured for each country in the world going back to its first
year of independence through 2006 Following conventions in the literature and in
order to make the regression coefficients easier to interpret we normalize these scores to
run from 0 (complete autocracy) to 100 (complete democracy)
Binary REGIME
The second measure we employ is the binary measure of democracy originally
created by Przeworski et al (2000) for the period 1950-1990 popularly known as
REGIME It is an ldquoelectoralrdquo measure of democracy that is coded as a ldquo1rdquo if (1) the
executive is directly or indirectly elected (2) the legislature is directly elected (3) there
is more than one party and (4) control of the executive alternates between different
parties under the same electoral rule REGIME has been extended by Boix and Rosato
(2005) from 1800 to 1999 and by Cheibub and Ghandi (2004) from 1946 to 200210
Counterfactual Polity
One potential concern with both of these measures is that they do not measure a
countryrsquos level of democracyautocracy relative to what it might have become had it not
discovered oil or minerals In order to address this concern we develop a third measure
of regime typemdashCounterfactual Polity We construct this variable by assuming that if a
resource dependent country did not develop its resource sector it would have obtained
the same level of democracy as that achieved by the typical non-resource dependent 10 We use the Cheibub and Ghandi (2004) data set but fill in missing observations observations for some country years during the 1946-2002 period by using Boix and Rosato (2005)
13
country in their same geographiccultural region We therefore calculate for each year a
synthetic hypothetical Polity Score for each resource reliant country and then calculate
how much that countryrsquos observed Polity Score differs from its hypothesized Polity
Score Specifically Counterfactual Polity is the average Polity Score of the non-resource
dependent countries computed by region and then subtracted from the resource
dependent countryrsquos Polity Score11 Decreases in the gap between the hypothesized and
observed Polity Scores over time bespeak convergence between a resource dependent
country and its regionrsquos average Polity Score while increases represent divergence
Measuring Oil and Mineral Dependence
Fiscal Reliance on Resource Revenues
The first measure or resource reliance we employ is Fiscal Reliance on Resource
Revenues the percentage of government revenues from oil or minerals These revenue
streams include taxes and royalties paid by oil or mineral companies as well as dividend
payments or direct transfers from government-owned oil and mining enterprises This
measure has both theoretical and practical advantages The theoretical advantage is that
by capturing the extent to which natural resource rents are directly absorbed by regimes
this measure provides a direct test of the resource curse hypothesis that increased
11 We specify a country as being non-resource dependent if its level of fiscal reliance on oil and minerals during the period 1972-1999 as measured by Herb (2005) was less than five percent We code those few cases not treated by Herb (2005) on the basis of their ratio of oil and mineral exports to GDP (a ratio of less than five percent is coded as non-resource dependent) We note that when we compare the countries for which we have both measures our method produces few false negatives countries that export oil and minerals worth more than five percent of GDP tend to obtain more than five percent of government revenues from those same resources Finally in the handful of cases where both measures of resource reliance are unavailable we verify that they produce no or extremely modest amounts of petroleum from our dataset on per capita oil production We also verify that they produce no or extremely modest levels of minerals from information in the Central Intelligence Agencyrsquos World FactBook
14
revenues from resources induce or protract authoritarianism by allowing governments to
operate autonomously from citizens The practical advantage is that this measure has
generous longitudinal coverage By retrieving and standardizing countriesrsquo fiscal
statistics from the annual reports and retrospective series of central banks statistical
offices and treasury ministries we are generally able to construct this measure from
independence to 2006 In most cases this means that our measure extends back to the
period before countries became major oil or mineral producers12
There is one practical disadvantage to this measure however the retrieval and
standardization of idiosyncratically organized fiscal data from historical sources is not an
enterprise characterized by economies of scale We therefore have to truncate our
coverage of Fiscal Reliance with respect to the number of countries We do so by
applying three criteria 1) a country had to have oil or mineral revenues equal to at least
five percent of total government revenues during the period 1972-1999 based on data
from Herb (2005) 2) we had to be able to obtain uninterrupted volumes of the serial
publications that contain countriesrsquo fiscal data and 3) those records had to be transparent
enough to allow for the identification of oil and mineral revenue streams as well as total
government revenues
Seventeen major resource exporters met these criteria fifteen oil producers and
two of the worldrsquos major copper producers The fifteen oil producers are Mexico
Venezuela Ecuador Trinidad and Tobago Nigeria Angola Indonesia Iran Algeria
Bahrain Yemen Oman Saudi Arabia Kuwait and Norway As a group they accounted 12 One concern is that by relying on central bank or treasury records we are potentially omitting oil or mineral revenues that are available to rulers but not captured via taxation royalties or dividends from state-owned oil or mining enterprises We recognize this potential shortcoming and try to mitigate it by reviewing where possible the records of state-owned oil or mineral companies in order to detect off-budget government expenditures
15
for 45 percent of the worldrsquos oil output in 2006 The two copper producers are Chile
which is the worldrsquos most important producer (accounting for 35 percent or world output
in 2005) and Zambia which is the worldrsquos tenth most important copper producer
(accounting for 3 percent of world output)
One might worry that our restrictions have yielded cases that are potentially
unrepresentative and thus that our time-series results on the relationship between Fiscal
Reliance and regime type cannot be extrapolated to the history of other resource
producers There are two reasons why we doubt this to be true The first is that many of
the major petroleum and copper producers that we have excluded are now robust
democracies that have achieved the highest possible democracy score across the popular
measures of regime type13 Therefore if there is sample selection bias engendered by our
incomplete coverage of fiscal reliance on resource revenues with respect to countries it is
likely to run in the direction of the resource curse making it easier to find a relationship
between natural resources and authoritarianism The second reason is that we develop
two other measures of resource reliance (see below) for panels covering the entire world
and they yield regression results that are not materially different from those we obtain
with Fiscal Reliance on Resource Revenues
Per Capita Gross Petroleum Rents
13 These countries include but are not restricted to the United States Great Britain Canada and Australia The United States is a particularly poignant case from the middle of the nineteenth century until 1975 when it was finally passed by Saudi Arabia it was the worldrsquos leading producer of petroleum It remains the worldrsquos third largest producer of petroleum accounting for seven percent of world output From the 1870s until 1910 the United States was also the worldrsquos leading mineral producer (David and Wright 1997) To this day it remains the worldrsquos second most important producer of copper accounting for 75 percent of world outputmdashfollowing only Chile which is also democratic
16
The second measure we employ is Per Capita Gross Petroleum Rents which we
compute as the output of oil in barrels multiplied by the world price of petroleum in
constant 2007 US dollars divided by population14 Petroleum production for every
country-year was obtained from yearbooks produced by petroleum consulting companies
producers associations and government agencies This measure has two main
advantages The first is longitudinal coverage our observations start with the first year
of a countryrsquos independence and extend to 2006 With the exception of a few producers
in the Middle East and Central Asia this means that we can observe countries before they
became major oil producers The second is that we do not confront issues of country
selection this variable covers 166 countriesmdashvirtually every country in the world Of
these as many as 94 produce oil in any given year The chief disadvantages of this
variable are that it does not include rents from non-fuel minerals and does not reflect
differences across countries and time in petroleum extraction and refining costs15
Per Capita Windfall Profits from Natural Resources
In order to mitigate potential problems of measurement error in Gross Oil Rents
Per Capita we develop a third measure Per Capita Windfall Profits from Natural
Resources This measure is calculated from data retrieved from the World Bankrsquos World
Development Indicators It is the value of the oil gas coal hard rock minerals and
precious metals produced minus the costs of production and the opportunity cost of
14 This measure as well as any of the measures normalized by population that we employ is measured in thousands in the regressions that follow in order to facilitate interpretation 15 To some extent this problem is mitigated by the fact that the decision to produce each marginal unit of oil is at least in the medium run a function of the rents available to producers if production costs are too high relative to the world price countries cut back on output which is implicitly incorporated into this measure
17
capital converted to constant 2007 US dollars divided by population This measure
originally developed by Hamilton and Clemens (1999) has two clear advantages over
Gross Oil Rents Per Capita it includes hard rock minerals as well as oil and it implicitly
controls for production costs16 Like Gross Oil Rents Per Capita its coverage is global
our data set includes 146 countries of which 104 exhibit positive values for windfall
profits from oil or minerals in any given year This measure does however have an
obvious disadvantage it is considerably longitudinally truncated the first World Bank
estimates of the components of this measure are not available until 1970 Thus while our
other measures of resource reliance run from a countryrsquos first year of independence to
2006 this measure only runs from 1970 to 2006
Control Variables
The unrestricted specifications that follow include several control variables
Following modernization theory ndash increasing wealth drives democratization (Lipset
1959) or at least protects it (Pzeworski et al 2000) ndash we include the log of Real Per
Capita GDP We take this data from the Penn World Tables version 61 and update it to
2006 using data on the rate of economic growth from the World Bank Development
Indicators (2008) We also include the Growth Rate of GDP Per Capita following the
widely held belief that economic performance (high growth) can lead to regime stability
and economic crises (negative growth) can catalyze regime transitions (eg Gasiorowski
1995) Finally in order to hold democratic diffusion effects constant we control for
regional and world trends in democratization as well as the possible contagion effects of
16 It also provides an advantage over other measures that can be developed from online data such as oil and mineral exports as a percent of GDP in that it measures production that is both consumed domestically and exported (Ross 2008)
18
nearby democratic transitions Following Gleditsch and Ward (2006) we add three
variables to the regressions the percentage of democracies in a countryrsquos geographic-
cultural region (with democracy measured as a score of 85 or higher on the normalized
Polity Score) the percentage of democracies in the world and a dummy variable coded
ldquo1rdquo for country-years in which a democratic transition occurs within the countryrsquos region
IV Data Analysis Hypothesis One Natural Resources Undermine Democracy
There are occasions in social science research when descriptive information and
simple graphs are enough to cast serious doubt on a hypothesismdashand this is one of those
occasions Before diagnosing the time-series properties of our data and reviewing the
results of several multivariate analyses we first conduct some simple tests by inspecting
and graphing the data Of the 164 countries for which we have data 33 enter the data set
with a Polity Score that meets Gleditsch and Wardrsquos (2006) criteria for a stable
democracy (a Polity Score of at least 85 on our normalized scale) Of those 33 countries
seven display non-trivial values on any of our three measures of oil and mineral reliance
Of those seven resource reliant democracies fivemdashAustralia Botswana Trinidad and
Tobago Jamaica and Papua New Guineamdashremained democratic The data for Trinidad
and Tobago displayed in Figure 1 illustrate the general pattern even during a period in
which petroleum rents increased dramatically and 60 to 70 percent of government
revenues derived from oil and gas the countryrsquos Polity Score actually ticked up
One might be tempted to argue that the remaining two casesmdashMalaysia and
Nigeria which are oil producers and which underwent periods of authoritarianismmdash
provide evidence consistent with the resource curse The problem with this reading of the
19
facts is that democracy broke down in these countries before they ever became significant
oil producers Figure 2 graphs the Nigerian data and it makes clear that oil accounted for
only seven percent of government revenues and gross oil rents were only $36 per person
in 1966 when a coup ended democracy In order to make a convincing case for the
resource curse one would have to believe that the military officers behind the 1966 coup
foresaw the run-up in world oil prices in 1973 that ushered in Nigeriarsquos petroleum boom
In addition one would also have to account for the fact that Nigeria has been trending
towards greater democracy since 1998 Between 1998 and 2006 its fiscal reliance on
petroleum grew by 40 percent its gross rents from oil per capita more than tripled and its
windfall profits from oil increased almost five-fold
Hypothesis Two Natural Resources Impede Democratic Transitions
As with hypothesis 1 we begin our analysis by visually inspecting the data and
present some representative graphs that plot the longitudinal relationship between our
three measures of resource reliance and a countryrsquos Polity Score We do not find
compelling evidence in favor of the hypothesis that resources impedes democratization
One of the first features of the data that jumps off the page is that there is a set of
countries that were authoritarian prior to the exploitation of oil or minerals and which
then democratized during a period in which their oil or mineral sectors boomed Such
cases include Ecuador Chile Peru Venezuela and Mexico To provide a sense of what
the data looks like Figure 3 graphs the data for Mexico The increase in Mexicorsquos Polity
Score from 20 in 1976 to 90 in 2000 captures the countryrsquos transition from a long-lived
authoritarian regime to a multiparty democracy What is particularly striking about the
increase in Mexicorsquos Polity Score is that it was coterminous with the rebirth of the
20
Mexican petroleum industry which had been stagnant since the late 1920s During the
heyday of one party rule in Mexicomdashthe 1950s and 1960smdashincome from oil typically
accounted for less than five percent of government revenue and real gross rents from oil
typically amounted to only $35 per capita In 2000 when the PRI finally lost its grip on
power oil income accounted for 23 percent of government revenues and real gross oil
rents had jumped to almost $400 per capita By 2006 when Mexico held a second free
and fair election the percentage of government revenues derived from oil and real gross
rents from oil stood at historic highs 37 percent and $865 per person respectively
The second surprising pattern revealed by visually inspecting the data is that there
is a set of countries that were highly authoritarian prior to the exploitation of oil or
minerals and which while they did not fully democratize saw at least a twofold increase
in their Polity Scores during the period in which their resource sectors grew rapidly
These cases include Chad Iran Egypt Yemen Algeria and Angola Figure 4 which
graphs the time-series relationship between our measures of resource reliance and Polity
for Angola provides a representative example The Polity Score Fiscal Reliance Real
Gross Rents from Oil Per Capita and Real Windfall Profits from Oil and Minerals Per
Capita all trend together and the trend is a monotonic secular increase
The third pattern that emerges is that there is a group of countries most of which
are clustered around the Persian Gulf that have persistently low Polity Scores and that
are highly reliant on oil The majority of these countries however ndash as Herb (1999) has
pointed out with respect to Kuwait ndash had authoritarian political structures in place for
decades before the first drop of oil ever flowed Other examples include Saudi Arabia
Iraq Libya Oman and Equatorial Guinea This suggests that the number of countries
21
born as autocratic ldquopetro-statesrdquo in which one can claim that oil fundamentally
conditioned the new nationrsquos political institutions is actually quite small candidates
include Qatar the United Arab Emirates Bahrain Azerbaijan and Turkmenistan
There is a final group of countries whose data display a pattern that accords with
the resource curse when resource dependence is at low levels irrespective of the way in
which it is measured the country has a high Polity Score conversely when resource
reliance is high the country exhibits a low Polity Score An example is Indonesia whose
data we graph in Figure 5 The number of such cases however appears to be
exceedingly small Besides Indonesia potential candidates include Syria and Gabon
Multivariate Analysis
When the central objective of the estimation approach lies with the datarsquos time-
series processes two issues must be addressed before moving to regression analysis The
first is the stationarity of each data series do the data have the same mean variance and
co-variance over time The second is specifying the datarsquos correct lag structure One
might imagine that political actors and institutions do not automatically react to changes
in resource dependence One might also imagine that changes in resource dependence
come in two flavors and each has a differential effect on political actors and institutions
Changes in resource reliance may be transitory if they are a product of a short-lived
increase in the price of oil for example or permanent if they arise from a technological
innovation that improves resource extraction It is important to model these dynamics
Unit Root and Co-integration Tests
22
Our graphed data (not all of which we reproduce here) indicate that the various
measures of resource dependence tend not to be mean-revertingmdashthere is an upward
trend This is also the case for several countriesrsquo Polity Scores The implication is that
the data are non-stationary Therefore we first apply a series of diagnostics to determine
whether the data are non-stationary and if they are indeed not stationary whether they
are co-integrated We conduct a series of Maddala and Wu (1999) based augmented
Dickey-Fuller tests for unbalanced panel data (based on Fuller 1932) and we do so for
each resource dependent measure and for Polity with separate diagnostics for each
distinct time period covered by our resource dependence measures For example
because Fiscal Reliance covers seventeen countries between 1800 and 2006 we check to
see if Polity is stationary during this time period and across these particular countries
Conversely because Windfall Profits on Oil or Minerals Per Capita has global coverage
but is truncated to the years 1970-2006 we check to see if Polity is stationary during this
time period and across the countries covered by this variable Table 2 Panels A and B
presents the results (Table 1 presents summary statistics for the variables in the dataset)
The null hypothesis is that the data are non-stationary
The tests performed on the data in levels (Panel A) indicate that in the majority of
cases both the dependent and independent variables are non-stationary The sole
exception is Per Capita Gross Oil Rents The augmented Dickey Fuller tests in Panel B
of Table 2 show that the series that are not stationary are integrated of order 1 first
differencing the data makes these series stationary
The non-stationarity of most of our series means that unless the series are
cointegrated it is inappropriate to estimate regression in levels To discover if Polity is
23
co-integrated with the non-stationary measures of resource dependence we test for unit
roots in the residuals of static models in which Polity is regressed against Fiscal Reliance
and Per Capita Windfall Profits respectively17 We again apply the Maddala and Wu
(1999) augmented Dickey-Fuller tests Since these unit root tests are conducted on the
aforementioned regressionsrsquo residuals the null hypothesis is that the variables are not co-
integrated The results for these co-integration tests are documented in Table 2 Panel C
All of the tests on the non-stationary series produce insignificant results This means that
there is no evidence for a long-run relationship between countriesrsquo Polity Scores and their
resource dependence Failure to find evidence for a long-run relationship between the
level of democracy and the degree of natural resource dependence casts strong doubt on
the claim that resource reliance is causally associated with autocracy
Regression Specification
Because the diagnostics described above reveal that our series are either non-
stationary and not co-integrated or are a mix of stationary and non-stationary series the
implication is that we should estimate a specification in first differences18 Despite the
lack of co-integration however our regressions should still account for both short and
long-term effects made by changes in resource dependence on changes in Polity We
17 Granger (1981) argues that two or more non-stationary time series that become stationary after first-differencing may have linear combinations that are stationary without differencing If such a relationship in levels exists these non-stationary variables are said to be co-integrated The existence of a stationary long-run relationship between series that are individually non-stationary justifies an evaluation of the relationship in levels between non-stationary variables 18 See Beck and Katz 2004 26 Kittel and Winner 2005 footnote 10 Wooldridge 2006 652-53) We note that An Error Correction Model (ECM) is not appropriate in these situations because though the dependent variable is first differenced in an ECM and thus stationary the introduction of covariates measured in levels may lead to spurious relationships when they are not stationary
24
therefore adopt an Autoregressive Distributed Lag (ARDL) framework in first
differences19 In order to select the right number of lags of Polity we choose a vector
autoregressive model with the lowest AIC statistic In order to select the right number of
lags of resource dependence we choose the number of lags that minimizes the AIC
statistic Since we introduce country dummies into the regressions the coefficients on
the independent variables represent a cross-country average of the longitudinal effect20
Specifically we run a model with the following functional form
∆Yit = ∆Xitβ + niφ+ vtλ+ uit (1)
where Y is a (ntimes1) vector of observations on the dependent variable X is a (ntimesk) matrix
of n observations on k explanatory variables Variables included in X include the one
year lag of the dependent variable as well as higher order lags of the DV as selected by
the AIC statistic and the contemporaneous value of the measure of resource reliance
19 First-differencing significantly affects the interpretation of the results Most crucially we forfeit the information about the degree of reliance on minerals and oil and retain only the information about its change This implies that we are relegated to making inferences about the effect that the size of the change in resource reliance has on the size of the change in regime type Conversely the resource curse implies that autocracy observed during any particular year is not necessarily related to short-run fluctuations in resource reliance ndash in or before that year ndash but to the accumulation of resource reliance since the discovery of resources We stress that we have ruled this type of relationship out however via the co-integration tests described above 20 Although first differencing the data expunges country fixed effects and therefore controls for countriesrsquo unobserved time-invariant heterogeneity we also include country dummies The country dummies control for systematic cross-country differences in the annual changes in Polity in other words for country-specific time trends (see Kittel and Winner 2005 280 Daveri and Tabellini 1997 26) We also note that across our models AR(1) serial correlation is eliminated by introducing one or more lags of the DV ndash according to Arellano Bond serial correlation tests (see Arellano and Bond 1991) ndash higher order serial correlation is not always eliminated (detected via the same Arellano Bond tests) Therefore across our models we estimate robust standard errors clustered by country Robust standard errors clustered by country are estimated via a variant of the HuberWhiteSandwich technique and yield estimates that are robust to both groupwise and within-country heteroskedasticity as well as correct coverage in the presence of any arbitrary correlation structure among errors within the country panels (Williams 2000 645) Shocks that are common across countries in any given year are estimated by introducing year dummies (also since robust standard errors clustered by country are not robust to contemporaneous correlation between panels the year dummies address this issue)
25
used as well as lags of resource reliance as selected by the AIC statistic X includes
∆regime type measuret-1 through ∆regime type measuret-k as well as ∆resource reliance
measuret and ∆resource reliance measuret-1 through ∆resource reliance measuret-m Also
in some specifications contemporaneous values of several control variables and in some
cases their values at relevant lags are also included Finally in some specifications the
interaction of the measure of resource reliance used and log(Per Capita GDP) are also
entered into the equation either contemporaneously (∆resource reliance measuret X
∆log(Per Capita GDP)t) or at some lag of both variables (∆resource reliance measuret-m
X ∆log(Per Capita GDP)t-m) Meanwhile β is a (ktimes1) vector of parameters n is a
country fixed effect potentially correlated with variables in X v is a year fixed effect
potentially correlated with variables in X and u is a (ntimes1) vector of disturbance terms that
are unique to each country and assumed to be possibly heteroskedastic and correlated
within countries Both n and v imply that a dummy variable for each country in the data
set (except for one) are included in the equation and a year dummy for each year in the
panel data set (except for one) are also included Heterogeneous intercepts are estimated
by country and year (the φ and λ vectors respectively)21
21 Because of the terms discussed above Equation (1) depicts an ARDL(pq) with p equal to the number of lags of Polity that are selected by the AIC statistic and q equal to the number of lags of the measure of resource dependence selected Moreover Equation (1) is a rational distributed lag model with an infinite lag Because country dummies are also estimated there is the concern that bias is induced via the correlation between the lagged dependent variable(s) and the individual effects (see Nickell 1981) The biasrsquos severity is a function of the sample size and the magnitude of the autoregressive coefficient and decreases as T grows Monte Carlo evidence uncovered by Judson and Owen (1999) show that a fixed effect estimator performs as well or better than alternative approaches that use instrumental variables or a methods of moments (GMM) approach to address this bias Because T is always greater than 30 across our regressions we do not think it necessary to move beyond the Ordinary Least Squares context We note however that after running a series of so-called Arellano Bond difference GMM dynamic panel data regressions in which first differencing the data expunges the country fixed effects and the lagged dependent variable(s) are instrumented with all of their available lags materially similar results are returned
26
Several values hold interest the Impact Multiplier (the coefficient on the
contemporaneous value of resource dependence) the coefficients on the lags of resource
dependence and the Long-run Multiplier (the total long-run effect) The Impact
Multiplier is the immediate change in Polity due to a one-unit temporary change in
resource dependence The coefficients on any of the lags of resource dependence are the
delayed changes in Polity that occur after a temporary one-unit change in resource
dependence Finally the Long-run Multiplier depicts the total changes in Polity due to a
permanent change in resource reliance at an indeterminate time in the past22
Empirical Findings
We begin with a set of regressions in which resource dependence is proxied by
Fiscal Reliance on Oil or Minerals We present the results of a base specification of this
regression in Table 3 Column 1 If there is a resource curse we would expect to find a
negative coefficient on the Long Run Multiplier We would also expect the majority of
the coefficients on the lagged independent variable to be negative with many of them
significant The theoretical predictions on the Impact Multiplier are somewhat
ambiguous but one would probably not expect to find systematic positive coefficients
The regression results however yield coefficients with the ldquowrongrdquo signs The
Long Run Multiplier the Impact Multiplier and the majority of the coefficients on the 22 The Long-run Multiplier is calculated by setting the dependent and independent variables at their long-run values for all t and then finding the change in the long run value of the dependent variable with respect to the long run value of the independent variable See Wooldridge (2006) 638 Since the Long-run multiplier is non-linear function of the estimated coefficients its standard error is computed via the Delta Method Because of the correlation in changes in resource reliance at different lags it is often hard to gain precise estimates of the individual coefficients for each lag Therefore for each distributed lag model we also calculate an F-test on the hypothesis that the contemporaneous value of resource reliance and its lags are jointly statistically significant
27
lagged independent variable are positive To the degree that any variables yield a
statistically significant result it is that the coefficient on the sixth lag of the independent
variable ndash yet it is positive23 One might be tempted to argue that our results are an
artefact of our (very) long time series Perhaps the resource curse is a post-World War II
phenomenon only Column 2 of Table 3 therefore truncates the estimation to the 1950-
2006 period This move has no material effect on the results
One might also be tempted to argue that the positive coefficients we obtain are the
product of concomitant increases in GDP per capita that accompany the creation of
economies that experience increases in their resource dependence Specification 3
therefore adds controls for the log of GDP Per Capita and the Growth Rate of GDP Per
Capita One might also argue that the positive coefficients we obtain are the product of
the fact that there has been a world-wide trend towards increased democracy We
thereforecontrol for the possibility of contagion effects in specification 3 with three
variables following Gleditsch and Ward (2006) the percentage of countries in the world
that are democratic the percentage of countries in a resource producerrsquos geographic
region that are democratic and a dummy for a democratic transition in a resource
producerrsquos geographic region If anything these controls strengthen our earlier results
the coefficient on the Long Run Multiplier is now positive and significant at the 90
percent confidence level
A sceptical reader might argue that there are conditional effects For example
she might suggest that resource dependent countries with low per capita incomes (such as
Equatorial Guinea) might be affected by the resource curse while wealthy resource
23 For clarity of presentation we do not report the coefficients on every lag but only the last lag and any before the last lag that comes up as statistically significant in any specification
28
dependent countries (such as Canada) might be immune We therefore add interactions
of Per capita GDP and Fiscal Reliance on Oil or Minerals in specification 4 of Table 3
and calculate the marginal effects of Fiscal Reliance at the 25th 50th and 75th percentiles
of Per Capita GDP The results are inconsistent with this conditional resource curse
view the coefficients on the lower values of GDP Per Capita have the wrong sign and
none of the coefficients are statistically significant An even greater sceptic might argue
that the conditional effects occur with a lag We therefore interact per Capita GDP in t-6
and Fiscal Reliance on Oil or Minerals in t-6 (we choose t-6 because it is the one lag of
Fiscal Reliance that is statistically significant across our regressions) This step reported
in specification 5 increases the statistical significance of the marginal effects of Fiscal
Reliance as GDP Per Capita increases Nevertheless we still cannot obtain the negative
coefficient that one would expect at the 25th percentile of GDP (nor at lower values of Per
Capita Income that we do not report)
A diehard advocate of the resource curse might still insist that the resource curse
is actually a result of recent geo-strategic developments She might argue that the
dramatic increase in oil prices after 1973 gave significant leverage to oil producing
countries allowing them to become price setters and deploy the resulting rents to make
their governments accountability-proof knowing that uninterrupted access to oil trumps
any concern about democracy She might also point to the fact that increasing numbers
of oil producing governments nationalized their oil industries in those same decades
giving them greater control over oil rents We therefore test the hypothesis that the
resource curse is conditional with respect to this particular time period by truncating the
29
dataset to the period 1973-2006 This experiment reported in specification 6 of Table 3
has no material effect on any our results
One might argue that the results in Table 3 are a product of sample selection bias
because our panel dataset with Fiscal Reliance is truncated with respect to the number of
country cases We therefore substitute Gross Oil Rents Per Capita whose coverage is
global as the independent variable in Table 4 and re-run all of the regressions The
material results do not change appreciably when we substitute this new independent
variable Five the six specifications yield Long Run Multipliers with the wrong (positive)
sign We never detect statistically significant coefficients on the lagged independent
variable In fact in some specifications the coefficients on the lagged independent
variable are positive and statistically significant There is only one specification that
produces a result that is at all consistent with the Resource Cursemdashspecification 1 which
is run on the entire length of the panel and includes none of the conditioning variables In
this specification the Long Run Multiplier is negative (but far from significant) and the
Impact Multiplier is negative and significant This result is curious given the non-results
in the other regressions We therefore split the sample to the pre-1950 period and the
post-1950 period and allow the AIC to choose the most appropriate lag structure for each
sub-sample When we do so we find that the Long Run Multipliers are positive in both
specifications while the Impact Multiplier is positive and highly significant in the pre-
1950 period (results not shown) and negative in the post-1950 period It is however not
statistically significant (see Table 3 specification 2)
As a robustness check we re-estimate all the regressions run in Tables 3 and 4
substituting Windfall Profits from Oil and Minerals Per Capita as the independent
30
variable The results reported in Table 5 are not materially different from the results in
Tables 3 and 4 All the specifications yield Long Run Multipliers that have the wrong
(positive) sign The lagged independent variables are consistently positive Although the
Impact Multiplier is negative in specification 1 and significant at the 90 percent level
once we introduce control variables (specifications 2 through 4) the sign of the Impact
Multiplier turns positive
Robustness of Results Democracy as a Binary Variable
Several researchers claim that regime types are best modelled as binary variables
instead of continuous ones (see Przeworski et al 2000 chapter 1) We therefore re-run
the regressions on the Gross Oil Rents Per Capita and Windfall Profits from Oil and
Minerals Per Capita as dynamic conditional fixed effects logit regressions with a binary
measure of democracy REGIME Because we need to include the Per Capita GDP and
the Growth Rate of GDP Per Capita the dataset is truncated to post-1950 observations24
The estimation technique we adopt affords many advantages First it allows us to
calculate separate estimates for those countries observed as democratic and those
observed as autocraticmdashand then see whether they switch regime type as a result of
increased resource reliance Second we can include the independent variables in levels
Third departing from dynamic probit based approaches without country fixed effects
(eg Ross 2008) we can control for time-invariant heterogeneity between countries
A dynamic conditional logit model can estimate a first-order Markov chain
transition process between different states over time where the probability distribution of
yit for observation i at time t is modelled as a function of irsquos prior state at previous time 24 We do not run these logit regressions on the dataset on Fiscal Reliance on Oil or Minerals because there is not enough switching from one regime type to the next with only 17 countries
31
periods t -1hellip t-T Specifically if we invert REGIME so that autocracies are coded as
a ldquo1rdquo we can evaluate the conditional transition probabilities while expunging country
specific fixed effects via the following functional form
Pr(yit = 1 | yit-1 Xit-1) = Λ[αi + Xit-1β + yit-1ρ + ξ(yit-1Xit-1)+ vtλ+ uit] (2)
where Λ() is the logistic cumulative distribution α is the intercept term for country i and
depicts the fact that the country fixed effects are potentially correlated with variables in X
(although these coefficients are not actually estimated) X is a (ntimesk) matrix of n
observations on k explanatory variables β is a vector of estimated parameters that
indicate the effects of the covariates on the probability of a 1 at time t given a 0 at time t-
1 and ρ is the estimated coefficient on the lagged dependent variable meanwhile the
effects on the probability of a 1 at time t given a 1 at time t-1 are given by β + ξ (the
coefficients on the interactions between yit-1 and Xit) Meanwhile v is a year fixed effect
potentially correlated with variables in X and u is a (ntimes1) vector of disturbance terms that
are unique to each country and assumed to be possibly heteroskedastic and correlated
within countries Finally v implies that a dummy variable for each year (except for one)
are also included represented by the heterogeneous intercepts in vector λ25
The first set of coefficients evaluates the hypothesis that oil undermines democracy
and the addition of these coefficients and their respective interaction terms evaluates the
hypothesis that oil prevents democratization Therefore the coefficient on the measure of
resource reliance (un-interacted with the lagged dependent variable) is the effect of
resources on the likelihood that a democracy will revert to authoritarianism Conversely 25 We note that if a country did not experience a regime change during the time period under consideration the estimation procedure drops the panelrsquos observations because countries that do not switch from one state to another do not contribute any information towards the optimization of the log-likelihood function
32
because the addition of this coefficient and its interaction term represents the effect of
resource reliance on the likelihood that an autocracy will remain autocratic if we subtract
the product of this addition from 1 we can identify the impact of resource reliance on the
odds of democratic transition26
We present the results in Table 6 Specification 1 models the effect of increases in
Per Capita Oil Rents on countries that are observed in any year as democratic Per Capita
Resource Reliance t-1 tells us the effect of an increase in Per Capita Oil Rents on the
probability that those countries will become autocratic If increases in resource dependence
are associated with the breakdown of democracy the coefficient should have a positive sign
Our results however tell the opposite story the coefficient is negative although not
significant Specification 2 models the effect of increases in Per Capita Oil Rents on
countries that are observed in any year as authoritarian Here the resource curse would
predict a negative coefficient as Per Capita Oil Rents increase authoritarian countries
should be less likely to transition to democracy Once again however our results yield the
opposite result the coefficient is positive (although not significant)
We repeat these operations in specifications 3 and 4 substituting Windfall Profits
Per Capita as the independent variable We can now no longer use Cheibub and Gandhirsquos
(2004) version of the Przeworski et al (2000) REGIME variable This is because between
1970 and 2002 the years for which Cheibub and Gandhi provide data coverage most
countries exhibit a strictly monotonic trend in Windfall Profits Per Capita and thus the
26 To calculate the z-statistics and p-values for the coefficients that gauge the probability of transitions from autocracy to democracy we use the Delta Method because we are calculating the statistical significance for the addition of a linear term and its interaction with the lagged DV (Alternatively a Wald test of the hypothesis that β+ ξ = 0 returns the same results) All z-statistics are derived from robust standard errors clustered by country to address serial correlation and heteroskedasticity (see Beck et al 1998)
33
maximum likelihood estimation fails because convergence does not occur If we extend the
dataset to 2006 however the dominant pattern in Windfall Profits is no longer secularly
monotonic We therefore construct a binary measure from 1970 to 2006 derived from Polity
(following Gleditsch and Ward 2006) Specification 3 models the effect of increases in
Windfall Profits Per Capita on countries observed as democratic Once again the regression
produces a result with the wrong sign Specification 4 models the effect of increases in
Windfall Profits on countries that are observed as autocratic It produces a coefficient with
the predicted (negative) sign but it is very far from statistical significance
Multivariate Analyses of Hypothesis III
One potential criticism of our analyses so far is that because they estimate
country fixed effects they do not take into account countries whose Polity Scores or
binary democracy measure do not vary over time (see Ross 2008) Another potential
criticism of our tests is that they only measure countries against themselves through
before and after comparisons They therefore do not measure countries against what they
could have become during the period in which they have resources had they never
developed their oil or mineral sectors
In order to address these concerns we developed Counterfactual Polity which
measures the gap between the Polity Score of a resource dependent country and the
average Polity Score of the non-resource dependent countries in their respective regions
Therefore it exhibits time series variance even if the resource dependent countryrsquos Polity
Score does not vary Counterfactual Polity also addresses the criticism about measuring
countries against what they could have become The logic is that a resource dependent
34
country could have obtained the average Polity Score of the non-resource dependent
countries in its geographic region
Unit root and co-integration tests
We conduct the same diagnostic tests on Counterfactual that we did on Polity in
order to choose the correct functional form for the regressions We begin with
augmented Dickey-Fuller tests to investigate whether the data is stationary (see Table 2
Panels A and B) These test indicate that Counterfactual Polity is non-stationary except
for the particular sub-period 1970-2006 when it is included in a regression against
Windfall Profits on Oil or Minerals To identify if there is co-integration between
Counterfactual Polity and our resource dependence measures we again apply Maddala
and Wu (1999) augmented Dickey-Fuller tests on the residuals of a regression in which
Counterfactual Polity is regressed against resource dependence The results of these co-
integration tests are shown in Table 2 Panel C In only one of these specifications (Panel
C Column 2) do we find evidence of a long-run relationship Counterfactual Polity and
Fiscal Reliance on Resource Revenues appear to be co-integrated
Regression Specification
Our diagnostic tests indicate that the regressions of Counterfactual Polity against
Gross Oil Rents Per Capita and against Windfall Profits Per Capita should be estimated
using the ARDL framework in first differences we introduced earlier Our tests also
indicate that it is possible to model the relationship between Counterfactual Polity and
35
Fiscal Reliance on Oil or Minerals under this same ARDL framework but with a slight
twist via an Error Correction Model (ECM) interpretation27
The ECM interpretation makes three improvements to the purely first-differenced
ARDL model First it allows us to model the relationship in levels between Polity and
resource dependence Second the ECM not only allows for the evaluation of both short
and long run impacts of changes in the independent variable it also allows the estimation
of the speed at which the long-run equilibrium between the variables is restored ndash or
ldquocorrectedrdquo ndash after a short-term shock We therefore estimate a regression that can be
expressed with the following functional form
∆Yit = ∆Yit-1ρ0 +hellip+ ∆Yit-kρk + ∆Xitβ1 + ∆Xit-1β2 +hellip+ ∆Xit-kβk +δ(Yit-1 - Xit-1γ) +
niφ+ vtλ+ uit (3)
where short-run changes in Y that take a yearrsquos time to elapse are captured by the
coefficients on the differenced independent variables increases in X produce a change in
Y that also disrupts the long-term equilibrium relationship between the level of X and Y
and subsequent (lagged) changes in Y are conditioned by deviations from the long-run
equilibrium Y will respond by gradually returning to this relationship registering a total
change equal to γ Specifically when Yit-1 gt Xit-1γ (the coefficient on the lagged
independent variable in levels is negative) then Y has overshot the equilibrium in the
27 In the case of non-stationary variables that stationary after first-differencing such as Counterfactual Polity and Fiscal Reliance Engle and Granger (1987) have shown that if there is a linear combination of the non-stationary processes that is itself stationary call it yit ndash γxit then yit and xit are co-integrated with parameter γ and their time-series relationship can be depicted through an ECM framework Furthermore the latter is equivalent to an ARDL approach (see DeBoef and Keele 2008) These innovations are made possible by simply adding the stationary variable identified above yit ndash γxit to equation (1) More specifically lags of each constituent part are added so that the model now also includes yit-1 and γxit-1 and the equation (excluding control variables for simplicity) DeBoef and Keele also argue that an ECM framework is the most valid way to model the relationship between stationary time series when complex dynamics at work
36
previous period and the error correction term works to push Y back towards the equilibrium
by inducing negative changes in subsequent periods at a rate determined by δ
Alternatively when Yit-1 lt Xit-1γ (the coefficient on the lagged independent variable in
levels is positive) then Y has remained below the equilibrium in the previous period and the
error correction term induces positive changes in subsequent periods The δ term is lt 0 and
is the error correction rate so that a δ proportion of this discrepancy (or ldquoerrorrdquo) is
corrected by a movement in the dependent variable each subsequent period Finally if
Yit-1 = Xit-1γ the dependent and independent variable are in a long-run equilibrium
Table 7 presents the results of these estimations repeating the order of
specification from Table 3 The Resource Curse would predict that Counterfactual Polity
and Fiscal Reliance on Oil or Minerals will tend to revert back to their long-run
relationship over time higher fiscal reliance will lead to lower Counterfactual Polity
Capturing the process by which these two variables remain in equilibrium requires three
terms the short run shocks (represented in our model as the first-differenced versions of
Fiscal Reliance) the error correction term which is the rate at which the equilibrium is
restored (represented in our model by the lagged dependent variable in levels) and the
Long Run Multiplier which is the total effect that an increase in Fiscal Reliance has on
Counterfactual Polity spread over future time periods The resource curse would predict
negative coefficients for the first-differenced Fiscal Reliance terms as well for the Long
Run Multiplier28 Meanwhile whether there is a resource curse or a resource blessing
the error correction term should be negative since it depicts the restoration to equilibrium
28 We constructed Counterfactual Polity so that its values shrink as the average Polity Score for non resource producers becomes greater than the resource producersrsquo Polity Score
37
The coefficients in Table 7 do not yield the predicted signs The coefficients for
the short-run changes in Fiscal Reliance and for the Long Run Multiplier are positive in
every specification There also appears to be a positive short run effect (at the sixth year
lag) that enters as significant in some specifications That is regardless of how we
truncate the data set or add conditioning variables we cannot find a result that is
consistent with the resource curse None of the specifications that look for the marginal
effects of Fiscal Reliance at different levels of Per Capita Income (columns 4 5 and 6)
produce the predicted results either poor countries that become increasingly resource
dependent do not see a decline in Counterfactual Polity
As we did for our regressions on Polity we repeat the regressions on
Counterfactual Polity substituting in Gross Oil Rents Per Capita Because the latter series
is not cointegrated with Counterfactual Polity we revert to the ARDL framework in first
differences that we employed in our regressions on Polity The results of these
regressions are presented in Table 8 and are not materially different from the regression
that used Fiscal Reliance as the independent variable Some of the independent variables
that capture short run effects (lagged Gross Oil Rents) are negative and significant but
they are matched by even larger positive and significant coefficients on other lagged
terms For example in specification 1 the contemporaneous effect of a change in Gross
Oil Rents on Counterfactual Polity is negative as is the effect of a change in Gross Oil
Rents on Counterfactual Polity with a four year lag The effect of a change in Gross Oil
Rents on Counterfactual Polity with a one year lag is however positive significant and
of large magnitude relative to the other lags The net effect is captured by the Long Run
38
Multiplier which is positive In fact the LRM is positive in every specification and is
almost always significant at the 95 percent level
Table 9 repeats this process substituting Windfall Profits from Oil and Minerals
Per Capita as the independent variable If anything these results cast even stronger doubt
on the notion of a resource curse Indeed the regressions produce results that are
consistent with an argument for a resource blessing the Long Run Multipliers are always
positive and significant the independent variable lagged one period is always positive
and significant and it dwarfs any negative coefficients revealed in any other year
V Conclusion
We have developed new datasets to analyze the relationship between oil or
mineral dependence and regime types within countries over the time We observe
countries prior to their becoming resource dependent and evaluate whether increasing
resource dependence over time affected their regime type ndash both relative to their level of
democracy before resource dependence and relative to the democratization experiences of
countries that were similar to them save for resource dependence Our results indicate
that natural resource dependence does not undermine democracy preclude democratic
transitions or protract democratic transitions Our evidence also does not support the
view that there are conditional resource curse effects that are systematicmdashat least to the
degree that these conditions are captured by differences in per capita incomes This is
not to say that there may not be cases in which natural resources contributed to the
maintenance of an authoritarian regime in a particular time and placemdashindeed it would
be surprising if this never happened It is to say however that the evidence does not
39
support generalizable law-like statements about the impact of natural resources on
regime types
The implications of our analysis are clear It is not the case that oil or mineral
abundance causes countries to become autocratic It is also not the case that oil or
mineral abundance in the presence low GDP causes autocracy Rather autocracy as
well as economic reliance on oil or minerals is often jointly determined by a countryrsquos
fundamental institutions
Our results have significant methodological implications Researchers in
comparative politics are intensely interested in explaining processes that occur within
countries over time such as the rise of the welfare state transitions to democracy and the
onset of domestic conflict In studying these processes however comparativists have
tended to rely on datasets that have limited longitudinal coverage They therefore employ
pooled regression techniques treating countries as homogenous units Our results
suggest that when the theory in question is not about static cross-sectional differences
between countries but about changes that take place within countries over time
assembling and using long-run time-series datasets designed to operationalize explicitly
specified counterfactuals is a better match between theory and empirics than regressions
centered on the cross-sectional analysis of longitudinally truncated data
40
References Anderson Lisa 1987 ldquoThe State in the Middle East and North Africardquo Comparative
Politics 20 (1) 1-18 Arellano Manuel and Stephen Bond 1991 ldquoSome tests of specification for panel data
Monte Carlo evidence and an application to employment equationrdquo Review of Economic Studies 58 277-97
Bardhan Pranab 1993 ldquoSymposium on Democracy and Developmentrdquo Journal of Economic Perspectives 7 (3) 45-49
Beblawi Hazem 1987 ldquoThe Rentier State in the Arab Worldrdquo In Hazem Beblawi and Giacomo Luciani eds The Rentier State (New York Croom Helm)
Beck Nathaniel and Jonathan Katz 2004 ldquoTime-Series Cross-Section Issues Dynamicsrdquo Unpublished Manuscript
Beck Nathaniel Jonathan Katz and Richard Tucker 1998 ldquoTaking Time Seriously
Time-Series Cross-Section Analysis with a Binary Dependent Variablerdquo American Journal of Political Science 42 1260-88
Bellin Eva 2004 ldquoThe Robustness of Authoritarianism in the Middle East Exceptionalism in Comparative Perspectiverdquo Comparative Politics 36 (2) 139-57
Boix Carles and Sebastian Rosato 2001 ldquoA Complete Data Set of Political Regimes 1800-1999rdquo Department of Political Science University of Chicago
Central Intelligence Agency The World Factbook 2008 httpswwwciagovlibrarypublicationsthe-world-factbook
Chaudhry Kiren Aziz 1989 ldquoThe Price of Wealth Business and State in Labor Remittance and Oil Economiesrdquo International Organization 43 (1) 101ndash45
Chaudhry Kiren Aziz 1994 ldquoEconomic Liberalization and the Lineages of the Rentier Staterdquo Comparative Politics 27 1-25
Chaudry Kiren Aziz 1997 The Price of Wealth Economies and Institutions in the Middle East Ithaca NY Cornell University Press
Cheibub Jose-Antonio and Jennifer Gandhi 2004 ldquoClassifying Political Regimes A Six-Fold Classification of Democracies and Dictatorshipsrdquo Department of Political Science Yale University
Clark John 1997 ldquoPetro-Politics in Congordquo Journal of Democracy 8 (3) 62-76 Clark John 1998 ldquoThe Nature and Evolution of the State in Zairerdquo Studies in
Comparative International Development 32 (4) Collier Paul 2007 The Bottom Billion Why the Poorest Countries Are Falling Behind
and What Can Be Done About It Oxford Oxford University Press Conley John and Akram Temini 2001 ldquoEndogenous Enfranchisement When Groups
Preferences Conflictrdquo Journal of Political Economy 109 (1) 79-102 Crystal Jill 1989 ldquoCoalitions in Oil monarchies Kuwait and Qatarrdquo Comparative
Politics 21 427ndash43 Crystal Jill 1990 Oil and Politics in the Gulf Rulers and Merchants in Kuwait and
Qatar New York Cambridge University Press Cutler David Angus Deaton and Adriana Lleras-Muney 2006 ldquoThe Determinants of
Mortalityrdquo Journal of Economic Perspectives Volume 20 (3) 97-120
41
Daveri Francesco and Guido Tabellini 1997 ldquoUnemployment Growth and Taxation in Industrial Countriesrdquo London Centre for Economic Policy Research Discussion Paper 1681
David Paul and Gavin Wright 1997 ldquoIncreasing Returns and the Genesis of American Resource Abundancerdquo Industrial and Corporate Change 6 (2) 203-45
DeBoef Suzanna and Luke Keele 2008 ldquoTaking Time Seriouslyrdquo American Journal of Political Science Volume 52(1) 184-200
Dillman Bradford L 2000 State and Private Sector in Algeria The Politics of Rent-Seeking and Failed Development Boulder CO Westview Press
Driscoll John and Aart Kraay 1998 ldquoConsistent Covariance Matrix Estimation with Spatially Dependent Panel Datardquo Review of Economics and Statistics 80 549-560
Dunning Thad 2008 Crude Democracy Natural Resource Wealth and Political Regimes New York Cambridge University Press Engle Robert and Clive Granger 1987 ldquoCointegration and Error Correction
Representation Estimation and Testingrdquo Econometrica Volume 55(2) 251-76 Englebert Pierre 2000 State Legitimacy and Development in Africa Boulder Lynne
Rienner Publishers Fisher RA 1932 Statistical Methods for Research Workers Edinburgh England Oliver
and Boyd Gardinier David E 2000 ldquoFrance and Gabon Since 1993 The Reshaping of the Neo-
Colonial Relationshiprdquo Journal of Contemporary African Studies 18 225-42 Gasiorowski Mark 1995 ldquoEconomic Crisis and Political Regime Change An Event
History Analysisrdquo American Political Science Review 89 (December) 882-97 Gleditsch Kristian and Michael D Ward 2006 Diffusion and the International
Context of Democratization International Organization 60 (4) 911-933 Goldberg Ellis Eric Wibbels and Eric Myukiyehe 2008 ldquoLessons from Strange
Cases Democracy Development and the Resource Curse in the US Statesrdquo Comparative Political Studies 41 477-514
Granger Clive 1981 ldquoSome Time-Series Data and their use in Econometric Model Specificationrdquo Journal of Econometrics 16 121-130
Granger CWJ and P Newbold 1974 ldquoSpurious Regressions in Econometricsrdquo Journal of Econometrics 2 111-120
Jaggers Keith and Marshall Monty 2005 Polity IV Codebook George Mason University Arlington VA
Haber Stephen 2006 ldquoAuthoritarian Governmentrdquo In Barry Weingast and Donald Wittman eds The Oxford Handbook of Political Economy (Oxford University Press) pp 693-707
Haber Stephen Armando Razo and Noel Maurer 2003 The Politics of Property Rights Political Instability Credible Commitments and Economic Growth in Mexico 1876-1929 New York Cambridge University Press
Haber Stephen Noel Maurer and Armando Razo 2003 ldquoWhen the Law Does Not Matter The Rise and Decline of the Mexican Oil Industryrdquo The Journal of Economic History 63 (1) 1-31
Hamilton Kirk and Michael Clemens 1999 ldquoGenuine Savings Rates in Developing Countriesrdquo World Bank Economic Review 13 333-56
42
Harford Tim and Michael Klein 2005 ldquoAid and the Resource Curserdquo Public Policy for the Private Sector 291
Herb Michael 1999 All in the Family Absolutism Revolution and Democracy in the Middle Eastern Monarchies Albany NY State University of New York Press
Herb Michael 2005 ldquoNo Representation without Taxation Rents Development and Democracyrdquo Comparative Politics 37 297-317
Herbst Jeffrey 2000 States and Power in Africa Comparative Lessons in Authority and Control (Princeton University Press)
Heston Alan Robert Summers and Bettina Aten 2004 Penn World Table Version 61 Center for International Comparisons at the University of Pennsylvania (CICUP)
Hodges Tony 2001 Angola From Afro-Stalinism to Petro-Diamond Capitalism Bloomington IN Indiana University Press
Huntington Samuel 1991 The Third Wave Democratization in the Late Twentieth Century Norman OK University of Oklahoma Press
Jensen Nathan and Leonard Wantchekon 2004 ldquoResource Wealth and Political Regimes in Africardquo Comparative Political Studies 37 816ndash41
Jones Luong Pauline and Erica Weinthal 2006 ldquoRethinking the Resource Curse Ownership Structure Institutional Capacity and Domestic Constraintsrdquo Annual Review of Political Science 9 241-63
Judson Ruth and Ann Owen 1999 ldquoEstimating dynamic panel data models a guide for macroeconomistsrdquo Economic Letters 65 9-15
Karl Terry Lynn 1997 The Paradox of Plenty Oil Booms and Petro-States Berkeley CA University of California Press
Khan Sara Ahmad 1994 Nigeria The Political Economy of Oil Oxford Oxford University Press
Kittel Bernhard and Hannes Winner 2005 ldquoHow Reliable is Pooled Analysis in Political Economy The Globalization-Welfare State Nexus Revisitedrdquo European Journal of Political Research 44 269-293
Lederman Daniel and William F Maloney (eds) 2007 Natural Resources Neither Curse nor Destiny World BankStanford University Press
Lederman Daniel and William F Maloney 2008 In Search of the Missing Resource Curse Economiacutea 9(1) 1-53
Lees GM 1940 ldquoThe Search for Oilrdquo The Geographical Journal Volume XCV(1) 1- 16
Lipset Seymour Martin 1959 ldquoSome Social Requisites of Democracy Economic Development and Political Legitimacyrdquo American Political Science Review 53 69-105
Lizzeri Alessandro and Nicola Persico 2004 ldquoWhy did the Elites Extend the Suffrage Democracy and the Scope of Government with an Application to Britainrsquos lsquoAge of Reformrsquordquo The Quarterly Journal of Economics 119 (2) 707-765
Llavador Humberto and Robert Oxoby 2005 ldquoPartisan Competition Growth and the Franchiserdquo The Quarterly Journal of Economics 120 (3) 1155-1189
Luciani Giacomo 1987 ldquoAllocation versus Production States A Theoretical Frameworkrdquo In Hazem Beblawi and Giacomo Luciani eds The Rentier State (New York Croom Helm)
Lusigi Angela and Colin Thirtle 1997 ldquoTotal Factor Productivity and the Effects of
43
RampD in African Agriculturerdquo Journal of International Development 9 529-538 Maddala GS and Shaowen Wu 1999 ldquoA Comparative Study of Unit Root Tests with
Panel Data and a New Simple Testrdquo Oxford Bulletin of Economics and Statistics Special Issue 631-652
Mahdavy Hussein 1970 ldquoThe Patterns and Problems of Economic Development in Rentier States The Case of Iranrdquo In MA Cook ed Studies in the Economic History of the Middle East (London England Oxford University Press)
Manzano Osmel and Roberto Rigobon 2007 ldquoResource Curse or Debt Overhangrdquo In Daniel Lederman and William F Maloney eds Natural Resources Neither Curse nor Destiny World BankStanford University Press
Marshall Monty and Keith Jaggers 2008 ldquoPolity IV Project Political Regime Characteristics and Transitions 1800-2006rdquo University of Maryland
McSherry Brendan 2006 ldquoThe Political Economy of Oil in Equatorial Guineardquo African Studies Quarterly 8 23-45
Nickell Stephen 1981 ldquoBiases in Dynamic Models with Fixed Effectsrdquo Econometrica 49 1417ndash26
Norman Catherine Forthcoming ldquoRule of Law and the Resource Curse Abundance Versus Intensityrdquo Environmental Resource Economics
North Douglass and Barry Weingast 1989 ldquoConstitutions and Commitment The Evolution of Institutional Governing Public Choice in Seventeenth-Century England The Journal of Economic History Volume 49(4) 803-832
Papaioannou Elias and Gregorios Siourounis 2008 ldquoEconomic and Social Factors Driving the Third Wave of Democratizationrdquo CEPR Discussion Paper DP6986
Pesaran M Hashiem Yongcheol Shin and Richard Smith 1999 ldquoPooled Mean Group Estimation of Dynamic Heterogeneous Panelsrdquo Journal of the American Statistical Association 94 621-634
Pesaran M Hashiem Yongcheol Shin and Richard Smith 2001 ldquoBounds Testing Approaches to the Analysis of Level Relationshipsrdquo Journal of Applied Econometrics 16 289-326
Phillips PCB 1986 ldquoUnderstanding Spurious Regressions in Econometricsrdquo Journal of Econometrics 33 311-340
Przeworski Adam Michael Alvarez Joseacute Antonio Cheibub and Fernando Limongi (2000) Democracy and Development Political Institutions and Well-Being in the World 1950-1990 New York Cambridge University Press
Ramsey Kevin 2008 ldquoThe Price of Oil and Democracyrdquo Mimeo Princeton University Update citation
Rosenberg Tina 2007 ldquoThe Perils of Petrocracyrdquo The New York Times Magazine (November 4)
Ross Michael 1999 ldquoThe Political Economy of the Resource Curserdquo World Politics 51 297-322
Ross Michael 2001a ldquoDoes Oil Hinder Democracyrdquo World Politics 53 325-61 Ross Michael 2001b Extractive Sectors and the Poor Washington DC Oxfam
America Ross Michael 2004 ldquoDoes Taxation Lead to Representationrdquo British Journal of
Political Science 34 229-49 Ross Michael 2006 ldquoA Closer Look at Oil Diamonds and Civil Warrdquo Annual Review
44
of Political Science 9 265-300 Skocpol Theda 1982 ldquoState and Shirsquoa Islam in the Iranian Revolutionrdquo Theory and
Society 11 (3) 265-83 Smith Benjamin 2004 ldquoOil Wealth and Regime Survival in the Developing World
1960-1999rdquo American Journal of Political Science 48 (2) 232-46 Smith Benjamin 2007 Hard Times in the Land of Plenty Oil Politics in Iran and
Indonesia Ithaca NY Cornell University Press Soares Rodrigo 2007 ldquoOn the Determinants of Mortality Reductions in the Developing
Worldrdquo Population and Development Review 33(2) 247-287 Stasavage David 2003 Public Debt and the Birth of the Democratic State France and
Great Britain 1688-1789 Cambridge England Cambridge University Press Summerhill William 1997 ldquoTransport Improvements and Economic Growth in Brazil
and Mexicordquo In Stephen Haber ed How Latin America Fell Behind Essays on the Economic Histories of Brazil and Mexico 1800-1914 (Stanford University Press Stanford CA pp 93-117)
Ulfelder Jay 2007 ldquoNatural Resource Wealth and the Survival of Autocraciesrdquo Comparative Political Studies 40 (8) 995-1018
Van de Walle Nicolas 1994 ldquoNeopatrimonialism and Democracy in Africardquo In Jennifer Widner ed Economic Change and Political Liberalization in Sub-Saharan Africa (Baltimore Maryland Johns Hopkins University Press)
Vandewalle Dirk 1998 Libya since Independence Oil and State-Building Ithaca NY Cornell University Press
Vandewalle Dirk 2006 A History of Modern Libya New York Cambridge University Press
Wantchekon Leonard 2002 ldquoWhy do Resource Dependent Countries Have Authoritarian Governmentsrdquo Journal of African Finance and Economic Development 2 57ndash77
Williams Rick 2000 ldquoA Note on Robust Variance Estimation for Cluster-correlated Datardquo Biometrics 56 645-646
Woodridge Jeffrey 2006 Introductory Econometrics A Modern Approach Mason OH Thompson South-Western
World Bank 2008 World Development Indicators Washington DC World Bank httpddp-extworldbankorgextDDPQQmemberdomethod=getMembers
Wright Gavin and Jessie Czelusta 2004 The Myth of the Resource Curse Challenge 47 6-38
Yates Douglas A 1996 The Rentier State in Africa Oil Rent Dependency and Neocolonialism in the Republic of Gabon Trenton NJ Africa World Press
45
Figure 1Trinidad and Tobago Resource Reliance and Polity 1960-2006
Polity (left axis)
Fiscal Reliance (left axis)
Gross Oil Rents (right axis)
Windfall Profits (right axis)
0
10
20
30
40
50
60
70
80
90
10019
6219
6319
6419
6519
6619
6719
6819
6919
7019
7119
7219
7319
7419
7519
7619
7719
7819
7919
8019
8119
8219
8319
8419
8519
8619
8719
8819
8919
9019
9119
9219
9319
9419
9519
9619
9719
9819
9920
0020
0120
0220
0320
0420
0520
06
Polit
y an
d Fi
scal
Rel
ianc
e
0
1000
2000
3000
4000
5000
6000
7000
8000
Win
dfal
l Pro
fits
and
Gro
ss O
il R
ents
Per
Cap
ita 2
007
US$
Polity Fiscal Reliance Gross Oil Rents Per Capita Windfall Profits Oil and Minerals Per Capita
46
Figure 2Nigeria Resource Reliance and Polity 1960-2006
Polity (left axis) Fiscal Reliance on Oil (left axis)
Gross Oil Rents (right axis)
Windfall Profits (right axis)
0
10
20
30
40
50
60
70
80
90
100
196019
6119
6219
6319
6419
6519
6619
6719
6819
6919
7019
7119
7219
7319
7419
7519
7619
7719
7819
7919
8019
8119
8219
8319
8419
8519
8619
8719
8819
8919
9019
9119
9219
9319
9419
9519
9619
9719
9819
9920
0020
0120
0220
0320
0420
0520
06
Polit
y an
d Fi
scal
Rel
ianc
e on
Oil
0
200
400
600
800
1000
1200
Win
dfal
l Pro
fits
and
Gro
ss O
il R
ents
Per
Cap
ita 2
007
US$
Polity Fiscal Reliance Gross Oil Rents Per Capita Windfall Profits Oil and Minerals Per Capita
47
Figure 3Mexico Resource Reliance and Polity 1822-2006
Polity (left axis)
Fiscal Reliance (left axis)
Gross Oil Rents (right axis)
Windfall Profits (right axis)
0
10
20
30
40
50
60
70
80
90
10018
2218
2618
3018
3418
3818
4218
4618
5018
5418
5818
6218
6618
7018
7418
7818
8218
8618
9018
9418
9819
0219
0619
1019
1419
1819
2219
2619
3019
3419
3819
4219
4619
5019
5419
5819
6219
6619
7019
7419
7819
8219
8619
9019
9419
9820
0220
06
Polit
y an
d Fi
scal
Rel
ianc
e
0
200
400
600
800
1000
1200
Win
dfal
l Pro
fits
and
Gro
ss O
il R
ents
Per
Cap
ita 2
007
US$
Polity Fiscal Reliance Gross Oil Rents Per Capita Windfall Profits Oil and Minerals Per Capita
48
Figure 4Angola Resource Reliance and Polity 1970-2006
Polity (left axis)
Fiscal Reliance (left axis)
Gross Oil Rents (right axis)
Windfall Profits (right axis)
0
10
20
30
40
50
60
70
80
90
10019
70
1972
1974
1976
1978
1980
1982
1984
1986
1988
1990
1992
1994
1996
1998
2000
2002
2004
2006
Polit
y an
d Fi
scal
Rel
ianc
e
0
400
800
1200
1600
2000
2400
Win
dfal
l Pro
fits
and
Gro
ss O
il R
ents
200
7 U
S$
Polity Fiscal Reliance Gross Oil Rents Per Capita Oil and Mineral Windfall Profits Per Capita
49
50
Figure 5 Indonesia Resource Reliance and Polity 1945-2006
Polity (left axis)
Fiscal Reliance (left axis)
Gross Oil Rents (right axis)
Windfall Profits(right axis)30
40
50
60
70
80
90
100
1989
1991
1993
1995
1997
1999
2001
2003
2005
Polit
y an
d Fi
scal
Rel
ianc
e
0
50
100
150
200
250
300
350
400
Win
dfal
l Pro
fits
and
Gro
ss O
il R
ents
200
7 U
S$
0
10
20
1945
1947
1949
1951
1953
1955
1957
1959
1961
1963
1965
1967
1969
1971
1973
1975
1977
1979
1981
1983
1985
1987
Polity Fiscal Reliance Gross Oil Rents Per Capita Windfall Profits Oil and Minerals Per Capita
Table 1 Summary Statistics of the within variation for Dependent Variables and Co-variates included in Regression Models
Summary Statistics for Resource Dependence and Regime Type measures
Panel A 1800-2006 Fiscal Reliance as independent variable 1776-2006 Gross Oil Rents as independent variable 1970-2006 Windfall Profits as independent variableFiscal Reliance Polity CF Polity Gross Oil Rents Polity CF Polity Windfall Profits Polity CF Polity
Mean 21 34 -6664 $3083 46 -1763 $677 56 -0673Minimum 0 0 -60 0 0 -83947 0 0 -8025Maximum 978 100 85 $79093 100 95 $6286 100 91667Standard Deviation 214 22937 18389 1675 24475 18742 2157 20242 15769
Resource measure observations of countries Mean of T observations of countries Mean of T observations of countries Mean of Tpanel statistics 1654 17 97 14111 164 86 4695 153 31
Panel B∆Fiscal Reliance ∆Polity ∆CF Polity ∆Gross Oil Rents ∆Polity ∆CF Polity ∆Windfall Profits ∆Polity ∆CF Polity
Mean 0324 0354 -0073 $783 0237 -0136 $16 0688 -0088Minimum -3768 -70 -70623 -$22822 -95 -89515 -$18623 -75 -775Maximum 67857 75 66379 $46942 80 76666 $3691 80 73462Standard Deviation 5802 6531 7674 1000 7505 7433 1433 8883 8627
Resource measure observations of countries Mean of T observations of countries Mean of T observations of countries Mean of Tpanel statistics 1610 17 95 13879 164 85 4529 152 30
Summary Statistics for Control Variables (observed over Gross Oil Rents panel)Panel C
Per Capita GDP Econ Growth Rate Democ World Democ Region ∆Per Capita GDP ∆Growth Rate ∆ Dem World ∆ Dem Region
Mean $5981 2 24 25 $1329 0111 03 04Minimum $256 78 0 0 -$3469 -75 -6 -67Maximum $37304 -46 49 100 $3570 110 6 67Standard Deviation 3069 634 10 21 324 7977 1385 3368
Fiscal Reliance is Fiscal Reliance on Resource Revenues Polity is Polity 2 Score normalized to run from 0 to 100 CF Polity is Counterfactual Polity Polity - Polity Score of non-resourceproducers average Polity Score in the countrys geographic-cultural region (see text for coding critera) Gross Oil Rents is Per Capita Gross Oil Rents (see text for construction) Windfall Profits is Per Capita Windfall Profits on Resources (see text for construction) Per Capita GDP is Real Per Capita GDP Econ Growth Rate is the yearly rate of growth of GDP Per Capita Democ World is the percent of democracies in the world in year t Democ Region is the percent of democracies in the region of the world of each country by year ∆ is the first-difference operator Summary statistics for resource dependence measures only for country-years in which Polity Score values are not set to missing summary statistics for Polity only for country-years in which the relevant resource dependence measure is not set to missing summary statistics for control variables only for country-years in which Polity Scores are not set to missing and Gross OilRents are not set to missing
51
52
Table 2 Maddala and Wu (1999) unit root and co-integration tests (Augmented Dickey Fuller Tests for unbalanced panel datasets)
Unit Root tests null hypothesis is that the data follows a Random Walk without Drift
Panel A 1800-2006 Fiscal Reliance as independent variable 1776-2006 Gross Oil Rents as independent variable 1970-2006 Windfall Profits as independent variableFiscal Reliance Polity CF Polity Gross Oil Rents Polity CF Polity Windfall Profits Polity CF Polity
Chi-square statistic 4096 11841 38706 335707 182091 325941 105613 275425 704289p-value 0192 0999 0266 002 1 0459 1 0862 0 lags included 16 8 6 20 16 9 10 5 5trend included YES YES NO YES YES NO YES YES NOstationary NO NO NO YES NO NO NO NO YES
Panel B∆Fiscal Reliance ∆Polity ∆CF Polity ∆Gross Oil Rents ∆Polity ∆CF Polity ∆Windfall Profits ∆Polity ∆CF Polity
Chi-square statistic 14383 13639 270901 519258 1505264 345437 467064p-value 0 0 0 0 0 0041 0 lags included 15 7 5 15 8 10 4trend included NO YES NO YES NO YES YESorder of integration I (1) I (1) I (1) I (0) I (1) I (1) I (0) I (1) I (0)
Co-integration tests unit root test on the residuals of a two-way fixed effects modelPanel C
Polity and Fiscal Reliance CF Polity and Fiscal Reliance Polity and Windfall ProfitsChi-square statistic 1701 47239 310422p-value 0993 0065 0271 lags included 15 6 10trend included NO NO NOCo-integration NO YES NOEstimation strategy ∆ARDL ECM ∆ARDL
significant at the 01 level 05 level 10 levelUnit-root and co-integration tests are Maddala-Wu-Fisher versions of Dickey Fuller tests This test combines the results of the country by country unit root tests each with p-value Pi and yields the following test-statistic -2Σlog(Pi) distributed chi-square with 2N degrees of freedom (see Maddala and Wu 1999 636) Time trend included in unit root tests when it was significant at conventional levels no series found to follow a Random Walk with drift Fiscal Reliance is Fiscal Reliance on Resource Revenues Polity is Polity Score CF Polity is Counterfactual Polity Gross Oil Rents is Per Capita Gross Oil Rents Windfall Profits is Per Capita Windfall Profits on Resources ∆ is first-difference operator I (n) denotes that data series is integrated of order n of lags of the dependent variable included in the test are selected by the Akaike Information Criterion The AIC choose lag length p to minimize log(SSR(p)n)+(p+1)2n where SSR(p) is the sum of squared residuals for the Vector Autoregression Model (VAR) with p lags and n is the number of observations ECM = Error Correction Model ∆ARDL = Autoregressive Distributed Lagmodel in first differences Co-integration tests are augmented Dickery Fuller tests on the residuals from a regression of Regime Type against Resource Dependence measure Because thistest relies on no cross-country correlation between observations we run each regression with year dummies and use Driscoll-Kraay standard errors which are robust to contemporaneous correlation and serial correlation (see Driscoll and Kraay 1998) We also include country dummies to control for unobserved heterogeneity For the co-integration tests if we reject the Ho thatthe spead between both variables is non-stationary this evidences that the data-series are co-integrated
Table 3 Autoregressive Distributed Lag Panel Data Model in First Differences
Dependent Variable is ∆Polity (Polity 2 Score normalized to vary from 0 to 100)
ARDL (115) ARDL (16) ARDL (16) ARDL (16) ARDL (16) ARDL (16)1 2 3 4 5 6
1800-2006 1950-2006 1950-2006 1950-2006 1950-2006 1973-2006∆Polity t-1 0059 0055 0027 0026 0026 0027
[145] [166] [091] [092] [085] [073] of Fiscal Reliance lags included 15 6 6 6 6 6AIC statistic for of lags chosen 6603 7719 7664 7668 7824 8039F-test for all lags of Fiscal Reliance 17523 146 173 138 157 184p-value 0 025 01711 0278 0216 0147Long-run Multiplier total change due 0354 0349 033 0328 0331 0337to a permanent change in Fiscal Rel [138] [155] [186] [182] [164] [153]∆Fiscal Reliance on 0002 0009 002 0019 004 0066Natural Resources [006] [036] [068] [048] [096] [120]∆Fiscal Reliance t-6 0157 016 0147 0147 0152 015
[219] [223] [231] [229] [210] [199]∆Fiscal Reliance t-15 004
[064]∆Fiscal Reliance X ∆ Log(Per 0015Capita GDP) [008]∆Fiscal Reliance X ∆ Log(Per 1202 1089Capita GDP) t-6 [122] [118]Marginal effect of Fisc Rel at 0019 0141 013325th Percentile of FD Log(PCGDP) [046] [186] [166]Marginal effect of Fisc Rel at 0018 0128 016750th Percentile of FD Log(PCGDP) [044] [158] [228]Marginal effect of Fisc Rel at 0019 0208 01975th Percentile of FD Log(PCGDP) [059] [283] [257]∆Log(Per Capita GDP) 3777 3641 3023 6329
[057] [050] [041] [068]∆Log(Per Capita GDP) t-6 1241 1931
[018] [026]∆ Growth of GDP Per Capita -0013 -0013 -0016 -0018
[019] [019] [021] [021]∆ Democracies in the Region 001 001 -0007 -0043
[012] [012] [008] [043]∆ Democracies in the World -1743 -1742 0173 0525
[098] [098] [048] [099]Democratic Transition in Region 25336 2534 25208 29608Dummy [322] [323] [336] [339]F-test for country dummies 5459312 69793 100205 1156801 82000 5095767p-value 0 0 0 0 0 0F-test for year dummies 583 488 757 86 2857 862p-value 00004 00014 00001 0 0 0Arellano Bond AR(1) serial 064 007 01 011 009 062correlation test 05239 09466 0924 0914 0931 0532Observations 1226 577 567 517 567 431R-squared 016 016 024 025 024 027
Robust t statistics clustered by country in brackets
included but not reported year dummies included but not reported lags of dependent variable to include based onthe minimization of AIC statistic only 1 lag selected which fully eliminates AR(1) and higher-order serial correlation lags of Fiscal Reliance to include calculated based on minimization of AIC statistic all lags of Fiscal Relianceincluded but only relevant lags reported Long-run Multiplier (LRM)(contemporaneous Fiscal Reliance + lags of Fiscal Reliance)(1-coefficient on lagged dependent variable) standarderror for LRM calculated via Delta Method marginal effect of Fiscal Reliance conditioned by ∆Log(Per Capita GDP)in interaction models calculated at different percentiles of ∆Log(PCGDP) standard error for marginal effectscalculated via Delta Method
53
Table 4 Autoregressive Distributed Lag Panel Data Model in First Differences
Dependent Variable is ∆Polity (Polity 2 Score normalized to vary from 0 to 100)
ARDL (94) ARDL (75) ARDL (75) ARDL (75) ARDL (75) ARDL (75)1 2 3 4 5 6
1778-2006 1950-2006 1950-2006 1950-2006 1950-2006 1973-2006∆Polity t-1 0012 -0009 -0039 -0039 -0039 -0032
[071] [037] [183] [183] [182] [168] of Gross Oil Rents lags included 4 5 5 5 5 5AIC statistic for of lags chosen 6861 727 7092 7092 7093 7152F-test for all lags of Gross Oil Rents 158 062 111 099 111 098p-value 016 0712 0357 0431 0359 0442Long-run Multiplier total change due -002 0175 0139 0152 0139 0138to a permanent change in Oil Rents [028] [120] [110] [111] [113] [106]∆Per Capita Gross Oil Rents -0058 -0042 -0061 -0054 -0057 -0042
[239] [077] [100] [097] [089] [067]∆Per Capita Gross Oil Rents 0013 0084 0104 0101 01 0103t-1 [052] [160] [200] [188] [204] [196]∆Per Capita Gross Oil Rents 0001 -0011 -0036 -0034 -004 -0037t-4 [007] [017] [058] [055] [063] [059]∆Per Capita Gross Oil Rents 0076 0036 0038 0033 0026t-5 [066] [034] [034] [030] [024]∆Gross Oil Rents X ∆ Log(Per -0253Capita GDP) [055]∆Gross Oil Rents X ∆ Log(Per 0115 0028Capita GDP) t-1 [022] [005]Marginal effect of Oil Rents at -0053 01 010225th Percentile of FD Log(PCGDP) [095] [203] [194]Marginal effect of Oil Rents at -006 0102 010350th Percentile of FD Log(PCGDP) [100] [201] [195]Marginal effect of Oil Rents at -0066 0105 010475th Percentile of FD Log(PCGDP) [100] [188] [185]∆Log(Per Capita GDP) -036 -0336 8958 18222
[011] [010] [056] [094]∆Log(Per Capita GDP) t-1 -9723 -19061
[065] [103]∆ Growth of GDP Per Capita 001 001 -0084 -019
[038] [038] [055] [101]∆ Democracies in the Region 0261 0261 0261 0277
[332] [332] [332] [297]∆ Democracies in the World -0092 -0092 -0093 0109
[029] [029] [029] [039]Democratic Transition in Region 32708 32708 32704 31215Dummy [1136] [1136] [1136] [978]F-test for country dummies 16000000 13000000 160000 130000 370000 68138p-value 0 0 0 0 0 0F-test for year dummies 15000000 264 258 258 259 221p-value 0 0 0 0 0 0001Arellano Bond AR(1) serial 013 -01 022 022 023 -095correlation test 0894 092 0828 0828 0821 0341Observations 12037 5435 5376 5376 5376 4109R-squared 005 006 022 022 022 024
Robust t statistics clustered by country in brackets
significant at 10 significant at 5 significant at 1 intercept included but not reported country dummies included but not reported year dummies included but not reported lags of dependent variable toinclude based on the minimization of AIC statistic all lags of dependent variable included but only first lag reported lags of resource dependence to include calculated based on minimization of AIC statistic all lags ofresource dependence included but only relevant lags reported Long-run Multiplier (LRM) (contemporaneousresource dependence + lags of resource dependence)(1-coefficient on addition of lags of dependent variables) standard error for LRM calculated via Delta Method marginal effect of resource dependence as conditioned by ∆Log(Per Capita GDP) in interaction models calculated at different percentiles of ∆Log(PCGDP) standard error for marginal effects calculated via Delta Method
54
55
Table 5 Autoregressive Distributed Lag Panel Data Model in First Differences
Dependent Variable is ∆Polity (Polity 2 Score normalized to vary from 0 to 100)
ARDL (53) ARDL (53) ARDL (53) ARDL (53)1 2 3 4
1970-2006 1970-2006 1970-2006 1970-2006∆Polity t-1 0008 -0023 -0023 -0022
[035] [124] [124] [119] of Windfall Profits lags included 3 3 3 3AIC statistic for of lags chosen 7312 7159 7159 7159F-test for all lags of Windfall Profits 203 092 088 104p-value 0094 0454 0477 0387Long-run Multiplier total change due 0012 0211 0218 0226to a permanent change in WP [019] [136] [135] [146]∆Per Capita Windfall Profits -0054 0002 0007 0006on Natural Resources [184] [004] [011] [009]∆Per Capita Windfall Profits 0004 0043 0049 0051t-3 [024] [067] [063] [078]∆Windfall Profits X ∆ Log(Per -018Capita GDP) [027]∆Windfall Profits X ∆ Log(Per -0236Capita GDP) t-1 [031]Marginal effect of Windfall Profits at 0009 011525th Percentile of FD Log(PCGDP) [013] [166]Marginal effect of Windfall Profits at 0003 010950th Percentile of FD Log(PCGDP) [006] [150]Marginal effect of Windfall Profits at -0001 012275th Percentile of FD Log(PCGDP) [001] [133]∆Log(Per Capita GDP) -0403 -0395 2284
[009] [009] [088]∆Log(Per Capita GDP) t-1 -241
[097]∆ Growth of GDP Per Capita -0009 -0009 -0241
[029] [029] [097]∆ Democracies in the Region 0264 0264 0264
[268] [268] [268]∆ Democracies in the World 0144 0143 0145
[050] [050] [051]Democratic Transition in Region 31499 3145 31489Dummy [902] [902] [902]F-test for country dummies 916272 2650502 150000 2941999p-value 0 0 0 0F-test for year dummies 195 192 192 191p-value 0004 0006 0006 0006Arellano Bond AR(1) serial -103 -158 -158 -154correlation test 0303 0113 0113 0125Observations 3998 3822 3822 3822R-squared 006 023 023 024
Robust t statistics clustered by country in brackets
significant at 10 significant at 5 significant at 1 intercept included but not reported country dummies included but not reported year dummies included but not reported lags of dependent variable toinclude based on the minimization of AIC statistic all lags of dependent variable included but only first lag reported lags of resource dependence to include calculated based on minimization of AIC statistic all lags ofresource dependence included but only relevant lags reported Long-run Multiplier (LRM) (contemporaneousresource dependence + lags of resource dependence)(1-coefficient on addition of lags of dependent variables) standard error for LRM calculated via Delta Method marginal effect of resource dependence as conditioned by ∆Log(Per Capita GDP) in interaction models calculated at different percentiles of ∆Log(PCGDP) standard errorfor marginal effects calculated via Delta Method
56
Table 6 Determinants of Transition from Democracy to Autocracy and from Autocracy to Democracy (Dynamic Conditional Fixed Effects Logit Transition Model First-order Markov Chain)
Dependent Variable is Binary Measure of Democracy (coded 1 if regime is autocracy and 0 if regime is democracy)
Model 1 Model 2Measure of Democracy used REGIME Polity binary regime transitioning from Democracy Autocracy Democracy Autocracyregime transitioning to Autocracy Democracy Autocracy DemocracyMeasure of Resources used Gross Oil Rents Windfall Profits
1950-2002 1970-2006
Per Capita Resource Reliance -1588 0357 -1332 -0891t-1 [142] [043] [086] [043]Log(Per Capita GDP) -0243 0746 -1235 1083t-1 [036] [116] [105] [077] Growth of GDP Per Capita -0081 -0051 0027 -0036t-1 [255] [191] [092] [150] Democracies in the Region -0015 -0005 -0033 0035t-1 [086] [026] [138] [155] Democracies in the World -0171 018 0001 0209t-1 [175] [006] [002] [312]Democratic Transition in Region -0482 1767 -14581 droppedt-1 [043] [250] [2793]
Year dummies Yes Yes
Pseudo R-squared 0764 0783Observations 2556 1681
Robust z statistics clustered by country in brackets
significant at 10 significant at 5 significant at 1 intercept included but not reported year dummies included but not reported REGIME iselectoral measure of democracy as developed by Przeworski et al (2000) and coded and expanded by Cheibub and Ghandi (2004) and Boix and Rosato (2001) Polity binary is coded as 1 if the Polity Score is less than 6 on the -10 to +10 Combined Polity 2 scale and coded 0 if it is 7 or morePolity-based measure of democracy used in Model 4 instead of REGIME because there is not enough within-country variance for Per Capita WindfallProfits between 1970 and 2002 most countries exhibit a monotonic trend and therefore convergence fails to occur when REGIME is the dependentvariable
Table 7 Autoregressive Distributed Lag Panel Data Model Error Correction Framework
Dependent Variable is ∆Counterfactual Polity (see text for construction)
ARDL (36) ARDL (36) ARDL (36) ARDL (36) ARDL (36) ARDL (36)1 2 3 4 5 6
1800-2006 1950-2006 1950-2006 1950-2006 1950-2006 1973-2006Long-run EffectsFiscal Reliance t-1 0011 0045 0026 0053 0075 0007
[051] [120] [058] [100] [137] [008]Long-run Multiplier total effect due to 0195 0314 0184 0379 0475 0042a permanent change in Fiscal Reliance [049] [121] [061] [107] [143] [008]Fiscal Reliance t-1 X Log(Per -0023 -0025 0008Capita GDP t-1) [118] [121] [027]Marginal effect of Fisc Rel at 0035 0055 001525th Percentile of Log(PCGDP) [078] [119] [023]Marginal effect of Fisc Rel at 015 0034 002250th Percentile of Log(PCGDP) [037] [080] [038]Marginal effect of Fisc Rel at 0001 0019 002775th Percentile of Log(PCGDP) [002] [043] [048]Log(Per Capita GDP) t-1 3091 4395 5991 5287
[161] [211] [261] [142] Growth of GDP Per Capita -0106 -0144 -0071 -0531t-1 [038] [040] [017] [071] Democracies in the Region 0028 0032 0018 0013t-1 [068] [078] [034] [019] Democracies in the World -0075 -0101 -008 0022t-1 [033] [043] [029] [010]Short-run EffectsCounterfactual Polity t-1 -0057 -0142 -014 -0139 -0158 -0169(Error Correction) [249] [428] [414] [405] [447] [385]∆Fiscal Reliance on 0023 0017 0048 0048 0076 0095Natural Resources [066] [034] [099] [086] [134] [173]Number of Fisc Rel lags included 6 6 6 6 6 6AIC statistic for of lags chosen 6895 7827 7738 7744 7892 8103F-test for all lags of Fisc Rel 246 213 184 176 121 138p-value 0071 01 0148 0165 0351 0279∆Fiscal Reliance t-6 0127 0119 0133 0138 0126 0128
[173] [162] [249] [257] [212] [189]∆Fiscal Reliance X ∆ Log(Per -0023Capita GDP) [008]∆Fiscal Reliance X ∆ Log(Per 0768 0712Capita GDP) t-6 [081] [073]∆Log(Per Capita GDP) 8967 12483 626 51739
[030] [036] [015] [082]∆Log(Per Capita GDP) t-6 -3147 -3036
[036] [035]∆ Growth of GDP Per Capita -0077 -0114 -0041 -0473
[027] [032] [010] [067]∆ Democracies in the Region -0565 -0566 -0567 -0635
[691] [708] [713] [537]∆ Democracies in the World -2334 -2397 -2604 -0542
[108] [114] [120] [098]Democratic Transition in Region 27372 27322 268 31528Dummy [408] [408] [400] [418]F-test for country dummies 413297 22985 22985 32735 5442 328876p-value 0 0 0 0 0 0F-test for year dummies 5011 2059 2059 355 582 10068p-value 0 0 0 0 0001 0Arellano Bond AR(1) serial 002 007 -003 -007 001 01correlation test 0983 0945 0973 107 0989 0923Observations 1411 577 567 567 517 431R-squared 023 023 034 034 035 037
Robust t statistics clustered by country in brackets
significant at 10 significant at 5 significant at 1 intercept included but not reported countrydummies included but not reported year dummies included not reported lags of dependent variable to includecalculated based on the minimization of AIC statistic all lags of DV included but not reported lags of FiscalReliance to include calculated based on minimization of AIC statistic all lags of Fiscal Reliance included but only relevant lags reported Long-run Multiplier (LRM) (coefficient of Fiscal Reliance t-1)(1-coefficient on LDV)standard error for LRM calculated via Delta Method marginal effect of Fiscal Reliance as conditioned byLog(Per Capita GDP) in interaction models calculated at different percentiles of Log(PCGDP) standard error formarginal effects calculated via Delta Method
57
Table 8 Autoregressive Distributed Lag Panel Data Model in First Differences
Dependent Variable is ∆Counterfactual Polity (see text for construction)
ARDL (94) ARDL (75) ARDL (75) ARDL (75) ARDL (75) ARDL (75)1 2 3 4 5 6
1778-2006 1950-2006 1950-2006 1950-2006 1950-2006 1973-2006∆Counterfactual Polity t-1 -0005 -0026 -0048 -0048 -0048 -0043
[029] [113] [235] [235] [234] [228] of Gross Oil Rents included 4 5 5 5 5 5AIC statistic for of lags chosen 6841 7224 707 707 707 7121F-test for all lags of Oil Rents 942 815 797 752 801 765p-value 0 0 0 0 0 0Long-run Multiplier total change due 0137 0358 0301 0306 0342 0316to a permanent change in Oil Rents [166] [244] [211] [211] [238] [217]∆Per Capita Gross Oil Rents -015 -0125 -0169 -0166 -0177 -0172
[436] [158] [190] [214] [205] [201]∆Per Capita Gross Oil Rents 0329 0559 0516 0515 0541 0535t-1 [412] [579] [547] [529] [566] [553]∆Per Capita Gross Oil Rents -0133 -0154 -0147 -0147 -0115 -0108t-4 [345] [190] [185] [186] [134] [126]∆Per Capita Gross Oil Rents 0063 0059 006 0067 0064t-5 [054] [053] [053] [059] [055]∆Gross Oil Rents X ∆ Log(Per -01Capita GDP) [012]∆Gross Oil Rents X ∆ Log(Per -0903 -0735Capita GDP) t-1 [150] [118]Marginal effect of Oil Rents at -0166 0547 054225th Percentile of FD Log(PCGDP) [218] [569] [557]Marginal effect of Oil Rents at -0168 0521 05250th Percentile of FD Log(PCGDP) [195] [550] [538]Marginal effect of Oil Rents at -0171 0499 050375th Percentile of FD Log(PCGDP) [172] [520] [509]∆Log(Per Capita GDP) 1276 1286 13199 197
[041] [041] [089] [114]∆Log(Per Capita GDP) t-1 -12309 -17981
[090] [111]∆ Growth of GDP Per Capita 0013 0013 -0106 -0171
[056] [056] [077] [104]∆ Democracies in the Region -0235 -0235 -0235 -0212
[341] [341] [341] [301]∆ Democracies in the World -0554 -0554 -0556 -0318
[178] [178] [179] [117]Democratic Transition in Region 32002 32002 31997 30432Dummy [1256] [1256] [1256] [1091]F-test for country dummies 16000000 9013958 120000 120000 290000 230000p-value 0 0 0 0 0 0F-test for year dummies 15000000 215 146 146 146 093p-value 0 0 004 004 004 0577Arellano Bond AR(1) serial -017 -026 -017 -017 -015 -131correlation test 0862 0793 0868 0867 088 0189Observations 11973 5435 5376 5376 5376 4109R-squared 004 005 019 019 019 02
Robust t statistics clustered by country in brackets
significant at 10 significant at 5 significant at 1 intercept included but not reported country dummies included but not reported year dummies included but not reported lags of dependent variable toinclude based on the minimization of AIC statistic all lags of dependent variable included but only first lag reported lags of resource dependence to include calculated based on minimization of AIC statistic all lags ofresource dependence included but only relevant lags reported Long-run Multiplier (LRM) (contemporaneousresource dependence + lags of resource dependence)(1-coefficient on addition of lags of dependent variables) standard error for LRM calculated via Delta Method marginal effect of resource dependence as conditioned by ∆Log(Per Capita GDP) in interaction models calculated at different percentiles of ∆Log(PCGDP) standard errorfor marginal effects calculated via Delta Method
58
Table 9 Autoregressive Distributed Lag Panel Data Model in First Differences
Dependent Variable is ∆Counterfactual Polity (see text for construction)
ARDL (93) ARDL (93) ARDL (93) ARDL (93)1 2 3 4
1970-2006 1970-2006 1970-2006 1970-2006∆Counterfactual Polity t-1 -0018 -0043 -0043 -0042
[074] [222] [222] [219] of Windfall Profits lags included 3 3 3 3AIC statistic for of lags chosen 7246 7132 7132 7132F-test for all lags of Windfall Profits 1215 1054 1076 104p-value 0 0 0 0Long-run Multiplier total change due 0433 0541 0526 055to a permanent change in WP [418] [352] [315] [352]∆Per Capita Windfall Profits -009 -0094 -0105 -0105on natural resources [244] [100] [127] [114]∆Per Capita Windfall Profits 0449 0659 0664 0681t-1 [419] [623] [611] [630]∆Per Capita Windfall Profits 0087 0011 0009 0001t-2 [169] [015] [013] [001]∆Per Capita Windfall Profits 0158 0183 0168 0194t-3 [483] [146] [106] [155]∆Windfall Profits X ∆ Log(Per 0412Capita GDP) [039]∆Windfall Profits X ∆ Log(Per -1086Capita GDP) t-1 [132]Marginal effect of Oil Rents at -0108 068925th Percentile of FD Log(PCGDP) [135] [632]Marginal effect of Oil Rents at -0096 065850th Percentile of FD Log(PCGDP) [105] [612]Marginal effect of Oil Rents at -0086 063375th Percentile of FD Log(PCGDP) [081] [573]∆Log(Per Capita GDP) 2089 2068 24246
[047] [047] [102]∆Log(Per Capita GDP) t-1 -22881
[103]∆ Growth of GDP Per Capita -0002 0 -0221
[001] [001] [099]∆ Democracies in the Region -0192 -0192 -0191
[256] [256] [256]∆ Democracies in the World -0209 -0207 -0211
[075] [074] [076]Democratic Transition in Region 3019 30189 30182Dummy [960] [960] [961]F-test for country dummies 130000 565075 406292 2419929p-value 0 0 0 0F-test for year dummies 08 098 098 098p-value 0772 0507 0507 0504Arellano Bond AR(1) serial 032 -06 -061 -057correlation test 0749 0546 0544 0569Observations 3865 3702 3702 3702R-squared 007 02 021 02
Robust t statistics clustered by country in brackets
significant at 10 significant at 5 significant at 1 intercept included but not reported country dummies included but not reported year dummies included but not reported lags of dependent variable toinclude based on the minimization of AIC statistic all lags of dependent variable included but only first lag reported lags of resource dependence to include calculated based on minimization of AIC statistic all lags ofresource dependence included but only relevant lags reported Long-run Multiplier (LRM) (contemporaneousresource dependence + lags of resource dependence)(1-coefficient on addition of lags of dependent variables) standard error for LRM calculated via Delta Method marginal effect of resource dependence as conditioned by ∆Log(Per Capita GDP) in interaction models calculated at different percentiles of ∆Log(PCGDP) standard errorfor marginal effects calculated via Delta Method
59