Do Leaders Matter? National Leadership and Growth since ... · We also examine what policies appear...
35
Do Leaders Matter? * National Leadership and Growth since World War II Benjamin F. Jones Northwestern University and Benjamin A. Olken NBER February 2005 ABSTRACT Economic growth within countries varies sharply across decades. This paper examines one explanation for these sustained shifts in growth—changes in the national leader. We use deaths of leaders while in office as a source of exogenous variation in leadership, and ask whether these plausibly exogenous leadership transitions are associated with shifts in country growth rates. We find robust evidence that leaders matter for growth. The results suggest that the effects of individual leaders are strongest in autocratic settings where there are fewer constraints on a leader’s power. Leaders also appear to affect policy outcomes, particularly monetary policy. The results suggest that individual leaders can play crucial roles in shaping the growth of nations. * The authors would like to thank Daron Acemoglu, Alberto Alesina, Abhijit Banerjee, Robert Barro, Francesco Caselli, Esther Duflo, Amy Finkelstein, Edward Glaeser, Michael Gordin, Bryan Graham, Chad Jones, Larry Katz, Michael Kremer, Sendhil Mullainathan, Lant Pritchett, Xavier Sala-i-Martin, Scott Stern, and four anonymous referees for helpful comments. Sonia Chan, Sidney Henderson, Jessica Huang, Tabinda Khan, Ellen Kim, Patricia Reiter, Tommy Wang, and Jacqueline Yen all provided invaluable research assistance. The support of the George Shultz Fund for the data collection is gratefully acknowledged. Jones also acknowledges support from the Social Science Research Council’s Program in Applied Economics, with funding provided by the John D. and Catherine T. MacArthur Foundation, and Olken acknowledges support from the National Science Foundation Graduate Research Fellowship.
Transcript of Do Leaders Matter? National Leadership and Growth since ... · We also examine what policies appear...

Do Leaders Matter?* National Leadership and Growth since World War II
Benjamin F. Jones
Northwestern University
and
Benjamin A. Olken NBER
February 2005
ABSTRACT
Economic growth within countries varies sharply across decades. This paper examines one explanation for these sustained shifts in growth—changes in the national leader. We use deaths of leaders while in office as a source of exogenous variation in leadership, and ask whether these plausibly exogenous leadership transitions are associated with shifts in country growth rates. We find robust evidence that leaders matter for growth. The results suggest that the effects of individual leaders are strongest in autocratic settings where there are fewer constraints on a leader’s power. Leaders also appear to affect policy outcomes, particularly monetary policy. The results suggest that individual leaders can play crucial roles in shaping the growth of nations.
* The authors would like to thank Daron Acemoglu, Alberto Alesina, Abhijit Banerjee, Robert Barro, Francesco Caselli, Esther Duflo, Amy Finkelstein, Edward Glaeser, Michael Gordin, Bryan Graham, Chad Jones, Larry Katz, Michael Kremer, Sendhil Mullainathan, Lant Pritchett, Xavier Sala-i-Martin, Scott Stern, and four anonymous referees for helpful comments. Sonia Chan, Sidney Henderson, Jessica Huang, Tabinda Khan, Ellen Kim, Patricia Reiter, Tommy Wang, and Jacqueline Yen all provided invaluable research assistance. The support of the George Shultz Fund for the data collection is gratefully acknowledged. Jones also acknowledges support from the Social Science Research Council’s Program in Applied Economics, with funding provided by the John D. and Catherine T. MacArthur Foundation, and Olken acknowledges support from the National Science Foundation Graduate Research Fellowship.
1
“There is no number two, three, or four… There is only a number one: that’s me and I do not share my decisions.”
-- Felix Houphouet-Boigny, President of Cote D’Ivoire (1960-1993)
1. Introduction In the large literature on economic growth, economists have given little attention
to the role of national leadership. While the idea of leadership as a causative force is as
old if not older than many other ideas, it is deterministic country characteristics and
relatively persistent policy variables that have been the focus of most econometric work.1
Recent research, however, suggests that countries frequently experience dramatic
reversals in growth, so that a country’s growth in one decade is often little related to
growth in the next (Easterly et al, 1993, Pritchett, 2000). These reversals are an important
part of the growth experience for many countries, particularly in the developing world.
Moreover, the explanations for such reversals are not likely to be found in the slow-
moving explanatory variables typically used in the cross-country growth literature. Shocks
and/or higher frequency events can presumably provide better explanations.
This paper asks whether national leaders, who change sharply and at potentially
high frequency, have a causative effect on growth. In addition to informing our
understanding of the growth process, this question also relates to an old debate over the
relative roles of individuals and historical forces in shaping outcomes. From this latter
perspective, looking at growth outcomes sets the bar for individual leaders quite high. One
might believe that leaders can influence various government policies long before one is
willing to believe that leaders could impact something as large as aggregate economic
growth.
To examine whether leaders can affect growth, one can investigate whether
changes in national leaders are systematically associated with changes in growth. The
difficulty, of course, is that leadership transitions are often non-random, and may in fact
be driven by underlying economic conditions. For example, there is evidence in the
United States that incumbents are much more likely to be reelected during economic
1 See, for example, Sachs & Warner (1997) on geography, Easterly & Levine (1997) on ethnic fragmentation, La Porta et al (1999) on legal origin, and Acemoglu et al (2001) on political institutions.

2
booms than during recessions (Fair 1978; Wolfers 2001). Other research has found, in
cross-country settings, that high growth rates inhibit coups (Londregan & Poole, 1990).2
To solve this problem, we focus our examination on cases where the leader’s rule
ended at death due to either natural causes or an accident. In these cases, the timing of the
transfer from one leader to the next was essentially random, determined by the death of
the leader rather than underlying economic conditions. These deaths therefore provide an
opportunity to examine whether leaders have a causative impact on growth.
This paper uses a data set on leaders collected by the authors. We identified all
national leaders worldwide in the post World War II period, from 1945 to 2000, for whom
growth data was available in the Penn World Tables. For each leader, we also identified
the circumstances under which the leader came to and went from power. Using the 57
leader transitions where the leaders’ rule ended by death due to natural causes or an
accident and where growth data was available, we find robust evidence that leaders
matter. Growth patterns change in a sustained fashion across these leadership transitions.
The magnitude of these changes is large; the estimates imply that a one standard deviation
change in leader quality leads to a growth change of 1.5 percentage points per year.
We then examine whether leaders matter more or less in different contexts. In
particular, one might expect that the degree to which leaders can affect growth depends on
the amount of power vested in the national leader. We find evidence that the death of
leaders in autocratic regimes leads to changes in growth while the death of leaders in
democratic regimes does not. Moreover, among autocrats, leader effects appear more
pronounced when leaders have fewer constraints on their power.
We also examine what policies appear to change when leaders change, and find
that leaders do affect some policy outcomes. In particular, we find substantial effects of
leaders on monetary policy, while we see at best ambiguous evidence for changes in fiscal
policy and trade policy. Interestingly, we find no unusual changes in either external
conflicts or civil wars associated with leader deaths, though the fact that these events are
2 Although other literature has found that growth rates have little predictive power in explaining the tenure of leaders more generally (Bienen & van de Walle, 1991).

3
relatively rare means we may not have sufficient statistical power to detect conflict effects
in our sample.
The remainder of this paper is organized as follows. Section 2 discusses existing
literature and debates about the role of national leaders. Section 3 presents the empirical
methodology used in the paper. Section 4 presents the main results of the impact of
national leaders on their nations’ growth. Section 5 examines how country-level
characteristics affect the degree to which leaders matter. Section 6 examines what policies
seem to be affected by individual leaders. Section 7 concludes.
2. Individuals, Determinism, and the Historical Debate The debate over the relative roles of individuals and deterministic forces in
shaping historical outcomes is both old and unsettled. Within this debate, authors range
from absolutist stances to more moderate, inclusive ones. At one extreme, Tolstoy’s
historical theory is perhaps the most dismissive of leaders, seeing so-called historic figures
as mere ex-post justifications for events wholly beyond any individual’s influence (Berlin,
1978). Marx, in his Eighteenth Brumaire of Louis Napoleon (Marx, 1852), allows some
minimal agency for leaders but argues that leaders must choose from a historically
determined set of choices, which means that they have much less freedom to act than they
think they do. More broadly, Marx’s materialist dialectic continues to inspire many
thinkers who see the contest of social or economic forces trumping the roles of
individuals. These traditions often see leaders as merely symbolic: “labels” to describe
particular expressions of underlying social phenomena. To Tolstoy, Marx, and others,
leaders typically claim immodest powers although they are in fact of little consequence.
Meanwhile, the population at large – and historians in later analysis – may accept this
pretense as part of a long tradition, ingrained through religious faith, of believing in a
higher power (Tolstoy, 1869). A modern view of leadership in the psychology literature
considers the very idea of powerful leaders a social myth, embraced to satisfy individuals’
psychological needs (Gemmill & Oakley, 1999).
In contrast, there are absolutist extremes in which individuals are seen as the
decisive influences in history -- the so-called “Great Man” view. From this perspective,
the evolution of history is largely determined by the idiosyncratic, causative influences of

4
certain individuals, and perhaps a very small number. Thomas Carlyle articulated this
historical theory clearly in his study of the French Revolution and later works (Carlyle,
1837, 1859), and it perseveres today especially among military historians, who tend to see
the individual leader as the key to military outcomes. For example, the British historian
John Keegan has written that the political history of the 20th Century can be found in the
biographies of six men: Lenin, Stalin, Hitler, Mao, Roosevelt, and Churchill (Keegan,
2003).3
These extremely different historical viewpoints cloud a possible broad middle
ground. Isaiah Berlin distinguishes in the debate over historical determinism between the
singular approach of the “hedgehogs” and the flexibility of the “foxes” (Berlin, 1978). In
Berlin’s menagerie, Marx and Carlyle are hedgehogs. Weber, whose sociological theories
act as a counterpoint to Marx on many dimensions, is a fox. Weber sees a role for
“charismatic” leadership in certain circumstances (Weber, 1947). He allows for possibly
substantial individual roles, but only in those cases where the national bureaucracy, or
possibly traditional social norms, do not stand in the way of the individual. For Weber,
individuals, historical forces and institutions are all important and they interact in an
important way.
The texture of this possible middle ground has been investigated most extensively
in political science, with particular attention to the ability of institutions to restrain leaders
in democracies. The possibility of profound restraints on a democratic leader’s power is
raised from one direction – leadership selection – in Schumpeter’s observation that
political leaders must compete for electoral votes (Schumpeter, 1950), an idea that can
produce decisive constraints through the median voter theorem (Downs, 1957). More
broadly, the presence of many “veto players”, either constitutionally-based institutions or
opposing political parties, may severely constrain the action space of leaders and policy
outcomes (Tsebelis, 2002). On the other hand, there is evidence that, in the context of
legislatures, politicians are not fully constrained by electoral pressures, allowing some
room for personal ideological views and party affiliations (see, for example, Kalt and
3 Outside of military history, the great man view fell out of fashion for many historians in the 20th century, its demise related to the seeming inevitability of World War I and Herbert Butterfield’s broad attack, The Whig Interpretation of History, on earlier historical reasoning (Butterfield, 1931).
5
Zupan 1984, Poole and Rosenthal 1984, Levitt 1996, and Lee, Moretti and Butler 2004).
All told, the evidence suggests that the degree to which political leaders may affect
economic outcomes may depend on the institutional context.
Meanwhile, the rapidly expanding literature on economic growth has paid little
formal attention to the role of individual leaders. Recent growth research has, however,
building on North (1990), moved beyond conceptions of convergence based on purely
economic factors to consider the role of institutions and social context in shaping
economic outcomes. Among other results, this literature has found relationships between
some measures of political institutions and macroeconomic outcomes (Keefer & Knack,
1995; Hall and Jones, 1999; Quinn and Woolley, 2001; Acemoglu, Johnson, and
Robinson, 2001), although convincingly identifying the causal effects of institutions is
difficult (Glaeser et. al, 2004). But if institutions have explanatory power, it is then
perhaps a natural next step to ask whether national leaders, who may partly control or
substitute for formal institutions, exert personal influences on growth.4
In this paper we study national leaders explicitly and find that leaders do matter. In
particular, our statistical tests reject the deterministic view where leaders are incidental to
the evolution of their national economies. At the same time, we find that leader effects are
limited to those settings in which they are relatively unconstrained. Changes in leaders in
democracies appear to have no effect on economic growth. Leaders in autocracies,
however, and particularly those without parties or legislatures to contest their rule, appear
to have very large effects on growth. Thus our results fall most closely with Weber;
leaders matter, but only in settings where other institutions are weak.
In the following sections we develop our methodology, present our results, and
examine the interaction of leader effects with descriptions of their institutional constraints.
4 If the economics literature takes the idea that individual personalities matter seriously, it is primarily in the management literature, which has seen many studies of the impacts of particular CEOs, with notable contributions by Johnson et al (1985) and Bertrand & Schoar (2003), who estimate leader effects on firm behavior. In the micro-development literature, recent work by Duflo and Chattopadhyay (2004) also examines leader effects at the village level in India.

6
3. Methodology The key question in this paper is whether growth rates change in a statistically
significant manner across randomly-timed leader deaths. In this section, we derive two
tests for whether leaders matter, a standard Wald test and a non-parametric Rank test.
To begin, consider the following growth process:
git i lit it
where git represents growth in country i at time t, νi is a fixed-effect of country i, and εit is
normally distributed error term with mean 0 and variance σ2εi. The term lit represents
leader quality, which is fixed over the life of the leader. Leaders are selected as follows:
( )( )⎩
⎨⎧
++−′++
=−
−−
...1...
110
1101
itit
itititit ggPl
ggPll
δδδδ
where l’ is normally distributed, with mean µ, variance σ2l, and Corr(l,l’) = ρ. The fact
that the probability of a leader transition can depend on growth captures the idea that, in
general, leader transitions may be related to economic conditions.
The question we wish to answer is whether θ =0 or not, i.e. whether leaders have
an impact on economic outcomes. If leader transitions were exogenous, a natural approach
would be to look at the joint significance of leader fixed effects—i.e., dummy variables
for each value of lit— to see whether there were systematic differences in growth
associated with different leaders. Given the endogeneity of leader transitions, however,
this test may find significant results even under the null that θ = 0, because leadership
transitions, and thus the end dates of the leader fixed effect, may be related to atypical
realizations of growth.
Comparing the difference in these fixed effects across leadership transitions
caused by leader deaths solves part of the problem, as the date of the transition between
leaders is now exogenously determined with respect to growth. However, the other end of
the fixed effect for these leaders is still endogenously determined. Therefore, rather than
compare differences in fixed effects, we compare differences in dummies that are true in
the T periods before the death and in the T periods after the leader death.

7
In particular, denote by zPRE average growth in the T years before a leader death
in year z, and denote by zPOST average growth in the T years after the leader dies.5 Then
the change in growth across the leader transition in country i will be distributed:
POST − PREz N 0,2i2
T 22l21 −
(1)
The variance of POST − PREz is equal to the sampling variance, Ti /2 2εσ , plus the
variance from the expected difference in leaders, 222 lσθ , less twice the covariance due to
the correlation in leaders, ρσθ 22l .
Under the null hypothesis that leaders do not matter, θ = 0. Therefore, under the
null, the change in growth across a leader transition in country i will be distributed:
POST − PREz N 0,2i2
T
(2)
We can easily develop a Wald test statistic based on this null hypothesis. Define
J 1Z∑i1
Z POST−PREi2
2i2 /T
(3)
where i2 is an estimate of σ2
εi for country i, POST − PREi represents the change in
growth around a leader death in country i, and Z is the number of leaders. If the number of
observations of country i is large, so that i2 is a good estimate for σ2
εi, then under the
null Z*J will be distributed ( )Z2χ .6
The magnitude of J is informative as well. Recalling equation (1) and rearranging
terms,
5 To simplify the exposition, assume for the moment that during each of these periods, there is only one leader. This assumption does not affect the statistical tests because, under the null that θ = 0, the variance as written in expression (2) would still be exactly correct even if there were multiple leaders in the pre or post period. 6 This exposition is based on simple iid errors. In the empirical work, we consider a more general error process that allows for heteroskedasticity and AR(1) autocorrelation when computing the J statistic.

8
( )
( )ρσσθ ε
−−
=11
2
22
lTJ
(4)
Normalizing σl to 1, setting ρ = 0 and substituting in the variance of the error process, 2εσ , provides a conservative estimate of how much one standard deviation in leader
quality affects growth. That is, we can estimate θ, the magnitude of leader effects.
We also consider a general, non-parametric test that does not depend on
assumptions about the structure of the growth process.7 This test simply asks whether the
change in growth around a leader death is unusual given the changes in growth witnessed
in that country at other years. We calculate the percentile rank of POST − PREz for each
actual leader death date within the distribution of POST − PREit for other years in that
leader’s country. This percentile rank, denoted rz, will be uniformly distributed over the
interval [0,1] under the null hypothesis that leaders don’t matter. Under the alternative
hypothesis that leaders do matter, rz should be closer to extreme values—i.e. closer to 0 or
1—than would be predicted by a uniform distribution.
We can therefore form a test-statistic that is the non-parametric analogue of the
Wald test. To do so, first define21−= zz ry . Under the null, 4
1][ =zyE , 481][ =zyVar , so
that one can form the test-statistic:
( )48
41
Z
zyK
−∑=
A non-parametric test for whether θ ≠ 0—i.e., whether the changes in POST − PREz at
leader deaths are systematically larger than average—is a one-sided test of whether K is
systematically larger than is expected under the null.8
In the empirical work, we will also consider the possibility that there is
heterogeneity in θ and ρ across countries. The degree to which leaders can affect growth 7 This test is a modification of the Rank test developed by Corrado (1989) in the context of the event study literature in finance. 8 In large samples, the Central Limit Theorem implies that K will be distributed under the null as N(0,1). In practice, given the small number (≤40) of growth observations in each country, the rank is distributed as a discrete uniform variable rather than a continuous uniform. This discreteness slightly increases the variance of yz, and failing to account for this issue will lead to over-rejection of the null. To be conservative, we therefore rely on Monte Carlo simulations to generate the exact distribution of K under the null.

9
(θ) and the correlation of successive leaders (ρ) may vary across institutional, historical,
or social contexts, and we can examine this possibility by considering our empirical tests
on subsets of leader deaths that share observable characteristics.
Note finally that, even if θ ≠ 0, the tests may still fail to reject the null. If
successive leaders tend to be alike -- because ρ is close to 1 or σ2l is close to 0 -- then the
tests will fail to reject even if leaders affect growth. Moreover, if the growth process in a
country is extremely noisy, so that σ2εi is large, then it becomes more difficult to detect
leader effects. A rejection of the null hypothesis therefore implies that leaders matter in
three senses: (i) leaders impact outcomes, (ii) leaders vary enough that different leaders
lead to different outcomes, and (iii) the impact of leader transitions is large relative to
average events that occur in their countries.
4. Do Leaders Matter? Evidence
4.1 Leader Deaths
This paper uses a data set on national leadership collected by the authors. The data
set includes every post-war leader in every sovereign nation in the Penn World Tables for
which there is sufficient data to estimate leader effects – a total of 130 countries, covering
essentially every nation today that existed prior to 1990.9 The resulting data set includes
1,108 different national leaders, representing 1,294 distinct leadership periods.10 More
details about the leadership dataset can be found in Jones and Olken (2004).
The leaders of particular interest for this paper are those who died in office, either
by natural causes or by accident. To define this group, further biographical research was
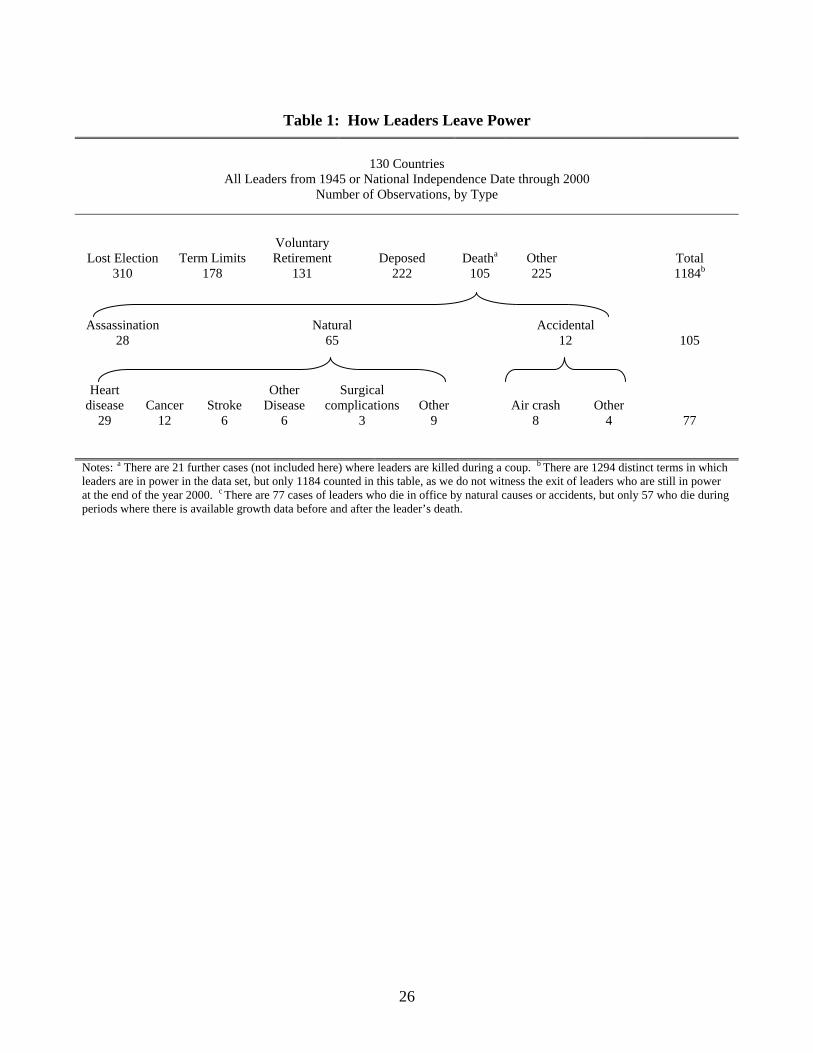
undertaken to determine how each leader came and went from power. Table 1 presents
summary statistics describing the departure of leaders. Of the 105 leaders who died in
office, 28 were assassinated, 65 died of natural causes, and 12 died in accidents.11 As
discussed above, it is important for the identification strategy that the timing of these
leader deaths be unrelated to underlying economic conditions. For this reason, it is 9 Leader data is collected from 1945 or the date of independence, whichever came later. 10 The data set is similar to one collected by Bienen and Van de Walle (1991), with the main exceptions that our data focuses more closely on the nature of leadership transfer and extends to the year 2000, while their data includes countries that are not covered by the Penn World Tables and extends further into the past. 11 A further 21 leaders, not counted here, were killed during coups.
10
important that assassinations, which may be motivated by underlying changes in the
country, be purged from the set of leader deaths. We therefore define the 57 leaders who
died either of natural causes or in accidents, and for whom we can estimate growth effects,
as the “random” deaths that we focus on in the paper.12 Of these, heart disease is the most
common cause of death, while cancer and air accidents were also relatively common.
Table 2 describes each of these cases in further detail.
One question is whether the leaders we consider here are typical of leaders in
power at any given time. To investigate this, in results not reported, we consider a Probit
regression on all leaders-years in the entire data set, with the dependent variable a dummy
distinguishing the 57 leaders in our sample. The independent variables in the regression
are the leader’s age and tenure, whether he was an autocrat (as classified by Polity IV),
decade dummies, region dummies, and dummies for the country’s per-capita income
trecile in 1960. The main finding is that, not surprisingly, the leader’s age positively
predicts dying in office; in fact, leaders who die in office are 8 years older than the typical
leader in power at a given time. The other variables we consider are not jointly
significant.13 Thus, with the prime exception of age, the leaders we consider here are
broadly similar to the leaders occupying office throughout the period we consider.
Historical analysis of these leader deaths suggests many plausible cases in which
leaders impact growth. Figure 1 highlights a few of the more dramatic examples,
presenting the evolution of national income for four countries: China, Mozambique,
Guinea, and Iran. In each graph, a solid vertical line indicates the exact date at which a
leader died, and a dashed line indicates the date at which that leader came to power. In
China, we see a remarkably close association between the long rule of Mao – from the
period the data begins until his death in 1976 – and a long period of poor growth. In fact,
growth averages 1.7% per year under Mao but 5.9% per year subsequently. The forced
collectivization of agriculture and the Cultural Revolution were among many national
12 Of the 77 leaders who died of natural causes or in accidents, sufficient Penn World Tables data to estimate the change in growth around the leader’s death was available for 62 of them. As discussed in footnote 15 below, we exclude a further 5 leaders whose deaths were too close to the deaths of other leaders to separately estimate their impacts on growth. This yields the 57 leader deaths we focus on in the empirical analysis. 13 The only other variable to be individually significant in the regression is the leader’s tenure – conditional on the leader’s age, longer tenure makes you less likely to die.

11
policies that likely served to retard growth during Mao’s tenure, whereas Deng, who
comes to power in 1978, is often regarded as having moved China towards more market-
oriented policies.
The death of Samora Machel in Mozambique was followed by an especially sharp
turnaround in economic performance. Machel, the leader of the Frelimo guerrilla
movement, established a one-party communist state and nationalized all private land upon
becoming president of Mozambique in 1975. Coincident with Machel’s policies, most
Portuguese settlers fled Mozambique and a new guerilla insurgency was born. After
Machel’s death, Mozambique moved firmly under his successor, Joaquin Chissano,
toward free-market policies, multi-party democracy, and peace with the insurgents.
During Machel’s eleven-year rule, growth was persistently negative, averaging -7.7% per
year; since Machel’s death, growth in Mozambique has average 2.4% per year.
Guinea and Iran provide further examples. In Guinea, the rule of Sekou Toure was
characterized by totalitarianism, paranoia, and violent purges until he died during
emergency heart surgery in 1984. In Iran, the rule of Ayatollah Khomeini was marked by
bloody conflict in both the Iranian Revolution and the Iran-Iraq war. Khomeini cast the
Iran-Iraq war in strictly religious terms, which is said to have prevented peace
negotiations for many years. As can be seen in Figure 1, both Guinea and Iran experienced
dramatic growth reversals coincident with the death of these leaders.
Of course, the associations between particular leaders and particular growth
episodes may be coincidental, and among the 57 leader deaths in our sample there are
many cases where growth does not appear to change. In the next sections, we leave
historical argument aside and pursue the question of whether leaders matter for economic
growth using more rigorous econometric methods.
4.2 Results
To implement the econometric tests developed in Section 3, we estimate the
following regression:
ittizzzzit POSTPREg εννβα ++++= (5)
12
where git is the annual growth rate of real purchasing-power-parity GDP per capita taken
from the Penn World Tables, i indexes countries, t indexes time in years, and z indexes
leader deaths. Country and time fixed effects are included through vi and vt respectively.
For each leader death, indexed by z, there is a separate set of dummies, denoted PREz and
POSTz. PREz is a dummy equal to 1 in the T years prior to leader z’s death in that leader’s
country. POSTz is a dummy equal to 1 in the T years after leader z’s death in that leader’s
country. We estimate a separate coefficient αz and βz for each leader death z. Note that we
estimate equation (5) using all countries and all years of data, as countries without leader
deaths can be used to help estimate time fixed effects.
In the main analysis, we let the period of observation, T, be five years, though
results are similar when we let T be either three or seven years. Note also that PREz and
POSTz are defined so that the actual year of the death is not included in either dummy.
This is probably the most conservative strategy when looking for longer-term leader
effects, as it helps to exclude any immediate turbulence caused by the fact of leader
transition itself.14
Table 3 presents the main results from the formal econometric tests developed in
Section 3. Column (1) presents the J statistic defined in Section 3, with the errors
corrected for region-specific heteroskedasticity and a region-specific AR(1) process.
Column (2) presents the p-value on the J statistic. Column (3) presents the p-value from
the analogous non-parametric Rank test. Columns (4)-(6) repeat this analysis, restricting
the set of leaders to those who were in office for at least 2 years prior to their death, whose
effect on growth we would expect to be stronger.
For each specification of the error structure, we present three different timings of
the PRE and POST dummies. The actual timing is represented by the row labeled t. To
ensure that the effects we ascribe to leaders are not simply caused by temporary changes
during the transition period, the timings t+1 and t+2 are included, indicating that the
POST dummies have been shifted 1 and 2 years later in time. Put another way, in the t+1
14 The results in this paper are robust to a number of other methods of handling transition years. For example, assigning the transition year to either the PRE or POST dummy, or assigning a fraction of the dummy to either the PRE or POST dummy, produces similar or slightly stronger results than those presented here.
13
timing, we exclude the year of the transition and the subsequent year from the analysis; in
the t+2 timing, we exclude the year of the transition and the two subsequent years from
the analysis.15
The results presented in Table 3 show that leaders have significant effects on
growth. Using the contemporaneous leader timing (t), both the Wald and the Rank tests
reject the null hypothesis that leaders do not matter. Results are also generally strong
when we shift the POST timing forward one or two years, suggesting that the effect of
leaders is not due to temporary effects of the transition. If we restrict the data to rule out
leader deaths where the leader was in power for a very short period of time, then the
results become stronger, despite having 10 fewer deaths in the sample.
The magnitudes of the estimated leader effects are substantial. For all leaders, the J
statistic is 1.312, so the variance of the coefficients on POST-PRE is 31% higher around
leader transitions than it would be normally. Recalling equation (4), which relates J to θ,
normalizing the standard deviation of leader quality to 1, and substituting for the standard
deviation in growth in these countries (0.060) yields an estimate of theta of 0.0147.16 This
means that a 1 standard deviation increase in leader quality increases growth rates by at
least 1.47 percentage points per year – which is a quite dramatic effect.
Even though growth changes when leaders die, it does not appear to systematically
increase or decrease; in fact, the average value of the coefficients on POST-PRE is -0.10
percentage points – i.e., almost exactly 0. However, if certain characteristics of a leader
predicted the leader’s quality, then the change in growth following a leader’s death might
be related to certain characteristics of the outgoing leader. For example, Lord Acton’s
famous observation that “power tends to corrupt; absolute power corrupts absolutely”
suggests declining performance over a leader’s tenure, while work by Clague et al (1996)
15 Note that we exclude five leader deaths (Barrow of Barbados, Hedtoft of Denmark, Shastri of India, Frieden of Luxembourg, and Gestido in Uruguay), because their deaths followed closely on a prior leader death in their countries. Including both leaders would cause the PRE and POST dummies to overlap, contaminating the results. In each case, we drop the leader who died second, though the results are robust to dropping the leader who died first instead. 16 This estimate assumes ρ, the correlation between leaders, is 0; i.e., each leader is an independent draw from the potential leader quality distribution. Assuming leaders were perfectly inversely correlated (ρ = -1) implies a lower-bound value of θ of 0.0104, so that a one standard deviation in leader quality changes annual growth rates by 1 percentage point. If, as seems more likely, the quality of successive leaders is positively correlated, then θ would be even higher than the 0.0147 reported in the text.

14
finds that property and contract rights actually tend to improve the longer an autocrat has
been in power. Other researchers suggest that expectations of longer tenure can lead to
longer planning horizons and greater expectations of stability by the leader and the public
at large, potentially enhancing investment (Blondel 1987, Olson 1993, Olson 2000). In
results not reported here, however, we find that neither the leader’s age nor tenure in
office predicts the change in growth following the leader’s death, either directly or when
interacted with the autocracy measure discussed below.
4.3 Specification Checks
These tests survive a wide range of robustness and specification checks. First, the
final rows of Table 3 present p-values for “control timings”, where the PRE and POST
dummies are shifted 5 or 6 years backwards in time. If the identification strategy is valid
and the growth process is correctly specified, one should not witness unusual changes in
growth at these timings. In fact, we find that such control timings fail to reject the null,
further confirming both the identification assumption and the specification of the error
structure used in forming the Wald tests.
We can further test the underlying identification assumption – that leader deaths
are exogenously timed with respect to underlying economic conditions – by attempting to
predict the deaths using economic information. In particular, we estimate a conditional
fixed-effects logit model, where the independent variables are lags of growth and other
economic variables and the dependent variable is a dummy variable equal to 1 in the year
of a leader death. As shown in Table 4, we find that the key variable of interest – growth –
as well as changes in the components of GDP and changes in the terms of trade, do not
predict these leader transitions. The one variable that has predictive power is the nominal
exchange rate, which is unusually steady prior to leader deaths. This result turns out to be
driven by outliers in other years of observation, i.e., episodes of massive exchange rate
adjustments, which do not occur in the years prior to the leader deaths. Such rare episodes
substantially affect the mean shift in exchange rates in the background years, and if we
drop the outliers (i.e., devaluations of more than 25% in a single year), then more normal
exchange rate movements have no predictive power for leader deaths.

15
The main results in Table 3 are also robust to a number of further specification
checks, including 3 or 7 year observation windows (T), different sets of right-hand-side
control variables, and the exclusion of certain decades or types of deaths.17
5. How do country level characteristics interact with leaders? The above results indicate that, on average, leaders have detectable, causative
impacts on national growth. However, the degree to which leaders matter may well be a
function of their context, as different institutional systems might amplify or retard a
leader’s influence. We therefore extend the regression framework above to consider
hypothesis tests on subsets of the leader deaths, in order to examine the interaction of
various national characteristics with the ability of leaders to influence growth.
The primary measure of institutional constraints we use is the “polity” variable
from the Polity IV dataset, which provides annual panel data on institutional
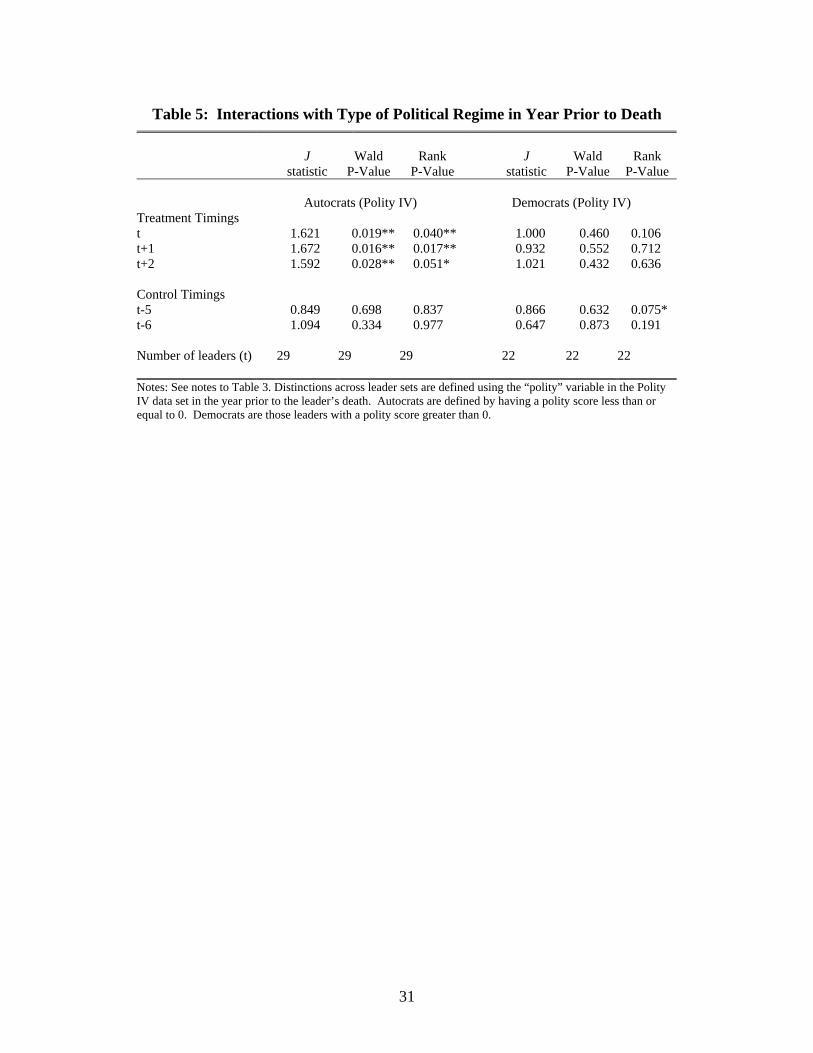
characteristics (Marshall and Jaggers, 2000).18 The results are presented in Table 5, which
compares those leaders whose nations receive a polity score less than or equal to 0 in the
year prior to their death, who we will refer to as “Autocrats”, with those leaders whose
nations receive a polity score better than 0, who we will refer to as “Democrats”. The
results indicate that autocratic leaders on average have a significant causative influence on
national growth. In particular, the autocratic leader effects are strongly significant at
treatment timings of t, t+1, and t+2, suggesting that the growth effects last over
substantial periods and are not due to immediate turbulence in the first two years after the
transition. In fact, the data suggest that growth tends to increase slightly following the
death of autocrats, not decline, providing further evidence that the effect of autocrat deaths
is not due to turbulence.19 The magnitudes of the autocrat effects are substantial; using
17 Specifically, we re-estimate equation (5) without any time fixed effects, allowing for time fixed effects that are allowed to vary by region, and including lagged income plus a host of plausibly exogenous control variables. We also estimate leader effects separately excluding heart attacks and air crashes, the two types of death most frequently plagued by conspiracy theories. Finally, to ensure that no decade is driving the results, we re-run the results excluding each decade one-by-one. The results are broadly robust to all of these alternative specifications. 18 We focus on Polity IV ratings because they are available for the entire period we study. Other sources of institutional classification, such as Przeworksi et al (2000) and Freedom House (Karatnycky et al, 2003), have generally similar classifications for the periods where they overlap with Polity. 19 On average, the change in annual growth rates following the leaders’ death (i.e., the coefficients on POST-PRE) is +0.4 percentage points for autocrats and -0.5 percentage points for democrats, though the difference between the two is not statistically significant.

16
calculations analogous to those above, the J statistic of 1.621 for autocrats implies an
estimated value of θ of 2.1 – i.e., a 1 standard deviation in leader quality increases growth
by 2.1 percentage points per year. On the other hand, the deaths of leaders in democratic
regimes produce no detectable impact on growth.20
Of course, autocracy vs. democracy is a crude measure, and there are several
reasons why autocrats might have more of an effect than democrats. The role of leaders in
democracies differs from that in autocracies in the constraints placed on the leader’s
power, in how leaders are selected, and in the ease with which bad leaders are removed
from power, among other things. Distinguishing between these different factors is
difficult, both because they are hard to measure and because they tend to move hand-in-
hand with one another.
Nevertheless, it is possible to obtain suggestive evidence regarding these factors.
Table 6 shows that, among autocrats, we also find particularly strong leader effects in
regimes without political parties, and no effects where there are political parties. (For
brevity, we present only the Rank-based p-values in this table, though the Wald-based
results are generally similar except where noted.) Similarly, in results not presented, we
find that leader effects are much stronger among those autocrats without a legislature,
where there presumably are few constraints on their power, than among autocrats whose
regime also includes a legislature. In terms of how leaders are selected, Table 6 compares
those autocrats who initially seized power in some type of coup d’etat with those autocrats
who came to power though some other means (either by being elected or by being selected
by the previous leader or ruling party.) The results are much less conclusive, but suggest
somewhat stronger leader effects among leaders who seize power than among other
leaders. This difference is much more pronounced using the Wald-based tests, which
show substantial effects among leaders who seize power and no effects otherwise.
Overall, these results provide further and more textured support for the Weberian
hypothesis that leaders matter when institutions are weak.
20 The differences between autocrats and democrats are also found when we use the smaller data sets for which the Przeworski et al (2000) and the Freedom House measures are available. The only change is that we can now also find some statistically significant effects of democrats with the Przeworski et al measure of democrats and with the Freedom House measure of “Free,” although they are significant only using the Rank test and only then at t=0, while all other timings and many specifications of the Wald test show no democrat effects.

17
An alternative hypothesis for the distinction between autocrats and democrats is
that income, rather than institutions per se, drives the observed difference in leader effects.
The second panel of Table 6 explores this hypothesis, and shows that leader effects are not
simply a matter of poverty. Indeed, the poorest countries show no leader effects on
average, while both middle income and rich countries show significant effects.
Meanwhile, the distinction between autocrats and democrats continues to operate,
particularly within the middle income countries. Increasingly small sample sizes preclude
conclusive interpretations, but one may speculate that the absence of autocrat effects
among the poorest countries may be related to weaker state institutions and failed states,
which may limit a leader’s ability to influence national outcomes.
Table 6 also explores the effect of ethnic fragmentation on leader effects. Previous
work has shown that ethnic fragmentation is a strong negative predictor of growth
(Easterly and Levine, 1997; Alesina et al, 2002) and helps predict institutional quality,
including measures for the quality of government (La Porta et al, 1999) and corruption
(Mauro, 1995), although other authors note that ethnic identity itself may be endogenous
with respect to political variables (e.g. Posner, 2003). With regard to national leadership,
ethnically fragmented nations may provide particular opportunities for leaders to impact
national outcomes by choosing to foment or suppress ethnic conflict. We divide countries
into high and low ethnic fragmentation groups depending on whether they fall above or
below the median level of the ethno-linguistic fractionalization measure from Easterly &
Levine (1997) and then sub-divide them according to whether the leader was an autocrat
or a democrat. We find that, overall, the autocrat/democrat distinction seems more
important than the distinction by ethnic fragmentation.
6. What policies do leaders affect? So far, this paper has focused on growth as the outcome of interest. But leaders
may affect a number of economic policy variables as well as growth. This section
examines whether leaders have an impact on four types of policy outcomes – monetary

18
policy, fiscal policy, trade policy, and security policy. To do this, we apply the same
techniques developed above to a host of different policy variables.21
To investigate whether leaders affect monetary policy, we examined whether there
were significant changes in the inflation rate following the deaths of leaders. We use the
annual change in the log GDP deflator from the Penn World Tables as our main measure
of inflation. We then examine whether each of these variables changes systematically
around leader deaths. The results, presented in Table 7, show substantial evidence of
changes in inflation rates following the death of autocrats, although not following the
death of democrats. In results not reported, we also found significant changes in the broad
money supply (M2), especially for autocrats, though we found no detectable movements
in M1. We find only weak evidence of changes in real exchange rates, and no evidence of
changes in the black market premium associated with leader deaths.
The fact that leaders appear to be affecting monetary policy is consistent with the
work of Romer and Romer (2003), who found that different Federal Reserve chairs are
associated with different monetary policies and different macroeconomic outcomes. The
results here suggest that, particularly for countries with strong leaders and, presumably,
less independent central banks, it may be the views of the national leader that are critical
in determining monetary policy.
To examine the impact of leaders on fiscal policy, we examine data from the Penn
World Tables on the growth rate of government consumption in the national accounts.
The results here are mixed. The results based on the Rank-test, presented in Table 7, show
at best weak evidence for changes in fiscal policy surrounding the death of leaders. Wald
tests (not presented) meanwhile suggest substantial and statistically significant changes in
the growth rate of government expenditures, particularly following the death of autocrats.
Unfortunately, more detailed annual panel data on other variables of interest, such as tax
revenues and central government debt, were not available for most of the observations in
our sample, and analysis of these other variables in the sub-samples do not produce robust
21 Many of the variables in this section, unlike growth, are highly serially correlated, and some (particularly the monetary variables) may follow GARCH processes, so in this section we focus on the Rank test, which is robust to these alternate error structures.

19
results. Therefore, while we cannot rule out fiscal policy changes, we conclude that there
is no strong evidence of such effects.
We also examine whether there were changes in the growth rate of international
trade. While the results presented in Table 7 show no statistically significant overall
changes in the growth of trade, the results may suggest an effect for autocrats, particularly
when the POST dummy is shifted several years into the future. To look more directly at
trade policy, we also examined data on average tariff rates, using data from the World
Development Indicators. Unfortunately, data on tariffs was only available for 16 of the 57
leader deaths, and we found no statistically significant effects on tariff rates for those
leaders.
Finally, we examine changes in security policy by looking at measures of conflict.
We use annual conflict data from the PRIO / Uppsala Armed Conflict Dataset (Gleditsch
et. al 2002). The conflict variable takes a value of 0 if there is no conflict, 1 if there is a
minor armed conflict, 2 if there is a intermediate armed conflict, and 3 if there is a major
armed conflict.22 The results in Table 7 show no unusual changes in conflict associated
with leader deaths. In results not reported, we also tried splitting the sample based on
whether the country was in conflict or not in the year before the leader’s death, and using
discrete models such as probit or multinomial logit to examine the change in conflict
status, and also to restricting the variable to look only at internal conflicts. None of these
procedures found any unusual changes in conflict following the death of leaders.
The results therefore provide strong evidence that leaders affect monetary policy
but no persuasive evidence that leaders affect fiscal, trade, or security policy. Of course,
the set of panel data variables with coverage of the entire period is somewhat limited, so it
is possible that, using more detailed data or a larger sample of leaders, we would find
more effects.
22 Minor conflict is defined to be at least 25 deaths per year but no more than 1,000 total deaths; intermediate is defined to be between 25 and 1,000 deaths per year but no more than 1,000 total deaths; major is defined to be more than 1,000 deaths per year.
20
7. Conclusion Recent work in the cross-country growth literature has suggested that growth in
the typical country changes dramatically from one decade to the next, with developing
countries in particular showing sharp changes in growth patterns. This paper considers one
possible force – the national leader – in explaining these growth experiences.
Exogenously-timed leader transitions are used as a natural experiment to identify the
causative impact of leaders.
We find that countries experience persistent changes in growth rates across these
leadership transitions, suggesting that leaders have a large causative influence on the
economic outcomes of their nations. The paper further shows that the effects of leaders are
very strong in autocratic settings but much less so in the presence of democratic
institutions.
These results add texture to a growing literature on institutions in shaping
economic outcomes. In particular, this paper suggests that while political institutions may
matter, their impact is not deterministic. Rather, one important effect of political
institutions is to constrain the power of individual leaders. Democracies may be able to
prevent the disastrous economic policies of Robert Mugabe in Zimbabwe or Samora
Machel in Mozambique; however, they might also have constrained the successful
economic policies of Lee-Kwan Yew in Singapore or Deng Xiaoping in China.
The authors’ primary interest in this study is to improve our understanding of the
forces behind economic outcomes. However, this research also informs a separate and
very old literature in history and political science that considers the role of national
leaders in shaping events. Deterministic views suggest that leaders have little or no
influence, while the Great Man view of history, at the other extreme, sees history as the
biographies of a small number of individuals. Tolstoy believed this debate
methodologically impossible to settle (Tolstoy, 1869). Using exogenously-timed leader
deaths, the analysis in this paper presents a methodology for analyzing the causative
impact of leaders. We reject the hypothesis that leaders are incidental. We find that
leaders do matter, and they matter to something as significant as national economic
growth.
21
References Acemoglu, Daron, Johnson, Simon, and Robinson, James A. “The Colonial Origins of
Comparative Development: An Empirical Investigation,” American Economic Review 91, pp. 1369-1401, December 2001.
Alesina, A., Devleeschauwer, A., Easterly, W., Kurlat, S., and Wacziarg, R.
“Fractionalization,” mimeo, Harvard University, 2002. Berlin, Isaiah. Russian Thinkers, London: Hogarth Press, 1978. Bertrand, Marianne and Schoar, Antoinette. “Managing with Style: The Effect of
Managers on Firm Policies,” Quarterly Journal of Economics 118 (4), pp. 1169-208, 2003.
Bienen, Henry and Van de Walle, Nicolas. Of Time and Power, Stanford: Stanford
University Press, 1991. Blondel, Jean. Political Leadership, London: Sage Publications, 1987. Butterfield, Herbert. The Whig Interpretation of History, London: G. Bell and Sons,
1931. Carlyle, Thomas. The French Revolution: A History, London: Chapman and Hall, 1837. __________. On Heroes, Hero Worship and the Heroic in History, New York: Wiley
and Halsted, 1859. Clague, Christopher, Keefer, Philip, Knack, Stephen, and Olson, Mancur. “Property and
Contract Rights under Democracy and Dictatorship,” Journal of Economic Growth 1, pp. 243-276, 1996.
Corrado, Charles J. “A Nonparametric Test for Abnormal Security-Price Performance in
Event Studies,” Journal of Financial Economics 23, pp. 385-95, 1989. Downs, Anthony. An Economic Theory of Democracy, New York: Harper and Row,
1957. Duflo, Esther and Chattopadhyay, Raghabendra, “Women as Policy Makers: Evidence
from a Randomized Policy Experiment in India,” Econometrica 72 (5), pp. 1409-1443, September 2004.
Easterly, William and Levine, Ross. “Africa’s Growth Tragedy: Policies and Ethnic
Divisions,” Quarterly Journal of Economics 112, pp. 1203-1250, November 1997.

22
Easterly, William, Kremer, Michael, Pritchett, Lant, and Summers, Lawrence H. “Good Policy or Good Luck? Country Growth Performance and Temporary Shocks,” Journal of Monetary Economics 32, pp. 459-483, 1993.
Fair, Ray C. “The Effect of Economic Events on Votes for President,” The Review of
Economics and Statistics, pp. 159-173, May 1978. Gemmill, Gary and Oakley, Judith. “Leadership: An Alienating Social Myth?” Human
Relations 45, pp. 113-129, 1992. Glaeser, Edward L., La Porta, Rafael, Lopez-De-Silanes, Florencio and Shleifer, Andrei,
“Do Institutions Cause Growth?” Journal of Economic Growth 9, pp. 271-303, 2004.
Gleditsch, Nils P., et. al “Armed Conflict 1946–2001: A New Dataset,” Journal of Peace
Research 39(5), pp. 615–637, 2002. Hall, Robert E. and Jones, Charles I. “Why Do Some Countries Produce So Much More
Output Per Worker Than Others?” Quarterly Journal of Economics 4, pp. 83-116, 1999.
Johnson, W. Bruce, Magee, Robert, Nagarajan, Nandu, and Newman, Harry. “An
Analysis of the Stock Price Reaction to Sudden Executive Deaths,” Journal of Accounting and Economics 7, pp. 151-174, 1985.
Jones, Benjamin F. and Olken, Benjamin A., “Do Leaders Matter? National Leadership
and Growth Since World War II,” mimeo, Northwestern University, 2004. Kalt, Joseph P. and Zupan, Mark A., “Capture and Ideology in the Economic Theory of
Politics,” American Economic Review 74 (3), pp. 279-300, June 1984. Keefer, Philip and Knack, Stephen. “Institutions and Economic Performance: Cross-
country Tests using Alternative Measures,” Economics and Politics 7, pp. 207-227, 1995.
Keegan, John. “Winston Churchill,” Time Magazine, World Wide Web:
http://www.time.com/time/time100/leaders/profile/churchill.html. La Porta, Rafael, Lopez-de-Silanes, Florencio, Shleifer, Andrei, and Vishny, Robert W.
“The Quality of Government,” Journal of Law, Economics, and Organizations 15, pp. 222-279, 1999.
Lee, David S., Moretti, Enrico and Butler, Matthew J, “Do Voters Affect or Elect
Policies? Evidence from the U.S. House,” Quarterly Journal of Economics 119 (4), 1383-1441, August 2004.
23
Levitt, Steven D., “How Do Senators Vote? Disentangling the Role of Voter Preferences, Party Affiliation, and Senator Ideology,” American Economic Review 86 (3), pp. 425-441, June 1996.
Londregan, John and Poole, Keith. “Poverty, the Coup Trap, and the Seizure of Executive
Power,” World Politics, 1990, 42, 151-183. Marx, Karl. “The Eighteenth Brumaire of Louis Napoleon”, Die Revolution (New York),
1852. Mauro, P. “Corruption and Growth,” Quarterly Journal of Economics 110, pp. 681-712,
1995. North, Douglass C. Institutions, Institutional Change, and Economic Performance,
Cambridge: Cambridge University Press, 1990. Olson, Mancur. “Dictatorship, Democracy, and Development,” American Political
Science Review 87 (3), pp. 567-576, September 1993. __________. Power and Prosperity, New York: Basic Books, 2000. Poole, Keith T., and Rosenthal, Howard, “The Polarization of American Politics,” Journal
of Politics 46 (4), pp. 1061 - 1079, November 1984. Posner, Daniel N. “The Colonial Origins of Ethnic Cleavages: The Case of Linguistic
Divisions in Zambia,” Comparative Politics 35(2), 2003. Pritchett, Lant. “Understanding Patterns of Economic Growth: Searching for Hills
Amongst Plateaus, Mountains, and Plains,” World Bank Economic Review, 2000. Quinn, Dennis P. and Wooley, John T. “Democracy and National Economic
Performance: The Preference for Stability,” American Journal of Political Science 45(3), 2001.
Romer, Christina D. and Romer, David H. “Choosing the Federal Reserve Chair: Lessons
from History,” NBER Working Paper #10161, December 2003. Sachs, Jeffrey D. and Warner, Andrew M. “Fundamental Sources of Long-Run Growth,”
American Economic Review 87, pp. 184-188, May 1997. Schumpeter, Joseph R. Capitalism, Socialism, and Democracy, New York: Harper and
Row, 1950. Tolstoy, Leo. War and Peace, 1869.
24
Tsebelis, George. Veto Players: How Political Institutions Work, New York: Russell Sage Foundation, 2002.
Weber, Max. The Theory of Social and Economic Organization, New York: Free Press,
1947. Wolfers, Justin. “Are Voters Rational? Evidence from Gubernatorial Elections,” Stanford
GSB Working Paper #1730, 2002. Major Data Sources Bourgoin, Suzanne M. and Byers, Paula K. eds. Encyclopedia of World Biography, 2nd
edition, 17 volumes, Detroit, MI: Gale Research Inc.,1998. Central Intelligence Agency. The World Factbook 2002, Internet Site:
http://www.odci.gov/cia/publications/factbook/. Commire, A. and Klezmer, D. eds. Historic World Leaders, 5 volumes, Detroit, MI: Gale
Research Inc., 1994. Contemporary Black Biography, periodical, Detroit, MI: Gale Research, Inc.1992-present. Frankel, Benjamin ed. The Cold War: 1945-1991, 3 volumes, Detroit, MI: Gale Research,
1992. Karatnycky, Adrian, Piano, Ali, and Puddington, Arch. Freedom in the World 2003: The
Annual Survey of Political Rights and Civil Liberties, Lanham, MD: Rowman & Littlefield, 2003.
Knight, Virginia C, ed. African Biography, 3 volumes, Detroit, MI: UXL, 1999. Lentz, Harris M. III. Heads of States and Governments: A Worldwide Encyclopedia of
Over 2,300 Leaders, 1945 through 1992, Jefferson, NC: McFarland & Company, 1994.
Heston, Alan, Summers, Robert and Aten, Bettina. Penn World Table Version 6.1, Center
for International Comparisons at the University of Pennsylvania (CICUP), October 2002.
Marshall, Monty G., and Jaggers, Keith. Polity IV Project, Integrated Network for
Societal Conflict Research Program and Center for International Development and Conflict Management, University of Maryland, 2000.
Przeworski, Adam, Alvarez, Michael E., Cheibub, Jose Antonio, and Limongi, Fernando,
Democracy and Development: Political Institutions and Well-Being in The World, 1950-1990, Cambridge: Cambridge University Press, 2000.

25
The New York Times, various issues. World Development Indicators, CD-ROM, World Bank, 2002. Zarate, Roberto Ortiz ed. Zarate’s Political Collections, Internet Site:
http://www.terra.es/personal2/monolith/home.htm, 2003.
26
Table 1: How Leaders Leave Power
130 Countries
All Leaders from 1945 or National Independence Date through 2000 Number of Observations, by Type
Lost Election Term Limits
Voluntary Retirement Deposed
Deatha
Other
Total
310 178 131 222 105 225 1184b
Assassination Natural Accidental 28 65 12 105
Heart disease
Cancer
Stroke
Other Disease
Surgical complications
Other
Air crash
Other
29 12 6 6 3 9 8 4 77 Notes: a There are 21 further cases (not included here) where leaders are killed during a coup. b There are 1294 distinct terms in which leaders are in power in the data set, but only 1184 counted in this table, as we do not witness the exit of leaders who are still in power at the end of the year 2000. c There are 77 cases of leaders who die in office by natural causes or accidents, but only 57 who die during periods where there is available growth data before and after the leader’s death.

27
Table 2: Deaths of National Leaders Due to Accidental or Natural Causes Country
Leader
Year of Death
Tenure (Years)
Nature of Death
Algeria Houari Boumediene 1978 13.5 Waldenstrom’s disease (blood disorder) Angola Agostinho Neto 1979 3.9 Cancer of the pancreas Argentina Juan Peron 1974 .7a Heart and kidney failure Australia John Curtin 1945 3.7 Heart attack Australia Harold Holt 1967 1.9 Drowned while skin-diving in Port Philip Bay Barbados John (Tom) Adams 1985 8.5 Heart attack Barbados Errol Barrow 1987 1.0a No cause of death announced Bolivia Rene Barrientos (Ortuna) 1969 2.7a Helicopter crash Botswana Sir Seretse Khama 1980 13.8 Cancer of the stomach Brazil Arthur da Costa e Silva 1969 2.6 Paralytic stroke, then heart attack China Mao Tse-tung 1976 26.9 Parkinson’s disease China Deng Xiaoping 1997 19.2 Parkinson’s disease Comoros Prince Jaffar 1975 .4 While on pilgrimage to Mecca Comoros Mohamad Taki 1998 2.7 Heart attack Cote d'Ivoire Felix Houphouet-Boigny 1993 33.3 Following surgery for prostate cancer Denmark Hans Hedtoft 1955 1.3a Heart attack in hotel in Stockholm Denmark Hans Hansen 1960 5.0 Cancer Dominica Roosevelt Douglas 2000 0.7 Heart attack Ecuador Jaime Roldos (Aguilera) 1981 1.8 Plane crash in Andes Egypt Gamal Abdel Nasser 1970 15.9 Heart attack France Georges Pompidou 1974 4.8 Cancer Gabon Leon Mba 1967 7.3 Cancer (in Paris) Greece Georgios II 1947 11.4 Heart attack Grenada Herbert Blaize 1989 5.0 Prostate cancer Guinea Sekou Toure 1984 25.5 Heart attack during surgery in Cleveland Guyana Linden Burnham 1985 19.2 During surgery Guyana Cheddi Jagan 1997 4.4 Heart attack a few weeks after heart surgery Haiti Francois Duvalier 1971 13.5 Heart disease Hungary Jozsef Antall 1993 3.6 Lymphatic cancer Iceland Bjarni Benediktsson 1970 6.7 House fire India Jawaharlal Nehru 1964 16.8 Stroke India Lal Bahadur Shastri 1966 1.6 Heart attack Iran Ayatollah Khomeini 1989 10.3 Following surgery to stem intestinal bleeding Israel Levi Eshkol 1969 5.7 Heart attack Jamaica Donald Sangster 1967 0.1 Stroke Japan Masayoshi Ohira 1980 1.5 Heart attack Japan Keizo Obuchi 2000 1.7 Stroke Jordan Hussein al-Hashimi 1999 46.5 Non-Hodgkin’s lymphoma Kenya Jomo Kenyatta 1978 14.7 While sleeping Liberia William V.S. Tubman 1971 27.6 Complications surrounding surgery on prostate Luxembourg Pierre Dupong 1953 16.1 Complications from broken leg Luxembourg Pierre Frieden 1959 0.9 Cause unclear Malaysia Tun Abdul Razak 1976 5.3a Leukemia (in London) Mauritania Ahmed Ould Bouceif 1979 .1 Plane crash in sandstorm over Atlantic Morocco Mohammed V 1961 5.3a Following operation to remove growth in throat Morocco Hassan II 1999 38.4 Heart attack Mozambique Samora Machel 1986 11.3 Plane crash near Maputo Nepal Tribhuvan 1955 4.1 Heart attack in Zurich Nepal Mahendra 1972 16.9 Heart attack New Zealand Norman Kirk 1974 1.7 Heart attack Nicaragua Rene Schick Gutierrez 1966 3.3 Heart attack Niger Seyni Kountche 1987 13.6 Cancer (brain tumor)

28
Nigeria Sani Abacha 1998 4.6 Heart attack (some say poisoned) Pakistan Mohammed Ali Jinnah 1948 1.1 Heart failure Pakistan Mohammed Zia Ul-Haq 1988 11.1 Plane crash in Pakistan Panama Domingo Diaz Arosemena 1949 .9 Heart attack Panama Omar Torrijos Herrera 1981 12.8 Plane crash near Penonomé Philippines Manuel Roxas y Acuna 1948 1.9 Heart attack Philippines Ramon Magsaysay 1957 3.2 Plane crash on Cebu Island Poland Boleslaw Bierut 1956 11.2 Heart attack Portugal Francisco de Sa Carneiro 1980 0.9 Light plane crash near Lisbon Romania Gheorghe Gheorghiu-Dej 1965 17.2 Pneumonia Sierra Leone Sir Milton Margai 1964 3.0 After “brief illness” South Africa Johannes G. Strijdom 1958 3.7 Heart disease Spain Francisco Franco 1975 36.3 Heart failure Sri Lanka Don Stephen Senanayake 1952 4.5 Thrown from horse Swaziland Sobhuza II 1982 60.7 Unknown Sweden Per Hansson 1946 10.0 Stroke Syria Hafiz al-Assad 2000 29.6 Heart attack Taiwan Chiang Kai-Shek 1975 25.3a Heart attack Taiwan Chiang Ching-Kuo 1988 12.8 Heart attack Thailand Sarit Thanarat 1963 5.1 Heart and lung ailments Trinidad & Tobago Eric Williams 1981 18.6 Complications from diabetes USA Franklin D. Roosevelt 1945 12.1 Stroke Uruguay Tomas Berreta 1947 .4 During emergency surgery Uruguay Luis Ganattasio 1965 .9 Heart attack Uruguay Oscar Gestido 1967 .8 Heart attack Notes: a Second time in power.

29
Table 3: Do Leaders Matter?
All Leaders
Leaders with Tenure >= 2 Years J
statistic Wald
P-Value Rank
P-Value J
statistic Wald
P-Value Rank
P-Value Treatment Timings t 1.312 .0573* 0.017** 1.392 .0390** 0.004*** t+1 1.272 .0845* 0.075* 1.361 .0537* 0.052* t+2 1.308 .0669* 0.172 1.443 .0314** 0.121 Control Timings t-5 0.841 .7953 0.446 0.918 .6269 0.357 t-6 0.986 .5026 0.806 0.962 .5409 0.905 Number of leaders (t) 57 57 57 47 47 47 Number of observations (t) 5567 5567 5567 5567 5567 5567 Notes: Under the null hypothesis, growth is similar before and after randomly-timed leader transitions. P-values indicate the probability that the null hypothesis is true. The J-statistic is the test statistic described in equation (3) in the text; under the null, J = 1, and higher values of J correspond to greater likelihood that the null is false. P-values in columns (2) and (5) are from Chi-squared tests, where the POST and PRE dummies are estimated via OLS allowing for region-specific heteroskedasticity and a region-specific AR(1) process, where the regions are Asia, Latin America, Western Europe, Eastern Europe/Transition, Middle East/North Africa, Sub-Saharan Africa, and Other. Estimation using alternative error structures for the Wald test produce similar or stronger results. Estimation of columns (3) and (6) is via the Rank-method described in the text. The regressions reported in this table compare 5-year growth averages before and after leader deaths. The treatment timing “t” considers growth in the 5-year period prior to the transition year with growth in the 5-year period after the transition year. The treatment timings “t+1” and “t+2” shift the POST period forward 1 and 2 years respectively. The control timings shift both PRE and POST dummies 5 and 6 years backwards in time. Asterisks indicate the significance with which the null is rejected: * indicates 90% significance; ** indicates 95% significance; *** indicates 99% significance.

30
Table 4: Do Economic Variables Predict Leader Deaths? (1) (2) (3)
Previous Year’s Growth 1.648 0.902
(2.254) (2.306) Change in Consumption 0.684
(1.553) Change in Government Expenditure -0.127
(1.109) Change in Investment 0.802
(0.692) Change in Trade 0.075
(1.24) Change in Terms of Trade 0.814
(1.110) Change in Exchange Rate -3.472**
(1.431) Observations 2267 2265 2267
Notes: Reported coefficients are from a conditional fixed-effects logit model of the probability of a leader death occurring in a given year, conditional on the number of leader deaths that actually occurred in each country. Results using mean changes in the independent variables over the previous 3 or 5 years, rather than in the previous year, are qualitatively similar. Standard errors are in parentheses. * significant at 10%; ** significant at 5%; *** significant at 1%
31
Table 5: Interactions with Type of Political Regime in Year Prior to Death J
statistic Wald
P-Value Rank
P-Value J
statistic Wald
P-Value Rank
P-Value Autocrats (Polity IV) Democrats (Polity IV) Treatment Timings t 1.621 0.019** 0.040** 1.000 0.460 0.106 t+1 1.672 0.016** 0.017** 0.932 0.552 0.712 t+2 1.592 0.028** 0.051* 1.021 0.432 0.636 Control Timings t-5 0.849 0.698 0.837 0.866 0.632 0.075* t-6 1.094 0.334 0.977 0.647 0.873 0.191 Number of leaders (t) 29 29 29 22 22 22 Notes: See notes to Table 3. Distinctions across leader sets are defined using the “polity” variable in the Polity IV data set in the year prior to the leader’s death. Autocrats are defined by having a polity score less than or equal to 0. Democrats are those leaders with a polity score greater than 0.

32
Table 6: Interactions with Country Characteristics P-values: Probability that dependent variable does not change
systematically across randomly-timed leader deaths Presence of Political Parties
(Autocracies only) Selection of Leader (Autocracies only)
No political parties
Has political parties Seized power
Did not seize power
Treatment timings t 0.001*** 0.602 0.118 0.152 t+1 0.002*** 0.280 0.040** 0.210 t+2 0.010*** 0.185 0.133 0.272 Number of leaders (t) 9 15 13 13
Low Income in 1960 Middle Income in 1960 High Income in 1960 All Autoc Democ All Autoc Democ All Autoc Democ Treatment timings t 0.264 0.223 0.451 0.096* 0.072* 0.531 0.042** 0.067* 0.082* t+1 0.263 0.158 0.590 0.063* 0.040* 0.840 0.403 0.138 0.517 t+2 0.701 0.490 0.804 0.059* 0.039* 0.459 0.495 0.111 0.638 Number of leaders (t) 15 11 3 24 17 5 15 1 12 High Ethnic Fragmentation Low Ethnic Fragmentation All Autoc Democ All Autoc Democ Treatment timings t 0.029** 0.034** 0.371 0.091* 0.157 0.113 t+1 0.133 0.137 0.493 0.253 0.010*** 0.750 t+2 0.483 0.375 0.608 0.193 0.004*** 0.702 Number of leaders (t) 28 18 10 22 8 10 Notes: See notes to previous tables. “Presence of political parties” is based on the “mobilize” variable from from Przeworski et al (2000), and “Selection of Leader” is from authors’ classification. “High” ethnic fragmentation refers to all countries above the median in that variable among all countries in the sample, not just countries with random leader deaths. Low Income, Middle Income, and High Income split countries into thirds by per-capita income in 1960. The table reports p-values for the Rank test of the null hypothesis that growth does not change unusually in the five years before and after a random leadership transition.
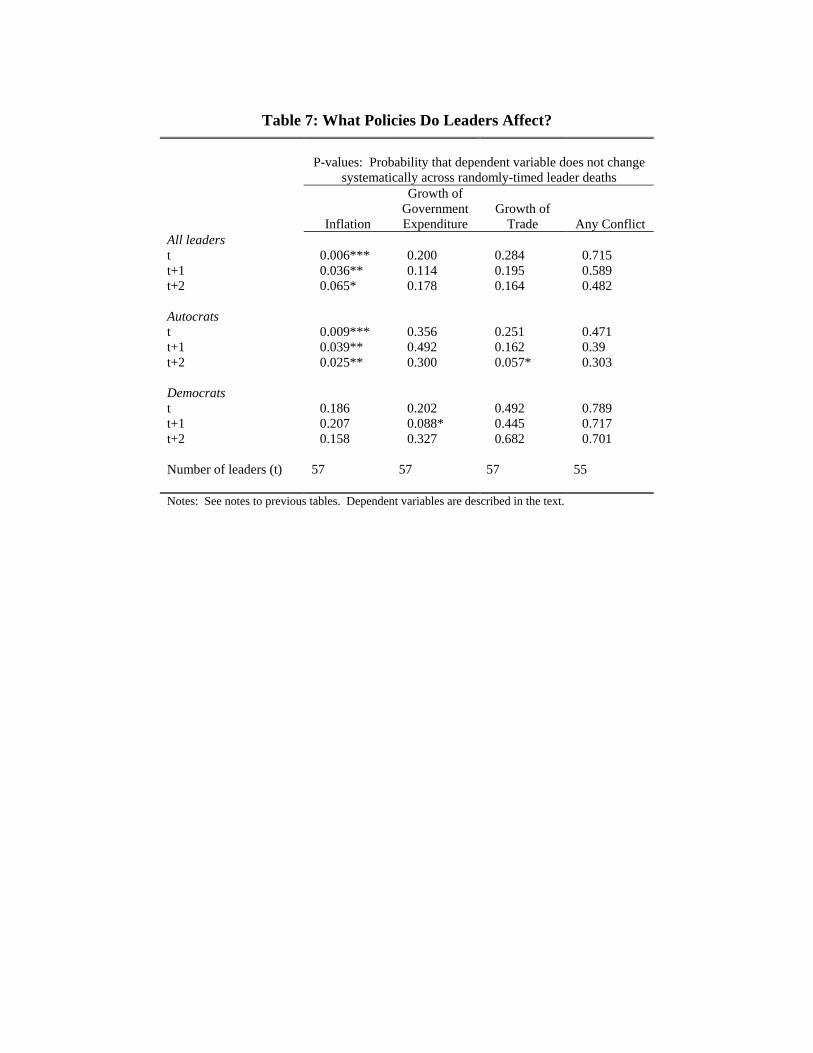
Table 7: What Policies Do Leaders Affect? P-values: Probability that dependent variable does not change
systematically across randomly-timed leader deaths
Inflation
Growth of Government Expenditure
Growth of Trade Any Conflict
All leaders t 0.006*** 0.200 0.284 0.715 t+1 0.036** 0.114 0.195 0.589 t+2 0.065* 0.178 0.164 0.482 Autocrats t 0.009*** 0.356 0.251 0.471 t+1 0.039** 0.492 0.162 0.39 t+2 0.025** 0.300 0.057* 0.303 Democrats t 0.186 0.202 0.492 0.789 t+1 0.207 0.088* 0.445 0.717 t+2 0.158 0.327 0.682 0.701 Number of leaders (t) 57 57 57 55 Notes: See notes to previous tables. Dependent variables are described in the text.

34
Figure 1: Growth and Leader Deaths
6.5
77.
58
8.5
1950 1960 1970 1980 1990 2000
China
6.6
6.8
77.
27.
47.
6
1950 1975 2000
Mozambique7.
77.
87.
98
1950 1975 2000
Guinea
7.5
88.
59
1950 1975 2000
Iran
Log
PPP
GD
P pe
r-ca
pita
Year