Do Jobs In Export Industries Still Pay More? And Why?
32
Do Jobs In Export Industries Still Pay More? And Why? by David Riker Office of Competition and Economic Analysis July 2010 Manufacturing and Services Economics Briefs are produced by the Office of Competition and Economic Analysis of the International Trade Administration’s Manufacturing and Services unit. A complete list of reports, along with links to other trade data and analysis, is available at www.trade.gov/mas/ian.
Transcript of Do Jobs In Export Industries Still Pay More? And Why?
Do Jobs In Export Industries Still Pay More? And Why?
by David Riker
Office of Competition and Economic Analysis
July 2010
Manufacturing and Services Economics Briefs are produced by the Office of Competition and Economic Analysis of the International Trade Administration’s Manufacturing and Services unit. A complete list of reports, along with links to other trade data and analysis, is available at www.trade.gov/mas/ian.

Manufacturing and Services Economics Brief No. 2
ii Do Jobs In Export Industries Still Pay More? And Why? – July 2010
Acknowledgements
I appreciate the helpful comments that I received on earlier drafts of this study from
Praveen Dixit, Joseph Flynn, Elizabeth Handwerker, Martin Johnson, Justin Pierce, and others.
All remaining errors are my own.

International Trade Administration
Do Jobs In Export Industries Still Pay More? And Why? iii
Table of Contents
Acknowledgements ......................................................................................................................... ii
Table of Contents ........................................................................................................................... iii
Executive Summary ........................................................................................................................ v
1. Introduction ................................................................................................................................ 1
2. CPS Data Provide Detailed Information about Individual Workers .......................................... 2
3. Education and Other Worker Attributes Explain Differences in Earnings ................................ 3
4. Exporting Contributes Significantly to Workers’ Earnings ....................................................... 4
5. Looking Ahead........................................................................................................................... 6
References ....................................................................................................................................... 7
Technical Appendix ........................................................................................................................ 9

Manufacturing and Services Economics Brief No. 2
iv Do Jobs In Export Industries Still Pay More? And Why? – July 2010
<Page intentionally left blank>
International Trade Administration
Do Jobs In Export Industries Still Pay More? And Why? v
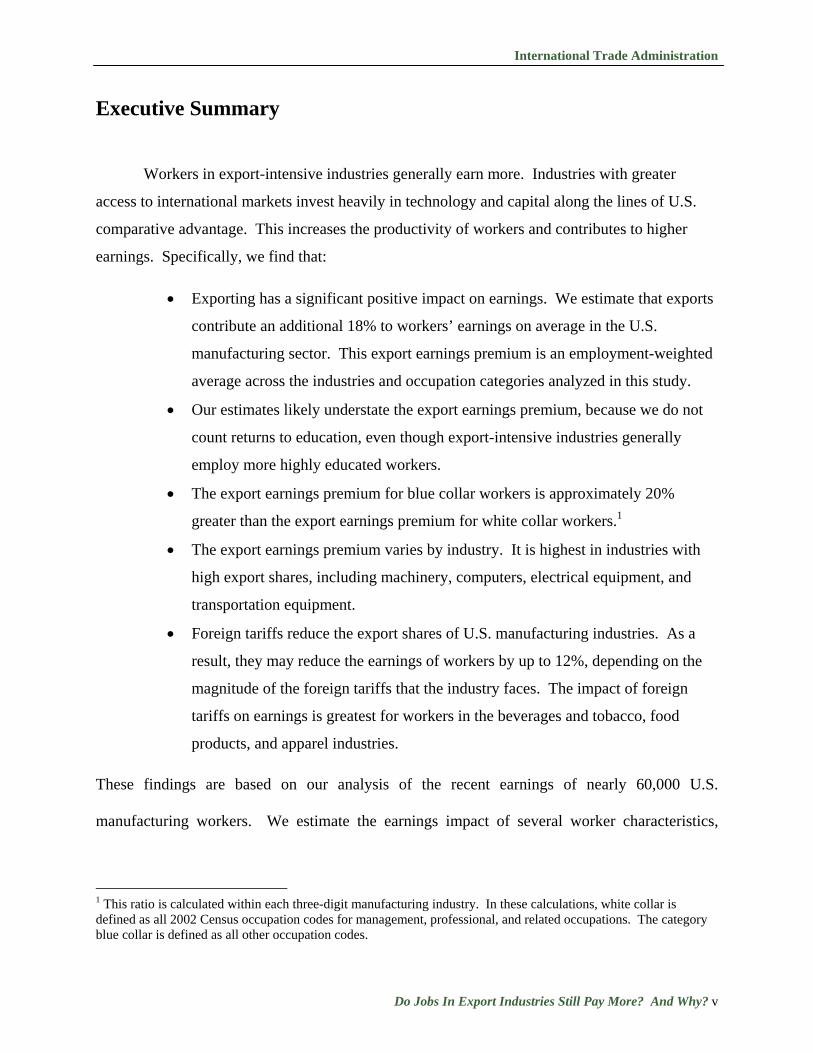
Executive Summary
Workers in export-intensive industries generally earn more. Industries with greater
access to international markets invest heavily in technology and capital along the lines of U.S.
comparative advantage. This increases the productivity of workers and contributes to higher
earnings. Specifically, we find that:
• Exporting has a significant positive impact on earnings. We estimate that exports
contribute an additional 18% to workers’ earnings on average in the U.S.
manufacturing sector. This export earnings premium is an employment-weighted
average across the industries and occupation categories analyzed in this study.
• Our estimates likely understate the export earnings premium, because we do not
count returns to education, even though export-intensive industries generally
employ more highly educated workers.
• The export earnings premium for blue collar workers is approximately 20%
greater than the export earnings premium for white collar workers.1
• The export earnings premium varies by industry. It is highest in industries with
high export shares, including machinery, computers, electrical equipment, and
transportation equipment.
• Foreign tariffs reduce the export shares of U.S. manufacturing industries. As a
result, they may reduce the earnings of workers by up to 12%, depending on the
magnitude of the foreign tariffs that the industry faces. The impact of foreign
tariffs on earnings is greatest for workers in the beverages and tobacco, food
products, and apparel industries.
These findings are based on our analysis of the recent earnings of nearly 60,000 U.S.
manufacturing workers. We estimate the earnings impact of several worker characteristics,
1 This ratio is calculated within each three-digit manufacturing industry. In these calculations, white collar is defined as all 2002 Census occupation codes for management, professional, and related occupations. The category blue collar is defined as all other occupation codes.

Manufacturing and Services Economics Brief No. 2
vi Do Jobs In Export Industries Still Pay More? And Why? – July 2010
including the export intensity of the worker’s industry and the worker’s education, age, location,
and occupation.

International Trade Administration
Do Jobs In Export Industries Still Pay More? And Why? 1
1. Introduction
Workers in export-intensive industries generally earn more. There are several reasons
for this. First, workers in industries with greater access to international markets benefit from the
industries’ investments in capital and technology along the lines of U.S. comparative advantage.
These investments increase the value of labor inputs and therefore earnings.
Second, export-intensive industries employ a more highly educated workforce, and the
higher earnings reflect the industry composition of the workforce. For this reason, part of the
higher earnings should be attributed to the worker’s educational attainment rather than to
exporting.
Finally, the higher earnings reflect industry factors that increase the productivity of the
workers whether they export or not, but which also increase the probability that the worker’s
industry will succeed in exporting. For example, if the U.S. industry produced an exceptionally
high quality, relatively unique set of goods, then export success would coincide with higher
earnings, even if export intensity did not increase the earnings. This third effect has been
described as “success begets exporting.” 2
Since we are interested in measuring the contribution of exporting to earnings, we want
to isolate and measure the first of these three effects. Using an econometric model of the
earnings of individual manufacturing workers, we quantify the impact on earnings of lower
barriers to international trade and the consequent expansion of U.S. manufacturing exports. In
order to estimate the econometric model, we need to identify industry characteristics that explain
why some U.S. industries are relatively export-intensive. We find that differences across
industries in international freight costs and tariffs on imports from the United States are
significant determinants of an industry’s export intensity, and thus lower trade barriers are
associated with significantly higher earnings.
2 Bernard and Jensen (1999).

Manufacturing and Services Economics Brief No. 2
2 Do Jobs In Export Industries Still Pay More? And Why?
2. CPS Data Provide Detailed Information about Individual
Workers
We analyze the weekly earnings of nearly 60,000 U.S. workers who participated in the
Current Population Survey (CPS) between 2006 and 2008. The data source is the NBER’s
Merged Outgoing Rotation Group extracts from the CPS data files. The sample is limited to
individuals employed in manufacturing industries (NAICS 311-339). Our earnings measure is
usual weekly earnings, converted into constant 2008 dollars.
Our statistical analysis takes into account individual characteristics that affect a worker’s
earnings, including educational attainment, age, occupation, union, race, gender, and location.
The measures of educational attainment are based on the highest degree completed (high school
diploma or equivalent, associate degree, bachelor degree, or post-graduate degree). We
aggregate occupations into three groups based on the occupation codes in the 2002 Census:
management, professional, and related occupations; sales and office occupations; and all other
occupations within the manufacturing industries. A worker is classified as union if he or she is a
member of a union or is covered by a union contract. We also take into account the worker’s
state of residence and whether the worker lives in a metropolitan area.
We use the worker’s three-digit industry designation to link the worker to industry-level
trade flows, and we use the ratio of export sales to total sales to measure the export intensity of
the worker’s industry.3 We calculate each industry’s export share and import penetration ratio
from annual free along ship export values, landed duty paid import values, and the total shipment
values from the Census Bureau.4 The six manufacturing industries with the highest export shares
in 2007 were computers, electrical equipment, machinery, medical equipment and miscellaneous
3 The industry designations in the CPS worker-level data correspond to three-digit NAICS industries. It is not possible to further disaggregate the industries and still associate them with individual workers. We discuss this limitation in our Looking Ahead section. 4 The export share is the value of exports divided by the total value of shipments. The import penetration ratio is the value of imports divided by the sum of domestic shipments and imports.
International Trade Administration
Do Jobs In Export Industries Still Pay More? And Why? 3
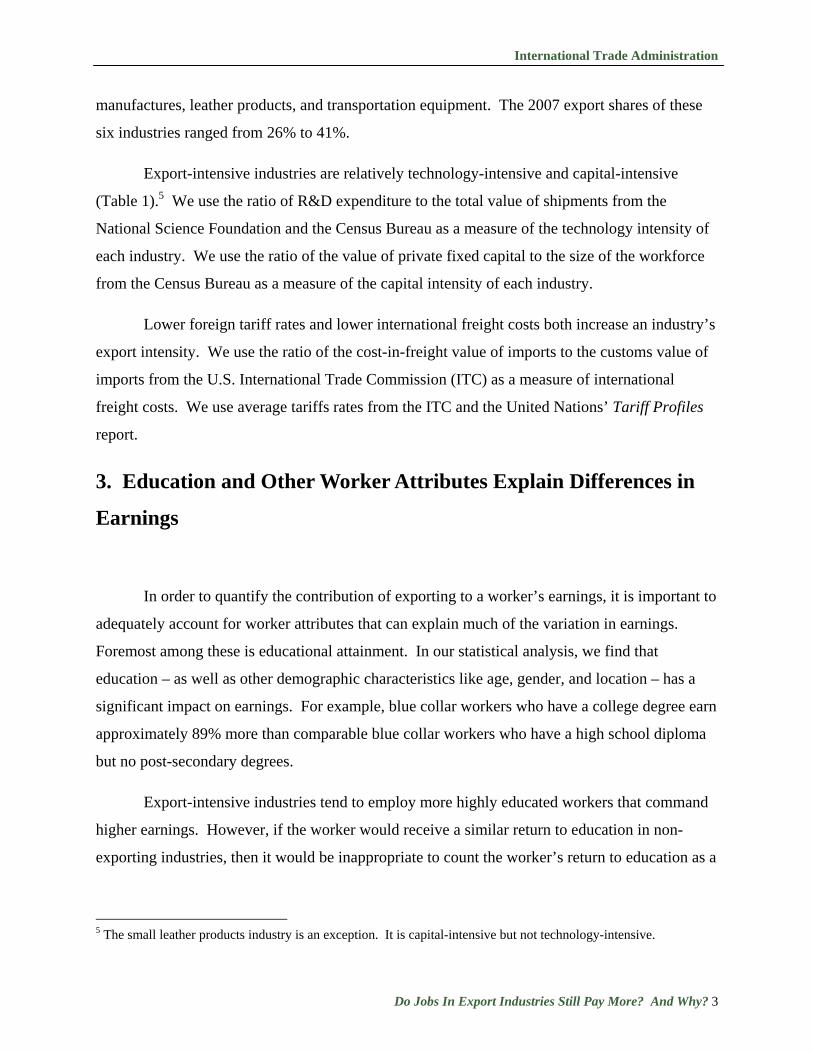
manufactures, leather products, and transportation equipment. The 2007 export shares of these
six industries ranged from 26% to 41%.
Export-intensive industries are relatively technology-intensive and capital-intensive
(Table 1).5 We use the ratio of R&D expenditure to the total value of shipments from the
National Science Foundation and the Census Bureau as a measure of the technology intensity of
each industry. We use the ratio of the value of private fixed capital to the size of the workforce
from the Census Bureau as a measure of the capital intensity of each industry.
Lower foreign tariff rates and lower international freight costs both increase an industry’s
export intensity. We use the ratio of the cost-in-freight value of imports to the customs value of
imports from the U.S. International Trade Commission (ITC) as a measure of international
freight costs. We use average tariffs rates from the ITC and the United Nations’ Tariff Profiles
report.
3. Education and Other Worker Attributes Explain Differences in
Earnings
In order to quantify the contribution of exporting to a worker’s earnings, it is important to
adequately account for worker attributes that can explain much of the variation in earnings.
Foremost among these is educational attainment. In our statistical analysis, we find that
education – as well as other demographic characteristics like age, gender, and location – has a
significant impact on earnings. For example, blue collar workers who have a college degree earn
approximately 89% more than comparable blue collar workers who have a high school diploma
but no post-secondary degrees.
Export-intensive industries tend to employ more highly educated workers that command
higher earnings. However, if the worker would receive a similar return to education in non-
exporting industries, then it would be inappropriate to count the worker’s return to education as a
5 The small leather products industry is an exception. It is capital-intensive but not technology-intensive.

Manufacturing and Services Economics Brief No. 2
4 Do Jobs In Export Industries Still Pay More? And Why?
contribution of exporting simply because the highly educated worker is employed in an export-
intensive industry.
We resolve this issue in a conservative way that likely leads to an understatement of the
export earnings premium. Our export earnings premium does not count returns to education.
Technically, this is equivalent to assuming that the manufacturing workers would still be
employed if they did not have a job in the export-intensive industry and that their alternative
employment would still fully utilize their education. If that were not the case, then some of the
returns to education should be counted in the export earnings premium.
4. Exporting Contributes Significantly to Workers’ Earnings
The economic theory linking exporting to higher earnings is straightforward. Greater
access to export markets will likely result in greater investments in technology and capital, both
of which increase the productivity of workers.6 If earnings are greater for more productive
workers, then we expect higher earnings in export-intensive industries, even after we take into
account the educational attainment and other attributes of the individual workers.
In order to quantify the contribution of exporting to earnings, we evaluate a hypothetical
scenario in which we set each industry’s export share equal to zero. We use the estimated
parameters of a statistical model to simulate the zero-exports level of earnings. We then
calculate how much higher actual earnings were relative to the zero-exports level of earnings.
The percentage difference in these two measures of earnings is our export earnings premium.
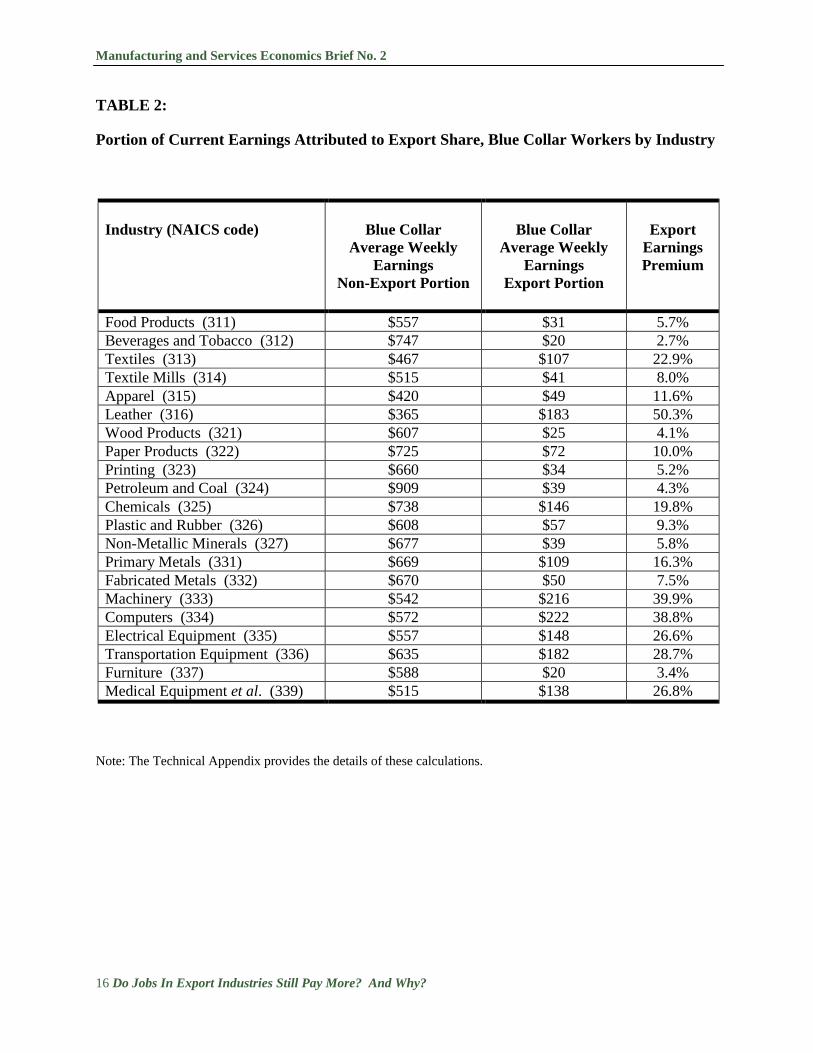
For example, for blue collar workers in the chemicals industry, the export earnings premium is
19.8%. The actual average weekly earnings of these workers is $884. If the industry had no
exports, rather than its actual export share of 20.4%, then we estimate that the average weekly
earnings of these workers would be $738. In this example, the export earnings premium is ($884
- $738) / $738 = 19.8%.
6 On the other hand, industries with large import penetration ratios are generally less technology-intensive and less capital-intensive.

International Trade Administration
Do Jobs In Export Industries Still Pay More? And Why? 5
We estimate that exports increase earnings by 18% on average across the U.S.
manufacturing industries and the two occupation categories. This summary statistic is an
employment-weighted average of the export earnings premium that we calculated for each
industry and occupation category. These calculations should be interpreted as estimates of the
long-run impact of exporting on earnings. We expect these differences in earnings only after the
industry’s technology intensity and capital intensity has fully adjusted to international trade
opportunities.
When we look within the three-digit manufacturing industries, we find that exports have
a larger impact on blue collar earnings than on white collar earnings (Tables 2 and 3). The
export earnings premium for blue collar workers in each industry is approximately 20% greater
than the export earnings premium for white collar workers.7
The contribution of exporting to earnings is greater in industries with higher export
shares. This is true for blue collar workers and for white collar workers. The six manufacturing
industries with the largest export earnings premium are computers, electrical equipment,
machinery, medical equipment and miscellaneous manufactures, leather products, and
transportation equipment.
Finally, foreign tariffs reduce the export shares of U.S. manufacturing industries. As a
result, they reduce the earnings of workers by up to 12%, depending on the magnitude of the
foreign tariffs that the industry faces (Table 4). The impact of foreign tariffs on earnings is
greatest for workers in the beverages and tobacco, food products, and apparel industries.
7 We can summarize these industry-specific estimates by averaging across the industries in the U.S. manufacturing sector. The un-weighted average of the industry-specific export wage premium is 16.6% for blue collar workers and 13.3% for white collar workers. The employment-weighted average of the export earnings premium is 18.0% for blue collar workers and 19.3% for white collar workers.

Manufacturing and Services Economics Brief No. 2
6 Do Jobs In Export Industries Still Pay More? And Why?
5. Looking Ahead
One limitation of the CPS data is that they do not identify the worker’s industry
affiliation at a disaggregated level.8 Our measure of the worker’s participation in export markets
is at the three-digit industry level. The appropriateness of this measure depends on the scope of
the product market of the worker’s employer. For example, suppose that a worker makes a
product that is not exported, but this product is within a broader three-digit industry that has a
relatively high export intensity overall. In this case, we would have false positive indicators of
export intensity, because our measure of export intensity is at the industry level. On the other
hand, there can be significant limitations to more disaggregated data. Workers who compete in
an export-intensive market are likely to earn an export earnings premium if their products are
competing in a globalized market, even if the output of their specific plant is not exported. In
this case, plant-level data could generate false negative indicators of export intensity. For these
reasons, we believe that it is important to consider both industry-level and plant-level evidence
on the link between exporting and wages.
Finally, it would be interesting to disentangle how much of the impact of exporting on
earnings comes through increased R&D intensity, increased capital intensity, and other channels.
However, for technical reasons we cannot do this decomposition with the information available
in this study.9 This could be a useful direction for further research.
8 On the other hand, the CPS data provide detailed information on the workers’ individual characteristics like education. 9 It would require additional instrumental variables with specific stochastic properties, as we explain in the Technical Appendix.

International Trade Administration
Do Jobs In Export Industries Still Pay More? And Why? 7
References
Bernard, A.; Jensen, J.B. (1995): “Exporters, Jobs, and Wages in U.S. Manufacturing: 1976-1987,” Brookings Papers on Economic Activity, Microeconomics, Volume 1995, 67-112.
Bernard, A.; Jensen, J.B. (1999): “Exceptional Exporter Performance: Cause, Effect, or Both?” Journal of International Economics 47: 1-25.
Bernard, A.; Jensen, J.B.; Redding, S.; Schott, P. (2007): “Firms in International Trade,” Journal of Economic Perspectives 21(3): 105-130.
Ebenstein, A.; Harrison, A.; McMillan, M.; Phillips, S. (2009): “Estimating the Impact of Trade and Offshoring on American Workers Using the Current Population Surveys,” NBER Working Paper 15107.
Munch, J.; Skaksen, J. (2008): “Human Capital and Wages in Exporting Firms,” Journal of International Economics 75: 363-372.
Schank, T.; Schnabel, C; Wagner, J. (2007): “Do Exporters Really Pay Higher Wages? First Evidence from German Linked Employer-Employee Data.” Journal of International Economics 72: 52-74.

Manufacturing and Services Economics Brief No. 2
8 Do Jobs In Export Industries Still Pay More? And Why?
<Page intentionally left blank>

International Trade Administration
Do Jobs In Export Industries Still Pay More? And Why? 9
Technical Appendix
Model of Earnings Determination
In order to more precisely describe the technical assumptions underlying the econometric
estimates, we present a mathematical model of earnings determination in equation (1). The
model combines workers’ characteristics, like education and age, with industry characteristics,
like export share and capital intensity.
, , , (1)
, is the log of average weekly earnings for individual in industry . is the ratio of exports
to the total value of shipments in industry , is the industry’s import penetration ratio, is
the industry’s ratio of R&D expenditures to the total value of shipments (a proxy for the
industry’s technology intensity), is the the industry’s ratio of private fixed assets to the size of
the workforce (a proxy for the industry’s capital intensity), , is a set of individual attributes
that are traditionally included in earnings models, and , is a random error. The coefficients
are constant parameters of the model.
Equations (2) and (3) represent the link between each industry’s technology intensity and
capital intensity and its export share and import penetration ratio.
(2)
(3)
The terms and are random variables that may be correlated with , in equation (1). The
and coefficients are constant parameters of the model.
In these three equations, exports ( ) affect earnings ( ) in three ways. An increase in
export intensity increases the industry’s technology intensity 0 , which in turn increases
earnings 0 . It increases the industry’s capital intensity 0 , which in turn increases
earnings 0 . In addition, it may also increase earnings through other channels, such as
increased utilization of workers’ unobserved skills 0 .
Manufacturing and Services Economics Brief No. 2
10 Do Jobs In Export Industries Still Pay More? And Why?
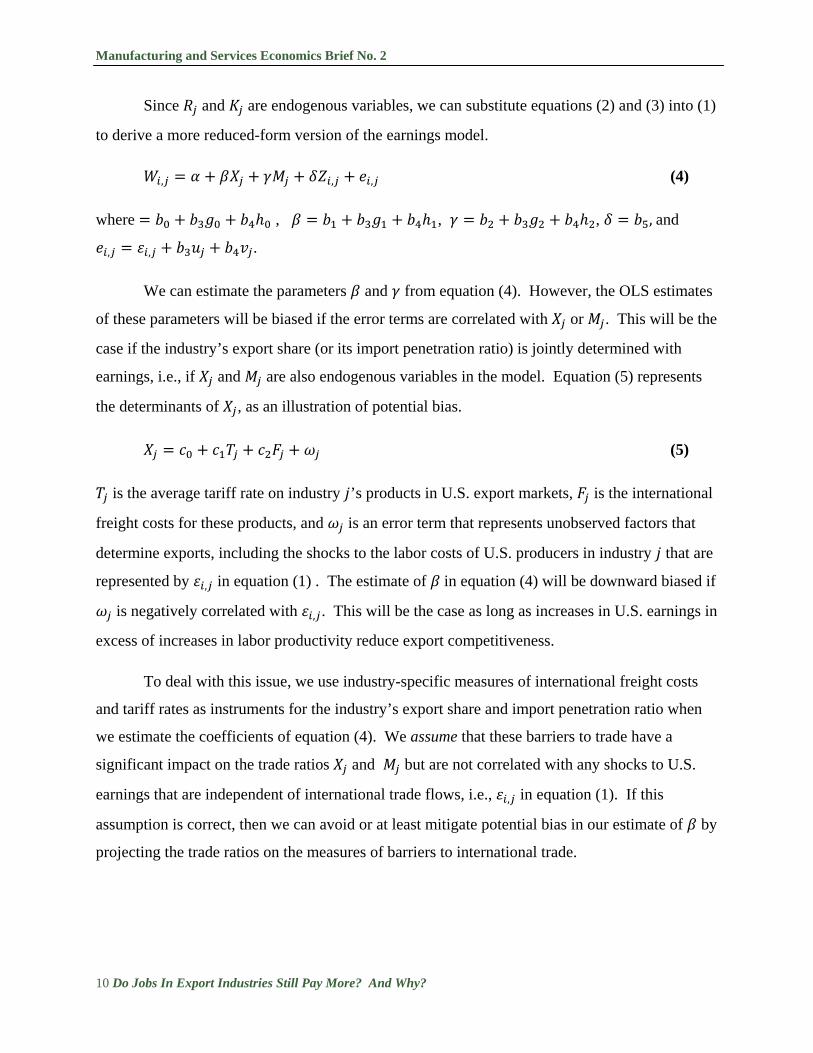
Since and are endogenous variables, we can substitute equations (2) and (3) into (1)
to derive a more reduced-form version of the earnings model.
, , , (4)
where , , , , and
, , .
We can estimate the parameters and from equation (4). However, the OLS estimates
of these parameters will be biased if the error terms are correlated with or . This will be the
case if the industry’s export share (or its import penetration ratio) is jointly determined with
earnings, i.e., if and are also endogenous variables in the model. Equation (5) represents
the determinants of , as an illustration of potential bias.
(5)
is the average tariff rate on industry ’s products in U.S. export markets, is the international
freight costs for these products, and is an error term that represents unobserved factors that
determine exports, including the shocks to the labor costs of U.S. producers in industry that are
represented by , in equation (1) . The estimate of in equation (4) will be downward biased if
is negatively correlated with , . This will be the case as long as increases in U.S. earnings in
excess of increases in labor productivity reduce export competitiveness.
To deal with this issue, we use industry-specific measures of international freight costs
and tariff rates as instruments for the industry’s export share and import penetration ratio when
we estimate the coefficients of equation (4). We assume that these barriers to trade have a
significant impact on the trade ratios and but are not correlated with any shocks to U.S.
earnings that are independent of international trade flows, i.e., , in equation (1). If this
assumption is correct, then we can avoid or at least mitigate potential bias in our estimate of by
projecting the trade ratios on the measures of barriers to international trade.

International Trade Administration
Do Jobs In Export Industries Still Pay More? And Why? 11
Estimation Using Instrumental Variables
We estimated the coefficients in equation (4) using the instrumental variables that we
described above. We estimate separate models for blue collar workers (Appendix Table 1) and
for white collar workers (Appendix Table 2). Our estimates of can be interpreted as the long-
run impact of exports on earnings assuming that complementary investments in capital and R&D
respond to exports as in equations (2) and (3).
We also estimated versions of equations (2) and (3) using the same instruments for the
export share and import penetration ratio. We expect that the R&D ratio is increasing in the
export ratio and decreasing in the import penetration ratio. Likewise, we expect that the capital
ratio is increasing in the export ratio and decreasing in the import penetration ratio. We find that
the instrumental variables estimates of and coefficients have the expected signs and are
statistically significant.
Calculation of the Export Earnings Premium
Tables 2 and 3 report the export earnings premium for each of the industries and
occupation categories. We use each industry’s export share and the corresponding estimated
coefficient on export share from Appendix Tables 1 and 2 to calculate what the industry average
earnings would have been but for the exports. This is the export portion of the earnings reported
in the Tables 2 and 3. The non-export portion is the difference between current earnings and the
export portion of earnings. The export earnings premium is the ratio of the export portion to the
non-export portions.
Estimation of the Impact of Foreign Tariffs on Export Shares
We also use the econometric model to calculate the impact of foreign tariffs on earnings.
First, we estimated the coefficients in equation (5), which relates the export share to the average
foreign tariff rates. Appendix Table 3 reports the coefficient estimates based on a cross-section

Manufacturing and Services Economics Brief No. 2
12 Do Jobs In Export Industries Still Pay More? And Why?
of the 21 three-digit NAICS manufacturing industries. Second, we multiplied each industry’s
average foreign tariff rate by the estimate of the parameter to calculate the impact of the
foreign tariffs on export shares in each industry. Appendix Table 4 reports these calculations.
Finally, we multiplied the impact on the export share by the instrumental variable estimates of
in Appendix Tables 1 and 2 to calculate the impact of the foreign tariffs on earnings. Table 4
reports these calculations.
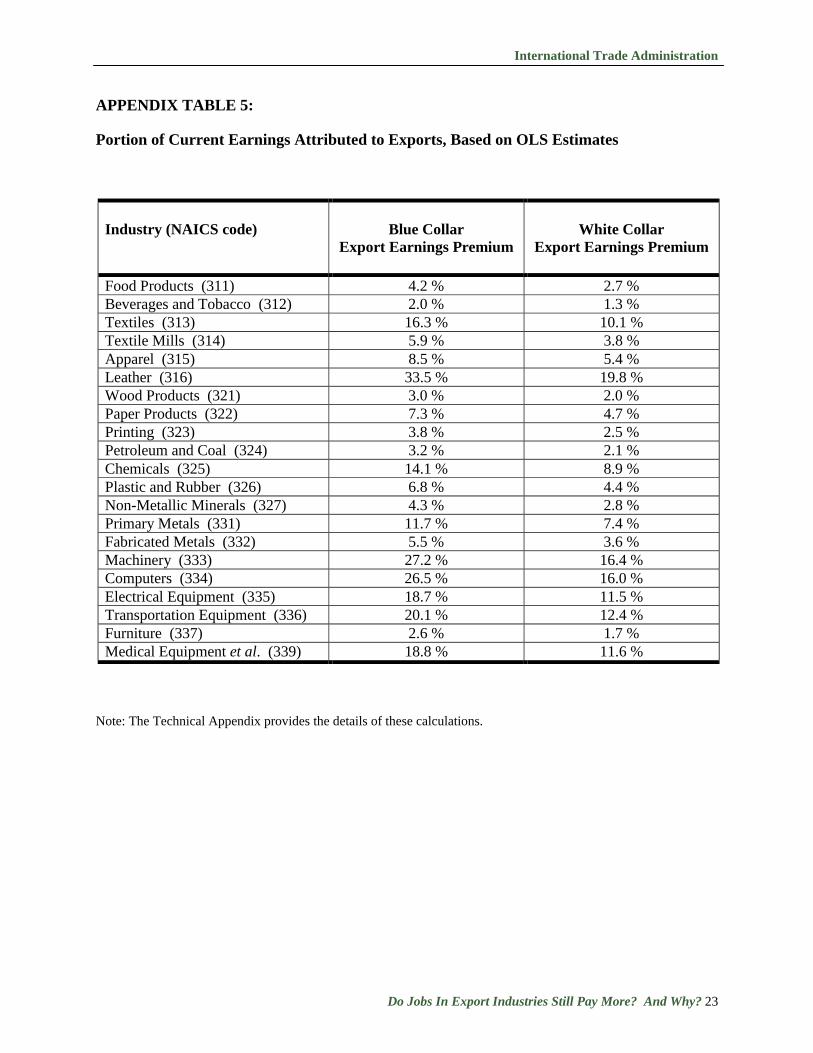
Estimation Using Ordinary Least Squares
The instrumental variables estimation relies on a set of technical assumptions about the
stochastic properties of the instrumental variables. Ordinary least squares (OLS) is an
alternative estimation technique that is appropriate under a different set of technical assumptions.
In order to evaluate the sensitivity of our estimates to our assumptions about the instrumental
variables, we also calculate the export earnings premium based on an OLS estimate of the
coefficient on export share (Appendix Tables 1 and 2). These OLS estimates, which are
probably downward-biased, indicate that exports increased earnings by 12% on average across
the U.S. manufacturing industries and the two occupation categories (Appendix Table 5).
OLS Estimation of a Partial Impact of Exporting on Earnings
We also estimate a partial impact of exporting on earnings, taking as given the
industries’ technology intensity and capital intensity. This partial impact does not include any
positive contribution to earnings from the impact of exporting on the industry’s technology
intensity and capital intensity. It only includes the impact of exporting on earnings conditional
on the industry’s technology intensity and capital intensity. To estimate the partial impacts, we
make the following alternative assumptions about the stochastic variables in the model: we
assume that the R&D ratio, the capital ratio, the export share, and the import penetration ratio are

International Trade Administration
Do Jobs In Export Industries Still Pay More? And Why? 13
all not correlated with , . Under these assumptions, we can estimate the model parameters in
equation (1) using OLS.10
Arguably, the partial impact calculation is less appropriate than the full impact as a
measure of the long-run effects of exporting. We expect that the partial impact will be
substantially smaller than the full impact, since . We find that the coefficients from the
partial impact model are smaller (Appendix Table 6). According to this partial impact model,
exports increased earnings by 7% on average across the U.S. manufacturing industries and the
two occupation categories (Appendix Table 7).
Technical Comparison to Studies with Alternative Methodologies
Bernard and Jensen (1999) and Bernard et al. (2007) use plant-level Census data to
estimate an export wage premium. Their models include industry fixed effects, and they do not
use instrumental variables. Bernard et al. (2007) report two alternative estimates of the export
wage premium in 2002. First they estimate an export wage premium by comparing across plants
in all manufacturing industries (i.e., without controlling for industry fixed effects), and they find
that wages in exporting plants were on average 17% higher than wages in non-exporting plants.
Then they estimate an export wage premium by comparing across plants within the same four-
digit industry (i.e., controlling for industry fixed effects), and they find that wages in exporting
plants were on average 6% higher.11
Equation (6) represents the OLS model in Bernard et al. (2007).12
10 While it would be preferable to estimate these model parameters using an instrumental variables estimator, this would require additional instruments that are correlated with the R&D ratios and the capital ratios, are not correlated with , , and are independent of the trade barrier instruments. Currently, we do not have instrumental variables that fit these requirements. 11 Bernard and Jensen (1999) also estimate the average change in wages within plants after they switch from non-exporting to exporting. These additional results provide only mixed evidence of an export wage premium. 12 Specifically, it is the model reported in column (2) in Table 3 of Bernard et al. (1999).

Manufacturing and Services Economics Brief No. 2
14 Do Jobs In Export Industries Still Pay More? And Why?
, · , 0 , (6)
, is the log of average wages in industry in plant . The parameter is the industry fixed
effect, , is the plant’s exports, and , is a random error term. If the error term , is
correlated with , , then the OLS estimate of will be biased.13 In principle, including
industry fixed effects in the model specification could mitigate the bias, but it could also magnify
it. , and , probably have both industry-wide and plant-specific components. The
industry fixed effects partial-out the industry-wide components. If most of the bias comes from
correlation of the plant-specific components, then the industry fixed effects would magnify the
bias. An alternative way to address potential bias is to instrument for exports using variables that
are unlikely to affect U.S. manufacturing earnings except through trade flows; however, it would
be difficult to find appropriate plant-level instruments to incorporate in the Bernard and Jensen
framework. The instrumental variables in our study are industry-level barriers to international
trade. The version of the Bernard and Jensen model that includes industry fixed effects is a
within-industry estimator, and therefore it cannot utilize this inter-industry variation to estimate
the relationship between exports and earnings.
Ebenstein et al. (2009) is a recent study that utilizes CPS data for the period 1982 to
2002.14 Their study estimates the impact of international trade and outsourcing on earnings and
employment. The authors treat the industry-level export share, import penetration ratio, R&D
ratio, and capital ratio as exogenous explanatory variables and they estimate the impact of these
factors on earnings using OLS. As we discussed above, this could result in biases in the
estimates, and it is for this reason that we use instrumental variables to estimate our model
parameters. Ebenstein et al (2009) find mixed evidence of a positive impact of the export share
on earnings.
13 To the extent that the error term is increasing in firm productivity, which increases the likelihood of exporting, the OLS estimate of will be upward-biased. To the extent that the error term reflects factors that increase earnings more than they increase labor productivity (and therefore reduce labor cost competitiveness and the likelihood of exporting), the OLS estimate of will be downward-biased. 14 In addition, Schank et al. (2007) and Munch et al. (2008) examined data that links individual workers with specific firms and trade flows, but their samples do not include U.S. manufacturing workers.

International Trade Administration
Do Jobs In Export Industries Still Pay More? And Why? 15
TABLE 1:
Domestic Production-Related Industry Characteristics
Notes: The R&D ratio relates the industry’s dollar value of private R&D expenditures to its total value of shipments in 2007. The capital ratio relates the industry’s value of private fixed assets (in thousands of dollars) to industry employment.
Industry (NAICS code)
Export Share
R&D Ratio
Capital Ratio
Share of College
Graduates
Leather (316) 41.3% 0.8% 210.8 20.1% Machinery (333) 35.2% 2.8% 158.0 22.6% Computers (334) 34.5% 12.6% 233.1 48.9% Transportation Equipment (336) 27.5% 4.2% 135.9 28.6% Medical Equipment et al. (339) 26.1% 4.3% 91.0 27.2% Electrical Equipment (335) 25.9% 2.0% 125.5 25.2% Textiles (313) 23.0% 0.8% 256.3 17.0% Chemicals (325) 20.4% 7.7% 322.9 43.8% Primary Metals (331) 17.3% 0.4% 297.5 14.6% Apparel (315) 12.9% 0.8% 68.7 14.6% Paper Products (322) 11.2% 0.9% 240.5 17.7% Plastic and Rubber (326) 10.5% 1.0% 109.9 13.8% Textile Mills (314) 9.2% 0.8% 276.0 10.2% Fabricated Metals (332) 8.6% 0.5% 84.8 13.5% Non-Metallic Minerals (327) 6.7% 0.4% 144.4 13.8% Food Products (311) 6.6% 0.5% 125.9 12.6% Printing (323) 6.1% 0.9% 87.8 17.7% Petroleum and Coal (324) 5.1% 0.3% 1212.2 30.1% Wood Products (321) 4.9% 0.4% 79.4 8.3% Furniture (337) 4.1% 0.4% 41.0 9.6% Beverages and Tobacco (312) 3.3% 0.4% 204.9 28.5%
Manufacturing and Services Economics Brief No. 2
16 Do Jobs In Export Industries Still Pay More? And Why?
TABLE 2:
Portion of Current Earnings Attributed to Export Share, Blue Collar Workers by Industry
Note: The Technical Appendix provides the details of these calculations.
Industry (NAICS code)
Blue Collar
Average Weekly Earnings
Non-Export Portion
Blue Collar
Average Weekly Earnings
Export Portion
Export
Earnings Premium
Food Products (311) $557 $31 5.7% Beverages and Tobacco (312) $747 $20 2.7% Textiles (313) $467 $107 22.9% Textile Mills (314) $515 $41 8.0% Apparel (315) $420 $49 11.6% Leather (316) $365 $183 50.3% Wood Products (321) $607 $25 4.1% Paper Products (322) $725 $72 10.0% Printing (323) $660 $34 5.2% Petroleum and Coal (324) $909 $39 4.3% Chemicals (325) $738 $146 19.8% Plastic and Rubber (326) $608 $57 9.3% Non-Metallic Minerals (327) $677 $39 5.8% Primary Metals (331) $669 $109 16.3% Fabricated Metals (332) $670 $50 7.5% Machinery (333) $542 $216 39.9% Computers (334) $572 $222 38.8% Electrical Equipment (335) $557 $148 26.6% Transportation Equipment (336) $635 $182 28.7% Furniture (337) $588 $20 3.4% Medical Equipment et al. (339) $515 $138 26.8%

International Trade Administration
Do Jobs In Export Industries Still Pay More? And Why? 17
TABLE 3:
Portion of Current Earnings Attributed to Export Share, White Collar Workers by Industry
Note: The Technical Appendix provides the details of these calculations.
Industry (NAICS code)
White Collar
Average Weekly Earnings
Non-Export Portion
White Collar
Average Weekly Earnings
Export Portion
Export
Earnings Premium
Food Products (311) $1,216 $57 4.7% Beverages and Tobacco (312) $1,387 $32 2.3% Textiles (313) $1,036 $193 18.6% Textile Mills (314) $999 $66 6.7% Apparel (315) $1,070 $103 9.6% Leather (316) $878 $344 39.1% Wood Products (321) $1,075 $37 3.4% Paper Products (322) $1,302 $107 8.2% Printing (323) $1,034 $45 4.3% Petroleum and Coal (324) $1,482 $53 3.6% Chemicals (325) $1,280 $206 16.1% Plastic and Rubber (326) $1,226 $95 7.7% Non-Metallic Minerals (327) $1,296 $62 4.8% Primary Metals (331) $1,156 $154 13.3% Fabricated Metals (332) $1,218 $76 6.2% Machinery (333) $1,022 $322 31.5% Computers (334) $1,199 $368 30.7% Electrical Equipment (335) $1,092 $234 21.4% Transportation Equipment (336) $1,202 $277 23.1% Furniture (337) $1,081 $31 2.9% Medical Equipment et al. (339) $1,101 $238 21.6%

Manufacturing and Services Economics Brief No. 2
18 Do Jobs In Export Industries Still Pay More? And Why?
TABLE 4:
Impact of Foreign Tariffs on Earnings by Manufacturing Industry
Industry (NAICS code)
Blue Collar Workers
White Collar Workers
Food Products (311) -8% -7% Beverages and Tobacco (312) -12% -10% Textiles (313) -4% -3% Textile Mills (314) -4% -3% Apparel (315) -7% -6% Leather (316) -4% -4% Wood Products (321) -1% -1% Paper Products (322) -1% -1% Printing (323) -1% -1% Petroleum and Coal (324) -7% -6% Chemicals (325) -3% -2% Plastic and Rubber (326) -3% -2% Non-Metallic Minerals (327) -2% -2% Primary Metals (331) -2% -2% Fabricated Metals (332) -2% -2% Machinery (333) -2% -1% Computers (334) -2% -2% Electrical Equipment (335) -2% -2% Transportation Equipment (336) -3% -2% Furniture (337) -1% -1% Medical Equipment et al. (339) -3% -2%

International Trade Administration
Do Jobs In Export Industries Still Pay More? And Why? 19
APPENDIX TABLE 1:
Econometric Model of Blue Collar Workers
Dependent Variable: Log of Usual Weekly Earnings for Blue Collar Workers
Notes: We report (in parentheses) standard errors that are corrected for potential industry-level clustering of the errors. The sample includes 43,113 individual CPS respondents.
Explanatory Variables
Ordinary Least
Squares Estimates
Instrumental
Variables Estimates
Export Share 0.60752 (0.1157)
0.81058 (0.1790)
Import Share -0.28326 (0.1048)
-0.37408 (0.1125)
Highest Education: High School Diploma 0.27723 (0.0106)
0.27232 (0.0109)
Highest Education: Associate Degree 0.37981 (0.0149)
0.37272 (0.0140)
Highest Education: Bachelor Degree 0.55658 (0.0320)
0.54970 (0.0297)
Highest Education: Post-Graduate Degree 0.69394 (0.0447)
0.68743 (0.0423)
Experience: Age 0.06406 (0.0023)
0.06399 (0.0023)
Experience: Age Squared -0.00067 (0.0000)
-0.00067 (0.0000)
Sales and Office Support Occupations 0.12254 (0.0188)
0.12107 (0.0186)
Union Status 0.17977 (0.0162)
0.17745 (0.0155)
Gender: Male 0.29751 (0.0124)
0.29510 (0.0127)
Race: White 0.11106 (0.0086)
0.11165 (0.0085)
Lives in Metropolitan Area 0.05501 (0.0081)
0.05428 (0.0088)
State Fixed Effects
Included
Included

Manufacturing and Services Economics Brief No. 2
20 Do Jobs In Export Industries Still Pay More? And Why?
APPENDIX TABLE 2:
Econometric Model of White Collar Workers
Dependent Variable: Log of Usual Weekly Earnings for White Collar Workers
Notes: We report (in parentheses) standard errors that are corrected for potential industry-level clustering of the errors. The sample includes 16,662 individual CPS respondents.
Explanatory Variables
Ordinary Least
Squares Estimates
Instrumental
Variables Estimates
Export Share 0.39996 (0.1779)
0.68090 (0.2958)
Import Share -0.15123 (0.0992)
-0.38287 (0.2438)
Highest Education: High School Diploma 0.40608 (0.0745)
0.40768 (0.0727)
Highest Education: Associate Degree 0.45982 (0.0722)
0.46108 (0.0708)
Highest Education: Bachelor Degree 0.76958 (0.0652)
0.76986 (0.0639)
Highest Education: Post-Graduate Degree 0.92096 (0.0628)
0.91969 (0.0617)
Experience: Age 0.07833 (0.0025)
0.07819 (0.0024)
Experience: Age Squared -0.00078 (0.0000)
-0.00078 (0.0000)
Union Status -0.04952 (0.0135)
-0.05451 (0.0164)
Gender: Male 0.23983 (0.0142)
0.23735 (0.0133)
Race: White 0.10071 (0.0121)
0.09856 (0.0129)
Lives in Metropolitan Area 0.10864 (0.0137)
0.10993 (0.0140)
State Fixed Effects
Included
Included

International Trade Administration
Do Jobs In Export Industries Still Pay More? And Why? 21
APPENDIX TABLE 3: Industry-Level Model of Export Shares
Notes: We report the standard errors in parentheses. The R2 statistic for the regression is 0.4145.
Dependent Variable
Export Share for Each Industry
Explanatory Factors
International Freight Costs
-2.55226 (0.7750)
Average Tariff in Major U.S. Export Markets
-0.00687 (0.0041)
Constant
0.33873 (0.0540)

Manufacturing and Services Economics Brief No. 2
22 Do Jobs In Export Industries Still Pay More? And Why?
APPENDIX TABLE 4:
Impact of Foreign Tariffs on Export Shares by Manufacturing Industry
Note: The Technical Appendix provides the details of these calculations.
Industry (NAICS code)
Reduction in Export Share Points
Attributable to Foreign Tariffs
Food Products (311) 10 Beverages and Tobacco (312) 15 Textiles (313) 5 Textile Mills (314) 5 Apparel (315) 8 Leather (316) 5 Wood Products (321) 1 Paper Products (322) 1 Printing (323) 1 Petroleum and Coal (324) 9 Chemicals (325) 3 Plastic and Rubber (326) 3 Non-Metallic Minerals (327) 2 Primary Metals (331) 2 Fabricated Metals (332) 2 Machinery (333) 2 Computers (334) 3 Electrical Equipment (335) 3 Transportation Equipment (336) 4 Furniture (337) 1 Medical Equipment et al. (339) 3
International Trade Administration
Do Jobs In Export Industries Still Pay More? And Why? 23
APPENDIX TABLE 5:
Portion of Current Earnings Attributed to Exports, Based on OLS Estimates
Note: The Technical Appendix provides the details of these calculations.
Industry (NAICS code)
Blue Collar
Export Earnings Premium
White Collar
Export Earnings Premium
Food Products (311) 4.2 % 2.7 % Beverages and Tobacco (312) 2.0 % 1.3 % Textiles (313) 16.3 % 10.1 % Textile Mills (314) 5.9 % 3.8 % Apparel (315) 8.5 % 5.4 % Leather (316) 33.5 % 19.8 % Wood Products (321) 3.0 % 2.0 % Paper Products (322) 7.3 % 4.7 % Printing (323) 3.8 % 2.5 % Petroleum and Coal (324) 3.2 % 2.1 % Chemicals (325) 14.1 % 8.9 % Plastic and Rubber (326) 6.8 % 4.4 % Non-Metallic Minerals (327) 4.3 % 2.8 % Primary Metals (331) 11.7 % 7.4 % Fabricated Metals (332) 5.5 % 3.6 % Machinery (333) 27.2 % 16.4 % Computers (334) 26.5 % 16.0 % Electrical Equipment (335) 18.7 % 11.5 % Transportation Equipment (336) 20.1 % 12.4 % Furniture (337) 2.6 % 1.7 % Medical Equipment et al. (339) 18.8 % 11.6 %

Manufacturing and Services Economics Brief No. 2
24 Do Jobs In Export Industries Still Pay More? And Why?
APPENDIX TABLE 6:
Model of Impacts Conditional on R&D Intensity and Capital Intensity
Dependent Variable: Log of Weekly Earnings for Workers in Each Occupational Category
Notes: The robust standard errors are corrected for potential industry-level clustering of the errors. The sample size is 43,113 for blue collar workers and 16,662 for white collar workers.
Explanatory Variables
Blue Collar OLS Estimates
White Collar OLS Estimates
Export Share 0.41452 (0.1130)
0.20388 (0.1308)
Import Share -0.26539 (0.0883)
-0.17258 (0.0667)
R&D Intensity
0.77850 (0.2481)
0.85270 (0.2016)
Capital Intensity
0.23338 (0.0479)
0.13764 (0.0376)
Highest Education: High School Diploma 0.27333 (0.0107)
0.40170 (0.0736)
Highest Education: Associate Degree 0.37167 (0.0147)
0.45541 (0.0707)
Highest Education: Bachelor Degree 0.54381 (0.0281)
0.76101 (0.0653)
Highest Education: Post-Graduate Degree 0.67689 (0.0405)
0.90700 (0.0635)
Experience: Age 0.06372 (0.0023)
0.07762 (0.0025)
Experience: Age Squared -0.00066 (0.0000)
-0.00077 (0.0000)
Sales and Office Support Occupations 0.11960 (0.0189)
Union Status 0.17915 (0.0175)
-0.04552 (0.01218)
Gender: Male 0.29862 (0.0118)
0.24223 (0.0134)
Race: White 0.11361 (0.0086)
0.10823 (0.0120)
Lives in Metropolitan Area 0.05020 (0.0077)
0.10416 (0.0145)
State Fixed Effects
Included
Included

International Trade Administration
Do Jobs In Export Industries Still Pay More? And Why? 25
APPENDIX TABLE 7:
OLS Estimates of the Partial Impact of Exports on Earnings, Taking as Given the Industry’s R&D and Capital Intensity
Note: The Technical Appendix provides the details of these calculations.
Industry (NAICS code)
Blue Collar
Export Earnings Premium
White Collar
Export Earnings Premium
Food Products (311) 2.8 % 1.4 % Beverages and Tobacco (312) 1.4 % 0.7 % Textiles (313) 10.5 % 4.9 % Textile Mills (314) 3.9 % 1.9 % Apparel (315) 5.6 % 2.7 % Leather (316) 20.7 % 9.2 % Wood Products (321) 2.1 % 1.0 % Paper Products (322) 4.9 % 2.3 % Printing (323) 2.6 % 1.3 % Petroleum and Coal (324) 2.2 % 1.0 % Chemicals (325) 9.2 % 4.3 % Plastic and Rubber (326) 4.6 % 2.2 % Non-Metallic Minerals (327) 2.9 % 1.4 % Primary Metals (331) 7.7 % 3.7 % Fabricated Metals (332) 3.7 % 1.8 % Machinery (333) 17.1 % 7.7 % Computers (334) 16.7 % 7.6 % Electrical Equipment (335) 12.0 % 5.6 % Transportation Equipment (336) 12.9 % 5.9 % Furniture (337) 1.7 % 0.8 % Medical Equipment et al. (339) 12.1 % 5.6 %

About the Office of Competition and Economic Analysis
The Office of Competition and Economic Analysis (OCEA), a part of the International Trade Administration’s Manufacturing and Services unit, provides industry and policy decision makers with information on the impacts of economic and regulatory policies on U.S. manufacturing and services industries. Its staff of specialists perform in-depth industry analysis on the effects of both domestic and foreign policy developments on U.S. business competitiveness. For more information, or to access other OCEA reports, visit www.trade.gov/mas/ian, or contact the office at (202) 482-5145.
The International Trade Administration's mission is to create prosperity by strengthening the competitiveness of U.S. industry, promoting trade and investment, and ensuring fair trade and compliance with trade laws and agreements.