Do International Migration and Remittances Reduce...
25
Do International Migration and Remittances Reduce Poverty in Developing Countries? RICHARD H. ADAMS JR. and JOHN PAGE * World Bank, Washington, DC, USA Summary. — Few studies have examined the impact of international migration and remittances on poverty in the developing world. This paper fills this lacuna by constructing and analyzing a new data set on international migration, remittances, inequality, and poverty from 71 developing coun- tries. The results show that both international migration and remittances significantly reduce the level, depth, and severity of poverty in the developing world. After instrumenting for the possible endogeneity of international migration, and controlling for various factors, results suggest that, on average, a 10% increase in the share of international migrants in a country’s population will lead to a 2.1% decline in the share of people living on less than $1.00 per person per day. After instrumen- ting for the possible endogeneity of international remittances, a similar 10% increase in per capita official international remittances will lead to a 3.5% decline in the share of people living in poverty. Ó 2005 Elsevier Ltd. All rights reserved. Key words — international migration, remittances, poverty 1. INTRODUCTION International migration is one of the most important factors affecting economic relations between developed and developing countries in the 21st century. At the start of the century, it was estimated that about 175 million peo- ple—roughly 3% of the world population— lived and worked outside the country of their birth (United Nations, 2002). The international remittances sent back home by these migrant workers have a profound impact on the devel- oping countries of Asia, Africa, Latin America, and the Middle East. According to Global Development Finance (World Bank, 2004), offi- cial international remittances sent home by migrant workers represent the second most important source of external funding in devel- oping countries. 1 Official international remit- tances now total $93 billion per year (Ratha, 2004) and are about twice as large as the level of official aid-related inflows to developing countries. 2 Despite the ever-increasing size of official international remittances, very little attention has been paid to analyzing the poverty impact of these financial transfers on developing coun- tries. While a small handful of studies have examined the impact of international remit- tances on poverty in specific village or country settings, 3 we are not aware of any studies which examine the impact of international rem- sittances on poverty in a broad range of devel- oping countries. Two factors seem to be responsible: The first is a lack of poverty data; it is quite difficult to estimate accurate and meaningful poverty headcounts in a broad and diverse range of developing countries. The second factor relates to the nature of data on international migration and remittances. Not only do few developing countries publish records on migration flows, but also many developed countries which do keep records on migration tend to undercount the large number of illegal migrants living with- in their borders. At the same time, the available data on international remittances do not * Work on this paper was funded by a World Bank Small Research Grant (2003–04). For helpful comments on earlier drafts, we would like to thank Francois Bourguignon, Maurice Schiff, and four anonymous re- viewers. We would also like to thank Kalpana Mehra for fine research assistance. Final revision accepted: May 6, 2005. World Development Vol. 33, No. 10, pp. 1645–1669, 2005 Ó 2005 Elsevier Ltd. All rights reserved Printed in Great Britain 0305-750X/$ - see front matter doi:10.1016/j.worlddev.2005.05.004 www.elsevier.com/locate/worlddev 1645
Transcript of Do International Migration and Remittances Reduce...

World Development Vol. 33, No. 10, pp. 1645–1669, 2005� 2005 Elsevier Ltd. All rights reserved
Printed in Great Britain
0305-750X/$ - see front matterdoi:10.1016/j.worlddev.2005.05.004www.elsevier.com/locate/worlddev
Do International Migration and Remittances Reduce
Poverty in Developing Countries?
RICHARD H. ADAMS JR. and JOHN PAGE *
World Bank, Washington, DC, USA
Summary. — Few studies have examined the impact of international migration and remittances onpoverty in the developing world. This paper fills this lacuna by constructing and analyzing a newdata set on international migration, remittances, inequality, and poverty from 71 developing coun-tries. The results show that both international migration and remittances significantly reduce thelevel, depth, and severity of poverty in the developing world. After instrumenting for the possibleendogeneity of international migration, and controlling for various factors, results suggest that, onaverage, a 10% increase in the share of international migrants in a country’s population will lead toa 2.1% decline in the share of people living on less than $1.00 per person per day. After instrumen-ting for the possible endogeneity of international remittances, a similar 10% increase in per capitaofficial international remittances will lead to a 3.5% decline in the share of people living in poverty.
� 2005 Elsevier Ltd. All rights reserved.Key words — international migration, remittances, poverty
* Work on this paper was funded by a World Bank
Small Research Grant (2003–04). For helpful comments
on earlier drafts, we would like to thank Francois
Bourguignon, Maurice Schiff, and four anonymous re-
viewers. We would also like to thank Kalpana Mehra for
fine research assistance. Final revision accepted: May 6,2005.
1. INTRODUCTION
International migration is one of the mostimportant factors affecting economic relationsbetween developed and developing countriesin the 21st century. At the start of the century,it was estimated that about 175 million peo-ple—roughly 3% of the world population—lived and worked outside the country of theirbirth (United Nations, 2002). The internationalremittances sent back home by these migrantworkers have a profound impact on the devel-oping countries of Asia, Africa, Latin America,and the Middle East. According to GlobalDevelopment Finance (World Bank, 2004), offi-cial international remittances sent home bymigrant workers represent the second mostimportant source of external funding in devel-oping countries. 1 Official international remit-tances now total $93 billion per year (Ratha,2004) and are about twice as large as the levelof official aid-related inflows to developingcountries. 2
Despite the ever-increasing size of officialinternational remittances, very little attentionhas been paid to analyzing the poverty impactof these financial transfers on developing coun-tries. While a small handful of studies have
164
examined the impact of international remit-tances on poverty in specific village or countrysettings, 3 we are not aware of any studieswhich examine the impact of international rem-sittances on poverty in a broad range of devel-oping countries.Two factors seem to be responsible: The first
is a lack of poverty data; it is quite difficult toestimate accurate and meaningful povertyheadcounts in a broad and diverse range ofdeveloping countries. The second factor relatesto the nature of data on international migrationand remittances. Not only do few developingcountries publish records on migration flows,but also many developed countries which dokeep records on migration tend to undercountthe large number of illegal migrants living with-in their borders. At the same time, the availabledata on international remittances do not
5

1646 WORLD DEVELOPMENT
include the large (and unknown) sum of remit-tance monies which are transmitted throughinformal, unofficial channels. As a result ofthese data problems, many key questions re-main unanswered. Exactly what is the effect ofinternational migration on poverty in the devel-oping world? How do the official remittancessent home by international migrants affect thelevel, depth, and severity of poverty in thedeveloping world?This paper proposes to answer these, and sim-
ilar, questions using a new data set composed of71 developing countries. This data set includesall those low- and middle-income developingcountries for which reasonable information onpoverty, inequality, international migration,and remittances could be assembled. It includescountries drawn from each major region of thedeveloping world: Latin America and the Carib-bean, Middle East and North Africa, Europeand Central Asia, East Asia, South Asia, andSub-Saharan Africa.The balance of this paper is organized as fol-
lows. Section 2 sets the stage by reviewing thefindings of recent village- or country-level stud-ies on the relationship between internationalmigration, remittances, inequality, and poverty.Section 3 presents the new data set and de-scribes how these data are used to calculatethe relevant migration, remittances, and pov-erty variables. Section 4 uses the new data toeconometrically estimate the impact of twovariables—international migration and remit-tances—on poverty in the developing world.This part finds that both international migra-tion and remittances reduce the level, depth,and severity of poverty in the developing world.However, it is possible that these variables maybe endogenous to poverty: that is, internationalmigration and remittances may reduce povertyin the developing world, but poverty in thedeveloping world may also affect the numberof international migrants being produced andthe level of remittances being received. For thisreason, Section 5 employs an instrumental vari-ables strategy to isolate the overall effect ofthese two variables on poverty. The maininstruments employed in this section are dis-tance between remittance-sending and -receiv-ing countries, level of education, andgovernment stability. Using these three vari-ables as instruments, the paper finds thatinstrumented international migration andremittances still reduce the level, depth, andseverity of poverty in developing countries.The final section of the paper, Section 6, sum-
marizes the findings and presents policy impli-cations.
2. RECENT STUDIES ONINTERNATIONAL MIGRATION,REMITTANCES, AND POVERTY
There is little agreement and scant informa-tion in the literature concerning the impact ofinternational migration and remittances onpoverty. Stahl, for example, writes that ‘‘migra-tion, particularly international migration, canbe an expensive venture. Clearly, it is going tobe the better-off households which will be morecapable of (producing international migrants)(1982, p. 883).’’ Similarly, Lipton, in a studyof 40 villages in India that focuses more oninternal than international migration, foundthat ‘‘migration increases intra-rural inequali-ties . . . because better-off migrants are �pulled’toward fairly firm prospects of a job (in a cityor abroad), whereas the poor are �pushed’ byrural poverty and labor-replacing methods(1980, p. 227).’’Other analysts, however, suggest that the
poor can and do benefit from internationalmigration and remittances. For example, Starkand Taylor find that in rural Mexico ‘‘relativelydeprived’’ households are more likely to engagein international migration than are ‘‘better-off’’households (1989, pp. 12–14). In a similar vein,Adams finds that in rural Egypt, the number ofpoor households declines by 9.8% when house-hold income includes international remittances,and that remittances account for 14.7% of totalincome of poor households (1991, pp. 73–74).While the findings of these past studies are
instructive, their conclusions are of limited use-fulness due to a small sample size. For instance,the findings of Stark and Taylor are based on61 households from two Mexican villages whilethose of Adams are based on 1,000 householdsfrom three Egyptian villages. Clearly, there is aneed to extend the scope of these studies to seeif their findings hold for a larger and broadercollection of developing countries.
3. NEW DATA ON INTERNATIONALMIGRATION, REMITTANCES,INEQUALITY, AND POVERTY
Our evaluation of the impact of internationalmigration and remittances on poverty in devel-oping countries is based on a new data set that

INTERNATIONAL MIGRATION AND REMITTANCES 1647
includes information on international migra-tion, remittances, inequality, and poverty for71 ‘‘low-income and middle-income’’ develop-ing countries. 4 These countries were selectedbecause it was possible to find relevant migra-tion, remittances, inequality, and poverty datafor all of these countries since the year 1980. 5
Since it was not easy to assemble this dataset, and data problems still plague this (andall other) studies on international migrationand remittances, it is useful to spell out howthis information was assembled.In the case of migration, few, if any, of the
major labor-exporting countries publish accu-rate records on the number of international mi-grants that they produce. It is thereforenecessary to estimate migration stocks andflows by using data collected by the main labor-receiving countries. For the purposes of thispaper, the main labor-receiving countries (re-gions) include two: United States and theOrganization for Economic Cooperation andDevelopment (OECD) (Europe), excludingNorth America and Asia. 6 Unfortunately, nodata are available on the amount of migrationto the third and fourth most important labor-receiving regions in the world, the Arab Gulfand South Africa.Because of their importance to labor-export-
ing countries, remittance flows tend to be thebest measured aspect of the migration experi-ence. For instance, the International MonetaryFund (IMF) keeps annual records of theamount of worker remittances received by eachlabor-exporting country. 7 However, as notedabove, the IMF only reports data on officialworker remittance flows, that is, remittancemonies which are transmitted through officialbanking channels. Since a large (and unknown)proportion of remittance monies is transmittedthrough private, unrecorded channels, the levelof remittances recorded by the IMF underesti-mates the actual flow of remittance moniesreturning to labor-exporting countries.Finally, with respect to poverty, many devel-
oping countries—especially the smaller popula-tion countries—have not conducted the type ofnationally representative household budget sur-veys that are needed to estimate poverty. Forexample, of the 157 developing countries classi-fied as low- or middle-income by the WorldBank, 8 only 81 countries (52%) have publishedthe results of any household budget survey. Ofthese 81 developing countries, missing data onincome inequality reduced the size of the dataset used in this paper to 71 countries. 9
Table 9 gives the countries, regions, poverty,inequality, migration, and remittances indica-tors included in the new data set. The data setincludes a total of 184 observations; an obser-vation is any point in time for which data on in-come, poverty and inequality exist. The data setis notable in that it includes 36 observations(from 18 countries) in Sub-Saharan Africa, aregion for which migration, remittances andpoverty data are relatively rare. It also includesobservations from countries in all other regionsof the developing world.Table 9 reports three different poverty mea-
sures: The first, the poverty headcount index,set at $1 per person per day, measures the per-cent of the population living beneath that pov-erty line at the time of the survey. 10 However,the headcount index ignores the ‘‘depth of pov-erty,’’ that is, the amount by which the averageexpenditures (income) of the poor fall short ofthe poverty line. 11 We therefore also reportthe poverty gap index, which measures in per-centage terms how far the average expenditures(income) of the poor fall short of the povertyline. For instance, a poverty gap of 10% meansthat the average poor person’s expenditures (in-come) are 90% of the poverty line. The thirdpoverty measure—the squared poverty gapindex—indicates the severity of poverty. Thesquared poverty gap index possesses useful ana-lytical properties, because it is sensitive tochanges in distribution among the poor. 12
To measure inequality, Table 9 uses the Ginicoefficient. In the table, this measure is normal-ized by household size and the distributions areweighted by household size so that a givenquintile (such as the lowest quintile) has thesame share of population as other quintilesacross the sample.The remaining variables in Table 9—interna-
tional migration as share of country populationand per capita official international remit-tances—are of key importance to this study.Since these two variables must be estimatedusing some rather heroic assumptions, it is cru-cial to discuss each variable in turn.In the absence of detailed records on interna-
tional migration in the labor-exporting coun-tries, the migration variable in this study isestimated by combining data from the twomain labor-receiving regions of the world: theUnited States and OECD (Europe). Specifi-cally, the migration variable is constructedusing three steps. The first step uses data fromthe 1990 and 2000 US Population Censuseson the ‘‘place of birth for the foreign-born

1648 WORLD DEVELOPMENT
population.’’ While these data are disaggre-gated by country of birth for about 50 differentlabor-exporting countries, it is not at all clearwhether all of these ‘‘foreign-born’’ peopleare, in fact international migrants. For exam-ple, a person born in Mexico and brought tothe United States as an infant would probablynot consider himself as a migrant. Moreover,it is also not clear how many of those who enterthe United States illegally are, in fact, includedin the ‘‘foreign-born’’ population figures. Assome observers have suggested, the US Censusdata may be grossly undercounting the actualmigrant population that is living—legally orillegally—in the United States. 13
The second step in calculating the migrationvariable is to estimate the number of ‘‘for-eign-born’’ living in the OECD (Europe),excluding North America and Asia. 14 Unfor-tunately, the OECD (Europe) data are not asdetailed as the US Census data, and differ fromthe US data in several key ways. Most basi-cally, the OECD (Europe) data use a differentway of classifying immigrants. Since US-bornchildren of immigrants have US citizenship,the United States defines an immigrant as aperson who was born abroad to non-US citi-zens. Most OECD (Europe) countries, how-ever, follow an ethnicity-based definition ofimmigration status. This method classifies aperson on the basis of the ethnicity of the par-ent, rather than on place of birth. Thus, a childof Turkish parents born in Germany is typicallyclassified as an immigrant. This different way ofclassifying immigrants has the net effect ofincreasing the stock of immigrants in any par-ticular OECD (Europe) country, and perhapsbiasing our estimates by including a numberof ‘‘migrants’’ who were actually born, raised,and educated in that OECD (Europe) country.Another key difference between the OECD(Europe) data and the US data has to do withthe number of labor-exporting countries re-corded. While the US Census data can be usedto count the number of ‘‘foreign-born’’ (or mi-grants) from about 50 different countries, theOECD (Europe) data only record the numberof ‘‘foreign-born’’ (or migrants) in each Euro-pean country coming from 10 or 15 countries.While this is not a significant problem forlarge-labor-exporting countries (like Turkey),which send many migrants to Europe, it is aproblem for smaller labor-exporting countries,such as Brazil or Sri Lanka, where the actualnumber of migrants to any particular Europeancountry might not be recorded at all.
The final step in calculating the migrationvariable is to take the sum of the ‘‘foreignborn’’ from each labor-exporting country thatare living in either the United States or theOECD (Europe), and divide this sum by thepopulation of each developing country. These‘‘migration as share of country population’’ fig-ures are the ones which appear in Table 9. In alllikelihood, these figures seriously underestimatethe actual number of international migrantsproduced by any given labor-exporting coun-try, because they do not include the large num-ber of illegal migrants working in the UnitedStates and OECD (Europe). These figures alsodo not count the unknown number of interna-tional migrants working in other labor-receiv-ing regions (like the Arab Gulf).The process of defining the remittances vari-
able in Table 9 is more straightforward, but italso involves one heroic assumption. All remit-tance data come from the IMF, Balance of Pay-ments Statistics Yearbook. As noted above, themain problem with these data is that they countonly remittance monies which enter throughofficial, banking channels; they do not includethe large (and unknown) amount of remittancemonies which are sent home through private,unofficial channels. For example, in one majorlabor-exporting country—Egypt—it has beenestimated that unofficial remittances amountto between one-third and one-half of totalremittances. 15 For this reason, it is likely thatthe ‘‘official remittance’’ figures reported inTable 9 are gross underestimates of the actuallevel of total remittances (official and unofficial)entering each labor-exporting country.
4. INTERNATIONAL MIGRATION,REMITTANCES, AND POVERTY:
OLS RESULTS
In this section, we use the crosscountry datato analyze how international migration andremittances affect poverty in the developingworld. Using the basic growth–poverty modelsuggested by Ravallion (1997) and Ravallionand Chen (1997), the relationship that we wantto estimate can be written as
log P it ¼ ai þ b1 log lit þ b2 logðgitÞþ b3 logðxitÞ þ �it
ði ¼ 1; . . . ;N ; t ¼ 1; . . . ; T iÞ; ð1Þ
where P is the measure of poverty in country iat time t, ai is a fixed effect reflecting time differ-

INTERNATIONAL MIGRATION AND REMITTANCES 1649
ences between countries, b1 is the ‘‘growth elas-ticity of poverty’’ with respect to mean per ca-pita income given by l, b2 is the elasticity ofpoverty with respect to income inequality givenby the Gini coefficient, g, b3 is the elasticity ofpoverty with respect to variable x (such asinternational migration or remittances) and �is an error term that includes errors in the pov-erty measure.Eqn. (1) represents the basic model of poverty
determination used by a host of researchers. 16
The model assumes that economic growth—asmeasured by increases in mean per capita in-come—will reduce poverty. The relationship be-tween poverty and the income variable istherefore expected to be negative and signifi-cant. The model also assumes that the level ofincome inequality affects poverty reduction.Since past work has shown that a given rate ofeconomic growth reduces poverty more inlow-inequality countries, as opposed to high-inequality countries, 17 the income inequalityvariable is expected to be positive and signifi-cant. The innovation in this study is to intro-duce into Eqn. (1) a variable measuring thelevel of international migration or remittances.Controlling for income and its distribution,we test the hypothesis that countries producingmore international migrants or receiving moreinternational remittances will have less poverty.The income variable in Eqn. (1) can be mea-
sured in two different ways: (1) per capita GDP,in purchasing power parity (PPP) units, as mea-sured from national accounts data; and (2) percapita survey mean income (expenditure), ascalculated from household budget surveys donein the various developing countries. As Deaton(2001) and others have shown, 18 these twomeasures of income typically do not agree. In-come (expenditure) as measured by householdsurveys is calculated from the responses of indi-vidual households. However, income as mea-sured by GDP data comes from the nationalaccounts, which measure household income asa residual item, so that errors and omissionelsewhere in the accounts automatically affectthe calculation of household income (expendi-ture). Since the national accounts data also in-clude many items (such as the expenditures ofnonprofit organizations and the imputed rentof owner-occupied dwellings) which are not in-cluded in the household surveys, it is little won-der that the two measures of income do notcorrespond.For the purposes of this study, we will esti-
mate Eqn. (1) using both measures of income.
It should be noted that neither measure of in-come includes international remittance income.The GDP data from national accounts shouldnot include remittance income from abroad,and our experience with household budget sur-veys suggests that most of these surveys do notadequately capture international remittance in-come because they do not include questions onremittances. 19
Other researchers have often estimated Eqn.(1) in first differences, in order to deal with pos-sible correlation problems between the vari-ables, since the dependent and independentvariables are drawn from the same single sourceof data (household budget surveys). 20 In thisstudy, however, we will estimate Eqn. (1) as alevel equation since the dependent and indepen-dent variables come from different sources ofdata: the dependent variable being drawn fromhousehold budget surveys and the independentvariables (for GDP, international migration,and international remittances) from variousother sources. 21
We will also estimate Eqn. (1) using thetwo measures of international migration andremittances developed in the last section: inter-national migration as a share of country popu-lation and per capita official internationalremittances received by a developing country.Given all of the problems involved in construct-ing these two variables, as well as the fact that anumber of the countries still have missing/incomplete migration or remittance data, it isnot surprising that these two measures are nothighly correlated in the data set (simple correla-tion of 0.579). Moreover, it is likely that a size-able share of international migrants maymigrate, but not remit. For all of these reasons,it seems useful to use each of these measures totest the robustness of our findings regarding theimpact of international migration and remit-tances on poverty in the developing world.Using the international migration data, the
OLS estimates of Eqn. (1) are presented inTables 1 (using per capita GDP) and 2 (usingsurvey mean income). To control for fixed effectsby geographic region of the world, five regionaldummy variables are added to the model. 22 Ineach table, results are shown first without, andthen with, regional dummies. Since all of thevariables are estimated in log terms, the resultscan be interpreted as elasticities of poverty withrespect to the relevant variable.In Tables 1 and 2, the coefficients for both of
the income variables—per capita GDP and sur-vey mean income—are of the expected
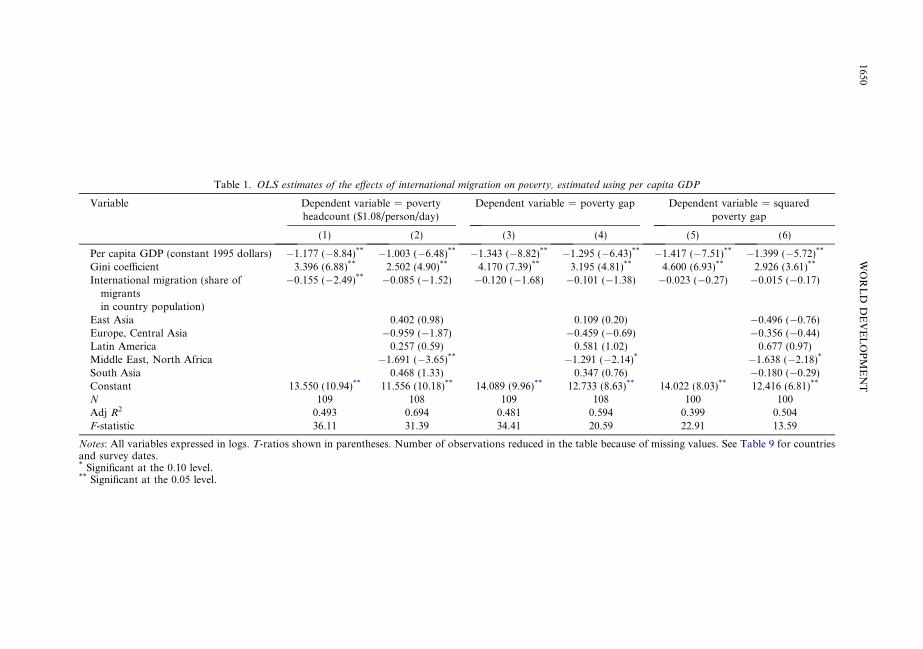
Table 1. OLS estimates of the effects of international migration on poverty, estimated using per capita GDP
Variable Dependent variable = povertyheadcount ($1.08/person/day)
Dependent variable = poverty gap Dependent variable = squaredpoverty gap
(1) (2) (3) (4) (5) (6)
Per capita GDP (constant 1995 dollars) �1.177 (�8.84)** �1.003 (�6.48)** �1.343 (�8.82)** �1.295 (�6.43)** �1.417 (�7.51)** �1.399 (�5.72)**
Gini coefficient 3.396 (6.88)** 2.502 (4.90)** 4.170 (7.39)** 3.195 (4.81)** 4.600 (6.93)** 2.926 (3.61)**
International migration (share ofmigrantsin country population)
�0.155 (�2.49)** �0.085 (�1.52) �0.120 (�1.68) �0.101 (�1.38) �0.023 (�0.27) �0.015 (�0.17)
East Asia 0.402 (0.98) 0.109 (0.20) �0.496 (�0.76)Europe, Central Asia �0.959 (�1.87) �0.459 (�0.69) �0.356 (�0.44)Latin America 0.257 (0.59) 0.581 (1.02) 0.677 (0.97)Middle East, North Africa �1.691 (�3.65)** �1.291 (�2.14)* �1.638 (�2.18)*
South Asia 0.468 (1.33) 0.347 (0.76) �0.180 (�0.29)Constant 13.550 (10.94)** 11.556 (10.18)** 14.089 (9.96)** 12.733 (8.63)** 14.022 (8.03)** 12.416 (6.81)**
N 109 108 109 108 100 100Adj R2 0.493 0.694 0.481 0.594 0.399 0.504F-statistic 36.11 31.39 34.41 20.59 22.91 13.59
Notes: All variables expressed in logs. T-ratios shown in parentheses. Number of observations reduced in the table because of missing values. See Table 9 for countriesand survey dates.* Significant at the 0.10 level.** Significant at the 0.05 level.
1650WORLD
DEVELOPMENT

Table 2. OLS estimates of the effect of international migration on poverty, estimated using survey mean income
Variable Dependent variable = povertyheadcount
Dependent variable = poverty gap Dependent variable = squared povertygap
(1) (2) (3) (4) (5) (6)
Per capita survey mean income �2.336 (�16.85)** �1.942 (�12.00)** �2.623 (�15.24)** �2.437 (�11.89)** �2.659 (�11.49)** �2.699 (�10.19)**
Gini coefficient 4.025 (12.08)** 3.060 (7.68)** 4.798 (11.60)** 3.678 (7.30)** 5.002 (9.29)** 3.675 (5.64)**
International migration (share ofmigrants in country population)
�0.188 (�4.48)** �0.136 (�3.12)** �0.153 (�2.93)** �0.143 (�2.59)* �0.048 (�0.69) �0.086 (�1.19)
East Asia �0.423 (�1.50) �0.962 (�2.69)** �1.609 (�3.53)**
Europe, Central Asia �1.046 (�2.98) �0.674 (�1.52) �0.445 (�0.78)Latin America �0.147 (�0.50) 0.037 (0.10) 0.157 (0.33)Middle East, North Africa �1.322 (�3.77)** �1.268 (�2.86)** �1.191 (�2.08)*
South Asia �0.054 (�0.20) �0.344 (0.99) 0.775 (�1.61)Constant 22.530 (19.09)** 19.214 (15.30)** 23.915 (16.32)** 21.943 (13.81)** 23.436 (11.98)** 22.960 (11.17)**
N 106 106 106 106 100 100Adj R2 0.766 0.817 0.722 0.773 0.598 0.685F-statistic 116.09 59.71 92.00 45.89 50.11 27.93
Notes: All variables expressed in logs. T-ratios shown in parentheses. Number of observations reduced in table because of missing values. See Table 9 for countries andsurvey dates.* Significant at the 0.10 level.** Significant at the 0.05 level.
INTERNATIO
NALMIG
RATIO
NAND
REMIT
TANCES
1651

1652 WORLD DEVELOPMENT
(negative) sign and statistically significant in allcases. In both tables, the poverty elasticitieswith respect to income inequality (Gini coeffi-cient) are also of the expected (positive) sign,and their magnitude is consistent with other re-cent analyses of poverty reduction (Adams,2004; Ravallion, 1997). However, the resultsfor the model as a whole are better and moreprecise in Table 2 using survey mean income:the R2 measures increase from the 0.4–0.7 rangeto 0.6–0.8. For this reason, we will focus onTable 2.When the dependent variable in Table 2 is
poverty headcount or poverty gap, the resultsfor the international migration variable arenegative and statistically significant. However,when the dependent variable is squared povertygap, the international migration variable is notsignificant. For the poverty headcount mea-sure, the estimates suggest that, on average, a10% increase in the share of international mi-grants in a country’s population will lead to a1.4% decline in the share of people living on lessthan $1.00 per person per day.Tables 3 (using per capita GDP) and 4 (using
survey mean income) show the results whenEqn. (1) is estimated using international remit-tances data. Since the results for the model arebetter and more precise in Table 4 using surveymean income, we will focus on these results.The remittance variable in Table 4—per capita
official international remittances—has a nega-tive and statistically significant impact on eachof the three poverty measures: headcount, pov-erty gap, and squared poverty gap. Estimatesfor the poverty headcount measure suggestthat, on average, a 10% increase in per capitaofficial international remittances will lead to a1.8% decline in the share of people living inpoverty. Table 4 shows that remittances willhave a slightly larger impact on poverty reduc-tion when poverty is measured by the more sen-sitive poverty measures: poverty gap andsquared poverty gap.
5. OFFICIAL INTERNATIONALREMITTANCES AND POVERTY:
IV RESULTS
As noted at the outset, one possible problemwith Eqn. (1) is that it assumes that all of theright-hand side variables in the model—includ-ing international migration and remittances—are exogenous to poverty. However, it ispossible that these two variables may be endo-
genous to poverty. Reverse causality may betaking place: international migration andremittances may be reducing poverty, but pov-erty may also be affecting the share of migrantsbeing produced and the level of internationalremittances being received. Without accountingfor this reverse causality, all of the estimatedcoefficients in Tables 1–4 may be biased.One way of accounting for possible endoge-
nous regressors is to pursue an instrumentalvariables approach. This is the strategy adoptedin this section.In our data set, there are three possible
instruments for the international migrationand remittances variables. The first instrumentis distance (miles) between the remittance-send-ing area (United States, OECD (Europe), or thePersian Gulf) and the remittance-receivingcountry. 23 This variable seems like a goodinstrument because various studies of the deter-minants of international migration have foundthat distance between labor-receiving and—exporting countries is usually negatively andsignificantly related to the level of internationalmigration. For example, in a study of migrationrates to the United States from 81 developingcountries, Hatton and Williamson (2003, p.11) find that distance from the United Statesis negatively and significantly related to thelevel of international migration from thatcountry. 24 A second instrument for theinternational migration and remittances vari-ables is education, specifically, the percent ofthe population over age 25 that have completedsecondary education in a developing country.This variable seems useful because human cap-ital theory generally suggests that education ispositively related with international migration(and presumably international remittances) be-cause educated people typically enjoy greateremployment and income-earning opportunitiesin labor-receiving countries. 25 While new emerg-ing research suggests that international mi-grants may not always be positively selected withrespect to education, 26 education still seems toplay an important role in the decision to mi-grate. The final instrument that can be used isgovernment stability, 27 which is a measure ofthe level of political stability in each country.The expected outcome of this variable is notstraightforward. Holding other factors con-stant, we would expect that countries with moreunstable governments would produce largernumbers of international migrants. However,whether or not these increased numbers ofmigrants will produce larger levels of remit-
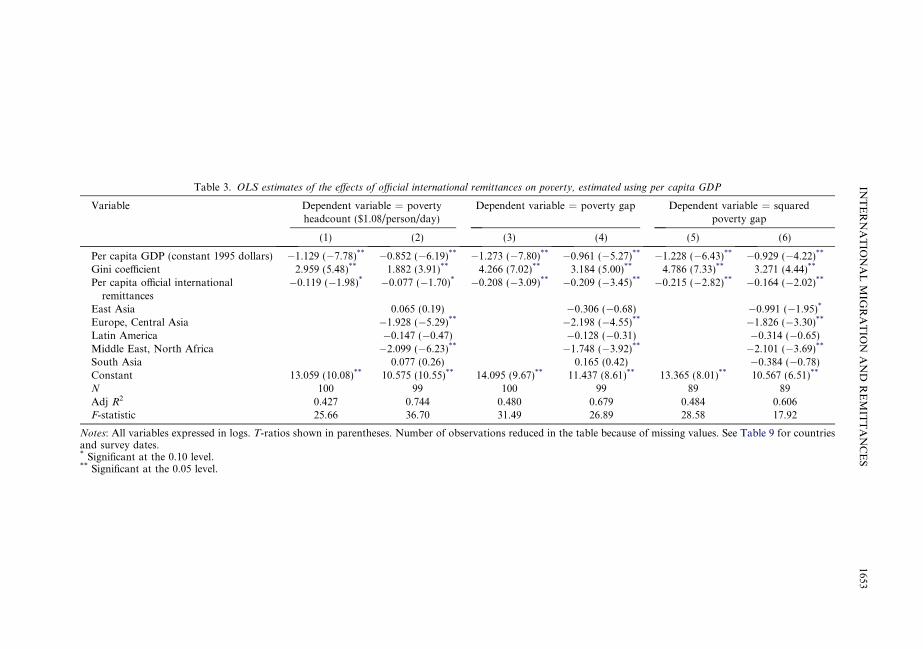
Table 3. OLS estimates of the effects of official international remittances on poverty, estimated using per capita GDP
Variable Dependent variable = povertyheadcount ($1.08/person/day)
Dependent variable = poverty gap Dependent variable = squaredpoverty gap
(1) (2) (3) (4) (5) (6)
Per capita GDP (constant 1995 dollars) �1.129 (�7.78)** �0.852 (�6.19)** �1.273 (�7.80)** �0.961 (�5.27)** �1.228 (�6.43)** �0.929 (�4.22)**
Gini coefficient 2.959 (5.48)** 1.882 (3.91)** 4.266 (7.02)** 3.184 (5.00)** 4.786 (7.33)** 3.271 (4.44)**
Per capita official internationalremittances
�0.119 (�1.98)* �0.077 (�1.70)* �0.208 (�3.09)** �0.209 (�3.45)** �0.215 (�2.82)** �0.164 (�2.02)**
East Asia 0.065 (0.19) �0.306 (�0.68) �0.991 (�1.95)*
Europe, Central Asia �1.928 (�5.29)** �2.198 (�4.55)** �1.826 (�3.30)**
Latin America �0.147 (�0.47) �0.128 (�0.31) �0.314 (�0.65)Middle East, North Africa �2.099 (�6.23)** �1.748 (�3.92)** �2.101 (�3.69)**
South Asia 0.077 (0.26) 0.165 (0.42) �0.384 (�0.78)Constant 13.059 (10.08)** 10.575 (10.55)** 14.095 (9.67)** 11.437 (8.61)** 13.365 (8.01)** 10.567 (6.51)**
N 100 99 100 99 89 89Adj R2 0.427 0.744 0.480 0.679 0.484 0.606F-statistic 25.66 36.70 31.49 26.89 28.58 17.92
Notes: All variables expressed in logs. T-ratios shown in parentheses. Number of observations reduced in the table because of missing values. See Table 9 for countriesand survey dates.* Significant at the 0.10 level.** Significant at the 0.05 level.
INTERNATIO
NALMIG
RATIO
NAND
REMIT
TANCES
1653

Table 4. OLS estimates of the effect of official international remittances on poverty, estimated using survey mean income
Variable Dependent variable = povertyheadcount ($1.08/person/day)
Dependent variable = poverty gap Dependent variable = squared povertygap
(1) (2) (3) (4) (5) (6)
Per capita survey mean income �2.242 (�15.48)** �1.605 (�10.47)** �2.593 (�14.29)** �2.005 (�9.16)** �2.394 (�11.74)** �2.059 (�8.44)**
Gini coefficient 3.646 (10.42)** 2.752 (7.34)** 5.029 (11.47)** 4.095 (7.66)** 5.361 (11.23)** 4.398 (7.29)**
Per capita official internationalremittances
�0.163 (�3.88)** �0.176 (�4.48)** �0.181 (�3.44)** �0.208 (�3.70)** �0.212 (�3.75)** �0.214 (�3.40)**
East Asia �0.126 (�0.52) �0.549 (�1.59) �1.152 (�3.03)**
Europe, Central Asia �1.337 (�4.69)** �1.365 (�3.36)** �0.893 (�1.96)*
Latin America �0.044 (�0.20) �0.052 (�0.16) �0.094 (�0.26)Middle East, North Africa �1.180 (�3.83)** �1.091 (�2.49)** �1.102 (�2.25)*
South Asia 0.348 (1.54) 0.269 (0.84) �0.079 (�0.20)Constant 16.355 (19.05)** 12.863 (15.86)** 17.896 (16.64)** 14.672 (12.69)** 16.461 (13.77)** 14.446 (11.10)**
N 95 95 95 95 88 88Adj R2 0.762 0.857 0.739 0.797 0.711 0.758F-statistic 101.25 71.64 89.69 47.25 72.24 35.07
Notes: All variables expressed in logs. T-ratios shown in parentheses. Number of observations reduced in the table because of missing values. See Table 9 for countriesand survey dates.* Significant at the 0.10 level.** Significant at the 0.05 level.
1654WORLD
DEVELOPMENT

INTERNATIONAL MIGRATION AND REMITTANCES 1655
tances would depend on the extent to whichpolitical instability affects the incentives of mi-grants to remit. Since migrants remit for bothaltruistic and economic reasons, the net impactof political instability—probably positive foraltruistic motives, as migrants seek to cushiontheir relatives from instability, and probablynegative for economic motives to the extentthat political instability undermines the invest-ment climate—is ambiguous.Tables 5 and 6 present the first-stage instru-
mental variables regression results when vari-ous combinations of these variables are usedto instrument international migration andremittances, respectively. In each table, Eqns.(1)–(4) present the results when the exogenousvariables include per capita GDP, and Eqns.(5)–(8) present the results when the exogenousvariables include survey mean income.In both tables, the IV equations containing
only the distance variable are arguably the mostexogenous and have the single highest predictivepower (R2 from 0.44 to 0.48). As expected, thedistance variable is always negative and highlysignificant, suggesting that as the distancebetween remittance-sending and -receivingcountries increases, the level of internationalmigration and remittances received falls. Wheninstrumenting for international migration(Table 5), the education variable is positiveand highly significant. As hypothesized, thisimplies that countries with a higher share ofeducated people also produce more internationalmigrants. The other variable—governmentstability—is statistically insignificant in bothtables, and therefore subject to weak instrumentconcerns. However, when all three variables arecombined together—Eqns. (4) and (8) in Tables5 and 6—the p-values for the F-statistic of theexcluded instruments are all less than 0.01 forthe prediction of international migration andremittances, while the F-statistics themselvesare over 8. When using all three variables asinstruments, international migration is pre-dicted somewhat better than official interna-tional remittances, but the F-statistics stillshow instrument relevance.Tables 7 and 8 present the second-stage IV
results when the international migration andremittance variables are instrumented by allthree variables: distance, education, and gov-ernment stability. Table 7 shows the IV resultsfor international migration and Table 8 showsresults for international remittances. Both ofthese tables are based on survey mean income;results based upon per capita GDP are simi-
lar and available from the authors upon re-quest.Comparing the OLS and IV estimates for
international migration (Tables 2 and 7), we findthat the coefficients for the instrumented inter-national migration variable in Table 7 are morenegative and of greater significance. Comparingthe OLS and IV estimates for official interna-tional remittances (Tables 4 and 8) yields similarresults. For example, while the IV estimates forthe poverty headcount measure suggest that, onaverage, a 10% increase in per capita officialremittances will lead to a 3.5% decline in theshare of people living in poverty (Table 8), theOLS estimates suggest that a similar increasein official remittances will lead to only a 1.8% de-cline in the share of poor people (Table 4).Considered as a whole, the IV results suggest
that after instrumenting for the possible endo-geneity of international migration and remit-tances, these two variables still have a negativeand statistically significant impact upon pov-erty. Instrumented international migration hasa negative and significant impact on two ofthe three poverty measures (Table 7), whileinstrumented official international remittanceshas a negative and significant impact on allthree of the poverty measures (Table 8).In Table 8, the relative magnitudes of the elas-
ticity estimates on survey mean income andinstrumented official international remittancesimply that an increase in international remit-tances has about twice the poverty-reducing im-pact as an increase in other sources ofhousehold income. Evaluated at the samplemean, an increase in $1 in instrumented per ca-pita official international remittances (from$17.15 to $18.15) will lead to a 2.04% reductionin the poverty headcount. By comparison, at thesample mean, a $1 increase in per capita surveymean income (from $1,628.60 to $1,629.60) willyield a 0.98% reduction in the poverty head-count. 28 In other words, dollar for dollar theincome remitted by migrants from abroad re-duces poverty much more than income gener-ated by domestic economic activity.
6. CONCLUSIONS AND POLICYIMPLICATIONS
This paper has used a new data set on interna-tional migration, remittances, inequality, andpoverty from 71 developing countries to exam-ine the impact of international migration, andremittances on poverty in the developing world.

Table 5. First-stage IV estimates for international migration
International migration, estimated using per capita GDP International migration, estimated using survey mean income
(1) (2) (3) (4) (5) (6) (7) (8)
Instruments
Distance from remittance-sending area(United States,OECD-Europe, Persian
Gulf) to remittance-receiving country
�1.162 (�6.21)** �1.328 (�7.53)** �1.157 (�6.05)** �1.331 (�7.40)**
Percent of population over25 years that has secondaryeducation
0.631 (2.38)* 0.913 (4.22)** 0.789 (3.03)** 0.980 (4.59)**
Government stability 0.270 (0.70) 0.137 (0.44) 0.178 (0.47) 0.001 (0.01)
Included exogenous variables
Per capita GDP(constant1995 dollars)
�0.237 (�1.09) �0.428 (�1.66) �0.329 (�1.27) �0.499 (�2.33)*
Per capita survey meanincome
�0.541 (�1.86) �1.089 (�3.21)** �0.745 (�2.21)* �0.843 (�3.00)**
Gini coefficient 0.509 (0.72) �0.300 (�0.37) �0.545 (�0.68) 1.041 (1.56) 0.728 (1.06) �0.109 (�0.15) �0.331 (�0.42) 1.099 (1.69)East Asia 2.022 (3.29)** 0.753 (1.05) 1.081 (1.53) 1.436 (2.45)* 1.728 (3.13)** 0.325 (0.51) 0.780 (1.22) 0.983 (1.82)Europe, Central Asia 0.358 (0.46) 1.617 (1.90) 2.251 (2.72)** �0.876 (�1.14) 0.357 (0.50) 1.744 (2.34)* 2.362 (3.19)** �1.067 (�1.48)
Latin America 1.906 (3.09)** 2.691 (3.84)** 2.951 (4.25)** 1.393 (2.35)* 1.720 (3.13)** 2.592 (4.44)** 2.797 (4.61)** 1.090 (2.09)*
Middle East,North Africa
0.375 (0.50) 2.410 (3.12)** 2.929 (4.05)** �0.837 (�1.12) 0.315 (0.40) 2.656 (3.68)** 3.151 (4.36)** �1.001 (�1.30)
South Asia 0.232 (0.44) 0.152 (0.24) 0.590 (0.92) �0.381 (�0.71) �0.009 (�0.02) �0.260 (�0.42) 0.309 (0.48) �0.696 (�1.30)Constant 8.993 (4.03)** �0.588 (�0.32) �0.965 (�0.51) 11.118 (5.05)** 11.527 (4.40)** 4.212 (1.69) 2.551 (0.95) 14.072 (5.51)**
N 117 114 114 111 117 115 113 111
Adj R2 0.442 0.259 0.240 0.514 0.451 0.313 0.256 0.538F-statistics excludedinstruments
42.65 8.46 4.15 12.65 42.65 8.46 4.15 12.65
P-value 0.000 0.004 0.148 0.000 0.000 0.004 0.148 0.000
Notes: All variables expressed in logs. T-ratios shown in parentheses. Number of observations reduced in the table because of missing values. See Table 9 for countries and surveydates.* Significant at the 0.10 level.** Significant at the 0.05 level.
1656WORLD
DEVELOPMENT

Table 6. First-stage IV estimates for official international remittances
Per capita international remittances, estimated
using per capita GDP
Per capita international remittances, estimated
using survey mean income
(1) (2) (3) (4) (5) (6) (7) (8)
Instruments
Distance from remittance-sending
area (United States,OECD-Europe, Persian Gulf) to
remittance-receiving country
�1.565 (�6.24)** �1.929 (�6.25)** �1.191 (�4.71)** �1.271 (�4.01)**
Percent of population over 25 years
that has secondary education
�0.232 (�0.58) �0.694 (�1.95)* 0.071 (0.20) �0.276 (�0.76)
Government stability 0.611 (1.12) 0.328 (0.69) 0.414 (0.87) 0.504 (1.10)
Included exogenous variables
Per capita GDP
(constant 1995 dollars)
0.505 (1.93) 0.773 (1.74) 0.141 (0.38) 1.358 (3.26)**
Per capita survey mean income 0.440 (1.19) 0.145 (0.31) 0.122 (0.28) 0.611 (1.33)
Gini coefficient 1.272 (1.34) �0.593 (�0.46) 0.552 (0.43) 0.264 (0.23) 1.124 (1.22) 0.694 (0.61) 0.994 (0.88) 1.221 (1.13)East Asia 2.143 (2.97)** 0.660 (0.65) 0.587 (0.66) 3.084 (3.21)** 2.165 (3.29)** 0.763 (0.85) 0.930 (1.31) 2.789 (2.86)**
Europe, Central Asia �2.000 (�2.76)** �0.392 (�0.33) 0.205 (0.17) �3.164 (�2.61)* �1.354 (�1.86) 0.210 (0.21) 0.631 (0.66) �1.107 (�1.03)Latin America 0.084 (0.13) 1.528 (1.80) 1.687 (2.05)* �0.303 (�0.36) 0.867 (1.54) 1.872 (2.70) 1.923 (3.03)** 1.053 (1.46)Middle East, North Africa �0.864 (�1.05) 2.504 (2.51)* 2.813 (3.35)** �1.742 (�1.54) 0.651 (0.72) 3.745 (4.25)** 3.733 (4.64)** 0.873 (0.77)
South Asia 1.378 (2.46)* 1.957 (2.30)* 1.852 (2.31)* 2.054 (2.60)* 1.566 (2.95)** 1.740 (2.35)* 2.150 (3.09)** 2.173 (2.79)**
Constant 10.914 (3.91)** �4.645 (�1.42) �0.791 (�0.28) 7.598 (2.17)* 7.871 (2.37)* 0.040 (0.01) �0.228 (�0.07) 6.713 (1.64)
N 101 91 91 84 97 90 87 83Adj R2 0.463 0.193 0.177 0.436 0.478 0.305 0.303 0.397
F-statistics excluded instruments 39.42 4.92 4.23 8.90 39.42 4.92 4.23 8.90P-value 0.000 0.069 0.047 0.000 0.000 0.069 0.047 0.000
Notes: All variables expressed in logs. T-ratios shown in parentheses. Number of observations reduced in the table because of missing values. See Table 9 for countries and survey dates.* Significant at the 0.10 level.** Significant at the 0.05 level.
INTERNATIO
NALMIG
RATIO
NAND
REMIT
TANCES
1657

Table 7. IV estimates of the effect of international migration on poverty, estimated using survey mean income
Variable Dependent variable = povertyheadcount ($1.08/person/day)
Dependent variable = poverty gap Dependent variable = squaredpoverty gap
(1) (2) (3) (4) (5) (6)
Instrumented endogenous variable
International migration (share ofmigrants in country population)
�0.337 (�4.78)** �0.211 (�3.06)** �0.230 (�2.78)** �0.197 (�2.30)* �0.059 (�0.56) �0.136 (�1.27)
Exogenous regressors
Per capita survey mean income �2.193 (�14.56)** �1.956 (�11.66)** �2.498 (�14.07)** �2.422 (�11.58)** �2.575 (�10.93)** �2.681 (�9.91)**
Gini coefficient 3.989 (11.30)** 3.001 (7.45)** 4.723 (11.36)** 3.595 (7.16)** 4.916 (9.09)** 3.583 (5.53)**
East Asia �0.402 (�1.36) �1.008 (�2.73)** �1.693 (�3.60)**
Europe, Central Asia �0.926 (�2.43)* �0.668 (1.40) �0.485 (�0.80)Latin America 0.012 (0.04) 0.097 (0.23) 0.180 (0.34)Middle East, North Africa �1.022 (�2.57)** �1.115 (�2.24)* �1.167 (�1.83)South Asia �0.059 (�0.20) �0.415 (�1.14) �0.853 (�1.70)Constant 21.448 (16.91)** 19.142 (15.01)** 22.95 (15.36)** 21.739 (13.67)** 22.773 (11.51)** 22.788 (11.06)**
N 101 101 101 101 96 96Adj R2 0.726 0.802 0.708 0.764 0.589 0.680F-statistic 96.33 52.33 83.12 41.53 46.38 23.33
Notes: All variables expressed in logs. T-ratios shown in parentheses. Number of observations reduced in the table because of missing values. See Table 9 for countriesand survey dates.* Significant at the 0.10 level.** Significant at the 0.05 level.
1658WORLD
DEVELOPMENT

Table 8. IV estimates of the effects of official international remittances on poverty, estimated using survey mean income
Variable Dependent variable = povertyheadcount ($1.08/person/day)
Dependent variable = poverty gap Dependent variable = squaredpoverty gap
(1) (2) (3) (4) (5) (6)
Instrumented endogenous variable
Per capita official international remittances �0.464 (�4.70)** �0.351 (�3.55)** �0.421 (�3.68)** �0.396 (�2.91)** �0.247 (�2.31)* �0.283 (�2.24)*
Exogenous regressors
Per capita survey mean income �2.00 (�9.87)** �1.590 (�9.12)** �2.415 (�10.31)** �1.986 (�8.26)** �2.322 (�9.42)** �2.072 (�8.32)**
Gini coefficient 3.610 (8.14)** 2.950 (6.60)** 5.094 (9.93)** 4.407 (7.15)** 5.351 (10.26)** 4.700 (7.25)**
East Asia �0.230 (�0.76) �0.688 (�1.65) �1.373 (�3.25)**
Europe, Central Asia �1.608 (�4.01)** �1.790 (�3.23)** �0.929 (�1.51)Latin America �0.021 (�0.07) �0.038 (�0.09) �0.303 (�0.68)Middle East, North Africa �0.614 (�1.24) �0.533 (�0.78) �1.026 (�1.54)South Asia 0.443 (1.28) 0.363 (0.76) �0.145 (�0.28)Constant 20.965 (12.79)** 17.271 (12.39)** 23.770 (12.53)** 20.214 (10.51)** 22.041 (11.05)** 20.264 (10.07)**
N 81 81 81 81 75 75Adj R2 0.642 0.811 0.674 0.756 0.688 0.744F-statistic 60.26 46.06 60.67 33.11 51.43 27.06
Notes: All variables expressed in logs. T-ratios shown in parentheses. Number of observations reduced in the table because of missing values. See Table 9 for countriesand survey dates.* Significant at the 0.10 level.** Significant at the 0.05 level.
INTERNATIO
NALMIG
RATIO
NAND
REMIT
TANCES
1659

1660 WORLD DEVELOPMENT
Three findings and two policy implicationsemerge.First, both international migration and remit-
tances have a strong, statistically significant im-pact on reducing poverty in the developingworld. After instrumenting for the possible endo-geneity of international migration, and con-trolling for level of income, income inequalityand geographic region, results for the povertyheadcount measure suggest that, on average, a10% increase in the share of international mi-grants in a country’s population will lead to a2.1% decline in the share of people living on lessthan $1.00 per person per day. After instrumen-ting for the possible endogeneity of interna-tional remittances, a similar 10% increase inper capita official international remittances willlead, on average, to a 3.5% decline in the shareof people living in poverty. The fact that bothinternational migration and international remit-tances reduce poverty in the developing world isimportant because data on each of these vari-ables are incomplete and subject to under-reporting in many developing countries. Byanalyzing samples which include informationon each of these variables, we have been ableto test the migration–remittances–poverty rela-tionship for the largest number of labor-export-ing countries possible. The results providestrong, robust evidence of the poverty-reducingimpact of both international migration andremittances in the developing world.The second finding relates to endogeneity.
Comparing the instrumented and noninstru-mented (OLS) estimates for internationalmigration and remittances in this paper showsthat the coefficients for the instrumented vari-ables are larger and more precisely estimatedthan those for the noninstrumented variables.This suggests that international migration andremittances may be endogenous to poverty:that is, we cannot exclude the hypothesis thatvariations in poverty in developing countriescause changes in both the share of migrantsgoing to work abroad and in the level of officialinternational remittances sent home. However,our results show that the extent of this endoge-neity bias on poverty is not large in absoluteterms: the instrumented results suggest that,on average, a 10% increase in per capita officialremittances will lead to a 3.5% decline in theshare of people living in poverty, while the non-instrumented (OLS) estimates suggest that asimilar increase in official remittances will leadto a 1.8% decline in the share of poor people.More work needs to be done on this topic.
The third finding is more of a plea than a con-clusion. From the standpoint of future work onthis topic, more attention needs to be paid tocollecting and publishing better data on interna-tional migration and remittances. With respectto international migration, it would be usefulif developing countries would start publishingrecords on the number and destination of theirinternational migrants. In many developingcountries, these data are already being collected,but they are not being published. With respectto international remittances, the IMF shouldmake greater efforts to count the amount ofremittance monies that are transmitted throughinformal, unofficial channels. It is possible thatpoor people, especially poor people from coun-tries located near major labor-receiving regions,are more likely to remit through informal, unof-ficial channels. For this reason, a full and com-plete accounting of the impact of internationalremittances (official and unofficial) on povertyin the developing world needs more accuratedata on the large level of unofficial remittancesreturning to developing countries.Our findings point to two policy recommen-
dations. With respect to migration, the positiveimpact of international migration on povertymakes the policy question of ‘‘managing migra-tion’’ assume greater importance in the interna-tional development community. While theinternational community has paid considerableattention in the past to international move-ments of goods, services, and finance, much lessattention has been paid to the internationalmovements of people. The results of this papersuggest that there would be substantial poten-tial benefits to the world’s poor if more interna-tional attention were focused on integrating‘‘migration policy’’ within the larger global dia-logue on economic development and povertyreduction. With respect to remittances, theinternational community needs to take effortsto reduce the current high transaction costs ofremitting money to labor-exporting countries.At present, high transaction costs resultingfrom lack of competition, regulation, and/orlow levels of financial sector performance inlabor-exporting countries act as a type of regres-sive tax on international migrants, who oftentend to be poor and to remit small amountsof money with each remittance transaction.Lowering the transactions costs of remittanceswill help to increase the poverty-reducing im-pact of international remittances and will alsoencourage a larger share of remittances to flowthrough formal financial channels.

INTERNATIONAL MIGRATION AND REMITTANCES 1661
NOTES
1. Foreign direct investment (FDI) is the most impor-tant source of external funding for developing countries.
2. In addition to the $93 billion per year in interna-tional remittances which return through official bankingchannels, a large and unrecorded amount ofinternational remittance monies is transmitted throughunofficial and informal channels. One recent IMF study(El-Qorchi, Maimbo, & Wilson, 2003) estimated thatunofficial transfers of remittances to the developingworld currently amount to $10 billion per year.
3. See, for example, Adams (1991, 1993), Taylor(1992), Gustafson and Makonnen (1993), Taylor, Zabin,and Eckhoff (1999), and Stark (1991).
4. Low-income and middle-income countries are thosewhich are classified as such by the World Bank (2000,pp. 334–335). Low-income countries are those with 1999GNP per capita $756 or less; middle-income countriesare those with 1999 GNP per capita of $756–$9,265.
5. In line with other crossnational studies of poverty,1980 was selected as a cutoff point because the povertydata prior to that year are far less comprehensive. See,for example, Ravallion and Chen (1997) and Adams(2004).
6. For the purposes of this study, OECD (Europe)includes 21 countries: Austria, Belgium, Czech Republic,Denmark, Finland, France, Germany, Greece, Hungary,Ireland, Italy, Luxemburg, Netherlands, Norway, Po-land, Portugal, Slovak Republic, Spain, Sweden, Swit-zerland, and United Kingdom.
7. IMF records annual flow in international remit-tances in its publication, Balance of Payments Statistics
Yearbook (Washington, DC).
8. For a full list of these 157 developing countries, seeWorld Bank (2000, pp. 334–335).
9. For example, China was eliminated from the data setbecause of missing income inequality data for thecountry as a whole.
10. To ensure compatibility across countries, all of thepoverty lines in Table 9 are international poverty lines,set at estimates of $1.08 per person per day in 1993purchasing power parity (PPP) exchange rates. The PPPexchange rates are used so that $1.08 is worth roughlythe same in all countries. PPP values are calculated bypricing a representative bundle of goods in each country
and comparing the local cost of that bundle with the USdollar cost of the same bundle. In calculating PPPvalues, the comparison of local costs with US costs isdone using conversion estimates produced by the WorldBank.
11. In this paper the terms ‘‘expenditure’’ and ‘‘in-come’’ are used interchangeably.
12. While a transfer of expenditures from a poorperson to a poorer person will not change the headcountindex or the poverty gap index, it will decrease thesquared poverty gap index.
13. In 2002, the stock of illegal immigrants in theUnited States was estimated at 9.3 million, or about 26%of the total stock of the ‘‘foreign-born’’ population. SeePassel, Capps, and Fix (2004).
14. All of the data on the ‘‘foreign-born’’ populationliving in the OECD (Europe) comes from OECD, Trendsin International Migration (Paris, various issues).
15. Adams (1991, p. 13).
16. In addition to Ravallion (1997) and Ravallion andChen (1997), see Squire (1993), Collier and Dollar(2001), and Bhalla (2002).
17. On this point, see Birdsall and Londono (1997) andRavallion (1997).
18. See Deaton (2001, pp. 125–147) and Adams(2004).
19. However, in those household surveys where surveymean income is proxied by survey mean expenditure, theincome variable may, to some extent, capture the impactof remittances income on household expenditure.
20. See, for example, Ravallion and Chen (1997).
21. When Eqn. (1) is estimated using survey meanincome, the dependent and independent variables in theequation are both based on data from household budgetsurveys.
22. The five regional dummy variables are those forEast Asia, Europe and Central Asia, Latin America andthe Caribbean, Middle East and North Africa, andSouth Asia. Sub-Saharan Africa is the omitted regionaldummy.

1662 WORLD DEVELOPMENT
23. In this study, distance between remittance-sendingregion (United States, OECD (Europe), or Persian Gulf)and remittance-receiving country is measured for eachindividual developing country as the miles between theborders of that country and the main region from whichit receives remittances. For example, for Latin Americancountries, it is the distance to the United States, forNorth African countries, it is the distance to OECD(Europe), and for South Asian countries, it is thedistance to the Persian Gulf.
24. For other empirical studies of the relationshipbetween distance and international migration, see Kare-mera, Oguledo, and Davis (2000) and Vogler and Rotte(2000).
25. See, for example, Harris and Todaro (1970).
26. For example, Mora and Taylor (2005) find thateducation has no significant effect on the level ofinternational migration from rural Mexico and Adams
(1993) finds similar results for rural Egypt. On this pointmore generally, Borjas (1999) argues that internationalmigrants will be negatively selected with respect toeducation in countries with high income inequality.
27. Government stability is measured by ratings pub-lished on a monthly basis by the PRS Group in theInternational Country Risk Guide. These ratings for‘‘government stability’’ have a scale of zero to 12, withzero representing countries with ‘‘very unstable govern-ment’’ to 11 representing those countries with ‘‘verystable government.’’ For instance, in June 2002, theUnited States had a ‘‘government stability’’ rating of 11,while Poland had a rating of 6.
28. The relevant calculations from Table 8 are asfollows. For instrumented per capita internationalremittances, (18.15/17.15 � 1) * (�0.351) = (�2.046).For survey mean income, (1,629.60/1,628.60 � 1) *(�1.590) = (�0.976).
REFERENCES
Adams, R., Jr. (1991). The effects of internationalremittances on poverty, inequality and developmentin rural Egypt. Research Report 86. InternationalFood Policy Research Institute, Washington, DC.
Adams, R. Jr. (1993). The economic and demographicdeterminants of international migration in ruralEgypt. Journal of Development Studies, 30, 146–167.
Adams, R. Jr. (2004). Economic growth, inequality andpoverty: estimating the growth elasticity of poverty.World Development, 32, 1989–2014.
Bhalla, S. (2002). Imagine there’s no country: Poverty,inequality and growth in the era of globalization.Washington, DC: Institute for International Eco-nomics.
Birdsall, N., & Londono, J. (1997). Asset inequalitymatters: an assessment of the World Bank’s ap-proach to poverty reduction. American EconomicReview, 87, 32–37.
Borjas, G. (1999). Heaven’s Door: Immigration policyand the American economy. Princeton, NJ: PrincetonUniversity Press.
Collier, P., & Dollar, D. (2001). Can the world cutpoverty in half. How policy reform and effective aidcan meet international development goals. WorldDevelopment, 29, 1787–1802.
Deaton, A. (2001). Counting the world’s poor: problemsand possible solutions. World Bank Research Ob-server, 16, 125–147.
El-Qorchi, M., Maimbo, S., & Wilson, J. (2003).Informal funds transfer systems: an analysis of theinformal hawala system. IMF Occasional Paper 222.International Monetary Fund, Washington, DC.
Gustafson, B., & Makonnen, N. (1993). Poverty andremittances in Lesotho. Journal of African Econo-mies, 2, 49–73.
Harris, J., & Todaro, M. (1970). Migration, unemploy-ment and development: a two-sector analysis. Amer-ican Economic Review, 60, 126–142.
Hatton, T., & Williamson, J. (2003). What fundamentalsdrive world migration? Wider Discussion Paper No.2003/23. Helsinki, Finland.
International Monetary Fund (various). Balance ofpayments statistics yearbook. International Mone-tary Fund, Washington, DC.
Karemera, D., Oguledo, V., & Davis, B. (2000). Agravity model analysis of international migration toNorth America. Applied Economics, 32, 1745–1755.
Lipton, M. (1980). Migration from rural areas of poorcountries: the impact on rural productivity andincome distribution. World Development, 8,1–24.
Mora, J., & Taylor, J. E. (2005). Determinants ofinternational migration: disentangling individual,household and community effects. Unpublishedmanuscript. Department of Agricultural Economics,University of California, Davis, USA.
Organization for Economic Cooperation and Develop-ment (various). Trends in international migration.Paris, France.
Passel, J., Capps, R., Fix, M. (2004). Undocumentedimmigrants: facts and figures. Unpublished manu-script. Urban Institute, Washington, DC.
Ratha, D. (2004). Enhancing the developmental effect ofworkers’ remittances to developing countries. InGlobal development finance (pp. 169–173). Washing-ton, DC: World Bank.
Ravallion, M. (1997). Can high-inequality developingcountries escape absolute poverty? Economics Let-ters, 56, 51–57.

INTERNATIONAL MIGRATION AND REMITTANCES 1663
Ravallion, M., & Chen, S. (1997). What can new surveydata tell us about recent changes in distribution andpoverty? World Bank Economic Review, 11, 357–382.
Squire, L. (1993). Fighting poverty. American EconomicReview, 83, 377–382.
Stahl, C. (1982). Labor emigration and economicdevelopment. International Migration Review, 16,868–899.
Stark, O. (1991). The migration of labor. Cambridge,MA: Harvard University Press.
Stark, O., & Taylor, J. E. (1989). Relative deprivationand international migration. Demography, 26, 1–14.
Taylor, J. E. (1992). Remittances and inequality recon-sidered: direct, indirect and intertemporal effects.Journal of Policy Modeling, 14, 187–208.
Taylor, J. E., Zabin, C., & Eckhoff, K. (1999). Migrationand rural development in El-Salvador: a micro-economywide perspective. North American Journal ofEconomics and Finance, 10, 91–114.
United Nations, Department of Economic and SocialAffairs, Population Division (2002). International Mig-ration Report 2002. New York: United Nations.
United States, Census Bureau (1990, 2000). Populationcensus. Washington, DC.
Vogler, M., & Rotte, R. (2000). The effects of develop-ment on migration: theoretical issues and newempirical evidence. Journal of Population Economics,13, 485–505.
World Bank (2000). World Development Report, 2000/01. World Bank, Washington, DC.
World Bank (2002). Global Poverty Monitoring data-base. World Bank, Washington, DC.
World Bank (2004). Global Development Finance.World Bank, Washington, DC.
APPENDIX
Table 9 summarizes the variables used in thenew data set.
(See Overleaf)

Table 9. Summary of data set on poverty, inequality, international migration and remittances
Country Surveyyear
Region Poverty headcount($1/person/day)
Povertygap (%)
Squaredpovertygap (%)
Ginicoefficient
Migrationas share ofcountry
population
Officialremittances
(million dollars)
Per capitaofficial remittances(constant 1995
dollars)
Algeria 1988 Middle East, North Africa 1.75 0.64 0.48 0.414 2.77 379 15.94Algeria 1995 Middle East, North Africa 1.16 0.23 0.094 0.353 2.01 1,101 39.22Bangladesh 1984 South Asia 26.16 5.98 1.96 0.258 0.04 527 5.58Bangladesh 1986 South Asia 21.96 3.92 1.07 0.269 0.04 497 4.98Bangladesh 1989 South Asia 33.75 7.72 2.44 0.288 0.05 771 7.17Bangladesh 1992 South Asia 35.86 8.77 2.98 0.282 0.06 848 7.43Bangladesh 1996 South Asia 29.07 5.88 1.6 0.336 0.09 1,217 10.78Belarus 1988 Europe, Central Asia 0 0 0 0.227 0 0 0Belarus 1993 Europe, Central Asia 1.06 0.13 0.03 0.216 0 0 0Belarus 1995 Europe, Central Asia 2.27 0.71 0.46 0.287 0 29 2.84Bolivia 1990 Latin America 11.28 2.22 0.6 0.42 0.47 2 0.30Botswana 1985 Sub-Saharan Africa 33.3 12.53 6.09 0.542 0 0 0Brazil 1985 Latin America 15.8 4.69 1.82 0.595 0.05 25 0.18Brazil 1988 Latin America 18.62 6.78 3.22 0.624 0.05 19 0.13Brazil 1993 Latin America 18.79 8.38 5.01 0.615 0.08 1,123 7.24Brazil 1995 Latin America 13.94 3.94 1.46 0.6 0.09 2,891 18.12Brazil 1997 Latin America 5.1 1.32 0.5 0.517 0.11 1,324 8.08Bulgaria 1989 Europe, Central Asia 0 0 0 0.233 0.2 0 0Bulgaria 1992 Europe, Central Asia 0 0 0 0.308 0.2 0 0Bulgaria 1995 Europe, Central Asia 0 0 0 0.285 0.2 0 0Burkina Faso 1994 Sub-Saharan Africa 61.18 25.51 13.03 0.482 0 80 8.19Central AfricanRepublic
1993 Sub-Saharan Africa 66.58 40.04 28.56 0.613 0 0 0
Chile 1987 Latin America 10.2 2.25 0.66 0.564 0.4 0 0Chile 1990 Latin America 8.26 2.03 0.73 0.56 0.42 0 0Chile 1992 Latin America 3.91 0.74 0.23 0.557 0.44 0 0Chile 1994 Latin America 4.18 0.65 0.15 0.548 0.46 0 0Colombia 1988 Latin America 4.47 1.31 0.57 0.531 0.8 448 13.32Colombia 1991 Latin America 2.82 0.75 0.32 0.513 0.86 866 24.29Colombia 1995 Latin America 8.87 2.05 0.63 0.574 1.02 739 19.16Colombia 1996 Latin America 10.99 3.16 1.21 0.571 1.06 635 16.16Costa Rica 1986 Latin America 12.52 5.44 3.27 0.344 1.43 0 0Costa Rica 1990 Latin America 11.08 4.19 2.37 0.456 1.41 0 0
1664WORLD
DEVELOPMENT

Costa Rica 1993 Latin America 10.3 3.53 1.79 0.462 1.58 0 0Costa Rica 1996 Latin America 9.57 3.18 1.55 0.47 1.71 122 34.83Cote d’Ivoire 1985 Sub-Saharan Africa 4.71 0.59 0.1 0.412 0 0 0Cote d’Ivoire 1987 Sub-Saharan Africa 3.28 0.41 0.08 0.4 0 0 0Cote d’Ivoire 1993 Sub-Saharan Africa 9.88 1.86 0.54 0.369 0 0 0Cote d’Ivoire 1995 Sub-Saharan Africa 12.29 2.4 0.71 0.367 0 0 0Czech Republic 1988 Europe, Central Asia 0 0 0 0.194 1.73 0 0Czech Republic 1993 Europe, Central Asia 0 0 0 0.266 1.53 0 0Dominican Republic 1989 Latin America 7.73 1.51 0.42 0.504 4.89 301 43.33Dominican Republic 1996 Latin America 3.19 0.71 0.26 0.487 7.08 914 116.70Ecuador 1988 Latin America 24.85 10.21 5.82 0.439 1.38 0 0Ecuador 1995 Latin America 20.21 5.77 2.27 0.437 1.92 382 33.32Egypt 1991 Middle East, North Africa 3.97 0.53 0.13 0.35 0.15 2,569 47.92Egypt 1995 Middle East, North Africa 5.55 0.66 0.13 0.283 0.18 3,279 56.35El Salvador 1989 Latin America 25.49 13.72 10.06 0.489 9.06 228 45.38El Salvador 1996 Latin America 25.26 10.35 5.79 0.522 11.67 1,084 187.32Estonia 1988 Europe, Central Asia 0 0 0 0.229 0 0 0Estonia 1993 Europe, Central Asia 3.15 0.91 0.51 0.395 0 0 0Estonia 1995 Europe, Central Asia 4.85 1.18 0.39 0.353 0 0 0Ethiopia 1981 Sub-Saharan Africa 32.73 7.69 2.71 0.324 0.07 0 0Ethiopia 1995 Sub-Saharan Africa 31.25 7.95 2.99 0.399 0.09 0 0Gambia 1992 Sub-Saharan Africa 53.69 23.27 13.28 0.478 0 0 0Ghana 1987 Sub-Saharan Africa 47.68 16.6 7.81 0.353 0.11 1 0.07Ghana 1989 Sub-Saharan Africa 50.44 17.71 8.36 0.359 0.12 6 0.41Ghana 1992 Sub-Saharan Africa 45.31 13.73 5.61 0.339 0.18 7 0.43Ghana 1999 Sub-Saharan Africa 44.81 17.28 8.71 0.327 0.32 26 1.44Guatemala 1987 Latin America 47.04 22.47 13.63 0.582 2.09 0 0Guatemala 1989 Latin America 39.81 19.79 12.59 0.596 2.34 69 8.07Honduras 1989 Latin America 44.67 20.65 12.08 0.595 2.11 35 7.40Honduras 1992 Latin America 38.98 17.74 10.4 0.545 2.74 60 11.62Honduras 1994 Latin America 37.93 16.6 9.38 0.552 3.23 85 15.54Honduras 1996 Latin America 40.49 17.47 9.72 0.537 3.66 128 22.15Hungary 1989 Europe, Central Asia 0 0 0 0.233 2.02 0 0Hungary 1993 Europe, Central Asia 0 0 0 0.279 1.75 0 0India 1983 South Asia 52.55 16.27 NA 0.32 0.04 2,311 3.14India 1986 South Asia 47.46 13.92 NA 0.337 0.06 2,105 2.69India 1988 South Asia 47.99 13.51 NA 0.329 0.07 2,402 2.95India 1990 South Asia 45.95 12.63 NA 0.312 0.09 1,875 2.21
(continued next page)
INTERNATIO
NALMIG
RATIO
NAND
REMIT
TANCES
1665
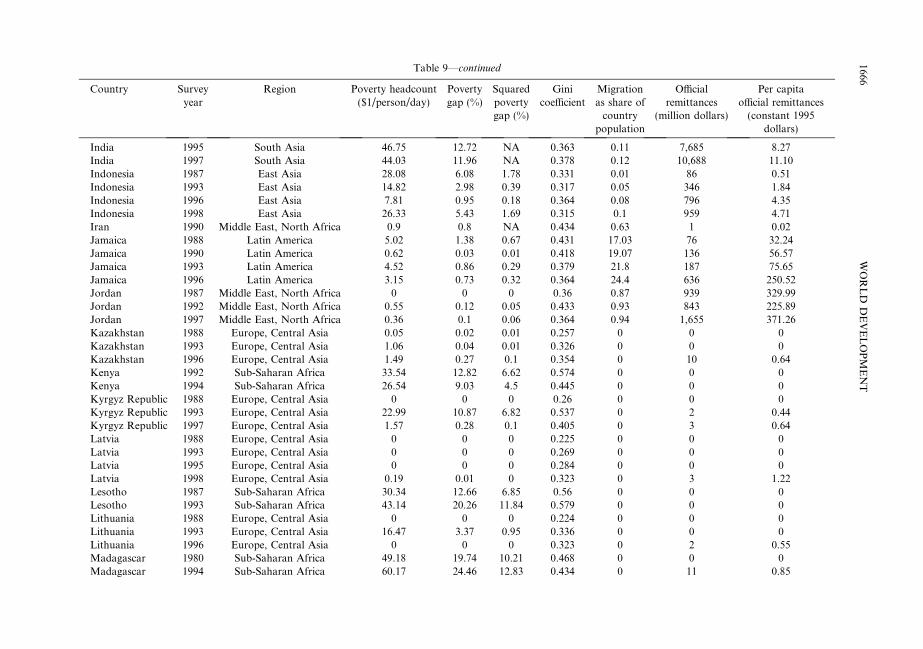
Table 9—continued
Country Surveyyear
Region Poverty headcount($1/person/day)
Povertygap (%)
Squaredpovertygap (%)
Ginicoefficient
Migrationas share ofcountry
population
Officialremittances
(million dollars)
Per capitaofficial remittances(constant 1995
dollars)
India 1995 South Asia 46.75 12.72 NA 0.363 0.11 7,685 8.27India 1997 South Asia 44.03 11.96 NA 0.378 0.12 10,688 11.10Indonesia 1987 East Asia 28.08 6.08 1.78 0.331 0.01 86 0.51Indonesia 1993 East Asia 14.82 2.98 0.39 0.317 0.05 346 1.84Indonesia 1996 East Asia 7.81 0.95 0.18 0.364 0.08 796 4.35Indonesia 1998 East Asia 26.33 5.43 1.69 0.315 0.1 959 4.71Iran 1990 Middle East, North Africa 0.9 0.8 NA 0.434 0.63 1 0.02Jamaica 1988 Latin America 5.02 1.38 0.67 0.431 17.03 76 32.24Jamaica 1990 Latin America 0.62 0.03 0.01 0.418 19.07 136 56.57Jamaica 1993 Latin America 4.52 0.86 0.29 0.379 21.8 187 75.65Jamaica 1996 Latin America 3.15 0.73 0.32 0.364 24.4 636 250.52Jordan 1987 Middle East, North Africa 0 0 0 0.36 0.87 939 329.99Jordan 1992 Middle East, North Africa 0.55 0.12 0.05 0.433 0.93 843 225.89Jordan 1997 Middle East, North Africa 0.36 0.1 0.06 0.364 0.94 1,655 371.26Kazakhstan 1988 Europe, Central Asia 0.05 0.02 0.01 0.257 0 0 0Kazakhstan 1993 Europe, Central Asia 1.06 0.04 0.01 0.326 0 0 0Kazakhstan 1996 Europe, Central Asia 1.49 0.27 0.1 0.354 0 10 0.64Kenya 1992 Sub-Saharan Africa 33.54 12.82 6.62 0.574 0 0 0Kenya 1994 Sub-Saharan Africa 26.54 9.03 4.5 0.445 0 0 0Kyrgyz Republic 1988 Europe, Central Asia 0 0 0 0.26 0 0 0Kyrgyz Republic 1993 Europe, Central Asia 22.99 10.87 6.82 0.537 0 2 0.44Kyrgyz Republic 1997 Europe, Central Asia 1.57 0.28 0.1 0.405 0 3 0.64Latvia 1988 Europe, Central Asia 0 0 0 0.225 0 0 0Latvia 1993 Europe, Central Asia 0 0 0 0.269 0 0 0Latvia 1995 Europe, Central Asia 0 0 0 0.284 0 0 0Latvia 1998 Europe, Central Asia 0.19 0.01 0 0.323 0 3 1.22Lesotho 1987 Sub-Saharan Africa 30.34 12.66 6.85 0.56 0 0 0Lesotho 1993 Sub-Saharan Africa 43.14 20.26 11.84 0.579 0 0 0Lithuania 1988 Europe, Central Asia 0 0 0 0.224 0 0 0Lithuania 1993 Europe, Central Asia 16.47 3.37 0.95 0.336 0 0 0Lithuania 1996 Europe, Central Asia 0 0 0 0.323 0 2 0.55Madagascar 1980 Sub-Saharan Africa 49.18 19.74 10.21 0.468 0 0 0Madagascar 1994 Sub-Saharan Africa 60.17 24.46 12.83 0.434 0 11 0.85
1666WORLD
DEVELOPMENT

Mauritania 1988 Sub-Saharan Africa 40.64 19.07 12.75 0.425 0 9 4.74Mauritania 1993 Sub-Saharan Africa 49.37 17.83 8.58 0.5 0 2 0.93Mauritania 1995 Sub-Saharan Africa 30.98 9.99 4.59 0.389 0 5 2.16Mexico 1984 Latin America 12.05 2.65 0.78 0.54 1.86 1,127 15.24Mexico 1989 Latin America 16.2 5.63 2.75 0.551 4.66 2,213 27.09Mexico 1992 Latin America 13.31 3.23 1.04 0.543 6.1 3,070 35.54Mexico 1995 Latin America 17.9 6.15 2.92 0.537 7.39 3,673 40.30Moldova 1988 Europe, Central Asia 0 0 0 0.241 0 0 0Moldova 1992 Europe, Central Asia 7.31 1.32 0.32 0.344 0 0 0Morocco 1985 Middle East, North Africa 2.04 0.7 0.5 0.392 4.38 967 44.67Morocco 1990 Middle East, North Africa 0.14 0.02 0.01 0.392 4.02 1,336 55.54Mozambique 1996 Sub-Saharan Africa 37.85 12.02 5.42 0.396 0 0 0Namibia 1993 Sub-Saharan Africa 34.93 13.97 6.93 0.743 0 8 5.26Nepal 1985 South Asia 42.13 10.79 3.75 0.334 0 39 2.40Nepal 1995 South Asia 37.68 9.74 3.71 0.387 0 101 4.95Nicaragua 1993 Latin America 47.94 20.4 11.19 0.503 4.38 25 5.98Nigeria 1997 Sub-Saharan Africa 70.24 34.91 NA 0.505 0.09 1,920 16.32Pakistan 1988 South Asia 49.63 14.85 6.03 0.333 0.11 2,013 19.63Pakistan 1991 South Asia 47.76 14.57 6.04 0.332 0.16 1,848 16.67Pakistan 1993 South Asia 33.9 8.44 3.01 0.342 0.18 1,562 13.41Pakistan 1997 South Asia 30.96 6.16 1.86 0.312 0.22 1,409 10.97Panama 1989 Latin America 16.57 7.84 4.9 0.565 3.53 14 5.95Panama 1991 Latin America 18.9 8.87 5.48 0.568 3.55 14 5.72Panama 1995 Latin America 14.73 6.15 3.39 0.57 3.61 16 6.08Panama 1997 Latin America 10.31 3.15 3.67 0.485 3.67 16 5.88Paraguay 1990 Latin America 11.05 2.47 0.8 0.397 0 43 10.19Paraguay 1995 Latin America 19.36 8.27 4.65 0.591 0 200 41.41Peru 1985 Latin America 1.14 0.29 0.14 0.457 0.33 0 0Peru 1994 Latin America 9.13 2.37 0.92 0.446 0.89 472 20.39Peru 1997 Latin America 15.49 5.38 2.81 0.462 1.03 636 26.09Philippines 1985 East Asia 22.78 5.32 1.66 0.41 1.26 111 2.04Philippines 1988 East Asia 18.28 3.59 0.94 0.407 1.49 388 6.66Philippines 1991 East Asia 15.7 2.79 0.66 0.438 1.69 329 5.27Philippines 1994 East Asia 18.36 3.85 1.07 0.429 1.86 443 6.63Philippines 1997 East Asia 14.4 2.85 0.75 0.461 2 1,057 14.82Poland 1987 Europe, Central Asia 0 0 0 0.255 1.89 0 0Poland 1990 Europe, Central Asia 0.08 0.027 0.02 0.283 1.84 0 0Poland 1992 Europe, Central Asia 0.08 0.031 0.02 0.271 1.81 0 0
(continued next page)
INTERNATIO
NALMIG
RATIO
NAND
REMIT
TANCES
1667

Table 9—continued
Country Surveyyear
Region Poverty headcount($1/person/day)
Povertygap (%)
Squaredpovertygap (%)
Ginicoefficient
Migrationas share ofcountry
population
Officialremittances
(million dollars)
Per capitaofficial remittances(constant 1995
dollars)
Romania 1989 Europe, Central Asia 0 0 0 0.233 0.62 0 0Romania 1992 Europe, Central Asia 0.8 0.34 0.31 0.254 0.77 0 0Romania 1994 Europe, Central Asia 2.81 0.76 0.43 0.282 0.88 4 0.17Russian Federation 1994 Europe, Central Asia 6.23 1.6 0.55 0.436 0.34 0 0Russian Federation 1996 Europe, Central Asia 7.24 1.6 0.47 0.48 0.35 0 0Russian Federation 1998 Europe, Central Asia 7.05 1.45 0.39 0.487 0.36 0 0Senegal 1991 Sub-Saharan Africa 45.38 19.95 11.18 0.541 0 105 14.05Senegal 1994 Sub-Saharan Africa 26.26 7.04 2.73 0.412 0 73 9.04Sierra Leone 1989 Sub-Saharan Africa 56.81 40.45 33.8 0.628 0.18 0 0South Africa 1993 Sub-Saharan Africa 11.47 1.83 0.38 0.593 0.14 0 0Sri Lanka 1985 South Asia 9.39 1.69 0.5 0.324 0.06 292 18.43Sri Lanka 1990 South Asia 3.82 0.67 0.23 0.301 0.12 401 23.57Sri Lanka 1995 South Asia 6.56 1 0.26 0.343 0.3 790 43.53Thailand 1988 East Asia 25.91 7.36 2.73 0.438 0.17 0 0Thailand 1992 East Asia 6.02 0.48 0.05 0.462 0.21 0 0Thailand 1996 East Asia 2.2 0.14 0.01 0.434 0.24 0 0Thailand 1998 East Asia 0 0 0 0.413 0.25 0 0Trinidad, Tobago 1992 Latin America 12.36 3.48 NA 0.402 10.5 6 4.85Tunisia 1985 Middle East, North Africa 1.67 0.34 0.13 0.434 3.12 271 37.33Tunisia 1990 Middle East, North Africa 1.26 0.33 0.16 0.402 3.01 551 67.56Turkey 1987 Europe, Central Asia 1.49 0.36 0.17 0.435 4.18 2,021 38.45Turkey 1994 Europe, Central Asia 2.35 0.55 0.24 0.415 4.13 2,627 44.00
1668WORLD
DEVELOPMENT

Turkmenistan 1988 Europe, Central Asia 0 0 0 0.264 0 0 0Turkmenistan 1993 Europe, Central Asia 20.92 5.69 2.1 0.357 0 0 0Uganda 1989 Sub-Saharan Africa 39.17 14.99 7.57 0.443 0 0 0Uganda 1993 Sub-Saharan Africa 36.7 11.44 5 0.391 0 0 0Ukraine 1989 Europe, Central Asia 0 0 0 0.233 0 0 0Ukraine 1992 Europe, Central Asia 0.04 0.01 0.01 0.257 0 0 0Ukraine 1996 Europe, Central Asia 0 0 0 0.325 0 0 0Uruguay 1989 Latin America 1.1 0.47 0.4 0.423 0 0 0Uzbekistan 1988 Europe, Central Asia 0 0 0 0.249 0 0 0Uzbekistan 1993 Europe, Central Asia 3.29 0.46 0.11 0.332 0 0 0Venezuela 1981 Latin America 6.3 1.08 0.25 0.556 0.08 0 0Venezuela 1987 Latin America 6.6 1.04 0.22 0.534 0.14 0 0Venezuela 1989 Latin America 8.49 1.77 0.49 0.557 0.19 0 0Venezuela 1993 Latin America 2.66 0.57 0.22 0.416 0.29 0 0Venezuela 1996 Latin America 14.69 5.62 3.17 0.487 0.36 0 0Yemen 1992 Middle East, North Africa 5.07 0.93 NA 0.394 0 1,018 73.51Yemen 1998 Middle East, North Africa 10.7 2.42 0.85 0.344 0 1,202 72.49Zambia 1991 Sub-Saharan Africa 58.59 31.04 20.18 0.483 0 0 0Zambia 1993 Sub-Saharan Africa 69.16 38.49 25.7 0.462 0 0 0Zambia 1996 Sub-Saharan Africa 72.63 37.75 23.88 0.497 0 0 0Zimbabwe 1991 Sub-Saharan Africa 35.95 11.39 4.56 0.568 0 0 0
Notes: All poverty and inequality data from World Bank, Global Poverty Monitoring database. Migration data from US Population Census and OECD, Trends inInternational Migration. Remittance data from IMF, Balance of Payments Statistics Yearbook.
INTERNATIO
NALMIG
RATIO
NAND
REMIT
TANCES
1669