DNA Fingerprinting Lab Activity Student Study GuideDNA...DNA, proteins, and other gene products such...
19
© 2005 WARD’S Natural Science All Rights Reserved Copymaster. Permission granted to make unlimited copies for use in any one school building. For educational use only. Not for commercial use or resale. 250 W 1405 v.4.10 DNA Fingerprinting Lab Activity Student Study Guide BACKGROUND Restriction enzymes, one of the primary tools in molecular biology, can be used to cut DNA molecules into precisely sized fragments. A more accurate name for this class of enzymes is restriction endonucleases, because they break DNA molecules at internal (endo) positions. Enzymes that degrade DNA by digesting the molecules from the ends of the DNA strand are called exonucleases (exo meaning “outside”). Restriction endonucleases are frequently named using the following convention: The first italicized letter indicates the genus of the organism from which the enzyme was isolated. The second and third italicized letters indicate the species. An additional letter indicates the particular strain used to produce the enzyme. The Roman numerals denote the sequence in which the restriction endonuclease enzymes from that particular genus, species, and strain of bacteria have been isolated. Examples of Restriction Endonuclease Names EcoR I E = genus Escherichia co = species coli R = strain RY 3 I = first RE isolated from this species BamH I B = genus Bacillus am = species amyloliquefaciens H = strain H I = first RE isolated from this species Hind III H = genus Haemophilus in = species influenzae d = strain Rd III = third RE isolated from this species Some restriction enzymes cut cleanly through the DNA molecule by cleaving both complementary strands at the same nucleotide position within the recognition sequence, which is generally four to six base pairs long. These nucleotide recognition sites are also termed palindromic sequences, because both strands have the same sequence running in opposite directions. The restriction endonuclease scans the length of the DNA molecule and stops DID YOU KNOW? More than 900 restriction enzymes have been isolated from more than 230 strains of bacteria.
Transcript of DNA Fingerprinting Lab Activity Student Study GuideDNA...DNA, proteins, and other gene products such...
�© 2005 WARD’S Natural Science
All Rights ReservedCopymaster. Permission granted to make unlimited copies for use in any one school building. For educational use only. Not for commercial use or resale.
250 W 1405 v.4.10
DNA FingerprintingLab Activity
Student Study Guide
BACKGROUND
Restriction enzymes, one of the primary tools in molecular biology, can be used to cut DNA molecules into precisely sized fragments. A more accurate name for this class of enzymes is restriction endonucleases, because they break DNA molecules at internal (endo) positions. Enzymes that degrade DNA by digesting the molecules from the ends of the DNA strand are called exonucleases (exo meaning “outside”).
Restriction endonucleases are frequently named using the following convention: The first italicized letter indicates the genus of the organism from which the enzyme was isolated. The second and third italicized letters indicate the species. An additional letter indicates the particular strain used to produce the enzyme. The Roman numerals denote the sequence in which the restriction endonuclease enzymes from that particular genus, species, and strain of bacteria have been isolated.
Examples of Restriction Endonuclease Names
EcoR I E = genus Escherichia co = species coli R = strain RY �3 I = first RE isolated from this species
BamH I B = genus Bacillus am = species amyloliquefaciens H = strain H I = first RE isolated from this species
Hind III H = genus Haemophilus in = species influenzae d = strain Rd III = third RE isolated from this species
Some restriction enzymes cut cleanly through the DNA molecule by cleaving both complementary strands at the same nucleotide position within the recognition sequence, which is generally four to six base pairs long. These nucleotide recognition sites are also termed palindromic sequences, because both strands have the same sequence running in opposite directions. The restriction endonuclease scans the length of the DNA molecule and stops
DID YOU KNOW?More than 900 restriction enzymes have been isolated from more than 230 strains of bacteria.

2© 2005 WARD’S Natural Science
All Rights ReservedCopymaster. Permission granted to make unlimited copies for use in any one school building. For educational use only. Not for commercial use or resale.
250 W 1405 v.4.10
to cut the molecule only at its particular recognition site. For example, the endonuclease Hind III will cut a double strand of DNA in the following way:
The Hind III enzyme recognizes the sequence
and will cut the DNA at a specific point (between the A’s) within the recognition site, resulting in a staggered cut.
A staggered cut exposes single-stranded regions of the molecule, which are known as “sticky ends”; these are especially useful in making recombinant-DNA molecules. DNA restriction fragments produced by the same restriction enzyme can be spliced together. The sticky ends produced as a result of the staggered cut by the restriction enzyme allow complementary regions in the sticky ends to recognize one another and pair up.
Another class of restriction enzyme cuts cleanly through the DNA molecule by cleaving both complementary strands of DNA at the same nucleotide position within the recognition sequence. These enzymes produce a blunt-end cut. For example, the restriction endonuclease Bam I will cut a double strand of DNA in the following way,
TGGCCAACCGGT
Electrophoresis
Molecular-level concepts in biology are often difficult to grasp. When trying to visualize the invisible world of the molecule, students are too often confronted by abstract theory. Yet one product of biotechnology’s advances—gel electrophoresis—actually allows students to visualize and separate DNA, proteins, and other gene products such as polypeptides and nucleotide sequences.
Gel electrophoresis is a separation technology that uses gel, a substrate (like gelatin), electricity (“electro”), and movement. “Phoresis”, from the Greek verb phoros, means “to carry across”. Gel electrophoresis, then, refers to the technique in which molecules are forced across a gel by an electrical current; activated electrodes at either end of the gel provide the driving force.
With gel electrophoresis, nucleic acids, both DNA and RNA, can be separated on the basis of size and charge to identify structural forms of plasmid DNA, as well as determine the size of DNA fragments. These determinations are critical to the analysis of the structure and function of genes. Furthermore, the size of unknown DNA fragments can be determined by constructing a standard curve using the migration distances and sizes of a known DNA marker.
Band patterns of separated DNA on a gel visually resemble a bar code—that familiar pattern used to identify consumer products. Each band is a unique “signature” revealing a recorded and identifiable DNA fragment. Scientists and clinicians regularly use scanning instruments to glean vital information from electrophoresis samples. This information is critical in a range of applications: pinpointing cancer types, identifying diseased tissue, characterizing genetic dysfunctions, assessing coronary risk, even reading and compiling nucleotide sequences to map genomes of many life-forms, including our own.
AAGCTTTTCGAA
DID YOU KNOW?Arne Tiselius, a Swedish biochemist, won the Nobel Prize for chemistry in �940 for his work with electrophoresis.

3© 2005 WARD’S Natural Science
All Rights ReservedCopymaster. Permission granted to make unlimited copies for use in any one school building. For educational use only. Not for commercial use or resale.
250 W 1405 v.4.10
Separation of large (macro) molecules depends on two forces: charge and mass. When a biological sample is mixed in a buffer solution and applied to a gel, these two forces act in concert. The electrical current from one electrode repels the molecules while the other electrode attracts, and the frictional force of the gel material acts as a “molecular sieve”, separating the molecules by size and charge. Negatively charged molecules will migrate toward the positive pole, while positively charged molecules will migrate toward the negative pole. The net negative charge of the phosphate backbone results in the DNA fragments having a negative charge and thus will always migrate toward the positive pole. The material is roughly analogous to that of a thoroughly wetted sponge, except that in this case, the “pores” are submicroscopic. During electrophoresis, macromolecules are forced to migrate through the “pores”, always from the closest electrode and toward the farther electrode when electrical current is applied. After staining, the separated macromolecules in each lane can be seen; they appear as a series of bands spread from one end of the gel to the other.
There are two basic types of materials used to make gels: agarose and polyacrylamide. Polyacrylamide is a material similar to that found in soft contact lenses; it is primarily used to separate proteins. Agarose is a natural colloid extracted from seaweed. Agarose gels have a very large “pore” size and are used primarily to separate very large molecules such as DNA with a molecular mass greater than 2,000 kdal. kdal is the abbreviation for kilodalton, or �,000 daltons. A dalton is a unit of molecular weight very nearly equivalent to the mass of a hydrogen atom, or �.000 on the atomic mass scale. When agarose is heated to about 90 °C it melts, but resolidifies when cooled below 45 °C. During the solidification process, agarose forms a matrix of microscopic pores. The size of these pores depends on the concentration of agarose used. Typically the concentration varies from 0.5% to 2.0%. The lower the concentration, the larger the pore size of the gel and the larger the nucleic acid fragments that can be separated. During electrophoresis, DNA molecules wind through the pores in the gel. As the pore size decreases (by increasing agarose concentration), it is harder for longer DNA fragments to orient properly. Smaller DNA fragments can thread their way through the pores easier, migrating faster.
DNA Fingerprinting
Of the three billion nucleotides in human DNA, more than 99% are identical among all individuals. The remaining �% that is different, however, adds up to a significant amount of code variations between individuals, making each person’s DNA profile as unique as a fingerprint. Due to the very large number of possible variations, no two people (with the exception of identical twins) have the same DNA sequence.
For every �,000 nucleotides inherited, there is one site of variation, or polymorphism. These DNA polymorphisms change the length of the DNA fragments produced by the digestion of restriction enzymes. The exact number and size of fragments produced by a specific restriction enzyme digestion varies from person to person. The resulting fragments, called Restriction Fragment Length Polymorphisms, or RFLPs, can be separated, and their size determined, by electrophoresis.
DID YOU KNOW?There are two types of electrophoresis: moving boundary electrophoresis uses liquid media, and zone electrophoresis uses solid or semi-solid media.

4© 2005 WARD’S Natural Science
All Rights ReservedCopymaster. Permission granted to make unlimited copies for use in any one school building. For educational use only. Not for commercial use or resale.
250 W 1405 v.4.10
Most of the DNA in a chromosome is not used for the genetic code; it is uncertain what, if any, use this DNA may have. Because these regions are not essential to an organism’s development, it is more likely that changes will be found in these nonessential regions. These regions contain nucleotide sequences that repeat from 20 to �00 times (e.g., GTCAGTCAGTCAGTCA), which are the strands that are cut with restriction enzymes to create RFLPs.
The differences in the fragments can be quantified to create a “DNA fingerprint”. Distinct RFLP patterns can be used to trace the inheritance of chromosomal regions with genetic disorders or to identify the origin of a blood sample in a criminal investigation. Scientists have identified more than 3,000 RFLPs in the human genetic code, many of which are highly variable among individuals. It is this large number of variable yet identifiable factors that allow scientists to identify individuals by the number and size of their various RFLPs.
This technique is being used more and more frequently in legal matters. Using DNA fingerprinting, the identity of a person who has committed a violent crime can be determined from minute quantities of DNA left at the scene of the crime in the form of blood, semen, hair, or saliva. The DNA fingerprint matched to a suspect can be accurate to within one in �0 billion people—about twice the total population of the world. Certain limitations in the technique prevents two samples from being identified as a “perfect match”, yet it is possible to measure the statistical probability of two samples coming from the same individual based on the number of known RFLPs that exist in a given population.
DNA fingerprinting has many other applications. Since half of a person’s genome comes from each parent, DNA fingerprinting can be used to determine familial relationships. It has a much higher certainty than a blood test when used to determine fatherhood in a paternity suit. DNA fingerprinting can be used to track hereditary diseases passed down family lines and can be used to find the closest possible matches for organ transplants. It can also be used to ascertain the level of inbreeding of endangered animals, aiding in the development of breeding programs to increase animals’ genetic health and diversity.
DID YOU KNOW?In �989, Alex Jeffreys, a professor at Leicester University, coined the term DNA fingerprinting. He was the first person to use DNA in court cases involving paternity, immigration, and murder.
5© 2005 WARD’S Natural Science
All Rights ReservedCopymaster. Permission granted to make unlimited copies for use in any one school building. For educational use only. Not for commercial use or resale.
250 W 1405 v.4.10
DNA Fragment Length Determination
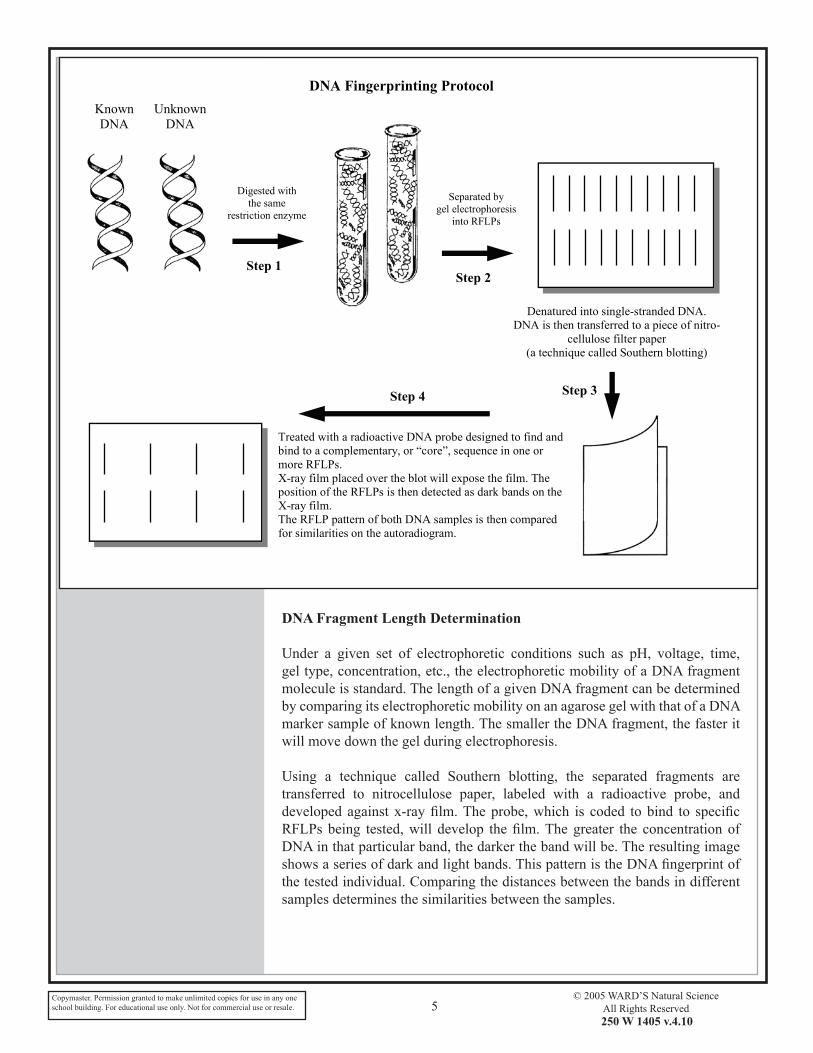
Under a given set of electrophoretic conditions such as pH, voltage, time, gel type, concentration, etc., the electrophoretic mobility of a DNA fragment molecule is standard. The length of a given DNA fragment can be determined by comparing its electrophoretic mobility on an agarose gel with that of a DNA marker sample of known length. The smaller the DNA fragment, the faster it will move down the gel during electrophoresis.
Using a technique called Southern blotting, the separated fragments are transferred to nitrocellulose paper, labeled with a radioactive probe, and developed against x-ray film. The probe, which is coded to bind to specific RFLPs being tested, will develop the film. The greater the concentration of DNA in that particular band, the darker the band will be. The resulting image shows a series of dark and light bands. This pattern is the DNA fingerprint of the tested individual. Comparing the distances between the bands in different samples determines the similarities between the samples.
DNA Fingerprinting Protocol
KnownDNA
UnknownDNA
Step 1
Digested withthe same
restriction enzyme
Step 2
Separated bygel electrophoresis
into RFLPs
Step 3
Denatured into single-stranded DNA.DNA is then transferred to a piece of nitro-
cellulose filter paper(a technique called Southern blotting)
Step 4
Treated with a radioactive DNA probe designed to find andbind to a complementary, or “core”, sequence in one ormore RFLPs.X-ray film placed over the blot will expose the film. Theposition of the RFLPs is then detected as dark bands on theX-ray film.The RFLP pattern of both DNA samples is then comparedfor similarities on the autoradiogram.

�© 2005 WARD’S Natural Science
All Rights ReservedCopymaster. Permission granted to make unlimited copies for use in any one school building. For educational use only. Not for commercial use or resale.
250 W 1405 v.4.10
OBJECTIVES
• Learn the process of agarose gel electrophoresis• Perform the electrophoresis procedure• Identify the guilty suspect in a criminal investigation• Determine the size of unknown DNA molecules
mATERIALS
mATERIALS NEEDED pER LAB GROUp
� 0.8% Agarose gel, on gel tray TBE running buffer I X, 350 mL DNA stain Staining tray Micropipets Metric ruler Calculator Semi-log graph paper Goggles Aprons Gloves
ShARED mATERIALS
DNA Samples: DNA marker standard Crime scene DNA Suspect � DNA sample Suspect 2 DNA sample Water bath or microwave Lab markers
SCENARIO
Investigators were called to the scene of a burglary where it appeared that, as the burglar rushed to leave, he ran into a glass door, cutting his arm and tearing his shirt. The investigators removed small pieces of bloodstained fabric from the door to be tested. The blood sample was determined to be type A. Two suspects were apprehended; unfortunately, both had type A blood. Investigators have now resorted to DNA fingerprinting to determine which of the two suspects is the burglar.
The procedure used in this lab activity will result in a gel showing the results of a Southern Blot DNA Fingerprint.
DID YOU KNOW?Homes without security systems are approximately three times more likely to be burglarized than homes with security systems.
�© 2005 WARD’S Natural Science
All Rights ReservedCopymaster. Permission granted to make unlimited copies for use in any one school building. For educational use only. Not for commercial use or resale.
250 W 1405 v.4.10
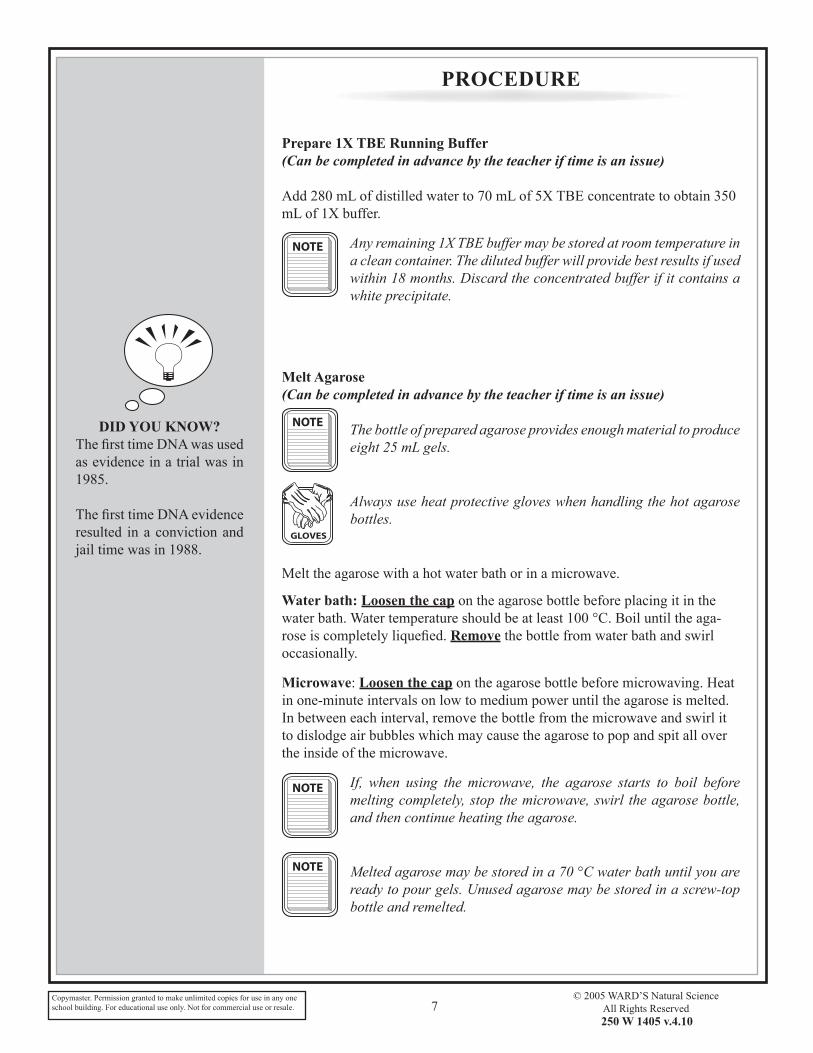
pROCEDURE
prepare 1X TBE Running Buffer (Can be completed in advance by the teacher if time is an issue)
Add 280 mL of distilled water to �0 mL of 5X TBE concentrate to obtain 350 mL of �X buffer.
Any remaining 1X TBE buffer may be stored at room temperature in a clean container. The diluted buffer will provide best results if used within 18 months. Discard the concentrated buffer if it contains a white precipitate.
melt Agarose (Can be completed in advance by the teacher if time is an issue)
The bottle of prepared agarose provides enough material to produce eight 25 mL gels.
Always use heat protective gloves when handling the hot agarose bottles.
Melt the agarose with a hot water bath or in a microwave.
Water bath: Loosen the cap on the agarose bottle before placing it in the water bath. Water temperature should be at least �00 °C. Boil until the aga-rose is completely liquefied. Remove the bottle from water bath and swirl occasionally.
microwave: Loosen the cap on the agarose bottle before microwaving. Heat in one-minute intervals on low to medium power until the agarose is melted. In between each interval, remove the bottle from the microwave and swirl it to dislodge air bubbles which may cause the agarose to pop and spit all over the inside of the microwave.
If, when using the microwave, the agarose starts to boil before melting completely, stop the microwave, swirl the agarose bottle, and then continue heating the agarose.
Melted agarose may be stored in a 70 °C water bath until you are ready to pour gels. Unused agarose may be stored in a screw-top bottle and remelted.
DID YOU KNOW?The first time DNA was used as evidence in a trial was in �985.
The first time DNA evidence resulted in a conviction and jail time was in �988.
NOTE
NOTE
GLOVES
NOTE
NOTE

8© 2005 WARD’S Natural Science
All Rights ReservedCopymaster. Permission granted to make unlimited copies for use in any one school building. For educational use only. Not for commercial use or resale.
250 W 1405 v.4.10
Casting an Agarose Gel (Can be completed in advance by the teacher if time is an issue)
You may pour the gels in advance and store them refrigerated for up to one week prior to performing the electrophoresis portion of the lab. Leave the gel on the casting tray and place it in a resealable bag with 1-2 mL 1X TBE buffer. Seal the bag and store refrigerated until needed. As a precaution, you may wish to pour one or two extra gels.
Note: The 16-well comb must be used for this lab!
1. Place gel casting tray on a flat surface and snap the end dams onto each end of the casting tray. The end dams seal the ends of the tray, eliminating the need to tape the ends.
2. Insert the gel comb, using the 16-well side, into the slots closest to either end of the tray.
3. Pour approximately 25 mL melted agarose into the tray, until it reaches a depth of about 3 mm.
4. Allow the gel to solidify for approximately 20-30 minutes. Do not disturb the gel tray or comb. When the agarose has solidified, it will turn opaque.
5. After the gel has solidified, carefully remove the comb from the gel. Remove the end dams from the tray by carefully sliding them off the base.
NOTE
NOTE
DID YOU KNOW?Besides agarose, other types of semi-solid media used for electrophoresis are cellulose acetate and polyacrylamide gel.
9© 2005 WARD’S Natural Science
All Rights ReservedCopymaster. Permission granted to make unlimited copies for use in any one school building. For educational use only. Not for commercial use or resale.
250 W 1405 v.4.10
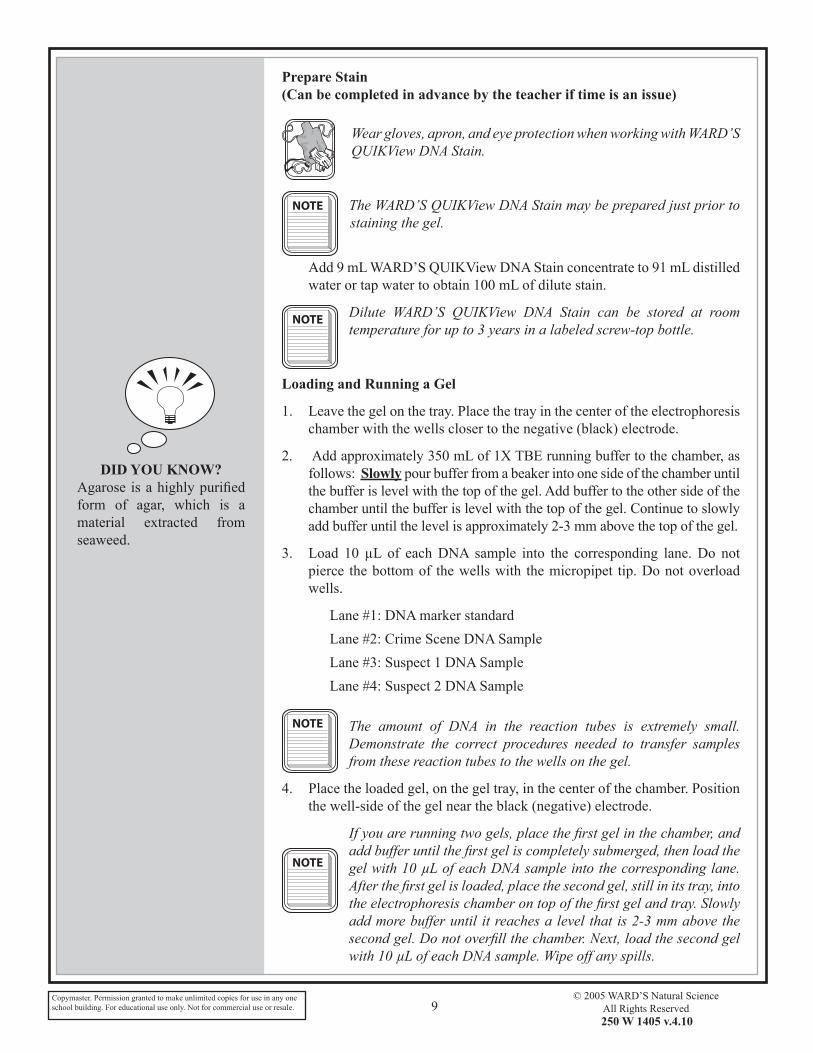
prepare Stain(Can be completed in advance by the teacher if time is an issue)
Wear gloves, apron, and eye protection when working with WARD’S QUIKView DNA Stain.
The WARD’S QUIKView DNA Stain may be prepared just prior to staining the gel.
Add 9 mL WARD’S QUIKView DNA Stain concentrate to 9� mL distilled water or tap water to obtain �00 mL of dilute stain.
Dilute WARD’S QUIKView DNA Stain can be stored at room temperature for up to 3 years in a labeled screw-top bottle.
Loading and Running a Gel
�. Leave the gel on the tray. Place the tray in the center of the electrophoresis chamber with the wells closer to the negative (black) electrode.
2. Add approximately 350 mL of �X TBE running buffer to the chamber, as follows: Slowly pour buffer from a beaker into one side of the chamber until the buffer is level with the top of the gel. Add buffer to the other side of the chamber until the buffer is level with the top of the gel. Continue to slowly add buffer until the level is approximately 2-3 mm above the top of the gel.
3. Load �0 µL of each DNA sample into the corresponding lane. Do not pierce the bottom of the wells with the micropipet tip. Do not overload wells.
Lane #�: DNA marker standard
Lane #2: Crime Scene DNA Sample
Lane #3: Suspect � DNA Sample
Lane #4: Suspect 2 DNA Sample
The amount of DNA in the reaction tubes is extremely small. Demonstrate the correct procedures needed to transfer samples from these reaction tubes to the wells on the gel.
4. Place the loaded gel, on the gel tray, in the center of the chamber. Position the well-side of the gel near the black (negative) electrode.
If you are running two gels, place the first gel in the chamber, and add buffer until the first gel is completely submerged, then load the gel with 10 µL of each DNA sample into the corresponding lane. After the first gel is loaded, place the second gel, still in its tray, into the electrophoresis chamber on top of the first gel and tray. Slowly add more buffer until it reaches a level that is 2-3 mm above the second gel. Do not overfill the chamber. Next, load the second gel with 10 µL of each DNA sample. Wipe off any spills.
NOTE
NOTE
NOTE
NOTE
DID YOU KNOW?Agarose is a highly purified form of agar, which is a material extracted from seaweed.

�0© 2005 WARD’S Natural Science
All Rights ReservedCopymaster. Permission granted to make unlimited copies for use in any one school building. For educational use only. Not for commercial use or resale.
250 W 1405 v.4.10
5. Making sure the cover, as well as the female jacks and the banana plugs, are dry, slide the cover onto the electrophoresis chamber. Wipe off any spills on the apparatus before proceeding to the next step.
�. Making sure that the patch cords attached to the cover are completely dry, connect the red patch cord to the red electrode terminal on the power supply. Connect the black patch cord to the black electrode terminal on the power supply.
Check the connections before allowing students to proceed to the next step.
�. Plug in the power supply and set it to the desired voltage.
It is recommended that you set the power supply at 75 volts. The system may be run at lower voltage settings, but this will increase the running time of your agarose gels.
8. Turn on the power supply. The red power light will illuminate, and bubbles will form along the platinum electrodes.
9. Observe the migration of the sample down the gel toward the red electrode. Turn off the power when the loading dye has run halfway off the end of the gel. Unplug the power supply.
The loading dye is a special dye added to the DNA samples prior to performing electrophoresis. The loading dye serves two purposes. It is heavier than the electrophoresis buffer, causing the DNA samples to sink into the wells. It is also smaller than most of the DNA fragments in the samples so it runs to the end of the gel faster than the DNA, giving an indication of when to end the electrophoresis run.
�0. Wait approximately �0 seconds and then disconnect the patch cords from the power supply. Remove the cover from the electrophoresis chamber.
��. Carefully remove the gel, on the casting tray, from the electrophoresis chamber.
Optional stopping point: If the lab period does not allow time to stain and destain the gel, measure and record the distance the loading dye has traveled from the bottom of each well to the center of the diffuse band formed by the loading dye in each lane. Be sure to take this measurement, as the loading dye will diffuse out of the gel within a couple of hours. Place the gel in a resealable bag, add 1-2 mL of 1X TBE buffer, and store gel refrigerated until next lab period.
STOP
NOTE
NOTE
DID YOU KNOW?New DNA technology has been used to clear the names of several people who were wrongly convicted of crimes. One man, falsely convicted of rape in �9�9, was released from prison after 23 years when advances in biotechnology allowed minute amounts of his DNA to be analyzed. The results verified that the man was innocent of the crime.
NOTE

��© 2005 WARD’S Natural Science
All Rights ReservedCopymaster. Permission granted to make unlimited copies for use in any one school building. For educational use only. Not for commercial use or resale.
250 W 1405 v.4.10
�2. Gently place the gel in the staining tray.
�3. Wearing protective gloves, pour approximately �00 mL of dilute stain into the staining tray so the stain just covers the gel.
�4. Cover and let gel stain for approximately �0-20 minutes.
�5. When the gel has completed staining, carefully decant the used stain. Make sure the gel remains flat and does not move up against the corner. Decant the stain directly to a sink drain and flush with water.
The dilute DNA stain may be saved and reused several times.
��. To destain, add distilled or tap water to the staining tray. To accelerate destaining, gently rock the tray. Destain until bands are distinct, with little background color. This will take between 30 and �0 minutes, depending on the amount of agitation and number of water changes. Change the water several times, or destain the gel, without changing the water, overnight.
��. View the gel against a light background, such as white paper, or on a light table. Gels can be stored in resealable plastic bags. For long-term storage, add several drops of dilute stain to the bag to prevent the DNA bands from fading. If fading does occur, the gel can be restained using the above procedure.
Wash your hands thoroughly before leaving the lab.
DID YOU KNOW?DNA testing was used to prove that Thomas Jefferson was, in fact, the biological father of at least one child of his slave Sally Hemings.
NOTE
NOTE

�2© 2005 WARD’S Natural Science
All Rights ReservedCopymaster. Permission granted to make unlimited copies for use in any one school building. For educational use only. Not for commercial use or resale.
250 W 1405 v.4.10
Analyzing Your Gel
�. For the DNA marker standard, measure the distance the DNA bands traveled, in millimeters, from the bottom of the sample well to the bottom of each DNA fragment. Measuring to the bottom of each fragment band ensures consistency and accurate measurements. Do not measure the migration distance of the largest fragments nearest the well; it will not be on the standard curve and will skew results.
2. Record the measurements in Table � in the Analysis section.
3. On semi-log graph paper, plot a standard curve for the DNA marker standard. Plot the migration distance, in millimeters, on the X-axis, against the molecular size in base pairs (bp) of each fragment. Draw the best-fit line to your points.
When plotting on semi-log graph paper, the fragment size on the Y-axis is expressed on a logarithmic scale. Label the first series of lines 100 bp, 200 bp, 300 bp, etc. Then label the second series of lines 1000 bp, 2000 bp, 3000 bp, etc. The third series would be 10,000 bp, 20,000 bp, etc.
4. Measure the distance that each band traveled from the bottom of the well for the lanes containing the DNA of the two suspects and the DNA found at the crime scene. Record the data in Tables 2, 3, and 4, in the Analysis section.
5. Calculate the base pair size of each of the fragments by moving along the X-axis until you have reached the distance traveled by the fragment. From that point, move upward until you intersect the line of best fit on the graph. Determine where that point is on the Y-axis and estimate the base pair value at that point. Enter this data in Tables 2-4.
This interpolation technique is not exact.
NOTE
NOTE
DID YOU KNOW?Gel electrophoresis is used in many fields biology, including genetic testing, paternity analysis, forensics, conservation biology, animal behavior, taxonomy, and evolutionary biology.

WARD’S Name: ____________________________________DNA Fingerprinting Group: ____________________________________Lab Activity Date: ____________________________________
WARD’S Name: ____________________________________DNA Fingerprinting Group: ____________________________________Lab Activity Date: ____________________________________
DATA
�3© 2005 WARD’S Natural Science
All Rights ReservedCopymaster. Permission granted to make unlimited copies for use in any one school building. For educational use only. Not for commercial use or resale.
250 W 1405 v.4.10
Table 1DNA marker Standard
Fragment Distance migrated (mm) Length (bp)
� (top) 23109
2 9416
3 6557
4 4361
5 2328
� 2027
� 564
8 Not imaged 125
The first fragment is too large to migrate properly in agarose and will not fit within your line of best fit; therefore, it should be disregarded.
Table 2Crime Scene DNA Sample
Fragment Distance migrated (mm) Length (bp)
� (top)
2
3
4
5
�
�
8
9
�0
��
�2
�3
NOTE
Fill in Tables �-4, as directed on page �2 of the Student Guide.
�3© 2005 WARD’S Natural Science
All Rights ReservedCopymaster. Permission granted to make unlimited copies for use in any one school building. For educational use only. Not for commercial use or resale.
250 W 1405 v.4.10

�4© 2005 WARD’S Natural Science
All Rights ReservedCopymaster. Permission granted to make unlimited copies for use in any one school building. For educational use only. Not for commercial use or resale.
250 W 1405 v.4.10
Table 3Suspect 1 DNA Sample
Fragment Distance migrated (mm) Length (bp)
� (top)
2
3
4
5
�
�
8
Table 4Suspect 2 DNA Sample
Fragment Distance migrated (mm) Length (bp)
� (top)
2
3
4
5
�
�
8
9
�0
��
�2
�3

�5© 2005 WARD’S Natural Science
All Rights ReservedCopymaster. Permission granted to make unlimited copies for use in any one school building. For educational use only. Not for commercial use or resale.
250 W 1405 v.4.10
DN
A F
ragm
ent S
ize
(#bp
)
Distance Migrated (mm)
1,000
10,000
100,000
10 20 30 40 50 60
Determination of Unknown DNA Fragment Size
Copymaster. Permission granted to make unlimited copies for use in any one school building. For educational use only. Not for commercial use or resale. ��
© 2005 WARD’S Natural ScienceAll Rights Reserved
WARD’S Name: ____________________________________DNA Fingerprinting Group: ____________________________________Lab Activity Date: ____________________________________
ASSESSmENT
250 W 1405 v.4.10
�. Compare the banding patterns formed on each lane of the gel. Do you think the three DNA samples tested are the same? Explain. How can you further verify whether or not any of the DNA samples tested are the same?
2. Which of the two suspects do you believe is the real burglar? Explain your answer.
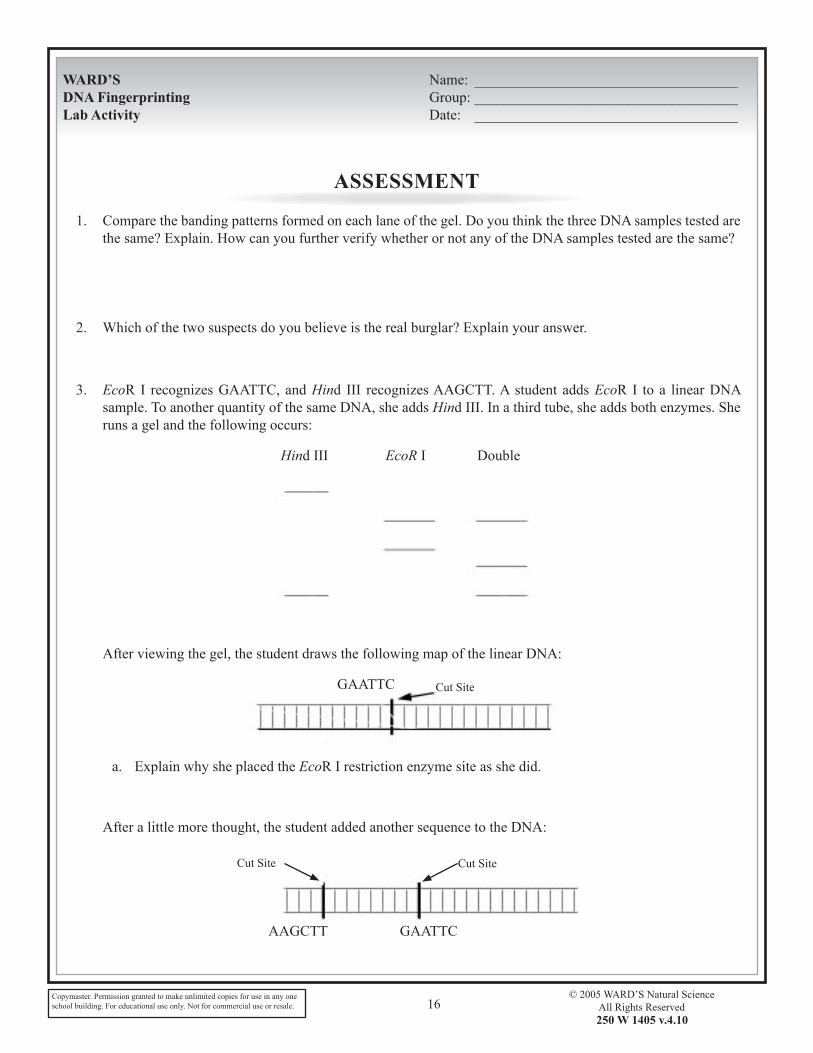
3. EcoR I recognizes GAATTC, and Hind III recognizes AAGCTT. A student adds EcoR I to a linear DNA sample. To another quantity of the same DNA, she adds Hind III. In a third tube, she adds both enzymes. She runs a gel and the following occurs:
Hind III EcoR I Double
After viewing the gel, the student draws the following map of the linear DNA:
GAATTC Cut Site
a. Explain why she placed the EcoR I restriction enzyme site as she did.
After a little more thought, the student added another sequence to the DNA:
Cut Site Cut Site
AAGCTT GAATTC

Copymaster. Permission granted to make unlimited copies for use in any one school building. For educational use only. Not for commercial use or resale. ��
© 2005 WARD’S Natural ScienceAll Rights Reserved
250 W 1405 v.4.10
b. Explain how the student was able to add the Hind III restriction enzyme site in this position, based on the results of her gel.
5. Different restriction enzymes are isolated from different types of bacteria. What advantage do you think bacteria gain by having restriction enzymes?
�. In your lab, you ran your DNA samples on a 0.8% agarose gel. Would you get the same results if you ran your samples on a higher percentage agarose gel? Why or why not?
�. Predict what would happen if you place your gel in the electrophoresis chamber with the wells containing the DNA next to the red electrode instead of the black?
8. If you have a restriction enzyme that cuts a piece of DNA at two recognition sites, how many DNA fragments would you see on a gel?
9. Hind III recognizes a sequence of six nucleotides (AAGCTT) as a cut site. What are the odds that this sequence will occur in a random chain of DNA?

Copymaster. Permission granted to make unlimited copies for use in any one school building. For educational use only. Not for commercial use or resale. �8
© 2005 WARD’S Natural ScienceAll Rights Reserved
250 W 1405 v.4.10
�0. Electrophoresis is one method of separating molecules. Paper chromatography is another method of separating molecules. Create a Venn diagram showing at least two similarities and two differences between these two methods.
11. Below is a list of the components involved in agarose gel electrophoresis. Briefly describe the purpose of each component.
Agarose gel – the substrate used to separate molecules. Contains microscopic pores that allow smaller molecules to move through faster.
TBE buffer – a liquid buffer that protects the DNA molecules and allows electricity to move through the chamber, driving the molecules across the gel.
Electrophoresis chamber – holds all of the components of the separation. Creates a closed system in which to submerge a gel and apply electrical current.
Power supply – the unit generating the direct current electricity being applied to the chamber.
DNA samples – the substance to be separated. A mixture of differently sized fragments that separate when electricity is applied.
DNA stain – used to stain the gel after electrophoresis. Since DNA cannot be seen with the naked eye, DNA stain is necessary to visualize your DNA fragments.
Copymaster. Permission granted to make unlimited copies for use in any one school building. For educational use only. Not for commercial use or resale. �9
© 2005 WARD’S Natural ScienceAll Rights Reserved
250 W 1405 v.4.10
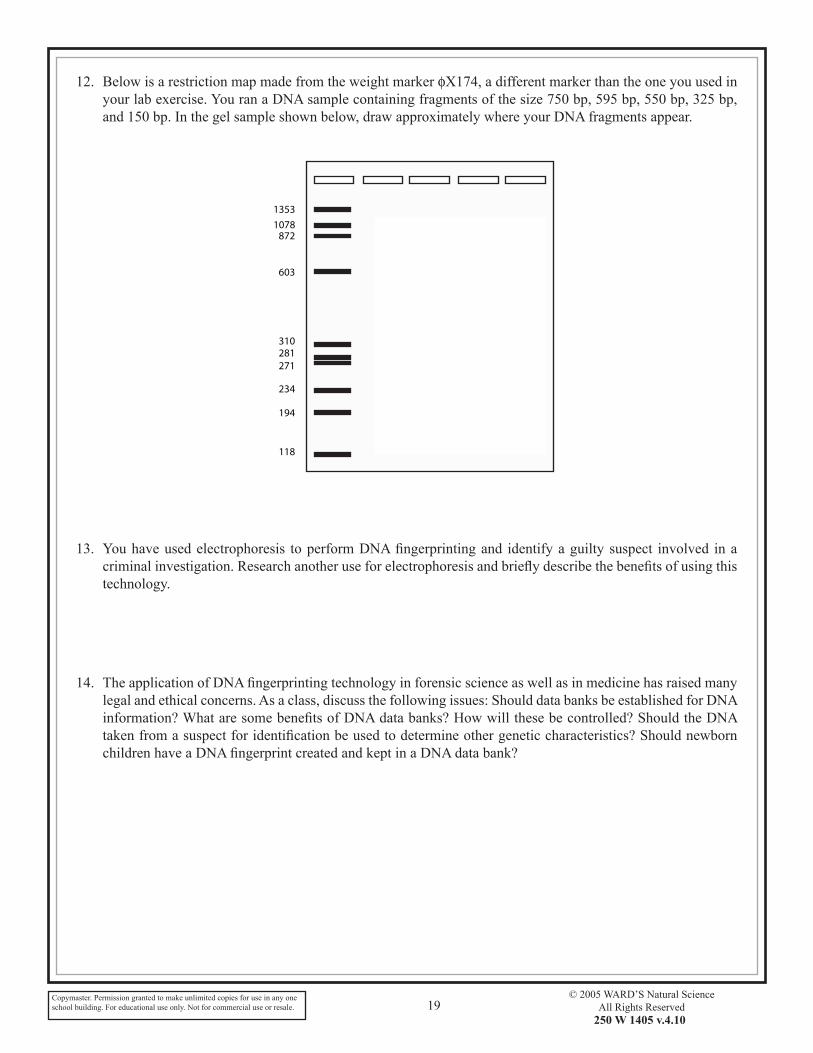
�2. Below is a restriction map made from the weight marker fX��4, a different marker than the one you used in your lab exercise. You ran a DNA sample containing fragments of the size �50 bp, 595 bp, 550 bp, 325 bp, and �50 bp. In the gel sample shown below, draw approximately where your DNA fragments appear.
1353
872
603
1078
234
194
118
271 281 310
750
550 595
325
150
13. You have used electrophoresis to perform DNA fingerprinting and identify a guilty suspect involved in a criminal investigation. Research another use for electrophoresis and briefly describe the benefits of using this technology.
Answers will vary. Students may present topics such as paternity testing, screening for genetic disorders, protein identification, studying evolutionary relationships, genetic engineering, etc.
14. The application of DNA fingerprinting technology in forensic science as well as in medicine has raised many legal and ethical concerns. As a class, discuss the following issues: Should data banks be established for DNA information? What are some benefits of DNA data banks? How will these be controlled? Should the DNA taken from a suspect for identification be used to determine other genetic characteristics? Should newborn children have a DNA fingerprint created and kept in a DNA data bank?
Answers will vary.