DMEO Report No. 233 Evaluation Study on Role of Public ...
149
DMEO Report No. 233 Evaluation Study on Role of Public Distribution System in Shaping Household and Nutritional Security India Government of India NITI Aayog Development Monitoring and Evaluation Office, New Delhi-110001 December, 2016
Transcript of DMEO Report No. 233 Evaluation Study on Role of Public ...

DMEO Report No. 233
Evaluation Study
on
Role of Public Distribution System in
Shaping Household and Nutritional
Security India
Government of India
NITI Aayog
Development Monitoring and Evaluation Office,
New Delhi-110001 December, 2016

Table of Contents
Titled
Page Nos
Preface
i
Executive Summary
ii-viii
Chapter 1. The Targeted Public Distribution System in India 1-14
2. Coverage 15-29
3. PDS Utilisations 30-37
4. Targeting Efficiency 38-44
5. Propensity Score Matching to Evaluate Behaviours of Households with Access to the TPDS and Their Peers
45-58
6. Access to PDS and Dietary Composition 59-71
7. Role of PDS in the Context of Household Income Fluctuations
72-80
8. Policy Implications 81-85
Appendix Tables 86-132
Appendix-II 133
Appendix-III 134
Appendix-IV 135
References 136-139

i
PREFACE
The Public distribution system (PDS) is an Indian food Security System for the poor
people established by the Government of India under the Ministry of Consumer Affairs, Food,
and Public Distribution. While the Central government is responsible for procurement,
storage, transportation, and bulk allocation of food grains, the State governments hold the
responsibility for distributing the same to the consumers through the established network of
approximately 5 lakh Fair Price Shops. Major commodities distributed include wheat, rice,
sugar, and kerosene.
A study on the role of PDS in Shaping the Household and Nutritional Security was
carried out by the erstwhile Independent Evaluation Office, now the Development
Monitoring and Evaluation Office, on a request received from the Ministry of Agriculture,
Government of India. The study was designed with an objective to explore the effectiveness
of PDS in ensuring food and nutritional security to the beneficiaries. The other aspects
explored were efficiency in PDS, importance of foodgrains provided to the beneficiaries,
balancing between cereal and non‐cereal and food and non‐food expenditures, effects of
change in income on food expenditure/consumption patterns, etc.
The study is based on the findings of the India Human Development Survey (IHDS), a
panel survey undertaken jointly by the National Council of Applied Economic Research
(NCAER) and the University of Maryland in 2004-05 (IHDS-I) and 2011-12 (IHDS-II). The goal
of IHDS surveys was to trace changes in the daily lives of Indian households during this
period. The evaluation study was carried out by NCAER on outsourcing basis.
The Chapter 1 and 2 focus on the coverage and targeting of households under TPDS.
Chapter 3 discusses the access and use of TPDS by consumers. Chapter 4 analyses the
efficiency and delivery of TPDS and Chapter 5 describes the methodology used in study.
Chapter 6 explains differences in consumption of different food groups among households
with access to TPDS and comparable households without access to TPDS. Chapter 7 examines
the changes in food expenditure and the intake of cereals and milk for the same households
at two points in time using a fixed effects regressions approach. Chapter 8 concludes the
report by summarizing the results and discussing policy implications.
The study received constant support and encouragement from the CEO, NITI Aayog
and the Director General (DMEO). It is expected that the study findings would help the
implementing Ministry is streamlining TPDS and making it more focused, efficient and
effective in meeting its objectives.
Place: New Delhi C. Angrup Bodh Dated: December, 2016 Adviser (DMEO)

ii
Executive Summary
Study Motivation
It has been observed that even though the Indian economy has achieved remarkable
economic growth along with a decline in poverty over the last two decades,
improvements in nutritional status have not kept pace with this economic growth. The
National Sample Survey (NSS) data also documents that the per capita cereal
consumption steadily declined for both the rural and urban population between 1993-94
and 2011-12. This study examines the reasons for the disjunction between economic
advancement and nutritional improvement in India by analysing the role and
performance of the Public Distribution System (PDS) in determining food consumption
patterns and nutritional outcomes over a period of time. The PDS, conceptualised as one
of the largest safety net programmes in the country, was envisaged as a means of dealing
with nutritional deficiency by supplying rice, wheat, sugar and kerosene at highly
subsidised prices to the poor. It was launched as a universal programme in the context of
food shortages during the early years after Independence. However, since it was widely
criticised for its urban bias, it was subsequently streamlined through the launch of the
Targeted PDS (TPDS) in June 1997, which aimed at providing very poor families access
to foodgrains at reasonably low costs to help them improve their nutrition standards and
attain food security. The National Food Security Act also focuses on providing food
security via expansion of the PDS.
In this context, greater access to subsidised grains for the poor was expected to
reduce malnutrition, leading to a concomitant fall in the number of underweight children.
However, most national level surveys conducted during this period including the
National Family Health Survey-3, Annual Health Survey and District Level Health Survey
did not find any correlation between PDS use and decline in malnutrition. Another
expectation which has been belied is that with a rise in incomes, households would
increasingly buy higher quality grains from the market rather than the PDS shops.
Research findings instead document that rather than declining, PDS use has risen sharply
in both urban and rural areas for the poor as well as the non‐poor. This study explores
these issues in depth and attempts to identify the prevalent food consumption patterns
across socio-demographic groups in the country while linking them to questions of food
security, malnutrition and the economic status of different categories of households.

iii
Using unique panel data from 2004-05 and 2011-12, this study addresses the
following questions:
How far has the PDS achieved targeting efficiency?
Has the role of grains purchased at fair price shops become more or less
important in recent years?
Holding income constant, are households that possess Below Poverty Line (BPL)
and Antyodaya Anna Yojana (AAY) cards more likely to purchase food from fair
price shops than their counterparts with similar incomes?
How does access to PDS shape the balance between cereal and non‐cereal
expenditure, and food and non‐food expenditure?
How do households suffering declining incomes cope with income loss? Is
curtailment in food expenditure one of the ways of coping with poverty?
How do households with rising incomes change their food consumption
patterns? Are these changes similar for households with access to BPL and AAY
cards and those without?
The assessment shows significant qualitative and quantitative changes in the PDS
since its advent in the 1970s. The goal of this report is not to replicate the analyses
arrived at by other data sources such as the NSS but to exploit the unique nature of the
India Human Development Survey that offers information about both incomes and
expenditures for the same households at two points in time.
Methodology
The study is based on the findings of the India Human Development Survey (IHDS), a
panel survey undertaken jointly by researchers from the National Council of Applied
Economic Research and the University of Maryland in 2004-05 and 2011-12. The goal of
IHDS‐I (2004‐05) and IHDS‐II (2011‐12) has been to trace changes in the daily lives of
Indian households in an era of rapid transformation. Therefore, by documenting these
changes in the way people live, work, educate their children, care for their aged parents,
and deal with ill health, these surveys seek to infuse the development discourse with the
lived experiences of ordinary people. IHDS-I and IHDS-II provide a rich empirical
database that is available free of charge to a wide range of researchers in India and
abroad. At present, more than 7000 users have downloaded these data and more than
200 papers and dissertations have been published using them.
This report contains two types of data analyses. First descriptive statistics are
presented to show changes in household use of TPDS in 2004-05 and 2011-12. Second,
multivariate analyses using Propensity Score Matching (PSM) and Fixed Effects
Regressions are presented to ensure that households with and without access to TPDS

iv
subsidies are compared with similar households in cross-sectional data as well as with
their own consumption patterns across the two rounds and thereby hold unobserved
food preferences constant.
The report is organised as follows. Subsequent to the Introduction in Chapter 1,
Chapter 2 focuses on the coverage and targeting of households under the TPDS. Chapter
3 discusses the access and use of TPDS by consumers. Chapter 4 analyses the efficiency
and delivery of the TPDS. Chapter 5 describes the methodology used in matching
households with and without BPL and AAY cards in order to address the role of TPDS in
shaping household food consumption patterns. Using the PSM method, Chapter 6
examines differences in consumption of different food groups among households with
access to TPDS subsidies and comparable households without access to these subsidies.
Chapter 7 examines changes in food expenditure and the intake of cereals and milk for
the same households at two points in time using a fixed effects regressions approach.
Chapter 8 concludes the report by summarising the results and discussing policy
implications. Appendix I provides detailed tables pertaining to the data collected during
the surveys whereas Appendices II and III provide information about the re-contact and
sample attrition rates for IHDS‐I and II while also facilitating an assessment of the quality
of IHDS data.
Key Findings
The findings of the study are briefly elucidated below:
Coverage of TPDS
PDS cards are ubiquitous with households that do not own any card declining from
19 per cent to 14 per cent of the total households between 2004-05 and 2011-12.
Bureaucratic difficulties are seen as being the single most important reason for
households not having a card.
The proportion of households holding Below Poverty Line (BPL) or Antyodaya
Anna Yojana (AAY) cards increased from 36 per cent of all households to 42 per
cent between 2004-05 and 2011-12. Much of this increase comes from expansion
of the AAY programme.
Although BPL and AAY card holders come from the poorer sections of the society,
this concordance is not perfect. The use of the consumption-based poverty line
cut-off suggested by the Tendulkar Committee indicates that only 29 per cent of
the BPL cardholders are poor while 71 per cent are not poor. In contrast, about 13
per cent of the APL cardholders are poor while 87 per cent are not poor. Thus,
many non-poor have BPL cards while some of the poor are excluded from the
ownership of BPL cards.

v
The access of the poor to AAY/BPL cards has improved because of the issuance of
more cards. However, the access of the rich has also improved because the
programme has failed in efficient targeting and an increased proportion of cards
have been distributed to the whole population.
Access and Use of the TPDS
There was a striking rise in PDS use between 2004-05 and 2011-12. In 2011-12,
about 27 per cent of all households purchased cereals from the PDS whereas by
2011-12, this proportion had risen to 52.3 per cent.
Every category of cardholders has recorded a growth in PDS use during the period
under study. While almost all the BPL and AAY cardholders are seen to purchase
PDS grains, as many as 32 per cent of the Above Poverty Line (APL) cardholders
also use the PDS.
Despite the increase in the use of PDS by the purchasing households, the amount
of purchase or the share of PDS grain to the total grain consumed has remained
more or less stable.
PDS use increased not just for food grains but also for kerosene, with 79 per cent
of the PDS card holders purchasing kerosene from PDS shops. Although the use of
kerosene as a primary cooking fuel is negligible, nearly 28 per cent of the
households use kerosene in conjunction with biomass (e.g. firewood) and LPG.
Targeting Efficiency
Exclusion errors in PDS targeting have declined between 2004-05 and 2011-12
while inclusion errors have increased. However, both types of errors remain high.
This change can be attributed both to a decrease in the poverty levels as well as a
slight increase in the number of cards being distributed to the whole population.
Inclusion errors increased across all regions between 2004-05 and 2011-12 and
were particularly high for the Southern states.
While exclusion errors are decreasing, they remain highest for the marginalised
groups.
Use of Propensity Score Matching as an Analytical Technique in the Study
In order to examine if the TPDS is the best way of enhancing food security for all
households, it is important to compare households with access to food subsidies
to those without such access, while holding income constant. However, this is a
difficult proposition due to the general lack of availability of data on household
income.
The India Human Development Surveys I and II contain detailed data on
household income as well as a brief consumption expenditure module that allows
for an analysis of different aspects of consumption.

vi
Since random assignment of the households with and without access to subsidies
via AAY and BPL cards is not feasible, the study uses the Propensity Score
Matching (PSM) technique to compare similar households.
The results show that at any given income level, households with BPL/AAY cards
are far more likely to buy cereals from PDS shops than those that do not have
access to these subsidies.
Role of BPL/AAY Subsidies in Shaping Food Expenditure
Application of the PSM techniques highlights notable distinctions between
consumption patterns of households with BPL/AAY cards and those not
having access to these cards. The results show that at any given income level,
households with BPL/AAY cards are more likely to buy cereals from PDS shops
than those with APL cards. Since only BPL cardholders are eligible for
subsidised cereals, this is not surprising.
The expenditure incurred on food by households with BPL/AAY cards is less
than the corresponding expenditure incurred by their counterparts who do
not have these cards. Once implicit subsidies via PDS transfers are factored in,
this difference is smaller but remains statistically significant.
Households with BPL/AAY cards are ostensibly trying to obtain their caloric
needs from cheaper cereals rather than from more expensive items like dairy,
fruits, nuts and meats.
Rising incomes lead to greater dietary diversification for households without
BPL cards than the matched households with BPL cards.
Role of TPDS in Shaping Food Consumption in the Context of Income Growth/Decline
When the same households are compared over time, the trends in food
expenditure and food consumption vary between households that experience
income growth vis-à-vis those that experience income declines.
Regardless of access to PDS, food expenditure among households that suffer
economic distress does not change substantially, possibly because they
economise in other areas. However, food expenditure for households
experiencing income growth increases. This suggests that food expenditure
has a sticky floor.
Growth in incomes leads to a higher increase in food expenditure by
households without BPL/AAY cards than for those with these cards, even after
implicit food subsidies are taken into account.
While all households experiencing substantial income growth increase their
cereal consumption, this increase is lower for households without BPL/AAY
cards as compared to those with these cards.

vii
The results from the household level fixed effects regression suggest that
income elasticity for cereal consumption is small but positive, though it is
greater for households owning BPL cards than for those without these cards.
Rising income is more likely to increase milk consumption in households
without BPL/AAY cards than in those with these cards, suggesting that higher
incomes coupled with the absence of subsidies on cereals lead to greater
dietary diversification.
Apart from the specific findings detailed above, the study also indicates that the
TPDS became better targeted between 2004-05 and 2011-12, due to a sharp decline in
the errors of exclusion, though errors of inclusion persist with many economically better-
off households continuing to derive benefits under the TPDS. While the access of the poor
improved because of the issuance of a higher number of AAY/BPL cards, the access of the
rich also improved due to inefficiency in targeting. Moreover, many households
continued to retain the BPL cards they had been issued earlier despite having moved out
of poverty after economic growth.
A comparison of the same households between 2004-05 and 2011-12 highlights a
differential impact of the TPDS on household food consumption by households that suffer
economic distress as opposed to households that experience income growth. Households
witnessing a per capita income decline of 20 per cent or greater in constant terms seem
to use the TPDS to stabilise their consumption and maintain at least some degree of
dietary diversity. When faced with adversity, households increase their use of the PDS to
try and keep their food consumption habits constant. In contrast, households whose
incomes remain stable or register a sharp increase seem to use the TPDS as a way of
obtaining cheaper calories, thereby investing less in increasing dietary diversity than
they would possibly have done in the absence of food subsidies.
Theoretically, food subsidies are expected to have two types of effects. As
households try to balance their various needs including ensuring adequate caloric
consumption, augmenting the quality of their diets, improving their living conditions, and
investing in the health and education of household members, the TPDS may change their
calculations. For households that value dietary diversity, being able to buy cheap cereals
will free up money to purchase other foods such as milk, fruits, nuts, and perhaps eggs
and meat (the income effect). For households that have other dominating consumption
needs, the money saved by purchasing subsidised cereals may be devoted to those needs
and diverted from food expenditure (the substitution effect). Which effect dominates
remains an empirical question. The findings of this study suggest that the substitution
effect dominates with households holding BPL/AAY cards acquiring more of their
calories from cereals and not increasing investments in other food groups by the same
level as non-BPL households.

viii
The results presented in this report thus paint a complex picture of the TPDS
programme. While on the one hand, the rising proportion of the Indian population relying
on the TPDS for procuring subsidised cereals points to the ubiquity of the TPDS, it also
has alarming implications in terms of skewing the dietary composition of households by
increasing their cereal consumption. This poses a critical problem particularly for a
society facing an epidemiological transition from the dominance of communicable
diseases to the rise in non-communicable diseases (NCDs) like cardiovascular diseases,
strokes, diabetes and cancer, the four leading NCDs in India. The country also has the
highest number of people with diabetes in the world, and this burden has been rising over
time, which is why it is sometimes referred to as the ‘diabetic capital of the world’. At least
some of this increase in the occurrence of the disease could be due to the rising
consumption of processed foods and refined foodgrains as unprocessed foods and
healthier cereals like small millets are considered inferior foods that households abandon
as they get rich.
Cash Transfers—A Way Forward?
Although this report does not directly examine the role of cash transfers, the results
arrived at have substantial implications for the discourse about cash transfers, which
could help prevent skewing the household consumption of cereals by depressing prices.
However, their success would depend on the effective administration of the transfers and
reduction in leakages. Moreover, the impact of cash transfers on grain markets cannot be
predicted. Thus, while theoretically, cash subsidies instead of in-kind subsidies via the
PDS could enhance dietary diversity, it may be more prudent to initially implement a cash
transfer programme in only a few districts, particularly those exhibiting diverse food
habits and market infrastructure before engaging in the massive transformation of the
PDS.

1
1. The Targeted Public Distribution System in India
1.1 Income, Food and Nutrition Puzzles: Study Motivation
Almost all observers agree that the Indian economy has experienced tremendous
economic growth and decline in poverty over the past two decades (Bhagwati and
Panagariya, 2012; Dreze and Sen, 2013). However, this transformation has not been
matched by improvements in nutritional status (Desai et al. 2016). This disjunction is
reflected in a number of puzzles.
1.1.1 Rising incomes and declining cereal consumption
The National Sample Survey (NSS) data, presented in in Table 1.1, documents that
between 1993-94 and 2011-12, the per capita cereal consumption declined steadily for
both the urban and rural population (National Sample Survey Office, 2014). In view of the
steady decline in poverty over this period, the decline in cereal consumption is puzzling.
Caloric consumption also seems to have fallen. As suggested by Deaton and Dreze (2009),
disaggregated analysis shows that most of this decline took place at the upper income
levels, which may be due to a reduction in physical activity and the resultant caloric
demands.
Table 1.1: Per capita cereal consumption per month (in kg.)
1993-94 1999-2000 2004-05 2009-10 2011-12
Rural 13.4 12.7 12.1 11.4 11.2
Urban 10.6 10.4 9.9 9.4 9.3
Source: National Sample Survey (2014, p. 40).
1.1.2 Sharp poverty decline, modest improvement in undernutrition
Although we must rely on the National Family Health Survey of 2005-06 (International
Institute for Population Sciences and Macro International, 2007) for national data on
nutrition, the results from a variety of other surveys suggest only a modest improvement
in the proportion of underweight children. Table 1.2 plots the poverty decline against
trends in underweight children from the National Family Health Surveys 1, 2 and 3;
surveys from the National Institute of Nutrition (National Nutrition Monitoring Bureau,
2012) and those from the National Council of Applied Economic Research and University
of Maryland (Thorat and Desai, 2016). This graph shows a steady but modest

2
improvement in undernutrition against a sharp drop in poverty. Recently released fact
sheets for National Family Health Survey 2015-16 for a selected number of states show a
continuation of this trend.
Table 1.2: Changes in Poverty and Underweight children for children under 5
since the 1990s
Poverty Rate
NFHS Underweight
NNMB (Rural) Underweight
IHDS Underweight
1990s 45.3 43.0 48.6 -
2000s 37.2 40.0 - 40.6
2010s 21.9 - 41.1 37.2 Sources: NSSO 2014; IIPS and Macro 2.
1.1.3 Declining poverty, increasing use of the Public Distribution System
The Public Distribution System (PDS) is one of the largest safety net programmes in India,
set up to provide subsidised grains to the poor. Although it began as a universal
programme in the context of food shortages in the early years of the nation, since 1997 it
has been targeted towards the poor, providing rice, wheat, sugar and kerosene at highly
subsidised prices to the poor, although households above the poverty line may also access
PDS at economic cost. It is generally assumed that as incomes rise, households will buy
higher quality grains from the market rather than the PDS shops. Market purchase also
offers greater convenience through shops that are open for longer hours and do not have
queues. However, as Figure 1.1 shows, instead of declining, PDS use has risen sharply in
both urban and rural areas for the poor as well as the non-poor (Himanshu and Sen,
2013a). Figure 1.1 presents only data for cereal purchase but the proportion of
households purchasing other food items from PDS shops, including sugar, has also risen.

3
Figure 1.1: Per cent population purchasing cereals from PDS (NSS 61st and 68th
Rounds)
Source: Himanshu and Sen (2013a).
1.1.4 Increase in the use of PDS is not correlated with a decline in malnutrition
It would be reasonable to expect that greater access to subsidised grains would lead to a
decline in malnutrition but when we juxtapose the data on PDS use from the NSS with the
decline in the proportion of underweight children from the National Family Health
Survey 3 (NFHS 3) and the Annual Health Survey (AHS) conducted by the Office of the
Registrar General of India and the District Level Health Survey (DLHS) conducted by the
International Institute of Population Sciences in Table 1.3, it is difficult to find any
correlation between the two. Judging by the comparison between NFHS-3 of 2005-06 and
either AHS or DLHS, circa 2012-14, the state of Chhattisgarh, where the PDS is extremely
efficient, shows only a decline of 7 percentage points in the proportion of underweight
children as compared to Jharkhand, where the decline is 11 percentage points in spite of
the prevalence of a relatively less efficient PDS. Judging by these two data sources, Tamil
Nadu recorded a tiny decline in undernutrition in spite of the availability of a rice
subsidy. At the household level also, a comparison of similar households with and
without TPDS subsidy shows no difference in child undernutrition (Desai and Vanneman,
2015).
24.8
15.4
50.0
30.7
0.0
10.0
20.0
30.0
40.0
50.0
60.0
Rural Urban
% o
f P
op
ula
tio
n b
uy
ing
fro
m P
DS
2004-05 2011-12

4
Table 1.3: Percentage of children under the age of five years classified as malnourished
according to indices of nutritional status: height-for-age and weight-for-age, by state
% Households using PDS % Children Underweight
NSS
2004-05
NSS
2011-12
%age
point
improvem
ent in PDS
use
IHDS-I
(2004-
05)
IHDS-II
(2011-
12)
NFHS-3
(2005-
06)
DLHS-
4/AHS
(2012-
14)
%age point
improvem
ent NFHS-3
to
DLHS/AHS
Andhra Pradesh 58.5 76.1 17.6 33.4 40.1 32.5 28.1 4.4
Assam 8.4 52.7 44.3 50.3 46.6 36.4 30.8 5.6
Bihar 1.9 42.7 40.8 54.8 41.4 55.9 40.3 15.6
Chhattisgarh 24.2 57.5 33.3 27.6 38.7 47.1 39.4 7.7
Delhi 5.7 12.3 6.6 48.5 31.9 26.1
Gujarat 25.5 22.7 -2.8 49.9 37.5 44.6
Haryana 4.3 16.2 11.9 29.6 28.5 39.6 36.2 3.4
Himachal Pradesh 51.6 89.5 37.9 28.4 26.6 36.5 28.5 8.0
Jammu & Kashmir 39.5 79.6 40.1 10.9 18.2 25.6
Jharkhand 5.5 29.6 24.1 48.8 51.5 56.5 45.7 10.8
Karnataka 50.0 63.1 13.1 34.7 32.6 37.6 29.7 7.9
Kerala 39.7 81.9 42.2 24.5 23.2 22.9 20.9 2.0
Madhya Pradesh 20.8 36.6 15.8 50.9 49.5 60.0 40.6 19.4
Maharashtra 22.1 33.1 11.0 38.2 39.1 37.0 38.7 -1.7
Orissa 18.6 63.3 44.7 44.0 39.3 40.7 38.9 1.8
Punjab 0.5 19.8 19.3 20.1 21.4 24.9 25.2 -0.3
Rajasthan 10.2 25.4 15.2 33.5 34.4 39.9 36.6 3.3
Tamil Nadu 72.7 87.1 14.4 32.5 29.7 29.8 32.5 -2.7
Uttar Pradesh 5.7 25.4 19.7 45.0 39.6 42.4 44.9 -2.5
Uttarakhand 21.0 69.0 48.0 45.6 32.8 38.0 28.0 10.0
West Bengal 13.2 44.6 31.4 47.5 32.1 38.7 37.4 1.3
All India 22.4 44.5 22.1 41.9 37.4 42.5
Sources: NFHS and DLHS-IV/AHS data from published reports; NSS PDS use data from Himanshu and Sen
(2013a), IHDS data on underweight children, authors' calculations.
*The IHDS state samples are very small and hence the results should be treated with great caution. The
IHDS-I sample for underweight children is only 5,630 children aged 0-5 years and the IHDS-II sample is
10,555.
The disjunction between economic growth, food consumption and nutritional
outcomes motivates the present study.

5
1.2 Food Security and Nutritional Security
The National Food Security Act primarily focuses on providing food security via
expansion of the PDS. However, the extent to which this would lead to nutritional security
depends on how households respond to the availability of cheap cereals.
Figure 1.2: Competing impacts of cereal subsidies
Source: Authors description for this report.
Figure 1.2 outlines two potential effects that PDS subsidies may have on
household consumption decisions. Households continually try to balance their various
needs including ensuring adequate caloric consumption, enhancing the quality of their
diets, improving living conditions and investing in the health and education of household
members. For households that value dietary diversity, being able to buy cheap cereals
will free up money to purchase other foods such as milk, fruits, nuts, and perhaps eggs
and meat (income effect). For households that have other dominating consumption
needs, money saved by purchasing subsidised cereals may be devoted to those needs and
diverted from food expenditure (substitution effect). Which effect dominates remains an
empirical question.
The issue of dietary diversity has received little attention in Indian policy
discourse until recently (Bhargava, 2014; Gaiha et al. 2014). However, this is an issue that
deserves considerable attention as India approaches an epidemiological transition with
Cheap Rice & Wheat
Substitution Effect
More calories from Cereals
Less calories from fruits/milk
Income Effect
Same amount of cereal
consumption
Savings used for milk & fruit

6
the increasing incidence of non-communicable diseases (NCDs). Although communicable
diseases remain dominant in the country, the prevalence of NCDs is rising. Cardiovascular
diseases, strokes, diabetes, and cancer are the four leading NCDs in India (Upadhyay,
2012). India has the highest number of people with diabetes in the world (Ghaffar, Reddy,
and Singhi, 2004) and this burden has been rising over time (Kaveeshwar and Cornwall,
2014), which is why it is often referred to as the ‘diabetic capital of the world’ (IDF, 2009).
At least some of this increase in the occurrence of the disease could be due to the rising
consumption of processed foods and refined foodgrains (Mohan et al., 2010) as
unprocessed foods and healthier cereals like small millets are considered inferior foods
that households abandon as they get rich.
Ironically, increasing incomes have not led to improving diets. Studies of dietary
diversity document declining diversity over time (Gaiha et al., 2014), anaemia remains
prevalent at almost all income levels (International Institute for Population Sciences and
Macro International, 2007), and the proportion of individuals suffering from NCDs has
grown even as India has experienced a surge in economic growth.
This issue is particularly critical for India since there is some possibility that either
genetic factors or their traditional carbohydrate-based diets make Indians more
susceptible to cardiovascular diseases and diabetes. South Asian populations living
abroad, particularly in Europe and the United States, have shown very high rates of
diabetes, high blood pressure and heart conditions (Gunarathne et al., 2009; Gupta et al.,
2011). The rates of coronary heart disease have been reported to be unusually high in
several parts of the world among people originating from the Indian subcontinent
(McKeigue, Miller, and Marmot, 1989). A UK study showed that men and women from
India had the highest standardised mortality rates due to cardiovascular diseases, and
that young Indian men were at particularly high risk of contracting these diseases
(Balarajan et al., 1984). The cardiovascular mortality of South Asian migrants was also
seen to increase with the duration of residence in England and Wales, presumably as
these migrants became richer (Harding, 2003). Indian immigrants in the United States
show a higher prevalence of diabetes and a number of related chronic diseases such as
hypertension and cardiac conditions (Bhopal, 2000; Shah et al., 2015), possibly due to the
increased consumption of processed carbohydrates facilitated by increasing incomes.
Thus, it is important to examine the extent to which the availability of subsidised
cereals affects dietary diversity.

7
1.3 Study Goals
Using data from the India Human Development Survey of 2004-05 and 2011-12, this
study addresses the following questions:
1. What is the targeting efficiency of the PDS?
2. Has the role of grains purchased at fair price shops become more or less
important in recent years? Rising incomes may reduce reliance on PDS, whereas
in contrast, rising food prices may spur PDS usage. Thus, evaluating the role of
the PDS in the food baskets of families at various income levels remains an
empirical priority.
3. Holding income constant, are households with BPL and Antyodaya cards more
likely to purchase food from fair price shops? How does access to PDS shape the
balance between cereal and non-cereal expenditure, and food and non-food
expenditure?
4. Do rising incomes translate into greater food consumption? Are households with
growing incomes likely to shift from cereal to non-cereal foods?
5. How do households with declining incomes cope with income loss? Do they
curtail food expenditure?
1.4 India Human Development Surveys I and II
This study relies on data from the India Human Development Survey of 2004-05 and
2011-12. The IHDS-I (2004-05) and IHDS-II (2011-12) constitute a collaborative
research programme between researchers from the National Council of Applied
Economic Research (NCAER) and the University of Maryland. The goal of IHDS is to
document changes in the daily lives of Indian households in an era of rapid
transformation. In documenting changes in the way people live, work, educate their
children, care for their aged parents, and deal with ill health, these surveys seek to infuse
the development discourse with the lived experiences of ordinary people. These surveys
provide a rich empirical database that is available free of charge to a wide range of
researchers in India and abroad, providing data for informed policy debates. At present,
more than 7000 users have downloaded these data and more than 200 papers and
dissertations have been published using them.
IHDS-I is a nationally representative survey of 41,554 households conducted in
2004-05. IHDS-II has re-interviewed 83 per cent of the original households as well as split
households residing within the same locality and an additional sample of 2134
households. This takes the sample size for IHDS to around 42,152 households. The sample

8
is spread across 33 (now 34) states and Union Territories and covers rural as well as
urban areas. Most of the IHDS-I interviews were conducted between October 2004 and
December 2005 while most of the IHDS-II interviews were conducted between October
2011 and December 2012.
India has a long and distinguished history of survey research starting with the
1950s. However, most national surveys are single-focus surveys, making it difficult to
study inter-relationships between different aspects of human development. Moreover,
these cross-sectional surveys only allow for snapshots of society at different points in
time. Repeatedly interviewing the same households allows for a richer understanding of
which households are able to partake in the fruits of growth, what allows them to move
forward, and the process through which they are incorporated in or left out of a growing
economy.
IHDS-I and IHDS-II collected extensive data on education, health, livelihoods,
family processes as well as the way in which households are embedded in a broader social
structure. Contextual information was also collected in surveys of village infrastructure
and markets, and from one private and one government school and medical facility in
each village/block. The data that are of greatest use in this report include data on income
and expenditure. The income data are based on nearly 56 sources of income inclusive of
wage and salary incomes, self-employment incomes from farms and businesses, and
incomes from public and private transfers. The consumption expenditure module mimics
the short consumption expenditure module used by the National Sample Survey
Organisation in their employment-unemployment surveys and includes purchases of
cereals, sugar and kerosene from both PDS and non-PDS sources.
The IHDS fieldwork, data entry and analyses have been funded through a variety
of sources including the US National Institutes of Health, UK Department of International
Development (DFID), The Ford Foundation, Poorest Area Civil Societies (PACS) Initiative,
The World Bank and International Research Development Centre (IRDC), Canada.
Logistical support for this work was provided by The Planning Commission. Throughout
this work, IHDS has been guided by an advisory panel chaired by Dr Pronab Sen,
Chairman, National Statistical Commission, and consisting of eminent Indian researchers,
policy makers and representatives of several government ministries. A detailed
description of the IHDS sample and assessment of IHDS data quality is provided in
Appendices II and III.

9
1.5 Targeted Public Distribution System
Of all the safety net operations in India, the most far-reaching is the public distribution
system (PDS). The PDS provides basic items such as rice, wheat, sugar, and non-food
items such as kerosene in rationed amounts at below-market prices. The programmes
originated during the early period after Independence, when food shortages necessitated
large imports of food under the PL-480 grants from the United States. A large network of
PDS shops, also known as Fair Price Shops, was established: local traders were enrolled
as owners, and each household was issued a PDS card with monthly per capita
entitlements of food staples. The programme continued with indigenous public resources
even after the PL-480 programme ceased to exist when India’s food production
improved. According to the annual report of the Department of Food and Public
Distribution, a network of about 5.21 lakh Fair Price Shops (FPS) distributed subsidies
worth Rs 98,979.52 crore in 2014-15 from the Centre (Department of Food and Public
Distribution, 2015).
The PDS has changed both qualitatively and quantitatively since the 1970s. At
first, the PDS was confined to urban areas and regions with food deficits. The main
emphasis was on price stabilisation. Private trade was considered exploitative, and the
PDS was considered a countervailing power to private trade. Since the early 1980s, the
welfare role of the PDS has gained importance. Nevertheless, the PDS was widely
criticised for its failure to reach those living below the poverty line (BPL), that is, for
whom the programme was intended. Although rural areas were covered in many states
in the 1980s, the PDS had an urban bias and large regional inequalities in its operation.
An effort was thus made to streamline the PDS by introducing the Targeted Public
Distribution System (TPDS) in June 1997. The objective was to help very poor families
buy food grains at a reasonably low cost to enable them to improve their nutrition
standards and attain food security. The new system followed a two-tier subsidised
pricing structure: one for BPL families, and another for Above the Poverty Line (APL)
families. The Union Budget 2000-011 announced a monthly allocation of 25 kg of
foodgrains to about 60 million BPL families under the TPDS. The issue price of foodgrains
for BPL families was initially fixed at 50 per cent of the economic cost that the APL
families pay. All prices are revised by the Food Corporation of India (FCI) from time to
time, and the states may offer further subsidies. The total food subsidy (including that
offered by programmes other than the PDS) has significantly increased in real terms over
the years.
In order to target the TPDS more towards the poor, the Antyodaya Anna Yojana
(AAY) was launched in December 2000. This scheme sought to identify the 10 million

10
poorest of the BPL families and to provide each of them with 25 kg of foodgrains per
month at a fixed price of Rs 2 per kg for wheat, and Rs 3 per kg for rice.
The TPDS operates through a coordinated system between the Centre and the
state governments wherein the Centre is responsible for setting the Minimum Support
Prices (MSP) for foodgrains bought from the farmers and allocates this purchase among
the states at the Central Issue Price (CIP). The allocation of foodgrains for BPL quota to
the states/UTs is made on the basis of the poverty estimates from 1993-94 and
population size of 2001. Allocation for the APL quota, on the other hand, is subject to
availability.
The Centre, however, does not choose the actual beneficiaries, as this is in the
domain of state governments, which identify the poor and distribute the foodgrains
through a network of over five lakh fair price shops (FPSs). Nonetheless, state policies on
the PDS can differ. For instance, Tamil Nadu has a universal PDS; Chhattisgarh has its own
legislation called the Chhattisgarh Food Security Act 2012, which categorises
beneficiaries as AAY, priority, and general, similar to the National Food Security Act
(2013); while Gujarat follows the Central schemes and classifies beneficiaries as AAY, BPL
and APL.
Ration cards are also used as proof of residence and BPL cards are particularly
valuable for accessing other benefits like free LPG connections and medical health
insurance. Under the Rashtriya Swasthya Bima Yojana (RSBY) launched by the Ministry
of Labour and Employment, Government of India, BPL cardholders are entitled to
hospitalisation coverage of up to Rs 30,000 with pre-existing conditions also being
covered. State governments offer additional benefits to BPL cardholders, which may
differ from state to state. For instance, in Delhi, under the Swaran Jayanti Shahari Rozgar
Yojana (SJSRY), the government provides loans to the unemployed to set up gainful self-
employment of up to Rs 50,000 with a subsidy component of 15 per cent of the project
cost.
1.5.1 (Over) Identification of the poor
The Central Government identifies the BPL households by using the 1993-94 poverty
estimates of the Planning Commission. The identification of the poor under the scheme is
done by the states as per the state-wise poverty estimates of the Planning Commission
for 1993-94, which are derived using the methodology of the “Expert Group on estimation
of proportion and number of poor” chaired by Late Professor Lakdawala. The Ministry of
Rural Development provides the criteria for classification based on the BPL Census of
2002. Until recently, BPL cards were given on the basis of a list prepared during the BPL
survey of 2002, though many states have added their own criteria and expanded the BPL
list. Over the last two years, some states have begun to re-issue BPL cards (now usually

11
called Priority Household Cards) using the recently conducted Socio-Economic and Caste
Census (SECC), but this practice has not yet been extended to the entire nation and does
not affect the periods being examined in this report, that is, 2004-05 and 2011-12.
Poverty levels have been falling since then and the Planning Commission released
poverty estimates in 2004-05 and 2011-12 following the new methodology suggested by
the Tendulkar Committee (see Table 1.4). Some part of the over-identification of the poor
and targeting leakages under TPDS in 2011-12 is because of the misclassification of those
who now are non-poor but are still identified as poor by the government. As seen in
Chapter 4, this has led to significant inclusion errors (mis-classification of the non-poor
as poor).0F
1
Table 1.4: Poverty estimates
Years Planning Commission IHDS
1993 45.3 N/A
2004-05 37.2 38.4
2011-12 21.9 21.3
Sources: Planning Commission (2013); IHDS surveys 2004-05 and 2011-12 using
poverty lines established by the Tendulkar Commission.
1.5.2 Beneficiary categorisation
The PDS cards essentially entitle the identified beneficiaries in the AAY, Annapurna, BPL
and APL categories to purchase foodgrains (rice, wheat, coarse cereals), sugar, kerosene
and a few other items at subsidised costs.
The beneficiaries under the TPDS fall under two main categories: BPL households,
and APL households. The Planning Commission calculates the state-wise estimates of
those to be covered under the TPDS while the state governments identify the BPL
households. The Antyodaya Anna Yojana (AAY) was introduced in 2000 and targets the
poorest among the poor of the BPL households. The IHDS surveys indicate that access of
the poor to AAY/BPL cards has improved as more cards were given out. However, the
access of the rich also increased as the programme was not well targeted and more cards
were given out to the population as a whole.
In addition to the BPL, APL and AAY categories, the Annapurna scheme launched
on April 1, 2000, for senior citizens makes the destitute citizens not covered under the
1 The Saxena Report (2009), constituted to advise the Ministry of Rural Development on the methodology for conducting the BPL Census for the Eleventh Five Year Plan also reports a similar finding.

12
National Old Age Pension Scheme (NOAPS) or State Pension Schemes eligible to receive
10 kg of foodgrains free of cost.
1.5.3 Rising food subsidies
The TPDS offers food security at highly subsidised prices. The food subsidy is the
difference between the Central Government’s cost price, which includes the MSP for
crops purchased from the farmers, transportation and handling cost (called the economic
cost), and its selling price, which is the CIP. The food subsidy has been increasing over the
years from Rs 23,793 crores in 2004-05 to Rs 72,371 crores in 2011-12 (Table 1.5), and
is estimated to be Rs 1,07,824 crores in 2014-15.1F
2 In 2011, almost two-thirds of the food
subsidy bill was spent on AAY/BPL beneficiaries.
Table 1.5: Scheme-wise food subsidy under various welfare schemes
(Rs in Crore)
Scheme 2009-10 2010-11 2011-12
Total Subsidy 58242 62930 72371
Scheme-wise Subsidy Antyodaya Anna Yojana (AAY) 14224 14083 15486
Above Poverty Line (APL) (Including Special Additional) 12595 15875 16191
Below Poverty Line (BPL) 19564 20385 30571
Targeted Public Distribution System (TPDS) 46383 50343 62248
Mid-Day Meal (MDM) 3087 2849 2703
Other Welfare Schemes 1765 1473 1512
Source: Lok Sabha unstarred question No. 775, dated 14.08.2012.
However, as has been found in several studies and reports, the subsidies on food have not
been well targeted and there have been significant leakages, though these appear to be
declining in recent years. The leakage was estimated to be around 54 per cent in 2004-
05 though it declined to 44 per cent in 2007-08 (Khera, 2011). Much of this leakage seems
to be concentrated in the APL category. Using both the NSS and IHDS data, Dreze (2015)
finds that APL leakages were 67 per cent, using NSS (2011), and 56 per cent using IHDS
(2011), while the BPL leakages for the two surveys were at 30 per cent and 21 per cent,
respectively (Dreze, 2015). Chapter 4 discusses in detail the efficiency issues that arise in
the functioning of the TPDS in its current form.
2 Economic Survey, Volume I, 2015.

13
1.5.4 Right to food under the National Food Security Act of 2013
The National Food Security Act (NFSA) 2013 envisages to provide subsidised foodgrains
to over two-thirds of India’s population. It will be the world’s largest food security
scheme. It comes at a significant monetary cost though there is no consensus on the
estimate. The annual cost of NFSA is estimated at Rs 1.3 lakh crores per year (Sinha,
2013), at Rs. 1 lakh crores per year (Khera, 2012), and at Rs 6.8 lakh crores over the next
three years, or Rs 2.3 lakh crores per year (Gulati, Gujral, and Nandakumar, 2012). At the
top end, Surjit Bhalla has estimated the cost at an even higher level at Rs 3 lakh crores or
3 per cent of GDP per year (Bhalla, 2013), whereas Prachi Mishra made a far more
conservative estimate of the cost in 2013-14 at Rs 44,411 to Rs 76,486 crores (Mishra,
2013). The vastly differing estimates of the cost of NFSA are due to the different
methodologies used for calculating leakages, the agricultural production costs, and other
costs related to transportation and storage.
Noting that the leakages from the TPDS ranged from 40 to 50 per cent, even going
up to 70 per cent in some states, the Shanta Kumar Committee (Government of India,
2015) recommended that the Government of India should defer the implementation of
the NFSA in states that have not set up end-to-end computerisation, have not put up the
beneficiaries online for anyone to verify, and have not set up vigilance committees to
check pilferage from the PDS. In addition, the Committee also recommended that the
coverage under NFSA should be 40 per cent as against the present 67 per cent and that
alternative mechanisms to TPDS for making cash transfers could potentially be more
effective as well as save subsidy costs of up to Rs 30,000 crores a year.
However, there are mixed reviews of whether or not cash transfers will improve
food security. Using the NSSO 2011-12 survey, Ashok Gulati and colleagues (Gulati and
Saini, 2015) make a strong argument for shifting the support to the poor from a highly
subsidised price policy to an income policy of cash transfers through the Jan-Dhan Yojana
and dovetailing the Unique Identification (UID) or the Aadhaar scheme as almost half of
the grain allotted for the TPDS does not reach the beneficiaries due to inefficient
targeting. There is a legitimate concern about cash subsidies being used for other
expenditures besides food consumption but results from two randomised controlled
trials that provided unconditional cash transfer to a group of households (Gangopadhyay,
Lensink, and Yadav, 2012; Sewa Bharat, 2013), find that an unconditional cash transfer
does not lead to a decline in food security, but provides opportunities for households to
shift to other nutritious options in the non-cereal segment. Interestingly, if the PDS
system is functioning well, it is found that the poor prefer in-kind food transfers to cash
transfers. Based on a household survey conducted in May–June 2011 and covering more
than 1,200 rural households across nine Indian states, Ritika Khera found that over two-
thirds of the respondents expressed a preference for food instead of cash transfers
(Khera, 2013).

14
The TPDS prevalent at the time of the IHDS 2011-12 survey and the NFSA 2013
differ in some significant respects (Balani, 2013). The TPDS has been set up under an
administrative order and has no legal backing whereas the NFSA provides statutory
backing to the right for food. The beneficiaries under the TPDS were categorised as AAY,
BPL or APL, whereas under the NFSA, the beneficiaries would be categorised as AAY,
priority, and excluded. The entitlements under both schemes also vary. The AAY
beneficiaries would continue to get 35 kg/household/month under both schemes.
However, while the BPL households were getting 35 kg/household/month under the
TPDS, the “priority” category under the NFSA will be getting 5 kg/person/month. Unlike
the TPDS, where the cost of foodgrains was different for different categories of
beneficiaries, under the NFSA, the cost of foodgrains would be the same for all categories
at Rs 3/kg for rice, Rs 2/kg for wheat, and Re 1/kg for coarse grains, although this may
be revised every three years. In this report, we focus on data collected during 2011-12
preceding the enactment of the NFSA, allowing us to sidestep the complexities associated
with modelling differential implementation of the NFSA across states and providing a
baseline assessment against which future studies can be carried out in the post-NFSA
period.
1.6 Structure of This Report
This report analyses the impact of the PDS on household well-being using data from the
India Human Development Surveys (IHDS) I and II, carried out in 2004-05 and 2011-12,
respectively. The following chapters explore in detail the data collected during the two
rounds of the IHDS surveys. Chapter 2 focuses on coverage and targeting under the TPDS.
Chapter 3 discusses the access and use of TPDS. Chapter 4 analyses the efficiency of the
TPDS. Chapter 5 describes Propensity Score Matching (PSM), the primary analytical
technique used in this report, and assesses the quality of matching. Chapter 6 applies PSM
to examine differences in consumption patterns between households with access to TPDS
subsidies and comparable households without access to these subsidies. Chapter 7
examines changes in food expenditure and the intake of cereals and milk for the same
households at two points in time using a fixed effects regressions approach, and Chapter
8 summarises the results to discuss policy implications. Appendix I provides detailed
tables while Appendices II and III provide information about re-contact and sample
attrition for IHDS-I and II as well as assessment for the quality of IHDS data.

15
2. Coverage
Key messages
PDS cards are ubiquitous as there are very few households that do not have PDS cards.
The proportion of cards with the AAY/BPL households has grown between the two
survey periods, viz. 2004-05 and 2011-12.
The proportion of households with BPL and AAY cards is quite large. This proportion is
larger than the proportion of the poor based on the NSS.
Poverty ratios have been decreasing but the number of those holding AAY/Annapurna
and BPL cards has been increasing.
Supply chain leakages as well as leakage due to inclusion are both found to be quite high
in 2004-05 as well as 2011-12.
The access of the poor to AAY/BPL cards improved because more cards were handed
out. However, the access of the rich also improved because the programme did not
become better targeted and the increased cards were distributed to the whole
population.
2.1 Introduction
In order to access the PDS, households must first acquire a card which lists the number of
household members included on the card and the place of residence for the cardholder. The
card also identifies the household as Above Poverty Line (APL), Below Poverty Line (BPL)
or Antyodaya Anna Yojana (AAY) category. Difficulties in accessing PDS may begin with
difficulties in obtaining a card, particularly for households that have newly migrated and may
not be able to provide proof of residence. In this chapter we examine households’ access to
PDS cards.
2.2 PDS Cards Are Ubiquitous
The coverage of the PDS increased from 83.3 per cent of the households in 2004-05 to
86.1 per cent of the households in 2011-12. Over this period, the proportion of those
using AAY/Annapurna cards and BPL cards grew from 2.5 per cent to 6 per cent for

16
AAY/Annapurna cards and from 33.7 per cent to 35.7 per cent for BPL cards.
Simultaneously, the number of those using APL cards decreased from 47.1 per cent to
44.5 per cent and the number of those with no cards decreased from 16.7 per cent to 13.9
per cent during this period (Figure 2.1). In comparison, using the NSSO 2011-12 Round,
Rahman (2014) finds a slightly higher percentage of beneficiaries for BPL cards at 37.9
per cent and a slightly lower percentage for APL cardholders at 42.3 per cent.
Figure 2.1: Distribution of cards under different categories in 2004-05 and 2011-12 (in per
cent)
Source: Authors’ calculations from IHDS data.
Not unexpectedly, there is a wide regional spread in coverage. In the hill region and the
South, there is close to full coverage with 94 per cent and 93.2 per cent of the households
having a PDS card. In contrast, in the North central region, only 78.7 per cent of the
households have a PDS card (Figure 2.2).
36.2
41.7
47.144.5
16.7
13.9
0
5
10
15
20
25
30
35
40
45
50
2004-05 2011-12 2004-05 2011-12 2004-05 2011-12
BPL/AAY/Annapurna APL No card

17
Figure 2.2: Region-wise distribution of cards (in per cent)
Source: Authors’ calculations from IHDS data.
2.3 Bureaucratic Difficulties Seen as Singular Reason for Not
Having a Card
The percentage of households not having a card decreased between the two survey
periods from 16.7 per cent to 13.9 per cent (Figure 2.3). Of those not having a card, close
to 43 per cent of the respondents in 2004-05 and 47 per cent in 2011-12 cited
“bureaucratic difficulties” as being the major reason for not having it. The proportion of
those who reported “not needing” a card increased from 9.3 per cent to 13.5 per cent over
this period. Bureaucratic difficulties are seen to be experienced the most by the least
developed villages and the least by college graduates and rich households.
Bureaucratic difficulties are also seen to be a major impediment in obtaining
ration cards in the northern, central and eastern regions with over 50 per cent of the
beneficiaries reporting this as a major problem. In contrast, less than a quarter of the
respondents in the western and southern regions reported this as a major difficulty. In
94
83.8
78.7
85.9 85.8 86.2
93.2
70
75
80
85
90
95
100
Hills North North Central Central Plains East West South

18
the latter two regions, the beneficiaries who did not have a card mainly said that they did
not need it or that they had moved (Figure 2.4).
Figure 2.3: Reasons for not having ration cards 2011-12
Source: Authors’ calculations from IHDS data.
Not needed14%
Lost6%
Bureaucraticdifficulties
46%
Moved but not transferred
18%
Others16%

19
Figure 2.4: Region-wise proportion of households claiming bureaucratic difficulties in
getting ration cards in 2011-12 (in per cent)
Source: Authors’ calculations from IHDS data.
2.4 The Rural Spread
An analysis of the spatial distribution of ration cards in 2011-12 indicates that 32 per cent
of the beneficiaries were located in urban areas and 68 per cent in rural areas, figures
which are close to the national population distribution. This is a welcome change from
the urban bias in the PDS system at its inception. Almost 85 per cent of the
AAY/Annapurna beneficiaries were concentrated in rural areas while the corresponding
percentages for the BPL and APL cardholders were 77 per cent and 59 per cent,
respectively. The increase in the number of AAY/BPL cards in the different areas
including metro urban, other urban, more developed villages and less developed villages
indicates that the percentage of households with AAY/BPL cardholders increased more
or less evenly by 6 percentage points over the period 2004-05 to 2011-12 (Figure 2.5).
The biggest challenge facing the PDS lies in its difficulties in identifying
appropriate beneficiaries for the BPL and AAY subsidies. The fact that almost 85 per cent
of AAY/Annapurna beneficiaries are concentrated in rural areas along with 77 per cent
BPL beneficiaries suggests a need to look at the extent to which these errors are
distributed across urban and rural areas as well as between different social groups.
35.0
45.1
55.4 55.653.7
24.9 23.7
0.0
10.0
20.0
30.0
40.0
50.0
60.0
Hills North North CentralCentral Plains East West South

20
Figure 2.5: Place of residence and change in cardholders between 2004-05 and
2011-12 (in per cent)
Source: Authors’ calculations from IHDS data.
67.0
52.9
46.2
40.5
47.1
60.555.7
41.6
36.2
44.5
0
10
20
30
40
50
60
70
80
Metro urban Other urban Moredeveloped
village
Lessdeveloped
village
All India
(in
pe
r ce
nt)
APL
2004-05
2011-12
14.4
25.0
41.7 41.9
36.2
20.6
31.1
47.248.3
41.7
0
10
20
30
40
50
60
Metro urban Other urban Moredeveloped
village
Lessdeveloped
village
All India
(in
pe
r ce
nt)
BPL/AAY
2004-05
2011-12

21
2.5 Income Distribution of PDS Cardholders
As per the IHDS 2004-05 and 2011-12 surveys, the percentage of the poor came down
from 38.4 per cent in 2004-05 to 21.3 per cent in 2011-12 using the Tendulkar Committee
poverty line based on consumption data, while the proportion of non-poor went up from
61.6 per cent to 78.7 per cent. Hence, while poverty was declining, ironically the
proportion of households with AAY or BPL cards had actually increased slightly.
Figure 2.6: Poverty ratios in 2004-05 and 2011-12 (in per cent)
Source: Authors’ calculations from IHDS data.
Errors of exclusion are seen in the proportion of households that are poor but do
not have a BPL card. Among APL cardholders, 12.9 per cent are poor but do not have a
BPL card; among those with no cards, 22.9 per cent are poor. This group forms a part of
the error of exclusion. In contrast, errors of inclusion are shown by the proportion of
households that have BPL or AAY card but are not poor.
In fact, the proportion of households having AAY/Annapurna/BPL cards is very
high as compared to the poverty rates. For instance, the IHDS data document that in 2011,
over two-thirds of the population under the AAY/Annapurna scheme comprised the non-
poor while over three-quarters having BPL cards were non-poor (Figure 2.6). On the
other hand, only 13 per cent of the households having APL cardholders were found to be
poor. Hence, inclusion errors seem more significant than exclusion errors in the TPDS
(Figure 2.7). It is important to note that these figures are based on the poverty line
recommended by Tendulkar Committee, which has sometimes been considered too low.

22
Figure 2.7: Proportion of poor by card type in 2011-12 (in per cent)
Source: Authors’ calculations from IHDS data.
We see somewhat greater errors of inclusion when we use income-based
categories as compared to the consumption-based categories presented above. In 2011,
close to 54 per cent and 50 per cent of the households in the bottom 20 per cent income
bracket (quintile 1) and in the second quintile held AAY/Annapurna and BPL cards,
respectively. Interestingly, among the top 20 per cent of the households, close to 21 per
cent held AAY/Annapurna or BPL cards, pointing to inclusion errors.
The percentage of those holding AAY/Annapurna or BPL cards increased for all
quintiles between 2004-05 and 2011-12 (Figure 2.8). For instance, in the bottom 20 per
cent income bracket, the proportion of those holding these cards increased by 18 per cent
while among those in the top 20 per cent income bracket, the corresponding figure
increased by 26 per cent. The errors of inclusion are greater in rural India as compared
to urban India. For instance, in the 4th quintile, in 2011, almost 46.1 per cent of the
households had AAY/Annapurna or BPL cards in rural India whereas the corresponding
figure in urban India was much less, at 32 per cent.
21.3
38.5
28.6
12.9
22.9
0
5
10
15
20
25
30
35
40
45
All AAY/Annapurna BPL APL No card

23
Figure 2.8: Per cent change in ownership of different card types between 2004-05
and 2011-12 by income quintile (in per cent)
Source: Authors’ calculations from IHDS data. Note that increase
in BPL/AAY/Annapurna card is not strictly
counterbalanced by decrease in APL card since
proportion of households with no card declined in 2011-
12 vis-à-vis 2004-05.
17.6
7.4
11.5
21.3
26.2
0.0 5.0 10.0 15.0 20.0 25.0 30.0
Poorest
2nd quintile
Middle quintile
4th quintile
Richest
BPL/AAY/Annapurna
-16.0
-7.1
-6.3
-5.5
1.1
-20.0 -15.0 -10.0 -5.0 0.0 5.0
Poorest
2nd quintile
Middle quintile
4th quintile
Richest
APL

24
Increasing inclusion errors are mostly due to rising incomes. About 28 per cent of
those in the richest 20 per cent quintile in the rural areas and 15 per cent of the richest
quintile in the urban areas have AAY, Annapurna or BPL cards (Table 2.1). In fact,
between 2004-05 and 2011-12, the proportion of BPL cards among the rich grew by 22.6
per cent in the rural areas and by 25.3 per cent in the urban areas. Significantly, this is
mostly due to the fact that most states were living with old BPL lists and hence,
households that had BPL cards continued to hold them even when economic growth had
taken them out of poverty.
Table 2.1: According to cards per capita income and growth rate
Rural/ Urban BPL/AAY/
Annapurna
APL No card
Per Capita Income Quintile; Top 20%
Rural 28.0 62.0 10.0
Urban 15.3 68.9 15.9
Growth rate between 2004-05 and 2011-12
Rural 22.6 -3.9 -39.2
Urban 27.8 2.1 -35.7
Source: Authors’ calculations from IHDS data.
2.6 The Caste-wise Composition of Beneficiaries Has
Remained Stable
In 2011, almost two-thirds among the high caste group held APL cards, while 22 per cent
of them held BPL cards and 13 per cent held no cards. The OBCs, Muslims and Christians,
who accounted for 35.7 per cent, 11.3 per cent and 2.2 per cent of the households,
respectively, in 2011-12, also predominantly held APL cards, while the Dalits and
Adivasis, who accounted for 22.1 per cent and 8.3 per cent of the households,
respectively, in 2011-12, predominantly held BPL cards (Figure 2.9). The caste-wise
composition of beneficiaries under all the PDS schemes remained more or less stable
between 2004-05 and 2011-12, with the only significant change being that the proportion
of Dalits under the AAY/Annapurna scheme increased from 29.1 per cent to 34.7 per cent
while simultaneously the proportion of Adivasis under this scheme fell from 18.9 per cent
to 11.8 per cent.

25
Figure 2.9: Distribution of cards among social groups in 2011-12 (in per cent)
Source: Authors’ calculations from IHDS data.
2.7 BPL Cardholders Have Substantially Lower Education
Not surprisingly, there is a strong correlation between education levels and ownership of
AAY/Annapurna and BPL cards. Of those who had no education at all, close to 60 per cent
had AAY/Annapurna and BPL cards, while 26 per cent of them had APL cards and 14 per
cent had no card at all in 2011 (Figure 2.10). In comparison, the proportions of
beneficiaries under the same categories for those with higher secondary education were
32 per cent, 55 per cent and 13 per cent, respectively, while the corresponding
proportions of those who were graduates were 19 per cent, 69 per cent and 12 per cent,
respectively.
24.8
43.3
53.457.2
37.0
19.7
62.7
43.7
33.6
20.5
47.5
70.6
0
10
20
30
40
50
60
70
80
High Caste OBC Dalit Adivasi Muslim Christian, Sikh,Jain
AAY/Annapurna/BPL APL

26
Figure 2.10: Education level (in per cent)
Source: Authors’ calculations from IHDS Data.
2.8 Marginal Farmers More Likely to Have BPL Cards
In 2011, 58.1 per cent of the households comprised non-cultivators, 28.5 per cent had
marginal (0-1 hectare), 7.2 per cent small (1-2 hectares), 5 per cent medium (2-5
hectares) and 1.2 per cent large (5 and more hectares) holdings of land (Figure 2.11). The
maximum number of AAY/Annapurna and BPL cards were owned by marginal farmers,
while over two-thirds of the medium and large cultivators had APL cards. Interestingly,
the percentage of all cultivators, whether marginal, small, medium or large, holding APL
cards increased between 2004-05 and 2011-12. Most of this increase was due to the fact
that households that previously had no card had subsequently acquired an APL card.
10.7
48.8
26.1
14.4
6.4
35.0
43.0
15.6
1.4
17.7
68.5
12.4
0
10
20
30
40
50
60
70
80
AAY/Annapurna BPL APL No card
None Middle Level Graduate+

27
Figure 2.11. Land use pattern and PDS card distribution
Source: Authors’ calculations from IHDS data.
2.9 The Beneficiaries of MGNREGA Are Mainly
AAY/Annapurna/BPL Cardholders
In 2011, 17.2 per cent of the households surveyed participated in the MGNREGA
programme. Of these, close to two-thirds had AAY/Annapurna or BPL cards, about 29 per
cent had APL cards and 9 per cent had no card at all (Figure 2.12).
Land use pattern by type of holding
Non cultivators/No land
58%
Marginal 29%
Small 7%
Medium5%
Large 1%
AAY/ Annapurna
8%BPL39%
APL41%
No card12%
Distribution of PDS cards among marginal farmers

28
Figure 2.12: MGNREGA participation and ration card type (in per cent)
Source: Authors’ calculations from IHDS data.
2.10 BPL Cardholders Increasing Their Asset Shares
Income growth between 2004-05 and 2011-12 has affected both AAY/Annapurna/BPL
households as well as APL households. In 2011-12 the AAY/Annapurna/BPL households
owned close to 40 per cent of the mobiles, own homes and milch animals. However, they
owned just around 10 per cent of the assets of high value like a washing machine or a
computer (Figure 2.13). Although they remain behind the APL households, these 10 per
cent represent a clear trend in improvement in living standards. Between 2004-05 and
2011-12, the BPL households increased their ownership share across all forms of assets
that were included in the survey. This can be partly attributed to the increase in the share
of BPL households over these two survey periods along with a decline in poverty levels,
which facilitated greater disposable income among the BPL class.
10.9
51.1
28.9
9.1
5.0
32.5
47.7
14.9
0
10
20
30
40
50
60
AAY/Annapurna BPL APL No card
MGNREGA
Non-MGNREGA

29
Figure 2.13: Asset ownership among different cardholders in 2004-05 and 2011-
12 (in per cent)
Source: Authors’ calculations from IHDS data.
67.3
71.4
76.0
75.7
73.4
76.5
64.7
67.9
73.2
73.8
53.7
65.9
77.2
76.3
71.9
70.3
73.7
65.1
76.3
76.9
0 20 40 60 80 100
Color TV
Air Cooler
Washing Machine
Computer
Credit Card
Refrigerator
Air Conditioner
Motor Cycle
Car
Telephone
APL 2004-05 APL 2011-12

30
3. PDS Utilisation
Key messages
PDS use grew strikingly between 2004-05 and 2011-12. In 2011-12, about 27 per cent of
all households purchased cereals from the PDS whereas by 2011-12, this proportion had
risen to 52.3 per cent.
The growth in PDS use has occurred for each category of cardholders. Almost all the BPL
and AAY cardholders purchase PDS grains and as many as 32 per cent of the APL
cardholders purchase from the PDS.
Although PDS use has increased, for the purchasing households, the amount of purchase
or share of PDS grain to the total grain consumed has remained more or less stable.
Nearly 72 per cent of the Indian households purchased kerosene from PDS shops.
Although the use of kerosene as a primary cooking fuel is negligible, nearly 28 per cent
of the households were found to use kerosene in combination with firewood in rural
areas and with LPG in urban areas.
3.1 Striking Growth of the PDS for Cereal Purchase
Even before the NFSA was implemented, the role of the PDS in household food
consumption was seen to be growing. The IHDS found that between 2004-05 and 2011-
12, the number of households purchasing cereals from the PDS nearly doubled. This
expansion parallels the expansion of PDS utilisation observed in the NSS.
The PDS moved from being universal to targeted in 1997. This move was accompanied
by a sharp increase in price for the APL cardholders. This change reduced the urban bias
of the PDS and led to a sharp decline in PDS use between 1993-94 and 2004-05. However,
since then, PDS use has grown steadily in both urban and rural areas. Table 3.1,
reproduced from calculations by Himanshu and Sen (2013a), shows that by 2011-12,
NSSO records about 50 per cent of the rural and 30.7 per cent of the urban population as
purchasing cereals from the PDS.

31
Table 3.1: Per cent households purchasing cereals from PDS
Year NSS IHDS
Rural Urban Rural Urban
1993-94 25.6 32.1
2004-05 24.8 15.4 28.3 17.2
2009-10 43.3 28.2
2011-12 50 30.7 53.4 44.0
Sources: Himanshu and Sen, 2013a for NSS; authors’ calculations for IHDS.
The IHDS also records an increase in the number of households purchasing from the PDS,
albeit somewhat greater than that recorded for the NSS. In 2004-05, about 27.1 per cent
of all households purchased any cereals from the PDS in the month prior to the interview,
whereas this proportion had grown to 52 per cent by 2011-12. About half the interviews
in IHDS were carried out in the latter half of 2012, a period of rapid food price inflation.
This may account for higher use of PDS among IHDS households compared to the NSS
households. As Figure 3.1 shows, as of 2011-12, about 91 per cent of the households
holding AAY or BPL cards purchased cereals from the PDS. Even more surprisingly, about
32 per cent of the households with APL cards also purchased cereals from the PDS. This
is a substantial change from 2004-05 when only 13 per cent of the households with APL
cards purchased grain from the PDS. It is possible that due to rapid food inflation during
the 2010-12 period, even the economic price of grains charged to APL households was
lower than the market price. This is a topic to which we return in a later section.
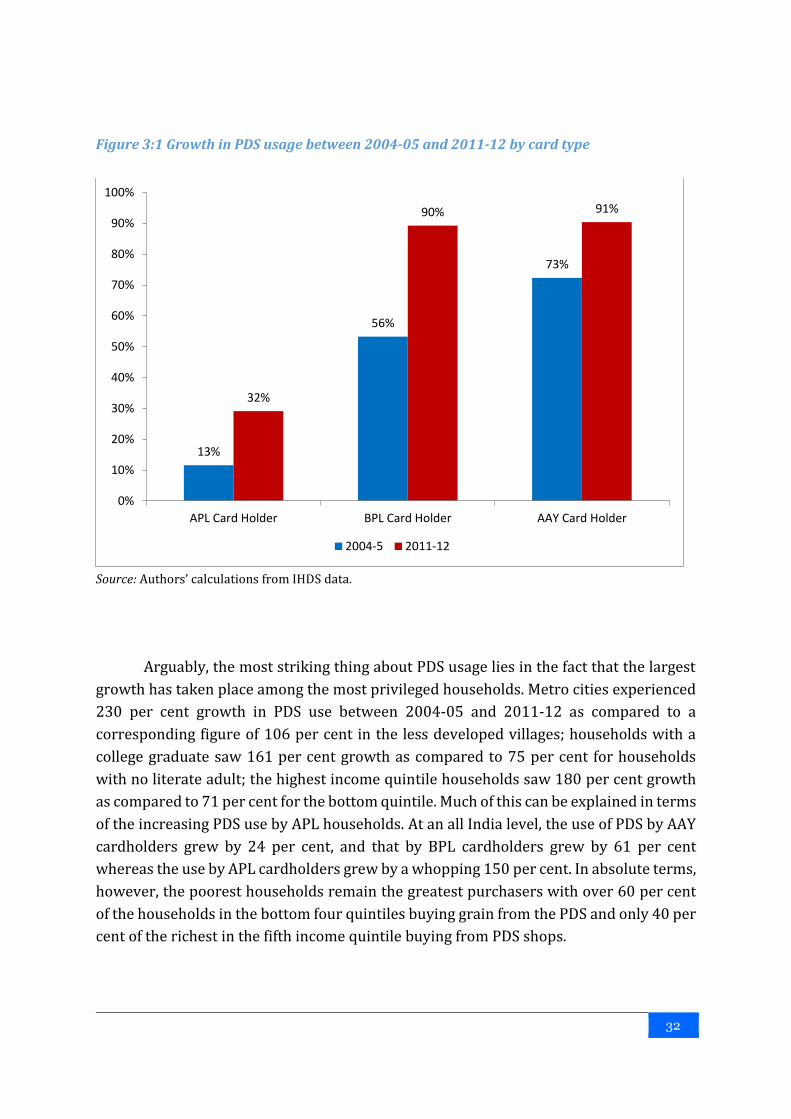
32
Figure 3:1 Growth in PDS usage between 2004-05 and 2011-12 by card type
Source: Authors’ calculations from IHDS data.
Arguably, the most striking thing about PDS usage lies in the fact that the largest
growth has taken place among the most privileged households. Metro cities experienced
230 per cent growth in PDS use between 2004-05 and 2011-12 as compared to a
corresponding figure of 106 per cent in the less developed villages; households with a
college graduate saw 161 per cent growth as compared to 75 per cent for households
with no literate adult; the highest income quintile households saw 180 per cent growth
as compared to 71 per cent for the bottom quintile. Much of this can be explained in terms
of the increasing PDS use by APL households. At an all India level, the use of PDS by AAY
cardholders grew by 24 per cent, and that by BPL cardholders grew by 61 per cent
whereas the use by APL cardholders grew by a whopping 150 per cent. In absolute terms,
however, the poorest households remain the greatest purchasers with over 60 per cent
of the households in the bottom four quintiles buying grain from the PDS and only 40 per
cent of the richest in the fifth income quintile buying from PDS shops.
13%
56%
73%
32%
90% 91%
0%
10%
20%
30%
40%
50%
60%
70%
80%
90%
100%
APL Card Holder BPL Card Holder AAY Card Holder
2004-5 2011-12

33
This discussion has combined rice and wheat but Appendix Tables A45 to A65
present separate results for households purchasing rice and wheat. The results remain
fairly similar.
3.2 The PDS Contributes Less than Half of the Total Cereal
Consumption
Although the number of households that purchase cereals from the PDS has grown
sharply, the per capita amount of grain purchased from the PDS has risen only slightly.
For example, the AAY cardholders purchased 5.7 kg/month per person in 2004-05 and
6.3 kg in 2011-12, while the increase for BPL cardholders was less, from 4.4 kg to 4.8 kg,
and the APL cardholders, on the other hand, experienced a decline from 4.5 to 3.7
kg/month (Figure 3.2).
Figure 3.2: Per capita monthly grain purchase from PDS by card type for purchasing
households, 2004‐05 and 2011‐12 (in per capita kg/month)
Source: Authors’ calculations from IHDS data.
Since the purchased amount is dictated by state allocation criteria, we see
relatively little variation in cereal purchase across different socio-economic strata within
any card category (as shown in Figure 3.3) for the households that purchase from the
PDS.
5.7
4.4 4.5 4.5
6.3
4.8
3.7
4.7
0.0
1.0
2.0
3.0
4.0
5.0
6.0
7.0
AAY/Annapurna BPL APL All PDS card holders
Gra
in p
urc
has
e f
rom
PD
S
2004-05 2011-12

34
Figure 3.3: Per capita PDS grain purchase by social group, 2011‐12 (in per capita
kg/month)
Source: Authors’ calculations from IHDS data.
In spite of the significant increase in the proportion of households buying from the
PDS and a relatively small increase in the quantity purchased, households also buy a
substantial amount of grains from the market, making the PDS a relatively small
component of the household food basket. For example, the PDS contributed 43 per cent
of the household cereal consumption for AAY households in 2004-05, which increased to
52 per cent but still remains barely half of the total need (Figure 3.4). For BPL households,
the proportion of cereals purchased from the PDS is even smaller, at only 44 per cent. On
an average, for the population as a whole, the grain purchased from the PDS accounts for
about 43 per cent of the per capita household cereal consumption in 2011-12, up from 41
per cent in 2004-05, but still comprising a modest share.
4.4
4.9 4.9
5.2
3.93.8
0.0
1.0
2.0
3.0
4.0
5.0
6.0
Forward Caste OBC Dalit Adivasi Muslim Christian, Sikh,Jain
PD
S G
rain
Pu
rch
ase

35
Figure 3.4: Share of PDS grain in household total cereal purchase for PDS using households,
2004‐05 and 2011‐12
Source: Authors’ calculations from IHDS data.
3.3 A Vast Majority of Households Rely on the PDS for
Kerosene
The recent government decision to deregulate the non-PDS kerosene supply and
considerations regarding reduction of the kerosene supply in the PDS, along with recent
experiments with direct transfer of kerosene subsidy, suggest the need for a deeper
understanding of which households use kerosene.
The IHDS results, like other studies based on the NSS, suggest that the PDS is
extensively used for kerosene purchase. Nearly 79 per cent of the PDS cardholders and
71 per cent of the total number of households purchased kerosene from the PDS shops in
the month preceding the survey in 2011-12. This proportion has remained more or less
steady over time.
4341 42 41
51
44
37
43
0
10
20
30
40
50
60
AAY/Annapurna BPL APL All PDS card holders
PD
S G
rain
as
% o
f To
tal G
rain
Co
nsu
mp
tio
n
2004-05 2011-12

36
Contrasting these household purchases with the use of kerosene for cooking has
led to a strong advocacy for reducing kerosene subsidy. Both the NSS and the Census
suggest that the proportion of households using kerosene as a cooking fuel is tiny, at less
than 3 per cent of the total beneficiaries. This very low figure, combined with concerns
about the black market sale of kerosene for industrial use, has generated substantial
concern. This is also the core of the recommendation by the B. K. Chaturvedi Committee
to remove subsidies on kerosene. However, it is important to note that both the NSS and
the Census ask about the primary cooking fuel. Many households use both firewood and
kerosene for cooking. Slow cooking, particularly while making chapatti or simmering dal,
may be done by using firewood while tea may be made by using the kerosene stove. Since
both the Census and the NSS focus on the primary source of fuel, they tend to miss out on
subsidiary use and any analysis of kerosene leakage based on these data alone would
suggest much greater leakage than would be the case if multiple fuels were counted.
Table 3.2: Use of cooking fuel including multiple types of fuel IHDS I and II
Source of Energy 2004-05
(% Households)
2011-12
(% Households)
Biomass 45.94 38.13
Biomass+Coal 2.01 1.74
Biomass+LPG 8.30 11.87
Biomass+LPG+Coal 0.21 0.33
LPG 17.16 19.43
LPG+Coal 0.08 0.11
Coal 0.66 0.10
Kerosene 1.72 0.85
Kerosene+Biomass 16.68 15.98
Kerosene+Biomass+Coal 1.16 0.80
Kerosene+Biomass+LPG 2.31 5.15
Kerosene+Biomass+Coal+LPG 0.16 0.16
Kerosene+Coal 0.20 0.09
Kerosene+LPG 3.37 5.19
Kerosene+LPG+Coal 0.04 0.05
Source: Authors’ calculations from IHDS data.
The IHDS survey contains an extensive array of questions on fuel use. For a variety
of fuels including dung cakes, firewood, crop residue, kerosene, LPG and coal, the
households were asked whether this fuel was used and if so, whether it was used for
cooking, lighting, heating or a combination of these activities. Table 3.2 just focuses on
the use of fuel for cooking and combination use, and calculates the distribution of
households based on the types of fuels used for cooking. The results show that in 2011-

37
12, 38 per cent of the households used only biomass (dung, firewood, crop residue) as
cooking fuel, while about 19 per cent used only LPG.
The proportion of households using kerosene alone for cooking was very small, at
less than 1 per cent, in 2011-12. If we only rely on primary fuel use, we might assume that
most of the kerosene used is for lighting and hence solar lighting may easily replace
kerosene. However, when we look at the use of kerosene in combination with other fuels
(for example, biomass) we find that about 28 per cent of the households use kerosene for
cooking. Even if we were to look at kerosene use solely for cooking (not for lighting), we
find that 10 per cent of the households used kerosene in 2011-12, either as a sole source
or in combination with other fuels.
Table 3.2 thus indicates that replacing kerosene by solar lights or greater
electrification may not quite replace its current use. Nonetheless, it is important to note
that 53 per cent of the households in 2004-05 and 47 per cent of the households in 2011-
12 used kerosene mainly for lighting. Thus, a significant reduction in kerosene
consumption is possible by ensuring greater electrification and improved reliability of
electricity supply.

38
4. Targeting Efficiency
Key messages
Exclusion errors in PDS targeting have declined between 2004-5 and 2011-12 while
inclusion errors have increased. However, both types of errors remain high. This change
can be attributed both to a decrease the poverty levels as well as an increase in the
number of cards being distributed to the whole population.
Inclusion errors increased across all regions between 2004-05 and 2011-12 and
accounted for over 50 per cent of the total errors for the South region.
The inclusion errors for the historically under-represented groups have been increasing.
However, exclusion errors still remain the highest across all the social groups.
4.1 Introduction
When the PDS became a targeted instead of a universal intervention in 1997, it faced
significant challenges of identifying the poor for food subsidies. Since then, several
studies have tried to look at the efficiency of TPDS targeting and suggested that the
system is full of both inclusion and exclusion errors (Dreze and Khera, 2010), and that
perhaps a universal system may be a solution to this challenge (Sen and Himanshu, 2011).
Nonetheless, the empirical analysis provides some indication that the targeting efficiency
of the TPDS has improved over time (Dreze, 2015; Himanshu and Sen, 2013b). This issue
has been explored below.
4.2 Targeting Errors
A singular aim of the TPDS is to provide ration cards to ensure food security for the poor.
Hence, the number of households identified as poor and receiving subsidised food can
also be expected to decrease over time with a decline in poverty levels. In line with the
NSS data, the IHDS data also indicate that the poverty rates in India fell from 38.4 per cent
in 2004-05 to 21.3 per cent in 2011-12. Hence, in theory, it is expected that the percentage
of households that use AAY, Annapurna, or BPL cards would decrease over time

39
concurrently with the decrease in poverty rates. However, though the poverty rate
between the two survey periods decreased by 44.5 per cent, the number of households
having an AAY/BPL card increased by 15.2 per cent (Figure 4.1 ). As Figure 3.1 shows,
the use of cards by households owning AAY/BPL cards nearly doubled between this
period.
Figure 4.1: Change in poverty and distribution of AAY/BPL cards between 2004-05
and 2011-12
Source: Authors’ calculations from IHDS data.
Targeting errors arise either when the poor do not get the benefits of the scheme,
and/or the non-poor are seen to benefit from the scheme. Targeting errors are of two
types: inclusion errors and exclusion errors (Figure 4.2). Inclusion errors comprise the
percentage of non-poor households that are holding AAY, Annapurna, or BPL cards.
Exclusion errors, on the other hand, comprise the percentage of poor households that are
entitled to but do not have AAY, Annapurna, or BPL cards. Exclusion errors reflect poor
coverage of the target group.
-44.5
15.2
-50.0
-40.0
-30.0
-20.0
-10.0
0.0
10.0
20.0
Poor (%) AAY/BPL Card

40
Figure 4.2: Inclusion and exclusion errors: 2004-05 and 2011-12 (in per cent)
Source: Authors’ calculations from IHDS data.
The IHDS I and II surveys suggest that the inclusion errors increased from 28.8
per cent in 2004-05 to 37 per cent in 2011-12. Simultaneously, the exclusion errors
declined. This trend is both due to more households being issued PDS cards, particularly
the expansion of the AAY category, as well as over-identification of the poor under the
TPDS in 2011-12, as despite a decline in poverty rates over this period, the non-poor are
still identified as poor by the government.
High inclusion errors lead to subsidies being wastefully spent. Using the NSS 2004-
05 survey, Jha and Bharat (2012) measure the percolation of food subsidy expenditures
to the poor by measuring both targeting leakages (inclusion errors) as well as non-
targeting leakages due to excess costs and fraud. Comparing India to the Philippines,
which had a universal programme, Jha finds that despite the PDS being a targeted
programme in India, only one-third of the total subsidy went to the poor, which is in
contrast to the Philippines, where 60 per cent of the subsidy went to the poor.
28.8
54.9
36.9
41.4
0
10
20
30
40
50
60
Inclusion Error: Being non-poor and havingBPL/Antodaya/ Annapurna card
Exclusion Error: Being poor and not havingBPL/Antodaya/ Annapurna card
2004-05 2011-12

41
4.2.1 The regional spread in targeting errors is significant
The Programme Evaluation Office of the Planning Commission 2F
3 had evaluated the
performance of the TPDS and found that not only are the inclusion errors high but also
that there are significant variations in inclusion errors across states in India. The
inclusion error in southern states was found to be generally higher than in the northern
and western states. For instance, the inclusion error in the southern region was found to
be 59.1 per cent, whereas that in the North and West was around 24 per cent (Figure 4.3).
Inclusion errors increased across all regions between 2004-05 and 2011-12. For
instance, in the North, inclusion errors increased from 10.9 per cent to 24.5 per cent, and
in the South from 49.9 per cent to 59.1 per cent. Exclusion errors, on the other hand, are
seen to be decreasing across all regions.
Figure 4.3: Regional distribution of inclusion errors: 2004-05 and 2011-12 (in per cent)
Source: Authors’ calculations from IHDS data.
3 Programme Evaluation Office, Planning Commission. 2005. Performance Evaluation of Targeted Public Distribution System (TPDS).
22.9
10.9
20.622.1
24.923.1
49.9
27.624.1
31.6 32.934.8
23.8
59.1
0
10
20
30
40
50
60
70
Hills North North Central Central Plains East West South
Inclusion Error: Non-poor and having BPL/Antodaya/Annapurna card 2004-05
Inclusion Error: Non-poor and having BPL/Antodaya/Annapurna card 2011-12

42
4.3 Inclusion Errors Increasing for Historically Under-
represented Groups
The number of non-poor among the OBCs, Dalits, Adivasis, and Muslims who got a PDS
card increased between the two survey periods of 2004-05 and 2011-12. In 2011-12, the
inclusion errors were 40 per cent for the OBCs, 49 per cent for the Dalits, 51.1 per cent
for the Adivasis, and 34.1 per cent for the Muslims (Figure 4.4). Part of this may be due to
increasing movement out of poverty for the marginalised groups (Thorat et al., 2016) and
part may be due to greater distribution of PDS cards with greater focus on including
historically marginalised groups. However, as seen in Table 4.1, exclusion errors were
still high among all the social groups in 2011-12.
Figure 4.4: Social groups and inclusion errors: 2004-05 and 2011-12 (in per cent)
Source: Authors’ calculations from IHDS data.
16.4
32.3
39.4
42.0
27.2
13.9
21.5
39.8
48.750.9
33.7
18.3
0
10
20
30
40
50
60
High caste OBC Dalit Adivasi Muslim Christian, Sikh,Jain
2004-05 2011-12

43
4.4 Exclusion Errors Decreasing
Exclusion errors steadily came down across all quintiles between 2004-05 and 2011-12.
Note that poverty is determined by per capita consumption and even in the highest
income quintiles some households remain poor. For the poorest, the exclusion errors in
urban areas are slightly higher at over 50 per cent as compared to less than 40 per cent
in the rural areas (Table 4.1).
The inclusion errors across all the quintiles increased, with the errors in the fourth
quintile showing the greatest jump (Table 4.1), this is the group where substantial
poverty decline took place but the households may still have retained their BPL/AAY
cards. The inclusion errors among the top 20 per cent of the households increased from
13 per cent in 2004-05 to 18 per cent in 2011-12. In the topmost bracket, in 2011-12, the
inclusion errors in rural areas, at 24 per cent, were greater than in urban areas at 14 per
cent.
Table 4.1: Poverty status and type of PDS cardholders
Population Groups
Non-poor
population (%)
Inclusion Error:
Non-poor and
having
BPL/Antodaya/
Annapurna card
Poor population
(%)
Exclusion Error:
Poor and NOT
having
BPL/Antodaya/
Annapurna card
2004-
05
2011-
12 2004-05
2011-
12
2004-
05
2011-
12 2004-05
2011-
12
All India 61.5 78.7 28.8 36.9 38.4 21.3 54.9 41.4
Place of Residence
Metro urban 83.6 94.3 13.5 20.1 16.3 5.8 79.0 58.3
Other urban 68.4 84.4 19.1 28.1 31.5 15.6 64.8 51.6
More developed village 63.7 79.4 34.9 42.5 36.3 20.6 51.6 39.7
Less developed village 52.2 71.9 32.9 41.9 47.8 28.1 52.3 38.5
Social Groups
High caste 78.9 89.3 16.4 21.5 21.0 10.7 68.4 54.4
OBC 63.2 80.7 32.3 39.8 36.8 19.3 56.8 42.6
Dalit 52.9 73.0 39.4 48.7 47.1 27.0 48.8 36.0
Adivasi 34.6 58.5 42.0 50.9 65.4 41.6 36.4 33.2
Muslim 56.0 76.9 27.2 33.7 44.0 23.1 67.7 49.1
Christian, Sikh, Jain 82.3 93.2 13.9 18.3 17.3 6.8 54.7 46.2

44
contd... Table 4.1
Population Groups
Non-poor
population (%)
Inclusion Error:
Non-poor and
having
BPL/Antodaya/
Annapurna card
Poor population
(%)
Exclusion Error:
Poor and NOT
having
BPL/Antodaya/
Annapurna card
2004-
05
2011-
12 2004-05
2011-
12
2004-
05
2011-
12 2004-05
2011-
12
Per Capita Income
Quintile-All India
Poorest 37.6 56.9 38.7 46.6 62.3 43.1 51.0 37.4
2nd quintile 43.1 68.8 40.7 47.2 56.9 31.2 53.4 43.5
Middle quintile 56.8 80.5 37.0 43.4 43.2 19.5 57.9 41.6
4th quintile 76.2 90.0 26.5 36.0 23.8 10.0 61.6 48.2
Richest 92.9 97.0 12.8 18.6 6.9 3.0 70.8 56.8
Region
Hills 81.4 84.1 22.9 27.6 18.5 15.9 44.4 44.7
North 81.7 88.8 10.9 24.1 17.9 11.2 78.2 49.0
North Central 51.3 72.2 20.6 31.6 48.6 27.8 63.8 44.5
Central Plains 48.5 75.0 22.1 32.9 51.3 25.0 58.6 39.1
East 57.7 73.7 24.9 34.8 42.3 26.3 52.1 38.6
West 63.1 80.7 23.1 23.8 36.9 19.3 53.6 53.2
South 74.7 87.9 49.9 59.1 25.3 12.1 30.9 24.6
Source: Authors’ calculations from IHDS data.
Declining exclusion errors and increasing inclusion errors are due to two forces. First,
programme expansion—particularly the expansion of the AAY programme—brought many
poor under its ambit, thereby reducing the proportion of poor who do not have access to
BPL/AAY/Annapurna cards. Second, income growth occurred at a time when BPL lists were
more or less frozen, allowing BPL cardholders who experienced income growth to continue to
hold onto their BPL cards. This observation of changes between 2004-05 and 2011-12, which
are far modest in comparison to the changes expected under NFSA, foreshadow the challenges
that NFSA is likely to face.

45
5. Propensity Score Matching to Evaluate
Behaviours of Households with Access
to the TPDS and Their Peers
Key messages
There is emerging advocacy for cash transfers.
Is TPDS the best way of enhancing food security of the households? In order to
examine this issue, we need to compare households with access to food subsidies
and those without this access on their food choices, while holding income constant.
It is difficult to do so without the availability of data on household income.
The India Human Development Surveys I and II contain detailed data on household
income as well as a brief consumption expenditure module that allows us to look at
different aspects of consumption.
The fundamental research question is about household choices in the context of
access to subsidies via BPL and AAY cards. However, random assignment is not
feasible. We use propensity score matching to compare similar households.
The propensity score matching technique has been described and the quality of our
matching data evaluated.
The quality of matching from our matching procedures seems to be acceptable in
providing the matched sample of households with access to BPL/AAY cards and
those without these cards.
The results show that at any given income level, households with BPL/AAY cards
are far more likely to buy cereals from PDS shops than those that do not have
access to these subsidies.
5.1 Introduction
Recent evidence points to an improvement in the efficiency of the PDS (Dreze, 2015; Paul,
2015; Sen, Himanshu, Dreze, and Khera, 2015). Nonetheless, two concerns about
providing food security via the PDS remain (Gulati and Saini, 2015): (1) Leakages and

46
administrative expenditures increase the expenditure involved in delivering food
subsidy; and, (2) Procurement policies may distort agricultural markets. The approach of
providing households with cash rather than food is being increasingly advocated
internationally as well as in India to address some of these problems (Ruel and Alderman,
2013; Sewa Bharat, 2013). However, randomised experiments comparing cash transfers,
food subsidies and food vouchers in diverse countries suggest that the effectiveness of
these programmes depends on pre-existing market and institutional conditions. A
comparison of randomised control trials in four countries undertaken by the
International Food Policy Research Institute (IFPRI) documents that “… there is no one
‘right’ transfer modality. The relative effectiveness of different modalities depends
heavily on contextual factors such as the severity of food insecurity and the thickness of
markets for grains and other foods. In three countries (Ecuador, Uganda, Yemen), cash
had a relatively larger impact on improving dietary diversity as did vouchers in Ecuador,
but in the fourth country (Niger), food had a larger impact on dietary diversity. Cash
assistance was always significantly more cost-effective to deliver,” (Hoddinott, 2013).
If international experience offers us little guidance, what information do we have
of the Indian context? Unconditional cash transfer experiments by SEWA document that
households receiving cash transfers tend to diversify their diet but simultaneously, they
also increase expenditure on other needed items like children’s education (Sewa Bharat,
2013). However, it is difficult to generalise from these experiments. In view of the
relatively short time span for the experiment, households may not really make
fundamental changes to their long-term consumption patterns as a result of cash
transfers in experimental settings.
A comparison of the time trends in NSS data between 1993-94 and 2009-10 for
the states which substantially expanded the TPDS, that is, West Bengal, Chhattisgarh,
Andhra Pradesh, Tamil Nadu, and Odisha, with the other states shows that an increase in
access to the TPDS is associated with decreased monthly expenditure on cereals. It was
also found that some of these savings were used to augment the expenditure on pulses,
edible oils, vegetables and sugar (Kishore and Chakrabarti, 2015). However, one of the
problems of relying on NSS data is that expenditure decisions as a function of the decline
in cereal prices are often conflated with secular changes in income. Since consumption is
an endogenous variable, it makes more sense to compare households at similar levels of
income rather than those at similar levels of consumption.
Below we use data from IHDS, waves I and II, of 2004-05 and 2011-12,
respectively, to examine the role of income as well as of the PDS in shaping household
consumption decisions.

47
5.2 Dealing with Non-Random Assignment of BPL/AAY Cards
Although randomised assignments of the household categories eligible for food subsidies
would allow us to better understand the role of the TPDS in shaping household food
consumption decisions, politically this would not seem to be a feasible strategy, nor is it
easy to run these experiments for relatively long periods required to observe
fundamental changes in spending preferences. At the same time, using access to food
subsidies via ownership of BPL and AAY cards in a regression framework would ignore
the fact that households are not randomly chosen to receive these cards and are likely to
be different from each other in terms of caste, religion, place of residence, and most
importantly, household income. In this report, we adopt an alternative approach and
employ the propensity score matching technique to compare households that are as
similar to each other as possible.
Propensity score analysis (Heckman and Navarro-Lozano, 2004; Rosenbaum and
Rubin, 1983) is frequently used in the context of non-random treatment assignments in
observational studies. The propensity score is expressed as:
e(Xi) = pr(Zi=1 | Xi = xi)
where the propensity score for subject i (i = 1… N), is the conditional probability of being
assigned to treatment Zi = 1 vs. control Zi = 0, given a vector xi of observed covariates.
Conceptually, estimating the treatment effect in a quasi-experimental situation is
relatively simple and involves predicting participation in a treatment by using a set of
covariates, and then matching two respondents with similar propensity scores, including
one from the treatment group and another from the control group. However, the results
tend to be sensitive to the quality of matching. In order to maximise the quality of the
match, we have used the nearest neighbour matching within calipers, followed
recommendations available in the literature (Austin, 2011), and set calipers to 0.2
standard deviations of the predicted logit. Since our matching procedure does not allow
a comparison case to match with more than one treatment case, it also reduces the
number of treated observations that have a valid match, which is an issue of potential
concern. We examine both these potential sources of bias in a later section.
In this analysis, we match households holding BPL/AAY cards with households
without these cards on the following variables: log of per capita household income,
squared term for log of per capita household income, an indicator for whether household
income is 0 or less than zero (about 1.5 per cent of the sample), state of residence, place
of residence, highest education level obtained by an adult aged above 21 years in the

48
household, the number of persons in the household, caste and religion (categorised as
forward castes, OBCs, Scheduled Castes, Scheduled Tribes, Muslims, and those following
other religions), whether the household owns or cultivates land, and whether it draws
any income from wage and salary work.
Note that in Chapters 5-7 we focus only on access to BPL/AAY cards and ignore
participation in the Annapurna scheme since it is available only to individuals of specific
ages and it would restrict our analyses to households with senior citizens. Also, we focus
on access to BPL/AAY cards rather than the use of these cards since the decision to
purchase from the PDS is one of the decisions we want to model.
5.3 Quality of Propensity Score Matching
Table 5.1 provides an illustrative example of the quality of matching in this analysis. For
each characteristic against which the households are being matched, the top row
provides the mean value for the BPL/AAY and non-BPL samples before matching, while
the bottom row provides the means after matching. For example, before matching, 46 per
cent of the PDS users in 2011-12 belonged to households that own or cultivate land while
44 per cent of those belonging to the non-PDS sample owned or cultivated land. After
matching, this proportion was 46 per cent for both types of households. The T-test
examines the differences in these means. As Tables 5.1a and 5.1b show, matching
substantially reduces the bias on each independent variable. Wherever a statistically
significant bias remains for an individual covariate, it is very small in size.
The danger with propensity score matching lies in our inability to find a comparable
match among non-users for the households using the PDS or households that are not on
a common support. The reason for households being off support is usually that the
probability of receiving the BPL subsidy is so high that no comparable non-recipient
household is available for matching. Of the 16,591 households having BPL or AAY cards
in 2011-12 in the IHDS survey, no match was found for 3,732 households or about 22 per
cent of the total sample. Of these, 1,504 households were in Andhra Pradesh and 1,162 in
Karnataka, where almost all households from the lower income categories depended on
food subsidy in 2011-12, indicating the widespread prevalence of food subsidies in these
two states. These off-support households are omitted from our comparisons presented
below.
The second important caveat for this analysis is that since households are selected
in a way that they match with each other on a variety of observable characteristics of
interest such as the state and place of residence as well as other characteristics like
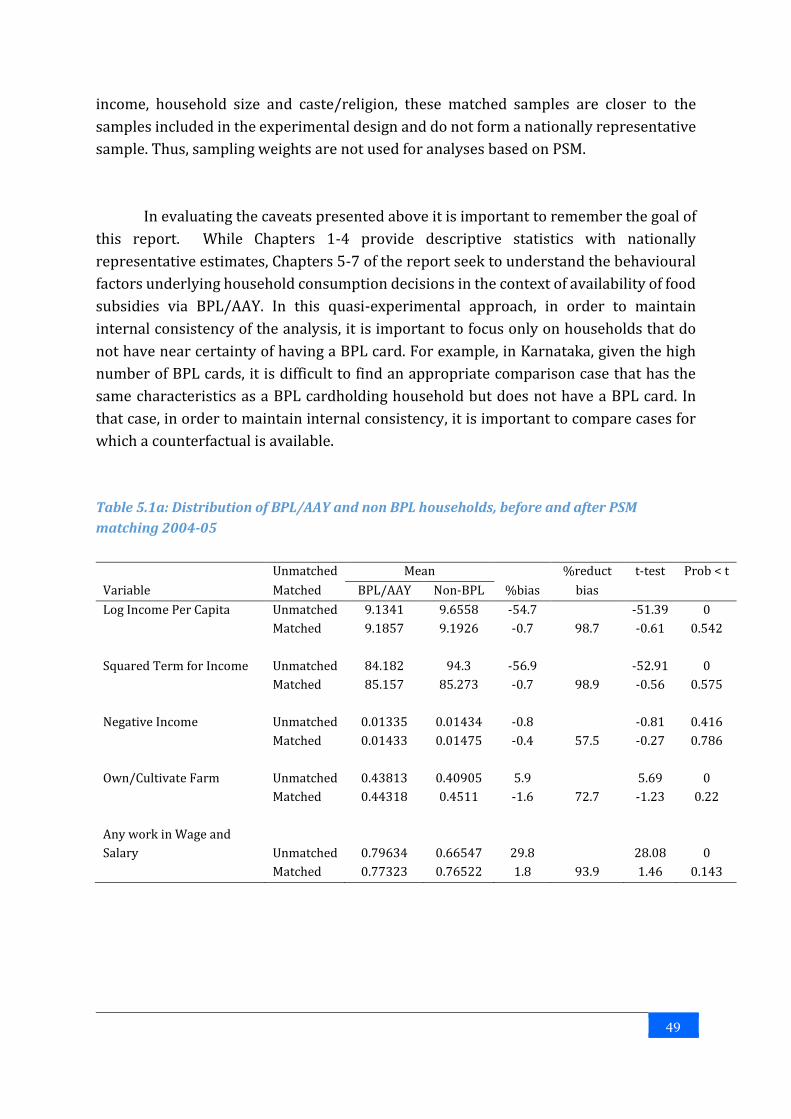
49
income, household size and caste/religion, these matched samples are closer to the
samples included in the experimental design and do not form a nationally representative
sample. Thus, sampling weights are not used for analyses based on PSM.
In evaluating the caveats presented above it is important to remember the goal of
this report. While Chapters 1-4 provide descriptive statistics with nationally
representative estimates, Chapters 5-7 of the report seek to understand the behavioural
factors underlying household consumption decisions in the context of availability of food
subsidies via BPL/AAY. In this quasi-experimental approach, in order to maintain
internal consistency of the analysis, it is important to focus only on households that do
not have near certainty of having a BPL card. For example, in Karnataka, given the high
number of BPL cards, it is difficult to find an appropriate comparison case that has the
same characteristics as a BPL cardholding household but does not have a BPL card. In
that case, in order to maintain internal consistency, it is important to compare cases for
which a counterfactual is available.
Table 5.1a: Distribution of BPL/AAY and non BPL households, before and after PSM
matching 2004-05
Unmatched Mean %reduct t-test Prob < t
Variable Matched BPL/AAY Non-BPL %bias bias Log Income Per Capita Unmatched 9.1341 9.6558 -54.7 -51.39 0
Matched 9.1857 9.1926 -0.7 98.7 -0.61 0.542
Squared Term for Income Unmatched 84.182 94.3 -56.9 -52.91 0
Matched 85.157 85.273 -0.7 98.9 -0.56 0.575
Negative Income Unmatched 0.01335 0.01434 -0.8 -0.81 0.416
Matched 0.01433 0.01475 -0.4 57.5 -0.27 0.786
Own/Cultivate Farm Unmatched 0.43813 0.40905 5.9 5.69 0
Matched 0.44318 0.4511 -1.6 72.7 -1.23 0.22
Any work in Wage and
Salary Unmatched 0.79634 0.66547 29.8 28.08 0
Matched 0.77323 0.76522 1.8 93.9 1.46 0.143

50
(contd..)
Unmatched Mean %reduct t-test Prob < t
Variable Matched BPL/AAY Non-BPL %bias bias
OBC Unmatched 0.36615 0.32457 8.8 8.48 0
Matched 0.37076 0.37009 0.1 98.4 0.11 0.914
Dalit Unmatched 0.25783 0.17076 21.3 21.09 0
Matched 0.23824 0.2336 1.1 94.7 0.84 0.4
Adivasi Unmatched 0.12927 0.05899 24.2 24.77 0
Matched 0.11457 0.10344 3.8 84.2 2.75 0.006
Muslim Unmatched 0.10172 0.11918 -5.6 -5.32 0
Matched 0.11212 0.12182 -3.1 44.5 -2.32 0.02
Christian/Sikh/Jain Unmatched 0.01789 0.04301 -14.7 -13.31 0
Matched 0.02023 0.02209 -1.1 92.6 -0.99 0.321
Household Size Unmatched 5.0751 5.2535 -7.3 -6.92 0
Matched 5.1288 5.1976 -2.8 61.4 -2.17 0.03
Highest level education by adult household members (none omitted)
Std 1-5 Unmatched 0.10769 0.05775 18.2 18.4 0
Matched 0.10099 0.09703 1.4 92.1 1.02 0.307
Std 5-8 Unmatched 0.3445 0.29531 10.6 10.25 0
Matched 0.35407 0.36014 -1.3 87.7 -0.98 0.329
Std 10-11 Unmatched 0.12338 0.16121 -10.8 -10.28 0
Matched 0.13084 0.1321 -0.4 96.7 -0.29 0.773
Higher Sec. & Some College Unmatched 0.06872 0.12327 -18.6 -17.24 0
Matched 0.07655 0.08085 -1.5 92.1 -1.23 0.219
Graduate Unmatched 0.05814 0.20082 -43.5 -38.99 0
Matched 0.06778 0.07056 -0.8 98.1 -0.84 0.398
No. of Assets Owned Unmatched 9.3818 13.739 -76.6 -71.19 0
Matched 9.8664 10.024 -2.8 96.4 -2.32 0.02
Place of residence (Metro omitted) Non Metro Urban Unmatched 0.18975 0.32106 -30.5 -28.6 0
Matched 0.21059 0.21261 -0.5 98.5 -0.38 0.703

51
(contd..)
Unmatched Mean %reduct t-test Prob < t
Variable Matched BPL/AAY Non-BPL %bias bias
Developed Village Unmatched 0.37254 0.29235 17.1 16.64 0
Matched 0.35053 0.34497 1.2 93.1 0.9 0.368
Less Developed Village Unmatched 0.39838 0.28517 24 23.5 0
Matched 0.39243 0.3931 -0.1 99.4 -0.11 0.915
State of Residence (UP Omitted) Jammu & Kashmir Unmatched 0.01072 0.02043 -7.8 -7.22 0
Matched 0.01265 0.0134 -0.6 92.2 -0.52 0.606
Himachal Pradesh Unmatched 0.02321 0.03801 -8.6 -8 0
Matched 0.02757 0.02858 -0.6 93.2 -0.47 0.637
Uttarakhand Unmatched 0.0088 0.01218 -3.3 -3.12 0.002
Matched 0.01028 0.01088 -0.6 82.6 -0.44 0.657
Punjab Unmatched 0.00603 0.05815 -29.9 -25.72 0
Matched 0.00717 0.01012 -1.7 94.3 -2.46 0.014
Haryana Unmatched 0.02009 0.04866 -15.7 -14.28 0
Matched 0.02386 0.02622 -1.3 91.7 -1.16 0.245
Delhi Unmatched 0.01469 0.02743 -8.9 -8.18 0
Matched 0.01737 0.0188 -1 88.7 -0.83 0.408
Bihar Unmatched 0.03372 0.03469 -0.5 -0.52 0.606
Matched 0.03912 0.04055 -0.8 -47.2 -0.56 0.573
Jharkhand Unmatched 0.01981 0.02346 -2.5 -2.39 0.017
Matched 0.02293 0.02276 0.1 95.4 0.09 0.931
Rajasthan Unmatched 0.0433 0.06825 -10.9 -10.16 0
Matched 0.05117 0.05918 -3.5 67.9 -2.7 0.007
Chhattisgarh Unmatched 0.03301 0.02586 4.2 4.16 0
Matched 0.03625 0.03777 -0.9 78.8 -0.62 0.536
Madhya Pradesh Unmatched 0.06162 0.07059 -3.6 -3.45 0.001
Matched 0.07258 0.0854 -5.2 -42.8 -3.66 0

52
(contd..)
Unmatched Mean %reduct t-test Prob < t
Variable Matched BPL/AAY Non-BPL %bias bias
Northeast Unmatched 0.02414 0.02382 0.2 0.2 0.843
Matched 0.02664 0.02689 -0.2 19.5 -0.12 0.904
Assam Unmatched 0.01867 0.02747 -5.9 -5.49 0
Matched 0.02217 0.02411 -1.3 78 -0.99 0.321
West Bengal Unmatched 0.04153 0.06537 -10.6 -9.91 0
Matched 0.04873 0.05724 -3.8 64.3 -2.93 0.003
Orissa Unmatched 0.0739 0.03732 16 16.28 0
Matched 0.06399 0.05547 3.7 76.7 2.77 0.006
Gujarat Unmatched 0.05743 0.0506 3 2.94 0.003
Matched 0.05952 0.0607 -0.5 82.7 -0.38 0.702
Maharashtra & Goa Unmatched 0.06836 0.08766 -7.2 -6.82 0
Matched 0.0768 0.07781 -0.4 94.8 -0.29 0.771
Andhra Pradesh Unmatched 0.1052 0.03473 27.9 29.23 0
Matched 0.07739 0.06255 5.9 78.9 4.48 0
Karnataka Unmatched 0.16285 0.06289 32 33.03 0
Matched 0.12334 0.10521 5.8 81.9 4.39 0
Kerala Unmatched 0.04408 0.04046 1.8 1.75 0.08
Matched 0.04915 0.04839 0.4 79.1 0.27 0.786
Tamil Nadu Unmatched 0.08007 0.03918 17.3 17.66 0
Matched 0.07343 0.06736 2.6 85.2 1.83 0.068
Sample Size Unmatched 41,554
Matched 23,724 Source: Authors’ calculations from IHDS data.

53
Table 5.1b: Distribution of BPL/AAY and non BPL households, before and after PSM
matching 2011-12
Unmatched Mean %reduct t-test Prob < t
Variable Matched Treated Control %bias bias Log Income Per Capita Unmatched 9.4605 9.9607 -52.1 -51.22 0
Matched 9.5024 9.5243 -2.3 95.6 -1.99 0.047
Squared Term for Income Unmatched 90.249 100.31 -53.9 -52.68 0
Matched 91.085 91.498 -2.2 95.9 -1.98 0.047
Negative Income Unmatched 0.01495 0.01425 0.6 0.59 0.557
Matched 0.01379 0.01441 -0.5 11.2 -0.42 0.672
Own/Cultivate Farm Unmatched 0.462 0.43552 5.3 5.34 0
Matched 0.45809 0.46004 -0.4 92.6 -0.31 0.754
Any work in Wage and
Salary Unmatched 0.82533 0.66652 37.1 36.36 0
Matched 0.79919 0.7893 2.3 93.8 1.96 0.05
OBC Unmatched 0.35375 0.32935 5.1 5.17 0
Matched 0.34842 0.36649 -3.8 25.9 -3.02 0.003
Dalit Unmatched 0.27509 0.17115 25.2 25.67 0
Matched 0.26165 0.25113 2.5 89.9 1.93 0.054
Adivasi Unmatched 0.12676 0.06025 23 23.86 0
Matched 0.11552 0.09581 6.8 70.4 5.14 0
Muslim Unmatched 0.10361 0.12227 -5.9 -5.86 0
Matched 0.11482 0.12393 -2.9 51.2 -2.25 0.024
Christian/Sikh/Jain Unmatched 0.0135 0.03829 -15.7 -14.97 0
Matched 0.01706 0.01807 -0.6 95.9 -0.62 0.537
Household Size Unmatched 4.8424 4.8648 -1 -0.97 0.334
Matched 4.8934 4.8794 0.6 37.4 0.48 0.628
Highest level education by adult household members (none omitted) Std 1-5 Unmatched 0.0795 0.04679 13.5 13.86 0
Matched 0.07634 0.0726 1.5 88.6 1.14 0.254
Std 5-8 Unmatched 0.36074 0.29117 14.9 15 0
Matched 0.37249 0.38082 -1.8 88 -1.38 0.168

54
(contd..)
Unmatched Mean %reduct t-test Prob < t
Variable Matched Treated Control %bias bias
Std 10-11 Unmatched 0.13447 0.15147 -4.9 -4.84 0
Matched 0.13803 0.14737 -2.7 45 -2.14 0.032
Higher Sec. & Some College Unmatched 0.1018 0.15548 -16.1 -15.82 0
Matched 0.1138 0.1177 -1.2 92.7 -0.98 0.329
Graduate Unmatched 0.07625 0.23565 -45 -43.18 0
Matched 0.08701 0.08755 -0.2 99.7 -0.15 0.877
No. of Assets Owned Unmatched 12.39 16.462 -70.5 -69.6 0
Matched 12.855 13.18 -5.6 92 -4.69 0
Place of residence (Metro omitted) Non Metro Urban Unmatched 0.18558 0.29314 -25.4 -25.05 0
Matched 0.19801 0.20393 -1.4 94.5 -1.18 0.237
Developed Village Unmatched 0.36743 0.30251 13.8 13.88 0
Matched 0.34546 0.34928 -0.8 94.1 -0.64 0.521
Less Developed Village Unmatched 0.40872 0.30853 21 21.18 0
Matched 0.41291 0.40279 2.1 89.9 1.65 0.099
State of Residence (UP Omitted) Jammu & Kashmir Unmatched 0.01091 0.02117 -8.2 -7.93 0
Matched 0.01379 0.01511 -1.1 87.1 -0.89 0.374
Himachal Pradesh Unmatched 0.0317 0.03739 -3.1 -3.09 0.002
Matched 0.03754 0.03973 -1.2 61.6 -0.91 0.365
Uttarakhand Unmatched 0.00814 0.01307 -4.8 -4.71 0
Matched 0.01013 0.01153 -1.4 71.6 -1.09 0.278
Punjab Unmatched 0.03303 0.04872 -7.9 -7.8 0
Matched 0.04058 0.04066 0 99.5 -0.03 0.975
Haryana Unmatched 0.03164 0.05014 -9.3 -9.16 0
Matched 0.03957 0.04027 -0.4 96.2 -0.29 0.774

55
(contd..)
Unmatched Mean %reduct t-test Prob < t
Variable Matched Treated Control %bias bias
Delhi Unmatched 0.01272 0.02707 -10.3 -9.95 0
Matched 0.01644 0.0194 -2.1 79.4 -1.79 0.074
Bihar Unmatched 0.04876 0.02877 10.4 10.67 0
Matched 0.04681 0.03996 3.6 65.7 2.7 0.007
Jharkhand Unmatched 0.01597 0.0231 -5.2 -5.07 0
Matched 0.02025 0.0215 -0.9 82.5 -0.7 0.485
Rajasthan Unmatched 0.0405 0.07973 -16.6 -16.08 0
Matched 0.05203 0.0592 -3 81.7 -2.51 0.012
Chhattisgarh Unmatched 0.04466 0.02282 12.1 12.56 0
Matched 0.04237 0.03443 4.4 63.6 3.31 0.001
Madhya Pradesh Unmatched 0.07842 0.07127 2.7 2.73 0.006
Matched 0.09332 0.09106 0.9 68.4 0.63 0.532
Northeast Unmatched 0.022 0.02066 0.9 0.93 0.351
Matched 0.02485 0.02446 0.3 70.9 0.2 0.841
Assam Unmatched 0.02116 0.02491 -2.5 -2.49 0.013
Matched 0.02648 0.02703 -0.4 85.5 -0.27 0.787
West Bengal Unmatched 0.04533 0.06603 -9 -8.89 0
Matched 0.05663 0.05686 -0.1 98.9 -0.08 0.936
Orissa Unmatched 0.06395 0.03916 11.2 11.53 0
Matched 0.06325 0.0525 4.9 56.6 3.69 0
Gujarat Unmatched 0.03405 0.05667 -10.9 -10.64 0
Matched 0.04292 0.04759 -2.2 79.3 -1.8 0.072
Maharashtra & Goa Unmatched 0.05841 0.09901 -15.1 -14.79 0
Matched 0.07267 0.07859 -2.2 85.4 -1.79 0.073
Andhra Pradesh Unmatched 0.11398 0.01192 43 47.15 0
Matched 0.03046 0.02274 3.2 92.4 3.84 0
Karnataka Unmatched 0.15086 0.05293 32.8 34.49 0
Matched 0.1022 0.08451 5.9 81.9 4.87 0

56
(contd..)
Unmatched Mean %reduct t-test Prob < t
Variable Matched Treated Control %bias bias Kerala Unmatched 0.02736 0.04356 -8.8 -8.59 0
Matched 0.03497 0.0405 -3 65.9 -2.33 0.02
Tamil Nadu Unmatched 0.04882 0.04951 -0.3 -0.32 0.751
Matched 0.0585 0.06348 -2.3 -628.3 -1.67 0.095
Sample Size Unmatched 42,152
Matched 25,718 Source: Authors’ calculations from IHDS data.
Descriptive statistics for the full sample have been provided in Chapters 1-5. In this
chapter and in Chapter 7, our goal is to examine the behavioural models underlying
household food consumption decisions. Although matching households on comparable
characteristics reduces the sample size, it provides less biased estimates of differences
between two groups. Consequently, PSM has emerged as a preferred method when
random assignment is not feasible.
5.4 Access to BPL/AAY Card Increases PDS Purchase
When we examine the matched samples, we find that for all income categories,
households that have access to BPL/AAY cards are more likely to purchase cereals from
the PDS in the month preceding the survey. This is not surprising as households that are
eligible for a higher PDS subsidy via BPL/AAY prices would be more likely to use the PDS.
What is surprising is that a substantial proportion of the BPL households continue
to rely on the PDS at both low and high incomes. Among the BPL households, PDS use was
seen to decline only after the per capita income touched Rs 3,500 per month in 2004-05,
and Rs 4,500 per month in 2011-12 – a level that 90 per cent of the households failed to
attain in these periods. This suggests that regardless of current income, households are
sensitive to cereal prices and when cheaper cereals are available, these households
continue to purchase from the PDS shops regardless of any concerns about inconvenience
and grain quality.

57
Table 5.2: Per cent households purchasing cereals from PDS by BPL/AAY cardholders and
non-BPL households in PSM matched sample, 2004-05 and 2011-12
2004-05 2011-12
Monthly Income Per
Capita
Non-BPL
Households
BPL/AAY
Households
Non-BPL
Households
BPL/AAY
Households
500 and below 13.86 54.21 19.69 88.05
501-1000 14.68 56.90 24.26 88.57
1001-1500 17.28 55.92 30.65 88.93
1501-2000 15.32 55.14 34.06 89.05
2001-2500 13.16 46.41 38.74 87.32
2501-3000 15.40 48.04 40.52 86.82
3001-3500 14.22 38.89 41.53 86.98
3501-4500 15.35 35.59 40.55 83.23
4501-5500 12.93 28.44 36.80 81.90
5501-6000 13.51 31.03 26.83 75.36
6000 and above 7.75 28.24 30.00 64.60
Total 14.80 53.77 29.32 87.40
T-Statistic from PSM Samples
BPL Vs. Non BPL Samples (Matched within survey round)
2004-05 69.3***
2011-12 120.0***
Note: *** p <= .001, ** p <= 0.01, * p <= 0.05.
Source: Authors’ calculations from IHDS data.
The increasing use of the PDS for both BPL and non-BPL households between 2004-
05 and 2011-12 is a testament to this price sensitivity. As Figure 5.1 shows, among the
IHDS households, implicit subsidies per kilogram of rice and wheat, defined as the
difference between the average market price and the average PDS price, for both BPL and
non-BPL families increased substantially between 2004-05 and 2011-12. Not
surprisingly, the household tendency to purchase from the PDS also increased.
Consequently, in our matched sample, in 2004-05, 15 per cent of the non-BPL households
and 54 per cent of the BPL households purchased food from the PDS, and by 2011-12, this
proportion had risen to 29 per cent and 87 per cent, respectively.

58
Figure 5.1: Implicit subsidy for rice and wheat in PDS, 2004-05 and 2011-12 (in 2011-12
constant prices)
Source: Authors’ calculations from IHDS data.
One anomaly in Table 5.2 should be noted. When households with incomes of less
than Rs 1,000 per month are denied BPL/AAY cards, they also seem to be excluded from
PDS purchase during the year 2011-12.
12.1
8.2
18.8
10.5
0
2
4
6
8
10
12
14
16
18
20
Difference Rice Difference Wheat
Rs.
per
Kg.
(20
11
-12
co
nst
ant)
2004-05 2011-12

59
6. Access to PDS and Dietary Composition
6.1 Introduction
This report began with the goal of understanding ways in which access to food subsidy
changes the consumption patterns of Indian households. In this chapter, we examine the
way in which households with access to the TPDS via BPL/AAY cards differ in their
consumption behaviour from their peers who do not have these cards. All the results
presented in this chapter are based on the Propensity Score Matching technique
described in Chapter 5.
6.2 Similar Incomes, Different Consumption Patterns
As we look at different aspects of household consumption decisions between households
with BPL/AAY cards and those that do not have these cards, it is important to check if
these households have similar income levels. Since we matched households on income,
by definition, they should be similar. Table 6.1 supports this expectation and shows that
Key messages
Households with BPL/AAY cards have very different consumption patterns than
matched households that do not have these cards.
The share of expenditure on food for households with BPL/AAY cards is smaller
than that for their peers. Once implicit subsidies via PDS transfers are factored in,
this difference is smaller but remains statistically significant.
It appears that households with BPL/AAY cards are trying to obtain their caloric
needs from cheaper cereals rather than from more expensive items like dairy,
fruits, nuts and meats.
Rising incomes lead to greater dietary diversification for households without BPL
cards than matched households with BPL cards.

60
the mean per capita income for BPL/AAY households in the matched sample for 2004-05
and 2011-12 is very similar to that of their non-BPL counterparts. The results show that
for 2004-05, the mean incomes in two groups are almost identical. For 2011-12, the non-
BPL group has slightly higher incomes but the difference is not statistically significant at
the 0.05 level.
Table 6.1: Income per capita (in constant 2011-12 Rs.) for BPL/AAY cardholders and Non
BPL households in PSM matched sample, 2004-05 and 2011-12
2004-05 2011-12
Monthly Income Per Capita
Non-BPL
Households
BPL/AAY
Households
Non-BPL
Households
BPL/AAY
Households
500 and below 282 289 263 255
501-1000 716 715 740 735
1001-1500 1207 1206 1214 1213
1501-2000 1702 1705 1714 1711
2001-2500 2199 2193 2205 2208
2501-3000 2705 2697 2714 2708
3001-3500 3183 3182 3192 3200
3501-4500 3882 3869 3915 3903
4501-5500 4826 4911 4895 4892
5501-6000 5655 5665 5719 5665
6000 and above 9167 10742 8968 10212
Total 1158 1157 1621 1598
T-Statistic from PSM Samples
BPL Vs. Non BPL Samples (Matched within survey round)
2004-05 0.08
2011-12 0.96
Note: *** p <= .001, ** p <= 0.01, * p <= 0.05.
Source: Authors’ calculations from IHDS data.
However, having similar incomes does not imply similar consumption patterns
across the two groups. Table 6.2 shows a comparison of the per capita consumption
across the two groups, which reveals significant differences. It shows lower per capita
expenditure for the BPL households during both years. The average difference is Rs 115
in 2004-05, and Rs 158 in 2004-05 with BPL/AAY households spending less than non-
BPL households. In both cases, the difference is statistically significant. This difference
may well be due to the underlying long-term poverty of the BPL/AAY households. As
research on the link between income and consumption suggests, individuals are more
likely to shape their consumption according to long-term income (often seen as being
permanent income) than to short-term fluctuations (Friedman, 1957). However, when

61
we look at the composition of household expenditure—particularly the expenditure on
food—this explanation does not seem fully satisfactory.
Table 6.2: Mean per capita consumption expenditure (in constant 2011-12 Rs.) for
BPL/AAY cardholders and non BPL households in PSM matched sample, 2004-05 and
2011-12
2004-05 2011-12
Monthly Income Per Capita
Non-BPL
Households
BPL/AAY
Households
Non-BPL
Households
BPL/AAY
Households
500 and below 998 930 1337 1263
501-1000 1113 1063 1415 1251
1001-1500 1446 1341 1604 1542
1501-2000 1692 1578 1885 1778
2001-2500 1950 1742 2106 2119
2501-3000 2353 1957 2572 2268
3001-3500 2602 2269 2613 2280
3501-4500 2734 2612 2930 2715
4501-5500 3339 2858 3421 2998
5501-6000 3135 2907 4060 3349
6000 and above 4198 3697 4664 4267
Total 1390 1276 1848 1690
T-Statistic from PSM Samples
BPL Vs. Non BPL Samples (Matched within survey round)
2004-05 7.11***
2011-12 7.01***
Note: *** p <= .001, ** p <= 0.01, * p <= 0.05.
Source: Authors’ calculations from IHDS data.
Research across the world shows that poorer households tend to spend a greater
proportion of their expenditure on food (Brown and Deaton, 1972; Ritson and Hutchins,
1995). In fact, the proportion of income spent on food is often used as an indicator of
poverty. If the BPL/AAY households in this matched sample are chronically more poor
than their non-BPL counterparts, their expenditure should be more skewed toward food
than that of the non-BPL households. However, the data on the ratio of food to non-food
expenditure in Table 6.3 indicates that this is not the case. Higher incomes are clearly
associated with a declining ratio of food to non-food items, but at any given income level,
the BPL/AAY households seem to incur a lower food expenditure as opposed to non-food
expenditure than households that do not have BPL/AAY cards. This difference was

62
relatively small in 2004-05 but widened by 2011-12, and became statistically significant
at the 0.001 level.
Table 6.3: Ratio of food to non-food expenditure for BPL/AAY cardholders and non BPL
households in PSM matched sample, 2004-05 and 2011-12
2004-05 2011-12
Monthly Income Per Capita
Non-BPL
Households
BPL/AAY
Households
Non-BPL
Households
BPL/AAY
Households
500 and below 2.40 2.20 1.51 1.41
501-1000 2.23 2.18 1.52 1.42
1001-1500 1.89 1.91 1.47 1.34
1501-2000 1.76 1.77 1.37 1.30
2001-2500 1.36 1.68 1.31 1.16
2501-3000 1.33 1.48 1.16 1.16
3001-3500 1.37 1.51 1.11 1.40
3501-4500 1.19 1.32 1.10 1.13
4501-5500 1.12 1.33 0.99 0.97
5501-6000 0.95 1.40 0.88 0.89
6000 and above 1.29 1.09 0.85 0.95
Total 2.04 2.01 1.39 1.32
T-Statistic from PSM Samples
BPL Vs. Non BPL Samples (Matched within survey round)
2004-05 1.15
2011-12 4.80***
Note: *** p <= .001, ** p <= 0.01, * p <= 0.05. Source: Authors’ calculations from IHDS data.
Table 6.3 highlights several interesting observations. First, the ratio of food to
non-food items steadily declined for all income categories between 2004-05 and 2011-
12. Going up as it did from a ratio of 2:1 to 1.3:1 over this short period, this decline is
considerably large. While this is consistent with theoretical expectations that growing
incomes lead to movement away from food, it is not applicable to this table. Since here
we are examining the same income levels after adjusting for inflation, the decline seems
to be a secular decline rather than simply the result of income growth. This change
suggests that growing demands on the consumer’s purse for other expenditures such as
education, health care, housing and transportation may play a substantial role in
squeezing his food expenditure. Second, we see that in 2011-12, the gap between the
BPL/AAY and the non-BPL households widened at the lowest income groups. In the case
of households with per capita monthly incomes of Rs 1,000 or less (those placed near or
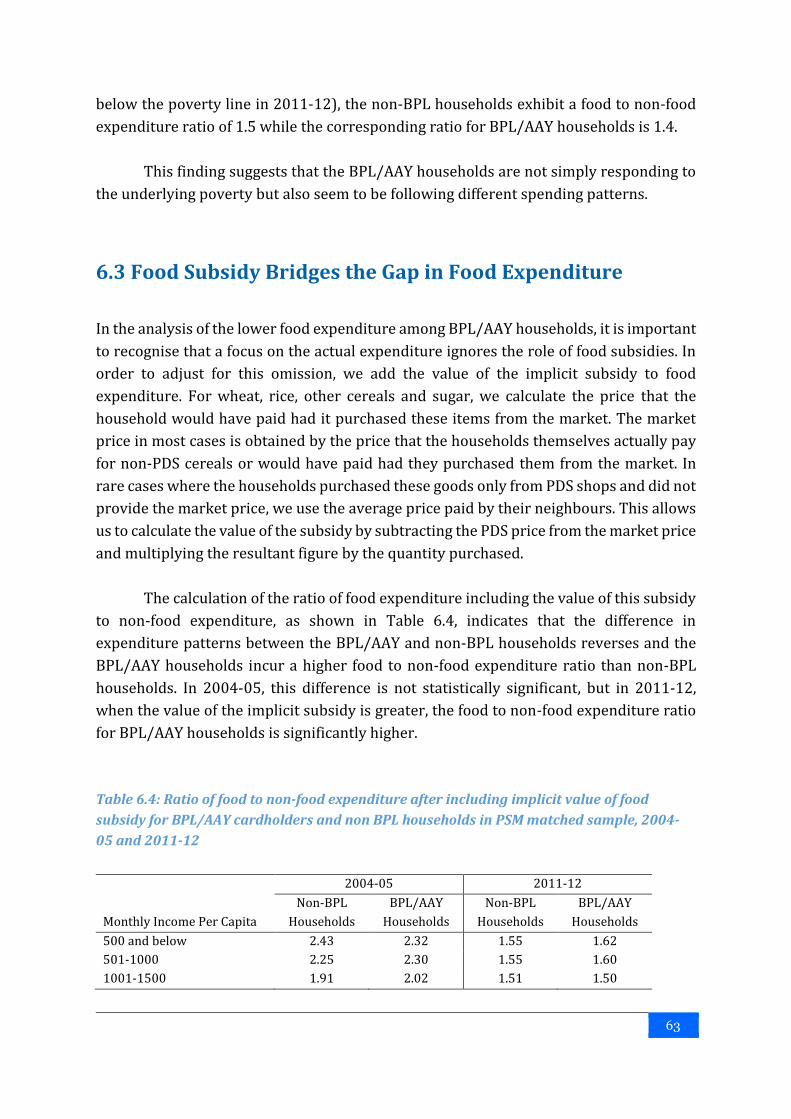
63
below the poverty line in 2011-12), the non-BPL households exhibit a food to non-food
expenditure ratio of 1.5 while the corresponding ratio for BPL/AAY households is 1.4.
This finding suggests that the BPL/AAY households are not simply responding to
the underlying poverty but also seem to be following different spending patterns.
6.3 Food Subsidy Bridges the Gap in Food Expenditure
In the analysis of the lower food expenditure among BPL/AAY households, it is important
to recognise that a focus on the actual expenditure ignores the role of food subsidies. In
order to adjust for this omission, we add the value of the implicit subsidy to food
expenditure. For wheat, rice, other cereals and sugar, we calculate the price that the
household would have paid had it purchased these items from the market. The market
price in most cases is obtained by the price that the households themselves actually pay
for non-PDS cereals or would have paid had they purchased them from the market. In
rare cases where the households purchased these goods only from PDS shops and did not
provide the market price, we use the average price paid by their neighbours. This allows
us to calculate the value of the subsidy by subtracting the PDS price from the market price
and multiplying the resultant figure by the quantity purchased.
The calculation of the ratio of food expenditure including the value of this subsidy
to non-food expenditure, as shown in Table 6.4, indicates that the difference in
expenditure patterns between the BPL/AAY and non-BPL households reverses and the
BPL/AAY households incur a higher food to non-food expenditure ratio than non-BPL
households. In 2004-05, this difference is not statistically significant, but in 2011-12,
when the value of the implicit subsidy is greater, the food to non-food expenditure ratio
for BPL/AAY households is significantly higher.
Table 6.4: Ratio of food to non-food expenditure after including implicit value of food
subsidy for BPL/AAY cardholders and non BPL households in PSM matched sample, 2004-
05 and 2011-12
2004-05 2011-12
Monthly Income Per Capita
Non-BPL
Households
BPL/AAY
Households
Non-BPL
Households
BPL/AAY
Households
500 and below 2.43 2.32 1.55 1.62
501-1000 2.25 2.30 1.55 1.60
1001-1500 1.91 2.02 1.51 1.50

64
(contd…)
2004-05 2011-12
Monthly Income Per Capita
Non-BPL
Households
BPL/AAY
Households
Non-BPL
Households
BPL/AAY
Households
1501-2000 1.78 1.86 1.40 1.44
2001-2500 1.37 1.76 1.35 1.30
2501-3000 1.34 1.55 1.20 1.30
3001-3500 1.39 1.58 1.15 1.56
3501-4500 1.21 1.36 1.14 1.25
4501-5500 1.13 1.36 1.03 1.08
5501-6000 0.96 1.44 0.90 0.98
6000 and above 1.30 1.11 0.88 1.03
Total 2.07 2.12 1.43 1.49
T-Statistic from PSM Samples
BPL Vs. Non BPL Samples (Matched within survey round)
2004-05 1.56
2011-12 3.33***
Note: *** p <= .001, ** p <= 0.01, * p <= 0.05.
Source: Authors’ calculations from IHDS data.
This observation has interesting implications. On the one hand, it is heartening to
see that the PDS subsidies help BPL/AAY households address some of the decline in their
food expenditure caused by rising costs and aspirations reflected in other expenditures
such as on education and health care. On the other hand, it suggests the domination of the
substitution rather than the income effect.
We began this report by seeking to understand how food subsidies may affect the
food consumption choices made by households (See Figure 1.3). We outlined two
potential pathways: (1) The Income Effect – where the savings from lower cereal prices
might be applied to purchasing a diverse food basket with higher nutritional value foods;
and, (2) The Substitution Effect – where households may use these savings for other
purchases. The results presented above strongly suggest that the substitution effect
seems to dominate, particularly in 2011-12, where households with BPL cards spend a
smaller portion of their overall expenditure on food, relying on subsidies to make up the
difference.

65
6.4 Differential Allocation to Cereals, Cereal Complements
and Substitutes
Conventional wisdom suggests that higher incomes lead to the consumption of a greater
number of calories (Strauss and Thomas, 1995). This research has been buttressed by
computations of Engel curves, which show that higher incomes lead to greater
expenditure on food but at a declining rate. However, this conventional wisdom is not
always consistent with empirical observations. Empirical research often finds that higher
income does not translate into higher caloric intake (Behrman and Deolalikar, 1987;
Bocoum et al., 2014) and over time, the Engel curve of caloric consumption in India has
become increasingly flat (Deaton and Dreze, 2009). Part of this disjunction may be
associated with the source of caloric intake (Bhargava, 2014). Poor households may
obtain calories from cheaper staples like cereals whereas richer households may obtain
their calories from a more diversified food basket that includes fish, meat, eggs, fruits,
nuts and dairy but they may need fewer calories due to lower likelihood of engaging in
physically demanding work.
It may be helpful to revisit the role of the PDS in household nutrition in the context
of this distinction between caloric consumption and the source of calories. Indian diets in
all parts of the country are carbohydrate-rich. By providing cheaper rice, wheat, and to a
more limited extent, coarse cereals, the PDS strengthens carbohydrate consumption. But
these starchy foods must be consumed with items like vegetables and pulses, which are
referred to as cereal complements. In contrast, foods like dairy products, nuts, fruits and
meat may act as substitutes for cereals in providing alternative sources of calories. Hence
we divide household food expenditure into the following four categories:
1. Cereals—which includes rice, wheat and coarse cereals.
2. Cereal complements—which includes pulses, eggs, oil and vegetables.
3. Cereal substitutes—which includes meat, fruits, nuts and milk.
4. Other foods—which includes sugar and other sweeteners, restaurant food
and other items like spices.
Tables 6.5a to 6.5d show the proportion of household food budget allocated to
these four categories, inclusive of the contribution of implicit subsidies for rice, wheat,
other cereals and sugar to the household food expenditure.

66
Table 6.5a: Expenditure on cereals as proportion of food expenditure after including
implicit value of food subsidy for BPL/AAY cardholders and non BPL households in PSM
matched sample, 2004-05 and 2011-12
2004-05 2011-12
Monthly Income Per Capita
Non-BPL
Households
BPL/AAY
Households
Non-BPL
Households
BPL/AAY
Households
500 and below 0.38 0.40 0.30 0.33
501-1000 0.35 0.36 0.28 0.30
1001-1500 0.30 0.32 0.25 0.27
1501-2000 0.27 0.29 0.23 0.25
2001-2500 0.25 0.28 0.23 0.25
2501-3000 0.26 0.28 0.22 0.24
3001-3500 0.24 0.26 0.22 0.23
3501-4500 0.25 0.24 0.21 0.23
4501-5500 0.23 0.24 0.20 0.22
5501-6000 0.21 0.22 0.21 0.20
6000 and above 0.20 0.23 0.20 0.21
Total 0.33 0.34 0.26 0.28
T-Statistic from PSM Samples
BPL Vs. Non BPL Samples (Matched within survey round)
2004-05 8.28***
2011-12 13.84***
Note: *** p <= .001, ** p <= 0.01, * p <= 0.05.
Source: Authors’ calculations from IHDS data.
Table 6.5b: Expenditure on cereal complements (+) as proportion of food expenditure after
including implicit value of food subsidy for BPL/AAY cardholders and non BPL households
in PSM matched sample, 2004-05 and 2011-12
2004-05 2011-12
Monthly Income Per Capita
Non-BPL
Households
BPL/AAY
Households
Non-BPL
Households
BPL/AAY
Households
500 and below 0.25 0.25 0.29 0.28
501-1000 0.25 0.25 0.28 0.28
1001-1500 0.25 0.25 0.28 0.27
1501-2000 0.25 0.24 0.26 0.27
2001-2500 0.24 0.24 0.26 0.25
2501-3000 0.24 0.24 0.26 0.25
3001-3500 0.23 0.23 0.26 0.25
3501-4500 0.23 0.24 0.24 0.25
4501-5500 0.22 0.24 0.24 0.25
5501-6000 0.22 0.26 0.23 0.24
6000 and above 0.23 0.22 0.24 0.24
Total 0.25 0.25 0.27 0.27

67
(contd…)
2004-05 2011-12
Monthly Income Per Capita
Non-BPL
Households
BPL/AAY
Households
Non-BPL
Households
BPL/AAY
Households
T-Statistic from PSM Samples
BPL Vs. Non BPL Samples (Matched within survey round)
2004-05 0.37
2011-12 0.13
Note: *** p <= .001, ** p <= 0.01, * p <= 0.05.
+Cereal complements includes pulses, vegetables, eggs and oil.
Source: Authors’ calculations from IHDS data.
Table 6.5c: Expenditure on cereal substitutes (+) as proportion of food expenditure after
including implicit value of food subsidy for BPL/AAY cardholders and non BPL households
in PSM matched sample, 2004-05 and 2011-12
2004-05 2011-12
Monthly Income Per Capita
Non-BPL
Households
BPL/AAY
Households
Non-BPL
Households
BPL/AAY
Households
500 and below 0.16 0.15 0.20 0.18
501-1000 0.18 0.18 0.22 0.21
1001-1500 0.22 0.21 0.25 0.24
1501-2000 0.25 0.23 0.28 0.26
2001-2500 0.27 0.24 0.29 0.28
2501-3000 0.26 0.24 0.29 0.28
3001-3500 0.26 0.27 0.30 0.30
3501-4500 0.27 0.28 0.31 0.29
4501-5500 0.29 0.28 0.32 0.30
5501-6000 0.29 0.30 0.32 0.31
6000 and above 0.30 0.30 0.33 0.29
Total 0.20 0.19 0.25 0.23
T-Statistic from PSM Samples
BPL Vs. Non-BPL Samples (Matched within survey round)
2004-05 5.55***
2011-12 10.10***
Note: *** p <= .001, ** p <= 0.01, * p <= 0.05.
+Cereal substitutes includes dairy, fruits and nuts and meat.
Source: Authors’ calculations from IHDS data.

68
Table 6.5d: Expenditure on other foods (+) as proportion of food expenditure after
including implicit value of food subsidy for BPL/AAY cardholders and non BPL households
in PSM matched sample, 2004-05 and 2011-12
2004-05 2011-12
Monthly Income Per Capita
Non-BPL
Households
BPL/AAY
Households
Non-BPL
Households
BPL/AAY
Households
500 and below 0.19 0.19 0.20 0.19
501-1000 0.20 0.19 0.20 0.19
1001-1500 0.21 0.21 0.20 0.20
1501-2000 0.21 0.21 0.21 0.20
2001-2500 0.21 0.21 0.20 0.20
2501-3000 0.22 0.22 0.21 0.20
3001-3500 0.23 0.22 0.20 0.20
3501-4500 0.23 0.22 0.21 0.21
4501-5500 0.23 0.22 0.22 0.21
5501-6000 0.24 0.20 0.21 0.22
6000 and above 0.23 0.22 0.21 0.23
Total 0.204 0.199 0.202 0.198
T-Statistic from PSM Samples
BPL Vs. Non BPL Samples (Matched within survey round)
2004-05 4.20***
2011-12 3.56***
Note: *** p <= .001, ** p <= 0.01, * p <= 0.05.
+ Other foods includes sweeteners, restaurant food, spices and other items
Source: Authors’ calculations from IHDS data.
The above four tables (6.5a–6.5d) present an interesting picture. Overall,
households with BPL cards appear to spend a greater proportion of their food budget on
cereals at every income level (Table 6.5a). Note that these calculations include the value
of the implicit subsidy for cereals. This difference is statistically significant for both the
years, 2004-05 and 2011-12. The expenditure share of cereal complements such as dal
and vegetables is about the same for BPL/AAY households and other households (Table
6.5b). However, as Table 6.5c shows, the share of cereal substitutes such as dairy, fruits
and meat is substantially lower, even at the highest income levels for the BPL/AAY
households. This difference is statistically significant in both 2004-05 and 2011-12 but
the magnitude of the difference is larger in 2011-12. The expenditure incurred on other
food items is slightly smaller for the BPL/AAY households than for other households but
the difference, while statistically significant, is very small in size.

69
These results suggest that access to cheaper cereals via the PDS skews household
consumption towards cereals and cereal complements and away from foods that might
be seen as cereal substitutes such as milk, fruit, nuts and meat.
6.5 BPL/AAY Access Associated with Lower Food Diversity
The preceding section discussed the skewing of expenditure in favour of cereals in the
context of access to BPL/AAY cards. The consequences of this bias in terms of the actual
cereal consumption are delineated below. Overall cereal consumption in India has been
falling as measured by both the NSS (Table 1.1) and IHDS. In some ways, this is not
surprising as a rise in incomes may lead to a preference for a more diversified diet and a
concomitant reduction in the consumption of cereals (Ritson and Hutchins, 1995).
However, within the context of this decline, if income, social background and place of
residence are held constant, it may be seen that households with BPL/AAY cards exhibit
higher cereal consumption than those without these cards.
Table 6.6a: Per capita monthly consumption of cereals (in kg) for BPL/AAY cardholders
and non BPL households in PSM matched sample, 2004-05 and 2011-12
Cereals per person per month (in Kg)
2004-05 2011-12
Monthly Income Per Capita
Non-BPL
Households
BPL/AAY
Households
Non-BPL
Households
BPL/AAY
Households
500 and below 11.66 11.74 11.50 12.27
501-1000 11.46 11.71 11.13 11.77
1001-1500 11.08 11.52 11.17 11.66
1501-2000 11.20 11.58 10.96 11.93
2001-2500 10.77 11.30 11.02 11.72
2501-3000 11.29 11.89 11.17 11.80
3001-3500 11.19 12.04 11.57 11.85
3501-4500 11.75 11.46 11.25 11.70
4501-5500 12.15 11.94 11.18 11.88
5501-6000 10.57 12.40 11.28 12.22
6000 and above 12.16 13.13 12.10 12.41
Total 11.40 11.68 11.22 11.87
T-Statistic from PSM Samples
BPL Vs. Non BPL Samples (Matched within survey round)
2004-05 4.29***
2011-12 10.43***
Note: *** p <= .001, ** p <= 0.01, * p <= 0.05
Source: Authors’ calculations from IHDS data.

70
As seen in Table 6.6a, cereal consumption for the non-BPL PSM sample fell from
11.40 kg per person per month in 2004–05 to a corresponding figure of 11.22 kg in 2011–
12. In contrast, cereal consumption for the BPL sample increased slightly from 11.66 to
11.87 kg. While carrying out comparisons across the survey rounds, it is important to
remember that the PSM matching is done within a round and hence, the PSM samples
across surveys are not strictly comparable. The BPL and non-BPL samples within a survey
round are quite comparable and show that in each round, and at all income levels, access
to food subsidy via BPL/AAY prices is associated with a higher consumption of cereals.
Moreover, this difference persists at almost all income levels.
These results prove that a person living in a BPL/AAY household consumed an
additional 280 grams of cereal as compared to his or her non-BPL peers in 2004-05, and
this difference rose to 650 grams by 2011-12. However, a reverse trend may be observed
in milk consumption. The average milk consumption of a BPL/AAY resident was about
0.2 litres less than that of his or her non-BPL counterparts in 2004-05, with the difference
growing to 0.44 litres by 2011-12 (Table 6.6b).
Research has shown that cereals constitute an easy source of cheap caloric intake
(Desai et al., 2016), and the results presented above too suggest that access to food
subsidy may contribute to increased caloric intake by augmenting cereal consumption.
However, at the same time, it may also lead to decreased dietary diversity. When we
compare per capita monthly milk intake for households with BPL/AAY cards and non-
BPL households, we see that in a matched sample, at any given income level, non-BPL
households have higher milk consumption than BPL/AAY households.
Table 6.6b: Per capita monthly consumption of milk (in ltr) for BPL/AAY cardholders and
Non BPL households in PSM matched sample, 2004-05 and 2011-12
Milk per person per month (in Ltr)
2004-05 2011-12
Monthly Income Per Capita
Non-BPL
Households
BPL/AAY
Households
Non-BPL
Households
BPL/AAY
Households
500 and below 1.66 1.50 1.87 1.68
501-1000 2.07 1.95 2.49 2.02
1001-1500 2.85 2.52 3.24 2.80
1501-2000 3.28 3.03 3.77 3.36
2001-2500 3.75 3.59 3.91 3.72
2501-3000 3.90 3.59 4.65 3.88
3001-3500 4.05 4.38 4.34 4.35
3501-4500 4.34 4.28 4.72 3.61
4501-5500 5.23 4.71 4.83 5.00

71
(contd…)
Milk per person per month (in Ltr)
2004-05 2011-12
Monthly Income Per Capita
Non-BPL
Households
BPL/AAY
Households
Non-BPL
Households
BPL/AAY
Households
5501-6000 4.35 4.28 5.82 5.97
6000 and above 6.15 6.40 6.09 4.84
Total 2.50 2.31 3.21 2.77
T-Statistic from PSM Samples
BPL Vs. Non BPL Samples (Matched within survey round)
2004-05 4.02***
2011-12 7.13***
Note: *** p <= .001, ** p <= 0.01, * p <= 0.05.
Source: Authors’ calculations from IHDS data.
These divergent patterns for actual milk and cereal consumption support the
results about the expenditure shares above with BPL/AAY access being associated with
higher cereal consumption and decreased milk consumption. One can thus conclude that
with economic growth, the threat of starvation recedes, but it is simultaneously
imperative to capitalise on this growth and the resultant improvement in financial
outcomes by focusing on dietary diversity rather than merely caloric consumption.

72
7. Role of PDS in the Context of Household Income
Fluctuations
7.1 Introduction
There is no doubt that poverty has steadily declined in India, but the aggregate figures
reflecting this poverty reduction actually mask considerable diversity. An assessment of
the economic status of individual households over time based on IHDS data clearly shows
that despite diminishing overall poverty, the profile of the poor is becoming increasingly
dynamic, as some people are moving out of poverty, while others who were earlier
characterised as being above the poverty line are becoming indigent and falling into the
BPL category. Figure 7.1 is based on the poverty ratios (HCR) calculated by using the
Tendulkar poverty lines for both 2004-05 and 2011-12 based on per capita consumption.
Key messages
When the same households are compared over time, the trends in food expenditure and food consumption vary between households that experience income growth vis-à-vis those that experience income declines.
Food expenditure among households that suffer economic distress does not change substantially, possibly because they economise in other areas. However, food expenditure for households experiencing income growth increases. This suggests that food expenditure has a sticky floor.
The increase in food expenditure with income growth is higher for households without BPL/AAY cards than for those with these cards, even after implicit food subsidies are taken into account.
Cereal consumption increases for all households experiencing substantial income growth but it is lower for households without BPL/AAY cards as compared to those with these cards.
The results from the household level fixed effects regression suggest that income elasticity for cereal consumption is small but positive, though it is greater for households owning BPL cards than for those without these cards.
Rising income is more likely to increase milk consumption for households without BPL/AAY cards than for those with these cards, suggesting that higher incomes lead to greater dietary diversification in the absence of subsidies for cereals.

73
The sample for this analysis comprises 34,643 households that were interviewed both in
2004-05 and 2011-12 (in 2011-12, this sample consisted of 40,018 households because
some of the root households had split between 2004-05 and 2011-12). While this figure
shows declining poverty, it also documents that in 2011-12, of the 22 per cent of those
characterised as poor, 9 per cent had become newly poor, which points to 40 per cent of
the poor in 2011-12 being newly poor. This situation documents tremendous
vulnerability among the households perched on the margins of indigence, wherein even
a slight change in financial status could propel them on either side of the poverty line.
How households cope with this fluctuation in fortunes is an important issue to be
addressed as we explore the use of the PDS as a social safety net.
Figure 7.1: Poverty transition between IHDS-I and IHDS-II
Source: Authors’ calculations from IHDS data.
Figure 7.1 highlights the churn in the household economic status using data on
consumption poverty. It has long been recognised that income fluctuates more than
consumption since individuals save during their peak working ages and consume when
they are unable to work (Modigliani and Brumberg, 1954). The IHDS data, therefore,
show tremendous income fluctuations over time—both in consumption and income, but
more in income.

74
Figure 7.2: Changes in per capita income between 2004-05 and 2011-12
Source: Authors’ calculations from IHDS data.
As can be seen from Figure 7.2, though a vast proportion of individuals live in households
where incomes grew by at least 20 per cent between 2004-05 and 2011-12, after
adjusting for inflation, about 28 per cent faced income declines of at least 20 per cent. The
changes in their food consumption is the main issue of investigation and forms the core
of this chapter.
7.2 Changes in Food Expenditure When Incomes Change
In this section, we compare different dimensions of food expenditure and intake for three
groups of households: (1) Households whose incomes declined by 20 per cent or more
between 2004-05 and 2011-12; (2) Households whose incomes remained more or less
stable and did not change by more than 20 per cent in either direction; and, (3)
Households whose incomes grew by 20 per cent or more. In each case, we compare the
inflation adjusted per capita incomes by using state-urban specific consumer price
indices (CPI-AL and CPI-IW). For each of these categories, we compare households with
BPL/AAY cards in 2011-12 with those not having these cards.
Food is the most basic commodity required for human sustenance. Consequently,
when incomes fall, households may economise on many other expenditures while trying
Income decline by 20% or
more28%
Income Almost Stable17%
Income increased by 20% or more
55%

75
to protect food expenditure as much as possible. Thus, we do not expect to see a
substantial decline in food expenditure in the context of an income decline. On an average,
both the BPL/AAY and non-BPL households spent about the same in 2011-12 as in 2004-
05 in spite of experiencing considerable economic distress (Panel A of Table 7.1a). The
only surprise is the slightly higher food expenditure for households with per capita
incomes of Rs 500 or less. For this distressed group, the difference between the BPL/AAY
and non-BPL households is not statistically significant. For households whose incomes
remained more or less stable as well as for those who experienced considerable income
growth, expenditure on food increased consistently. However, this increase is greater for
non-BPL households than for BPL/AAY households. Note that since we are comparing the
same households at two points in time, all the other characteristics such as caste/religion
and place of residence are held constant.
Table 7.1a: Changes in per capita food expenditure (exclusive of subsidy) for BPL/AAY and
non-BPL households between 2004-05 and 2011-12 (in 2011-12 Rs.)
Per Capita income
in 2011-12
Income Decline of 20%+ Stable income (+ or - 20%) Income Growth (20%+)
Non-BPL BPL/AAY Non-BPL BPL/AAY Non-BPL BPL/AAY
500 and below 58 20 103 58 105 51
501-1000 -1 -26 109 52 158 106
1001-1500 -33 -32 93 26 183 141
1501-2000 10 -124 135 62 229 203
2001-2500 -83 41 135 8 249 234
2501-3000 -7 -17 184 20 303 236
3001-3500 -79 -184 146 47 333 268
3501-4500 -178 250 136 114 349 330
4501-5500 -128 -96 161 -194 398 351
5501- 6000 115 -186 245 861 349 549
6000 and above -340 -463 129 467 546 453
Total -3 -7 123 47 301 185
T-Statistic
BPL/AAY Vs. Non BPL 0.41 6.96*** 16.91***
Note: *** p <= .001, ** p <= 0.01, * p <= 0.05.
Source: Authors’ calculations from IHDS data.

76
Table 7.1b: Changes in per capita food expenditure (inclusive of subsidy) for BPL/AAY and
non-BPL households between 2004-05 and 2011-12 (in 2011-12 Rs.)
Per Capita income in
2011-12
Income Decline of 20%+ Stable income (+ or - 20%) Income Growth (20%+)
Non-BPL BPL/AAY Non-BPL BPL/AAY Non-BPL BPL/AAY
500 and below 64 77 104 112 108 103
501-1000 5 28 114 106 160 159
1001-1500 -25 24 100 86 190 195
1501-2000 23 -69 146 119 237 264
2001-2500 -71 87 145 74 262 296
2501-3000 1 63 192 73 319 303
3001-3500 -67 -144 159 87 350 337
3501-4500 -168 294 143 136 367 400
4501-5500 -117 -58 173 -123 414 427
5501-6000 117 -130 258 830 363 627
6000 and above -334 -451 144 435 561 524
Total 5 48 131 102 313 244
T-Statistic
BPL/AAY Vs. Non BPL 4.25*** 2.6** 9.9***
Note: *** p <= .001, ** p <= 0.01, * p <= 0.05.
Source: Authors’ calculations from IHDS data.
A comparison between the BPL/AAY and other households, as depicted in Table
7.1a, provides a somewhat biased picture, however, because it does not take into account
the value of the PDS subsidy. Table 7.1b presents the same information for food
expenditure where an implicit subsidy is included in the total food expenditure at both
points in time. This table, on the other hand, presents a different picture. First, it shows
that in the case of distressed households, food expenditure remained stable for the non-
BPL households but grew slightly for the BPL/AAY households as the value of the PDS
subsidy increased over time. The difference in food expenditure between these two
groups is statistically significant, suggesting that the PDS has a significant impact on
protecting food expenditure for distressed households.
However, even after the value of the subsidy is taken into account, it is clear that
among the households that experienced income stability or significant income growth,
the BPL/AAY households incur a lower food expenditure than their non-BPL
counterparts. This is consistent with our observations in Chapter 6, where we found that
BPL access skews household expenditure towards cereals. Since it is far cheaper to gain
calories from cereals than from meat, dairy and fruits, households that get more of their
calories from cereals are likely to spend less money on food.
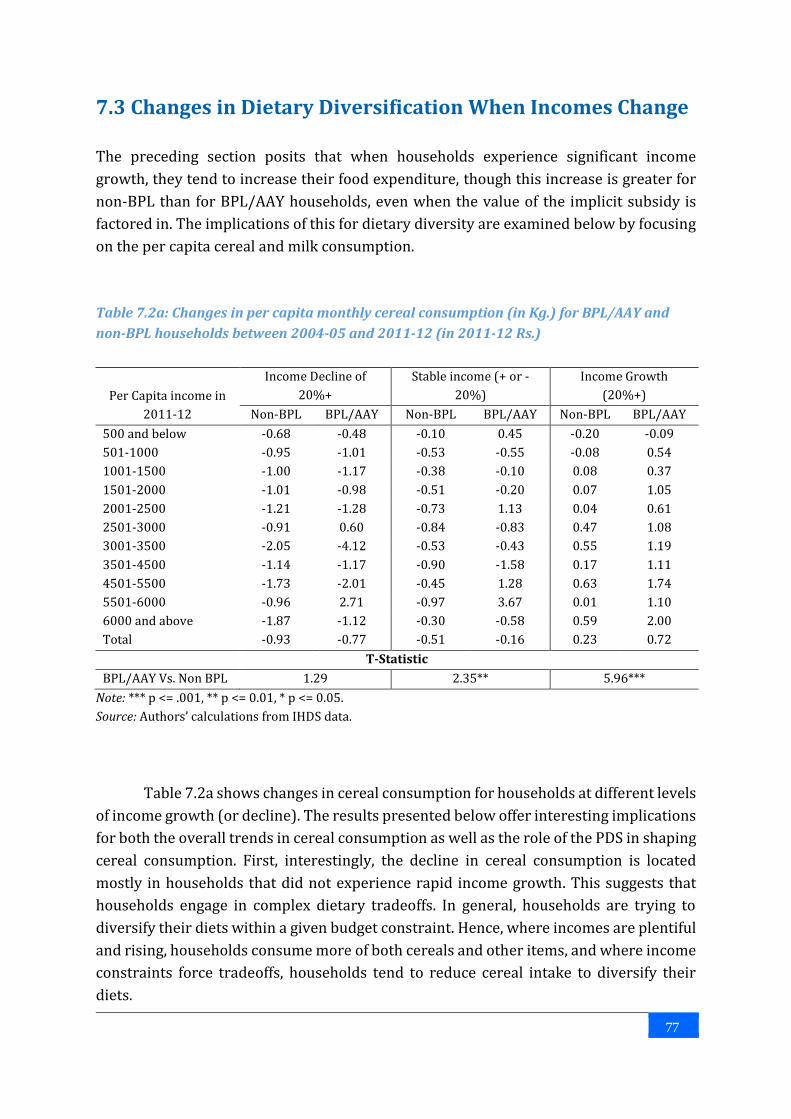
77
7.3 Changes in Dietary Diversification When Incomes Change
The preceding section posits that when households experience significant income
growth, they tend to increase their food expenditure, though this increase is greater for
non-BPL than for BPL/AAY households, even when the value of the implicit subsidy is
factored in. The implications of this for dietary diversity are examined below by focusing
on the per capita cereal and milk consumption.
Table 7.2a: Changes in per capita monthly cereal consumption (in Kg.) for BPL/AAY and
non-BPL households between 2004-05 and 2011-12 (in 2011-12 Rs.)
Per Capita income in
2011-12
Income Decline of
20%+
Stable income (+ or -
20%)
Income Growth
(20%+)
Non-BPL BPL/AAY Non-BPL BPL/AAY Non-BPL BPL/AAY
500 and below -0.68 -0.48 -0.10 0.45 -0.20 -0.09
501-1000 -0.95 -1.01 -0.53 -0.55 -0.08 0.54
1001-1500 -1.00 -1.17 -0.38 -0.10 0.08 0.37
1501-2000 -1.01 -0.98 -0.51 -0.20 0.07 1.05
2001-2500 -1.21 -1.28 -0.73 1.13 0.04 0.61
2501-3000 -0.91 0.60 -0.84 -0.83 0.47 1.08
3001-3500 -2.05 -4.12 -0.53 -0.43 0.55 1.19
3501-4500 -1.14 -1.17 -0.90 -1.58 0.17 1.11
4501-5500 -1.73 -2.01 -0.45 1.28 0.63 1.74
5501-6000 -0.96 2.71 -0.97 3.67 0.01 1.10
6000 and above -1.87 -1.12 -0.30 -0.58 0.59 2.00
Total -0.93 -0.77 -0.51 -0.16 0.23 0.72
T-Statistic
BPL/AAY Vs. Non BPL 1.29 2.35** 5.96***
Note: *** p <= .001, ** p <= 0.01, * p <= 0.05.
Source: Authors’ calculations from IHDS data.
Table 7.2a shows changes in cereal consumption for households at different levels
of income growth (or decline). The results presented below offer interesting implications
for both the overall trends in cereal consumption as well as the role of the PDS in shaping
cereal consumption. First, interestingly, the decline in cereal consumption is located
mostly in households that did not experience rapid income growth. This suggests that
households engage in complex dietary tradeoffs. In general, households are trying to
diversify their diets within a given budget constraint. Hence, where incomes are plentiful
and rising, households consume more of both cereals and other items, and where income
constraints force tradeoffs, households tend to reduce cereal intake to diversify their
diets.

78
Second, in almost any category, regardless of whether incomes are growing or
declining, households with BPL/AAY cards are more likely to favour cereal consumption
while making their food allocation choices. In the case of households challenged by a
substantial income decline, the reduction in cereal consumption is smaller for BPL/AAY
households than for others. In the case of households experiencing an income growth of
20 per cent or more, the cereal consumption increase is greater for BPL/AAY households
than for other households.
Table 7.2b: Changes in per capita monthly milk consumption (in ltr) for BPL/AAY and non-
BPL households between 2004-05 and 2011-12 (in 2011-12 Rs.)
Per Capita income in
2011-12
Income Decline of
20%+
Stable income (+ or -
20%)
Income Growth
(20%+)
Non-BPL BPL/AAY Non-BPL BPL/AAY Non-BPL BPL/AAY
500 and below -0.29 0.10 0.33 0.39 0.91 0.67
501-1000 -0.40 -0.32 0.65 0.39 1.10 0.77
1001-1500 -0.26 0.04 0.31 0.08 1.46 1.16
1501-2000 -0.18 -0.40 1.02 0.54 1.88 1.54
2001-2500 -0.15 1.48 0.82 -0.16 1.83 2.03
2501-3000 0.58 -0.16 0.88 -0.16 2.56 1.70
3001-3500 0.29 -3.02 0.45 0.54 2.37 2.57
3501-4500 -0.82 1.19 0.80 -0.41 2.53 2.12
4501-5500 -0.54 -2.36 1.23 1.48 3.11 3.02
5501-6000 1.86 -6.50 0.47 0.00 2.82 4.15
6000 and above -0.65 0.80 1.00 7.50 3.85 2.21
Total -0.28 -0.05 0.67 0.32 2.26 1.43
T-Statistic
BPL/AAY Vs. Non BPL 2.07** 2.65*** 9.90***
Note: *** p <= .001, ** p <= 0.01, * p <= 0.05.
Source: Authors’ calculations from IHDS data.
Table 7.2b presents similar results for per capita milk consumption. Both these
results highlight the role of the PDS in protecting dietary diversity for households
suffering from economic distress and in reducing dietary diversity for households
experiencing economic growth. For households that suffer economic distress (depicted
in columns 1 and 2 of the table), the average milk consumption is seen to decline for both
the BPL/AAY households and other households, but less so for households with BPL/AAY
cards. This may be because the income effect plays a role here and access to cheaper
cereals allows the BPL/AAY households to sustain their milk consumption. However, in
the case of households with stable or rising incomes, where the overall milk consumption
is rising rather than declining, the increase is smaller for BPL/AAY households than for

79
other households, possibly because the former meet more of their caloric needs through
the consumption of cheaper cereals.
7.4 Results from the Household Level Fixed Effects Models
While the above results can be understood intuitively, they simplify the
complexity of studying change over time. Households do not simply gain or lose income
but also gain or lose BPL/AAY status. Between 2004-05 and 2011-12, the proportion of
households covered under the AAY programme expanded substantially. Moreover, it may
be concluded that when households move or split, they often find it difficult to obtain
another BPL card. All these factors cause a substantial churn in household BPL status.
Table 7.3: Changes in household BPL/AAY classification for household’s survey in both
rounds
2004-05
2011-12 Not BPL/AAY BPL/AAY Total
Not BPL/AAY 45.25 12.69 57.94
BPL/AAY 17.47 24.59 42.06
Total 62.72 37.28 100
Source: Authors’ calculations from IHDS data.
Table 7.3 maps these changes. In order to examine the dietary implications
emanating from simultaneous changes in income and BPL/AAY status, we undertake
fixed effects regressions at the household level for the households surveyed in both 2004-
05 and 2011-12, including household splits.
The fixed effects regressions we estimate take the following form (Greene, 2012):
Yit = Xit + i + it
where Yit is the log of the dietary outcome variable for household i at time t, Xit refers to
time varying covariates for household i at time t (in this case log of per capita income,
BPL/AAY status and household size), i refers to a household specific constant term and
it refers to the error term. In this analysis, we centre the log of per capita income around
the value 9.62179 to improve the interpretability of coefficients for BPL/AAY status
around the population mean.

80
Table 7.4: Results from household fixed effects regression for per capita cereal and milk
consumption
Log Per Capita Cereal Consumption Log Per Capita Milk Consumption
Coefficient
Standard
Error
T-
Statistic P < t Coefficient
Standard
Error
T-
Statistic P < t
Log per capita income 0.030 0.003 11.3 0.000 0.150 0.005 29.4 0.000
BPL/AAY Card 0.040 0.004 9.1 0.000 -0.018 0.008 -2.1 0.037
Interaction term for
BPL*Log Income 0.015 0.004 3.9 0.000 -0.020 0.008 -2.6 0.008
Survey Period 2011-12
(2004-05 omitted) -0.048 0.003 -18.4 0.000 0.112 0.005 22.5 0.000
No. of persons in the
household -0.044 0.001 -48.5 0.000 -0.033 0.002 -19.4 0.000
Constant 2.679 0.005 504.0 0.000 1.441 0.010 141.8 0.000
Sample Size 74567
Household Groups 34643
Source: Authors’ calculations from IHDS data.
The results for the two dietary intake variables discussed above, that is, the log of
per capita cereal and milk intake from household level fixed effects regressions, are
presented in Table 7.4. They support the observations from descriptive analyses
presented in the prior section. Both cereal and milk consumption rise with an increase in
incomes, though the increase for cereals is fairly small. A one per cent increase in income
leads to an increase of 0.03 per cent in cereal consumption and 0.15 per cent in milk
consumption, suggesting greater income elasticity for milk consumption than for cereals.
These results also suggest that at mean income levels, access to a BPL/AAY card causes
an increase in cereal consumption by 0.04 per cent and a decline in milk consumption by
0.018 per cent. The coefficient of the interaction between income and possession of a BPL
card is particularly interesting. It indicates that growing incomes improve cereal
consumption for households having BPL/AAY cards even as they depress milk
consumption for the same households. All these effects are statistically significant at 0.05
levels or better.
The descriptive as well as regression results presented in this chapter clearly
show that access to BPL/AAY cards improves cereal consumption but is associated with
decreases in dietary diversity.

81
8. Policy Implications
This report set out to understand the role of the Targeted Public Distribution System
(TPDS) in shaping household food consumption decisions and the changes in these
decisions in the context of changing economic conditions between 2004-05 and 2011-12.
It is based on analyses of data from the India Human Development Survey (IHDS), waves
I and II, carried out in 2004-05 and 2011-12, respectively. The goal of this report is not to
replicate the analyses that may be undertaken by other data sources such as the National
Sample Surveys but rather to exploit the unique nature of the IHDS, which contains
information about income as well as expenditure for the same households at two points
in time.
8.1 Key Findings
The results presented in Chapters 2–7 paint an interesting picture of the changes in use
of TPDS as well as their implications. Even before the full implementation of the National
Food Security Act (NFSA), the TPDS is seen to play a crucial role in household food
consumption. The TPDS provides highly subsidised cereals to households with Below
Poverty Line (BPL) and Antyodaya Anna Yojana (AAY) cards as well as participation in
the Annapurna scheme. For those with Above Poverty Line (APL) cards, the grains are
supposed to be provided at economic costs though these households also benefit
somewhat from the TPDS if they live in areas where the market prices are higher than the
PDS prices.
PDS use grew strikingly between 2004-05 and 2011-12. In 2011-12, about 27 per
cent of all households purchased cereals from the PDS, whereas by 2011-12, this
proportion had risen to 52.3 per cent.
The growth in PDS use has occurred for each category of cardholders. Almost all
BPL and AAY cardholders purchase PDS grains and as many as 32 per cent of the APL
cardholders purchase from the PDS.
The results also show that the TPDS became better targeted between 2004-05 and
2011-12 with a sharp decline in errors of exclusion, though errors of inclusion remain
with many better-off households taking advantage of the TPDS. The access of the poor to
AAY/BPL cards improved because more cards were issued, particularly in the AAY

82
category. However, the access of the rich also improved because the programme did not
become better targeted and an increased number of cards were distributed to the whole
population. Moreover many households retained BPL cards issued earlier in spite of
having moved out of poverty with economic growth.
In order to compare apples with apples, this report employed the Propensity Score
Matching (PSM) technique in which households with and without BPL/AAY cards were
matched on income, household size, caste/religion, place of residence, state of residence,
and household education, and whether the household owns or cultivates land and
whether the household has any income from wage and salary work. These matched
samples show that access to BPL and AAY cards is associated with fundamental changes
in household consumption behaviours. The following are the salient features with respect
to the BPL/AAY cardholders:
Spending a lower proportion of their overall expenditure on food, even when the
value of implicit food subsidies is factored in.
Incurring a greater proportion of their food expenditure on cereals and a lower
proportion of expenditure on cereal substitutes such as fruits, nuts, dairy and
meat.
Consuming a greater amount of cereals at any given income level.
Consuming a lower amount of milk.
When the same households are compared between 2004-05 and 2011-12, the
results show that the impact of the TPDS on household food consumption varies between
households that suffer economic distress versus households that experience income
growth. Households that experience a per capita income decline of 20 per cent or greater
in constant terms seem to use the TPDS to stabilise their consumption and maintain at
least some degree of dietary diversity. Since dietary preferences change slowly and
caloric needs remain stable, it is not surprising that under adversity, households work
hard to retain their food consumption habits and use the PDS to support this. In contrast,
households whose incomes remain stable or experience a sharp increase seem to use the
TPDS as a way of obtaining cheaper calories, and thereby invest less in increasing dietary
diversity than they might have done so in the absence of food subsidies.
8.2 Dietary Diversity in an Era of Growing Incomes
The results presented in this report paint a complex picture of the TPDS programme. On
the one hand, the TPDS has become increasingly ubiquitous with a rising proportion of
the Indian population relying on it to provide subsidised cereals. The TPDS clearly has a

83
role to play in providing food security to households that are placed at the lowest end of
the income spectrum or that suffer from economic distress.
On the other hand, it also skews the dietary composition towards consumption of
cereals. In the absence of the TPDS, cereals have relatively low income elasticity with
cereal consumption rising by 0.03 per cent for every percentage point increase in per
capita income. This suggests that as households grow richer, they will try to diversify
their diet and obtain more of their calories from other sources such as fruit, nuts, milk
and meat. However, access to the TPDS seems to skew their diets towards cereals.
Theoretically, we can expect food subsidies to have two types of effects. As
households try to balance their various needs including ensuring adequate caloric
consumption, improving the quality of their diets, improving their living conditions, and
investing in the health and education of household members, the TPDS may change their
calculations. For households that value dietary diversity, being able to buy cheap cereals
will free up money to purchase other foods such as milk, fruits, nuts, and perhaps eggs
and meat (the income effect). For households that have other dominating consumption
needs, the money saved by purchasing subsidised cereals may be devoted to those needs
and diverted from food expenditure (the substitution effect). Which effect dominates
remains an empirical question. The results presented in this report suggest that the
substitution effect dominates with households holding BPL/AAY cards acquiring more of
their calories from cereals and not increasing investments in other food groups by the
same level as non-BPL households.
This is a particular problem for a society facing an epidemiological transition.
Although communicable diseases remain dominant in the country, the prevalence of non-
communicable diseases (NCDs) is rising. Cardiovascular diseases, strokes, diabetes, and
cancer are the four leading NCDs in India (Upadhyay, 2012). India has the highest number
of people with diabetes in the world (Ghaffar et al., 2004) and this burden has been rising
over time (Kaveeshwar and Cornwall, 2014), which is why it is sometimes referred to as
the ‘diabetic capital of the world’ (IDF, 2009). At least some of this increase in the
occurrence of the disease could be due to the rising consumption of processed foods and
refined foodgrains (Mohan et al., 2010) as unprocessed foods and healthier cereals like
small millets are considered inferior foods that households abandon as they get rich.
This issue is particularly critical for India since there is some possibility that either
genetic factors or their traditional carbohydrate-based diets make Indians more
susceptible to cardiovascular diseases and diabetes. The South Asian populations living
abroad, particularly in Europe and the United States, have shown very high rates of
diabetes, high blood pressure and heart conditions (Gunarathne et al., 2009; Gupta et al.,
2011). The rates of coronary heart disease have been reported to be unusually high in

84
several parts of the world among people originating from the Indian subcontinent
(McKeigue et al., 1989). A UK study showed that men and women from India had the
highest standardised mortality rates due to cardiovascular diseases, and that young
Indian men were at particularly high risk of contracting these diseases (Balarajan et al.,
1984). The cardiovascular mortality of South Asian migrants was also seen to increase
with the duration of residence in England and Wales, presumably as these migrants
became richer (Harding, 2003). Indian immigrants in the United States show a higher
prevalence of diabetes and a number of related chronic diseases such as hypertension
and cardiac conditions (Bhopal, 2000; Shah et al., 2015), possibly due to the increased
consumption of processed carbohydrates facilitated by increasing incomes.
If income growth is combined with the increased consumption of cereals in India
and the TPDS facilitates the concentration of calories from starch, this may have long-
term health implications for India. The economic as well as human costs of diseases like
diabetes, heart conditions and high blood pressure may be substantial. Thus, it may be
important to explore how food security for the poor via the TPDS may be combined with
improving dietary diversity of the population.
8.3 Cash Transfers: A Way Forward?
This report does not examine the role of cash transfers directly. However, the results have
substantial implications for the discourse about cash transfers. The results highlight that
even in an era of growing overall incomes, the availability of subsidised cereals skews
consumption towards greater cereal consumption at all income levels.
This is a somewhat surprising finding. The PDS does not meet all of the
households’ cereal needs. As this report documents, almost all the households purchase
some cereals from the market and PDS purchase accounts for less than half of the total
cereal consumption (Figure 3.4). At this infra-marginal level, would it not be possible for
households to curtail their market cereal purchase and use that money for other foods?
However, this does not seem to be the case. It may be that instead of the PDS grains being
the staple and market grains being the additional, market grains form the staple of
household consumption, possibly because of their higher quality. However, even if the
market-purchased rice is being used for special meals, the PDS rice may be used for the
preparation of foods like dosa or khichdi, in which case the quality of the grain is less
important. Consequently, access to the TPDS may add to cereal consumption rather than
replacing market purchases.
Cash transfers may be a way of avoiding skewing the household consumption of
cereals by depressing prices. However, their success would depend on the ability to

85
effectively administer transfers and reduce leakages. Moreover, how this may affect grain
markets remains unknown. International research on cash versus in-kind food subsidies
presents mixed results with the effectiveness of cash transfers depending on the
institutional framework (Hoddinott, 2013). Thus, while in theory it seems likely that cash
subsidies instead of in-kind subsidies via PDS may increase dietary diversity, it may make
sense to experiment with a cash transfer programme in a few districts—particularly
districts with diverse food habits and market infrastructure—before engaging in the
massive transformation of India’s Public Distribution System.

86
APPENDIX - I: Tables
Table A1: Percentage distribution of households with ration card ownership by place of
residence
Population Groups
AAY/Annapurna BPL APL No card
2004-
05
2011-
12
2004-
05
2011-
12
2004-
05
2011-
12
2004-
05
2011-
12
All India 2.5 6.0 33.7 35.7 47.1 44.5 16.7 13.9
Place of Residence
Metro urban 0.1 1.6 14.4 19.0 67.0 60.5 18.6 18.9
Other urban 1.2 3.2 23.8 27.9 52.9 55.7 22.1 13.2
More developed village 1.9 6.3 39.7 40.9 46.2 41.6 12.1 11.3
Less developed village 4.2 8.5 37.7 39.8 40.5 36.2 17.6 15.5
Source: Authors’ calculations from IHDS data.
Table A2: Percentage distribution of households with ration card ownership by social
groups
Population Groups AAY/Annapurna BPL APL No card
2004-
05
2011-
12
2004-
05
2011-
12
2004-
05
2011-
12
2004-
05
2011-
12
High caste 1.2 2.8 19.0 22.0 64.2 62.7 15.6 12.6
OBC 2.3 5.7 35.4 37.6 43.5 43.7 18.8 13.0
Dalit 3.3 9.5 43.3 43.9 39.8 33.6 13.6 13.0
Adivasi 6.0 8.5 50.0 48.7 23.0 20.5 21.0 22.2
Muslim 1.9 4.9 28.4 32.1 53.3 47.5 16.5 15.6
Christian, Sikh, Jain 0.3 1.9 19.9 17.8 67.0 70.6 12.8 9.7
Source: Authors’ calculations from IHDS data.

87
Table A3: Percentage distribution of households with ration card ownership by highest
adult education level in a household
Population Groups AAY/Annapurna BPL APL No card
2004-05 2011-
12
2004-
05
2011-
12
2004-
05
2011-
12
2004-
05
2011-
12
None 4.4 10.7 45.5 48.8 31.8 26.1 18.3 14.4
Below primary 3.4 8.1 44.6 44.2 35.2 35.1 16.9 12.6
Primary 2.4 7.2 40.0 43.1 41.0 35.0 16.6 14.7
Middle 2.9 6.4 33.2 35 48.6 43.0 15.3 15.6
Secondary 1.3 4.1 28.3 34.6 54.6 48.5 15.9 12.9
Higher secondary 0.8 3.9 22.4 27.7 60.4 55.0 16.4 13.4
Graduate+ 0.6 1.4 13.4 17.7 69.0 68.5 17.1 12.4
Source: Authors’ calculations from IHDS data.
Table A4: Percentage distribution of households with ration card ownership by status of
land ownership
Population Groups AAY/Annapurna BPL APL No card
2004-
05
2011-
12
2004-
05
2011-
12
2004-
05
2011-
12
2004-
05
2011-
12
Non cultivators/No land 2.4 5.8 34.7 35.4 44.3 42.8 18.6 16.1
Marginal (0-1 hectare) 3.5 8.0 42.7 39.1 39.3 41.3 14.6 11.5
Small (1-2 hectare) 3.0 3.1 34.8 35.4 47.9 52.5 14.3 9.0
Medium (2-5 hectare) 2.3 1.9 25.0 24.5 59.7 63.6 13.0 10.0
Large (5 and more hectare) 1.5 2.5 24.4 17.0 58.9 71.3 15.1 9.1
Source: Authors’ calculations from IHDS data.
Table A5: Percentage distribution of households with ration card ownership by income
quintile - All India
Population Groups
AAY/Annapurna BPL APL No card
2004-05 2011-
12
2004-
05
2011-
12
2004-
05
2011-12 2004-
05
2011-
12
Poorest 4.6 10.3 41.2 43.5 36.4 30.6 17.9 15.6
2nd quintile 3.4 7.8 43.0 42.0 38.0 35.3 15.6 14.9
Middle quintile 2.7 6.5 39.4 40.4 42.4 39.7 15.6 13.4
4th quintile 1.5 4.4 30.7 34.7 51.8 49.0 15.9 11.9
Richest 0.6 1.7 14.8 17.8 66.2 67.0 18.4 13.6
Source: Authors’ calculations from IHDS data.
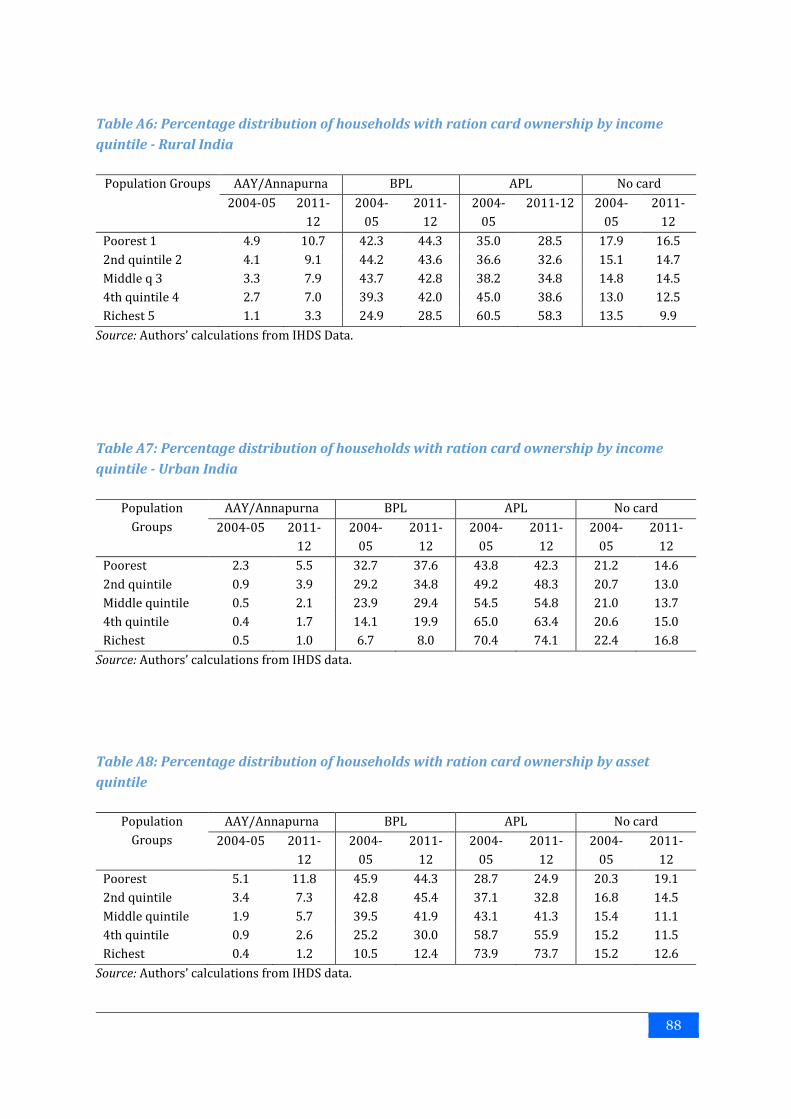
88
Table A6: Percentage distribution of households with ration card ownership by income
quintile - Rural India
Population Groups AAY/Annapurna BPL APL No card
2004-05 2011-
12
2004-
05
2011-
12
2004-
05
2011-12 2004-
05
2011-
12
Poorest 1 4.9 10.7 42.3 44.3 35.0 28.5 17.9 16.5
2nd quintile 2 4.1 9.1 44.2 43.6 36.6 32.6 15.1 14.7
Middle q 3 3.3 7.9 43.7 42.8 38.2 34.8 14.8 14.5
4th quintile 4 2.7 7.0 39.3 42.0 45.0 38.6 13.0 12.5
Richest 5 1.1 3.3 24.9 28.5 60.5 58.3 13.5 9.9
Source: Authors’ calculations from IHDS Data.
Table A7: Percentage distribution of households with ration card ownership by income
quintile - Urban India
Population
Groups
AAY/Annapurna BPL APL No card
2004-05 2011-
12
2004-
05
2011-
12
2004-
05
2011-
12
2004-
05
2011-
12
Poorest 2.3 5.5 32.7 37.6 43.8 42.3 21.2 14.6
2nd quintile 0.9 3.9 29.2 34.8 49.2 48.3 20.7 13.0
Middle quintile 0.5 2.1 23.9 29.4 54.5 54.8 21.0 13.7
4th quintile 0.4 1.7 14.1 19.9 65.0 63.4 20.6 15.0
Richest 0.5 1.0 6.7 8.0 70.4 74.1 22.4 16.8
Source: Authors’ calculations from IHDS data.
Table A8: Percentage distribution of households with ration card ownership by asset
quintile
Population
Groups
AAY/Annapurna BPL APL No card
2004-05 2011-
12
2004-
05
2011-
12
2004-
05
2011-
12
2004-
05
2011-
12
Poorest 5.1 11.8 45.9 44.3 28.7 24.9 20.3 19.1
2nd quintile 3.4 7.3 42.8 45.4 37.1 32.8 16.8 14.5
Middle quintile 1.9 5.7 39.5 41.9 43.1 41.3 15.4 11.1
4th quintile 0.9 2.6 25.2 30.0 58.7 55.9 15.2 11.5
Richest 0.4 1.2 10.5 12.4 73.9 73.7 15.2 12.6
Source: Authors’ calculations from IHDS data.

89
Table A9: Percentage distribution of households with ration card ownership by households
having MGNREGA card
Population Groups AAY/Annapurna BPL APL No card
2004-05 2011-
12
2004-
05
2011-
12
2004-
05
2011-
12
2004-
05
2011-
12
MGNREGA - 10.9 - 51.1 - 28.9 - 9.1
Non-MGNREGA - 5.0 - 32.5 - 47.7 - 14.9
Source: Authors’ calculations from IHDS data.
Table A10: Percentage distribution of households with ration card ownership by social
network
Population Groups AAY/Annapurna BPL APL No card
2004-
05
2011-
12
2004-
05
2011-
12
2004-
05
2011-
12
2004-
05
2011-
12
Acquaintance 1.9 5.7 28.8 32.6 52.2 48.5 17.1 13.2
Organization 2.0 5.1 40.1 42.1 42.4 42.0 15.6 10.9
Panchayat/Nagarpalika 2.8 8.6 38.2 35.1 42.8 41.9 16.2 14.4
Source: Authors’ calculations from IHDS data.
Table A11: Percentage distribution of households with ration card ownership by different
regions of India
Population
Groups
AAY/Annapurna BPL APL No card
2004-05 2011-12 2004-
05
2011-
12
2004-
05
2011-
12
2004-
05
2011-
12
Hills 5.4 6.8 25.8 24.8 60.5 62.3 8.3 6.0
North 0.3 8.4 12.5 18.4 74.1 57.0 13.1 16.2
North Central 3.6 8.3 25.3 29.6 46.6 40.8 24.5 21.3
Central Plains 5.3 9.1 27.5 30.6 49.1 46.2 18.1 14.1
East 2.3 5.7 32.0 35.1 52.7 45.0 13.0 14.2
West 1.6 2.8 30.3 25.2 56.0 58.2 12.1 13.8
South 0.9 3.5 52.8 56.5 29.9 33.2 16.4 6.8
Source: Authors’ calculations from IHDS data.

90
Table A12: Percentage distribution of households with ration card ownership by asset
ownership
Population Groups AAY/Annapurna BPL APL No card
2004-05 2011-
12
2004-
05
2011-
12
2004-
05
2011-
12
2004-
05
2011-
12
Colour TV 0.5 3.6 16.6 30.9 67.3 53.7 15.7 11.8
Air Cooler 0.5 2.4 9.8 16.5 71.4 65.9 18.3 15.2
Washing Machine 0.6 1.2 7.0 9.3 76.0 77.2 16.4 12.3
Computer 0.4 0.9 5.8 9.0 75.7 76.3 18.2 13.8
Laptop - 0.8 - 7.8 - 76.6 - 14.8
Credit Card 0.7 1.9 6.9 16.3 73.4 71.9 19.1 10.0
Refrigerator 0.5 2.2 8.4 15.3 76.5 70.3 14.6 12.2
Air Conditioner 0.3 1.6 8.3 10.0 64.7 73.7 26.7 14.8
Motor Cycle 0.5 1.8 14.8 20.5 67.9 65.1 16.8 12.7
Car 0.9 1.0 6.3 8.8 73.2 76.3 19.6 13.9
Telephone 0.4 1.2 12.6 14.5 73.8 76.9 13.2 7.5
Mobile 0.5 5.0 12.0 33.2 69.3 49.2 18.3 12.7
Own House 2.6 6.3 34.9 36.2 47.7 44.5 14.8 13.0
Milch Animal 2.2 6.6 30.4 34.7 51.0 48.9 16.4 9.8
Source: Authors’ calculations from IHDS data.
Table A13: Percentage distribution of ration cardholder households across place of
residence in India
Population Groups Distribution of
household
AAY/
Annapurna
BPL APL No card
2004-
05
2011-
12
2004-
05
2011-
12
2004-
05
2011-
12
2004-
05
2011-
12
2004-
05
2011-
12
Metro urban 7.6 7.6 0.2 2.0 3.2 4.0 10.8 10.3 8.4 10.3
Other urban 21.1 24.4 10.4 13.0 14.9 19.1 23.7 30.5 27.9 23.2
More developed
village
34.4 30.5 26.8 32.0 40.6 35.0 33.8 28.6 24.9 24.8
Less developed
village
36.9 37.5 62.6 53.0 41.2 41.9 31.7 30.6 38.8 41.8
Total 100 100 100 100 100 100 100 100 100 100
Source: Authors’ calculations from IHDS data.

91
Table A14: Percentage distribution of ration cardholder households across social groups
Population
Groups
Distribution of
household
AAY/
Annapurna
BPL APL No card
2004-
05
2011-
12
2004-
05
2011-
12
2004-
05
2011-
12
2004-
05
2011-
12
2004-
05
2011-
12
High caste 20.6 20.4 9.9 9.6 11.6 12.5 28.1 28.7 19.2 18.4
OBC 35.7 35.7 33.2 34.1 37.5 37.7 33.0 35.1 40.0 33.4
Dalit 22.0 22.1 29.1 34.7 28.3 27.2 18.5 16.7 17.9 20.7
Adivasi 7.8 8.3 18.9 11.8 11.6 11.3 3.8 3.8 9.8 13.3
Muslim 11.2 11.3 8.6 9.2 9.5 10.2 12.7 12.1 11.0 12.7
Christian,
Sikh, Jain 2.7 2.2 0.3 0.7 1.6 1.1 3.8 3.4 2.1 1.5
Total 100 100 100 100 100 100 100 100 100 100
Source: Authors’ calculations from IHDS data.
Table A15: Percentage distribution of ration cardholder households across highest adult
education level
Population Groups
Distribution of
household
AAY/
Annapurna
BPL APL No card
2004-
05
2011-
12
2004-
05
2011-
12
2004-
05
2011-
12
2004-
05
2011-
12
2004-
05
2011-
12
None 23.4 19.4 41.4 34.6 31.6 26.6 15.8 11.4 25.5 20.1
Below primary 8.3 6.3 11.3 8.5 10.9 7.8 6.2 5.0 8.3 5.7
Primary 15.7 15.2 15.4 18.2 18.6 18.3 13.6 11.9 15.6 16.0
Middle 16.0 16.7 18.8 17.7 15.8 16.3 16.5 16.1 14.6 18.8
Secondary 13.6 13.7 6.9 9.2 11.4 13.2 15.7 14.9 12.9 12.7
Higher secondary 9.6 12.3 3.2 8.1 6.4 9.6 12.3 15.3 9.3 11.9
Graduate+ 13.6 16.5 3.1 3.8 5.4 8.2 19.9 25.4 13.8 14.8
Total 100 100 100 100 100 100 100 100 100 100
Source: Authors’ calculations from IHDS data.

92
Table A16: Percentage distribution of ration cardholder households across land
ownership
Population Groups
Distribution of
household
AAY/
Annapurna
BPL APL No card
2004-
05
2011-
12
2004-
05
2011-
12
2004-
05
2011-
12
2004-
05
2011-
12
2004-
05
2011-
12
Non cultivators/ No land 57.1 58.1 54.7 56.0 58.9 57.6 53.7 55.9 63.6 67.3
Marginal (0-1 hectare) 13.6 28.5 19.0 38.1 17.3 31.2 11.4 26.5 11.9 23.7
Small (1-2 hectare) 8.0 7.2 9.7 3.8 8.3 7.2 8.2 8.5 6.9 4.7
Medium (2-5 hectare) 11.2 5.0 10.4 1.6 8.3 3.4 14.2 7.1 8.7 3.6
Large (5 and more
hectare) 10.0 1.2 6.2 0.5 7.3 0.6 12.5 2.0 9.0 0.8
Total 100 100 100 100 100 100 100 100 100 100
Source: Authors’ calculations from IHDS data.
Table A17: Percentage distribution of ration cardholder households across income
quintiles - All India
Population
Groups
AAY/Annapurna BPL APL No card
2004-05 2011-12 2004-05 2011-12 2004-05 2011-12 2004-05 2011-12
Poorest 1 33.4 29.9 22.5 22.0 14.1 12.2 19.7 20.3
2nd quintile 2 28.0 23.6 26.5 22.1 16.7 14.4 19.4 19.6
Middle quintile 3 21.4 22.9 23.5 22.6 18.1 17.3 18.8 19.4
4th quintile 4 12.5 16.4 18.6 21.2 22.4 22.3 19.5 18.9
Richest 5 4.6 7.2 9.0 12.2 28.7 33.8 22.5 21.8
Total 100 100 100 100 100 100 100 100
Source: Authors’ calculations from IHDS data.
Table A18: Percentage distribution of ration cardholder households across income
quintiles - Rural India
Population
Groups
AAY/Annapurna BPL APL No card
2004-
05
2011-
12
2004-
05
2011-
12
2004-
05
2011-
12
2004-
05
2011-
12
Poorest 1 27.6 26.1 19.5 20.0 14.5 13.4 21.7 21.9
2nd quintile 2 26.5 24.6 23.4 22.2 17.4 17.3 21.0 22.1
Middle quintile 3 21.2 21.6 23.1 21.7 18.1 18.4 20.6 22.0
4th quintile 4 17.7 18.9 20.8 21.5 21.3 20.2 18.1 18.9
Richest 5 7.0 8.8 13.2 14.5 28.7 30.8 18.8 15.1
Total 100 100 100 100 100 100 100 100
Source: Authors’ calculations from IHDS Data.

93
Table A19: Percentage distribution of ration cardholder households across income
quintiles - Urban India
Population Groups
AAY/Annapurna BPL APL No card
2004-
05
2011-
12
2004-
05
2011-
12
2004-
05
2011-
12
2004-
05
2011-
12
Poorest 1 48.9 36.7 30.3 28.1 15.2 14.4 19.8 19.2
2nd quintile 2 20.1 28.9 27.8 27.6 17.6 17.5 19.8 18.2
Middle quintile 3 11.6 14.8 22.3 22.5 19.1 19.2 19.7 18.5
4th quintile 4 7.9 12.3 13.3 15.6 23.0 22.7 19.5 21.0
Richest 5 11.6 7.4 6.4 6.2 25.0 26.3 21.3 23.1
Total 100 100 100 100 100 100 100 100
Source: Authors’ calculations from IHDS data.
Table A20: Percentage distribution of ration cardholder households across asset quintile -
All India
Population
Groups
Distribution of
household
AAY/
Annapurna
BPL APL No card
2004-
05
2011-
12
2004-
05
2011-
12
2004-
05
2011-
12
2004-
05
2011
-12
2004-
05
2011-
12
Poorest 22.8 22.9 47.0 45.1 31.0 28.5 13.9 12.8 22.8 22.9
2nd quintile 21.2 17.5 28.8 21.2 27.0 22.3 16.7 13.0 21.2 17.5
Middle quintile 17.4 23.3 13.6 22.1 20.4 27.4 15.9 21.6 17.4 23.3
4th quintile 21.9 18.7 7.7 8.1 16.4 15.7 27.3 23.6 21.9 18.7
Richest 16.7 17.5 2.8 3.5 5.2 6.1 26.2 29.0 16.7 17.5
Total 100 100 100 100 100 100 100 100 100 100
Source: Authors’ calculations from IHDS data.
Table A21: Percentage distribution of ration cardholder households across MGNREGA
card ownership
Population
Groups
Distribution of
household
AAY/
Annapurna
BPL APL No card
2004-
05
2011-
12
2004-
05
2011-
12
2004-
05
2011-
12
2004-
05
2011-
12
2004-
05
2011-
12
MGNREGA - 17.2 - 31.2 - 24.6 - 11.2 - 11.3
Non-MGNREGA - 82.8 - 68.8 - 75.4 - 88.8 - 88.7
Total - 100 - 100 - 100 - 100 - 100
Source: Authors’ calculations from IHDS data.

94
Table A22: Percentage distribution of ration cardholder households across different
regions in India
Population
Groups
Distribution of
household
AAY/
Annapurna
BPL APL No card
2004-
05
2011-
12
2004-
05
2011-
12
2004-
05
2011-
12
2004-
05
2011-
12
2004-
05
2011-
12
Hills 3.3 3.3 7.1 3.7 2.5 2.3 4.2 4.6 3.3 3.3
North 5.5 5.6 0.6 7.8 2.1 2.9 8.7 7.1 5.5 5.6
North Central 22.0 23.7 31.6 32.8 16.5 19.7 21.8 21.8 22.0 23.7
Central Plains 12.7 13.3 27.0 20.1 10.3 11.4 13.2 13.8 12.7 13.3
East 16.0 15.6 14.6 14.9 15.2 15.4 17.9 15.8 16.0 15.6
West 3.3 3.3 7.1 3.7 2.5 2.3 4.2 4.6 3.3 3.3
South 5.5 5.6 0.6 7.8 2.1 2.9 8.7 7.1 5.5 5.6
Total 100 100 100 100 100 100 100 100 100 100
Source: Authors’ calculations from IHDS data.
Table A23: Households having no ration card (%) and reasons by place of residence
Population Groups
% households
having no card
Reasons for not having a ration card
2004-05 2011-12
20
04
-05
20
11
-12
No
t n
eed
ed
Lo
st
Bu
reau
crat
ic
dif
ficu
ltie
s
Mo
ved
bu
t n
ot
tran
sfer
red
Oth
ers
No
t n
eed
ed
Lo
st
Bu
reau
crat
ic
dif
ficu
ltie
s M
ov
ed b
ut
no
t
tran
sfer
red
Oth
ers
All India 16.7 13.9 9.3 8.3 42.7 9.9 29.8 13.5 16.7 13.9 9.3 8.3
Place of Residence
Metro urban 18.6 18.9 17.2 3.4 19.3 16.7 43.5 28.0 18.6 18.9 17.2 3.4
Other urban 22.1 13.2 15.1 7.5 34.1 15.3 28.1 16.3 22.1 13.2 15.1 7.5
More developed
village 12.1 11.3 7.0 9.4 40.4 8.7 34.4 10.8 12.1 11.3 7.0 9.4
Less developed
village 16.7 13.9 9.3 8.3 42.7 9.9 29.8 13.5 16.7 13.9 9.3 8.3
Source: Authors’ calculations from IHDS data.

95
Table A24: Households having no ration card (%) and reasons by social group
Population
Groups
% households
having no card
Reasons for not having a ration card
2004-05 2011-12
20
04
-05
20
11
-12
No
t n
eed
ed
Lo
st
Bu
reau
crat
ic
dif
ficu
ltie
s
Mo
ved
bu
t n
ot
tran
sfer
red
Oth
ers
No
t n
eed
ed
Lo
st
Bu
reau
crat
ic
dif
ficu
ltie
s
Mo
ved
bu
t n
ot
tran
sfer
red
Oth
ers
High caste 15.6 12.6 15.9 6.3 33.2 13.0 31.7 17.3 15.6 12.6 15.9 6.3
OBC 18.8 13.0 7.0 8.5 46.2 8.8 29.5 13.0 18.8 13.0 7.0 8.5
Dalit 13.6 13.0 6.3 10.1 44.3 8.9 30.4 8.0 13.6 13.0 6.3 10.1
Adivasi 21.0 22.2 10.7 7.6 53.4 7.3 21.1 20.2 21.0 22.2 10.7 7.6
Muslim 16.5 15.6 6.7 8.9 40.1 9.4 35.0 9.6 16.5 15.6 6.7 8.9
Christian,
Sikh, Jain 15.6 12.6 15.9 6.3 33.2 13.0 31.7 17.3 15.6 12.6 15.9 6.3
Source: Authors’ calculations from IHDS data.
Table A25: Households having no ration card (%) and reasons by highest adult education
level
Population
Groups
%
households
having no
card
Reasons for not having a ration card
2004-05 2011-12
20
04
-05
20
11
-12
No
t n
eed
ed
Lo
st
Bu
reau
crat
ic
dif
ficu
ltie
s
Mo
ved
bu
t n
ot
tran
sfer
red
Oth
ers
No
t n
eed
ed
Lo
st
Bu
reau
crat
ic
dif
ficu
ltie
s
Mo
ved
bu
t n
ot
tran
sfer
red
Oth
ers
None 18.3 14.4 5.5 9.9 49.3 6.6 28.7 12.8 18.3 14.4 5.5 9.9
Below primary 16.9 12.6 4.1 11.2 51.5 7.9 25.4 8.5 16.9 12.6 4.1 11.2
Primary 16.6 14.7 4.7 8.6 47.6 9.1 30.0 11.1 16.6 14.7 4.7 8.6
Middle 15.3 15.6 7.2 7.8 44.3 11.7 29.0 8.2 15.3 15.6 7.2 7.8
Secondary 15.9 12.9 9.7 7.2 39.1 12.8 31.2 17.2 15.9 12.9 9.7 7.2
Higher secondary 18.3 14.4 5.5 9.9 49.3 6.6 28.7 12.8 18.3 14.4 5.5 9.9
Graduate+ 16.9 12.6 4.1 11.2 51.5 7.9 25.4 8.5 16.9 12.6 4.1 11.2
Source: Authors’ calculations from IHDS data.

96
Table A26: Households having no ration card (%) and reasons by status of land ownership
Population Groups
%
households
having no
card
Reasons for not having a ration card
2004-05 2011-12
20
04
-05
20
11
-12
No
t n
eed
ed
Lo
st
Bu
reau
crat
ic
dif
ficu
ltie
s
Mo
ved
bu
t n
ot
tran
sfer
red
Oth
ers
No
t n
eed
ed
Lo
st
Bu
reau
crat
ic
dif
ficu
ltie
s
Mo
ved
bu
t n
ot
tran
sfer
red
Oth
ers
Non cultivators/ No
land 18.6 16.1 10.1 7.1 38.1 12.6 32.1 15.1 5.5 45.1 18.7 15.7
Marginal (0-1
hectare) 14.6 11.5 4.7 11.0 46.9 5.6 31.8 10.0 6.5 51.3 14.8 17.5
Small (1-2 hectare) 14.3 9.0 7.6 11.2 46.9 7.9 26.4 10.2 6.9 43.9 22.6 16.4
Medium (2-5
hectare) 13.0 10.0 12.4 9.2 50.2 3.0 25.2 11.7 5.9 48.9 19.8 13.7
Large (5 and more
hectare) 15.1 9.1 7.9 10.4 59.0 4.7 18.1 20.8 15.9 24.1 16.5 22.7
Source: Authors’ calculations from IHDS data.
Table A27: Households having no ration card (%) and reasons by Income quintile - All
India
Population
Groups
%
households
having no
card
Reasons for not having a ration card
2004-05 2011-12
20
04
-05
20
11
-12
No
t n
eed
ed
Lo
st
Bu
reau
crat
ic
dif
ficu
ltie
s
Mo
ved
bu
t n
ot
tran
sfer
red
Oth
ers
No
t n
eed
ed
Lo
st
Bu
reau
crat
ic
dif
ficu
ltie
s
Mo
ved
bu
t n
ot
tran
sfer
red
Oth
ers
Poorest 17.9 15.6 4.2 9.2 57.6 6.3 22.7 10.8 5.8 53.8 11.7 17.9
2nd quintile 15.6 14.9 4.2 9.8 53.8 7.4 24.8 10.0 6.3 52.5 17.2 14.1
Middle quintile 15.6 13.4 5.6 8.2 43.2 10.8 32.2 11.9 6.2 51.1 18.7 12.1
4th quintile 15.9 11.9 10.0 10.0 33.9 11.7 34.5 11.0 6.5 44.1 21.1 17.3
Richest 18.4 13.6 21.5 5.6 24.7 13.6 34.6 23.1 4.6 31.9 21.7 18.8
Source: Authors’ calculations from IHDS data.

97
Table A28: Households having no ration card (%) and reasons by Income quintile - Rural
India
Population
Groups
%
households
having no
card
Reasons for not having a ration card
2004-05 2011-12
20
04
-05
20
11
-12
No
t n
eed
ed
Lo
st
Bu
reau
crat
ic
dif
ficu
ltie
s
Mo
ved
bu
t n
ot
tran
sfer
red
Oth
ers
No
t n
eed
ed
Lo
st
Bu
reau
crat
ic
dif
ficu
ltie
s
Mo
ved
bu
t n
ot
tran
sfer
red
Others
Poorest 17.9 16.5 3.0 10.5 58.0 5.1 23.4 11.8 6.4 51.9 11.0 18.9
2nd quintile 15.1 14.7 3.2 9.0 58.7 6.1 23.0 9.7 6.8 55.4 13.5 14.6
Middle quintile 14.8 14.5 3.6 11.4 50.4 7.4 27.2 9.8 5.8 54.0 18.0 12.4
4th quintile 13.0 12.5 6.2 9.3 40.8 9.0 34.8 6.7 7.7 50.5 21.4 13.7
Richest 13.5 9.9 14.3 7.7 33.6 6.7 37.8 13.7 4.9 40.0 22.3 19.1
Source: Authors’ calculations from IHDS data.
Table A29: Households having no ration card (%) and reasons by Income quintile - Urban
India
Population
Groups
%
households
having no
card
Reasons for not having a ration card
2004-05 2011-12
20
04
-05
20
11
-12
No
t n
eed
ed
Lo
st
Bu
reau
crat
ic
dif
ficu
ltie
s
Mo
ved
bu
t n
ot
tran
sfer
red
Oth
ers
No
t n
eed
ed
Lo
st
Bu
reau
crat
ic
dif
ficu
ltie
s
Mo
ved
bu
t n
ot
tran
sfer
red
Oth
ers
Poorest 21.2 14.6 8.5 7.8 43.9 13.4 26.4 17.2 5.4 42.3 19.3 15.7
2nd quintile 20.7 13.0 9.2 6.4 36.7 15.7 31.9 12.3 4.4 48.7 19.6 15.0
Middle quintile 21.0 13.7 11.6 7.4 29.7 16.7 34.6 13.5 6.0 44.5 19.4 16.7
4th quintile 20.6 15.0 19.5 5.0 27.2 15.9 32.4 26.1 4.2 30.1 20.9 18.8
Richest 22.4 16.8 28.4 6.1 16.3 16.5 32.8 27.4 4.8 28.5 22.1 17.3
Source: Authors’ calculations from IHDS data.

98
Table A30: Households having no ration card (%) and reasons by asset quintile - All India
Population
Groups
%
households
having no
card
Reasons for not having a ration card
2004-05 2011-12
20
04
-05
20
11
-12
No
t n
eed
ed
Lo
st
Bu
reau
crat
ic
dif
ficu
ltie
s
Mo
ved
bu
t
no
t
tran
sfer
red
Oth
ers
No
t n
eed
ed
Lo
st
Bu
reau
crat
ic
dif
ficu
ltie
s
Mo
ved
bu
t
no
t
tran
sfer
red
Oth
ers
Poorest 20.3 19.1 4.5 10.0 56.4 7.9 21.2 10.0 5.5 53.6 14.8 16.2
2nd quintile 16.8 14.5 4.7 7.1 54.0 8.0 26.2 12.0 8.2 49.9 14.5 15.5
Middle quintile 15.4 11.1 7.6 8.2 36.8 7.9 39.4 8.6 5.6 50.2 20.0 15.5
4th quintile 15.2 11.5 10.5 8.4 33.8 13.0 34.3 13.2 5.5 40.0 22.0 19.3
Richest 15.2 12.6 24.6 6.8 19.9 14.2 34.5 28.7 4.7 29.9 22.0 14.7
Source: Authors’ calculations from IHDS data.
Table A31: Households having no ration card (%) and reasons by MGNREGA card ownership
Population
Groups
%
households
having no
card
Reasons for not having a ration card
2004-05 2011-12
20
04
-05
20
11
-12
No
t n
eed
ed
Lo
st
Bu
reau
crat
ic
dif
ficu
ltie
s
Mo
ved
bu
t
no
t
tran
sfer
red
Oth
ers
No
t n
eed
ed
Lo
st
Bu
reau
crat
ic
dif
ficu
ltie
s
Mo
ved
bu
t
no
t
tran
sfer
red
Oth
ers
MGNREGA - 9.1 - - - - - 6.4 9.9 47.8 14.1 21.8
Non-MGNREGA - 14.9 - - - - - 14.4 5.4 46.3 18.4 15.4
Source: Authors’ calculations from IHDS data.

99
Table A32: Households having no ration card (%) and reasons by social network
Population Groups
%
households
having no
card
Reasons for not having a ration card
2004-05 2011-12
20
04
-05
20
11
-12
No
t n
eed
ed
Lo
st
Bu
reau
crat
ic
dif
ficu
ltie
s
Mo
ved
bu
t
no
t
tran
sfer
red
O
ther
s
No
t n
eed
ed
Lo
st
Bu
reau
crat
ic
dif
ficu
ltie
s
Mo
ved
bu
t
no
t
tran
sfer
red
O
ther
s
Acquaintance 17.1 13.2 10.9 7.8 43.3 9.7 28.3 13.7 5.3 47.5 17.4 16.1
Organization 15.6 10.9 9.0 7.8 41.7 9.2 32.3 13.9 6.0 45.6 18.3 16.3
Panchayat/
Nagarpalika 16.2 14.4 9.0 8.4 49.1 5.7 27.8 11.5 4.8 53.4 12.0 18.3
Source: Authors’ calculations from IHDS data.
Table A33: Households having no ration card (%) and reasons by different regions
Population
Groups
%
households
having no
card
Reasons for not having a ration card
2004-05 2011-12
20
04
-05
20
11
-12
No
t n
eed
ed
Lo
st
Bu
reau
crat
ic
dif
ficu
ltie
s
Mo
ved
bu
t
no
t
tran
sfer
red
Oth
ers
No
t n
eed
ed
Lo
st
Bu
reau
crat
ic
dif
ficu
ltie
s
Mo
ved
bu
t
no
t
tran
sfer
red
Oth
ers
Hills 8.3 6.0 14.6 3.2 30.0 9.0 43.2 7.0 12.2 35.0 26.1 19.7
North 13.1 16.2 17.0 10.3 22.2 13.4 37.1 14.9 6.6 45.1 12.4 20.9
North Central 24.5 21.3 6.0 9.2 61.0 4.2 19.6 15.9 4.2 55.4 12.0 12.6
Central Plains 18.1 14.1 11.5 7.4 62.2 4.8 14.2 6.7 7.3 55.6 15.0 15.4
East 13.0 14.2 12.0 15.7 44.4 5.2 22.6 6.6 8.9 53.7 14.0 16.9
West 12.1 13.8 14.7 9.4 22.5 34.7 18.6 16.5 6.4 24.9 33.8 18.4
South 16.4 6.8 6.8 3.5 20.7 10.8 58.1 20.6 3.6 23.7 29.8 22.3
Source: Authors’ calculations from IHDS data.

100
Table A34: Percentage of households purchased grains from PDS by place of residence
Population Groups
AAY/Annapurna BPL APL All PDS
cardholders
2004-
05
2011-
12
2004-
05
2011-
12
2004-
05
2011-
12
2004-
05
2011-
12
All India 73.2 90.7 55.7 89.9 12.7 31.8 31.9 59.9
Place of Residence
Metro urban 73.2 90.7 55.7 89.9 12.7 31.8 31.9 59.9
Other urban - 68.0 37.9 75.2 5.4 23.8 11.1 36.7
More developed village 55.2 87.1 57.8 91.2 11.8 37.8 26.5 56.8
Less developed village 77.8 90.5 64.2 91.5 19.2 35.0 40.8 64.9
Source: Authors’ calculations from IHDS data.
Table A35: Percentage of households purchased grains from PDS by social groups
Population Groups
AAY/Annapurna BPL APL All PDS cardholders
2004-
05
2011-
12
2004-
05
2011-
12
2004-
05
2011-
12 2004-05 2011-12
High caste 51.0 80.4 49.3 87.8 6.9 26.2 17.1 43.4
OBC 74.9 90.2 59.3 90.9 16.9 32.8 37.0 61.7
Dalit 74.8 93.1 58.0 90.9 14.8 33.8 38.7 69.1
Adivasi 81.7 94.3 53.6 88.3 20.3 38.1 46.0 75.7
Muslim 71.0 90.2 45.3 88.2 9.8 34.1 23.2 57.9
Christian, Sikh, Jain - 76.9 56.7 82.8 11.0 41.8 21.4 50.6
Source: Authors’ calculations from IHDS data.

101
Table A36: Percentage of households purchased grains from PDS by highest adult
education level in a household
Population Groups
AAY/Annapurna BPL APL All PDS cardholders
2004-
05
2011-
12
2004-
05
2011-
12
2004-
05
2011-
12 2004-05 2011-12
None 77.9 91.9 56.2 91.9 14.0 25.7 41.0 71.7
Below primary 82.9 94.7 55.7 92.7 11.1 36.5 38.0 70.3
Primary 75.4 94.5 58.3 89.8 17.3 35.5 38.7 67.9
Middle 67.7 93.7 52.9 89.9 12.5 37.6 30.2 63.5
Secondary 69.4 81.3 59.6 91.0 13.3 35.2 29.7 59.5
Higher secondary - 86.0 56.7 85.9 11.8 30.9 24.3 51.0
Graduate+ 77.9 91.9 56.2 91.9 14.0 25.7 41.0 71.7
Source: Authors’ calculations from IHDS data.
Table A37: Percentage of households purchased grains from PDS by status of land
ownership
Population Groups
AAY/Annapurna BPL APL All PDS cardholders
2004-
05
2011-
12
2004-
05
2011-
12
2004-
05
2011-
12 2004-05 2011-12
Non cultivators/No land 76.4 90.7 57.4 90.3 13.5 36.3 34.1 62.8
Marginal (0-1 hectare) 76.5 91.6 61.7 89.0 20.7 30.2 43.4 61.8
Small (1-2 hectare) 69.3 87.0 54.4 92.7 11.6 19.6 31.0 50.3
Medium (2-5 hectare) 55.5 82.5 45.3 87.0 9.8 20.8 21.2 40.2
Large (5 and more hectare) - 72.9 41.4 76.7 6.2 18.2 17.5 30.7
Source: Authors’ calculations from IHDS data.
Table A38: Percentage of households purchased grains from PDS by income quintile - All
India
Population Groups
AAY/Annapurna BPL APL All PDS cardholders
2004-
05
2011-
12
2004-
05
2011-
12
2004-
05
2011-
12 2004-05 2011-12
Poorest 80.7 94.9 54.5 89.6 16.0 24.6 39.0 66.7
2nd quintile 78.6 93.8 55.9 90.2 13.7 30.5 37.8 65.8
Middle quintile 76.9 89.0 59.2 91.3 15.3 34.2 37.7 64.9
4th quintile 55.4 86.6 57.9 91.3 13.5 36.9 30.5 60.8
Richest 23.1 69.6 44.5 83.6 8.2 29.9 14.9 41.7
Source: Authors’ calculations from IHDS data.

102
Table A39: Percentage of households purchased grains from PDS by income quintile -
Rural India
Population Groups
AAY/Annapurna BPL APL All PDS cardholders
2004-
05
2011-
12
2004-
05
2011-
12
2004-
05
2011-
12 2004-05 2011-12
Poorest 78.9 93.0 54.6 89.6 14.3 21.6 38.8 66.8
2nd quintile 84.8 95.4 55.7 90.0 14.9 26.6 39.5 66.3
Middle quintile 74.1 91.1 55.7 90.8 15.0 27.5 38.2 65.1
4th quintile 69.2 90.1 58.9 91.5 15.1 31.0 36.6 64.7
Richest 51.0 81.7 54.6 89.1 12.7 36.5 25.2 54.8
Source: Authors’ calculations from IHDS data.
Table A40: Percentage of households purchased grains from PDS by income quintile -
Urban India
Population Groups
AAY/Annapurna BPL APL All PDS cardholders
2004-
05
2011-
12
2004-
05
2011-
12
2004-
05
2011-
12 2004-05 2011-12
Poorest 67.2 92.9 61.8 90.5 16.4 41.0 36.7 66.1
2nd quintile - 90.1 56.4 91.5 15.6 42.5 31.2 64.2
Middle quintile - 85.8 55.8 91.7 9.0 38.9 23.4 58.0
4th quintile - 75.8 43.7 85.2 7.8 33.1 14.3 46.2
Richest - 31.8 27.8 62.1 4.0 22.0 6.1 26.0
Source: Authors’ calculations from IHDS data.
Table A41: Percentage of households purchased grains from PDS by asset quintile - All
India
Population Groups
AAY/Annapurna BPL APL All PDS
cardholders
2004-
05
2011-
12
2004-
05
2011-
12
2004-
05
2011-
12
2004-
05
2011-
12
Poorest 80.5 93.1 53.7 89.0 16.6 20.3 42.1 68.5
2nd quintile 76.1 93.2 51.8 90.0 14.3 26.8 36.1 66.0
Middle quintile 71.5 90.4 66.7 93.6 14.7 39.8 40.3 68.4
4th quintile 45.9 84.2 58.0 90.9 14.8 40.5 27.9 58.8
Richest - 60.8 38.1 74.0 6.3 26.1 10.2 33.3
Source: Authors’ calculations from IHDS data.

103
Table A42: Percentage of households purchased grains from PDS by MGNREGA card
ownership
Population Groups
AAY/Annapurna BPL APL All PDS
cardholders
2004-
05
2011-
12
2004-
05
2011-
12
2004-
05
2011-
12
2004-
05
2011-
12
MGNREGA - 94.1 - 93.3 - 43.9 - 77.7
Non-MGNREGA - 89.1 - 88.7 - 30.3 - 56.0
Source: Authors’ calculations from IHDS data.
Table A43: Percentage of households purchased grains from PDS by social network
Population Groups
AAY/Annapurna BPL APL All PDS
cardholders
2004-
05
2011-
12
2004-
05
2011-
12
2004-
05
2011-
12
2004-
05
2011-
12
No Acquaintance 78.7 92.5 54.9 91.1 13.6 38.2 35.4 70.8
Acquaintance 65.0 89.9 56.8 89.3 12.1 30.3 28.8 56.3
No Organization 73.9 89.1 51.0 86.7 11.0 26.4 27.7 53.8
Organization 71.5 93.5 62.1 93.2 16.2 40.1 39.3 68.2
No Panchayat/Nagar 73.7 90.5 54.6 89.7 13.0 33.1 31.3 60.0
Panchayat/Nagar 70.2 90.9 64.4 90.4 10.2 27.5 36.9 59.6
Source: Authors’ calculations from IHDS data.
Table A44: Percentage of households purchased grains from PDS by place of residence
Population Groups
AAY/Annapurna BPL APL All PDS cardholders
2004-
05
2011-
12
2004-
05
2011-
12
2004-
05
2011-
12 2004-05 2011-12
Hills 74.7 91.1 75.0 91.6 23.2 68.3 40.8 76.1
North - 80.7 13.3 62.0 - 5.3 2.6 25.3
North Central 72.9 89.8 13.8 83.7 - 7.2 8.8 44.7
Central Plains 63.3 91.5 42.1 87.0 5.6 13.6 21.6 48.0
East 77.5 91.8 25.4 90.0 2.9 42.6 13.1 65.3
West 85.9 87.4 66.7 82.6 15.8 26.1 34.6 44.6
South 74.7 91.1 75.0 91.6 23.2 68.3 40.8 76.1
Source: Authors’ calculations from IHDS data.
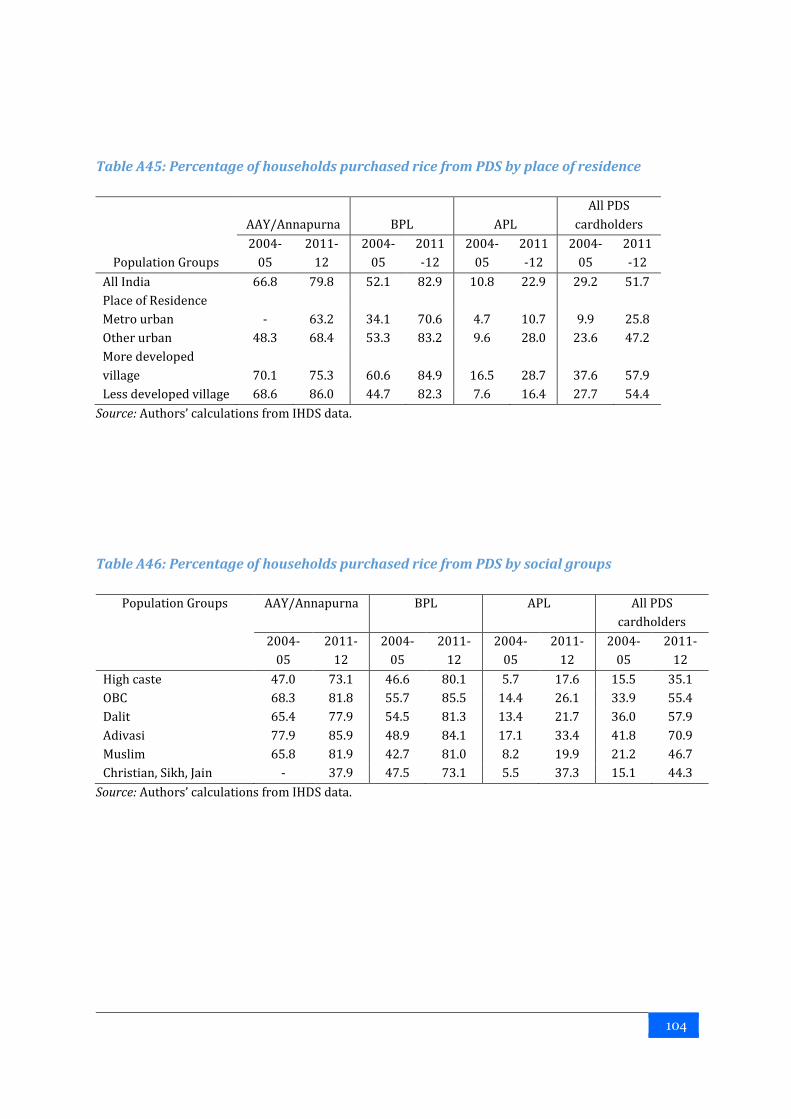
104
Table A45: Percentage of households purchased rice from PDS by place of residence
Population Groups
AAY/Annapurna BPL APL
All PDS
cardholders
2004-
05
2011-
12
2004-
05
2011
-12
2004-
05
2011
-12
2004-
05
2011
-12
All India 66.8 79.8 52.1 82.9 10.8 22.9 29.2 51.7
Place of Residence
Metro urban - 63.2 34.1 70.6 4.7 10.7 9.9 25.8
Other urban 48.3 68.4 53.3 83.2 9.6 28.0 23.6 47.2
More developed
village 70.1 75.3 60.6 84.9 16.5 28.7 37.6 57.9
Less developed village 68.6 86.0 44.7 82.3 7.6 16.4 27.7 54.4
Source: Authors’ calculations from IHDS data.
Table A46: Percentage of households purchased rice from PDS by social groups
Population Groups AAY/Annapurna BPL APL All PDS
cardholders
2004-
05
2011-
12
2004-
05
2011-
12
2004-
05
2011-
12
2004-
05
2011-
12
High caste 47.0 73.1 46.6 80.1 5.7 17.6 15.5 35.1
OBC 68.3 81.8 55.7 85.5 14.4 26.1 33.9 55.4
Dalit 65.4 77.9 54.5 81.3 13.4 21.7 36.0 57.9
Adivasi 77.9 85.9 48.9 84.1 17.1 33.4 41.8 70.9
Muslim 65.8 81.9 42.7 81.0 8.2 19.9 21.2 46.7
Christian, Sikh, Jain - 37.9 47.5 73.1 5.5 37.3 15.1 44.3
Source: Authors’ calculations from IHDS data.

105
Table A47: Percentage of households purchased rice from PDS by highest adult education
level in a household
Population Groups AAY/Annapurna BPL APL All PDS
cardholders
2004-
05
2011-
12
2004-
05
2011-
12
2004-
05
2011-
12
2004-
05
2011-
12
None 72.2 80.6 53.0 83.9 11.8 17.4 38.0 63.2
Below primary 75.5 85.4 53.2 86.4 10.0 22.4 35.8 60.6
Primary 66.9 84.3 54.6 82.5 15.9 24.2 35.9 58.7
Middle 60.6 82.9 49.0 83.1 10.6 25.8 27.3 53.9
Secondary 63.5 68.2 55.1 84.6 11.2 27.6 26.8 52.1
Higher secondary - 75.7 51.9 80.1 8.9 24.2 20.9 44.4
Graduate+ - 61.6 40.0 77.8 7.7 19.3 12.9 31.8
Source: Authors’ calculations from IHDS data.
Table A48: Percentage of households purchased rice from PDS by status of land ownership
Population Groups AAY/Annapurna BPL APL All PDS
cardholders
2004-
05
2011-
12
2004-
05
2011-
12
2004-
05
2011-
12
2004-
05
2011-
12
Non cultivators/No land 70.5 76.7 54.2 83.2 11.7 26.0 31.6 53.6
Marginal (0-1 hectare) 70.7 85.0 57.6 82.1 17.2 21.5 39.6 54.0
Small (1-2 hectare) 61.1 77.9 49.2 86.0 10.0 14.1 27.7 44.2
Medium (2-5 hectare) 43.6 72.5 40.3 82.5 7.8 15.7 18.1 35.1
Large (5 and more
hectare)
69.4 72.9 38.9 68.7 4.6 15.2 15.7 26.8
Source: Authors’ calculations from IHDS data.
Table A49: Percentage of households purchased rice from PDS by income quintile - All
India
Population
Groups
AAY/Annapurna BPL APL All PDS cardholders
2004-05 2011-12 2004-05 2011-12 2004-05 2011-12 2004-05 2011-12
Poorest 72.2 88.1 50.9 83.1 13.8 15.3 35.6 59.2
2nd quintile 73.8 83.9 52.6 83.0 11.8 18.3 35.1 56.2
Middle quintile 70.6 76.9 56.1 83.4 13.4 22.8 35.1 55.1
4th quintile 50.3 67.7 53.4 84.1 11.8 28.2 27.7 52.2
Richest - 56.4 40.5 78.7 6.2 24.1 12.5 35.9
Source: Authors’ calculations from IHDS data.

106
Table A50: Percentage of households purchased rice from PDS by income quintile - Rural
India
Population
Groups
AAY/Annapurna BPL APL All PDS cardholders
2004-05 2011-12 2004-05 2011-12 2004-05 2011-12 2004-05 2011-12
Poorest 70.1 86.8 50.9 83.8 11.9 13.4 35.4 60.2
2nd quintile 80.0 88.1 52.1 83.0 12.8 15.2 36.5 57.6
Middle quintile 69.7 80.4 52.6 83.8 13.4 18.9 35.6 57.1
4th quintile 61.0 75.0 55.5 83.8 13.0 24.6 33.7 56.9
Richest - 66.2 51.1 83.0 10.5 30.7 22.7 48.6
Source: Authors’ calculations from IHDS data.
Table A51: Percentage of households purchased rice from PDS by income quintile - Urban
India
Population
Groups
AAY/Annapurna BPL APL All PDS cardholders
2004-05 2011-12 2004-05 2011-12 2004-05 2011-12 2004-05 2011-12
Poorest - 77.3 57.3 81.3 13.8 24.9 33.1 53.1
2nd quintile - 70.1 53.0 83.4 13.8 26.2 28.8 51.0
Middle quintile - 70.3 50.9 84.8 8.0 27.4 21.3 48.0
4th quintile - 56.9 39.3 79.9 6.1 25.0 12.1 38.5
Richest - 21.9 - 57.2 2.6 16.3 4.2 20.3
Source: Authors’ calculations from IHDS data.
Table A52: Percentage of households purchased rice from PDS by asset quintile - All India
Population
Groups
AAY/Annapurna BPL APL All PDS cardholders
2004-05 2011-12 2004-05 2011-12 2004-05 2011-12 2004-05 2011-12
Poorest 73.8 87.2 49.9 82.1 14.8 11.8 38.8 61.3
2nd quintile 67.9 83.1 48.4 81.3 12.8 16.5 33.4 56.5
Middle quintile 65.9 77.2 63.7 87.8 13.1 27.7 38.0 59.2
4th quintile 43.3 60.1 54.0 85.0 12.4 31.4 25.1 50.4
Richest - 26.2 33.4 65.6 4.2 20.1 7.8 26.6
Source: Authors’ calculations from IHDS data.

107
Table A53: Percentage of households purchased rice from PDS by MGNREGA card
ownership
Population
Groups
AAY/Annapurna BPL APL All PDS cardholders
2004-05 2011-12 2004-05 2011-12 2004-05 2011-12 2004-05 2011-12
MGNREGA - 87.2 - 85.0 - 29.6 - 67.7
Non-MGNREGA - 76.4 - 82.2 - 22.0 - 48.2
Source: Authors’ calculations from IHDS data.
Table A54: Percentage of households purchased rice from PDS by social network
Population Groups AAY/Annapurna BPL APL All PDS cardholders
2004-05 2011-12 2004-05 2011-12 2004-05 2011-12 2004-05 2011-12
No Acquaintance 69.7 80.2 50.9 83.1 11.8 25.0 32.3 60.4
Acquaintance 62.3 79.6 53.6 82.9 10.0 22.4 26.4 48.8
No Organization 66.8 76.1 47.1 76.4 9.2 17.3 25.0 43.9
Organization 66.5 86.6 58.8 89.9 14.0 31.6 36.5 62.2
No
Panchayat/Nagar
66.7 80.7 50.9 82.6 11.0 23.0 28.5 51.2
Panchayat/Nagar 67.4 78.2 61.4 83.9 8.2 22.4 34.5 53.2
Source: Authors’ calculations from IHDS data.
Table A55: Percentage of households purchased rice from PDS by place of residence
Population
Groups
AAY/Annapurna BPL APL All PDS cardholders
2004-05 2011-12 2004-05 2011-12 2004-05 2011-12 2004-05 2011-12
Hills 74.2 87.5 74.2 90.0 22.2 60.8 39.9 70.4
North - 9.7 - 13.4 - 2.6 - 5.7
North Central 67.2 89.6 12.7 82.1 - 2.0 8.0 41.3
Central Plains 49.5 69.4 26.8 52.2 3.0 2.7 14.0 27.4
East 76.3 87.9 23.7 85.2 2.5 15.3 12.3 48.7
West 79.1 86.3 62.5 81.2 13.9 23.4 31.8 42.3
South 86.1 97.0 83.4 96.9 38.6 67.9 67.4 86.6
Source: Authors’ calculations from IHDS data.

108
Table A56: Percentage of households purchased wheat from PDS by place of residence
Population Groups
AAY/Annapurna BPL APL All PDS
cardholders
2004-
05
2011-
12
2004-
05
2011-
12
2004-
05
2011-
12
2004-
05
2011-
12
All India 56.6 70.8 26.7 62.8 6.9 25.3 16.4 44.0
Place of Residence
Metro urban - 66.6 17.4 52.8 2.3 21.7 5.0 29.9
Other urban 40.9 66.0 29.9 68.1 7.3 29.9 14.7 43.5
More developed village 63.4 72.5 29.1 64.6 9.6 26.7 19.6 47.4
Less developed village 56.4 71.1 23.8 59.9 5.5 20.5 16.5 44.1
Source: Authors’ calculations from IHDS data.
Table A57: Percentage of households purchased wheat from PDS by social groups
Population Groups
AAY/Annapurna BPL APL All PDS cardholders
2004-
05
2011-
12
2004-
05
2011-
12
2004-
05
2011-
12 2004-05 2011-12
High caste 40.9 62.3 26.3 61.2 4.9 21.5 10.2 32.8
OBC 56.8 68.6 27.7 63.7 9.3 26.1 18.7 45.1
Dalit 63.9 78.3 25.0 68.2 5.7 28.4 17.6 53.9
Adivasi 50.0 60.4 30.2 48.4 10.8 21.1 26.1 42.5
Muslim 65.6 72.0 23.9 62.7 5.7 26.9 13.2 43.1
Christian, Sikh, Jain 40.9 62.3 26.3 61.2 4.9 21.5 10.2 32.8
Source: Authors’ calculations from IHDS data.
Table A58: Percentage of households purchased wheat from PDS by highest adult
education level in a household
Population Groups
AAY/Annapurna BPL APL All PDS cardholders
2004-
05
2011-
12
2004-
05
2011-
12
2004-
05
2011-
12 2004-05 2011-12
None 60.9 74.3 22.5 64.0 7.4 21.1 18.7 52.2
Below primary 52.3 74.7 29.9 66.1 7.2 29.3 21.2 52.1
Primary 60.3 67.8 27.4 61.4 7.9 28.1 18.8 48.3
Middle 54.3 73.7 28.4 65.3 7.2 31.2 17.1 48.5
Secondary 52.9 59.5 30.6 63.3 7.5 28.1 16.0 43.5
Higher secondary 60.9 74.3 22.5 64.0 7.4 21.1 18.7 52.2
Graduate+ 52.3 74.7 29.9 66.1 7.2 29.3 21.2 52.1
Source: Authors’ calculations from IHDS data.

109
Table A59: Percentage of households purchased wheat from PDS by status of land
ownership
Population Groups
AAY/Annapurna BPL APL All PDS cardholders
2004-
05
2011-
12
2004-
05
2011-
12
2004-
05
2011-
12 2004-05 2011-12
Non cultivators/No land 60.0 72.3 25.4 63.8 6.7 29.0 16.2 46.7
Marginal (0-1 hectare) 55.8 71.7 31.1 61.5 10.6 23.6 22.7 44.7
Small (1-2 hectare) 50.3 51.9 35.3 64.9 8.4 14.8 20.8 35.5
Medium (2-5 hectare) 52.1 45.8 30.0 54.0 6.5 16.8 14.5 27.6
Large (5 and more hectare) - 46.8 13.4 56.7 4.1 15.7 7.6 24.2
Source: Authors’ calculations from IHDS data.
Table A60: Percentage of households purchased wheat from PDS by income quintile - All
India
Population Groups
AAY/Annapurna BPL APL All PDS cardholders
2004-
05
2011-
12
2004-
05
2011-
12
2004-
05
2011-
12 2004-05 2011-12
Poorest 64.3 74.4 28.6 63.4 8.8 20.5 21.8 49.2
2nd quintile 56.7 74.7 27.6 61.8 7.8 25.7 19.8 48.0
Middle quintile 61.2 68.8 27.1 63.9 7.5 28.1 18.3 47.9
4th quintile 41.1 65.6 26.1 63.9 7.4 30.1 14.8 45.2
Richest - 53.6 20.2 58.7 4.9 21.7 7.8 29.9
Source: Authors’ calculations from IHDS data.
Table A61: Percentage of households purchased wheat from PDS by income quintile - Rural
India
Population Groups
AAY/Annapurna BPL APL All PDS
cardholders
2004-
05
2011-
12
2004-
05
2011-
12
2004-
05
2011-
12
2004-
05
2011-
12
Poorest 66.2 71.9 28.6 62.7 9.3 18.0 22.6 48.6
2nd quintile 57.6 76.0 27.7 60.7 7.3 22.8 20.3 47.9
Middle quintile 58.5 71.7 25.0 63.0 7.6 21.6 18.5 47.0
4th quintile 58.0 68.3 27.2 62.4 8.5 24.7 18.5 46.3
Richest - 62.9 23.1 60.8 6.3 26.8 11.5 38.9
Source: Authors’ calculations from IHDS data.

110
Table A62: Percentage of households purchased wheat from PDS by income quintile -
Urban India
Population Groups
AAY/Annapurna BPL APL All PDS
cardholders
2004-
05
2011-
12
2004-
05
2011-
12
2004-
05
2011-
12
2004-
05
2011-
12
Poorest - 76.0 33.4 68.3 10.1 34.9 21.1 52.3
2nd quintile - 68.6 29.3 67.7 8.7 35.8 16.6 50.0
Middle quintile - 65.6 24.2 67.3 4.6 32.0 10.7 44.8
4th quintile - 56.8 20.8 61.7 5.0 26.3 7.9 35.2
Richest - 25.1 - 47.5 2.5 16.3 4.0 19.4
Source: Authors’ calculations from IHDS data.
Table A63: Percentage of households purchased wheat from PDS by asset quintile - All
India
Population Groups
AAY/Annapurna BPL APL All PDS
cardholders
2004-
05
2011-
12
2004-
05
2011-
12
2004-
05
2011-
12
2004-
05
2011-
12
Poorest 58.4 73.9 30.2 62.8 9.6 16.6 24.6 58.4
2nd quintile 64.0 73.2 24.3 63.1 6.1 21.6 17.8 64.0
Middle quintile 58.3 66.5 25.0 64.1 7.7 32.3 17.0 58.3
4th quintile 35.1 66.6 28.0 63.5 8.2 32.4 14.4 35.1
Richest - 52.0 21.1 54.0 4.3 19.7 6.4 -
Source: Authors’ calculations from IHDS data.
Table A64: Percentage of households purchased wheat from PDS by MGNREGA card
ownership
Population Groups
AAY/Annapurna BPL APL All PDS
cardholders
2004-
05
2011-
12
2004-
05
2011-
12
2004-
05
2011-
12
2004-
05
2011-
12
MGNREGA - 71.1 - 63.7 - 35.5 - 55.6
Non-MGNREGA - 70.6 - 62.5 - 24.0 - 41.4
Source: Authors’ calculations from IHDS data.

111
Table A65: Percentage of households purchased wheat from PDS by social network
Population Groups
AAY/Annapurna BPL APL All PDS
cardholders
2004-
05
2011-
12
2004-
05
2011-
12
2004-
05
2011-
12
2004-
05
2011-
12
No Acquaintance 58.2 72.9 26.1 62.4 6.6 32.2 17.7 51.6
Acquaintance 54.2 69.9 27.4 63.0 7.2 23.7 15.3 41.4
No Organization 58.1 75.3 27.3 68.1 6.3 21.7 15.7 43.2
Organization 52.7 62.4 25.9 57.2 8.3 30.8 17.7 45.0
No Panchayat/Nagar 57.1 68.3 26.5 59.7 7.0 27.3 16.2 43.2
Panchayat/Nagar 53.1 75.1 28.2 72.0 6.6 18.9 18.0 46.3
Source: Authors’ calculations from IHDS data.
Table A66: Percentage of households purchased wheat from PDS by place of residence
Population Groups
AAY/Annapurna BPL APL All PDS
cardholders
2004-
05
2011-
12
2004-
05
2011-
12
2004-
05
2011-
12
2004-
05
2011-
12
Hills 55.3 76.9 46.8 76.9 11.2 56.3 23.8 63.2
North - 80.3 12.6 60.0 - 5.0 2.2 24.6
North Central 71.4 83.8 12.5 66.1 - 6.3 8.2 37.0
Central Plains 35.7 65.4 27.6 80.9 4.4 12.8 14.2 42.6
East - 45.7 4.4 38.7 - 33.6 3.2 36.5
West 83.9 83.3 62.4 77.6 13.6 22.6 31.7 40.6
South 65.6 61.9 27.9 60.8 18.8 53.3 25.1 58.2
Source: Authors’ calculations from IHDS data.
Table A67: Percentage of households purchased sugar from PDS by place of residence
Population Groups
AAY/Annapurna BPL APL All PDS
cardholders
2004-
05
2011-
12
2004-
05
2011-
12
2004-
05
2011-
12
2004-
05
2011-
12
All India 18.0 55.8 32.9 60.5 13.0 17.7 21.2 38.1
Place of Residence
Metro urban 0.0 37.9 30.4 53.2 10.0 11.0 13.6 21.5
Other urban 16.3 60.0 36.3 69.9 12.5 21.5 19.8 38.5
More developed village 22.8 55.5 38.6 64.1 14.9 19.8 25.8 42.7
Less developed village 16.3 55.6 26.2 53.9 12.5 14.3 19.0 37.1
Source: Authors’ calculations from IHDS data.
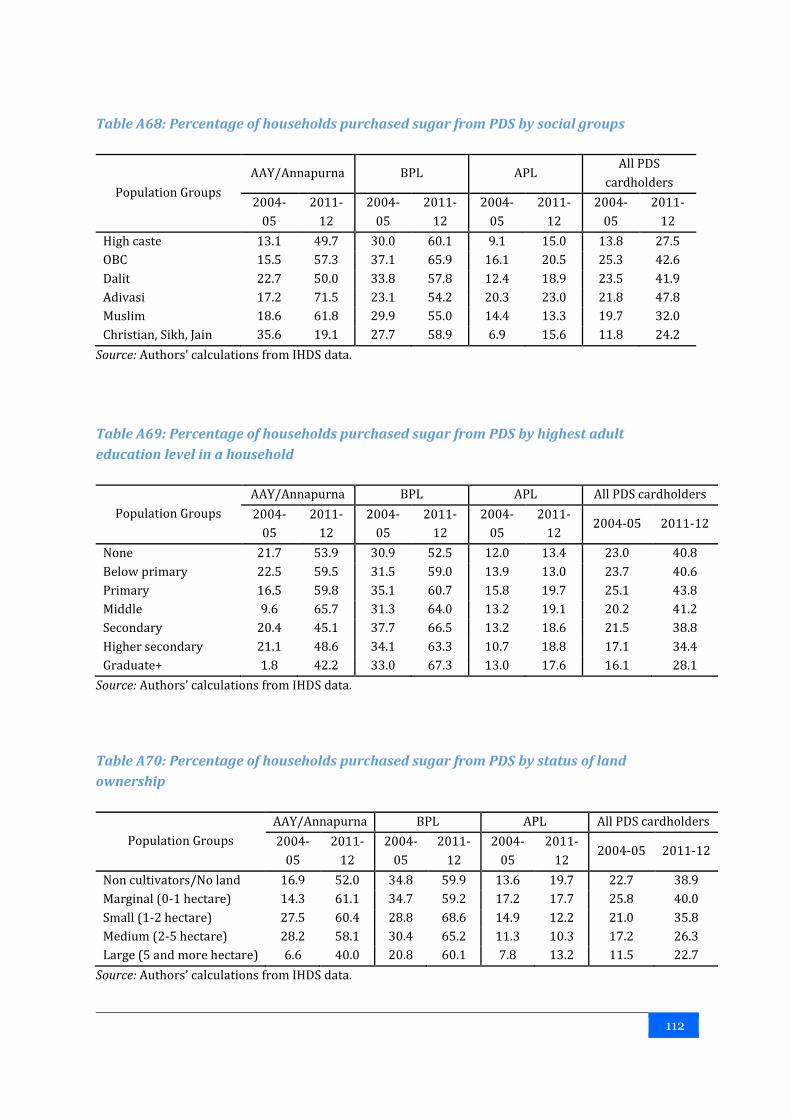
112
Table A68: Percentage of households purchased sugar from PDS by social groups
Population Groups
AAY/Annapurna BPL APL All PDS
cardholders
2004-
05
2011-
12
2004-
05
2011-
12
2004-
05
2011-
12
2004-
05
2011-
12
High caste 13.1 49.7 30.0 60.1 9.1 15.0 13.8 27.5
OBC 15.5 57.3 37.1 65.9 16.1 20.5 25.3 42.6
Dalit 22.7 50.0 33.8 57.8 12.4 18.9 23.5 41.9
Adivasi 17.2 71.5 23.1 54.2 20.3 23.0 21.8 47.8
Muslim 18.6 61.8 29.9 55.0 14.4 13.3 19.7 32.0
Christian, Sikh, Jain 35.6 19.1 27.7 58.9 6.9 15.6 11.8 24.2
Source: Authors’ calculations from IHDS data.
Table A69: Percentage of households purchased sugar from PDS by highest adult
education level in a household
Population Groups
AAY/Annapurna BPL APL All PDS cardholders
2004-
05
2011-
12
2004-
05
2011-
12
2004-
05
2011-
12 2004-05 2011-12
None 21.7 53.9 30.9 52.5 12.0 13.4 23.0 40.8
Below primary 22.5 59.5 31.5 59.0 13.9 13.0 23.7 40.6
Primary 16.5 59.8 35.1 60.7 15.8 19.7 25.1 43.8
Middle 9.6 65.7 31.3 64.0 13.2 19.1 20.2 41.2
Secondary 20.4 45.1 37.7 66.5 13.2 18.6 21.5 38.8
Higher secondary 21.1 48.6 34.1 63.3 10.7 18.8 17.1 34.4
Graduate+ 1.8 42.2 33.0 67.3 13.0 17.6 16.1 28.1
Source: Authors’ calculations from IHDS data.
Table A70: Percentage of households purchased sugar from PDS by status of land
ownership
Population Groups
AAY/Annapurna BPL APL All PDS cardholders
2004-
05
2011-
12
2004-
05
2011-
12
2004-
05
2011-
12 2004-05 2011-12
Non cultivators/No land 16.9 52.0 34.8 59.9 13.6 19.7 22.7 38.9
Marginal (0-1 hectare) 14.3 61.1 34.7 59.2 17.2 17.7 25.8 40.0
Small (1-2 hectare) 27.5 60.4 28.8 68.6 14.9 12.2 21.0 35.8
Medium (2-5 hectare) 28.2 58.1 30.4 65.2 11.3 10.3 17.2 26.3
Large (5 and more hectare) 6.6 40.0 20.8 60.1 7.8 13.2 11.5 22.7
Source: Authors’ calculations from IHDS data.

113
Table A71: Percentage of households purchased sugar from PDS by income quintile - All
India
Population Groups
AAY/Annapurna BPL APL All PDS cardholders
2004-
05
2011-
12
2004-
05
2011-
12
2004-
05
2011-
12 2004-05 2011-12
Poorest 19.3 55.9 25.1 53.4 11.2 9.3 18.7 37.7
2nd quintile 14.1 58.4 30.2 54.7 12.7 12.0 21.7 37.3
Middle quintile 22.2 56.1 36.2 62.4 13.9 16.8 24.6 41.0
4th quintile 18.6 53.7 39.0 69.3 14.8 22.2 23.7 42.3
Richest 13.5 42.7 36.0 67.2 12.2 21.3 16.6 31.1
Source: Authors’ calculations from IHDS data.
Table A72: Percentage of households purchased sugar from PDS by income quintile - Rural
India
Population Groups
AAY/Annapurna BPL APL All PDS cardholders
2004-05 2011-12 2004-
05
2011-
12
2004-
05
2011-
12 2004-05 2011-12
Poorest 20.9 55.8 24.2 53.5 11.5 6.6 18.6 37.8
2nd quintile 14.6 55.7 28.8 49.9 11.1 10.4 20.5 35.4
Middle quintile 12.1 58.4 32.7 55.9 13.3 12.7 23.2 38.6
4th quintile 27.2 53.0 37.2 66.2 14.6 20.1 25.2 44.9
Richest 18.8 50.9 40.0 69.9 16.0 25.7 22.9 40.6
Source: Authors’ calculations from IHDS data.
Table A73: Percentage of households purchased sugar from PDS by income quintile -
Urban India
Population Groups
AAY/Annapurna BPL APL All PDS
cardholders
2004-
05
2011-
12
2004-
05
2011-
12
2004-
05
2011-
12
2004-
05
2011-
12
Poorest 16.2 67.1 32.7 65.4 13.7 17.1 21.7 41.6
2nd quintile 22.2 55.3 35.1 69.5 14.7 20.0 22.3 41.4
Middle quintile 17.2 55.3 40.6 69.1 11.5 20.1 20.3 37.6
4th quintile 7.6 51.8 33.8 69.3 9.7 19.0 14.0 31.4
Richest 8.9 23.3 31.6 48.9 10.4 17.1 12.3 20.2
Source: Authors’ calculations from IHDS data.

114
Table A74: Percentage of households purchased sugar from PDS by asset quintile - All
India
Population Groups
AAY/Annapurna BPL APL All PDS
cardholders
2004-
05
2011-
12
2004-
05
2011-
12
2004-
05
2011-
12
2004-
05
2011-
12
Poorest 18.4 55.7 25.2 44.3 11.4 6.3 19.8 34.3
2nd quintile 19.0 59.6 29.7 56.7 13.6 12.0 22.1 39.8
Middle quintile 18.9 61.1 41.8 72.8 16.7 21.8 28.5 48.4
4th quintile 13.3 47.9 40.4 73.8 14.8 25.3 22.4 42.4
Richest 8.1 20.1 36.1 60.1 9.5 16.2 12.8 22.5
Source: Authors’ calculations from IHDS data.
Table A75: Percentage of households purchased sugar from PDS by MGNREGA card
ownership
Population Groups
AAY/Annapurna BPL APL All PDS
cardholders
2004-
05
2011-
12
2004-
05
2011-
12
2004-
05
2011-
12
2004-
05
2011-
12
MGNREGA - 68.2 - 67.6 - 24.4 - 53.9
Non-MGNREGA - 50.2 - 58.2 - 16.9 - 34.6
Source: Authors’ calculations from IHDS data.
Table A76: Percentage of households purchased sugar from PDS by social network
Population Groups
AAY/Annapurna BPL APL All PDS
cardholders
2004-
05
2011-
12
2004-
05
2011-
12
2004-
05
2011-
12
2004-
05
2011-
12
No Acquaintance 16.9 56.2 33.2 59.5 15.0 21.0 23.6 44.4
Acquaintance 19.6 55.7 32.5 61.0 11.7 17.0 19.1 36.0
No Organization 15.8 52.3 28.9 51.0 12.0 15.3 18.3 31.5
Organization 23.4 62.5 38.2 70.5 15.2 21.5 26.3 47.0
No Panchayat/Nagar 17.8 53.1 31.8 59.6 13.1 17.1 20.7 36.9
Panchayat/Nagar 19.1 60.6 40.9 63.0 12.7 19.7 25.7 41.6
Source: Authors’ calculations from IHDS data.

115
Table A77: Percentage of households purchased sugar from PDS by place of residence
Population Groups
AAY/Annapurna BPL APL All PDS
cardholders
2004-
05
2011-
12
2004-
05
2011-
12
2004-
05
2011-
12
2004-
05
2011-
12
Hills 60.8 95.2 77.2 92.3 68.6 84.7 70.6 87.5
North 0.0 9.3 10.3 19.9 0.5 0.4 1.9 5.6
North Central 9.8 46.0 1.5 24.2 0.9 1.0 1.5 14.5
Central Plains 15.2 69.4 14.8 55.6 2.5 1.3 7.5 27.8
East 5.8 48.1 18.3 47.6 13.8 16.3 15.2 31.2
West 21.6 42.0 27.1 42.2 3.1 7.5 11.7 18.8
South 37.6 89.8 56.7 91.8 40.9 52.4 50.8 77.7
Source: Authors’ calculations from IHDS data.
Table A78: Percentage of households purchased kerosene from PDS by place of residence
Population Groups
AAY/Annapurna BPL APL All PDS
cardholders
2004-
05
2011-
12
2004-
05
2011-
12
2004-
05
2011-
12
2004-
05
2011-
12
All India 83.3 88.3 84.9 88.7 68.9 70.1 75.8 79.1
Place of Residence
Metro urban 0.0 52.6 55.6 59.9 43.0 51.2 45.2 53.3
Other urban 61.2 76.4 71.0 76.8 46.1 50.0 54.0 59.6
More developed village 88.4 86.0 88.9 92.3 78.5 79.5 83.4 85.9
Less developed village 85.1 93.9 88.3 93.9 84.7 87.7 86.4 91.2
Source: Authors’ calculations from IHDS data.

116
Table A79: Percentage of households purchased kerosene from PDS by social groups
Population Groups
AAY/Annapurna BPL APL All PDS
cardholders
2004-
05
2011-
12
2004-
05
2011-
12
2004-
05
2011-
12
2004-
05
2011-
12
High caste 61.1 75.0 80.1 84.8 60.6 62.0 65.0 68.2
OBC 90.0 91.3 84.9 89.1 73.1 71.7 78.7 80.5
Dalit 86.9 86.5 87.8 89.7 72.2 75.3 80.6 83.8
Adivasi 76.5 94.8 86.2 90.3 70.7 78.2 81.0 87.6
Muslim 87.0 92.5 81.3 89.1 78.1 82.0 79.4 85.3
Christian, Sikh, Jain 43.8 47.6 81.5 75.9 46.6 45.1 54.5 51.2
Source: Authors’ calculations from IHDS data.
Table A80: Percentage of households purchased kerosene from PDS by highest adult
education level in a household
Population Groups
AAY/Annapurna BPL APL All PDS
cardholders
2004-
05
2011-
12
2004-
05
2011-
12
2004-
05
2011-
12
2004-
05
2011-
12
None 87.1 91.0 88.9 94.1 82.7 87.8 86.4 91.8
Below primary 87.5 94.8 87.2 94.6 84.4 87.8 86.0 91.9
Primary 77.7 90.7 84.1 89.2 77.5 79.8 80.7 85.5
Middle 85.9 88.3 84.5 89.7 75.2 77.7 79.2 83.5
Secondary 83.2 84.6 83.5 85.4 61.9 68.8 69.5 76.1
Higher secondary 75.3 77.9 81.3 81.9 60.3 64.6 66.1 70.7
Graduate+ 87.1 91.0 88.9 94.1 82.7 87.8 86.4 91.8
Source: Authors’ calculations from IHDS data.
Table A81: Percentage of households purchased kerosene from PDS by status of land
ownership
Population Groups
AAY/Annapurna BPL APL All PDS
cardholders
2004-
05
2011-
12
2004-
05
2011-
12
2004-
05
2011-
12
2004-
05
2011-
12
Non cultivators/No land 78.2 84.9 82.1 85.4 57.6 61.3 68.7 73.1
Marginal (0-1 hectare) 88.6 93.0 90.9 93.2 83.7 83.1 87.5 88.5
Small (1-2 hectare) 94.1 92.0 87.7 94.0 80.9 80.5 84.1 86.2
Medium (2-5 hectare) 86.5 88.5 85.8 91.5 78.8 78.1 81.0 82.0
Large (5 and more hectare) 89.8 88.3 89.4 89.3 85.1 71.3 86.4 75.2
Source: Authors’ calculations from IHDS data.

117
Table A82: Percentage of households purchased kerosene from PDS by income quintile - All
India
Population Groups
AAY/Annapurna BPL APL All PDS
cardholders
2004-
05
2011-
12
2004-
05
2011-
12
2004-
05
2011-
12
2004-
05
2011-
12
Poorest 93.7 95.0 88.6 93.5 84.5 87.0 87.1 91.3
2nd quintile 82.8 92.6 88.6 92.1 82.8 85.3 85.8 89.3
Middle quintile 77.3 86.0 86.5 89.6 76.6 77.6 81.2 83.9
4th quintile 80.0 79.6 82.8 84.6 69.0 68.6 74.3 75.4
Richest 51.7 65.5 66.2 75.2 48.0 52.1 51.4 57.1
Source: Authors’ calculations from IHDS data.
Table A83: Percentage of households purchased kerosene from PDS by income quintile -
Rural India
Population Groups
AAY/Annapurna BPL APL All PDS
cardholders
2004-
05
2011-
12
2004-
05
2011-
12
2004-
05
2011-
12
2004-
05
2011-
12
Poorest 93.4 96.0 89.1 94.1 85.6 91.1 87.8 93.3
2nd quintile 89.2 94.0 90.6 94.9 88.3 90.8 89.5 93.2
Middle quintile 82.1 93.0 90.6 94.6 82.5 90.0 86.6 92.6
4th quintile 78.9 83.1 87.5 92.6 81.2 83.1 84.0 87.7
Richest 79.3 81.6 83.6 87.8 75.2 73.6 77.6 78.4
Source: Authors’ calculations from IHDS data.
Table A84: Percentage of households purchased kerosene from PDS by income quintile -
Urban India
Population Groups
AAY/Annapurna BPL APL All PDS
cardholders
2004-
05
2011-
12
2004-
05
2011-
12
2004-
05
2011-
12
2004-
05
2011-
12
Poorest 71.6 81.6 76.8 81.6 66.1 65.7 70.7 73.7
2nd quintile 73.8 78.3 74.1 78.7 60.9 59.9 65.9 68.2
Middle quintile 62.2 74.7 67.9 71.5 47.9 55.9 54.1 61.7
4th quintile 26.3 62.6 54.4 64.0 36.8 48.4 39.9 52.4
Richest 7.2 25.8 34.9 51.8 27.3 33.3 27.8 35.0
Source: Authors’ calculations from IHDS data.

118
Table A85: Percentage of households purchased kerosene from PDS by asset quintile - All
India
Population Groups
AAY/Annapurna BPL APL All PDS
cardholders
2004-
05
2011-
12
2004-
05
2011-
12
2004-
05
2011-
12
2004-
05
2011-
12
Poorest 88.3 95.4 88.8 95.8 88.7 94.0 88.7 95.2
2nd quintile 88.6 92.0 88.5 93.1 88.3 92.1 88.5 92.6
Middle quintile 70.7 84.8 88.4 91.1 81.0 84.6 84.2 87.7
4th quintile 75.5 70.3 78.2 78.7 68.9 69.8 71.8 72.9
Richest 28.1 39.1 50.7 54.8 38.7 39.3 40.1 41.5
Source: Authors’ calculations from IHDS data.
Table A86: Percentage of households purchased kerosene from PDS by MGNREGA card
ownership
Population Groups
AAY/Annapurna BPL APL All PDS
cardholders
2004-
05
2011-
12
2004-
05
2011-
12
2004-
05
2011-
12
2004-
05
2011-
12
MGNREGA 0.0 94.9 0.0 95.5 0.0 92.3 0.0 94.4
Non-MGNREGA 0.0 85.3 0.0 86.5 0.0 67.3 0.0 75.7
Source: Authors’ calculations from IHDS data.
Table A87: Percentage of households purchased kerosene from PDS by social network
Population Groups
AAY/Annapurna BPL APL All PDS
cardholders
2004-
05
2011-
12
2004-
05
2011-
12
2004-
05
2011-
12
2004-
05
2011-
12
No Acquaintance 84.0 92.0 85.2 90.3 75.9 76.5 80.5 85.1
Acquaintance 82.3 86.7 84.6 88.0 64.0 68.7 71.6 77.1
No Organization 82.1 87.4 83.3 87.7 67.9 69.6 74.0 77.7
Organization 86.3 90.0 87.1 89.8 71.0 71.0 79.0 80.9
No Panchayat/Nagar 83.2 89.1 85.2 88.1 68.4 69.0 75.6 78.1
Panchayat/Nagar 84.4 86.8 82.7 90.7 73.5 73.6 78.1 81.9
Source: Authors’ calculations from IHDS data.

119
Table A88: Percentage of households purchased kerosene from PDS by place of residence
Population Groups
AAY/Annapurna BPL APL All PDS
cardholders
2004-
05
2011-
12
2004-
05
2011-
12
2004-
05
2011-
12
2004-
05
2011-
12
Hills 82.4 66.8 71.3 70.2 49.5 51.8 57.5 57.8
North 40.0 38.2 34.9 39.5 16.8 9.8 19.5 19.2
North Central 94.4 96.6 89.6 96.9 85.1 91.2 87.0 93.9
Central Plains 76.7 93.5 86.7 92.2 72.1 72.3 77.3 81.6
East 71.9 92.2 85.2 93.5 85.1 93.4 84.8 93.4
West 83.9 83.4 82.7 83.1 59.0 60.0 67.6 67.5
South 85.6 93.2 86.6 87.8 71.1 61.7 81.0 78.7
Source: Authors’ calculations from IHDS data.
Table A89: Share of PDS grain to total consumption of households by place of residence
(%)
Population Groups
AAY/Annapurna BPL APL All PDS
cardholders
2004-
05
2011-
12
2004-
05
2011-
12
2004-
05
2011-
12
2004-
05
2011-
12
All India 32.3 47.0 20.6 39.2 4.7 10.3 11.8 25.2
Place of Residence
Metro urban - 38.1 18.1 34.0 2.2 8.1 5.1 14.9
Other urban 31.7 50.2 26.4 43.2 5.1 13.7 11.6 25.0
More developed village 38.9 48.8 24.6 41.2 6.6 12.1 14.9 28.1
Less developed village 29.9 45.6 15.9 36.8 3.2 7.0 10.1 24.6
Source: Authors’ calculations from IHDS data.
Table A90: Share of PDS grain to total consumption of households by social groups (%)
Population Groups
AAY/Annapurna BPL APL All PDS cardholders
2004-
05
2011-
12
2004-
05
2011-
12
2004-
05
2011-
12 2004-05 2011-12
High caste 24.2 44.3 19.0 37.1 2.7 8.6 6.6 17.2
OBC 34.8 46.5 20.8 39.6 5.1 10.9 12.5 25.9
Dalit 31.6 48.1 21.2 40.1 4.9 10.7 14.0 29.8
Adivasi 34.7 53.3 19.9 42.6 10.4 13.1 18.3 35.7
Muslim 30.4 40.9 19.7 34.9 5.7 9.8 10.9 21.4
Christian, Sikh, Jain - 34.9 28.2 44.5 3.7 14.7 8.6 21.1
Source: Authors’ calculations from IHDS data.
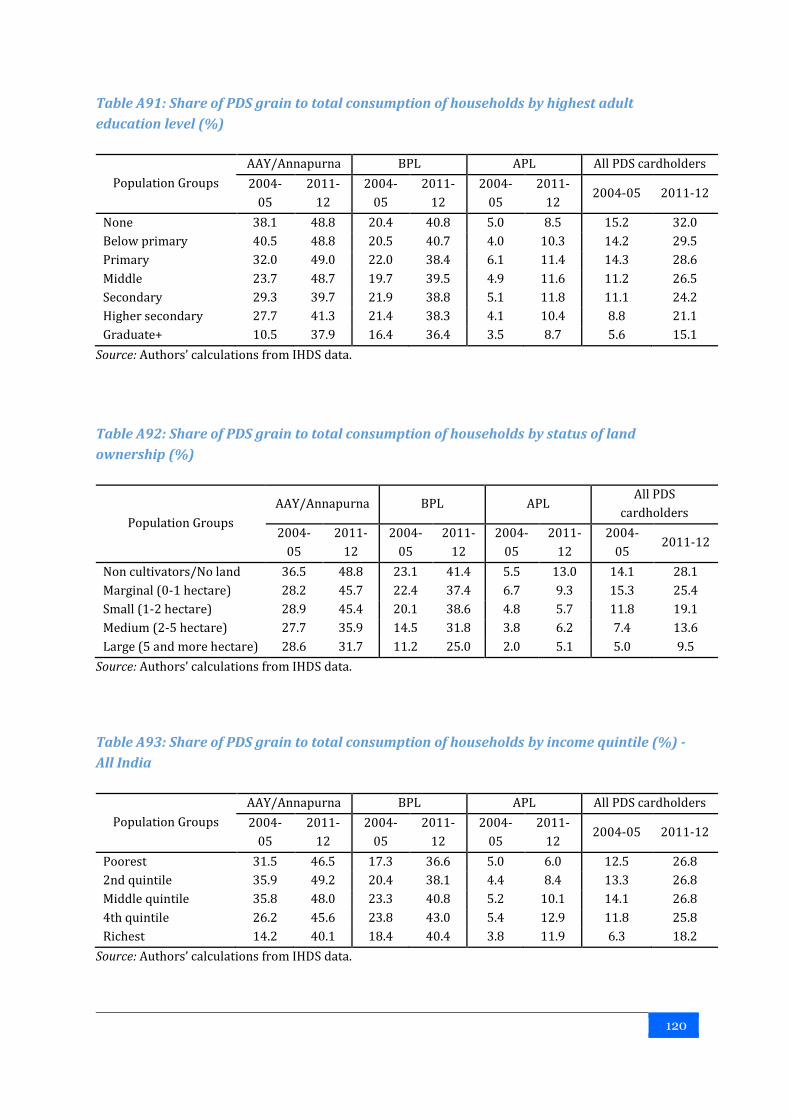
120
Table A91: Share of PDS grain to total consumption of households by highest adult
education level (%)
Population Groups
AAY/Annapurna BPL APL All PDS cardholders
2004-
05
2011-
12
2004-
05
2011-
12
2004-
05
2011-
12 2004-05 2011-12
None 38.1 48.8 20.4 40.8 5.0 8.5 15.2 32.0
Below primary 40.5 48.8 20.5 40.7 4.0 10.3 14.2 29.5
Primary 32.0 49.0 22.0 38.4 6.1 11.4 14.3 28.6
Middle 23.7 48.7 19.7 39.5 4.9 11.6 11.2 26.5
Secondary 29.3 39.7 21.9 38.8 5.1 11.8 11.1 24.2
Higher secondary 27.7 41.3 21.4 38.3 4.1 10.4 8.8 21.1
Graduate+ 10.5 37.9 16.4 36.4 3.5 8.7 5.6 15.1
Source: Authors’ calculations from IHDS data.
Table A92: Share of PDS grain to total consumption of households by status of land
ownership (%)
Population Groups
AAY/Annapurna BPL APL All PDS
cardholders
2004-
05
2011-
12
2004-
05
2011-
12
2004-
05
2011-
12
2004-
05 2011-12
Non cultivators/No land 36.5 48.8 23.1 41.4 5.5 13.0 14.1 28.1
Marginal (0-1 hectare) 28.2 45.7 22.4 37.4 6.7 9.3 15.3 25.4
Small (1-2 hectare) 28.9 45.4 20.1 38.6 4.8 5.7 11.8 19.1
Medium (2-5 hectare) 27.7 35.9 14.5 31.8 3.8 6.2 7.4 13.6
Large (5 and more hectare) 28.6 31.7 11.2 25.0 2.0 5.1 5.0 9.5
Source: Authors’ calculations from IHDS data.
Table A93: Share of PDS grain to total consumption of households by income quintile (%) -
All India
Population Groups
AAY/Annapurna BPL APL All PDS cardholders
2004-
05
2011-
12
2004-
05
2011-
12
2004-
05
2011-
12 2004-05 2011-12
Poorest 31.5 46.5 17.3 36.6 5.0 6.0 12.5 26.8
2nd quintile 35.9 49.2 20.4 38.1 4.4 8.4 13.3 26.8
Middle quintile 35.8 48.0 23.3 40.8 5.2 10.1 14.1 26.8
4th quintile 26.2 45.6 23.8 43.0 5.4 12.9 11.8 25.8
Richest 14.2 40.1 18.4 40.4 3.8 11.9 6.3 18.2
Source: Authors’ calculations from IHDS data.

121
Table A94: Share of PDS grain to total consumption of households by income quintile (%) -
Rural India
Population Groups
AAY/Annapurna BPL APL All PDS
cardholders
2004-
05
2011-
12
2004-
05
2011-
12
2004-
05
2011-
12
2004-
05
2011-
12
Poorest 33.0 44.9 16.6 36.3 4.7 5.2 12.3 26.6
2nd quintile 33.5 48.6 19.1 36.4 4.3 7.0 12.9 26.6
Middle quintile 33.9 48.2 20.4 39.1 5.0 7.7 13.5 26.7
4th quintile 30.2 46.3 23.3 41.8 4.8 10.0 13.1 27.2
Richest 26.5 45.0 21.4 42.5 5.4 13.4 9.5 22.9
Source: Authors’ calculations from IHDS data.
Table A95: Share of PDS grain to total consumption of households by income quintile (%) -
Urban India
Population Groups
AAY/Annapurna BPL APL All PDS
cardholders
2004-
05
2011-
12
2004-
05
2011-
12
2004-
05
2011-
12
2004-
05
2011-
12
Poorest 35.6 52.7 27.7 41.9 6.0 12.1 15.4 27.9
2nd quintile - 50.6 26.9 41.7 6.3 13.5 13.7 26.5
Middle quintile - 48.3 24.6 43.5 3.9 14.3 9.8 24.9
4th quintile - 42.3 20.8 41.5 3.5 13.0 6.4 20.1
Richest - 19.9 10.7 32.9 2.1 8.8 2.9 11.2
Source: Authors’ calculations from IHDS data.
Table A96: Share of PDS grain to total consumption of households by asset quintile (%) -
All India
Population Groups
AAY/Annapurna BPL APL All PDS
cardholders
2004-
05
2011-
12
2004-
05
2011-
12
2004-
05
2011-
12
2004-
05
2011-
12
Poorest 37.77 48.08 20.07 38.67 6.15 5.30 15.98 29.90
2nd quintile 29.48 48.52 18.89 37.96 4.60 7.82 12.71 26.98
Middle quintile 32.78 45.65 24.06 40.93 5.22 12.32 13.93 27.63
4th quintile 22.17 45.04 22.19 41.66 5.48 14.24 10.22 24.34
Richest 2.43 31.66 14.74 32.99 2.51 9.21 3.99 13.01
Source: Authors’ calculations from IHDS data.

122
Table A97: Share of PDS grain to total consumption of households by social network (%)
Population Groups
AAY/Annapurna BPL APL All PDS
cardholders
2004-
05
2011-
12
2004-
05
2011-
12
2004-
05
2011-
12
2004-
05
2011-
12
No Acquaintance 34.0 49.0 21.7 41.9 4.8 13.2 13.4 31.4
Acquaintance 30.0 46.2 19.5 38.1 4.7 9.7 10.5 23.3
No Organization 31.9 46.7 19.7 39.8 4.0 8.7 10.6 23.6
Organization 33.5 47.5 21.9 38.6 6.0 12.9 14.0 27.3
No Panchayat/Nagar 32.5 48.0 20.4 40.1 4.8 10.8 11.8 25.5
Panchayat/Nagar 30.9 45.3 22.3 37.0 3.6 8.8 12.3 24.3
Source: Authors’ calculations from IHDS data.
Table A98: Share of PDS grain to total consumption of households across regions (%)
Population Groups
AAY/Annapurna BPL APL All PDS
cardholders
2004-
05
2011-
12
2004-
05
2011-
12
2004-
05
2011-
12
2004-
05
2011-
12
Hills 46.8 55.2 45.3 49.6 17.1 32.9 26.2 39.1
North - 39.0 7.1 35.5 0.3 2.3 1.3 13.6
North Central 26.9 42.4 4.9 35.4 0.4 1.8 3.2 19.0
Central Plains 31.4 53.3 17.8 40.5 2.3 3.2 9.3 21.6
East 26.8 39.8 7.7 33.8 1.6 8.9 4.6 21.7
West 54.1 53.3 26.3 42.6 6.9 11.3 14.5 22.2
South 48.8 60.0 35.6 43.4 18.1 33.5 29.8 40.9
Source: Authors’ calculations from IHDS data.
Table A99: Average per capita consumption of grain by different cardholders (kg/month)
and place of residence
Population Groups
AAY/
Annapurna BPL APL
All PDS
cardholders
No
cardholders All India
2004-
05
2011-
12
2004-
05
2011-
12
2004-
05
2011-
12
2004-
05
2011-
12
2004-
05
2011-
12
2004-
05
2011-
12
All India 12.7 12.1 11.3 11.0 11.0 10.4 11.2 10.8 11.6 10.7 11.3 10.8
Place of Residence
Metro urban 9.0 9.5 9.3 9.1 8.8 9.0 8.9 9.0 9.1 8.7 8.9 9.0
Other urban 9.6 10.1 9.5 9.6 9.6 9.0 9.6 9.2 9.7 9.3 9.6 9.2
More developed village 12.9 11.5 10.9 10.8 11.4 10.6 11.2 10.8 11.8 11.1 11.3 10.8
Less developed village 13.1 13.1 12.5 12.0 12.3 12.0 12.4 12.2 13.0 11.8 12.5 12.1
Source: Authors’ calculations from IHDS data.

123
Table A100: Average per capita consumption of grain by different cardholders (kg/month)
and Social groups
Population
Groups
AAY/
Annapurna BPL APL
All PDS
cardholders No cardholders All India
2004-
05
2011-
12
2004-
05
2011-
12
2004-
05
2011-
12
2004-
05
2011-
12
2004-
05
2011-
12
2004-
05
2011-
12
High caste 11.8 11.0 10.6 11.2 10.5 10.0 10.5 10.3 10.5 10.2 10.5 10.3
OBC 13.0 12.3 11.5 11.1 11.5 10.7 11.5 11.0 12.0 10.9 11.6 11.0
Dalit 12.8 12.5 11.7 11.1 11.3 10.6 11.5 11.1 11.8 10.7 11.6 11.0
Adivasi 13.1 12.0 11.2 10.9 11.1 11.1 11.3 11.0 12.3 11.4 11.5 11.1
Muslim 11.8 11.7 11.2 10.7 11.1 10.6 11.1 10.7 10.8 10.7 11.1 10.7
Christian,
Sikh, Jain - 9.2 8.9 8.7 9.8 8.9 9.6 8.8 9.3 8.9 9.6 8.8
Source: Authors’ calculations from IHDS data.
Table A101: Average per capita consumption of grain by different cardholders
(Kg/month) and highest adult education level of a household
Population
Groups
AAY/Annapurna BPL APL All PDS
cardholders
No cardholders All India
2004-
05
2011-
12
2004-
05
2011-
12
2004-
05
2011-
12
2004-
05
2011-
12
2004-
05
2011-
12
2004-
05
2011-
12
None 13.7 13.5 12.3 12.3 12.5 12.5 12.4 12.5 12.7 11.7 12.5 12.4
Below
primary
12.1 12.5 11.7 11.7 11.8 11.7 11.8 11.8 12.5 11.0 11.9 11.7
Primary 12.3 11.8 11.3 11.0 11.2 11.0 11.3 11.1 11.5 11.4 11.3 11.1
Middle 13.0 11.6 11.0 10.9 11.1 10.7 11.1 10.9 11.0 10.9 11.1 10.9
Secondary 11.5 11.2 10.4 10.2 10.4 10.2 10.5 10.2 11.0 10.0 10.5 10.2
Higher
secondary
11.3 10.7 10.2 10.1 10.7 9.8 10.6 9.9 11.3 10.4 10.7 10.0
Graduate+ 9.0 10.7 10.4 10.0 10.4 9.6 10.4 9.7 10.3 9.3 10.4 9.7
Source: Authors’ calculations from IHDS data.
Table A102: Average per capita consumption of grain by different cardholders (kg/month)
and status of land ownership
Population Groups
AAY/Annapurna BPL APL All PDS
cardholders
No
cardholders All India
2004-
05
2011-
12
2004-
05
2011-
12
2004-
05
2011-
12
2004-
05
2011-
12
2004-
05
2011-
12
2004-
05
2011-
12
Non cultivators/No
land 12.0 11.7 10.7 10.5 10.0 9.5 10.4 10.1 10.5 10.1 10.4 10.1
Marginal (0-1
hectare) 14.0 12.8 11.7 11.9 11.9 11.5 11.9 11.8 12.4 12.1 12.0 11.8

124
(contd..)
Population Groups
AAY/Annapurna BPL APL All PDS
cardholders
No
cardholders All India
2004-
05
2011-
12
2004-
05
2011-
12
2004-
05
2011-
12
2004-
05
2011-
12
2004-
05
2011-
12
2004-
05
2011-
12
Small (1-2 hectare) 13.1 11.9 11.7 11.0 11.9 11.6 11.9 11.4 12.0 11.1 11.9 11.3
Medium (2-5
hectare) 13.4 11.7 12.2 10.8 12.0 11.1 12.1 11.0 13.2 11.7 12.2 11.1
Large (5 and more
hectare) 12.4 10.1 12.9 12.0 12.3 11.0 12.4 11.1 14.3 9.7 12.7 11.0
Source: Authors’ calculations from IHDS Data.
Table A103: Average per capita consumption of grain by different cardholders (kg/month)
and income quintiles - All India
Population
Groups
AAY/
Annapurna BPL APL
All PDS
cardholders
No
cardholders All India
2004-
05
2011-
12
2004-
05
2011-
12
2004-
05
2011-
12
2004-
05
2011-
12
2004-
05
2011-
12
2004-
05
2011-
12
Poorest 12.7 12.3 11.5 11.2 11.8 11.0 11.7 11.3 12.2 11.2 11.8 11.3
2nd quintile 12.3 12.2 11.4 11.1 11.3 10.8 11.4 11.1 11.9 10.9 11.4 11.0
Middle quintile 13.0 11.5 11.4 10.9 11.0 10.6 11.2 10.8 11.5 10.6 11.3 10.7
4th quintile 13.8 12.9 10.9 10.9 10.8 10.1 10.8 10.5 10.9 10.2 10.8 10.5
Richest 10.6 11.4 11.2 10.8 10.4 10.0 10.6 10.2 10.7 10.5 10.6 10.2
Source: Authors’ calculations from IHDS data.
Table A104: Average per capita consumption of grain by different cardholders (kg/month)
and income quintiles - Rural India
Population
Groups
AAY/Annapurna BPL APL All PDS
cardholders
No
cardholders All India
2004-
05
2011-
12
2004-
05
2011-
12
2004-
05
2011-
12
2004-
05
2011-
12
2004-
05
2011-
12
2004-
05
2011-
12
Poorest 12.7 12.9 11.6 11.3 11.9 11.3 11.8 11.5 12.5 11.2 11.9 11.5
2nd quintile 12.8 12.1 11.7 11.5 11.9 11.2 11.8 11.5 12.8 11.4 12.0 11.5
Middle quintile 13.1 12.3 11.8 11.5 11.7 11.7 11.8 11.6 12.5 11.5 11.9 11.6
4th quintile 14.0 12.8 11.8 11.5 11.8 11.4 11.9 11.6 12.3 11.5 11.9 11.6
Richest 13.0 13.0 11.8 11.6 11.6 11.2 11.7 11.4 12.4 12.3 11.7 11.5
Source: Authors’ calculations from IHDS data.

125
Table A105: Average per capita consumption of grain by different cardholders (kg/month)
and income quintiles - Urban India
Population
Groups
AAY/
Annapurna BPL APL
All PDS
cardholders
No
cardholders All India
2004-
05
2011-
12
2004-
05
2011-
12
2004-
05
2011-
12
2004-
05
2011-
12
2004-
05
2011-
12
2004-
05
2011-
12
Poorest 9.2 9.7 9.3 9.3 9.2 9.0 9.3 9.2 9.3 9.3 9.3 9.2
2nd quintile - 10.2 9.2 9.4 9.3 8.9 9.3 9.2 9.3 8.6 9.3 9.1
Middle quintile - 11.5 9.6 9.6 9.4 8.9 9.4 9.2 9.5 8.7 9.4 9.1
4th quintile - 9.7 9.7 9.5 9.3 8.8 9.4 9.0 9.7 9.5 9.4 9.1
Richest - 9.0 10.6 9.7 9.6 9.4 9.7 9.4 9.9 9.6 9.7 9.4
Source: Authors’ calculations from IHDS data.
Table A106: Average per capita consumption of grain by different cardholders (kg/month)
and asset quintiles - All India
Population
Groups
AAY/
Annapurna BPL APL
All PDS
cardholders
No
cardholders All India
2004-
05
2011-
12
2004-
05
2011-
12
2004-
05
2011-
12
2004-
05
2011-
12
2004-
05
2011-
12
2004-
05
2011-
12
Poorest 13.7 13.5 12.3 12.4 12.7 12.6 12.5 12.7 12.6 11.9 12.5 12.5
2nd quintile 13.0 12.0 11.9 11.4 12.4 11.8 12.2 11.6 12.9 11.4 12.3 11.6
Middle quintile 11.8 11.3 10.9 10.6 11.6 11.0 11.3 10.9 11.3 10.6 11.3 10.8
4th quintile 10.2 9.8 10.1 9.7 10.4 9.8 10.3 9.8 10.4 9.6 10.3 9.7
Richest 8.2 8.7 9.3 9.1 9.6 9.0 9.6 9.0 9.6 9.2 9.6 9.1
Source: Authors’ calculations from IHDS data.
Table A107: Average per capita consumption of grain by different cardholders (kg/month)
and social network
Population Groups
AAY/
Annapurna BPL APL
All PDS
cardholders
No
cardholders All India
2004-
05
2011-
12
2004-
05
2011-
12
2004-
05
2011-
12
2004-
05
2011-
12
2004-
05
2011-
12
2004-
05
2011-
12
No Acquaintance 13.1 12.1 10.9 11.0 11.1 10.7 11.1 10.9 11.1 10.6 11.1 10.9
Acquaintance 12.1 12.1 11.8 11.0 11.0 10.4 11.3 10.7 11.9 10.8 11.4 10.7
No Organization 12.8 12.2 11.4 11.2 11.0 10.6 11.2 10.9 11.4 10.7 11.3 10.9
Organization 12.3 11.9 11.2 10.8 11.0 10.2 11.1 10.6 11.8 10.8 11.2 10.6
No Panchayat/ Nagar 12.7 12.1 11.2 10.8 10.9 10.2 11.1 10.5 11.4 10.6 11.1 10.5
Panchayat/ Nagar 12.9 12.2 12.1 11.6 12.0 11.2 12.1 11.5 12.5 11.1 12.1 11.4
Source: Authors’ calculations from IHDS data.

126
Table A108: Average per capita consumption of grain by different cardholders (kg/month)
and regions
Population
Groups
AAY/
Annapurna BPL APL
All PDS
cardholders
No
cardholders All India
2004-
05
2011-
12
2004-
05
2011-
12
2004-
05
2011-
12
2004-
05
2011-
12
2004-
05
2011-
12
2004-
05
2011-
12
Hills 12.8 12.6 12.6 11.4 12.4 11.0 12.5 11.2 11.9 10.7 12.5 11.2
North 9.7 10.1 9.3 9.2 9.6 9.0 9.6 9.2 8.4 8.7 9.5 9.1
North Central 13.5 12.7 13.5 12.4 12.5 11.6 12.9 12.0 13.0 11.3 12.9 11.9
Central Plains 12.0 12.1 12.0 11.8 11.4 11.4 11.6 11.7 11.8 11.4 11.7 11.6
East 14.2 12.7 12.3 12.5 11.8 12.0 12.0 12.3 12.2 12.4 12.1 12.3
West 10.8 11.4 9.6 8.7 9.1 8.4 9.3 8.6 9.1 8.9 9.3 8.6
South 11.1 11.3 10.2 10.0 9.8 9.1 10.1 9.7 10.3 9.0 10.1 9.7
Source: Authors’ calculations from IHDS data.
Table A109: Per capita purchase of PDS grain (kg/month) by place of residence
Population Groups
AAY/Annapurna BPL APL All PDS
cardholders
2004-
05
2011-
12
2004-
05
2011-
12
2004-
05
2011-
12
2004-
05
2011-
12
All India 5.7 6.3 4.4 4.8 4.5 3.7 4.5 4.7
Place of Residence
Metro urban - 5.0 4.4 4.1 3.6 3.1 4.1 3.7
Other urban 5.6 5.8 4.5 4.6 4.5 3.4 4.5 4.2
More developed village 6.6 6.3 4.4 4.9 4.3 4.1 4.5 4.8
Less developed village 5.3 6.5 4.3 5.0 5.0 3.7 4.6 5.0
Source: Authors’ calculations from IHDS data.
Table A110: Per capita purchase of PDS grain (kg/month) by social group
Population Groups
AAY/Annapurna BPL APL All PDS
cardholders
2004-
05
2011-
12
2004-
05
2011-
12
2004-
05
2011-
12
2004-
05
2011-
12
High caste 5.9 6.2 4.2 4.8 4.1 3.6 4.2 4.4
OBC 6.2 6.5 4.3 4.9 4.2 4.2 4.4 4.9
Dalit 5.4 6.4 4.5 4.9 4.1 3.6 4.5 4.9
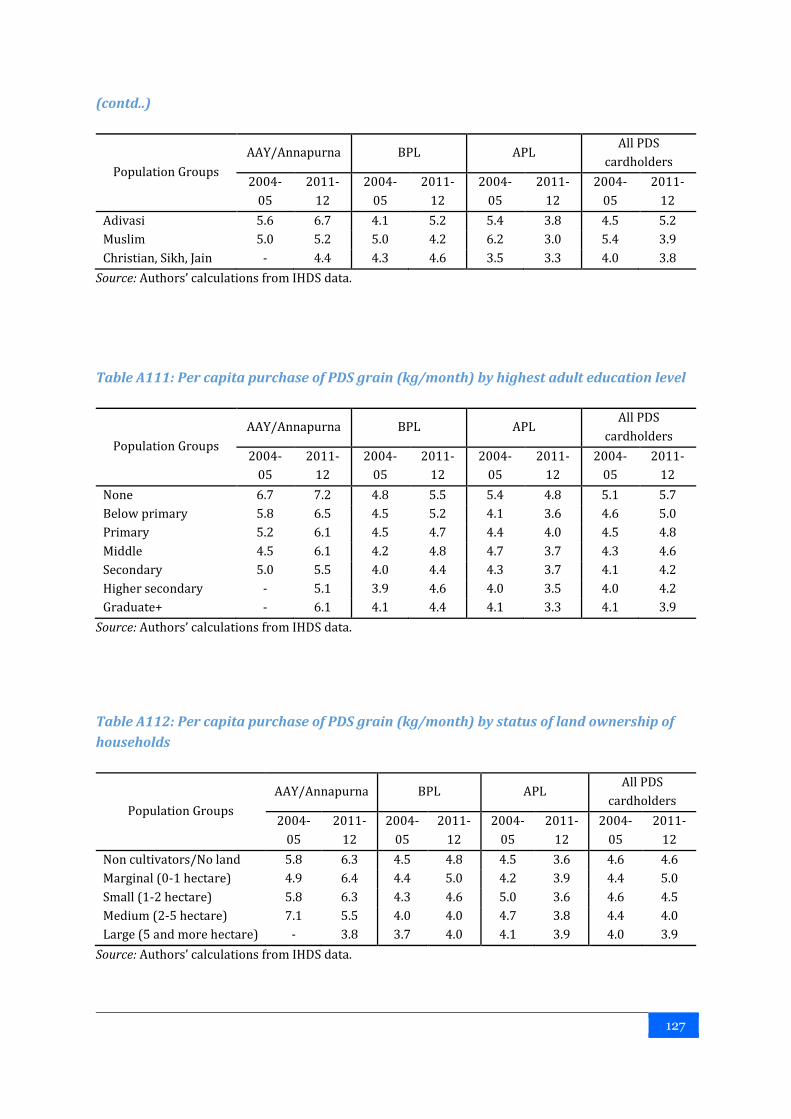
127
(contd..)
Population Groups
AAY/Annapurna BPL APL All PDS
cardholders
2004-
05
2011-
12
2004-
05
2011-
12
2004-
05
2011-
12
2004-
05
2011-
12
Adivasi 5.6 6.7 4.1 5.2 5.4 3.8 4.5 5.2
Muslim 5.0 5.2 5.0 4.2 6.2 3.0 5.4 3.9
Christian, Sikh, Jain - 4.4 4.3 4.6 3.5 3.3 4.0 3.8
Source: Authors’ calculations from IHDS data.
Table A111: Per capita purchase of PDS grain (kg/month) by highest adult education level
Population Groups
AAY/Annapurna BPL APL All PDS
cardholders
2004-
05
2011-
12
2004-
05
2011-
12
2004-
05
2011-
12
2004-
05
2011-
12
None 6.7 7.2 4.8 5.5 5.4 4.8 5.1 5.7
Below primary 5.8 6.5 4.5 5.2 4.1 3.6 4.6 5.0
Primary 5.2 6.1 4.5 4.7 4.4 4.0 4.5 4.8
Middle 4.5 6.1 4.2 4.8 4.7 3.7 4.3 4.6
Secondary 5.0 5.5 4.0 4.4 4.3 3.7 4.1 4.2
Higher secondary - 5.1 3.9 4.6 4.0 3.5 4.0 4.2
Graduate+ - 6.1 4.1 4.4 4.1 3.3 4.1 3.9
Source: Authors’ calculations from IHDS data.
Table A112: Per capita purchase of PDS grain (kg/month) by status of land ownership of
households
Population Groups
AAY/Annapurna BPL APL All PDS
cardholders
2004-
05
2011-
12
2004-
05
2011-
12
2004-
05
2011-
12
2004-
05
2011-
12
Non cultivators/No land 5.8 6.3 4.5 4.8 4.5 3.6 4.6 4.6
Marginal (0-1 hectare) 4.9 6.4 4.4 5.0 4.2 3.9 4.4 5.0
Small (1-2 hectare) 5.8 6.3 4.3 4.6 5.0 3.6 4.6 4.5
Medium (2-5 hectare) 7.1 5.5 4.0 4.0 4.7 3.8 4.4 4.0
Large (5 and more hectare) - 3.8 3.7 4.0 4.1 3.9 4.0 3.9
Source: Authors’ calculations from IHDS data.

128
Table A113: Per capita purchase of PDS grain (kg/month) by income quintile - All India
Population Groups
AAY/Annapurna BPL APL All PDS
cardholders
2004-
05
2011-
12
2004-
05
2011-
12
2004-
05
2011-
12
2004-
05
2011-
12
Poorest 4.9 6.0 3.9 4.6 4.2 3.1 4.1 4.7
2nd quintile 5.7 6.4 4.3 4.7 4.0 3.2 4.4 4.6
Middle quintile 6.7 6.3 4.7 4.9 4.4 3.3 4.8 4.6
4th quintile 7.3 7.0 4.6 5.2 4.8 3.9 4.8 4.8
Richest - 6.6 5.0 5.3 4.9 4.3 5.0 4.8
Source: Authors’ calculations from IHDS data.
Table A114: Per capita purchase of PDS grain (kg/month) by income quintile - Rural India
Population Groups
AAY/Annapurna BPL APL All PDS
cardholders
2004-
05
2011-
12
2004-
05
2011-
12
2004-
05
2011-
12
2004-
05
2011-
12
Poorest 5.2 6.3 3.7 4.6 4.4 3.2 4.0 4.7
2nd quintile 5.0 6.2 4.2 4.7 3.8 3.4 4.2 4.7
Middle quintile 6.7 6.5 4.5 5.0 4.5 3.5 4.6 4.9
4th quintile 6.6 6.7 5.0 5.3 4.5 4.0 5.0 5.2
Richest - 7.6 4.7 5.6 5.1 4.5 5.0 5.2
Source: Authors’ calculations from IHDS data.
Table A115: Per capita purchase of PDS grain (kg/month) by income quintile - Urban India
Population Groups
AAY/Annapurna BPL APL All PDS
cardholders
2004-
05
2011-
12
2004-
05
2011-
12
2004-
05
2011-
12
2004-
05
2011-
12
Poorest 5.0 5.5 4.3 4.4 4.1 2.9 4.3 4.0
2nd quintile - 5.8 4.5 4.4 4.2 3.0 4.5 3.9
Middle quintile - 6.5 4.4 4.6 4.8 3.5 4.5 4.2
4th quintile - 5.4 5.1 4.8 4.2 3.7 4.7 4.2
Richest - 5.4 4.6 5.2 5.3 4.0 5.1 4.3
Source: Authors’ calculations from IHDS data.

129
Table A116: Per capita purchase of PDS grain (kg/month) by asset quintile - All India
Population Groups
AAY/Annapurna BPL APL All PDS cardholders
2004-
05
2011-
12
2004-
05
2011-
12
2004-
05
2011-
12 2004-05 2011-12
Poorest 6.4 6.9 4.8 5.5 4.9 3.9 5.0 5.6
2nd quintile 5.0 6.3 4.5 4.8 4.6 3.8 4.6 4.9
Middle quintile 5.3 5.8 4.1 4.7 4.6 3.9 4.2 4.6
4th quintile 5.1 5.2 4.0 4.5 4.3 3.7 4.2 4.2
Richest - 4.4 3.8 4.0 3.9 3.4 3.8 3.6
Source: Authors’ calculations from IHDS data.
Table A117: Per capita purchase of PDS grain (kg/month) by social network
Population Groups
AAY/Annapurna BPL APL All PDS cardholders
2004-
05
2011-
12
2004-
05
2011-
12
2004-
05
2011-
12 2004-05 2011-12
No Acquaintance 5.6 6.4 4.5 5.1 4.5 4.0 4.6 5.0
Acquaintance 5.8 6.3 4.2 4.8 4.5 3.6 4.4 4.6
No Organization 5.6 6.4 4.6 5.2 4.6 3.9 4.7 5.0
Organization 5.8 6.1 4.1 4.5 4.3 3.5 4.2 4.4
No Panchayat/Nagar 5.6 6.4 4.4 4.9 4.5 3.6 4.5 4.7
Panchayat/Nagar 6.0 6.2 4.4 4.8 4.5 4.0 4.5 4.8
Source: Authors’ calculations from IHDS data.
Table A118: Per capita purchase of PDS grain (kg/month) by regions
Population Groups
AAY/Annapurna BPL APL All PDS cardholders
2004-
05
2011-
12
2004-
05
2011-
12
2004-
05
2011-
12 2004-05 2011-12
Hills 7.6 7.5 7.5 6.3 8.4 5.3 7.9 5.8
North - 4.9 5.3 5.3 - 3.7 4.8 4.9
North Central 4.9 6.1 4.5 5.2 - 2.8 4.7 5.2
Central Plains 6.2 7.0 5.3 5.6 4.8 2.7 5.4 5.4
East 4.9 5.5 3.6 4.7 6.1 2.5 4.1 4.0
West 6.8 7.0 3.8 4.5 3.7 3.8 3.9 4.4
South 6.3 7.0 4.3 4.4 3.9 4.2 4.2 4.5
Source: Authors’ calculations from IHDS data.

130
Table A119: Percentage share of rice, wheat and other cereals to total household
consumption - All cardholders
Regions
2004-05 2011-12
Rice Wheat Other
cereals Total Rice Wheat
Other
cereals Total
Hills 56.5 38.2 5.3 100 50.1 47.6 2.3 100
North 10.1 86.1 3.8 100 16.9 82.0 1.1 100
North Central 47.3 50.8 1.9 100 48.3 49.8 1.9 100
Central Plains 30.1 55.3 14.6 100 27.1 62.4 10.5 100
East 90.2 8.8 1.0 100 87.5 10.6 1.9 100
West 30.8 41.4 27.8 100 31.5 55.7 12.9 100
South 85.9 6.0 8.0 100 84.4 8.8 6.7 100
Total 55.6 36.2 8.2 100 55.1 39.6 5.3 100
Source: Authors’ calculations from IHDS data.
Table A120: Percentage share of rice, wheat and other cereals to total household
consumption - AAY/Annapurna cardholders
Regions
2004-05 2011-12
Rice Wheat Other
cereals Total Rice Wheat
Other
cereals Total
Hills 46.8 46.8 6.4 100 54.6 42.3 3.1 100
North 13.4 81.8 4.9 100 19.0 80.2 0.9 100
North Central 48.8 49.0 2.3 100 51.0 47.7 1.4 100
Central Plains 49.6 42.6 7.8 100 46.4 50.4 3.2 100
East 89.3 10.2 0.5 100 88.9 9.9 1.3 100
West 26.3 45.0 28.7 100 38.2 49.8 12.1 100
South 70.8 8.2 21.0 100 82.2 7.8 10.0 100
Total 54.5 38.7 6.8 100 56.6 40.1 3.3 100
Source: Authors’ calculations from IHDS data.
Table A121: Percentage share of rice, wheat and other cereals to total household
consumption - BPL cardholders
Regions
2004-05 2011-12
Rice Wheat Other
cereals Total Rice Wheat
Other
cereals Total
Hills 62.1 34.0 4.0 100 52.8 45.2 2.0 100
North 12.5 82.3 5.2 100 17.4 81.1 1.5 100
North Central 52.9 45.3 1.9 100 54.1 44.2 1.7 100

131
(contd…)
Regions
2004-05 2011-12
Rice Wheat Other
cereals Total Rice Wheat
Other
cereals Total
Central Plains 40.0 47.1 12.9 100 34.0 57.1 8.9 100
East 93.2 5.9 1.0 100 89.7 8.1 2.2 100
West 29.2 37.6 33.2 100 33.0 52.4 14.6 100
South 86.1 5.1 8.8 100 85.9 7.3 6.8 100
Total 65.2 25.7 9.1 100 64.6 30.0 5.4 100
Source: Authors’ calculations from IHDS data.
Table A122: Percentage share of rice, wheat and other cereals to total household
consumption - APL cardholders
Regions
2004-05 2011-12
Rice Wheat Other
cereals Total Rice Wheat
Other
cereals Total
Hills 54.1 39.8 6.1 100 48.6 49.3 2.2 100
North 9.0 87.3 3.7 100 15.2 83.7 1.1 100
North Central 42.9 55.1 2.0 100 41.1 56.4 2.5 100
Central Plains 16.1 64.5 19.4 100 16.9 69.0 14.1 100
East 88.5 10.9 0.7 100 84.9 13.8 1.3 100
West 31.3 43.1 25.6 100 30.5 57.8 11.7 100
South 89.1 6.6 4.3 100 83.3 11.4 5.3 100
Total 48.2 43.5 8.4 100 47.0 47.2 5.8 100
Source: Authors’ calculations from IHDS data.
Table A123: Percentage share of rice, wheat and other cereals to total household
consumption - No cardholders
Regions
2004-05 2011-12
Rice Wheat Other
cereals Total Rice Wheat
Other
cereals Total
Hills 62.9 35.0 2.1 100 48.7 46.9 4.4 100
North 15.3 82.0 2.7 100 22.0 77.0 0.9 100
North Central 50.3 48.1 1.6 100 54.0 45.0 1.0 100
Central Plains 51.3 44.4 4.3 100 35.7 58.7 5.6 100

132
(contd…)
Regions
2004-05 2011-12
Rice Wheat Other
cereals Total Rice Wheat
Other
cereals Total
East 89.7 8.1 2.2 100 89.0 7.4 3.5 100
West 33.5 43.2 23.4 100 30.8 54.5 14.7 100
South 80.6 8.0 11.5 100 77.1 11.5 11.4 100
Total 59.1 35.1 5.8 100 55.4 40.0 4.6 100
Source: Authors’ calculations from IHDS data.

133
APPENDIX - II: Distribution of IHDS Sample in Waves 1
and 2 and Re-contact Rate
States & Union
Territories
Total
Dist. in
2001
Included in IHDS-I Households
Surveyed
Re-
contact
Rate Districts Urban
Areas
Urban
Blocks
Villages IHDS-I IHDS-II
Jammu and Kashmir 14 5 5 21 20 715 720 87.3%
Himachal Pradesh 12 9 7 21 52 1,372 1476 91.3%
Punjab 17 13 11 36 61 1,593 1702 87.4%
Chandigarh 1 1 1 6 0 90 85 58.9%
Uttarakhand 13 6 3 9 20 458 468 88.7%
Haryana 19 14 6 18 79 1,618 1806 87.4%
Delhi 9 10 7 56 6 960 899 47.2%
Rajasthan 32 23 17 60 88 2,485 2707 86.8%
Uttar Pradesh 70 43 24 75 138 3,512 3824 88.2%
Bihar 37 17 10 31 61 1,430 1547 88.1%
Sikkim 4 1 1 3 3 105 107 81.9%
Arunachal Pradesh 13 1 1 3 6 165 159 84.9%
Nagaland 8 4 1 2 5 130 110 64.6%
Manipur 9 3 1 3 3 105 88 81.0%
Mizoram 8 1 1 3 3 105 78 70.5%
Tripura 4 2 1 3 7 229 220 60.7%
Meghalaya 7 3 1 3 6 161 134 80.8%
Assam 23 8 7 21 38 1,017 991 68.5%
West Bengal 18 14 21 75 66 2,380 2435 89.0%
Jharkhand 18 6 9 27 26 924 853 74.1%
Orissa 30 26 13 40 84 2,064 2058 88.1%
Chhattisgarh 16 15 6 18 49 1,175 1324 91.9%
Madhya Pradesh 45 31 13 42 121 2,805 3123 88.3%
Gujarat 25 17 14 60 70 2,078 1895 76.6%
Daman and Diu 2 2 0 0 3 60 59 86.7%
Dadra and Nagar
Haveli
1 1 0 0 3 60 60 75.0%
Maharashtra 35 27 18 75 115 3,203 3309 89.8%
Andhra Pradesh* 23 19 18 60 94 2,435 2203 72.7%
Karnataka 27 26 21 78 144 4,021 3865 78.5%
Goa 2 2 1 3 6 165 188 97.6%
Lakshadweep 1 0 0 0 0 0 0 0.0%
Kerala 14 12 14 42 61 1,731 1570 82.3%
Tamil Nadu 30 21 22 74 62 2,098 1982 82.4%
Pondicherry 4 1 1 3 3 105 107 86.7%
Andaman and Nicobar 2 0 0 0 0 0 0 0.0%
Total 593 384 276 971 1503 41,554 42152 83.3%
Source: Authors’ calculations from IHDS data.
Note: * Andhra includes Telangana since survey conducted before creation of Telangana
Households surveyed in IHDS-II include original households, split households and refresher households

134
APPENDIX - III: Comparison of IHDS Estimates with
Other Data Sources
IHDS I
2004–5
NFHS–II I
2005–6
NSS
2004–5
Census
2001
IHDS II
2011-12
NSS
2011-12
Census
2011
Per cent urban 27 31 25 28 32 29 31
Per cent literate
Age 5+ 67 67 66 NA 72 74 NA
Age 7+ 68 69 67 65 73 75 73
Caste (per cent)
Other backward class 42 40 41 NA 43 44 NA
Schedule castes 21 19 20 16 22 19 17
Schedule tribes 7 8 9 8 8 9 9
Others 30 32 31 76 27 28 75
Total 100 100 100 100 100 100 100
Religion (per cent)
Hindu 80 82 82 81 81 82 80
Muslim 14 13 13 13 13 14 14
Christian 2 3 2 2 2 2 2
Sikh 2 2 2 2 1 2 2
Others 2 0 1 2 2 1 2
Total 100 100 100 100 100 100 100
Per cent currently in
School (Age 5-14)
80 NA 83 NA 88 91 NA
Work Participation
Rates for Males*
49 NA 55 52 51 55 53
Work Participation
Rates for Females*
23 NA 29 26 24 22 26
Average Family Size 5 5 5 5 5 4 5
% of women currently
married (age 15-49)
73 75 76 77 71 74 74
% of women currently
married (all ages)
48 47 48 48 49 50 50
Per cent electricity 72 68 65 56 83 80 67
% of piped water 40 25 41 37 44 NA 44
TV Ownership (colour or b/w)
Black and White TV 48 25 37 24
5 59 47
Colour TV 56
LPG Use for cooking 33 25 22 18 34 32 29
Per cent toilets 23 NA 19 18 51 NA 47
Per cent poor 26 NA 27 NA 21 22
Source: Authors’ calculations from IHDS data.
Note: *NSSO: Principal+Subsidiary status; Census: Main+Marginal workers
IHDS works more than 240 hours/year in farming, salaried work or own business.

135
APPENDIX - IV: Comparison of IHDS PDS Data with
National Sample Survey 2004-05 and 2011-12
2004-05 2011-12
Rural Urban Rural Urban
IHDS-1 NSSO IHDS-1 NSSO IHDS-2 NSSO IHDS-2 NSSO
Distribution of households by
type of ration card possessed (%)
Antyodaya 3.1 3.0 0.9 1.0 7.5 5.0 2.8 2.0
BPL 38.7 26.5 21.3 10.5 40.3 38.0 25.8 16.0
APL 43.2 51.5 56.6 55.5 38.7 42.0 56.8 50.0
No Card 15.0 19.0 21.2 33.0 13.6 14.0 14.6 33.0
Per capita consumption of cereals
(Kg/per month)
Rice 6.7 6.5 4.9 4.9 6.4 6.1 4.8 4.7
Wheat 4.1 4.3 3.9 4.6 4.4 4.4 4.0 4.3
Other Cereals 1.1 1.3 0.5 0.4 0.7 0.7 0.4 0.3
Total Cereals 11.9 12.1 9.4 9.9 11.5 11.2 9.2 9.3
Share of PDS consumption
Rice 13.5 13.0 11.4 11.0 28.0 27.9 24.7 19.6
Wheat 8.9 7.0 5.3 4.0 19.2 17.3 15.5 10.1
Sugar 11.1 10.0 7.4 7.0 14.6 15.8 12.0 10.3
Kerosene 76.5 77.0 64.2 57.0 80.9 80.8 72.3 58.1
Source for NSSO: (i) NSS Report No. 510-Public Distribution System and Other Sources of Household
Consumption, 2004-05.
(ii) NSS Report No. 565-Public Distribution System and Other Sources of Household Consumption, 2011-12.

136
References
Austin, P. C. (2011). "Optimal Caliper Widths for Propensity-score Matching When Estimating
Differences in Means and Differences in Proportions in Observational Studies." Pharm
Stat, 10(2), 150-161. doi:10.1002/pst.433
Balani, S. (2013). Functioning of the Public Distribution System: An Analytical Report. Retrieved
from New Delhi:
http://www.prsindia.org/administrator/uploads/general/1388728622~~TPDS
Thematic Note.pdf (Accessed April 16, 2016).
Balarajan, R., Bulusu, L., Adelstein, A., & Shukla, V. (1984). "Patterns of Mortality among Migrants
to England and Wales from the Indian Subcontinent." BMJ, 289(6453), 1185-1187.
Behrman, J. R., and Deolalikar, A. B. (1987). "Will Developing Country Nutrition Improve with
Income? A Case Study for Rural South India." Journal of Political Economy, 95(3), 492-507.
doi:10.2307/1831975
Bhagwati, J., and Panagariya, A. (2012). India's Tryst with Destiny: Debunking Myths that
Undermine Progress and Addressing New Challenges. New York: Harper Collins.
Bhalla, S. (2013). Rotting Food, Rotten Arguments. The Indian Express, 4 September.
Bhargava, A. (2014). "Diet Quality, Child Health, and Food Policies in Developing Countries." The
World Bank Research Observer, 30, 247-76.
Bhopal, R. (2000). "What is the Risk of Coronary Heart Disease in South Asians? A Review of UK
Research." Journal of Public Health Medicine, 22(3), 375-85.
Bocoum, I., Dury, S., Egg, J., Herrera, J., and Prevel, Y. M. (2014). "Does Monetary Poverty Reflect
Caloric Intake?" Food Security, 6, 113-30.
Brown, A., and Deaton, A. (1972). "Surveys in Applied Economics: Models of Consumer
Behaviour." The Economic Journal, 82(328), 1145-1236. doi:10.2307/2231303
Deaton, A., and Dreze, J. (2009). "Food and Nutrition in India: Facts and Interpretations."
Economic and Political Weekly, 44(7), 42-65.
Department of Food and Public Distribution. (2015). Annual Report 2014-2015. New Delhi:
Government of India.
Desai, S. and Vanneman, R. 2015. “Enhancing Nutrition Security via India’s National Food
Security Act: Using an Axe Instead of a Scalpel?” India Policy Forum Vol. 11. Shah, S., A.
Panagariya and S. Gokarn (eds.) New Delhi: Sage.
Desai, S., Haddad, L., Chopra, D., and Thorat, A. (eds.). (2016). Undernutrition and Public Policy in
India: Investing in the Future. New Delhi: Routledge.
Dreze, J. (2015). "Understanding Leakges in the Public Distribution System." Economic and
Political Weekly, 50(7), 39-42.
Dreze, J., and Khera, R. (2010). "The BPL Census and a Possible Alternative." Economic and
Political Weekly, 45(9), 54-63.
Dreze, J., and Sen, A. (2013). An Uncertain Glory: India and Its Contraditions. Princeton, NJ:
Princeton University Press.
Friedman, M. (1957). A Theory of the Consumption Function. Princeton: Princeton University
Press.

137
Gaiha, R., Jha, R., Kulkarni, V. S., and Kaicker, N. (2014). "Diets, Nutrition, and Poverty in India."
(Publication no. 10.1093/oxfordhb/9780195397772.013.029). from Oxford Handbooks
Online.
Gangopadhyay, S., Lensink, R., and Yadav, B. (2012). Cash or Food Security Through the Public
Distribution System? Evidence from a Randomized Controlled Trial in Delhi, India. Retrieved
from New Delhi: https://www.tilburguniversity.edu/upload/e9304caf-29ce-41fe-b1bb-
ca79fcaf7cad_lensink.pdf (Accessed April 2, 2016)
Ghaffar, A., Reddy, K. S., and Singhi, M. (2004). "Burden of Non-communicable Diseases in South
Asia," BMJ, 328, 807-10.
Government of India. (2015). Report of the High Level Committee on Reorienting the Role and
Restructuring of Food Corportation of India. New Delhi: Government of India.
Greene, W. H. (2012). Econometric Analysis. Upper Saddle River, NJ: Prentice Hall.
Gulati, A., Gujral, J., and Nandakumar, T. (2012). National Food Security Bill: Challenges and
Options. Retrieved from New Delhi:
http://cacp.dacnet.nic.in/ViewQuestionare.aspx?Input=2&DocId=1&PageId=42&KeyId=
470 (Accessed April 10, 2016)
Gulati, A., & Saini, S. (2015). Leakages from Public Distribution System (PDS) and Way Forward.
ICRIER Working Paper No. 294. New Delhi: Indian Council for Research on Industrial
Relations.
Gunarathne, A., Patel, J. V., Gammon, B., Gill, P. S., Hughes, E. A., and Lip, G. Y. (2009). "Ischemic
Stroke in South Asians: A Review of the Epidemiology, Pathophysiology, and Ethnicity-
related Clinical Features." Stroke, 40(6), e415-423.
doi:10.1161/STROKEAHA.108.535724
Gupta, L. S., Wu, C. C., Young, S., and Perlman, S. E. (2011). "Prevalence of Diabetes in New York
City, 2002–2008: Comparing Foreign-born South Asians and Other Asians with U.S.-born
Whites, Blacks, and Hispanics." Diabetes Care, 34(8), 1791-93. doi:10.2337/dc11-0088
Harding, S. (2003). "Mortality of Migrants from the Indian Subcontinent to England and Wales:
Effect of Duration of Residence." Epidemiology, 14(3), 287-92.
doi:10.1097/01.ede.0000050369.88416.82
Heckman, J., and Navarro-Lozano, S. (2004). "Using Matching, Instrumental Variables, and Control
Functions to Estimate Economic Choice Models." Review of Economics and Statistics, 86(1),
30.
Himanshu, & Sen, A. (2013a). "In-Kind Food Transfers - I." Economic and Political Weekly, 48, 46-
54.
. (2013b). "In-Kind Food Transfers - II." Economic and Political Weekly, 48(47), 60-73.
Hoddinott, J. (2013). "Cash, Food or Vouchers? Evidence from a Four-Country Study,"
Presentation on November 11, 2013. Retrieved from https://www.ifpri.org/blog/cash-
food-or-vouchers (Accessed March 20, 2016).
IDF. (2009). IDF Diabetes Atlas, Fourth Edition. Retrieved from Montreal:
https://www.idf.org/sites/default/files/IDF-Diabetes-Atlas-4th-edition.pdf (Accessed
February 1, 2016).
International Institute for Population Sciences, and Macro International. (2007). National Family
Health Survey (NFHS-3) 2005-2006, India: Volume 1. Mumbai: IIPS.

138
Jha, S. and Bharat, R. (2012). "The Percolation of Public Expenditure: Food Subsidies and the Poor
in India and the Philippines." National Council of Applied Economic Research (NCAER) and
Brookings Institution: India Policy Forum, New Delhi.
Kaveeshwar, S. A., and Cornwall, J. (2014). The Current State of Diabetes Mellitus in India. The
Australasian Medical Journal, 7(1), 45-48. doi:10.4066/AMJ.2013.1979
Khera, R. (2011). "Revival of the Public Distribution System: Evidence and Explanations."
Economic & Political Weekly, 46(44-45), 36-50.
. (2012). "Food Security: One Step Forward, One Step Back?" Seminar, 634.
. (2013). Cash vs In-Kind Transfers: Indian Data Meets Theory. Retrieved from New Delhi:
http://web.iitd.ac.in/~reetika/WP325cash.pdf (Accessed December 1, 2015).
Kishore, A., and Chakrabarti, S. (2015). "Is More Inclusive More Effective? The ‘New Style’ Public
Distribution System in India." Food Policy, 55, 117-30.
doi:http://dx.doi.org/10.1016/j.foodpol.2015.06.006
McKeigue, P. M., Miller, G., and Marmot, M. (1989). "Coronary Heart Disease in South Asians
Overseas: A Review." Journal of Clinical Epidemiology, 42(7), 597-609.
Mishra, P. (2013). "Financial and Distributional Implications of the Food Security Law." Economic
and Political Weekly, 49(39), 28-30.
Modigliani, F., and Brumberg, R. H. (1954). "Utility Analysis and the Consumption Function: An
Interpretation of Cross-section Data." In K. K. Kurihara (ed.), Post-Keynesian Economics
(pp. 388–436.). New Brunswick, N.J.: Rutgers University Press.
Mohan, V., Radhika, G., Vijayalakshmi, P., and Sudha, V. (2010). "Can the Diabetes/Cardiovascular
Disease Epidemic in India be Explained, at Least in Part, by Excess Refined Grain (Rice)
Intake? Indian Journal of Medical Research, 131, 369-72.
National Sample Survey Office. (2007). Public Distribution System and Other Sources of Household
Consumption, 2004-05. NSS Report No. 510. New Delhi: National Sample Survey.
National Sample Survey Office. (2014). Level and Patterns of Consumption Expenditure 2011-12.
NSS Report No. 554. New Delhi: National Sample Survey.
Paul, S. (2015). Evaluation Study of Targeted Public Distribution System. New Delhi: National
Council of Applied Economic Research.
Rahman, A. (2014). "Revival of Rural PDS: Expansion and Outreach." Indira Gandhi Institute of
Development Research, Mumbai Working Papers (2014-012).
Ritson, C., and Hutchins, R. (1995). "Food Choice and Demand for Food." In D. Marshall (ed.), Food
Choice and the Consumer. Glasgow: Blackie Academic andProfessional.
Rosenbaum, P., and Rubin, D. (1983). "Assessing Sensitivity to an Unobserved Binary Covariate
in an Observational Study with Binary Outcome". Journal of Royal Statistical Society, Series
B, 45(2), 212-28.
Ruel, M. T., and Alderman, H. (2013). "Nutrition-sensitive Interventions and Programmes: How
Can They Help to Accelerate Progress in Improving Maternal and Child Nutrition?" The
Lancet, 382(9891), 536-51. doi:http://dx.doi.org/10.1016/S0140-6736(13)60843-0
Sen, A., & Himanshu. (2011). "Why Not a Universal Food Security Legislation?" Economic and
Political Weekly, XLVI(12), 38-47.
Sen, A., Himanshu, Dreze, J., and Khera, R. (2015). "Clarification on PDS Leakages." Economic and
Political Weekly, 50(39), 72-73.

139
Sewa Bharat. (2013). Conditional Cash Transfers: Findings from Two Pilot Studies. Paper presented
at the SEWA-UNICEF Conference, New Delhi. May 30-31, 2013.
Shah, A. D., Kandula, N. R., Lin, F., Allison, M. A., Carr, J., Herrington, D., . . . Kanaya, A. M. (2015).
"Less Favorable Body Composition and Adipokines in South Asians Compared with Other
US Ethnic Groups: results from the MASALA and MESA Studies." Int J Obes,
10.1038/ijo.2015.219. doi:10.1038/ijo.2015.219
Sinha, D. (2013). "Cost of Implementing the National Food Security Act." Economic & Political
Weekly, 48(39), 31-34.
Strauss, J., and Thomas, D. (1995). "Human Resources: Empirical Modeling of Household and
Family Decisions. Handbook of Development Economics, 3(1), 1883-2023.
Thorat, A., and Desai, S. (2016). "Recent Evidence Shows Slow Improvement in Undernutrition in
India." In S. Desai, L. Haddad, D. Chopra, and A. Thorat (eds.), Undernutrition and Public
Policy in India: Investing in the Future (pp. 71-76). London: Routledge.
Thorat, A., R. Vanneman, S. Desai and A. Dubey. (2016) "Escaping and Falling into Poverty,"
Unpublished.
Upadhyay, R. P. (2012). "An Overview of the Burden of Non-Communicable Diseases in India."
Iran J Public Health, 41(3), 1-8.