DMA Webinar Series - Intelligent transportation system (Advanced Traveler Information System 2.0)...
40
DMA Webinar Series DMA-ATDM Analysis, Modeling, and Simulation (AMS) Testbed Project James Colyar, Transportation Specialist FHWA Office of Operations February 26, 2015
Transcript of DMA Webinar Series - Intelligent transportation system (Advanced Traveler Information System 2.0)...

DMA Webinar Series
DMA-ATDM Analysis, Modeling, and Simulation (AMS) Testbed Project
James Colyar, Transportation Specialist FHWA Office of Operations
February 26, 2015

2 U.S. Department of Transportation
TODAY’S AGENDA
DMA Program Overview ATDM Program Overview
DMA-ATDM AMS Testbed Project Overview
AMS Testbeds: Status, Next Steps, and Challenges
Project Next Steps and Expected Outcomes
Stakeholder Q&A
□ We cannot answer any questions related to the CV Pilots

3 U.S. Department of Transportation
DMA Program Overview

4 U.S. Department of Transportation
DYNAMIC MOBILITY APPLICATIONS PROGRAM Vision
□ Expedite development, testing, commercialization, and deployment of innovative mobility application ▪ maximize system productivity ▪ enhance mobility of individuals within the system
Objectives □ Create applications using frequently collected and rapidly disseminated multi-
source data from connected travelers, vehicles (automobiles, transit, freight) and infrastructure
□ Develop and assess applications showing potential to improve nature, accuracy, precision and/or speed of dynamic decision
□ Demonstrate promising applications predicted to significantly improve capability of transportation system
□ Determine required infrastructure for transformative applications implementation, along with associated costs and benefits
Project Partners □ Strong internal and external participation
▪ ITS JPO, FTA, FHWA R&D, FHWA Office of Operations, FMCSA, NHTSA, FHWA Office of Safety

5 U.S. Department of Transportation
DMA BUNDLES AND APPLICATIONS
MMITSS: Multimodal Intelligent Traffic Signal System Apps: Intelligent Traffic Signal System (I-SIG), Transit and Freight Signal Priority (TSP and FSP) Mobile Accessible Pedestrian Signal System (PED-SIG), Emergency Vehicle Preemption (PREEMPT)
INFLO: Intelligent Network Flow Optimization Apps: Dynamic Speed Harmonization (SPD-HARM), Queue Warning (Q-WARN) Cooperative Adaptive Cruise Control (CACC)
FRATIS: Freight Advanced Traveler Information Systems Apps: Freight-Specific Dynamic Travel Planning and Performance, Drayage Optimization (DR-OPT)
Enable ATIS: Enable Advanced Traveler Information Systems Apps: EnableATIS (Advanced Traveler Information System 2.0)
R.E.S.C.U.M.E.: Response, Emergency Staging and Communications, Uniform Management, and Evacuation Apps: Incident Scene Pre-Arrival Staging Guidance for Emergency Responders (RESP-STG) Incident Scene Work Zone Alerts for Drivers and Workers (INC-ZONE) Emergency Communications and Evacuation (EVAC)
IDTO: Integrated Dynamic Transit Operations Apps: Connection Protection (T-CONNECT), Dynamic Transit Operations (T-DISP) Dynamic Ridesharing (D-RIDE)

6 U.S. Department of Transportation
ATDM Program Overview

7 U.S. Department of Transportation
ACTIVE TRANSPORTATION AND DEMAND MANAGEMENT (ATDM) Active Management is the fundamental
concept of taking a dynamic approach to a performance based process
Dynamically monitor, control, and influence travel, traffic, and facility demand of the entire transportation system and over a traveler's entire trip chain.
ATDM leverages existing infrastructure to evolve from Static to Active Management
Trip Chain
Active Management

8 U.S. Department of Transportation
• A suite of strategies intended to reduce or redistribute travel demand to alternate modes or routes.
• Examples: comparative multi-modal travel times, dynamic ride-sharing, pricing and incentive approaches.
Active Demand
Management
• A suite of strategies that actively manage traffic on a facility. • Examples: variable speed limits, dynamic shoulder use, queue
warning, lane control.
Active Traffic Management
• A suite of strategies designed to affect the demand, distribution, availability, and management of parking.
• Examples: parking pricing, real-time parking availability and reservation systems.
Active Parking Management
ACTIVE TRANSPORTATION AND DEMAND MANAGEMENT (ATDM) CATEGORIES

9 U.S. Department of Transportation
DMA-ATDM AMS Testbed Project Overview

10 U.S. Department of Transportation
DMA PROGRAM HAS SEVERAL EFFORTS UNDERWAY BUT SEVERAL QUESTIONS STILL REMAIN
The DMA Program currently sponsoring several small-scale Prototype Demonstrations (PDs) of each of the six bundles to test if the bundles can be successfully deployed in the future
The DMA Program also sponsoring separate, multiple efforts (one for each bundle) to conduct Impact Assessments (IAs) of the impacts of the prototype as well as local/regional impacts of the various bundles
The data and findings from the PDs and IAs are helping U.S. DOT make more informed decisions regarding the technical feasibility and potential impacts of deploying the bundles more widely
However, there are several outstanding questions that the DMA Program is seeking to answer before justifying large-scale demonstrations and pilot deployments

11 U.S. Department of Transportation
ID DMA Research Question
1 Will DMA applications yield more cost-effective mobility benefits with connected vehicle technology than with legacy systems?
2 What DMA bundles or combinations of bundles yield the most benefits?
3 What DMA applications, bundles, or combinations of bundles complement or conflict with each other?
4 Under what operational conditions are specific bundles the most beneficial?
5 Which DMA bundle or combinations of bundles will be most beneficial for certain facility types?
6 Which DMA bundle or combinations of bundles will have the most benefits for individual facilities vs corridor-wide vs region-wide deployment?
7 At what levels of market penetration of connected vehicle technology do the DMA bundles (collectively or independently) become effective?
8 What are the impacts of future deployments of the DMA bundles in the near, mid, and long term (varying market penetration, RSE deployment density, and other connected vehicle assumptions)?
9 To what extent are connected vehicle data beyond BSM Part 1 instrumental to realizing a near-term implementation of DMA applications?
10 Is BSM Part 1 transmitted via DSRC every 10th of a second critical for the effectiveness of the DMA bundles? Will alternate messaging protocols, such as PDM, BMM, etc., suffice?
KEY RESEARCH QUESTIONS FOR DMA PROGRAM

12 U.S. Department of Transportation
The more active forms of control envisioned by the ATDM Program will rely on new forms of data from vehicles, travelers, and infrastructure to hone predictions and tailor management responses
Likewise, the transformative applications developed in the DMA Program must be incorporated within current and future dynamic system-wide management practices in order to realize their full potential
In order to explore potential transformations in transportation systems performance, both programs require an AMS capability
AMS Testbeds will support a detailed and integrated evaluation of DMA and ATDM concepts before initiating costly large-scale field deployments
Provide modeling results (i.e., impacts) to the USDOT’s DMA National Program and Mobility Impacts Estimation project
NEED FOR A JOINT DMA-ATDM AMS TESTBED
13 U.S. Department of Transportation
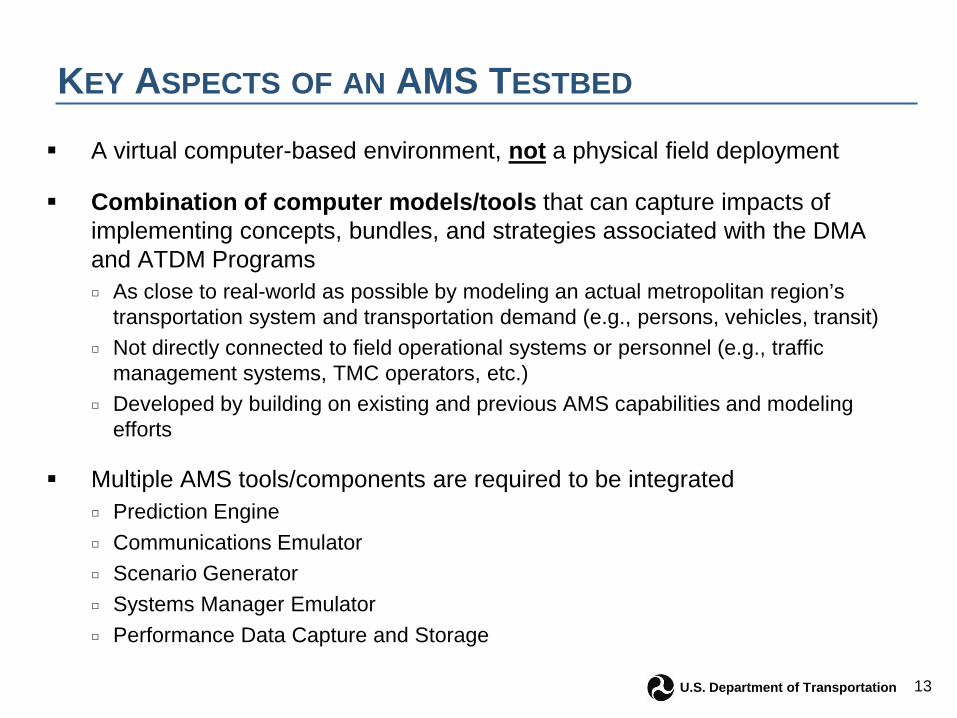
A virtual computer-based environment, not a physical field deployment
Combination of computer models/tools that can capture impacts of implementing concepts, bundles, and strategies associated with the DMA and ATDM Programs □ As close to real-world as possible by modeling an actual metropolitan region’s
transportation system and transportation demand (e.g., persons, vehicles, transit) □ Not directly connected to field operational systems or personnel (e.g., traffic
management systems, TMC operators, etc.) □ Developed by building on existing and previous AMS capabilities and modeling
efforts
Multiple AMS tools/components are required to be integrated □ Prediction Engine □ Communications Emulator □ Scenario Generator □ Systems Manager Emulator □ Performance Data Capture and Storage
KEY ASPECTS OF AN AMS TESTBED

14 U.S. Department of Transportation
AMS TESTBED PROJECT TEAM
U.S. DOT Task Manager James Colyar
Project Core Review Team Kate Hartman (ITS- JPO)
John Halkias (FHWA) James Sturrock (FHWA) Roemer Alfelor (FHWA)
Eric Pihl (FHWA) Prime Contractor

15 U.S. Department of Transportation
Timeline
Phase 1: AMS Testbed Selection □ Develop Testbed requirements and selection criteria □ Conduct preliminary and final selection of AMS Testbed
Phase 2: Develop Evaluation Methodology □ Develop Testbed specific Analysis Plans □ Combine Testbed specific plans to develop an overarching
Evaluation Plan
Phase 3: Modeling, Analysis, and Reporting □ Develop and calibrate Testbed models, including data collection □ Evaluate DMA and ATDM strategies using calibrated Testbeds □ Report the relevant findings, produce documentation, and make them
publicly available □ Recommend further research for continuation of the DMA / ATDM future
projects
Ong
oing
Wor
k
AMS TESTBED PROJECT PHASES AND TIMELINE
Phas
e 1
Phas
e 2
Phas
e 3
Sep 2013
June 2014
Oct 2014
Nov 2015

16 U.S. Department of Transportation
AMS TESTBEDS SELECTED
San Mateo, CA Testbed
Phoenix, AZ Testbed
Pasadena, CA Testbed
Dallas, TX Testbed
Chicago, IL Testbed

17 U.S. Department of Transportation
San Mateo, CA Testbed
Phoenix, AZ Testbed
Pasadena, CA Testbed
Dallas, TX Testbed
Chicago, IL Testbed
DMA BUNDLES TO BE ANALYZED IN EACH AMS TESTBED
INFLO
EnableATIS IDTO
FRATIS R.E.S.C.U.M.E.
INFLO INFLO
MMITSS R.E.S.C.U.M.E.

18 U.S. Department of Transportation
Bundle Application San Mateo Phoenix Pasadena Chicago Dallas
Ena
ble
ATIS
Multimodal Real-Time Traveler Information (ATIS) - √ - - Smart Park-and-Ride (S-PARK) Universal Map Application (T-MAP) Real-Time Route-Specific Weather Information (WX-INFO)
INFL
O Queue Warning (Q-WARN) √ - √ - -
Dynamic Speed Harmonization (SPD-HARM) √ - √ √ - Cooperative Adaptive Cruise Control (CACC) √ - - - -
MM
ITS
S
Intelligent Traffic Signal System (ISIG) √ - - - - Transit Signal Priority (TSP) √ - - - - Mobile Accessible Pedestrian Signal System (PED-SIG) √ - - - - Emergency Vehicle Preemption (PREEMPT) √ - - - - Freight Signal Priority (FSP) √ - - - -
IDTO
Connection Protection (T-CONNECT) Dynamic Transit Operations (T-DISP) - √ - - - Dynamic Ridesharing (D-RIDE) - √ - - -
FRAT
IS Freight Real-Time Traveler Information with Performance Monitoring
(F-ATIS) - √ - - -
Drayage Optimization (DR-OPT) Freight Dynamic Route Guidance (F-DRG) - √ - -
R.E
.S.C
.U.M
.E. Emergency Communications and Evacuation (EVAC)
Incident Scene Pre-Arrival Staging Guidance for Emergency Responders (RESPSTG) √ √ - - -
Incident Scene Work Zone Alerts for Drivers and Workers (INC-ZONE) √ √ - - -
OVERVIEW OF DMA APPLICATIONS TO BE TESTED USING DIFFERENT TESTBEDS

19 U.S. Department of Transportation
Coordinating closely with the DMA Bundle leads and Prototype Development (PD)/Impact Assessment (IA) Contractors
Most DMA applications are being prototyped, but not all
□ Developing new algorithms for some that are not prototyped
Customization to form and format of the DMA algorithms in some cases is needed to implement in AMS Testbed
□ Linkages to proprietary software require workaround, involving new development to mimic the functions of proprietary software
Implementing Transit/Freight applications in AMS Testbeds is complex and requires tool enhancements
ENHANCING PROTOTYPED DMA APPLICATIONS FOR USE IN AMS TESTBEDS

20 U.S. Department of Transportation
FRAMEWORK FOR MODELING COMBINATIONS OF DMA APPLICATIONS
The simulation scenarios will be conducted in three stages based on the algorithm acquisition/development timeline.
Selected logical combinations through a systematic analysis □ Several combinations will be analyzed, and results will be documented for the individual as well
as multiple combinations at an aggregate level Results are expected to help address the research questions and provide insights into
potential impacts from real-world deployments of a portfolio of DMA applications
S1 S2 S3 S4 S5 S6 S7 S8 S9 S10 S11 S12 S13Enable ATIS (ATIS) √ √ √ √
(Q-WARN) √ √ √ √(SPD-HARM) √ √ √ √
(CACC) √ √(ISIG) √ √ (TSP) √ √
(PED-SIG) √ √(PREEMPT) √ √
(FSP) √ √(T-DISP) √ √ √ √ √(D-RIDE) √ √ √ √ √(F-ATIS) √ √ √ √ (F-DRG) √ √ √
(RESPSTG) √ √(INC-ZONE) √ √ √
IDTO
FRATIS
R.E.S.C.U.M.E
INFLO
MMITSS
Stage 1 Scenarios Stage 2 Scenarios Stage 3 Scenarios
Scenarios (S)

21 U.S. Department of Transportation
Bundle ApplicationEnableATIS ATIS
Q-WARNSPD-HARM CACCISIGTSPPED-SIG PREEMPT FSPT-DISP D-RIDE
FRATIS F-ATIS/F-DRGRESP-STGINC-ZONE
R.E.S.C.U.M.E.
INFLO
MMITSS
IDTO
OApr'15 May'15 Jun'15 Jul'15 Aug'15 Sep'15Mar'15Sep-Oct No'14 Dec'14 Jan'15 Feb'15
Stage 1 Analysis Stage 2 Analysis Stage 3 Analysis
Algorithm Acquisition/Development Preliminary Results Refined/Final Results
DMA APPLICATIONS MODELING TIMELINE

22 U.S. Department of Transportation
DMA/ATDM applications are anticipated to generate some benefits under “recurring” conditions and significant benefits under “non-recurring” conditions □ The frequency of “recurring” and “non-recurring” conditions defines total benefits □ Use AMS Testbeds to quantify the benefits of DMA / ATDM strategies under multiple
operational conditions
Operational conditions define specific combinations of traffic/travel conditions □ Demand levels and patterns (e.g., low, medium or high demand) □ Weather (e.g., clear, rain, snow, ice, fog, poor visibility) □ Incident (e.g., no impact, medium impact, high impact) □ Other planned disruptions (e.g., work zones, sporting events, etc.)
Cluster analysis uses observed data from each Testbed to identify conditions with similar characteristics and their frequency of occurrence □ Observed data from the selected condition clusters will be used to calibrate and
validate the input demand and traffic performance of the operational condition
MODELING RELIABILITY AND DIFFERENT OPERATIONAL CONDITIONS

23 U.S. Department of Transportation
CLUSTER ANALYSIS FOR DALLAS TESTBED
15
20
25
30
35
40
45
50
55
60
65
15:00 15:30 16:00 16:30 17:00 17:30 18:00 18:30 19:00
Trav
el T
ime
(Min
utes
)
Time
Cluster 2: Medium Demand, Minor Incident, and without Precipitation
Cluster 3: High Demand, Minor Incident, and with Precipitation
Cluster 4: High Demand, Minor Incident, and without Precipitation
Cluster 5: Medium to High Demand, Major Incident, and without Precipitation
*

24 U.S. Department of Transportation
AMS Testbeds: Status, Next Steps, and Challenges

25 U.S. Department of Transportation
SAN MATEO TESTBED: OVERVIEW
Freeway Network Arterial Network
(complete) (complete) (to do)
8.5 mile long stretch of the US 101 freeway and State Route 82 (El Camino Real) in San Mateo County, California
□ The US 101 freeway is an 8 lane freeway, transitioning to 6 mixed flow lanes plus 2 peak period HOV 2+ lanes south of Whipple Avenue
□ El Camino Real is a 4 to 6 lane signalized divided arterial with a posted 35 mph speed limit
US 101 carries between 200,000 and 250,000 Average Annual Daily Traffic (AADT) of which 15-25% are HOV 2+ vehicles
El Camino Real carries between 25,000 and 50,000 AADT
A microsimulation network coded in VISSIM software.

26 U.S. Department of Transportation
Current Status
□ SPD-HARM and Q-WARN Applications acquired and implemented □ Interim version of MMITSS, INC-ZONE and RESPSTG developed and implemented □ A common simulation platform that enables data-sharing between different
applications developed for modeling application combinations □ USDOTs Trajectory Convertor Application (TCA) Emulator tool added to the Testbed
to enable communication modeling for INFLO and R.E.S.C.U.M.E. bundles
Next Steps
□ Refine preliminary results of the applications algorithms □ Test of other modules of MMITSS as they become available □ Pilot Test operation of MMITSS and SPD-HARM in combination
SAN MATEO TESTBED: STATUS AND NEXT STEPS

27 U.S. Department of Transportation
PASADENA TESTBED: OVERVIEW Four major freeway segments in the
city of Pasadena: I-210, I-710, CA-134 and CA-110 11 miles of HOV lanes on I-210 and
CA-134 for both directions
AADT between 210,000 and 294,000, of which 8-15% are HOV 2+ vehicles. Major east-west arterials carry daily traffic between 8,000 and 13,000.
Multi-resolution approach using VISSIM microsimulation software and Visum’s dynamic traffic assignment (DTA) along with custom tools to emulate operation control of the Testbed
Modeling SPD-HARM and Q-WARN on DMA side, but primarily used for ATDM analysis

28 U.S. Department of Transportation
PASADENA TESTBED: STATUS AND NEXT STEPS Current Status
□ Identified the Operational Conditions to conduct DMA-ATDM analysis □ Built the base model for better representation of supply side, including intersection
geometries, and traffic controls □ Started the calibration process for the multi-resolution models in Visum and
VISSIM. The calibration of the baseline operational condition included: i) bottleneck and queuing location, formation and dissipation durations; and ii) driving behavior model parameter calibration.
Next Steps
□ Add ATDM and DMA applications to the Testbed □ Finalize the baseline operational conditions calibration □ Integrate demand and network performance prediction tools

29 U.S. Department of Transportation
DALLAS TESTBED: OVERVIEW US-75 corridor – Dallas
A 20-mile long stretch of the US-75 freeway with several parallel and crossing major regional arterial streets.
One parallel light rail line (the Red Line), and an arterial network which extends over multiple cities (Dallas, Richardson and Plano).
1.8 million daily trips – 90 zones
Modeled using a mesoscopic dynamic traffic assignment simulation model: DIRECT (Dynamic Intermodal Routing Environment for Control and Telematics) DIRECT consists of several interconnected
components including demand generation, travel behavior and vehicle simulation.
No DMA modeling, only used for ATDM analysis
LBJ way
PGBT
Downtown
Plano
Richardson
Dallas

30 U.S. Department of Transportation
DALLAS TESTBED: STATUS AND NEXT STEPS Current Status
□ Identified the Operational Conditions to conduct ATDM analysis □ Started the calibration process for the network □ Developed an interim version of the demand estimation and the prediction module
as part of the ATDM strategies evaluation
Next Steps
□ Adjust the model parameters (demand pattern and flow propagation functions) to be able to represent each of the selected clusters
□ Build the system management module which emulates the decision making process at a typical traffic management center (TMC)

31 U.S. Department of Transportation
CHICAGO TESTBED: OVERVIEW The Chicago downtown area
Located in the central part of the regional network, Kennedy Expressway (I90), Edens Expressway (I94), Eisenhower Expressway (I290), and Lakeshore Drive
Dedicated to testing weather-related applications under different weather conditions Congestion becomes much worse in
snow season Developed using the enhanced, weather-
sensitive DYNASMART (DYnamic Network Assignment-Simulation Model for Advanced Road Telematics) platform A discrete time mesoscopic simulation-
assignment tool developed and applied for intelligent transportation system applications
Modeling SPD-HARM, but primarily used for ATDM analysis

32 U.S. Department of Transportation
CHICAGO TESTBED: STATUS AND NEXT STEPS
Current Status
□ Completed draft Analysis Plan □ Identified preliminary Operational Conditions that cover different demand levels
and snow severity to evaluate DMA/ATDM weather related applications □ Developed a plan for collecting additional data needed for modeling snowplow
strategies
Next Steps
□ Finalize the Analysis Plan □ Begin network calibration for the selected Operational Conditions □ Develop algorithms for weather-specific applications/strategies
33 U.S. Department of Transportation
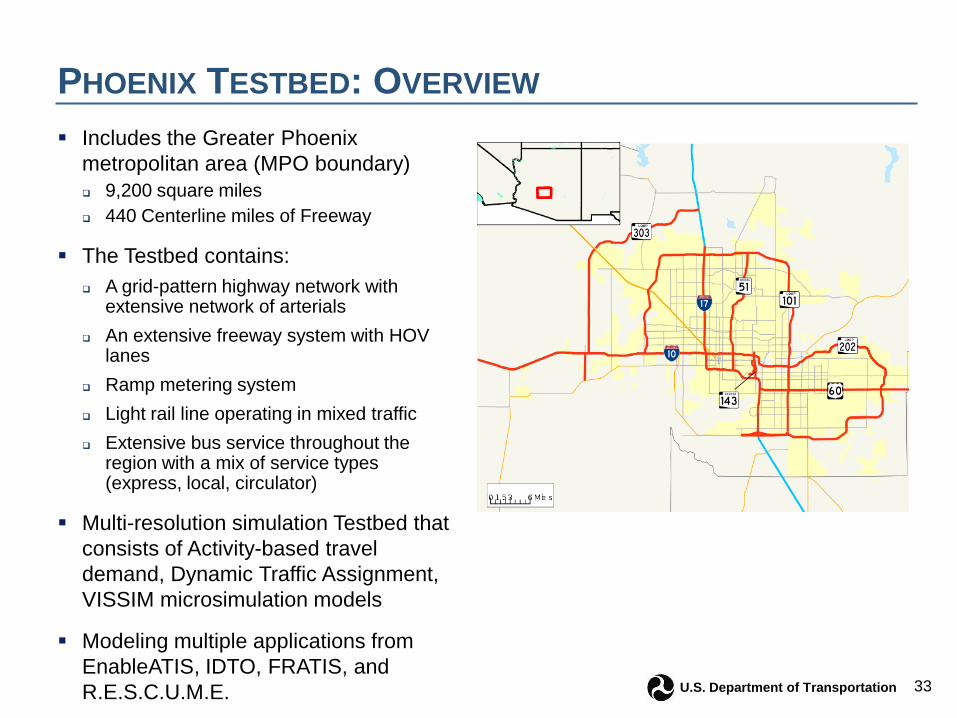
PHOENIX TESTBED: OVERVIEW Includes the Greater Phoenix
metropolitan area (MPO boundary) 9,200 square miles 440 Centerline miles of Freeway
The Testbed contains: A grid-pattern highway network with
extensive network of arterials An extensive freeway system with HOV
lanes Ramp metering system Light rail line operating in mixed traffic Extensive bus service throughout the
region with a mix of service types (express, local, circulator)
Multi-resolution simulation Testbed that consists of Activity-based travel demand, Dynamic Traffic Assignment, VISSIM microsimulation models
Modeling multiple applications from EnableATIS, IDTO, FRATIS, and R.E.S.C.U.M.E.

34 U.S. Department of Transportation
PHOENIX TESTBED KEY ALGORITHMS: D-RIDE, T-DISP, AND ATIS

35 U.S. Department of Transportation
PHOENIX TESTBED: STATUS AND NEXT STEPS
Current Status
□ Gathered diverse data types (travel survey data, traffic control data, loop detector data and transit data) needed to identify the tested operational conditions
□ Developed a common (preliminary) platform to connect the different levels of modeling (i.e., Activity based model, dynamic traffic assignment and traffic microsimulation) in the Testbed
Next Steps
□ Finalize baseline operational conditions □ Develop preliminary FRATIS and IDTO algorithms □ Conduct DMA and ATDM analysis

36 U.S. Department of Transportation
PROJECT MODELING CHALLENGES
SPDHARM/QWARN prototype not designed for arterial implementation
Significant effort to adapt MMITSS to El Camino Real, therefore full functionality not expected until May 2015
□ MMITSS functionality for weather and incident effects on street operations is not yet available
Dependencies on other critical components that are under parallel development as part of other projects (e.g., FHWA Prediction tool)
Large scale model (e.g., Phoenix Testbed) and needs extensive calibration process to replicate real-time operations and system management capabilities
Some algorithms are not available (e.g., EVAC application) or are dependent on commercial third party software (e.g., dynamic routing component of FRATIS application)
Evaluating transit applications is complex and needs new tool development

37 U.S. Department of Transportation
Project Next Steps and Expected Outcomes

38 U.S. Department of Transportation
PROJECT NEXT STEPS
Continue Testbed development, calibration, and modeling efforts
Continue Stakeholder engagement throughout 2015
□ Conferences and webinars □ Let us know if you are interested in participating
Reporting Timeline
□ March 2015 – Stage 1 (early) findings □ June 2015 - Stage 2 findings/reports □ October 2015 – Stage 3 findings/reports □ November 2015 – Final reports
▪ Final Report for each Testbed ▪ Final Report on Overall DMA Evaluation ▪ Final Report on Overall ATDM Evaluation

39 U.S. Department of Transportation
PROJECT OUTCOMES
In addition to Final Reports which will summarize analysis results, several resources will be made available for use by others: □ Testbed Analysis Plans □ Methodology used for evaluating DMA Applications □ DMA Algorithms and Testbed input & output files (APIs, code, tools, files) posted
on Open Source Application Development Portal (OSADP) □ Cleaned and documented Testbed-related data posted on Research Data
Exchange (RDE)
Serve as examples for transportation agencies to set up their own Testbed and evaluate DMA and ATDM strategies/applications in their regions
Provide tools and techniques for Decision Support Systems to TMC managers and operators for proactive, real-time operations

40 U.S. Department of Transportation
Stakeholder Q&A
DMA Program Manager Kate Hartman, ITS Joint Program Office, (202) 366-2742, [email protected] Webinar Speaker James Colyar, FHWA, AMS Testbed Task Manager, 360-753-9408, [email protected] DMA Website www.its.dot.gov/dma/ Booz Allen Hamilton Balaji Yelchuru, AMS Testbed Principal Investigator