District Hospital Performance Assessment Gauteng Province ... Publications/District Hopsital... ·...
54
District Hospital Performance Assessment Gauteng Province 2008-2010 Catherine Ogunmefun, Sizulu Moyo, Thokozani Mbatha, Rhulane Madale, Rene English
Transcript of District Hospital Performance Assessment Gauteng Province ... Publications/District Hopsital... ·...

District Hospital Performance
Assessment
Gauteng Province
2008-2010
Catherine Ogunmefun, Sizulu Moyo, Thokozani Mbatha, Rhulane Madale, Rene English
District Hospital Performance Assessment
Gauteng Province
2008-2010
Catherine Ogunmefun, Sizulu Moyo, Thokozani Mbatha, Rhulane Madale, Rene English
Published by Health Systems Trust
34 Essex Terrace
Westville
3630
South Africa
Tel: +27 (0)31 266 9090
Fax: +27 (0)31 266 9199
Email: [email protected]
http://www.hst.org.za
Published: January 2012
Suggested citation:
Ogunmefun C, Moyo S, Mbatha T, Madale R, English R. District Hospital Performance
Assessment: Gauteng Province 2008-1010. Health Systems Trust; Durban, 2012

The information contained in this publication may be freely distributed and reproduced, as
long as the source is acknowledged, and it is used for non-commercial purposes.

District Hospital Performance Assessment: Gauteng Province 2008-2010 i
Acknowledgements
We would like to thank the National Department of Health for providing the data for the
report. We are also grateful to Candy Day for assistance with the data. We thank Dr Peter
Barron for input and guidance in writing the final report.

District Hospital Performance Assessment: Gauteng Province 2008-2010 ii
Contents
INTRODUCTION ........................................................................................................ 1
BACKGROUND ......................................................................................................... 3
A SEDIBENG – DC42 ............................................................................................. 5 1. Heidelberg Hospital ........................................................................................................ 5
i: Description ................................................................................................................... 5 ii: Input and process indicators ....................................................................................... 5 iii: Outcomes indicators ................................................................................................... 7 iv: Impact indicators ........................................................................................................ 7 v: Conclusions: ............................................................................................................... 8
2. Kopanong Hospital ......................................................................................................... 9 i: Description ................................................................................................................... 9 ii: Input and process indicators ....................................................................................... 9 iii: Outcomes indicators ................................................................................................. 10 iv: Impact indicators ...................................................................................................... 11 v: Conclusions: ............................................................................................................. 12
B WEST RAND – DC48 ........................................................................................ 13 1. Carletonville Hospital .................................................................................................... 13
i: Description ................................................................................................................. 13 ii: Input and process indicators ..................................................................................... 13 iii: Outcomes indicators ................................................................................................. 15 iv: Impact indicators ...................................................................................................... 15 v: Conclusions: ............................................................................................................. 16
2. Dr Yusuf Dadoo Hospital .............................................................................................. 17 i: Description ................................................................................................................. 17 ii: Input and process indicators ..................................................................................... 17 iii: Outcomes indicators ................................................................................................. 18 iv: Impact indicators ...................................................................................................... 19 v: Conclusions: ............................................................................................................. 20
C EKURHULENI – EKU ........................................................................................ 21 1. Germiston Hospital ....................................................................................................... 21
i: Description ................................................................................................................. 21 ii: Input and process indicators ..................................................................................... 21 iii: Outcome indicators .................................................................................................. 23 iv: Impact indicators ...................................................................................................... 23 v: Conclusions .............................................................................................................. 24
D CITY OF JOHANNESBURG – JHB .................................................................. 25 1. South Rand Hospital .................................................................................................... 25
i: Description ................................................................................................................. 25 ii: Input and process indicators ..................................................................................... 25 iii: Outcome indicators .................................................................................................. 27 iv: Impact indicators ...................................................................................................... 27

District Hospital Performance Assessment: Gauteng Province 2008-2010 iii
v: Conclusions .............................................................................................................. 28
E CITY OF TSHWANE – TSH ............................................................................... 29 1. Jubilee Hospital ............................................................................................................ 29
i: Description ................................................................................................................. 29 ii: Input and process indicators ..................................................................................... 29 iii: Outcomes indicators ................................................................................................. 31 iv: Impact indicators ...................................................................................................... 31 v: Conclusions: ............................................................................................................. 32
2. Odi Hospital ................................................................................................................. 33 i: Description ................................................................................................................. 33 ii: Input and process indicators ..................................................................................... 33 iii: Outcomes indicators ................................................................................................. 34 iv: Impact indicators ...................................................................................................... 35 v: Conclusions: ............................................................................................................. 36
3. Mamelodi Hospital ........................................................................................................ 37 i: Description ................................................................................................................. 37 ii: Input and process indicators ..................................................................................... 37 iii: Outcome indicators .................................................................................................. 38 iv: Impact indicators ...................................................................................................... 39 v: Conclusions .............................................................................................................. 40
4. Pretoria West Hospital .................................................................................................. 41 i: Description ................................................................................................................. 41 ii: Input and process indicators ..................................................................................... 41 iii: Outcomes indicators ................................................................................................. 42 iv: Impact indicators ...................................................................................................... 43 v: Conclusions: ............................................................................................................. 44
5. Tshwane District Hospital ............................................................................................. 45 i: Description ................................................................................................................. 45 ii: Input and process indicators ..................................................................................... 45 iii: Outcomes indicators ................................................................................................. 46 iv: Impact indicators ...................................................................................................... 47 v: Conclusions: ............................................................................................................. 48
District Hospital Performance Assessment: Gauteng Province 2008-2010 1
Introduction
Health system strengthening is a key objective in both the Negotiated Service Delivery
Agreement and the Re-engineered Primary Health Care approach. Effective utilisation of
routine data is crucial for improving the effectiveness of service delivery as well as for
improvement of health information systems. There remains considerable scope for improved
utilisation of routine data for quality improvement.
This report aims to provide health managers at all levels within the health services, with a
useful screening tool for assessing District Hospital management performance. It provides
managers with a snap shot of how a facility is performing in key areas of hospital
management. It focuses on individual facilities and assesses seven key hospital
performance indicators listed in Table 1. Data on these seven indicators is retrieved primarily
from the DHIS. Individual facility data is compared to the national and provincial indicator
average values. The hospitals are assessed over a period of three financial years:
2008/2009; 2009/2010 and 2010/2011. These are depicted as 2008, 2009 and 2010
respectively in the graphs and text in the report. The data presented should be viewed with
an awareness of problems common to routine data, namely incorrect and missing data, as
well as specific contextual factors.
The report should be considered in conjunction with a number of other published documents
including; The Guidebook for District Hospital Managers- Health Systems Trust-2006, A
District Hospital Service Package for South Africa – The South African National Department
of Health – 2002 and the Negotiated Service Delivery Agreement.
District Hospital Performance Assessment: Gauteng Province 2008-2010 2
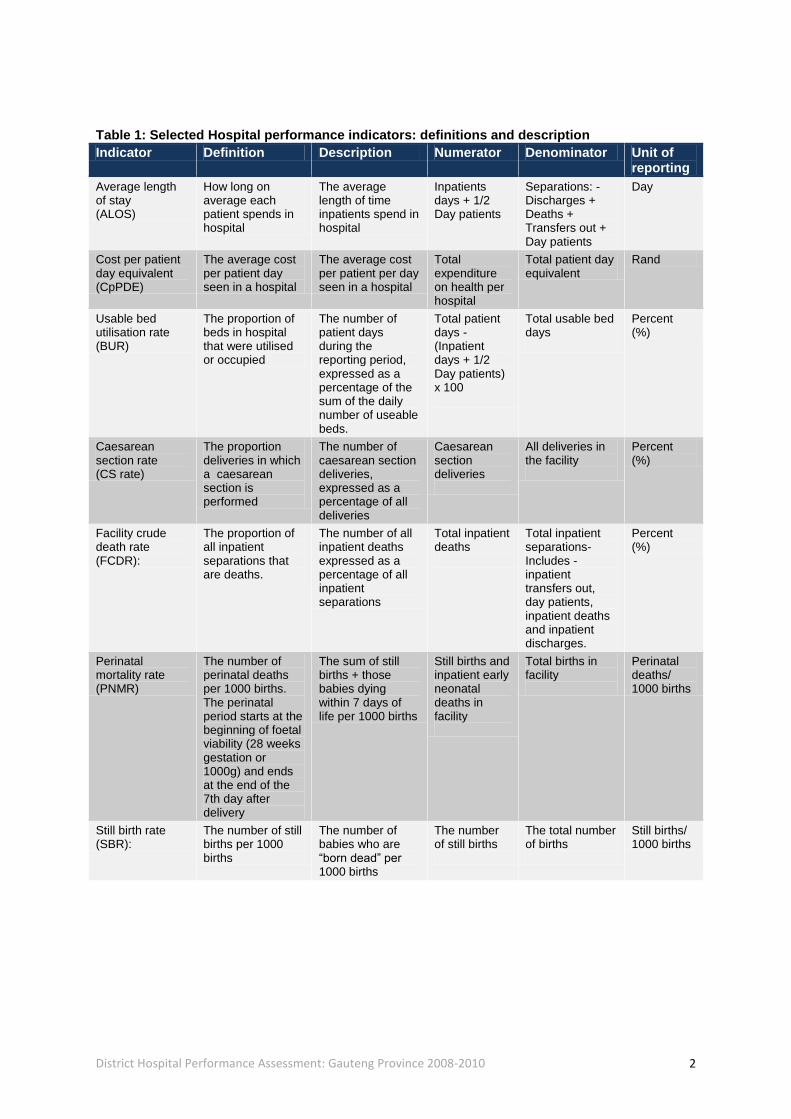
Table 1: Selected Hospital performance indicators: definitions and description
Indicator Definition Description Numerator Denominator Unit of reporting
Average length of stay (ALOS)
How long on average each patient spends in hospital
The average length of time inpatients spend in hospital
Inpatients days + 1/2 Day patients
Separations: - Discharges + Deaths + Transfers out + Day patients
Day
Cost per patient day equivalent (CpPDE)
The average cost per patient day seen in a hospital
The average cost per patient per day seen in a hospital
Total expenditure on health per hospital
Total patient day equivalent
Rand
Usable bed utilisation rate (BUR)
The proportion of beds in hospital that were utilised or occupied
The number of patient days during the reporting period, expressed as a percentage of the sum of the daily number of useable beds.
Total patient days - (Inpatient days + 1/2 Day patients) x 100
Total usable bed days
Percent (%)
Caesarean section rate (CS rate)
The proportion deliveries in which a caesarean section is performed
The number of caesarean section deliveries, expressed as a percentage of all deliveries
Caesarean section deliveries
All deliveries in the facility
Percent (%)
Facility crude death rate (FCDR):
The proportion of all inpatient separations that are deaths.
The number of all inpatient deaths expressed as a percentage of all inpatient separations
Total inpatient deaths
Total inpatient separations- Includes - inpatient transfers out, day patients, inpatient deaths and inpatient discharges.
Percent (%)
Perinatal mortality rate (PNMR)
The number of perinatal deaths per 1000 births. The perinatal period starts at the beginning of foetal viability (28 weeks gestation or 1000g) and ends at the end of the 7th day after delivery
The sum of still births + those babies dying within 7 days of life per 1000 births
Still births and inpatient early neonatal deaths in facility
Total births in facility
Perinatal deaths/ 1000 births
Still birth rate (SBR):
The number of still births per 1000 births
The number of babies who are “born dead” per 1000 births
The number of still births
The total number of births
Still births/ 1000 births

District Hospital Performance Assessment: Gauteng Province 2008-2010 3
Background
Gauteng Province is divided into six district municipalities demarcated as shown in Figure 1.
In 2010, the province had 11 District Hospitals serving a population of approximately 10
million people. Table 2 gives a list of District Hospitals in the province by district and sub-
district location. The number of useable beds per facility is also listed in Table 2.
Figure 1: Map of the Gauteng Province depicting District boundaries

District Hospital Performance Assessment: Gauteng Province 2008-2010 4
Table 2: District hospitals in Gauteng Province: Location by District and local municipality
District Name Sub District Hospital Usable hospital Beds
Sedibeng- DC42 Lesedi Heidelberg Hospital 126
Emfuleni Kopanong Hospital 195
Metsweding DC46 There are no district hospitals in this district
West Rand- DC48 Merafong City Carletonville Hospital 180
Mogale City Dr Yusuf Dadoo Hospital
245
Ekurhuleni-EKU Ekurhuleni S1 Germiston Hospital 149
City of Johannesburg-JHB
JHB-F South Rand Hospital 197
City of Tshwane- TSH TSH-NE Jubilee Hospital 414
Tshwane Odi Odi Hospital 198
Mamelodi Hospital 197
Tshwane Central Pretoria West Hospital 146
Tshwane District Hospital
189
District Hospital Performance Assessment: Gauteng Province 2008-2010 5
A Sedibeng – DC42
Sedibeng district had an estimated population of 867 623 people in 2010. It has 39 clinics, 6
CHCs, 1 mobile service, 2 district hospitals and 1 regional hospital. There are no provincial
tertiary or central hospitals in the district.
1. Heidelberg Hospital
i: Description
Heidelberg district hospital has 126 beds and lies in the Lesedi sub-district.
ii: Input and process indicators
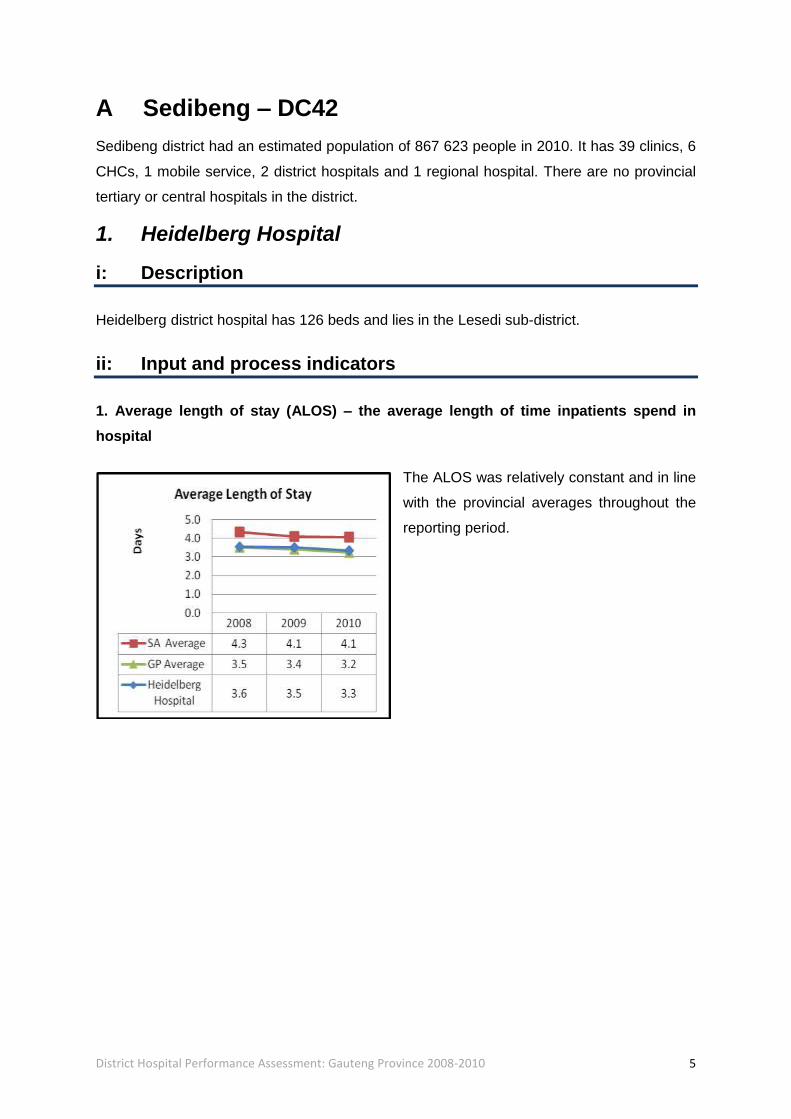
1. Average length of stay (ALOS) – the average length of time inpatients spend in
hospital
The ALOS was relatively constant and in line
with the provincial averages throughout the
reporting period.
District Hospital Performance Assessment: Gauteng Province 2008-2010 6
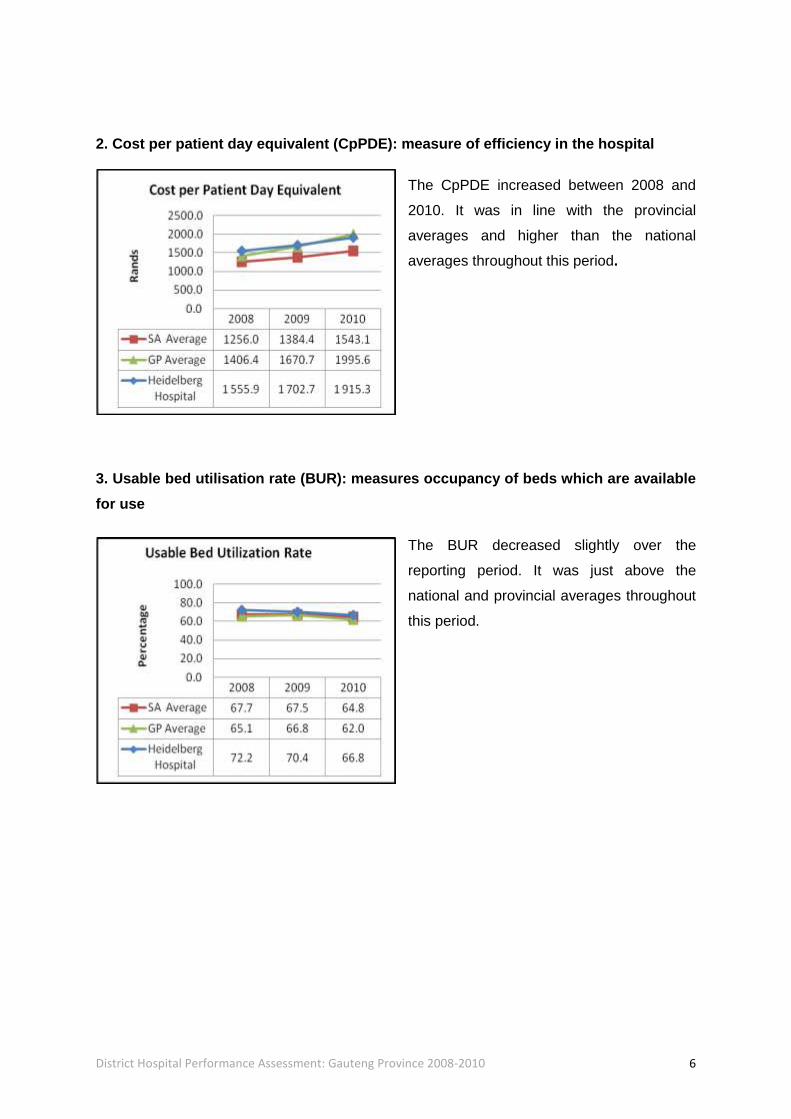
2. Cost per patient day equivalent (CpPDE): measure of efficiency in the hospital
The CpPDE increased between 2008 and
2010. It was in line with the provincial
averages and higher than the national
averages throughout this period.
3. Usable bed utilisation rate (BUR): measures occupancy of beds which are available
for use
The BUR decreased slightly over the
reporting period. It was just above the
national and provincial averages throughout
this period.
District Hospital Performance Assessment: Gauteng Province 2008-2010 7
iii: Outcomes indicators
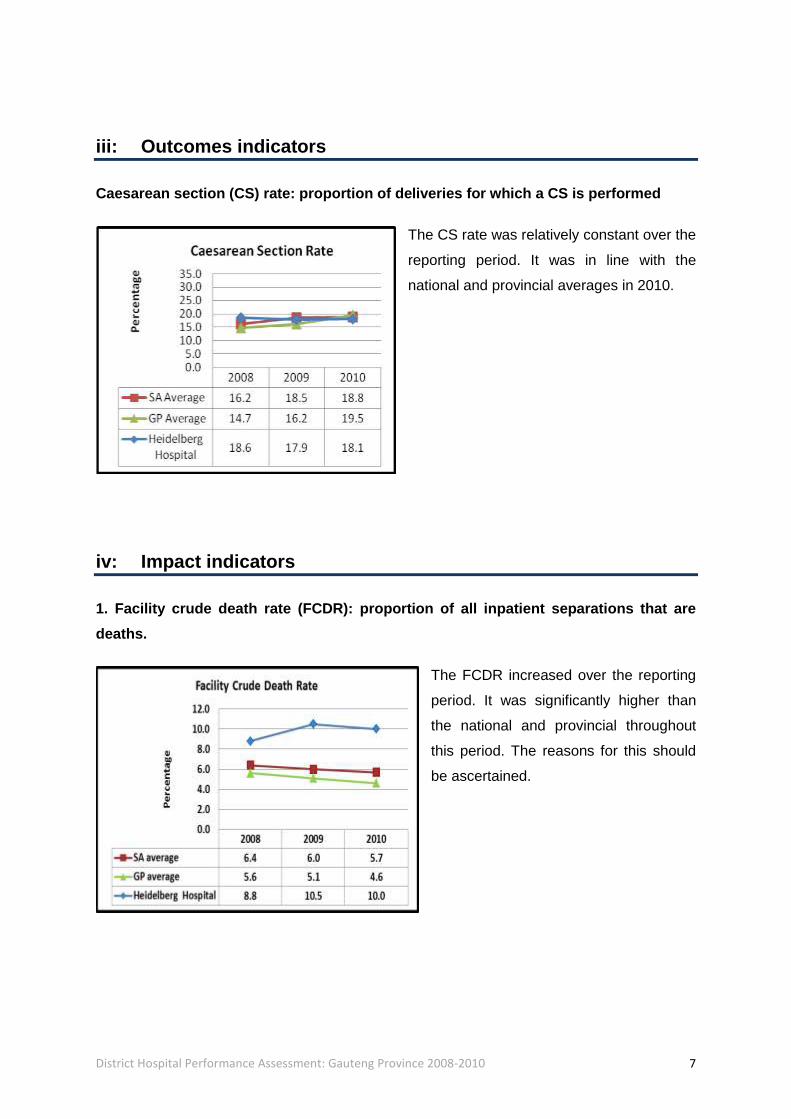
Caesarean section (CS) rate: proportion of deliveries for which a CS is performed
The CS rate was relatively constant over the
reporting period. It was in line with the
national and provincial averages in 2010.
iv: Impact indicators
1. Facility crude death rate (FCDR): proportion of all inpatient separations that are
deaths.
The FCDR increased over the reporting
period. It was significantly higher than
the national and provincial throughout
this period. The reasons for this should
be ascertained.

District Hospital Performance Assessment: Gauteng Province 2008-2010 8
2. Perinatal mortality rate (PNMR) – the sum of still births + those babies dying within
7 days of life/1000 births
The PNMR increased sharply between
2009 and 2010 and is probably due to
data inaccuracy. The data should be
reviewed to exclude data error and to
determine the reasons for the sharp
increase in 2010.
3. Still birth rate (SBR): number of babies born dead/1000 births
The SBR also increased sharply
between 2009 and 2010 to an unlikely
value of 104. The data should be
reviewed to exclude data error and to
determine the reasons for the sharp
increase in 2010.
v: Conclusions:
The reasons for the high FCDR should be ascertained. The PNMR and SBR data should be
reviewed to ascertain the reasons for the extremely high rates in 2010 and to exclude data
error.

District Hospital Performance Assessment: Gauteng Province 2008-2010 9
2. Kopanong Hospital
i: Description
Kopanong district hospital has 195 beds and lies in the Emfuleni sub-district.
ii: Input and process indicators
1. Average length of stay (ALOS) – the average length of time inpatients spend in
hospital
The ALOS decreased over the reporting
period. It was in line with the provincial
average throughout this period.
2. Cost per patient day equivalent (CpPDE): measure of efficiency in the hospital
The CpPDE increased between 2008
and 2010. It was in line with the
provincial average in 2010.

District Hospital Performance Assessment: Gauteng Province 2008-2010 10
3. Usable bed utilisation rate (BUR): measures occupancy of beds which are available
for use
The BUR decreased over the reporting
period. It was higher than the national
and provincial averages throughout this
period.
iii: Outcomes indicators
Caesarean section (CS) rate: proportion of deliveries for which a CS is performed
The CS rate fluctuated slightly,
decreasing between 2008 and 2009 and
then increasing in 2010. It was higher
than the national and provincial
averages throughout the reporting
period. The reasons for the high CS rate
should be ascertained.

District Hospital Performance Assessment: Gauteng Province 2008-2010 11
iv: Impact indicators
1. Facility crude death rate (FCDR): proportion of all inpatient separations that are
deaths.
The FCDR decreased by 36% between
2008 and 2010. It was in line with the
provincial average in 2010.
2. Perinatal mortality rate (PNMR) – the sum of still births + those babies dying within
7 days of life/1000 births
The PNMR decreased between 2008
and 2009 and then increased sharply
(an 8-fold increase) in 2010 to an
unlikely value of 109.4. The data should
be reviewed to exclude data error and to
ascertain the reasons for the sharp
increase.

District Hospital Performance Assessment: Gauteng Province 2008-2010 12
3. Still birth rate (SBR): number of babies born dead/1000 births
The SBR also decreased between 2008
and 2009 and then increased sharply
(an 8-fold increase) in 2010 to an
unlikely value of 99.1. The data should
be reviewed to exclude data error and to
ascertain the reasons for the sharp
increase.
v: Conclusions:
The reasons for the high CS rate should be ascertained. The PNMR and SBR data should
be reviewed to exclude data error and to ascertain the reasons for the sharp increase in
rates in 2010.

District Hospital Performance Assessment: Gauteng Province 2008-2010 13
B West Rand – DC48
West Rand district had an estimated population of 658 733 people in 2010. It has 39 clinics,
2 CHCs, 2 district hospitals, 1 regional hospital and 1 specialised hospital. There are no
provincial tertiary or central hospitals in the district.
1. Carletonville Hospital
i: Description
Carletonville district hospital has 180 beds and lies in the Merafong City sub-district.
ii: Input and process indicators
1. Average length of stay (ALOS) – the average length of time inpatients spend in
hospital
The ALOS decreased to 3.6 days in 2010. It
was lower than the national average and
higher than the provincial average in 2010.

District Hospital Performance Assessment: Gauteng Province 2008-2010 14
2. Cost per patient day equivalent (CpPDE): measure of efficiency in the hospital
The CpPDE increased significantly by over
50% between 2009 and 2010, when it was
closer to the national and provincial
averages. The reasons for the sharp
increase in the CpPDE 2010 need to be
ascertained.
3. Usable bed utilisation rate (BUR): measures occupancy of beds which are available
for use
The BUR fluctuated, decreasing between
2008 and 2009 and then increasing in 2010.
It was higher than the national and
provincial averages in 2010.

District Hospital Performance Assessment: Gauteng Province 2008-2010 15
iii: Outcomes indicators
Caesarean section (CS) rate: proportion of deliveries for which a CS is performed
The CS rate fluctuated significantly. It
decreased sharply between 2008 and 2009
reaching a very low rate of 1% and then
increased sharply again in 2010. It was
lower than the national and provincial
averages throughout this period. The data
should be reviewed to exclude data error
and to explain the fluctuations.
iv: Impact indicators
1. Facility crude death rate (FCDR): proportion of all inpatient separations that are
deaths.
The FCDR decreased over the reporting
period. It was higher than the national and
provincial averages throughout this period.
The reasons for the high FCDR should be
ascertained.
District Hospital Performance Assessment: Gauteng Province 2008-2010 16
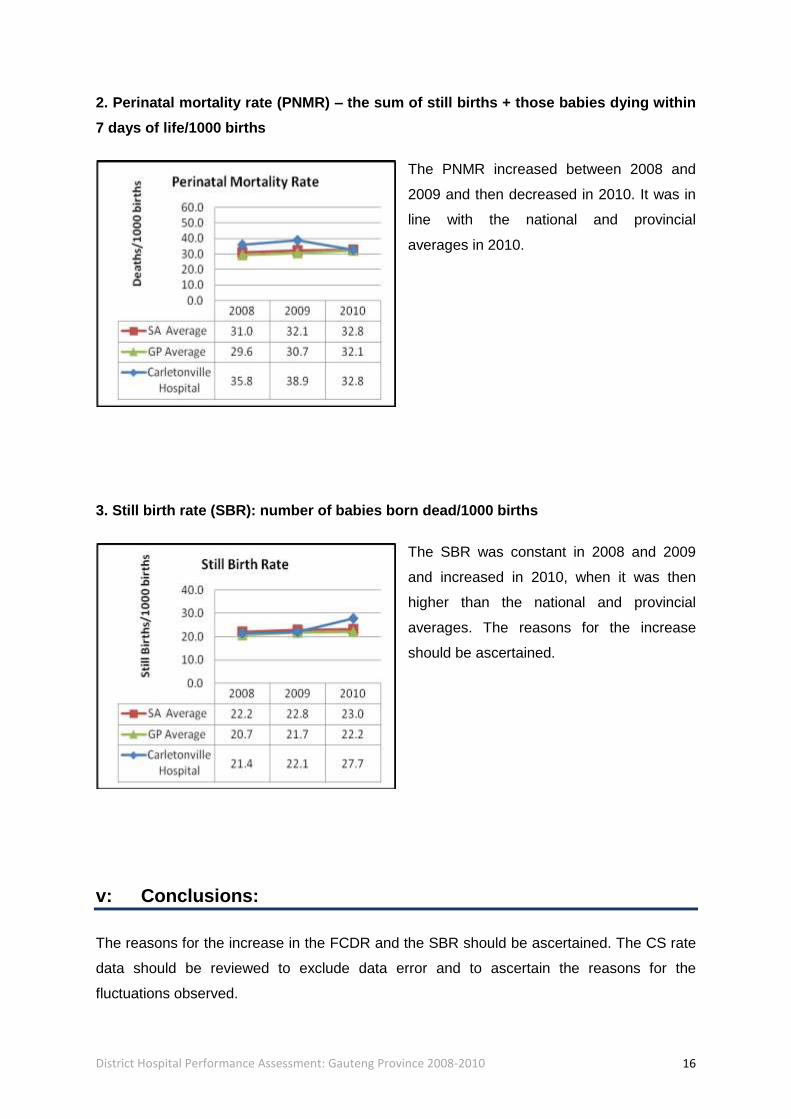
2. Perinatal mortality rate (PNMR) – the sum of still births + those babies dying within
7 days of life/1000 births
The PNMR increased between 2008 and
2009 and then decreased in 2010. It was in
line with the national and provincial
averages in 2010.
3. Still birth rate (SBR): number of babies born dead/1000 births
The SBR was constant in 2008 and 2009
and increased in 2010, when it was then
higher than the national and provincial
averages. The reasons for the increase
should be ascertained.
v: Conclusions:
The reasons for the increase in the FCDR and the SBR should be ascertained. The CS rate
data should be reviewed to exclude data error and to ascertain the reasons for the
fluctuations observed.
District Hospital Performance Assessment: Gauteng Province 2008-2010 17
2. Dr Yusuf Dadoo Hospital
i: Description
Dr Yusuf Dadoo district hospital has 245 beds and lies in the Mogale City sub-district.
ii: Input and process indicators
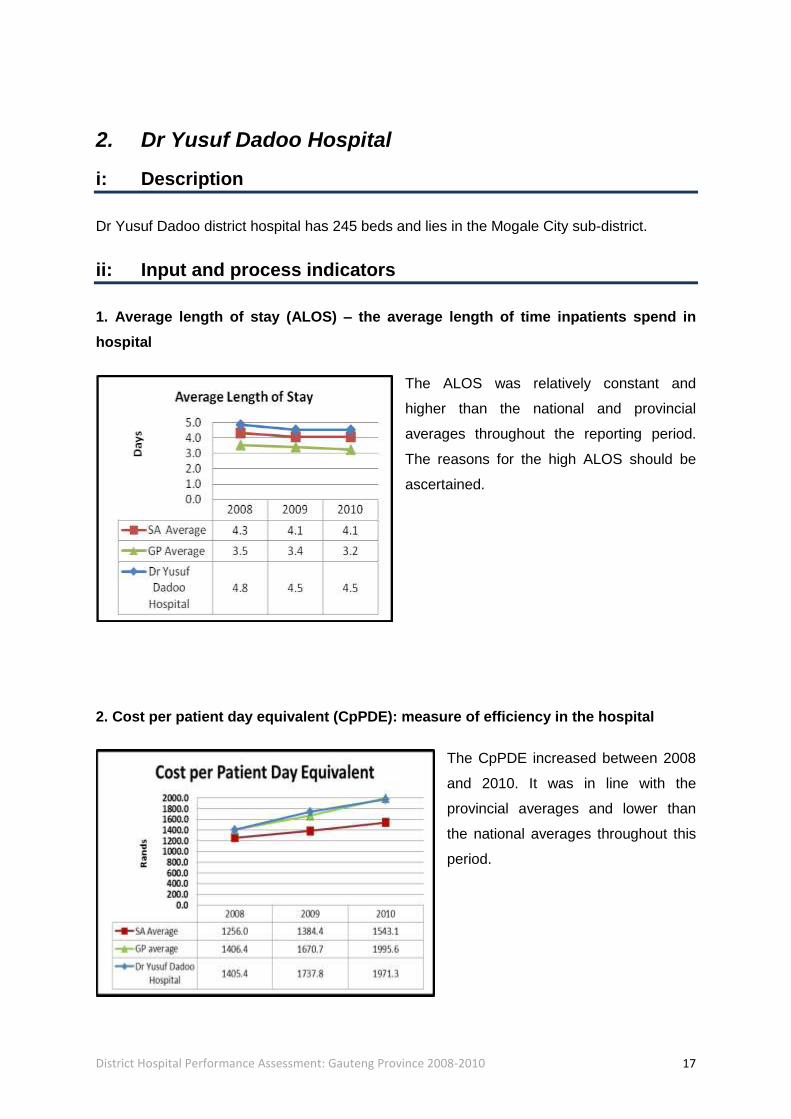
1. Average length of stay (ALOS) – the average length of time inpatients spend in
hospital
The ALOS was relatively constant and
higher than the national and provincial
averages throughout the reporting period.
The reasons for the high ALOS should be
ascertained.
2. Cost per patient day equivalent (CpPDE): measure of efficiency in the hospital
The CpPDE increased between 2008
and 2010. It was in line with the
provincial averages and lower than
the national averages throughout this
period.

District Hospital Performance Assessment: Gauteng Province 2008-2010 18
3. Usable bed utilisation rate (BUR): measures occupancy of beds which are available
for use
The BUR decreased and was in line with the
national and provincial averages throughout
the reporting period.
iii: Outcomes indicators
Caesarean section (CS) rate: proportion of deliveries for which a CS is performed
The CS was relatively constant in 2008 and 2009
and decreased in 2010. It was lower than the
national and provincial averages in 2010.
District Hospital Performance Assessment: Gauteng Province 2008-2010 19
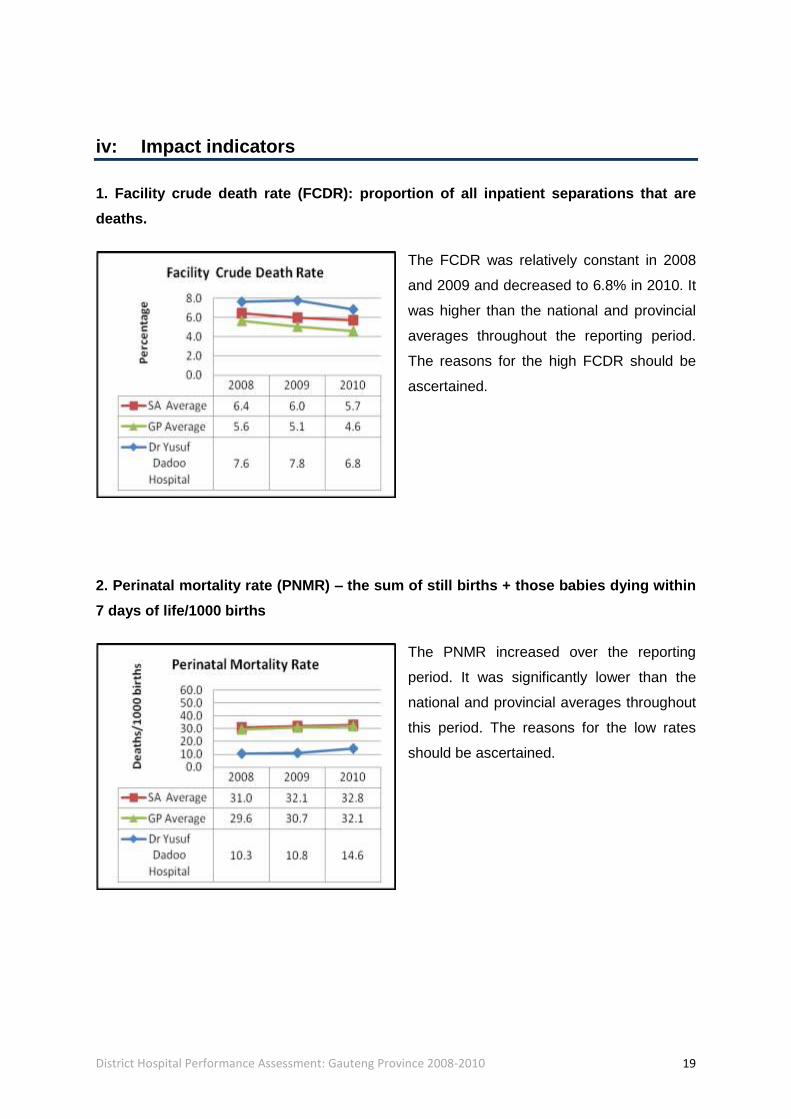
iv: Impact indicators
1. Facility crude death rate (FCDR): proportion of all inpatient separations that are
deaths.
The FCDR was relatively constant in 2008
and 2009 and decreased to 6.8% in 2010. It
was higher than the national and provincial
averages throughout the reporting period.
The reasons for the high FCDR should be
ascertained.
2. Perinatal mortality rate (PNMR) – the sum of still births + those babies dying within
7 days of life/1000 births
The PNMR increased over the reporting
period. It was significantly lower than the
national and provincial averages throughout
this period. The reasons for the low rates
should be ascertained.

District Hospital Performance Assessment: Gauteng Province 2008-2010 20
3. Still birth rate (SBR): number of babies born dead/1000 births
The SBR was constant in 2008 and 2009
and increased in 2010. It was lower than the
national and provincial averages throughout
the reporting period. The reasons for the low
rates should be ascertained.
v: Conclusions:
The reasons for the high ALOS and the high FCDR should be ascertained. The reasons for
the low PNMR and SBR should be investigated for best practices.
District Hospital Performance Assessment: Gauteng Province 2008-2010 21
C Ekurhuleni – EKU
Ekurhuleni District had an estimated population of 2 965 602 people in 2010. It has 79
clinics, 8 CHCs, 1 district hospital and 5 regional hospitals. There are no provincial tertiary or
central hospitals in the district.
1. Germiston Hospital
i: Description
Germiston district hospital has 189 beds and lies in the Ekurhuleni S1 sub-district.
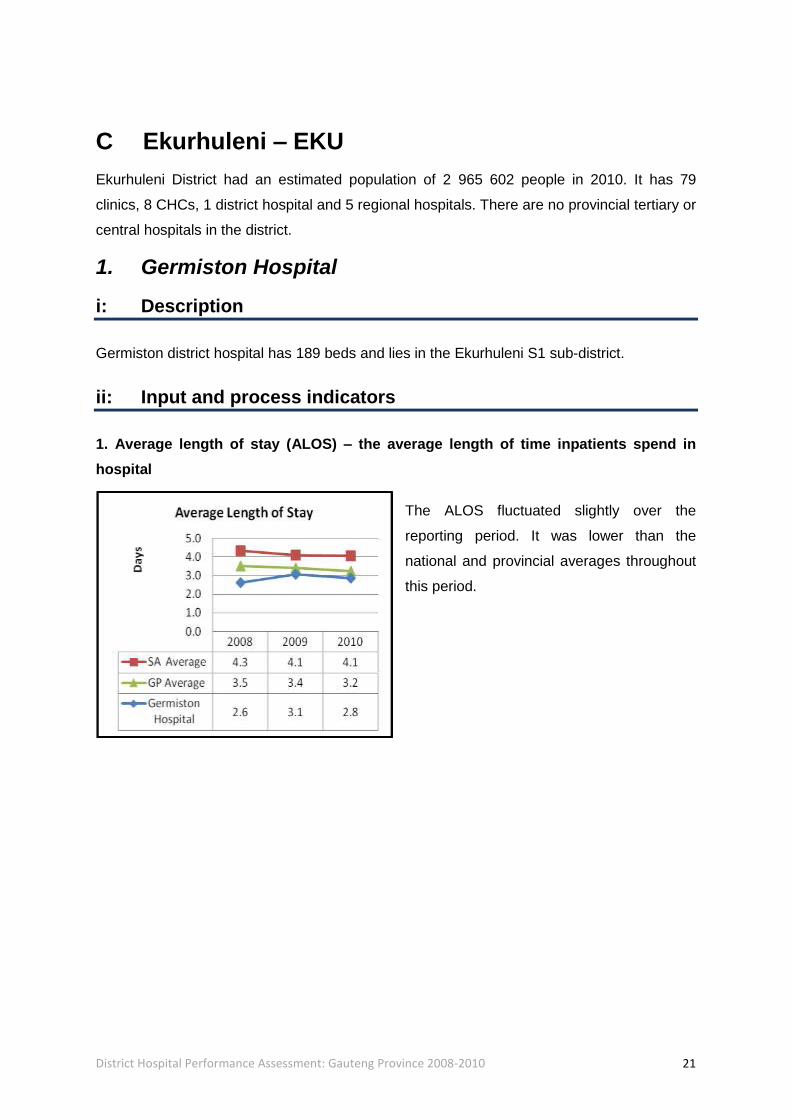
ii: Input and process indicators
1. Average length of stay (ALOS) – the average length of time inpatients spend in
hospital
The ALOS fluctuated slightly over the
reporting period. It was lower than the
national and provincial averages throughout
this period.
District Hospital Performance Assessment: Gauteng Province 2008-2010 22
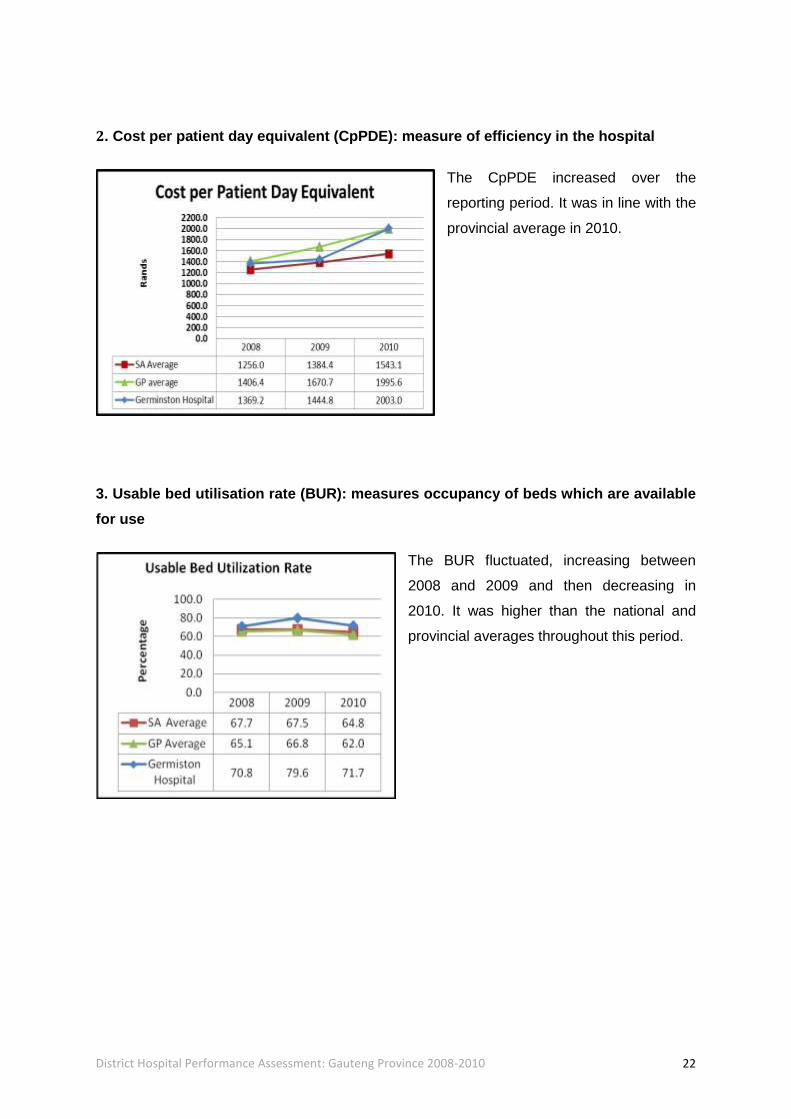
2. Cost per patient day equivalent (CpPDE): measure of efficiency in the hospital
The CpPDE increased over the
reporting period. It was in line with the
provincial average in 2010.
3. Usable bed utilisation rate (BUR): measures occupancy of beds which are available
for use
The BUR fluctuated, increasing between
2008 and 2009 and then decreasing in
2010. It was higher than the national and
provincial averages throughout this period.
District Hospital Performance Assessment: Gauteng Province 2008-2010 23
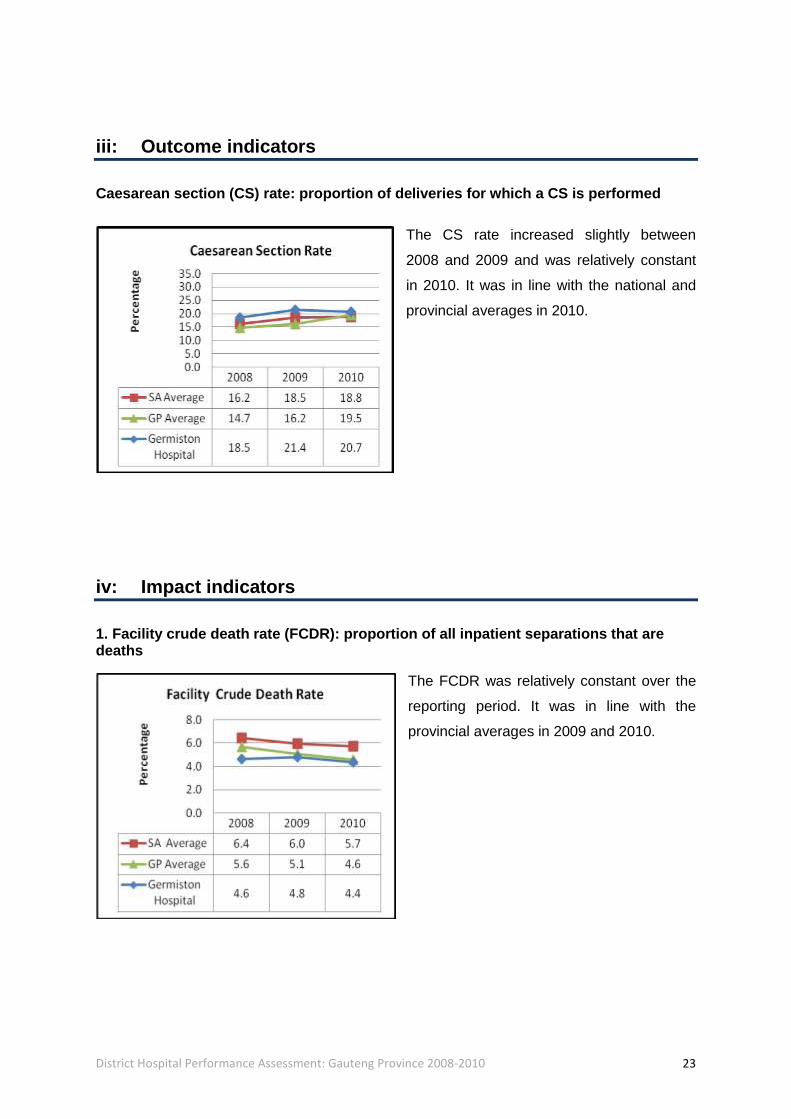
iii: Outcome indicators
Caesarean section (CS) rate: proportion of deliveries for which a CS is performed
The CS rate increased slightly between
2008 and 2009 and was relatively constant
in 2010. It was in line with the national and
provincial averages in 2010.
iv: Impact indicators
1. Facility crude death rate (FCDR): proportion of all inpatient separations that are deaths
The FCDR was relatively constant over the
reporting period. It was in line with the
provincial averages in 2009 and 2010.

District Hospital Performance Assessment: Gauteng Province 2008-2010 24
2. Perinatal mortality rate (PNMR) – the sum of still births + those babies dying within
7 days of life/1000 births
The PNMR was relatively constant in 2008
and 2009 and increased in 2010. It was
generally in line with the national and
provincial averages throughout this period.
3. Still birth rate (SBR): number of still births/1000 births
The SBR was relatively constant between
2008 and 2009 and increased slightly in
2010. It was in line with the national and
provincial averages in 2010.
v: Conclusions
The indicators for this hospital are generally below or in line with the national or provincial
averages, and should be maintained. The reasons for the increase in the PNMR should be
ascertained.

District Hospital Performance Assessment: Gauteng Province 2008-2010 25
D City of Johannesburg – JHB
The City of Johannesburg had an estimated population of 3 701 528 people in 2010. It has
110 clinics, 10 CHCs, 1 district hospital, 3 regional hospitals, 2 central hospitals and 2
specialised hospitals.
1. South Rand Hospital
i: Description
South Rand district hospital has 197 beds and lies in the Johannesburg-F sub-district.
ii: Input and process indicators
1. Average length of stay (ALOS) – the average length of time inpatients spend in
hospital
The ALOS decreased slightly over the
reporting period. It was in line with the
provincial averages throughout this period.
District Hospital Performance Assessment: Gauteng Province 2008-2010 26
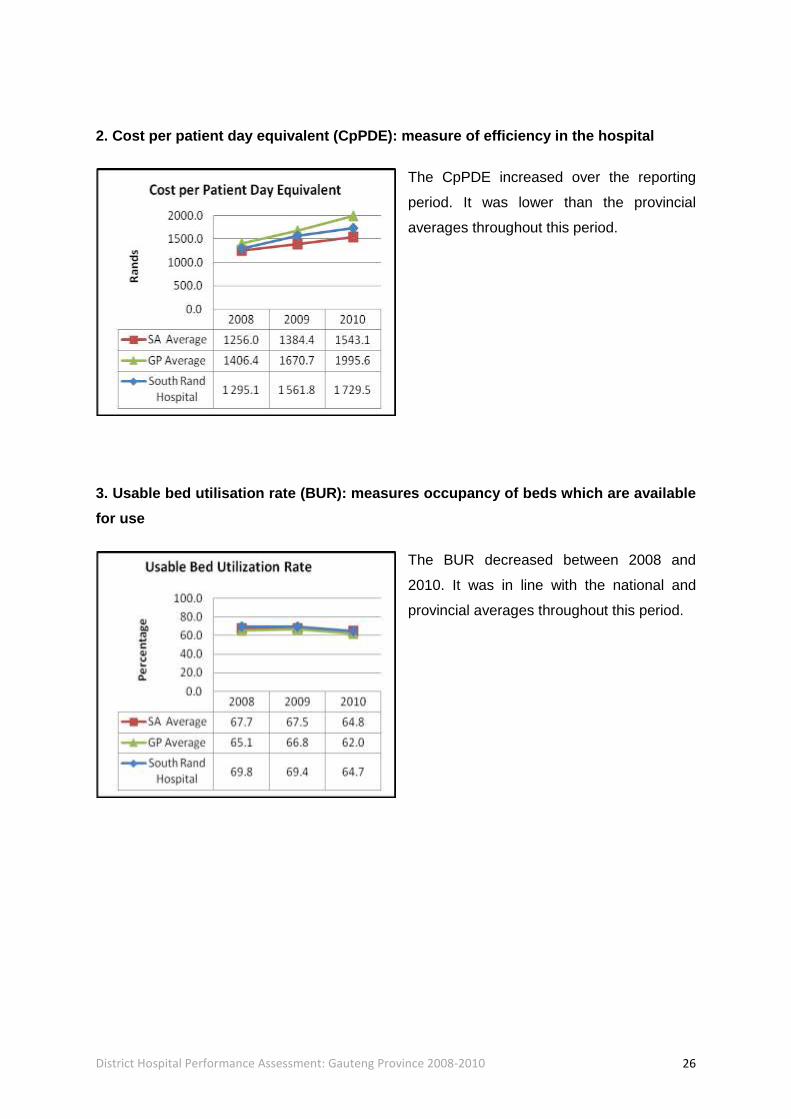
2. Cost per patient day equivalent (CpPDE): measure of efficiency in the hospital
The CpPDE increased over the reporting
period. It was lower than the provincial
averages throughout this period.
3. Usable bed utilisation rate (BUR): measures occupancy of beds which are available
for use
The BUR decreased between 2008 and
2010. It was in line with the national and
provincial averages throughout this period.
District Hospital Performance Assessment: Gauteng Province 2008-2010 27
iii: Outcome indicators
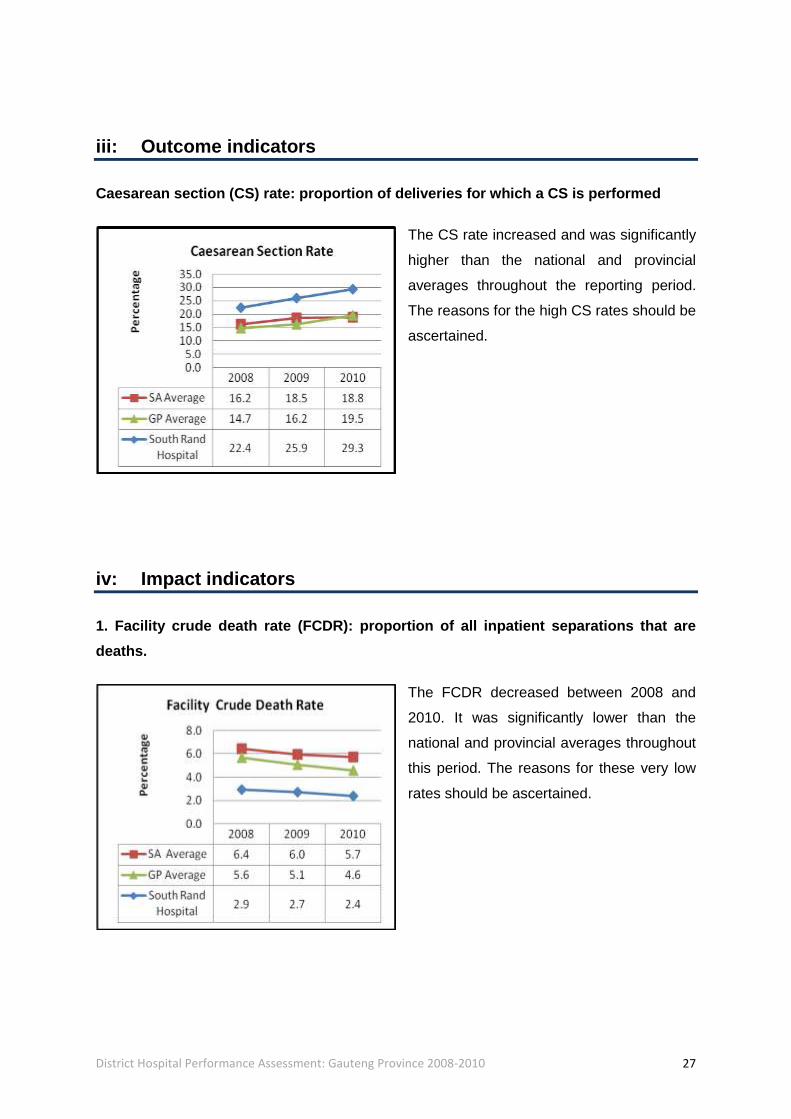
Caesarean section (CS) rate: proportion of deliveries for which a CS is performed
The CS rate increased and was significantly
higher than the national and provincial
averages throughout the reporting period.
The reasons for the high CS rates should be
ascertained.
iv: Impact indicators
1. Facility crude death rate (FCDR): proportion of all inpatient separations that are
deaths.
The FCDR decreased between 2008 and
2010. It was significantly lower than the
national and provincial averages throughout
this period. The reasons for these very low
rates should be ascertained.
District Hospital Performance Assessment: Gauteng Province 2008-2010 28
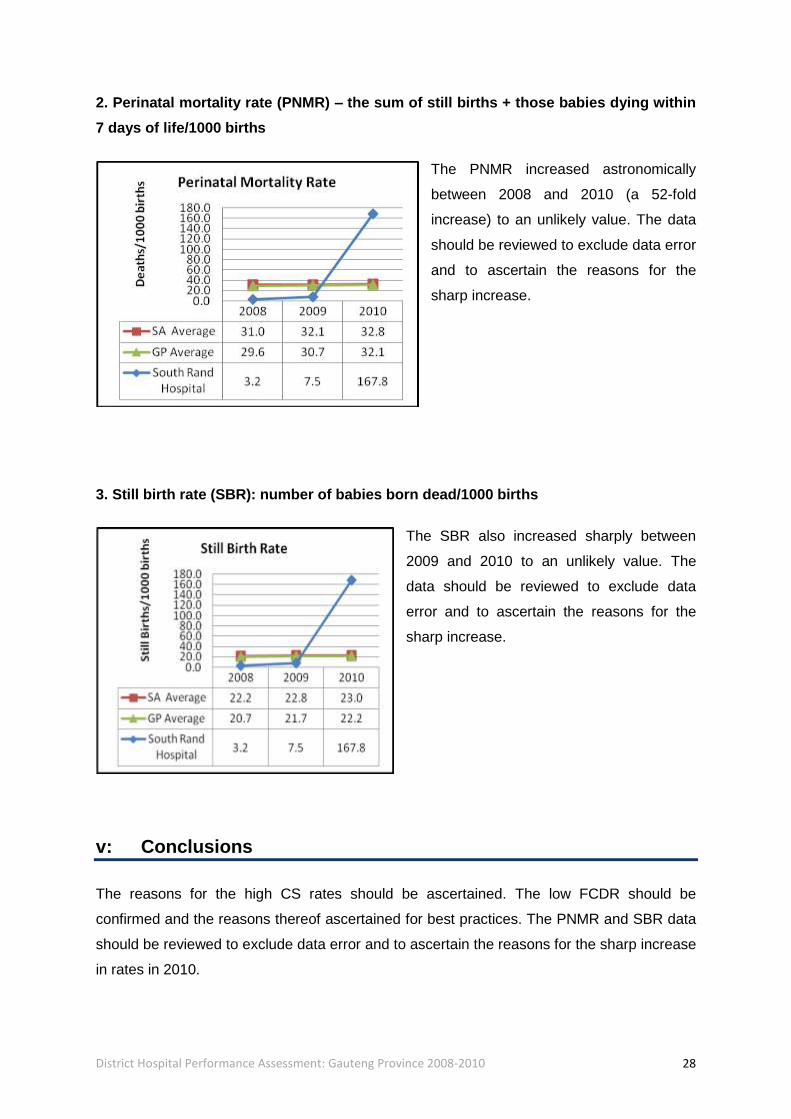
2. Perinatal mortality rate (PNMR) – the sum of still births + those babies dying within
7 days of life/1000 births
The PNMR increased astronomically
between 2008 and 2010 (a 52-fold
increase) to an unlikely value. The data
should be reviewed to exclude data error
and to ascertain the reasons for the
sharp increase.
3. Still birth rate (SBR): number of babies born dead/1000 births
The SBR also increased sharply between
2009 and 2010 to an unlikely value. The
data should be reviewed to exclude data
error and to ascertain the reasons for the
sharp increase.
v: Conclusions
The reasons for the high CS rates should be ascertained. The low FCDR should be
confirmed and the reasons thereof ascertained for best practices. The PNMR and SBR data
should be reviewed to exclude data error and to ascertain the reasons for the sharp increase
in rates in 2010.
District Hospital Performance Assessment: Gauteng Province 2008-2010 29
E City of Tshwane – TSH
The City of Tshwane had an estimated population of 420 927 in 2010. It has 53 clinics, 11
CHCs, 5 district hospitals, 1 regional hospital, 1 specialised hospital and 2 central hospitals.
1. Jubilee Hospital
i: Description
Jubilee district hospital has 414 beds and lies in the Tshwane Odi sub-district.
ii: Input and process indicators
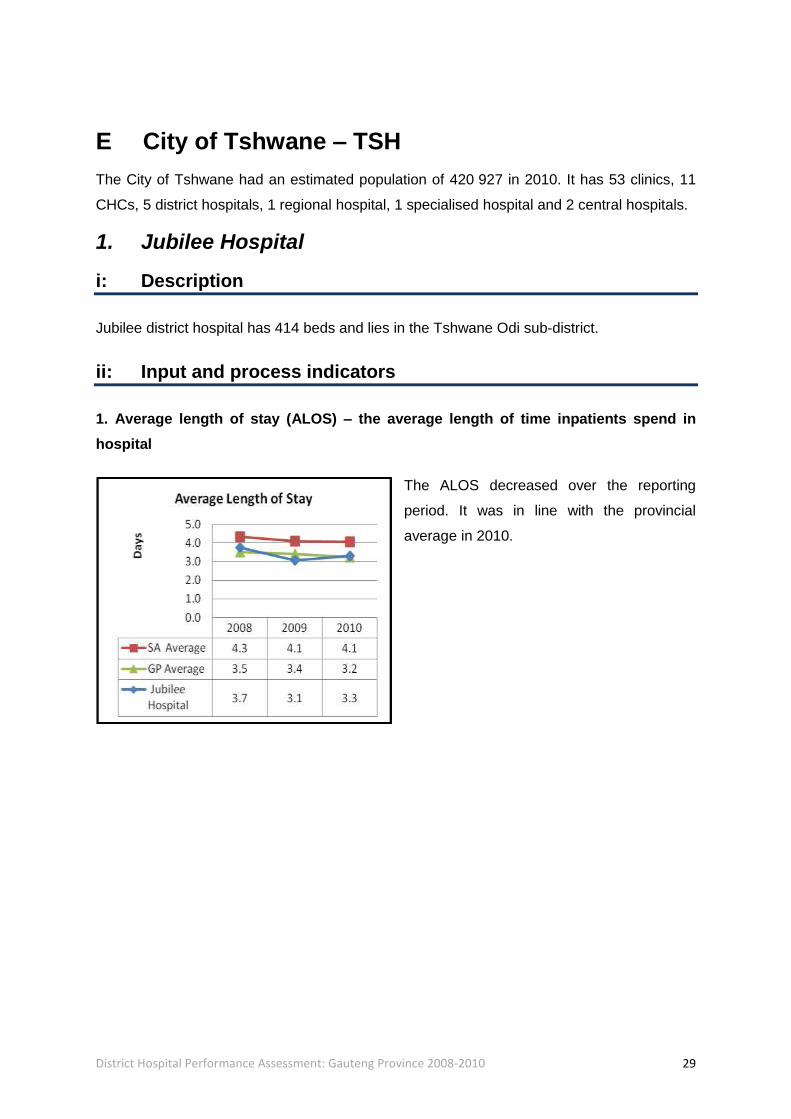
1. Average length of stay (ALOS) – the average length of time inpatients spend in
hospital
The ALOS decreased over the reporting
period. It was in line with the provincial
average in 2010.

District Hospital Performance Assessment: Gauteng Province 2008-2010 30
2. Cost per patient day equivalent (CpPDE): measure of efficiency in the hospital
The CpPDE increased over the reporting
period. It was in line with the provincial
averages throughout this period.
3. Usable bed utilisation rate (BUR): measures occupancy of beds which are available
for use
The BUR increased over the reporting
period. It was lower than the national and
provincial averages throughout this period.
The reasons for the low BUR need to be
ascertained.

District Hospital Performance Assessment: Gauteng Province 2008-2010 31
iii: Outcomes indicators
Caesarean section (CS) rate: proportion of deliveries for which a CS is performed
The CS rate increased by nearly 50%
between 2009 and 2010.The reasons for the
increase should be ascertained.
iv: Impact indicators
1. Facility crude death rate (FCDR): proportion of all inpatient separations that are
deaths.
The FCDR decreased by almost 50%
between 2008 and 2010. It was significantly
lower than the national and provincial
averages throughout the reporting period.
The rates should be confirmed and the
reasons for the low levels ascertained.

District Hospital Performance Assessment: Gauteng Province 2008-2010 32
2. Perinatal mortality rate (PNMR) – the sum of still births + those babies dying within
7 days of life/1000 births
The PNMR increased between 2008 and
2009 and was relatively unchanged in 2010.
It was in line with the national and provincial
averages in 2009 and 2010.
3. Still birth rate (SBR): number of babies born dead/1000 births
The SBR increased between 2008 and
2009, and was relatively unchanged in
2010. It was significantly higher than the
national and provincial averages in 2009
and 2010. The reasons for the increase
should be ascertained.
v: Conclusions:
The reasons for the increase in the CS rate and the SBR should be ascertained. The low
FCDR values should be confirmed and the reasons for this ascertained. The low BUR also
requires explanation.

District Hospital Performance Assessment: Gauteng Province 2008-2010 33
2. Odi Hospital
i: Description
Odi district hospital has 198 beds and lies in the Tshwane Odi sub-district.
ii: Input and process indicators
1. Average length of stay (ALOS) – the average length of time inpatients spend in
hospital
The ALOS was relatively constant over
the reporting period. It was in line with
the provincial average in 2010.
2. Cost per patient day equivalent (CpPDE): measure of efficiency in the hospital
The CpPDE increased between 2008 and
2010. It was in line with the provincial
averages throughout this period.

District Hospital Performance Assessment: Gauteng Province 2008-2010 34
3. Usable bed utilisation rate (BUR): measures occupancy of beds which are available
for use
The BUR increased between 2008 and
2009 and then decreased in 2010. It was
lower than the national and provincial
averages throughout this period. The
reasons for the low BUR should be
ascertained.
iii: Outcomes indicators
Caesarean section (CS) rate: proportion of deliveries for which a CS is performed
The CS rate increased significantly between
2008 and 2010. It was higher than the
national and provincial averages throughout
this period. The reasons for the high CS rate
should be ascertained.
District Hospital Performance Assessment: Gauteng Province 2008-2010 35
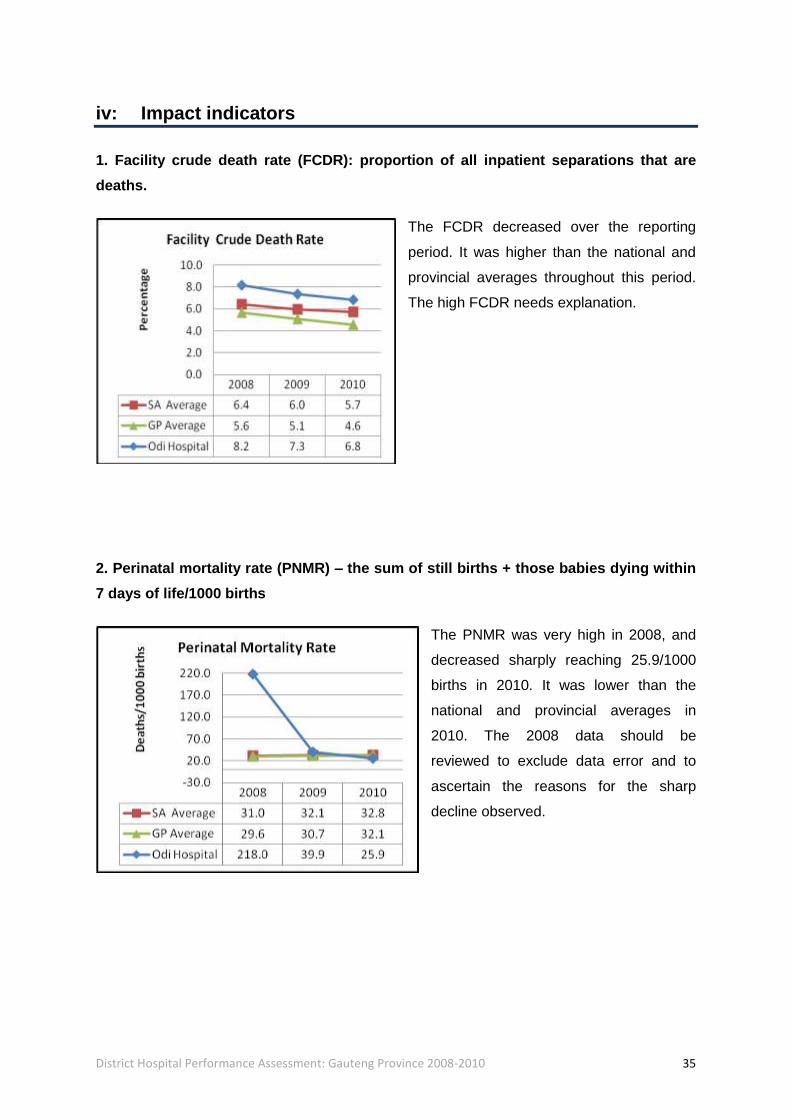
iv: Impact indicators
1. Facility crude death rate (FCDR): proportion of all inpatient separations that are
deaths.
The FCDR decreased over the reporting
period. It was higher than the national and
provincial averages throughout this period.
The high FCDR needs explanation.
2. Perinatal mortality rate (PNMR) – the sum of still births + those babies dying within
7 days of life/1000 births
The PNMR was very high in 2008, and
decreased sharply reaching 25.9/1000
births in 2010. It was lower than the
national and provincial averages in
2010. The 2008 data should be
reviewed to exclude data error and to
ascertain the reasons for the sharp
decline observed.
District Hospital Performance Assessment: Gauteng Province 2008-2010 36
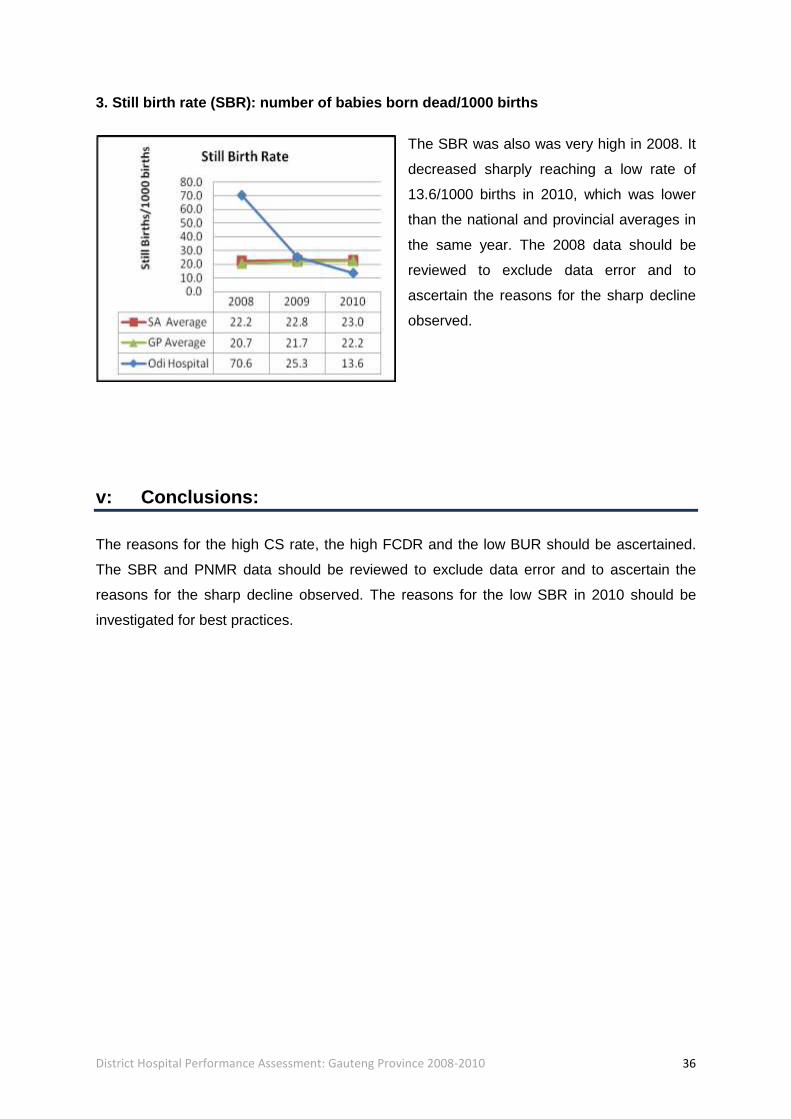
3. Still birth rate (SBR): number of babies born dead/1000 births
The SBR was also was very high in 2008. It
decreased sharply reaching a low rate of
13.6/1000 births in 2010, which was lower
than the national and provincial averages in
the same year. The 2008 data should be
reviewed to exclude data error and to
ascertain the reasons for the sharp decline
observed.
v: Conclusions:
The reasons for the high CS rate, the high FCDR and the low BUR should be ascertained.
The SBR and PNMR data should be reviewed to exclude data error and to ascertain the
reasons for the sharp decline observed. The reasons for the low SBR in 2010 should be
investigated for best practices.

District Hospital Performance Assessment: Gauteng Province 2008-2010 37
3. Mamelodi Hospital
i: Description
Mamelodi district hospital has 197 beds and lies in the Tshwane Central sub-district.
ii: Input and process indicators
1. Average length of stay (ALOS) – the average length of time inpatients spend in
hospital
The ALOS fluctuated, increasing
between 2008 and 2009 and the
decreasing in 2010. It was lower than
the national and provincial averages in
2010.
2. Cost per patient day equivalent (CpPDE): measure of efficiency in the hospital
The CpPDE increased sharply by over 50%
between 2009 and 2010. It was significantly
higher than the national and provincial
averages in 2010. The reasons for the
increase should be ascertained.

District Hospital Performance Assessment: Gauteng Province 2008-2010 38
3. Usable bed utilisation rate (BUR): measures occupancy of beds which are available
for use
The BUR increased to 93.9% in 2009 and
then decreased sharply to 65.7% in 2010,
when it was then in line with the national
and provincial averages. The reasons for
the fluctuations should be ascertained.
iii: Outcome indicators
Caesarean section (CS) rate: proportion of deliveries for which a CS is performed
The CS rate increased sharply over the
reporting period and was higher than the
national and provincial averages in 2010.
The reasons for this sharp increase should
be ascertained.

District Hospital Performance Assessment: Gauteng Province 2008-2010 39
iv: Impact indicators
1. Facility crude death rate (FCDR): proportion of all inpatient separations that are
deaths.
The FCDR decreased between 2008 and 2010
and was in line with the provincial average in
2010.
2. Perinatal mortality rate (PNMR) – the sum of still births + those babies dying within
7 days of life/1000 births
The PNMR increased by more than 100%
between 2008 and 2009 and was relatively
unchanged in 2010. It was closer to the
national and provincial averages in 2009
and 2010.

District Hospital Performance Assessment: Gauteng Province 2008-2010 40
3. Still birth rate (SBR): number of babies born dead/1000 births
The SBR fluctuated, increasing sharply
between 2008 and 2009, and then
decreasing in 2010. It was in line with the
national and provincial averages in 2009
and 2010.
v: Conclusions
The reasons for the sharp increase in the CpPDE and the CS rate should be ascertained as
should the reasons for the increase in the PNMR and the SBR. The sharp decline in the
BUR needs explanation.

District Hospital Performance Assessment: Gauteng Province 2008-2010 41
4. Pretoria West Hospital
i: Description
Pretoria West district hospital has 146 beds and lies in the Tshwane central sub-district.
ii: Input and process indicators
1. Average length of stay (ALOS) – the average length of time inpatients spend in
hospital
The ALOS was relatively constant and in
line with the provincial averages throughout
the reporting period.
2. Cost per patient day equivalent (CpPDE): measure of efficiency in the hospital
The CpPDE increased and was higher than
the national and provincial averages
throughout the reporting period.
District Hospital Performance Assessment: Gauteng Province 2008-2010 42
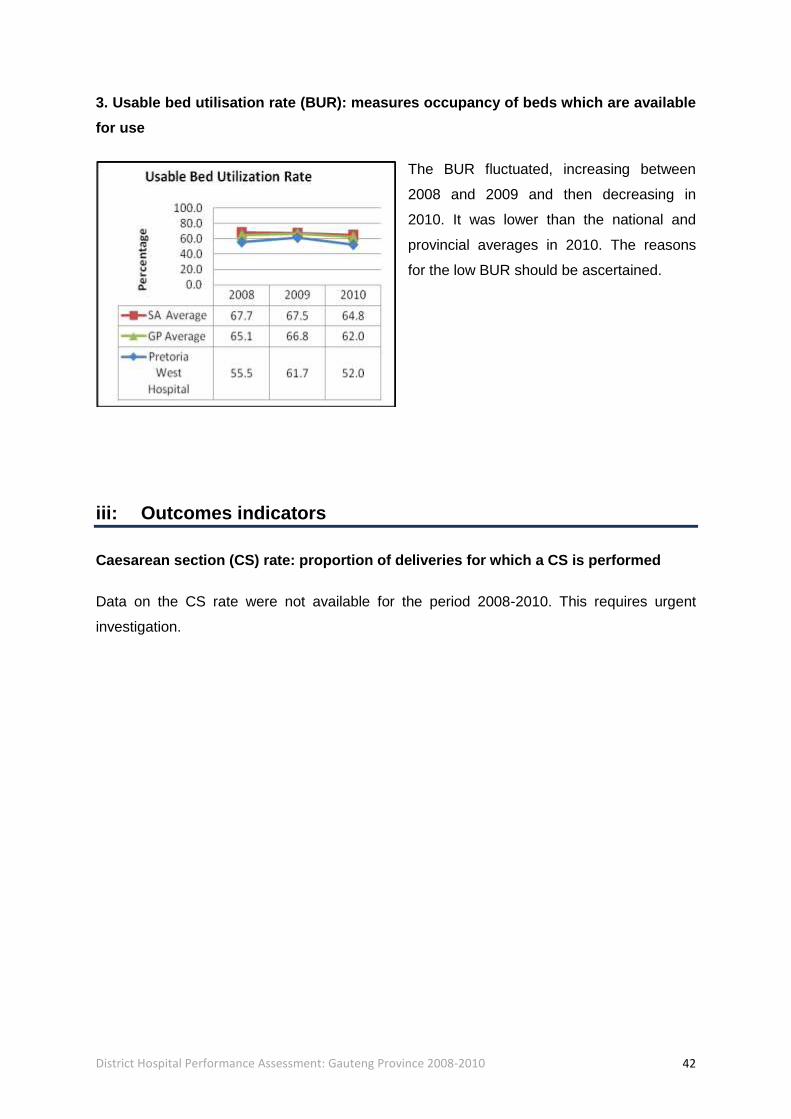
3. Usable bed utilisation rate (BUR): measures occupancy of beds which are available
for use
The BUR fluctuated, increasing between
2008 and 2009 and then decreasing in
2010. It was lower than the national and
provincial averages in 2010. The reasons
for the low BUR should be ascertained.
iii: Outcomes indicators
Caesarean section (CS) rate: proportion of deliveries for which a CS is performed
Data on the CS rate were not available for the period 2008-2010. This requires urgent
investigation.
District Hospital Performance Assessment: Gauteng Province 2008-2010 43
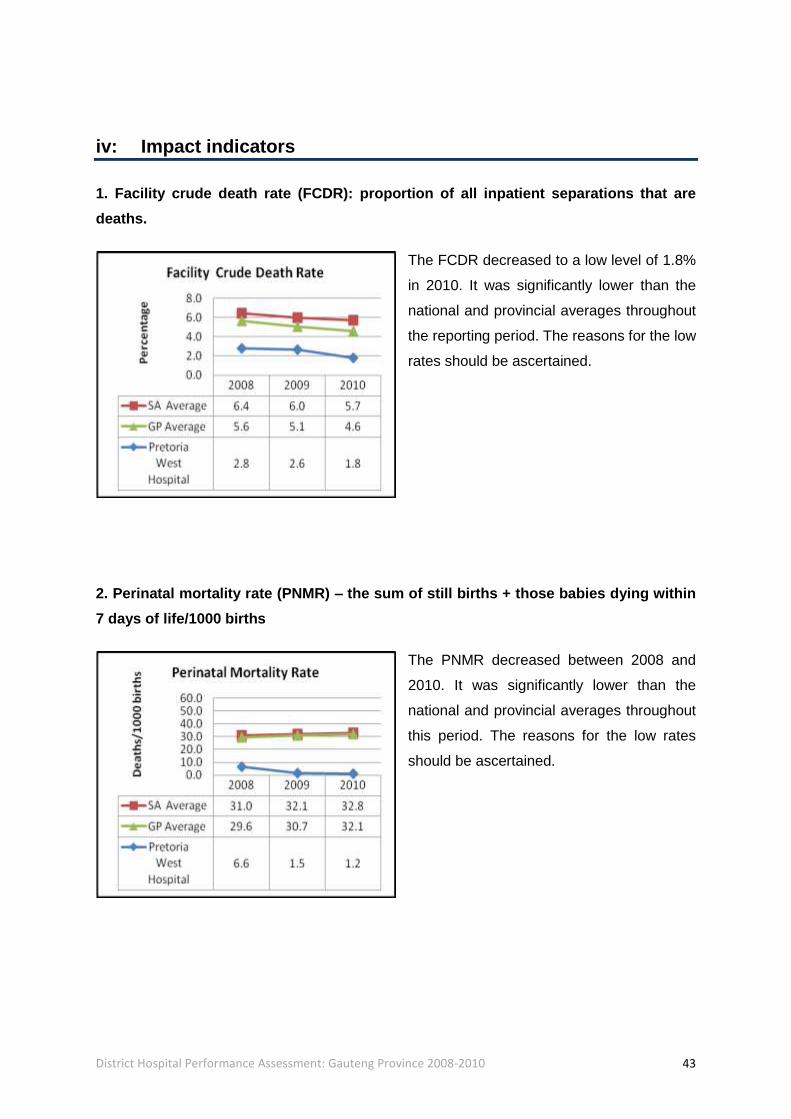
iv: Impact indicators
1. Facility crude death rate (FCDR): proportion of all inpatient separations that are
deaths.
The FCDR decreased to a low level of 1.8%
in 2010. It was significantly lower than the
national and provincial averages throughout
the reporting period. The reasons for the low
rates should be ascertained.
2. Perinatal mortality rate (PNMR) – the sum of still births + those babies dying within
7 days of life/1000 births
The PNMR decreased between 2008 and
2010. It was significantly lower than the
national and provincial averages throughout
this period. The reasons for the low rates
should be ascertained.
District Hospital Performance Assessment: Gauteng Province 2008-2010 44
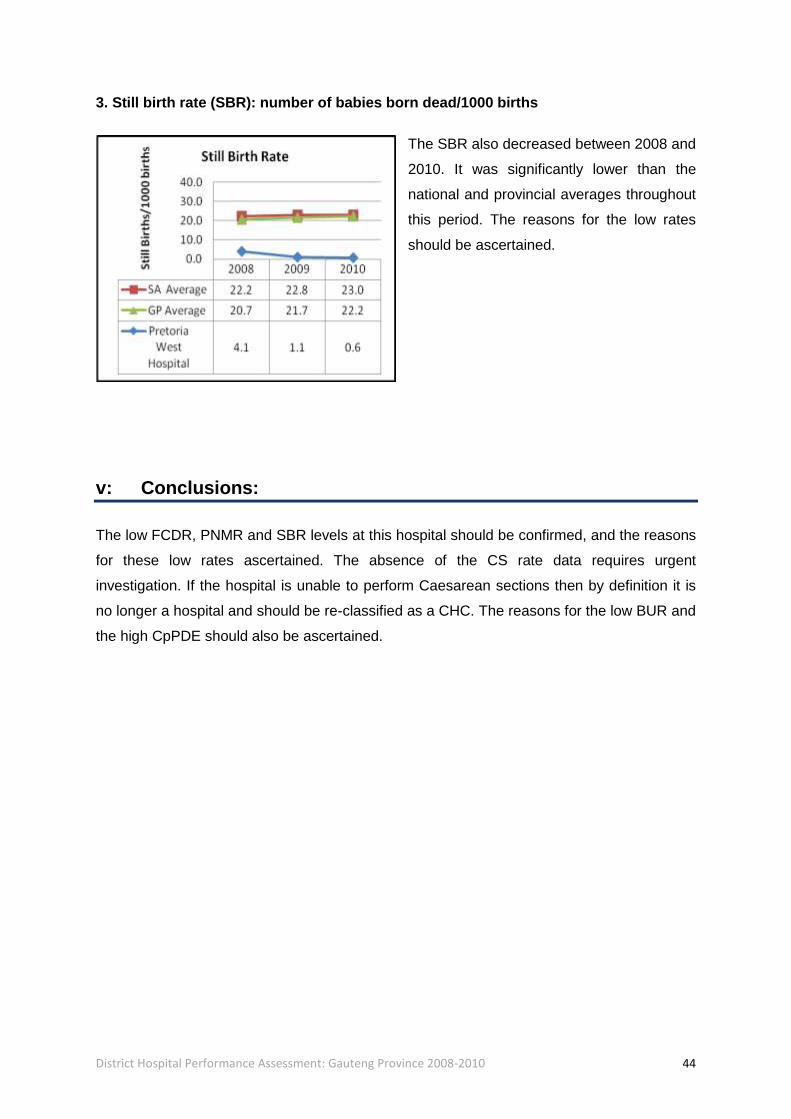
3. Still birth rate (SBR): number of babies born dead/1000 births
The SBR also decreased between 2008 and
2010. It was significantly lower than the
national and provincial averages throughout
this period. The reasons for the low rates
should be ascertained.
v: Conclusions:
The low FCDR, PNMR and SBR levels at this hospital should be confirmed, and the reasons
for these low rates ascertained. The absence of the CS rate data requires urgent
investigation. If the hospital is unable to perform Caesarean sections then by definition it is
no longer a hospital and should be re-classified as a CHC. The reasons for the low BUR and
the high CpPDE should also be ascertained.
District Hospital Performance Assessment: Gauteng Province 2008-2010 45
5. Tshwane District Hospital
i: Description
Tshwane district hospital has 189 beds and lies in the Tshwane central sub-district.
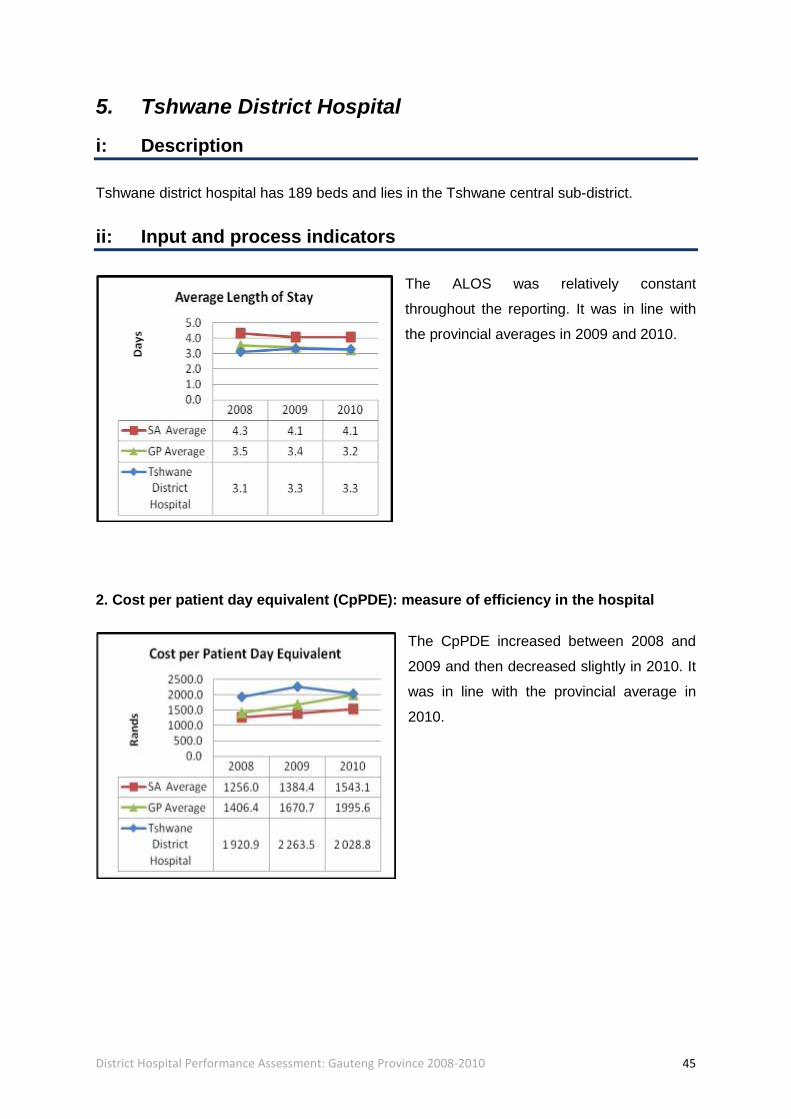
ii: Input and process indicators
The ALOS was relatively constant
throughout the reporting. It was in line with
the provincial averages in 2009 and 2010.
2. Cost per patient day equivalent (CpPDE): measure of efficiency in the hospital
The CpPDE increased between 2008 and
2009 and then decreased slightly in 2010. It
was in line with the provincial average in
2010.

District Hospital Performance Assessment: Gauteng Province 2008-2010 46
3. Usable bed utilisation rate (BUR): measures occupancy of beds which are available
for use
The BUR was relatively constant between
2008 and 2009 and decreased in 2010,
when it was then lower than the national
and provincial averages. The reasons for
the low BUR should be ascertained.
iii: Outcomes indicators
Caesarean section (CS) rate: proportion of deliveries for which a CS is performed
The CS rate increased slightly between
2008 and 2010. It was lower than the
national and provincial averages throughout
this period.
District Hospital Performance Assessment: Gauteng Province 2008-2010 47
iv: Impact indicators
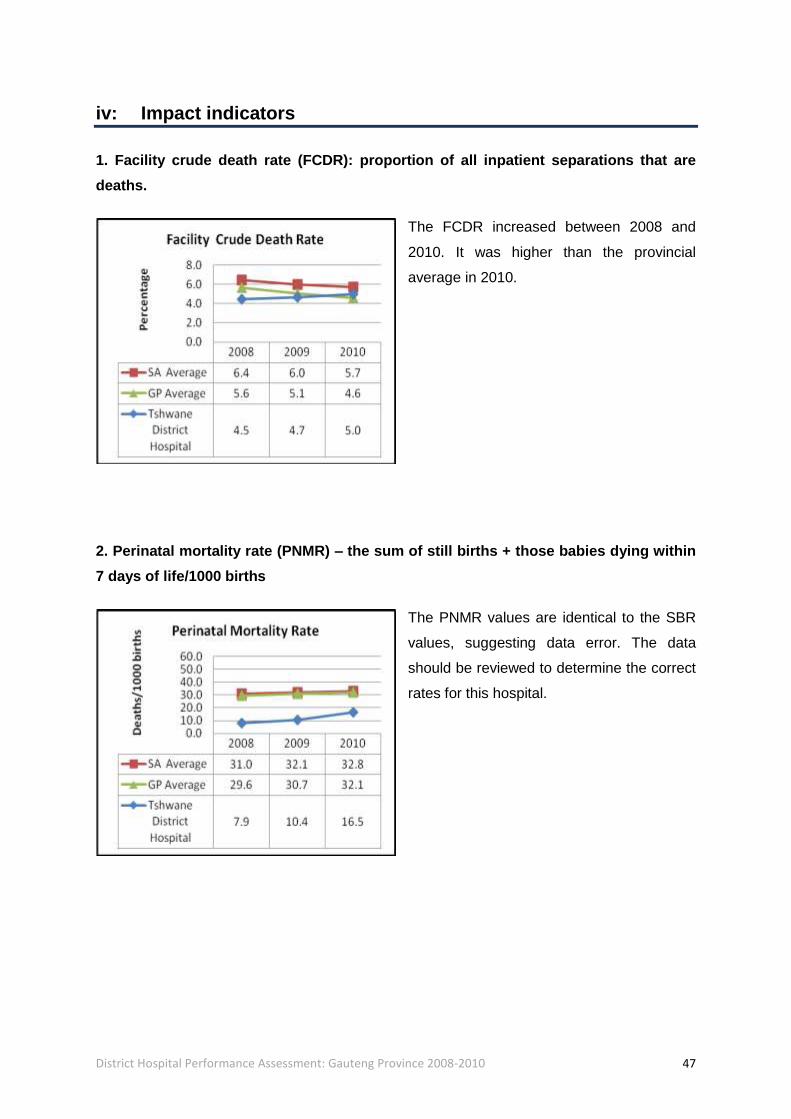
1. Facility crude death rate (FCDR): proportion of all inpatient separations that are
deaths.
The FCDR increased between 2008 and
2010. It was higher than the provincial
average in 2010.
2. Perinatal mortality rate (PNMR) – the sum of still births + those babies dying within
7 days of life/1000 births
The PNMR values are identical to the SBR
values, suggesting data error. The data
should be reviewed to determine the correct
rates for this hospital.
District Hospital Performance Assessment: Gauteng Province 2008-2010 48
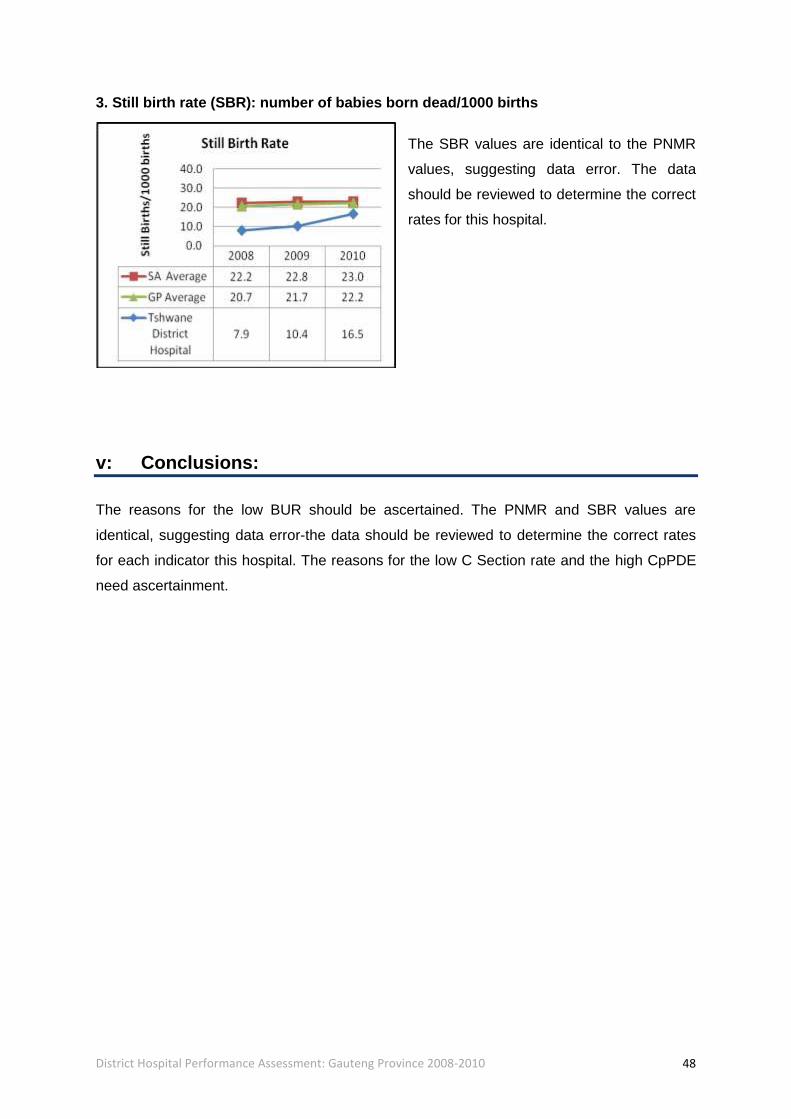
3. Still birth rate (SBR): number of babies born dead/1000 births
The SBR values are identical to the PNMR
values, suggesting data error. The data
should be reviewed to determine the correct
rates for this hospital.
v: Conclusions:
The reasons for the low BUR should be ascertained. The PNMR and SBR values are
identical, suggesting data error-the data should be reviewed to determine the correct rates
for each indicator this hospital. The reasons for the low C Section rate and the high CpPDE
need ascertainment.