Distributions of Nominal Variables 12/02. Nominal Data Some measurements are just types or...
12
Distributions of Nominal Variables 12/02
-
Upload
amice-weaver -
Category
Documents
-
view
213 -
download
0
Transcript of Distributions of Nominal Variables 12/02. Nominal Data Some measurements are just types or...

Distributions of Nominal Variables
12/02
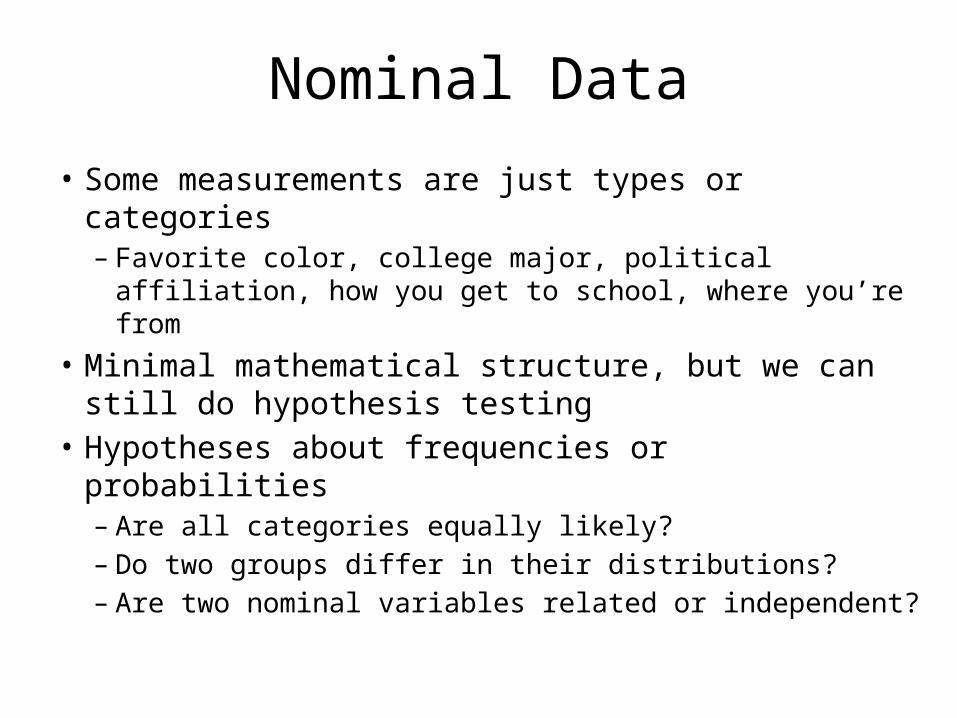
Nominal Data
• Some measurements are just types or categories– Favorite color, college major, political affiliation, how
you get to school, where you’re from• Minimal mathematical structure, but we can still
do hypothesis testing• Hypotheses about frequencies or probabilities– Are all categories equally likely?– Do two groups differ in their distributions?– Are two nominal variables related or independent?

Extending the Binomial Test• Binomial test
– Frequency of observations in yes/true category– Compare to prediction of null hypothesis
• Normal approximation– Treat binomial distribution as Normal– Convert frequency to z-score
mfreqf

Extending the Binomial Test• Multinomial test
– Count observations in every category• Observed frequencies, f obs
– Convert each to z-score– H0 predicts each z should be near 0
• Chi-square statistic– Sum of squared z-scores– Measures deviation from null hypothesis
• p-value– Probability of result greater than c2
– Uses chi-square distribution– df = k – 1 (k is number of categories)– Counts are not independent;
last constrained by rest

Details of z-score• Expected frequencies:
– Frequency of each category predicted by H0
– Expected value or mean of sampling distribution– Category probability times number of observations (n)– If all categories equally likely:
• Standard error– Denominator of z formula– Standard deviation of sampling distribution (adjusted for degrees of freedom)– Equals square root of expected frequency:
•
•

Example: Favorite Colors
• Choices: Red, Yellow, Green, Blue, Purple
• Are they all equally popular?
• Null hypothesis: For each color,
• Deviances:
• Squared z-scores:
• Chi-square statistic:
• Critical value (df = 4, a = 5%): 9.49

Independence of Nominal Variables
• Are two nominal variables related?– Same question as correlation, but need different approach– Do probabilities for one variable differ between categories of
another?– Experimental condition vs. success of learning;
sex vs. political affiliation; origin vs. major• Independent nominal variables
– Probabilities for each variable unaffected by other– Example: 80% from CO, 10% psych majors
• 80% of psych majors are from CO• 80%10% = 8% both psych and from CO
– p(x & y) = p(x)p(y)

Chi-square Test of Independence• Null hypothesis: Variables are independent
– Use H0 to calculate expected frequencies
• Find observed marginal frequencies for each variable– Total count for each category, ignoring levels of other variable
• Multiply marginal frequencies to get expected frequency for combination
• Same formula as before:
y1 y2 y3
x1 40 20 10 40 30 20 80
x2 30 30 80 60 10 30 120
x3 20 40 90 80 50 40 160
90 180 90 360

General Principles of Chi-square Tests
• Can use any prediction about data as null hypothesis– Very general approach
• Measure goodness of fit– Actually badness of fit– Deviation of data from prediction
• Nominal data– Calculate z-score for each frequency within its sampling distribution
• Observed minus expected frequency, divided by sqrt(f exp)
– Square zs and sum, to get c2
– Distribution of one variable; dependence between two variables• Compare GoF to chi-square distribution to get p-value
– p = p(c2df > c2)
• df comes from number of parameters constrained by H0
– k – 1 for multinomial test; (kX – 1)(kY – 1) for independence test

Review
Dogs in the U.S. are
30% Labrador20% Chihuahua15% German Shepherd35% Other
The local shelter has 200 dogs. How many of each would you expect if sheter dogs had the same distribution as the general population?
A. 50 Lab, 50 Chihuahua, 50 GSD, 50 otherB. 30 Lab, 20 Chihuahua, 15 GSD, 35 otherC. 60 Lab, 40 Chihuahua, 30 GSD, 70 otherD. 25 Lab, 25 Chihuahua, 25 GSD, 25 other

ReviewThe actual breed counts are as follows:
Labrador Chihuahua GSD OtherObserved 65 50 20 65Expected 60 40 30 70
Calculate a c2 statistic for testing whether this shelter reliably deviates from the breed distribution in the general population.
A. 0.74B. 6.61C. 7.77D. 250
p = .085
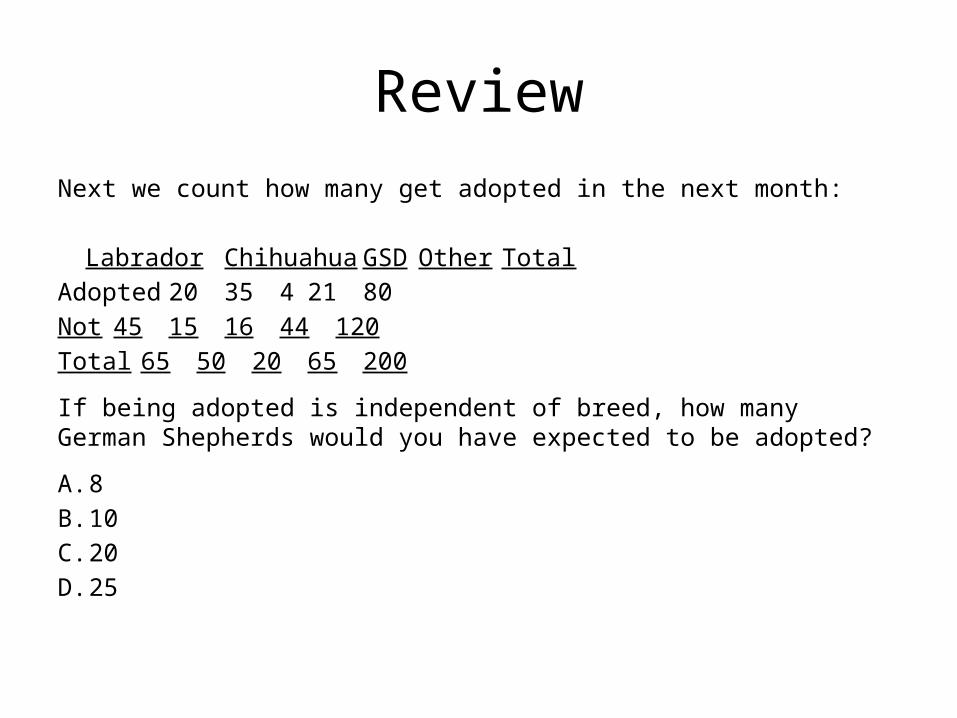
ReviewNext we count how many get adopted in the next month:
Labrador Chihuahua GSD Other TotalAdopted 20 35 4 21 80Not 45 15 16 44 120Total 65 50 20 65 200
If being adopted is independent of breed, how many German Shepherds would you have expected to be adopted?
A. 8B. 10C. 20D. 25