Distributional Consequences of Labor-demand Shocks: … · when translating labor-demand reactions...
26
Distributional Consequences of Labor-demand Shocks: The 2008-09 Recession in Germany Olivier Bargain, Herwig Immervoll, Andreas Peichl, Sebastian Siegloch 23rd March 2011. Abstract The distributional consequences of the recent economic crisis are still broadly unknown. While it is possible to speculate which groups are likely to be hardest- hit, detailed distributional studies are still largely backward-looking due to a lack of real-time microdata. This paper studies the distributional and scal implications of output changes in Germany 200809, using data available prior to the economic downturn. We rst estimate labor demand on 12 years of detailed, administrative matched employer-employee data. The distributional analysis is then conducted by transposing predicted employment e/ects of actual output shocks to household-level microdata. A scenario in which labor demand adjustments occur at the intensive margin (hour changes), close to the German experience, shows less severe e/ects on income distribution compared to a situation where adjustments take place through massive layo/s. Adjustments at the intensive margin are also preferable from a scal point of view. In this context we discuss the cushioning e/ect of the tax- benet system and the conditions under which German-style work-sharing policies can be successful in other countries. Key Words: labor demand; output shock; tax-benet system; crisis; income distribution. JEL Classication: D58, J23, H24, H60. Acknowledgement: Bargain is a¢ liated to UC Dublin, IZA, ESRI, the Geary Institute and CHILD. Immervoll is a¢ liated to the OECD, IZA and ISER. Peichl is a¢ liated to IZA, the University of Cologne, ISER and CESifo. Siegloch is a¢ liated to IZA and the University of Cologne. We would like to thank Tim Callan, Daniel Hamermesh, John Martin and Paul Swaim for valuable comments. Usual disclaimers apply. Correspondence to: Andreas Peichl, IZA, 7-9 Schaumburg-Lippe Str, 53113 Bonn, Germany, [email protected]
Transcript of Distributional Consequences of Labor-demand Shocks: … · when translating labor-demand reactions...

Distributional Consequences of Labor-demandShocks: The 2008-09 Recession in Germany�
Olivier Bargain, Herwig Immervoll, Andreas Peichl, Sebastian Siegloch
23rd March 2011.
Abstract
The distributional consequences of the recent economic crisis are still broadly
unknown. While it is possible to speculate which groups are likely to be hardest-
hit, detailed distributional studies are still largely backward-looking due to a lack
of real-time microdata. This paper studies the distributional and �scal implications
of output changes in Germany 2008�09, using data available prior to the economic
downturn. We �rst estimate labor demand on 12 years of detailed, administrative
matched employer-employee data. The distributional analysis is then conducted by
transposing predicted employment e¤ects of actual output shocks to household-level
microdata. A scenario in which labor demand adjustments occur at the intensive
margin (hour changes), close to the German experience, shows less severe e¤ects on
income distribution compared to a situation where adjustments take place through
massive layo¤s. Adjustments at the intensive margin are also preferable from a
�scal point of view. In this context we discuss the cushioning e¤ect of the tax-
bene�t system and the conditions under which German-style work-sharing policies
can be successful in other countries.
Key Words: labor demand; output shock; tax-bene�t system; crisis; incomedistribution.
JEL Classi�cation: D58, J23, H24, H60.
�Acknowledgement: Bargain is a¢ liated to UC Dublin, IZA, ESRI, the Geary Institute and CHILD.Immervoll is a¢ liated to the OECD, IZA and ISER. Peichl is a¢ liated to IZA, the University of Cologne,ISER and CESifo. Siegloch is a¢ liated to IZA and the University of Cologne. We would like to thankTim Callan, Daniel Hamermesh, John Martin and Paul Swaim for valuable comments. Usual disclaimersapply. Correspondence to: Andreas Peichl, IZA, 7-9 Schaumburg-Lippe Str, 53113 Bonn, Germany,[email protected]
1 Introduction
The 2008-09 economic downturn has led to a broad discussion, both in the public andacademic arena, on the likely distributional and �scal consequences of the crisis and onwhich policy might be most e¤ective at mitigating the adverse labor market and welfareconsequences of the downturn. In fact, policy e¤orts to minimize welfare losses wereseriously hampered by how little was known about the distribution of changes in employ-ment and incomes and about the capacity of existing redistribution systems to soften thenegative impacts of job and earnings losses. In this context the German experience isparticularly interesting. While Germany has su¤ered a substantial drop in GDP (around5 percent on average� an even larger slump than in the United States), employment levelsand unemployment rates were unusually resilient as most of labor adjustments occurredat the intensive margin (working hours). This is in contrast to many other Westerncountries, which experienced far greater levels of layo¤. While many analysts and policymakers have focused on Germany�s employment e¤ects and its work-sharing policies (see,e.g., Hijzen & Venn (2011), Cahuc & Carcillo (2011)), much less is known about precisedistributional and �scal consequences of alternative labor market adjustments.We investigate this question, focusing on the German situation for the years 2008-
09. While it is possible to speculate about which groups are likely to be hardest-hit,detailed distributional studies are usually not available until the crisis is long over anddecisions have already been made. For that reason we develop a straightforward approachto gauge the distributional and �scal implications of large output changes at an earlystage, i.e., without having the appropriate microdata. We �rst estimate labor demandon 12 years of high-quality, micro-level administrative employer-employee data (LIAB).The estimates are used to predict labor-demand e¤ects of the output shocks observedduring the downturn at a disaggregated level (by industry and for labor inputs detailedby age, skill and contract type). Interestingly, we are able to transpose these labormarket changes to household-level microdata commonly used for distributional analyses(the German Socio-Economic Panel, SOEP).1
Using this combined approach we can analyze the �rst-round consequences of the re-cession for income changes at the household level. We suggest two contrasting scenarios
1To the best of our knowledge, this is the �rst empirical study linking output changes to distributionaland �scal consequences using a detailed micro model of labor-demand responses. The approach is concep-tually related to the literature on linking micro and macro models (see, e.g., Bourguignon et al. (2003)or Peichl (2009) for a survey, and Bourguignon et al. (2008), Hérault (2010), Ahmed & O�Donoghue(2010), Ferreira et al. (2008) and Robilliard et al. (2008) for distributional and crisis-related analyses).In particular, our method is closer to the �top-down�approach which aims to approximate the e¤ect ofmacro changes on income distribution. Further di¤erences with approaches are discussed in the followingsections.
1

when translating labor-demand reactions to earnings losses at the household level. The�rst polar case (intensive scenario) allows only for adjustments of employees�workinghours rather than sta¤ levels. Although being stylized, this scenario comes close to theobserved German situation and also to that of other countries where much of the reduc-tions in total working hours occurred at the intensive margin (e.g., Austria, Belgium, theCzech Republic, the Slovak Republic). The second polar case (extensive scenario) showswhat happens if the same overall adjustment in total working hours occurs exclusivelyvia layo¤s and hires� a scenario more in line with the situation experienced in the UnitedStates, Greece, Ireland, Spain or the UK (OECD (2010)).2
Our results show that low-skilled and non-standard workers faced above-average risksof earnings losses. An examination of the resulting income losses shows, however, thatautomatic stabilization by the tax-bene�t system is e¤ective in cushioning a signi�cantshare of the gross-income losses. Moreover, we �nd that the margin of adjustments doesindeed matter. Given the likely pattern of job losses among di¤erent groups of workers,adjustments at the extensive margin result in a sizable widening of the income distri-bution, increasing inequality and a rise in the number of poor people by more than 10percent. In the intensive scenario poverty headcounts rise by under 4 percent, while mostinequality measures are predicted to change little. Importantly, adjustments at the in-tensive margin are also preferable from a �scal point of view� at least in the short-term.We discuss the limits of our analysis, notably the fact that the hour-adjustment would beeven more favorable in countries with less generous unemployment insurance. However, itis less e¤ective if the economic structure encourages temporary work or does not provideincentives for �rms to retain workers.
The remainder of the paper is structured as follows. Section 2 brie�y summarizesthe labor market changes in Germany during the crisis and contrasts them with the USexperience. In Section 3 we lay out our empirical approach, present the data and theestimation of the labor-demand model. In Section 4we predict the �rst-round e¤ect ofoutput shocks on the demand for di¤erent labor inputs, compare them to observed labormarket trends, and analyze the distributional consequences of labor market adjustmentsat the household level. Finally, we derive and discuss the �scal consequences of working-hour reductions versus layo¤s. Section 5 concludes.
2Our demand model, speci�ed on total hours (rather than employment levels), captures the actualtotal labor demand adjustment (comprising both margins) reasonably well. In fact, we show that theGerman labor market performance was very much in line with past reaction to output changes as far aschanges in total hours worked are concerned.
2

2 The German Labor Market during the Crisis
The German labor market performance has received considerable attention since the onsetof the 2008-09 economic crisis. Figure 1 illustrates the unique adjustment patterns inGermany by contrasting the evolution of output and employment against those observedin the United States.
Figure 1: Labor market adjustments: Germany vs. US
92
93
94
95
96
97
98
99
100
101
102
92 93 94 95 96 97 98 99 100 101
GDP relative to peak
Empl
oym
ent /
tota
l hou
rs re
lati
ve t
o pe
ak
q0 (peak)
q6
q7
q7
q6
DEU
USA
solid lines: employment
dashed lines: total hours worked
Source: OECD National Accounts database and Eurostat labor market statistics. Notes: Q0 is the
quarter when GDP peaked (2007Q4 for US and 2008Q1 for Germany), and each data point refers to
consecutive quarters since then.
During the recent economic crisis, Germany su¤ered particularly sizable output lossesof almost 7 percent since GDP peaked in 2008Q1. Yet employment levels, as shown bythe black solid line, remained practically unchanged, suggesting an unusually low Okun�scoe¢ cient value. Nonetheless, Figure 1 shows that the crisis did have a signi�cant e¤ecton the German labor market. Up until 2009Q2, hours worked per employee (as wellas total working hours in the economy) had declined by 4 percent (black dashed line).
3

Hence, on aggregate, the adjustments materialized exclusively at the intensive margin (thedi¤erence between the solid and the dashed lines). In contrast to the German situation,US employment dropped by almost 5 percent despite a smaller drop in GDP (grey solidline). Most of the adjustment happened along the extensive margin, whereas working-hour reductions along the intensive margin accounted for only around one third of thedrop in total hours worked (grey dashed line).
The speci�c adjustment witnessed in Figure 1 is partly the result of possibilities andconstraints induced by labor market conditions and institutions (see, e.g., Möller (2010),Eichhorst et al. (2010), OECD (2010)). In the German context the government-supportedshort-time working scheme (Kurzarbeit) has tended to receive most of the attention. Yetwhile a substantial share (around 25 percent) of working-time reductions during the crisisto date can indeed be directly attributed to this programme, other factors were moreimportant on aggregate. The greatest reductions, accounting for more than one third ofrecorded changes in total hours worked, were due to opening clauses in collective agree-ments, which allowed temporary reductions in weekly working hours (and earnings), or toso-called �pacts for employment and competitiveness�between employers and employees(Bellmann et al. (2008)). In addition, working-time accounts or �time banks�, as well assubstantially reduced overtime, account for around 20 percent each (Bach & Spitznagel(2009)).
In our analysis we set up a framework which is general enough to comprise boththe intensive and extensive margin. This allows us to simulate two polar scenarios ofadjustment which come close to the contrasted situations depicted in Figure 1. This willbe described in the following section.
3 Empirical Approach
To study the short-term e¤ects of a large output shock on employment and income, wederive the likely patterns of demand-side adjustments using own labor-demand estima-tions. We assume a �right-to-manage�setting, with employment and hours chosen by the�rm. Wages are �xed in the short term and labor inputs are the only margins of adjust-ment for �rms (capital is constant). The labor-demand model is estimated on matchedemployer-employee data for Germany. In a second step the demand-side model is linkedto household-level data, and tax/bene�t simulations are conducted in order to derive thedistributional consequences. In our approach the macro level output shocks are not de-rived from a stylized CGE-type of model but correspond directly to the observed changes
4

per industry for the years 2008-09.3 We ignore longer-term changes in prices and wages,which is justi�ed in the German case, since wage adjustments were not a primary chan-nel for reducing labor costs during the downturn (Collective Agreement Archive (2009),Bellmann & Gerner (2011)). Instead we focus on short-term labor-demand adjustments,which are the most immediate driver of household income losses during a labor marketdownturn. Before proceeding with the distributional analysis in Section 4, this sectionpresents details on data sources and labor-demand estimations.
3.1 Data
The demand model relies on a high-quality linked employer-employee dataset (LIAB)from the Institute for Employment Research (IAB) in Nuremberg, Germany, (see Aldaet al. (2005) for more information on the dataset and von Wachter & Bender (2006)for a recent application). The �rm component of the LIAB is the IAB EstablishmentPanel (Kölling (2000)). The term �establishment�refers to the fact that the observationunit is the individual plant, not the �rm. The Establishment Panel is a representative,strati�ed, random sample including establishments with at least one worker for whomsocial contributions were paid. Information on employment levels and changes, sta¤quali�cations, investment as well as industry a¢ liation and output are used.The employee data correspond to the employment statistics of the German Federal
Employment Agency (Bundesagentur für Arbeit) and are drawn from administrative re-cords comprising all employees paying social security taxes or receiving unemploymentbene�ts (see, e.g., Bender et al. (2000)). The dataset covers about 80 percent of Germanemployees in the private sector. The entire public sector is excluded, as civil servants arenot observed in the social security data. Information recorded in the data include employ-ees�histories on daily wages, age, seniority, schooling, training, occupation, employmenttype (full-time, part-time or irregular employment), industry and region.Data from the employee history are linked with the establishment sample year-by-year
using a plant identi�er. Since the uni�ed sample for East and West Germany exists onlysince 1996, we focus on the period 1996-2007. We select establishments with at least 10employees, in order to be able to identify substitution patterns between di¤erent types ofworkers. In total our resulting sample consists of 37; 958 establishment-year observations.The number of establishment-years is 19; 520 in manufacturing (51 percent of the total),5; 035 in construction (13 percent), 1; 847 in transport and communications (5 percent),10; 956 in services (29 percent) and 600 in �nancial services (2 percent).
3The method we suggest is rather general. It can also be applied as a tool for ex ante policy responseanalyses if one uses projections of output changes (instead of actual ones) in order to analyze forward-looking counterfactual scenarios.
5

For the distributional analysis we use the German Socio-Economic Panel (SOEP), arepresentative survey of the entire German population with around 25; 000 sample indi-viduals living in more than 10; 000 households per cross-section (see Wagner et al. (2007)).For the present paper we utilize information on labor market status, gross wage, job type,bene�ts, industry, working time, household composition, age, education levels and housingcosts. We use the 2008 wave, which contains labor market information for the year 2007,in particular hours worked and wages.4 In order to make the information consistent withthe distributional analysis using policy parameters as of January 1, 2009, we use a staticageing technique, which allows us to control for changes in global structural variables aswell as income adjustments that di¤erentiate by income components (see Gupta & Kapur(2000)). We restrict the sample to the same industries as in the LIAB, but include theunemployed. This yields 5; 532 households and 9; 218 individuals.To calculate net incomes and �scal e¤ects, we link the data to the tax and bene�t
simulation model of the Institute for the Study of Labor, IZAMOD (see Peichl et al.(2010)). IZAMOD contains a tax-bene�t calculator comprising all relevant featuresof the German tax and bene�t system, such as income taxation and social insurancecontribution rules, as well as unemployment, housing and child bene�ts.5 We make useof the population weights available in SOEP. The results are therefore representative ofthe German population. Using the simulated tax and bene�t payments, we can computedisposable income for each household.
3.2 Labor-demand Model
We estimate a structural labor-demand model on the LIAB data. For our purposes it isessential to adopt a micro rather than a macro approach for mainly two reasons. Firstly,the explicit goal of our contribution is to assess the consequences of output changes onthe demand for narrowly de�ned groups of workers. This implies that we have to accountfor substitution patterns between di¤erent labor inputs at the �rm level. Secondly, macromodels of labor demand produce unbiased results only under quite restrictive assumptionswith regard to employment adjustments (see Bresson et al. (1992)).Following standard practice, we adopt the dual approach by assuming a constant
output, specifying a cost function and using Shephard�s lemma to derive the labor-demandfunctions (Hamermesh (1986, 1993) and Bond & Van Reenen (2007)). We opt for aGeneralized Leontief speci�cation as proposed by Diewert (1971), which is a linear second-
4As explained in the introduction, it is precisely the lack of rapid microdata production that justi�esour approach.
5Note that IZAMOD also has a behavioral module allowing for the simulation of labor supplyreactions, which is not used in this application.
6

order approximation to any arbitrary cost function. Importantly, it does not restrictthe substitution elasticities of input factors. We follow the speci�cation of Diewert &Wales (1987) and take a short-term perspective, assuming capital to be �xed (or perfectlyseparable from labor inputs). We also allow for non-constant returns to scale, which isimportant in the context of our study, since the output elasticities are not restricted toequal unity.For a given �rm there are i = 1; :::; I labor inputs corresponding to the cells we de�ne
below. We ignore �rm and time indices to clarify notations. We write C, the short-termlabor costs of a �rm, as follows:
C =P
i �iwi +P
i
Pj �ijw
0:5j w
0:5j Y +
Pi(�Y Y iwi)Y
2; (1)
with Y the �rm-speci�c output and wi the wage of labor group iThe symmetry condition�ij = �ji, 8i; j, is the only restriction imposed on the coe¢ cients. Di¤erentiating C withrespect to wages wi yields the factor demandsXi, and dividing by Y gives the input-outputratio:
Xi=Y = �ii +P
j 6=i �ij
�wjwi
�0:5+ �i
1
Y+ �Y Y iY; (2)
which is the basis of our labor-demand estimation. Since we are analyzing the comparative-static e¤ect of output shocks, our main measure of interest is the output elasticity of input(labor) demand, which is written as:
�iY =@Xi
@Y
Y
Xi
= 1� �iXi
(3)
3.3 Estimation
The detailed administrative data allow us to distinguish I = 12 labor inputs per industry.We di¤erentiate between two skill/education levels, three age groups and two categoriesof employment contract. Skilled workers hold a university, polytechnical or college de-gree or have completed vocational training. Age groups are de�ned as 15-29 (young),30-54 (middle-age) and 55-64 (old). We di¤erentiate between full-time workers and a�non-standard�employment type category comprising both part-timers and irregular em-ployment (short-term employment, temporary workers and those in marginal employmentreferred to as Mini/Midijob in Germany). We estimate input-output ratios separately for
7

the �ve industries (manufacturing, construction, trade and communications, services and�nancial sector), which gives 5� 12 = 60 di¤erent cells for the distributional analysis.There is clearly no complete congruence, and possibly a trade-o¤, between the de�ni-
tion of labor inputs used for the purpose of labor-demand estimation on one hand and adisaggregated cell de�nition for precise distributional analyses on the other. We feel thatthe choice made here presents a reasonable balance. In particular, skill and age/experiencegroups constitute di¤erent types of productive factors for �rms and also correspond togroups exposed to di¤erent risks of unemployment or working-time adjustments during alabor market downturn. One may wish more disaggregation for the distributional analysis(e.g., gender, migrants) but this would be more di¢ cult to justify in terms of labor-inputdi¤erentiation. The output variable used for estimating the model is de�ned as busi-ness volume excluding intermediate inputs. For the �nancial sector we instead measure�output�as balance sheet total (banking) and total premiums paid (insurances).We specify our labor-demand model with respect to total working hours� exploiting
establishment level working-time information. This setup therefore captures changes inboth employment (heads) and work intensity (hours) and implicitly assumes perfect sub-stitutability between the two adjustment margins. To the best of our knowledge, an hoursspeci�cation at the micro level is unique. Most of the related studies estimating demandsystems rely on the textbook head-count speci�cation. A few other papers specify theirmodel in terms of hours by appending working-hours measures to the data (see Hamer-mesh (1993)), but due to a lack of �rm-level information, such working-hours measuresnormally rely on semi-aggregate averages (in most cases at the industry level) at a givenpoint in time (see Freier & Steiner (2010) for a recent example). Our micro approach isset up as follows: we �rst extract average full-time working hours at the establishmentlevel directly from LIAB data. At this point we only have information on average full-timehours for a speci�c establishment in a certain year. We then extract mean working hoursfor each cell from the SOEP data. After which, we retrieve SOEP information on averagefull-time hours by industry and year, mirroring the available LIAB data. In a fourth stepwe calculate ratio of SOEP cell-speci�c working hours and SOEP industry-year full-timeaverages, which we �nally apply to the LIAB data to construct a �nely grained workinghours distribution across our labor-demand cells in each establishment and year.For the estimation we add two linear terms to the equations (2). We include time
dummies to capture time trends as well as potential policy or business-cycle e¤ects, andadd disturbance terms "i for the i = 1; ::; 12 inputs in each industry. The disturbancevector f"1; :::; "12g is assumed to be multivariate and normally distributed, with meanvector zero and constant covariance matrix . The system of 12 equations per industry isestimated using the Seemingly Unrelated Regression (SUR) proposed by Zellner (1962).
8

SUR �rst employs equation-by-equation OLS to obtain the covariance matrix of the errorterms, . A Feasible Generalized Least Squares estimation on the full system, condi-tional on , is then conducted. Thus, SUR allows error terms to be contemporaneouslycorrelated across regressions and is more e¢ cient than separate OLS estimations.It is useful to check the predictive power of the model. In Figure 2 we plot yearly
relative changes in total hours worked as reported in the LIAB data against changes aspredicted by the model for each industry over the period 1996-2007.6 Predicted changesin working hours are derived by multiplying the industries� output elasticities by theindustry-speci�c aggregate output change. With the exception of the �nancial sector, thegraphs show the predictions to be rather accurate. This is reassuring with regards tothe estimated model and provides con�dence that using employment reaction to outputchanges over the entire period results in good approximations of employment changes inspeci�c time periods.Table 1 presents output elasticities of labor demand. For readability we present average
elasticities for broader input groups in this table. Complete results for all 60 cells arereported in Table 8 in the appendix. All group elasticities are positive� as predicted bytheory. The average output elasticity across all cells is 0:64, which is well in line with otherstudies determining employment reactions to output shocks (normally output elasticitieslie in [0:5; 0:9], see e.g., Brechling & O�Brien (1967), Fay & Medo¤ (1985) or Card (1986)).The results suggest that across all sectors unskilled employees are hired more quickly ina boom and �red faster during a recession. Output elasticities of young and, especially,older workers are also above average. As expected, those on non-standard employmentcontracts are more likely to be a¤ected by output changes than regular (�full-time�)employees.
6Note that we could not use any observations for the �nancial sector for the years 2006 and 2007because the LIAB output measure for these industries changed as of 2006.
9

Figure 2: Predictive power
-20
020
40
1995 2000 2005 2010year
manufacturing
-20-
100
1020
30
1995 2000 2005 2010year
construction
-40
-20
020
40
1995 2000 2005 2010year
traffic & trade
-20
020
4060
80
1995 2000 2005 2010year
service
-100
010
0200
3004
00
1995 2000 2005 2010year
financial sector
-20
020
40
1995 2000 2005 2010year
total
in %Changes in total hours worked
observed predicted
Source: Observed hours form the LIAB, predicted hours calculated using LIAB output data and
estimated elasticities.
Table 1: Output elasticitiesGroup Man Con Tra Ser Fin TotalSkilled 0.57 0.45 0.79 0.62 0.94 0.59Unskilled 1.05 0.5 1.02 0.99 1.02 0.96Young 0.74 0.55 0.02 0.72 0.87 0.68Middle-age 0.62 0.41 0.92 0.61 0.96 0.61Old 0.75 0.61 1.04 0.99 0.94 0.82Full-time 0.65 0.43 0.80 0.63 0.95 0.63Non-standard 0.68 0.93 1.23 0.97 0.92 0.83Total 0.65 0.46 0.83 0.67 0.94 0.64
Source: Own calculations using the LIAB. Notes: All numbers are averages weighted by the number of
total hours in the respective cells. Man = Manufacturing, Con = Construction, Tra = Transport &
Communications, Ser = Services, Fin = Financial Services.
10

4 Employment and Distributional E¤ects
We now model the impact of the crisis, �rst on employment using the labor-demandmodel, then on household income distribution by feeding the predicted employment ef-fects into the SOEP data. Our reference period for the output shock (and subsequentemployment/distributional changes) is the period 2008-09, which corresponds to the re-cent downturn period in Germany.
4.1 Output Shocks and Predicted Employment E¤ects
Results are summarized in Table 2. The top panel reports changes in o¢ cial outputaggregates and employment by industry over the crisis period. Output, as measuredby value added for each industry from German national accounts, dropped in all of theshown industries. Overall, the German economy shrunk by 5 percent over this period.In the selected sample of industries, value added declined by even more (8 percent).7 Inparticular, the decline in manufacturing output, a slump of 18 percent, is noteworthy.Employment changes are shown in headcounts (employment levels) as well as total
hours worked, accounting for adjustments along both the extensive and intensive margin.It is evident that the output shock did result in sizable labor-demand e¤ects overall. Yetthere is a considerable di¤erence between the margins of adjustment. While changes inemployment levels are minimal, total hours worked dropped substantially over a relativelyshort period of time, with a very large drop of about 10 percent in the manufacturingsector.The bottom panel of Table 2 shows changes in total hours worked across industries and
for di¤erent groups of workers as predicted by the labor-demand model. For the predictionwe multiplied reported industry output changes with the corresponding output elasticitiesof labor demand in each of the 60 cells. As we have chosen a �total hours�speci�cation,our predictions are conceptually comparable to the o¢ cial changes in total working hoursshown in the top part of the table. Our predictions capture the overall changes well�both quantitatively and qualitatively. This match is reassuring in terms of the externalvalidity of the estimated model and validates our implicit assumption that past elasticitiesprovide a good approximation of present labor market responses. The correspondencebetween predicted and observed working-hours changes is also an important �nding: itsuggests that, despite its magnitude, the downturn in Germany has not resulted in astructural break of �rm behavior. Only in the transport and communications sector do weoverestimate the labor-demand reaction (possibly explained in part by stimulus spending
7The di¤erence is mostly due to the public sector, where value added actually increased during thecrisis period.
11

Table 2: Output shocks and actual vs. predicted hours adjustmentsMan Con Tra Ser Fin Total
O¢ cial statisticsOutput (value added, price adjusted)
2008 496.4 78.8 130.5 949.6 76.1 1731.32009 406.2 77.7 119.2 917.6 74.9 1595.6% change -18 -1 -9 -3 -2 -8
Employment levels (in 1000 workers)2008 7352 1741 2079 12420 1045 246372009 7163 1746 2067 12415 1042 24433% change -3 0 -1 0 0 -1
Total hours worked (in millions)2008 10383 2680 3015 15827 1483 333872009 9352 2630 2915 15401 1457 31754% change -10 -2 -3 -3 -2 -5
PredictionsTotal hours worked (% change)
Total -12 -1 -7 -2 -2 -7Skilled -10 -1 -7 -2 -2 -6Unskilled -19 -1 -9 -3 -2 -11Young -14 -1 0 -2 -1 -8Middle-age -11 -1 -8 -2 -2 -7Old -14 -1 -9 -3 -2 -9Full-time -12 -1 -7 -2 -2 -7Non-standard -12 -1 -11 -3 -1 -8
Sources: Value added from the German National Accounts (constant prices, chain-linked index, 2000 =
100). O¢ cial employment statistics from the Institute for Employment Research. Predictions are based
on the LIAB. Notes: Man = Manufacturing, Con = Construction, Tra = Transport & Communications,
Ser = Services, Fin = Financial Services.
bene�ting this sector). Moreover, the table suggests that di¤erent types of workers area¤ected di¤erently, with old, unskilled and non-standard workers su¤ering the most.
4.2 Cell Identi�cation and Shock Scenarios
We now feed the predicted employment shocks for each cell into the SOEP, a representativemicro dataset often used for distributional analyses. The SOEP is informationally richand allows us to di¤erentiate by skill, age, employment group and industry, just as we didin the linked employer-employee data. Table 3 provides an overview of selected workercharacteristics for both the LIAB and SOEP datasets. The table reveals that althoughgeneral socio-demographic characteristics such as gender or nationality di¤er, the two
12

datasets compare well as far as the dimensions of our cells are concerned. In particular,the age and employment-type distributions are almost identical.
Table 3: Worker characteristics, wave 2007General LIAB SOEPObservations (persons) 1,828,126 9,218Share of women 38.3 44.4Share of foreigners 5.4 16.0Share of working in East 20.6 16.2
Skill distributionShare of skilled 85.9 91.0Share of unskilled 14.1 9.0
Age distributionShare of young 17.9 18.4Share of medium-aged 67 68.2Share of old 15.1 13.4Mean age 41.8 41.6
Job distributionShare of full-timers 73.4 72.9Share of part-timers 26.6 27.1
Source: Own calculations using the LIAB and the SOEP.
The labor-demand model is speci�ed in terms of total hours and hence accounts foradjustments at both the extensive and intensive margin. Yet the model cannot predictwhich margin is used by a particular �rm or sector. Thus, we must suggest concrete scen-arios of labor market adjustments to translate total hour changes into income changes atthe cell level. Since actual labor-input adjustments during the 2008-09 crisis were mainlyalong the intensive margin in Germany, we �rst suggest a scenario where adjustmentsexclusively materialize as a change in worked hours (e.g., a switch from full-time to part-time employment). We simply change working hours proportionally in line with the totalchange in labor demand at the cell level, holding employment levels constant.In a second polar case we suggest a scenario where the same total hours adjustments
only occur at the extensive margin through layo¤s. That is, adjustments consist in changesin employment rates at the cell level. If the predicted change in labor demand for a givencell is �X%, we randomly draw X% of workers within the SOEP cell and make themunemployed. This second scenario is closer to the adjustment pattern seen in countrieswhere layo¤s were more important than changes in average hours worked.We feel that these two scenarios provide interesting counterfactuals for the distribu-
13

tional and �scal impact of the labor market downturn, which highlight the role of theadjustment margin in shaping distributional outcomes and correspond reasonably well tothe adjustment patterns observed in Germany and the United States. It is likely, however,that the di¤erences between the distributional e¤ects of our stylized scenarios provide up-per bound estimates. First, adjustments will generally take place along both the intensiveand the extensive margins. On a more technical level, we abstract from the facts thatworking-hours reductions will not be uniform within each cell and that unemploymentrisks within cells will not be evenly distributed. However, in the context of our distri-butional analysis, the random draw will have no noticeable impact as cell de�nitions arealready disaggregated.8
4.3 Distributional and Fiscal Impacts
The distributional analysis is based on SOEP data before and after the two scenarios oflabor-demand adjustment. We denote by �Base� the pre-crisis (baseline) situation, by�Intensive�the post-crisis scenario resulting from adjustments along the intensive marginonly, and by �Extensive�the post-crisis scenario resulting from extensive-margin adjust-ments. Income distribution measures are based on household total income equivalizedusing the �modi�ed OECD� scale. Capturing the household context (family size andcomposition) is of course a principal reason for performing the distributional analysis onSOEP-type data rather than using the worker-based LIAB directly.
Income and hours changes. We examine the distributions of both gross and netincomes in order to capture the cushioning e¤ect of the tax-bene�t system. We assumepolicy parameters as of January 1, 2009.9 Table 4 shows large working-hours changes forworkers in the manufacturing industry mirroring the predicted labor-input adjustmentsreported in Table 2.10 Gross earnings follow changes in total working hours. They are
8For instance, in the case of the extensive scenario, any non-random modeling attempt would, in fact,run into di¢ culties, as it would have to utilize characteristics (such as age, education) that are similarto the ones used to distinguish cells. Also note that some intermediary scenarios based on more realisticcombinations of the intensive and extensive margins could be suggested but would require additionalassumptions. We keep this work for future research.
9It is important to note that net income calculations do not account for bene�ts (Kurzarbeitergeld)paid through the short-time working programme (Kurzarbeit), as our data do not allow us to identify thelikely recipients of these bene�ts. This is relevant when considering the distributional e¤ects reported forthe �intensive�scenario below. While this provides a lower-bound for the incomes of many of the workersa¤ected by reduced working hours, recall that the large majority of working-hour reductions in 2009 (75percent) were not on account of Kurzarbeit.
10Note that because the sampling frames for the SOEP and LIAB data are di¤erent and predictionsfrom the demand model have been applied cell-by-cell to the SOEP, total working-hour changes byindustry do not match exactly.
14

not the same, however, since working hours are shown at the individual level, whereasincomes are measured on an �equivalized�household basis and, hence, are also a¤ectedby the incomes of other family members. This is also why incomes can change for thenon-employed and why relative changes in (household) earnings can exceed changes in(individual) working-hours reductions. Across industries it is, in particular, unskilledworkers who are found to su¤er the greatest earnings losses. The net incomes of youngindividuals also decline sharply. Average losses are even larger than for the older age-group, despite the earlier �nding in Table 2 that older workers are somewhat more likelyto face job loss or working-time reductions than young workers. One reason is that olderworkers are more likely to be living with a partner whose income partly shields them froma drop in household incomes.It is striking that the net income e¤ects are more sizable in the intensive scenario.
This is because hours in the intensive scenario are equally reduced for everybody who isworking in a speci�c cell. Hence, every worker in this cell su¤ers an equal, but relativelysmall, income losses. Tax burdens also decline for these workers, which is why incomelosses are smaller on a net basis than before taxes. In the extensive scenario certainworkers are laid o¤� resulting in a sharp drop of their gross income. On top of reducedtax burdens, a considerable part of the earnings loss tends to be o¤set by an entitlementto unemployment bene�ts. Consequently, the income cushioning e¤ect of the tax-bene�tsystem is larger than under the intensive scenario, and the di¤erence between net andgross income changes is more sizable as a result. Note that these e¤ects also operatefor non-employed individuals, who can be sharing a household with job losers entitled tounemployment bene�ts.Comparing changes in gross and net income gives some indication of the e¤ectiveness
of social safety nets at absorbing some of the income loss. The income of low-skilledworkers is likely to be relatively close to the level of minimum-income bene�ts. Safety-netbene�ts, therefore, absorb a large part of their earnings losses on average resulting inlarge di¤erences between gross and net earnings changes. Re�ecting the 400/800 euroceiling on monthly earnings in the German Mini/Midijob programme, the wages of manyworkers in the �non-standard�category are also especially low. However, these jobs areparticularly attractive for second earners. Because of their higher-earning partners, theyare then less likely to receive means-tested bene�ts when losing all or part of their ownearnings.
Income distribution. Table 5 presents changes of incomes and working hours bydecile groups. Interestingly, relative net income losses in the �intensive�scenario are verysimilar from deciles 4 to 10. Perhaps even more strikingly, the lowest two decile groups
15

Table 4: Relative change in earnings and hours for working-age individuals and familymembers (by group, in %)
Intensive ExtensiveGross Net Hours Gross Net Hours
Skilled -3.6 -2.4 -3.3 -3.6 -2.2 -3.3Unskilled -6.6 -3.4 -6.3 -6.6 -2.7 -6.3Young -3.6 -2.7 -3.6 -3.6 -2.4 -3.6Middle-age -3.8 -2.2 -3.0 -3.9 -2.0 -3.1Old -3.5 -1.8 -3.3 -3.6 -1.7 -3.4Full-time -3.6 -2.6 -3.4 -3.6 -2.3 -3.4Non-standard -4.7 -2.7 -4.6 -4.7 -2.4 -4.6Non-employed -4.3 -1.7 . -4.2 -1.2 .Manufacturing -9.4 -7.0 -11.2 -9.2 -6.2 -11.2Construction -1.3 -0.9 -0.7 -1.3 -0.8 -0.8Transport-Comm -6.3 -4.2 -7.0 -6.4 -3.8 -7.1Services -2.8 -1.8 -2.2 -3.0 -1.8 -2.3Financial -2.4 -1.8 -1.5 -2.4 -1.5 -1.5Total -3.7 -2.5 -3.5 -3.7 -2.2 -3.5
Source: Own calculations using the SOEP and IZAMOD. Notes: Incomes are equivalized (modi�edOECD scale), working hours are shown on an individual basis.
experience the smallest net income changes� showing the e¤ectiveness of the bene�t sys-tem. A somewhat similar picture emerges if labor-demand adjustments take place entirelythrough layo¤s. Once again, net income losses tend to be less severe than in the intensivescenario. This is not the case, however, for the �rst two decile groups. The reason is thatthose at the bottom of the income distribution tend to be entitled to means-tested bene�ts,which ensure that net incomes at the very bottom change very little in both the intensiveand extensive scenarios. As a result, whether or not those a¤ected by earnings lossesare entitled to unemployment bene�ts makes little di¤erence, and net income changesfor the two scenarios are more similar for the bottom two deciles than for middle-classhouseholds.
Distributional measures. Table 6 reports a range of global distribution meas-ures (Gini, General Entropy, inter-decile ratio), as well as absolute and relative povertyheadcount (Foster-Greer-Thorbecke: FGT0) and poverty intensity (FGT1, FGT2). Ascustomary the poverty line is de�ned as the 60 percent of median income. Consistentwith the results by income deciles, overall inequality is reduced in the �intensive�scen-ario. The income distribution is compressed, as parts of the working population su¤erincome losses, while the net incomes of the non-employed change less. In the �extensive�
16
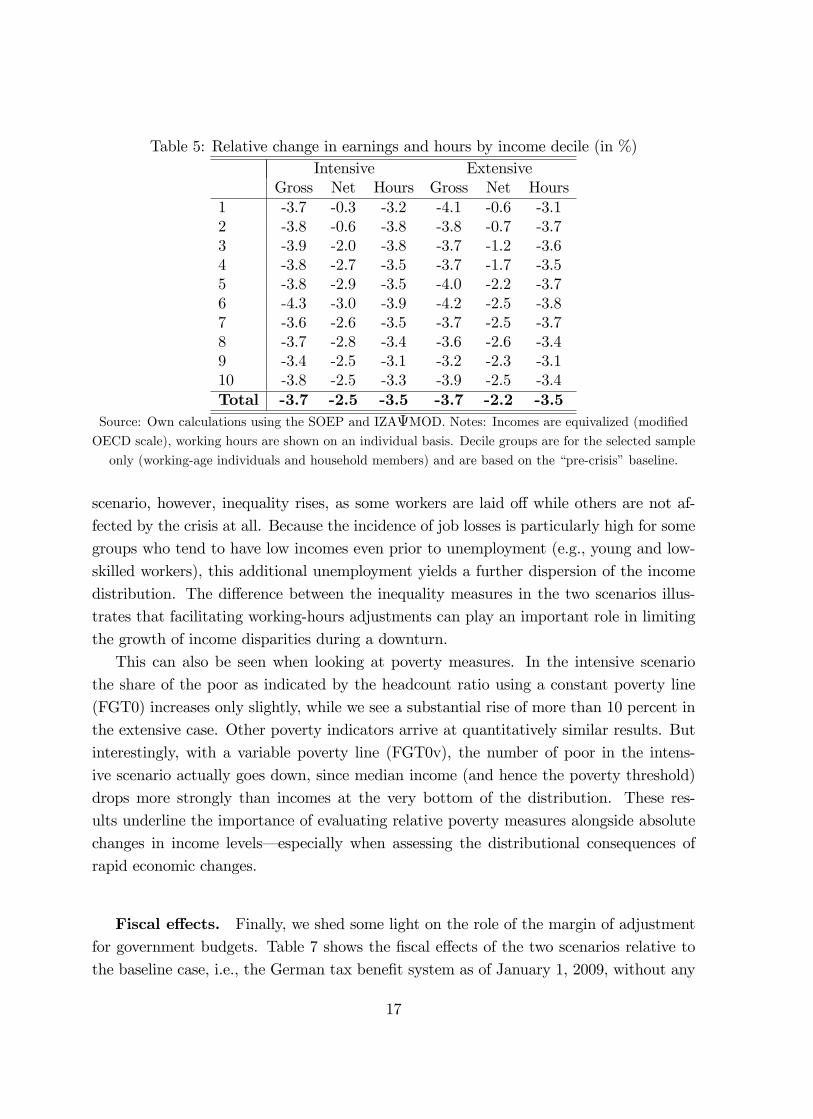
Table 5: Relative change in earnings and hours by income decile (in %)Intensive Extensive
Gross Net Hours Gross Net Hours1 -3.7 -0.3 -3.2 -4.1 -0.6 -3.12 -3.8 -0.6 -3.8 -3.8 -0.7 -3.73 -3.9 -2.0 -3.8 -3.7 -1.2 -3.64 -3.8 -2.7 -3.5 -3.7 -1.7 -3.55 -3.8 -2.9 -3.5 -4.0 -2.2 -3.76 -4.3 -3.0 -3.9 -4.2 -2.5 -3.87 -3.6 -2.6 -3.5 -3.7 -2.5 -3.78 -3.7 -2.8 -3.4 -3.6 -2.6 -3.49 -3.4 -2.5 -3.1 -3.2 -2.3 -3.110 -3.8 -2.5 -3.3 -3.9 -2.5 -3.4Total -3.7 -2.5 -3.5 -3.7 -2.2 -3.5
Source: Own calculations using the SOEP and IZAMOD. Notes: Incomes are equivalized (modi�edOECD scale), working hours are shown on an individual basis. Decile groups are for the selected sample
only (working-age individuals and household members) and are based on the �pre-crisis�baseline.
scenario, however, inequality rises, as some workers are laid o¤ while others are not af-fected by the crisis at all. Because the incidence of job losses is particularly high for somegroups who tend to have low incomes even prior to unemployment (e.g., young and low-skilled workers), this additional unemployment yields a further dispersion of the incomedistribution. The di¤erence between the inequality measures in the two scenarios illus-trates that facilitating working-hours adjustments can play an important role in limitingthe growth of income disparities during a downturn.This can also be seen when looking at poverty measures. In the intensive scenario
the share of the poor as indicated by the headcount ratio using a constant poverty line(FGT0) increases only slightly, while we see a substantial rise of more than 10 percent inthe extensive case. Other poverty indicators arrive at quantitatively similar results. Butinterestingly, with a variable poverty line (FGT0v), the number of poor in the intens-ive scenario actually goes down, since median income (and hence the poverty threshold)drops more strongly than incomes at the very bottom of the distribution. These res-ults underline the importance of evaluating relative poverty measures alongside absolutechanges in income levels� especially when assessing the distributional consequences ofrapid economic changes.
Fiscal e¤ects. Finally, we shed some light on the role of the margin of adjustmentfor government budgets. Table 7 shows the �scal e¤ects of the two scenarios relative tothe baseline case, i.e., the German tax bene�t system as of January 1, 2009, without any
17

Table 6: Inequality and poverty measures and relative changeBase Intensive ExtensiveNet Net � (in%) Net � (in%)
Gini 0.324 0.323 -0.385 0.330 1.637GE0 0.176 0.174 -1.193 0.181 2.972GE1 0.197 0.197 -0.161 0.203 3.079P9010 4.251 4.175 -1.807 4.307 1.304FGT0 0.205 0.213 3.588 0.229 11.653FGT1 0.048 0.050 2.142 0.054 12.388FGT2 0.019 0.020 4.289 0.023 19.085FGT0v 0.205 0.195 -5.067 0.214 4.516
Source: Own calculations using the SOEP and IZAMOD. Notes: Measures are based on equivalizeddisposable incomes (modi�ed OECD scale) and refer to the selected sample only (working-age
individuals and household members). The poverty line is set at 60 percent of median income (of the
total population) and is either constant, using the baseline median (FGT0, FGT1, FGT2), or varies,
using the median of each scenario (FGT0v).
crisis-related employment changes. As one would expect, both scenarios result in a highlynegative e¤ect on the government budget. Tax revenue and social insurance contributions(SIC) decrease, as labor earnings drop for those employees a¤ected by the crisis. It isinteresting to note the di¤erences between the two scenarios in terms of taxes and SIC. Inthe intensive case the proportional reduction in combination with the progressive incometaxation and regressive SIC yields higher relative tax revenue reductions. In the extensivescenario employment reductions are highest in the middle part of the income distribution(cf. Table 5), where SIC payments are higher than tax liabilities. As the highly progressiveGerman income tax is concentrated at the top (with the top 10 percent paying more than55 percent of the income tax revenue), the reduction in tax revenue is relatively lowerthan the decrease in SIC. Due to higher bene�t expenditures, the �scal consequences ofthe extensive scenario are, however, substantially more severe (bene�t payments increaseby 6 percent). In total, the government�s budget decreases by 7 percent in this case.This yields an eventual shortfall which is approximately 3 billion euros higher than in theintensive scenario, given our considered population sample.11
11In a back-of-the-envelope calculation one could argue that the German short-term working schemewas an e¢ cient investment for the initial phase of the crisis� costing a similar amount (3 billion euros peryear)� encouraging reductions in total working hours and thus keeping many employees in the workforce.
18

Table 7: Fiscal e¤ectIntensive Extensive
Changes in billion euros in % in billion euros in %Tax revenue -5.6 -4.2 -3.0 -2.3Social insurance contributions -5.4 -3.2 -6.3 -3.8Bene�t payments -1.0 1.1 -5.3 5.9Total budget e¤ect -11.9 -5.7 -14.6 -7.0
Source: Own calculations using the SOEP and IZAMOD. Notes: Percentage changes refer to eachcategory (ex: tax revenue goes down by 4.2 percent in intensive scenario)
Discussion. A principal result of the analysis is that sharing earnings losses in adownturn among larger groups of workers can produce less inequality� and lower imme-diate �scal costs� than widespread layo¤s. In general, the distributional advantages ofachieving capacity adjustments through working-hours reductions, rather than layo¤s, aregreater in countries with lower automatic stabilizers, i.e., with less generous unemploy-ment bene�ts and lower average tax burdens than Germany. In this respect, our resultscon�rm the claim that the distributional distortions of the US labor market� experiencingmassive layo¤s while having a much less redistributive tax and bene�t system� have beenparticularly severe.Yet the question remains whether countries should adopt a strategy of working-time
reductions to minimize layo¤s. The answer depends largely on the nature of the labor mar-ket downturn and on the speci�c initial conditions (such as the structure of the economyor labor market institutions) in each country. In Germany conditions for working-hoursreductions were, in many respects, ideal. First, the greatest output losses were su¤ered inthe export-oriented manufacturing industry. Firms in this sector had both the motivationand the �nancial resources to retain valuable skilled workers during a temporary periodof severely reduced output demand. Second, the output shock was indeed temporary: ex-ternal demand for German manufacturing goods recovered; and the jobs of workers withreduced hours therefore remained viable after the downturn. Third, and as discussed inSection 2, policy developments prior to the downturn (especially working-time accountsand speci�c provisions in collective agreements), as well as policy responses to the crisis(e.g., the short-time working scheme, Kurzarbeit), had strongly facilitated working-hoursadjustments.On the other hand, this type of measure, which protects existing jobs, tends to re-
inforce employer incentives to hoard highly educated or experienced workers, while lessattractive jobs may be cut more quickly (Hijzen & Venn (2011), Cahuc & Carcillo (2011)).In other words, working-hours adjustments may in fact worsen the relative position ofpoorly protected low-skilled and non-standard workers, who were shown to be particu-
19

larly likely to su¤er earnings losses in a downturn. This is likely to be a concern in highlysegmented labor markets, e.g., in Spain (but also in Germany, where non-standard formsof employment have become more common).The speci�city of the output shock also has to be borne in mind, when assessing the
merits of exporting certain national policies to other countries. If the sectoral incidenceof output shock is di¤erent, labor hoarding might be much less bene�cial for �rms, andhence less widespread as a result. If, for instance, �rms in the a¤ected sector are severelycredit-constrained, they may have little choice but to lay o¤ workers. More importantly,lower output demand may not be temporary as recessions are frequently accompanied bystructural changes. Policies that actively encourage �rms to delay layo¤s in these casescan be an obstacle to a necessary restructuring process and, hence, hold back economicrecovery.
5 Conclusion
In this paper we analyze the distributional and �scal impact of the 2008-09 crisis inGermany. We base our analysis on a disaggregated labor-demand model, which is justi�edby the fact that labor-demand changes are the principal driving factor of household incomelosses in the early phase of a labor market downturn. The predicted adjustments are thencombined with detailed household microdata to translate changes in individual earningsinto income changes at the household level. Thus, the method can be used before detailedincome data become available and can therefore aid timely policy responses to outputshocks.The choice of Germany is interesting, since, on the one hand, it su¤ered from a severe
output drop, which translated into a substantial labor market downturn� like many otherWestern countries. However, on the other hand, the adjustments occurred almost exclus-ively at the intensive margin, with employment levels and unemployment rates remainingunusually stable. This re�ects in part Germany�s policy measures before and duringthe crisis� facilitating labor-cost adjustments via working-hours reductions rather thanlayo¤s.
Our labor-demand model is �exible enough to capture the real-world demand reactionsfollowing the German recession well. At the same time, the approach enables us to assessthe distributional and �scal consequences� in particular with respect to the margin ofadjustment. More precisely, we propose two polar cases to assess the importance of thedi¤erent margins. The �rst scenario, close to the German experience, assumes that allemployment adjustments take place via such working-hour reductions. The second one
20

better re�ects the situation in countries such as the United States, Greece and Spain,where adjustments of employment levels were far greater.Our results show that low-skilled and non-standard workers faced above-average risks
of earnings losses, in particular if they worked in the manufacturing sector where outputreductions were very large. When examining the resulting income losses, it transpires,however, that automatic stabilization by the tax-bene�t system is e¤ective in cushioning asigni�cant share of the gross-income losses� especially among low-income groups (cf. alsoDolls et al. (2010)). As far as the margin of adjustment is concerned, we show that whilepromoting working-hour adjustments through work-sharing and other measures cannotprevent signi�cant income losses, it can be highly e¤ective in avoiding very large increasesin income poverty and �scal costs. In those two dimensions the German policy responsesto the crisis were successful.Nevertheless, the conditions for working-hours reductions in Germany were ideal, as
the output drop mostly occurred in the export-oriented sectors, where motivation tohoard skilled labor was high and �rms had the necessary �nancial resources to do so.We, therefore, argue that whether the German policy can be successful in other countriescrucially depends on initial conditions (especially the structure of the economy and labormarket institutions) as well as the speci�cities of the output shocks.From a methodological point of view, we use recent historical data to make inference
about the e¤ects of the current labor market downturn. The demand model providesan interesting �average� approximation of short-term e¤ects of output shocks. Yet in-stitutional changes over recent years may have a¤ected the demand for di¤erent groupsof workers in complicated ways, and the policies put in place during the crisis had theirown speci�c e¤ects. Hence, an important, but challenging, improvement would consist inexplicitly modeling policy institutions (such as Kurzarbeit) in the labor-demand estima-tion. Another obvious limitation is that the adopted short-term horizon goes along withthe assumption of constant wage levels. Although it would be worthwhile to model wagevariations by interacting labor demand and supply iteratively in order to attain equilib-rium (see e.g., Peichl & Siegloch (2010)), we have argued that this assumption is not toorestrictive in the context of our study, as wage reductions were not a primary response tothe labor market downturn in Germany.
21

A Appendix
Table 8: Output elasticities per cellCell values Man Con Tra Ser Fin
Sk/You/FT 0.67 0.42 -0.09 0.63 0.88
Sk/You/PT 0.96 -0.29 0.78 0.94 0.76
Sk/Mid/FT 0.53 0.45 0.85 0.52 0.96
Sk/Mid/PT 0.50 2.10 1.21 0.97 0.95
Sk/Old/FT 0.77 0.40 0.99 0.98 0.93
Sk/Old/PT 0.62 0.29 2.22 1.00 0.97
USk/You/FT 0.95 1.17 -0.20 0.99 1.10
USk/You/PT 0.99 0.89 0.95 0.96 0.95
USk/Mid/FT 1.15 -0.35 1.30 0.99 1.04
USk/Mid/PT 0.41 -0.32 1.26 0.99 1.00
USk/Old/FT 0.89 3.09 0.74 1.04 1.00
USk/Old/PT 0.25 0.36 -0.33 0.99 0.96
Source: Own calculations using the LIAB. Notes: (U)Sk = (Un)skilled, You=Young, Mid= Middle-age,
FT = full-time, PT = Part-timer and irregular employees.
References
Ahmed, V. & O�Donoghue, C. (2010). Global Economic Crisis and Poverty in Pakistan,International Journal of Microsimulation 3(1): 127�129.
Alda, H., Bender, S. & Gartner, H. (2005). European Data Watch: The Linked Employer-Employee Dataset Created from the IAB Establishment Panel and the Process-Produced data of the IAB (LIAB), Schmollers Jahrbuch: Journal of Applied SocialScience Studies 125(2): 327�336.
Bach, H.-U. & Spitznagel, E. (2009). Betriebe zahlen mit - und haben was davon, IABKurzbericht No. 17.
Bellmann, L., Gerlach, K. & Meyer, W. (2008). Company-Level Pacts for Employment,Journal of Economics and Statistics 228(5-6): 533�553.
Bellmann, L. & Gerner, H.-D. (2011). Reversed Roles? Wage and Employment E¤ects ofthe Current Crisis, Research in Labor Economics forthcoming.
Bender, S., Haas, A. & Klose, C. (2000). The IAB Employment Subsample 1975-1995,Schmollers Jahrbuch: Journal of Applied Social Science Studies 120(4): 649�662.
22
Bond, S. & Van Reenen, J. (2007). Microeconometric Models of Investment and Employ-ment, in J. J. Heckman & E. E. Leamer (eds), Handbook of Econometrics, Vol. 6,Elsevier, Amsterdam, chapter 65, pp. 4417�4498.
Bourguignon, F., Bussolo, M. & Pereira da Silva, L. (2008). The Impact of MacroeconomicPolicies on Poverty and Income Distribution: Macro-Micro Evaluation Techniquesand Tools, Palgrave-Macmillan, New York.
Bourguignon, F., Robilliard, A.-S. & Robinson, S. (2003). Representative Versus RealHouseholds in the Macro-Economic Modelling of Inequality, DIAL Document deTravail DT/2003-10.
Brechling, F. & O�Brien, P. (1967). Short-Run Employment Functions in ManufacturingIndustries: An International Comparison, The Review of Economics and Statistics49(3): 277�287.
Bresson, G., Kramarz, F. & Sevestre, P. (1992). Heterogeneous Labor and the Dynam-ics of Aggregate Labor Demand: Some Estimations Using Panel Data, EmpiricalEconomics 17(1): 153�168.
Cahuc, P. & Carcillo, S. (2011). Is Short-Time Work a Good Method to Keep Unemploy-ment Down?, IZA Discussion Paper No. 5430.
Card, D. (1986). E¢ cient Contracts with Costly Adjustment: Short-Run EmploymentDetermination for Airline Mechanics, American Economic Review 76(5): 1045�1071.
Collective Agreement Archive (2009). Tarifpolitik 2009 auf einen Blick, Informationenzur Tarifpolitik, Wirtschafts- und Sozialwissenschaftliches Institut der Hans-Böckler-Stiftung (WSI).
Diewert, W. E. (1971). An Application of the Shephard Duality Theorem: A GeneralizedLeontief Production Function, Journal of Political Economy 79(3): 481�507.
Diewert, W. E. & Wales, T. J. (1987). Flexible Functional Forms and Global CurvatureConditions, Econometrica 55(1): 43�68.
Dolls, M., Fuest, C. & Peichl, A. (2010). Automatic Stabilizers and Economic Crisis: USvs. Europe, NBER Working Paper 16275.
Eichhorst, W., Feil, M. & Marx, P. (2010). Crisis, What Crisis? Patterns of Adaptation inEuropean Labor Markets, Applied Economics Quarterly Supplement 56(61): 29�64.
23
Fay, J. A. & Medo¤, J. L. (1985). Labor and Output Over the Business Cycle: SomeDirect Evidence, American Economic Review 75(4): 638�655.
Ferreira, F. H. G., Leite, P. G., Pereira da Silva, L. A. & Picchetti, P. (2008). Can theDistributional Impacts of Macroeconomic Shocks Be Predicted? A Comparison ofTop-Down Macro-Micro Models with Historical Data for Brazil, in F. Bourguignon,M. Bussolo & L. A. Pereira da Silva (eds), The Impact of Macroeconomic Policieson Poverty and Income Distribution: Macro-Micro Evaluation Techniques and Tools,Palgrave-Macmillan, New York, pp. 119�175.
Freier, R. & Steiner, V. (2010). "Marginal Employment" and the Demand for Heterogen-eous Labour: Elasticity Estimates from a Multi-Factor Labour Demand Model forGermany, Applied Economics Letters 17(12): 1177�1182.
Gupta, A. & Kapur, V. (2000). Microsimulation in Government Policy and Forecasting,North-Holland, Amsterdam.
Hamermesh, D. S. (1986). The Demand for Labor in the Long Run, in O. Ashenfelter& R. Layard (eds), Handbook of Labor Economics, Vol. 1, Elsevier, Amsterdam,pp. 429�471.
Hamermesh, D. S. (1993). Labor Demand, Princeton University Press, Princeton.
Hijzen, A. & Venn, D. (2011). The Role of Short-Time Work Schemes During the 2008-09Recession, OECD Social, Employment and Migration Working Paper No. 115.
Hérault, N. (2010). Sequential Linking of Computable General Equilibrium and Mi-crosimulation Models: A Comparison of Behavioural and Reweighting Techniques,International Journal of Microsimulation 3(1): 35�42.
Kölling, A. (2000). The IAB-Establishment Panel, Schmollers Jahrbuch: Journal of Ap-plied Social Science Studies 120(2): 291�300.
Möller, J. (2010). The German Labor Market Response in the World Recession : De-mystifying a Miracle, Journal for Labour Market Research 42(4): 325�336.
OECD (2010). Moving beyond the Jobs Crisis, in OECD (ed.), OECD EmploymentOutlook: Moving beyond the Jobs Crisis, OECD, Paris, pp. 15�102.
Peichl, A. (2009). The Bene�ts and Problems of Linking Micro and Macro Models:Evidence from a Flat Tax Analysis, Journal of Applied Economics 12(2): 301�329.
24

Peichl, A., Schneider, H. & Siegloch, S. (2010). Documentation IZAMOD: The IZAPolicy SImulation MODel, IZA Discussion Paper No. 4865.
Peichl, A. & Siegloch, S. (2010). Accounting for Labor Demand E¤ects in StructuralLabor Supply Models, IZA Discussion Paper No. 5350.
Robilliard, A.-S., Bourguignon, F. & Robinson, S. (2008). Examining the Social Impactof the Indonesian Financial Crisis Using a Macro-Micro Model, in F. Bourguignon,L. A. Pereira da Silva & M. Bussolo (eds), The Impact of Macroeconomic Policieson Poverty and Income Distribution: Macro-Micro Evaluation Techniques and Tools,Palgrave-Macmillan, New York, pp. 93�118.
von Wachter, T. & Bender, S. (2006). In the Right Place at the Wrong Time: TheRole of Firms and Luck in Young Workers�Careers, American Economic Review96(5): 1679�1705.
Wagner, G. G., Frick, J. R. & Schupp, J. (2007). The German Socio-Economic PanelStudy (SOEP) - Scope, Evolution and Enhancements, Schmollers Jahrbuch: Journalof Applied Social Science Studies 127(1): 139�169.
Zellner, A. (1962). An E¢ cient Method of Estimating Seemingly Unrelated Regressionsand Tests for Aggregation Bias, Journal of the American Statistical Association57(298): 348�368.
25