Spatio-temporal variability in Mediterranean rocky shore ...
Upload
david-j-carlsonCategory
view
214download
2
Dissolved Organic Materials in Surface Microlayers: Temporal and Spatial Variability andRelation to Sea StateAuthor(s): David J. CarlsonSource: Limnology and Oceanography, Vol. 28, No. 3 (May, 1983), pp. 415-431Published by: American Society of Limnology and OceanographyStable URL: http://www.jstor.org/stable/2835824 .
Accessed: 14/06/2014 21:16
Your use of the JSTOR archive indicates your acceptance of the Terms & Conditions of Use, available at .http://www.jstor.org/page/info/about/policies/terms.jsp
.JSTOR is a not-for-profit service that helps scholars, researchers, and students discover, use, and build upon a wide range ofcontent in a trusted digital archive. We use information technology and tools to increase productivity and facilitate new formsof scholarship. For more information about JSTOR, please contact [email protected].
.
American Society of Limnology and Oceanography is collaborating with JSTOR to digitize, preserve andextend access to Limnology and Oceanography.
http://www.jstor.org
This content downloaded from 91.229.229.49 on Sat, 14 Jun 2014 21:16:19 PMAll use subject to JSTOR Terms and Conditions

Limnol. Oceanogr., 28(3), 1983, 415-431 ? 1983, by the American Society of Limnology and Oceanography, Inc.
Dissolved organic materials in surface microlayers: Temporal and spatial variability and relation to sea state
DavidJ. Carlson' Department of Oceanography, University of Maine, Walpole 04573
Abstract Microlayer samples were collected to assess the temporal and spatial variability of their
dissolved organic materials (DOM). Dissolved organic carbon (DOC) was often enriched in microlayers but concentration differences between microlayers and bulkwaters were gener- ally small. Ranges of DOC enrichments were large in oceanic samples. Enrichments dimin- ished with increasing bulkwater DOC concentrations in coastal waters and were not influ- enced by wave states from Beaufort 0 to 4. Microlayer depletions of DOC occurred, but the removal processes responsible for them are unknown. UV-absorbing phenolic fractions of microlayer DOM were consistently enriched, with the enrichments described by a partition- ing relationship, and showed evidence of decreasing enrichment with increasing wave states. In general, over the temporal and spatial scales considered, microlayer DOM variabilities in clean surfaces were not greater than equivalent bulkwater variabilities.
Studies of the organic chemistry of sur- face microlayers are evolving from an in- ventory of the materials present to con- sideration of the processes by which those materials arrive in the microlayers, their reactions while there, and their eventual fates. Two factors are important to inves- tigations of microlayer process and reac- tions: the first is that such inventories should represent both types and concen- trations of organic materials, including assessment of possible temporal and spa- tial variations; the second is the avail- ability of some natural organic material which represents significant fractions of microlayer dissolved materials and offers quantitative and predictive possibilities.
Neither of these has received adequate treatment. Microlayer dissolved organic matter (DOM) includes, besides contin- ually growing lists of anthropogenic con- taminants, dissolved organic carbon (DOC) (Williams 1967; Dietz et al. 1976; Sieburth et al. 1976;) and several frac- tions of DOC, such as phenolic materials (Carlson and Mayer 1980), carbohydrates (Dietz et al. 1976; Sieburth et al. 1976), and many lipids and hydrocarbons. Most
1 Current address: Environmental Chemistry, Code 4330, Naval Research Laboratory, Washing- ton, D.C. 20375.
of these data, however, usually derive from a few samples collected in a few lo- cations over brief periods. It is difficult, therefore, even when accumulating avail- able data regardless of sampling method, to assess the temporal or spatial variabil- ity of microlayer DOM. If it in fact shows large variations in concentration over small temporal or spatial scales, as sug- gested by Barker and Zeitlin (1972) and by Hunter and Liss (1981), then the in- formation obtained from small numbers of samples may be of limited value. The few samples, coupled with a general ab- sence of concurrent and quantitative sur- face descriptions, also limit our ability to relate microlayer DOM to varying sur- face conditions such as, for example, wave state.
The distribution of fatty acids, because of their known surface activity, wave- damping properties, and well document- ed occurrence in surface microlayers, has been considered to be representative of that of a significant fraction of microlayer DOM. However, there are suggestions that fatty acids and lipid materials have been miscast as representing all micro- layer DOM (Baier et al. 1974; Maclntyre 1974; Hunter and Liss 1981), leading to questions of extrapolating the character- istics of any single compound or class of compounds to microlayer DOM in gen-
415
This content downloaded from 91.229.229.49 on Sat, 14 Jun 2014 21:16:19 PMAll use subject to JSTOR Terms and Conditions

416 Carlson
eral. In view of the diversity of materials so far reported in surface microlayers and the probability of their interactions, it seems unlikely that any fraction of micro- layer DOM could represent the whole. However, it remains desirable from an analytical and experimental standpoint to find some material representative of a significant fraction of microlayer DOM whose distribution is consistent and pre- dictable.
The intent of my study was to supple- ment the inventory of microlayer organic materials by increasing both the duration of the sampling period and the frequency of individual samplings for microlayer DOC. Observations of surface wave con- ditions and the presence of slicks at the time of sampling were included. During the study, I found that dissolved UV-ab- sorbing phenolic materials had potential as consistent and useful fractions of mi- crolayer DOM. I give here the results of the investigations of DOC and UV-ab- sorbing materials and assess some sources of microlayer DOM and processes of ac- cumulation and removal.
Assistance and encouragement were provided by faculty, students, and staff of the Department of Oceanography, Uni- versity of Maine, especially by L. M. Mayer and B. J. McAlice. G. Mills and E. Hoffman provided unpublished data. Portions of the work were supported by NSF grant OCE-79-20244.
Geography, materials, and methods Details of sampling locations, tech-
niques, and analytical methods are given elsewhere (Carlson 1981, 1982b). Briefly, microlayer samples were collected be- tween May 1978 and September 1980 primarily in the Damariscotta (lake-river) estuary in central Maine, in waters of 25- 33%o salinity. Additional samples were collected in the Saco River estuary, at various Maine coastal locations, and in the Gulf of Maine (42?31.7'N, 69?31.8'W) and the North Atlantic (39?26.8'N, 66?21.2'W).
Surface microlayers were sampled with glass plates (Harvey and Burzell 1972) and screens (Gorter 1936; Garrett 1965). Because the volumes of water collected
by single dips of any of the samplers was small, successive dips (3-8 for screens and 12-30 for plates) were made until vol- umes sufficient for analysis were ob- tained; this integrated concentrations of microlayer components over the time elapsed and distance drifted during col- lection. The thickness of microlayer sam- ples was calculated from the volume of sample divided by the sampling area of each sampler. Unless described as screen-collected, all material discussed in this work was plate-collected. Bulkwater was sampled with Van Dorn bottles at 2-m depths.
Filtered samples (Whatman GF/C or GF/F) were analyzed for UV absorbance at 280 nm in 10-cm quartz cells, phenolic reactivity by a modification of the Folin- Ciocalteu (F-C) assay (Singleton 1974), and DOC (Menzel and Vaccaro 1964; Sharp 1973). Particulate organic carbon and nitrogen were measured on a Hew- lett-Packard CHN analyzer.
Enrichment ratios were calculated as the ratio of the concentration in microlay- ers to that in bulkwater. An enrichment ratio >1.0 was termed an enrichment, a ratio <1.0 was designated a depletion.
Information collected at the time of sampling included air and water temper- atures, bulkwater salinity, wind direction and speed, and wave state (Beaufort scale). Particular attention was given to surface conditions, especially slicks, those areas with visible reflectance differences from adjacent surfaces. A classification of surface conditions designated surfaces as clean, slick-influenced, or "'certified" slicks, in increasing order of coverage, and included a mixed class for samples col- lected partially from slicked and partially from clean surfaces (Carlson 1982a).
Results Dissolved organic carbon-Concentra-
tions of DOC in bulkwaters from which surface microlayer samples were collect- ed ranged from 0.78 to 2.15 mg liter-' in oceanic samples and from 1.11 to 12.64 in coastal and estuarine samples. Bulkwater DOC displayed a seasonal pattern within the Damariscotta estuary, coinciding ap-
This content downloaded from 91.229.229.49 on Sat, 14 Jun 2014 21:16:19 PMAll use subject to JSTOR Terms and Conditions

Microlayer DOM 417
(b) 040-L
33 a0.30 4
o 6 ! , 50
-o~~~~~~~~~~~~~~~~1 0
> 020- T
0.10
I I I I i I I I I a
I0-
T 8- 21
E 13
C~6- 7 3
0 17 0 4)
0 5
102
I ~ , I I J F M A M J J A S O N D
Month
Fig. 1. Seasonal patterns of bulkwater and mi- crolayer DOC in Damariscotta estuary. Plots are x (horizontal lines), sx for DOC and 95% C.I. for UV absorbance (boxes), and range (vertical lines), with numbers of data. Solid boxes and circles are bulk- waters, open boxes and circles are microlayer sam- ples. a-DOC. Continuous line connects mean monthly surface water temperatures (from data of McAlice 1979). b-UV absorbance (280 nm, 10-cm path length) from three stations with similar salinity ranges.
proximately with water temperature (Fig. la). Shorter temporal variations in bulk- water DOC were also evident. Ranges over 30 h were as great as 1.3 mg liter-' in the North Atlantic, 2.0 in the open Gulf of Maine, and 6.75 in the Damariscotta estuary, where values tended to be higher at night (Fig. 2).
Microlayer DOC concentrations ranged from 1.82 to 18.10 mg liter-' and were usually slightly higher than correspond-
12-
I0-
.~8 Microlayers
(S
2 >s ,8 | 20.- 8) E
10
IC- I0 wI i I I I 06;00 1000 1400 1800 2200 0200 0600
Local Standard Time Fig. 2. Diel variations of microlayer and bulk-
water DOC concentrations and enrichments taken from 30-h samplings at two stations within Dama- riscotta estuary (D7 and Lowes Cove), 1979. Station D7: O -14-15 June; 0-20-21 June; *-17-18 July; 0-8-9 August. Lowes Cove: E-*9 August.
ing bulkwater concentrations (Fig. 3). Samplings within the Damariscotta es- tuary extended over a 6-month period; high values occurred in every month (Fig. 1). Variations in microlayer DOG concen- trations over 30 h were usually larger than those in bulkwater, reaching a maximum of 8.46 mg liter-1. Nocturnal increases similar to those in bulkwater were ob- served. Enrichments, however, remained consistently low (Fig. 2).
Small-scale temporal and spatial vari- ations in microlayer DOC were investi- gated by collecting replicate microlayer and bulkwater samples while drifting. Drifts over clean surfaces provided rep- licate microlayer samples with variability similar to that of replicate bulkwater sam- ples: microlayer ranges of 1.8 (n = 4) and 0.37 (n - 2) mg liter1 and bulkwater ranges of 1.4 (n = 2) and 0.27 (n = 2). In drifts of slicked, visually patchy surfaces,
This content downloaded from 91.229.229.49 on Sat, 14 Jun 2014 21:16:19 PMAll use subject to JSTOR Terms and Conditions

418 Carlson
. 16
E 12 -
0~~~~~~ o . V. ) 8-*4 8 12
ters Cetfe slck arice. Sape wihbuk
4 8 12 Bulkwater DOC, mg liter-a
Fig. 3. Microlayer DOC concentrations vs. bulkwater concentrations. Broken line indicates equal concentrations in microlayers and bulkwa- ters. Certified slicks are circled. Samples with bulk- water concentrations <2.0 mg liter-' are from the North Atlantic.
samples were collected from clean, inter- mittent, and completely slicked areas. Microlayer DOC variability among com- bined clean and slicked surfaces was no larger or only slightly larger than that of bulkwater in two cases, but was much larger during a third drift when a very dense, debris-filled slick was present.
Enrichment ratios of microlayer DOC are plotted vs. concentrations of bulk- water DOC in Fig. 4a, with plate-collect- ed data of Dietz et al. (1976) included for comparison. Most enrichment values were <2.0; the mean enrichment for all my data was 1.33, and 1.16 when only coastal data (excluding a dense slick) were considered. Highest enrichments were observed at lowest concentrations of bulkwater DOC (samples from the North Atlantic) and in a dense coastal slick. Concentrations of DOC in oceanic micro- layers were low relative to most inshore samples; high enrichments resulted from
very low bulkwater concentrations. When screen-collected DOC data from both this and previous work were plotted in the same format as plate-collected data, oceanic enrichments were seen to vary independently of low bulkwater DOC concentrations (Fig. 4b), ranging from 1.20 to 3.73 mg liter-' over a bulkwater range of only 0.61-1.33.
Enrichment patterns in coastal waters with higher concentrations of DOC were distinctly different from those in oceanic samples. Both plate- and screen-collect- ed samples had uniformly low enrich- ments, approaching 1.0 at the highest concentrations of bulkwater DOC (Fig. 4). A significant number of plate samples had enrichment ratios <1.0, indicating deple- tion of DOC in the microlayers over the upper range of bulkwater concentrations, becoming less evident at the highest concentrations. Of my plate-collected data, 17% were depletions; 67% of the samples of Dietz et al. (1976) were de- pleted.
Microlayer DOC enrichments showed no evidence of a relationship to surface roughness; enrichment ratios were simi- lar over wave states from Beaufort 0 to 4. There was no indication that microlayer DOC resulted from tidal resuspension of material from mudflats. Enrichments measured at the mouth of a tidal cove showed no relation to tidal height nor any significant difference from a midchannel station. Films such as those from salt marsh surfaces (Gallagher 1975) were not evident from mudflat surfaces. There were also no indications of consistent diel patterns (Fig. 2), nor any relation to standing crops of bulkwater or microlayer primary producers as measured by chlo- rophyll a.
The highest microlayer DOC concen- tration and enrichments were observed in a slick. DOC concentrations and en- richments were also high in other slick samples, but the presence of a slick did not inevitably result in either high DOC concentrations or high enrichments (Figs. 3, 4). One slick sample showed a DOC depletion and several others only slight
This content downloaded from 91.229.229.49 on Sat, 14 Jun 2014 21:16:19 PMAll use subject to JSTOR Terms and Conditions

Microlayer DOM 419
4.0 (a)
3.0
2.0 , A-- -
A~~~~* * .
E ̂? I
C: _ 4. 0
4.0
3.0 _ f
*7~~~
v 2.0 e- -_
c *AA AA
E A~~
4.0~~~~~~~~ vv~~~ 0.
2 4 6 8 10 12 Bulkwaiter DOC, nng liter-'
Fig. 4. Microlayer DOC enrichment ratios vs. bulkwater DOC concentrations. In general, bulkwater concentrations <2.0 mg liter-' indicate oceanic samples. a. Plate-collected samples: *-present data; (D certified slicks; A-data from Dietz et al. 1976, except those with reference bulkwater depths of 100 m. Vertical lines represent 95% C.I. of enrichment ratios extrapolated from calculated confidence limits of five replicates taken 19 August 1980. For convenience, confidence limits are drawn on line of enrichment= 1.0. b. Screen-collected samples: *-present data; V-data from Williams 1967; A- Nishizawa 1971; A- Sieburth et al. 1976; O-G. Mills pers. comm.; O-E. Hoffman pers. comm.
This content downloaded from 91.229.229.49 on Sat, 14 Jun 2014 21:16:19 PMAll use subject to JSTOR Terms and Conditions

420 Carlson
Table 1. Summary of particulate organic carbon data. E-Enrichment.
Bulkwater Microlayer Microlayer TOC
(mg liter-') E (S) Surface condition
Estuarine 0.386 1.092 2.83 8.1 Clean 0.212 0.333 1.57 2.9 Clean 0.146 0.490 3.36 10.1 Clean 0.143 1.477 10.33 29.3 Slick-influenced
Coastal 0.474 0.914 1.93 25.1 Clean 0.500 0.679 1.36 8.7 Clean 1.117 3.662 3.29 67.0 Slick-influenced 2.022 17.236 8.52 85.5 Certified slick 2.022 59.786 29.59 77.0 Certified slick
Oceanic 0.210 2.160 10.3 37.2 Slick-influenced 0.061 2.324 38.4 39.2 Clean
C:N ratios [x ? s., (n)] Bulkwater Screen samples Plate samples
5.83 ? 0.27 (11) 7.07 ? 0.61 (7) 8.10 ? 0.52 (11)
enrichments. Nor did high DOC concen- trations or enrichments necessarily indi- cate slick conditions (Carlson 1982a).
Particulate organic carbon-POC was considered as a possible source of micro- layer DOC. Particulate materials visible on surfaces were noted. Designation of clean surfaces indicated that no accu- mulation of particulate materials was vis- ible. Preliminary estimates of type and abundance of particles in samples exam- ined microscopically for phytoplankton suggest that so-called clean samples were in fact relatively free of detritus.
Terrestrial materials, primarily pollen, conifer needles, and deciduous leaves, occasionally dominated microlayer POC in coastal waters. Large detached, float- ing marine macroalgae were also ob- served. These inputs occurred infre- quently throughout summer and fall, forming a large and inconsistent compo- nent which discouraged routine mea- surement of POC. Therefore, microlayer POC was measured only infrequently. However, several patterns are evident in the available data. First, microlayer POC was invariably enriched relative to bulk- water (Table 1). Bulkwater concentra- tions ranged from 0.061 to 2.022 mg li-
ter-1, while microlayer concentrations were 0.333 to :60, accounting for 3-85% of the total organic carbon in the micro- layers, larger percentages than those gen- erally found in bulkwater (Menzel 1974). POC enrichment ratios ranged from 1.6 to 38.4. High enrichments and concentra- tions were usually associated with slicks. C:N ratios in microlayer POC were great- er than in bulkwater.
UV-absorbing materials-Microlayer UV absorbance is shown vs. bulkwater absorbance in Fig. 5. In all but one case, microlayers had greater absorbances than bulkwater. In clean-surface microlayer samples from the lower Damariscotta es- tuary and coastal or Gulf of Maine waters (salinity range 25-33%o) microlayer UV absorbances were related to bulkwater absorbances by an equation of the form: microlayer absorbance = k x bulkwater absorbance, with a partition coefficient, k, of 1.27.
Data compiled from three stations with similar salinity ranges in the Damariscot- ta estuary demonstrated a seasonal pat- tern of UV absorbance in both bulkwater and microlayers (Fig. lb) which was es- sentially an inverse of yearly salinity pat- terns (McAlice 1979). This and a similar
This content downloaded from 91.229.229.49 on Sat, 14 Jun 2014 21:16:19 PMAll use subject to JSTOR Terms and Conditions
Microlayer DOM 421
0.50
K> E=~~~~~~150
12E=I 7
0)0.40 0
0 /
030- / 20 L gE
020- K
0.10-'
0.10 0 20 030 0.40 Bulkwater UV Absorbance
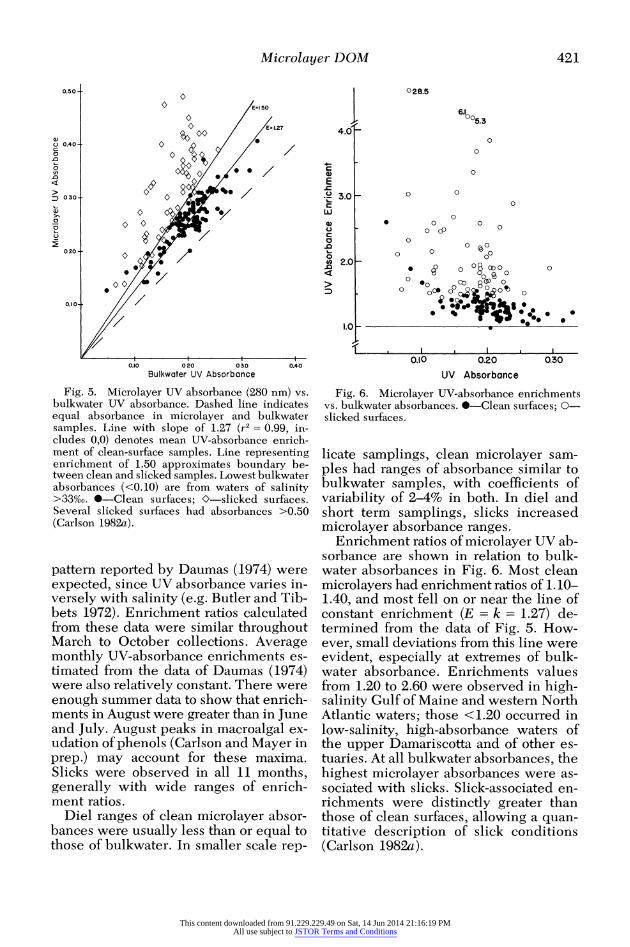
Fig. 5. Microlayer UV absorbance (280 nm) vs. bulkwater UV absorbance. Dashed line indicates equal absorbance in microlayer and bulkwater samples. Line with slope of 1.27 (r2 = 0.99, in- cludes 0,0) denotes mean UV-absorbance enrich- ment of clean-surface samples. Line representing enrichment of 1.50 approximates boundary be- tween clean and slicked samples. Lowest bulkwater absorbances (<0.10) are from waters of salinity >33%o. *-Clean surfaces; 0-slicked surfaces. Several slicked surfaces had absorbances >0.50 (Carlson 1982a).
pattern reported by Daumas (1974) were expected, since UV absorbance varies in- versely with salinity (e.g. Butler and Tib- bets 1972). Enrichment ratios calculated from these data were similar throughout March to October collections. Average monthly UV-absorbance enrichments es- timated from the data of Daumas (1974) were also relatively constant. There were enough summer data to show that enrich- ments in August were greater than in June and July. August peaks in macroalgal ex- udation of phenols (Carlson and Mayer in prep.) may account for these maxima. Slicks were observed in all 11 months, generally with wide ranges of enrich- ment ratios.
Diel ranges of clean microlayer absor- bances were usually less than or equal to those of bulkwater. In smaller scale rep-
028.5
6.1005.3
4.0 0
0
C) 0 E
.a ~~~0 t) .0 _
c 0 w
0 Q) 0 0 o c
C~~~~ o 0 ? .0 0
00 ~ 20 00 0 2.0 * O8-0
0 O0 0~.20 0.30 0 0 cSo Q 1D 0 0 D0 0 .
1.0 s-we *.. .
0
0.10 0.20 0.30 UV Absorbance
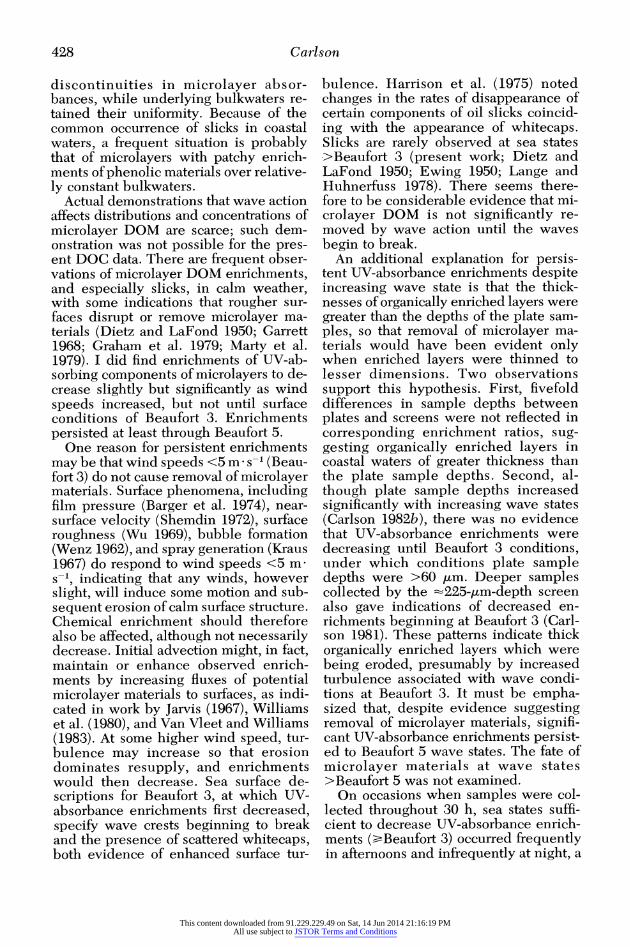
Fig. 6. Microlayer UV-absorbance enrichments vs. bulkwater absorbances. *-Clean surfaces; 0- slicked surfaces.
licate samplings, clean microlayer sam- ples had ranges of absorbance similar to bulkwater samples, with coefficients of variability of 2-4% in both. In diel and short term samplings, slicks increased microlayer absorbance ranges.
Enrichment ratios of microlayer UV ab- sorbance are shown in relation to bulk- water absorbances in Fig. 6. Most clean microlayers had enrichment ratios of 1.10- 1.40, and most fell on or near the line of constant enrichment (E = k = 1.27) de- termined from the data of Fig. 5. How- ever, small deviations from this line were evident, especially at extremes of bulk- water absorbance. Enrichments values from 1.20 to 2.60 were observed in high- salinity Gulf of Maine and western North Atlantic waters; those <1.20 occurred in low-salinity, high-absorbance waters of the upper Damariscotta and of other es- tuaries. At all bulkwater absorbances, the highest microlayer absorbances were as- sociated with slicks. Slick-associated en- richments were distinctly greater than those of clean surfaces, allowing a quan- titative description of slick conditions (Carlson 1982a).
This content downloaded from 91.229.229.49 on Sat, 14 Jun 2014 21:16:19 PMAll use subject to JSTOR Terms and Conditions

422 Carlson
UV-absorbance enrichments of sam- ples from tidal cove stations were no dif- ferent from those collected midchannel nor was there any indication of tidal pe- riodicity of enrichment at any station. Al- though the occurrence or coverage of slicks was not determined, slicks were not obvious more frequently at any stage of tide.
UV-absorbance enrichments were af- fected by surface roughness. Mean clean- surface enrichments were <1.20 at Beau- fort 3 and 4, 1.30 at calmer wave states. Significant enrichments remained throughout the range of sea states sam- pled. Ranges of enrichment ratios in slicks were large and showed no changes in re- sponse to wave state. UV-absorbance en- richments indicative of certified slicks were not observed at sea states >Beau- fort 3.
The influence of wave state on clean- surface, UV-absorbance enrichment ra- tios and the occurrence of slicks con- tributed to diel enrichment patterns. Summer wind patterns consisted of calm nights, light morning and midday breez- es, and well developed afternoon sea breezes. UV-absorbance enrichments measured during 30-h samplings at two stations in the Damariscotta estuary were highest near midnight (2100-0300 hours), intermediate during morning and midday (0300-0900 and 0900-1500 hours), and lowest in the afternoon (1500-2100 hours). In these diel samplings, slicks were most frequently encountered at night.
Additional sampling-In October 1979 the entire Damariscotta estuary was sam- pled simultaneously (total sampling in- terval < 1 h) by several groups of work- ers. Results for DOC, UV absorbance, salinity, POC, and F-C reactivity are shown in Fig. 7.
Bulkwaters were relatively warm, showing the influences of freshwater in the upper 4 km of the estuary and hydro- graphically similar to coastal surface waters in the lower 20 km. Most micro- layer concentrations were highest at the upper estuarine station and declined to fairly constant levels in the middle and lower estuary. POC and UV absorbance
increased in the slick-influenced oceanic sample. A salinity difference between microlayer and bulkwater was evident only at the upper estuarine station. En- richments of both UV absorbance and F-C reactivity were greater in the upper estuarine station than in the lake, de- creased to constant levels in midestuary, and increased again at the ocean end. DOC enrichments were slight and con- stant throughout. POC had larger enrich- ments than DOC, with a maximum of 10.33 in the slick-influenced sample.
Discussion Dissolved organic carbon-Microlay-
ers and bulkwaters had similar DOC con- centrations as well as similar temporal variations. Concentration similarities to bulkwater were also evident in other studies (Fig. 8). Differences between bulk- and microlayer waters were usually small in absolute terms, and microlayers did not consistently contain more DOC than bulkwater. These differences, and the processes or conditions responsible, are the subject of the rest of this discus- sion. However, a fundamental observa- tion remains: microlayer DOC was, in terms of concentration, generally similar to bulkwater DOC. Thus, the prevailing assumption that microlayers are always enriched in DOM cannot always be sup- ported, and enrichments, when they oc- cur, are not necessarily great.
Fine-scale (<1 min) variability has been observed in microlayer thermal structure (Ewing and McAlister 1960) and in po- tentiometric estimates of microlayer or- ganic materials (Williams et al. 1980). The sampling methods used here involved successive dips of the samplers and the accumulation of individual samples; therefore, DOC concentration differ- ences on scales of less than =100-150 m (average distance drifted during collec- tion of a complete sample) or of <5 min (duration of one sample collection) would have been integrated. Microlayer DOC variability in clean surfaces on larger scales (400 m or 30 min) was not gener- ally greater than in bulkwater. Only in an extreme case, on visibly patchy, slicked
This content downloaded from 91.229.229.49 on Sat, 14 Jun 2014 21:16:19 PMAll use subject to JSTOR Terms and Conditions

Microlayer DOM 423
L. 1-501
o o'i.00 -_- E a 0.50 62-[
'5-
0 1.02.0
4 1- I! 1
_ _ __ 1 L
I,~ ~~Dstne km~
u~3 0
3.0_C) a.~ ~ ~ ~ ~ ~ ~~~~~~2O 2 .5 _ _ _ _ _ _ _ _ _ _ _ _ _ _ _ _ .
-Q ~ ~~~~~~~~~~~-
of phloroglucinol (PGE).~ ~ ~ ~ ~ ~ ~~~~c
-0 I,,> ~' I '
30~~ 15 2
Distance, km Fig. 7. Synoptic sampling of Damariscotta estuary, 23 October 1979. @-Bulkwater concentrations;
0-microlayer concentrations; Ky-enrichments; U-temperature. F-C reactivity expressed as micromoles of phloroglucinol (PGE).
surfaces, was microlayer variability great- er. We may conclude that, depending on the scale of interest, microlayer DOC may be no more variable than bulkwater DOC. Therefore, it may be inappropriate to invoke patchy distributions of DOM in microlayers as an explanation for either concentration differences between mi- crolayer and bulkwater or patchy distri- butions of other materials or substances, such as aerosols, derived from microlay- ers.
Enrichment ratios of DOC were not constant, even when only clean surfaces or only estuarine samples were consid- ered, indicating that there was no uni- form partitioning of some fraction of bulkwater DOC into microlayers. In view of the complex and probably variable composition of bulkwater DOC, there is no reason to expect that constant propor- tions would have solubilities impelling them to an interface, even if microlayers were the only interfaces available. In-
This content downloaded from 91.229.229.49 on Sat, 14 Jun 2014 21:16:19 PMAll use subject to JSTOR Terms and Conditions

424 Carlson
4-
.__
E o t512 *0 o 0 *
Q 0 #7~~
0~~~~
4 8 12 Bulkwater DOC, mg liter-l
Fig. 8. Compilation of reported microlayer and bulkwater concentrations of DOC. Broken line in- dicates equal microlayer and bulkwater concentra- tions. Plate-collected samples: *-present work; *- Dietz et al. 1976. Screen-collected samples: 0- present work; V-Williams 1967; A-Nishizawa 1971; A-Sieburth et al. 1976; U-Meyers 1980; V- G. Mills pers. comm.; O-E. Hoffman pers. comm.
stead of constant enrichment, I found two patterns: high enrichments in oceanic samples and lower enrichments dimin- ishing with increasing bulkwater DOC concentrations in coastal waters. An in- verse hyperbolic relationship between microlayer DOC enrichments and bulk- water DOC, as suggested by these pat- terns, could have resulted had microlay- ers either contained constant excesses of DOC over bulkwater or been limited to some maximum excess. However, micro- layer DOC excesses were definitely not constant. There are suggestions of dis- solved organic materials enriched over tens or hundreds of micrometers (Dau- mas et al. 1976; Carlson 1982b). If en- richments of such thicknesses exist, dis- solved organic materials accumulating at or near surfaces, even in diffuse arrange-
ment, should not have been limited to some maximum excess by spatial or vol- ume considerations at these concentra- tions. Therefore, other causes for the DOC enrichment patterns should be con- sidered.
High DOC enrichment ratios in ocean- ic waters might imply greater proportions of low-solubility DOC than in coastal waters. However, small enrichments also occurred in low DOC oceanic bulkwater; high enrichments were not invariable. There is little evidence to suggest that oceanic DOC has higher proportions of low-solubility materials. Dissolved lip- ids are not consistently different between oceanic and coastal microlayers (Kattner and Brockmann 1978). Total carbohy- drates are a relatively constant proportion of bulkwater and microlayer DOC in both neritic and oceanic waters (Burney et al. 1979; Sieburth et al. 1976). While amounts of relatively low-solubility materials may not be consistently related to distance from shore, availability of those materials to contribute to microlayer enrichments might show coastal and oceanic differ- ences. Boehm and Quinn (1973) demon- strated that n-alkane solubility in sea- water increased as DOC concentrations increased. A similar solubilization could decrease the effective concentrations of potential microlayer materials in coastal waters, thereby contributing to a pattern of enhanced oceanic and diminished coastal enrichments.
Differences between oceanic and coastal DOC enrichments might reflect differences in microlayer accumulation or removal processes. It is hard to imagine near-surface advective or diffusive pro- cesses that might have sufficiently great- er intensities in oceanic waters than in coastal waters to cause larger oceanic en- richments. It seems reasonable instead to consider microlayer removal processes which might be smaller in oceanic than in coastal areas.
The susceptibility of DOC to removal might be a function of time spent in a microlayer. Surface compressional and di]ational motions might, with time, reor- der near-surface organic materials into an organically more dense microlayer,
This content downloaded from 91.229.229.49 on Sat, 14 Jun 2014 21:16:19 PMAll use subject to JSTOR Terms and Conditions

Microlayer DOM 425
thereby increasing resistance to turbu- lent erosion. Such a hypothesis would ac- count for both the high DOM enrich- ments in oceanic microlayers and the observation that oceanic organic micro- layers seemed thinner than coastal micro- layers (Carlson 1981).
Other removal processes such as the formation of particulate materials from microlayer DOM or biological removal might be more effective in coastal areas than in oceanic areas. Wheeler (1975) was able to compress and collapse coastal mi- crolayer DOM, but not that from the Sar- gasso Sea, into particles. Addition of pro- tein to the samples stimulated the collapse and removal of Sargasso Sea microlayer DOM, perhaps duplicating processes oc- curring in coastal waters. Terrestrial ma- terials which can contribute to particle formation (Sholkovitz et al. 1978) are available in coastal areas.
In discussing microlayer enrichments, one assumes minimum levels to be equal to those in bulkwater; that is, no enrich- ment. However, most dissolved organic materials found in microlayers, including DOC, lipids, and carbohydrates, are at least occasionally depleted (Dietz et al. 1976; Sieburth et al. 1976; Marty et al. 1979; Meyers 1980). In contrast, there is only one report of depletion of total POC (Dietz et al. 1976) or of any particulate organic fraction, raising the possibility that particulate materials are immune to processes causing depletions and may be a sink for dissolved materials.
I found sporadic DOC depletions, with no apparent relation to location, time of day, or wave state. They were detected most often in plate-collected samples, only rarely in screen samples; depletions encountered during simultaneous use of both methods were greater in plate sam- ples. This suggests that DOC depletions were a phenomenon of relatively thin mi- crolayers, although depletions in other dissolved fractions have been reported for screen-collected samples.
Wind-generated mixing processes which might remove microlayer DOC would ultimately result in homogeneous water columns rather than surface deple- tions. Near-surface bubble populations
are known to increase over the range of wind speeds (0-8 m s-1) observed here (e.g. Johnson and Cooke 1979). Bubbles which remove microlayer DOC upon breaking (Bezdek and Carlucci 1974) will probably first have contributed DOC to the microlayers (Jarvis 1967; Pojasek and Zajicek 1978; Williams et al. 1980). In- creasing surface roughness might also de- crease microlayer enrichments due to in- creased near-surface turbulence, as suggested by Marty et al. (1979). The ab- sence of any discernible influences of wind speed or wave state on microlayer DOC enrichments suggests either that bubbling and turbulent processes were unimportant to microlayer DOC at these wind speeds or that removal and supply processes were approximately in bal- ance. In any case, if bubbling or turbu- lence could remove all surface-active DOM from microlayers, the result should again be homogeneous water columns rather than depletions.
Oxidation or degradation of microlayer DOC by light to labile or soluble prod- ucts could effectively remove microlayer materials. Photochemical reactions would presumably be a direct function of irra- diation, but I found no relation between depletions and irradiation patterns-sev- eral depletions occurred at night. During the day, photochemical removal is likely to be relatively constant, so that sporad- ically exceptional irradiation or reactivity would have been needed to cause spo- radic depletions. I did not sample during rain, suggested by Green and Houk (1979) as a factor in removing microlayer mate- rial.
Collapse of dissolved microlayer ma- terials leading to particle formation (Wheeler 1975) could be a significant sink for microlayer DOC. The process, be- sides being dependent on surface con- centrations of DOM, should become in- creasingly effective due to increased compression and turbulence at high wave states. However, depletions measured here were not related to higher wave states.
A primary uncertainty in each of these removal hypotheses is how depletions can be maintained against diffusive and mix-
This content downloaded from 91.229.229.49 on Sat, 14 Jun 2014 21:16:19 PMAll use subject to JSTOR Terms and Conditions

426 Carlson
ing processes tending to resupply micro- layers. In pure compound-water systems, the adsorption time for fatty acids to form monolayers is only a few seconds (Davies and Rideal 1963). If, instead of calculat- ing rates of arrival of molecules at an in- terface, one postulates a microlayer of some thickness bounded below by a 50- ,m-thick diffusional layer in which con- centration gradients are linear, both over- lying a homogeneous and continuously mixed bulkwater solution, then one can calculate the time required to pass enough material from bulkwater across the dif- fusional barriers into the microlayer to overcome a given depletion. For deple- tions of 1 mg liter-' of DOC, the time required to pass this DOC in the form of a representative fatty acid (diffusion con- stant, D, = 6 x 10⁻⁶ cm2 s-1) is about 23 min. For a much larger molecule, bovine serum albumin (BSA, with D = 6 x 10⁻⁷
cm2 s-1), the time required is nearly 4 h. This simplistic model neglects changing concentration gradients, which would lengthen the calculated resupply times, and is presented only to allow estimates. However these calculated times may be reasonable estimates of actual resupply times. Jarvis (1967) demonstrated in lab- oratory experiments that amounts of sur- face-active material measurable by sur- face potential were adsorbed from bulk seawater to cleaned surfaces in as little as 30 min and continued to be adsorbed for at least 2 h. Accumulation rates were considerably increased by bubbling or stirring. In similar experiments, Williams et al. (1980) and Van Vleet and Williams (1983) also measured natural seawater film formation times varying from tens of minutes to several hours. They noted in addition that surface potentials showed very rapid increases immediately after cleaning of surfaces, presumably indica- tive of rapid initial adsorbtion of material from bulkwaters to surfaces. It is not pos- sible to tell from those studies whether the processes represented resupply from a depleted condition or accumulation to reform an enrichment, in which case en- richment kinetics might be expected to differ from resupply kinetics. In any case,
if resupply times estimated here are re- alistic, the critical assumptions being dif- fusive layer thickness and minimum tur- bulence, then the depletions might last long enough to be sampled.
Depletions must still be created before they may persist. In addition to the phys- ical and chemical removal processes con- sidered above, the possibility of biologi- cal uptake of microlayer DOC must be considered. If the data of Dietz et al. (1976) are representative of microlayer microbial metabolic rates, then their maximum glucose uptake rate, converted to a DOC removal rate of 2.7 x 10⁻¹¹ ,ug DOC cm-2 s- over a 100-,m-thick mi- crolayer, is six orders of magnitude slow- er than the slowest DOC resupply rate calculated above (7.2 x 10⁻⁵ ,g DOC cm-2 s- , corresponding to 1 mg liter-' in 4 h). Faster glutamate utilization rates from Passman et al. (1979) are still four orders of magnitude slower than diffu- sional resupply. In addition, Dietz et al. (1976) found no relationship between mi- crobial heterotrophic activity and the oc- currence of depletions. Therefore, it seems that exceptional biological activi- ty, or a combination of biological activity with the other removal processes dis- cussed, would be required to cause the observed depletions.
The absence of obvious explanations for depletions suggests the possibility that these depletions were an artifact of sam- pling or of sample handling. It is unlikely that the samplers were retaining DOC. Retention would be a function of surface area or of crevices, both of which were minimal on plates, and samples were wiped off plates, a more thorough remov- al than was possible on screens. In most simultaneous plate and screen sam- plings, screens showed depletions of a magnitude about proportional, consider- ing the increased screen sample thick- nesses, to the plate depletions, or screens showed no enrichment, consistent with a hypothesis that depleted microlayers did exist and were sampled without bias by both plates and screens. Handling arti- facts, such as the adsorption of microlayer DOC onto filters or onto particulate ma-
This content downloaded from 91.229.229.49 on Sat, 14 Jun 2014 21:16:19 PMAll use subject to JSTOR Terms and Conditions

Microlayer DOM 427
terial loaded on the filters, were probably not important. Although lipid materials may adsorb to filters (Quinn and Meyers 1971), the adsorption of DOC from sea- water onto glass-fiber filters has been shown to be insignificant (Wangersky and Hincks 1978). Microlayer particles should have been presaturated with organic ma- terials and unlikely to adsorb additional DOC. Although materials used in sam- pling microlayers or in subsequent han- dling of samples may have influenced the distributions of materials between dis- solved and particulate phases (Mayer and Carlson in prep.), it is not known whether such changes might result in depletions of the magnitude observed.
In summary, then, depletions are un- likely to be artifacts, but present under- standing of the processes whereby DOC enters and is removed from microlayers does not provide any immediately satis- factory explanations for them. DOC must leave microlayers either as CO2 or by ad- sorption to particles; ubiquitous enrich- ments of microlayer POC suggest the lat- ter.
Particulate organic carbon-In sam- ples in which POC and PON were mea- sured, particulate organic materials were always enriched, usually to a greater de- gree than dissolved organic materials. This pattern is consistent with previous reports of large microlayer POC enrich- ments. Thus POM in microlayers seems to be relatively stable, resistant to resol- ubilization, degradation, or mixing into the water, and perhaps maintained by eolian inputs of terrestrial material. The high C:N ratios of microlayer POM in- dicated detrital materials, without distin- guishing terrestrial or marine sources. High microlayer C:N ratios were also found by Nishizawa (1971), Taguchi and Nakajima (1971), and Dietz et al. (1976); however Williams (1967) found microlay- er C:N ratios lower than those in bulk- water, approaching values indicative of proteinaceous materials. These samples have come from coastal locations and from offshore and open-ocean areas; C:N ra- tios may vary with local primary produc- tion or terrestrial inputs.
It is interesting that in my data screen samples collected simultaneously with plate and bulkwater samples had C:N ra- tios of POM intermediate to, although not significantly different from, bulkwater and plate samples. These differences may in- dicate compositional gradients of POM between bulkwater and microlayers.
UV-absorbing materials-UV absor- bance can be considered to represent dis- solved phenolic materials of both terres- trial and marine (macroalgal) origin (Carlson and Mayer 1980; Carlson 1981). These measurements of UV-absorbing phenolic materials are perhaps the most numerous quantitative data available concerning microlayer DOM. They are also the most consistently enriched, with no record of depletion in 165 samples (or in >250 samples when shallow screen data are included). The partition coeffi- cient derived from these data, describing distributions of phenolic materials be- tween bulk and microlayer waters, is nei- ther definitive or universal; minor devia- tions from it were evident, including salinity-dependent effects (Carlson and Mayer 1980). It does, however, represent the first instance in which microlayer field data were found to obey a partitioning re- lationship and thus offers predictive and comparative capabilities not previously available.
An immediate comparison can be made with DOC data from this study, which showed no evidence of a constant parti- tioning relationship. Neither do any oth- er reported microlayer DOM data, either individually or in sum, including fatty acid data. Thus UV-absorbant materials were more consistent components of mi- crolayers than any other DOC fractions so far measured.
Ranges of UV absorbance measured in clean microlayers over monthly, daily, and short (<0.5 h) periods were equal to or only slightly greater than corresponding ranges in bulkwater. Given the integra- tion of fine-scale variability inherent in the sampling methods, UV-absorbant ma- terials in clean surfaces were not, on these scales, remarkably patchy relative to bulkwater. Slicks, however, caused large
This content downloaded from 91.229.229.49 on Sat, 14 Jun 2014 21:16:19 PMAll use subject to JSTOR Terms and Conditions
428 Carlson
discontinuities in microlayer absor- bances, while underlying bulkwaters re- tained their uniformity. Because of the common occurrence of slicks in coastal waters, a frequent situation is probably that of microlayers with patchy enrich- ments of phenolic materials over relative- ly constant bulkwaters.
Actual demonstrations that wave action affects distributions and concentrations of microlayer DOM are scarce; such dem- onstration was not possible for the pres- ent DOC data. There are frequent obser- vations of microlayer DOM enrichments, and especially slicks, in calm weather, with some indications that rougher sur- faces disrupt or remove microlayer ma- terials (Dietz and LaFond 1950; Garrett 1968; Graham et al. 1979; Marty et al. 1979). I did find enrichments of UV-ab- sorbing components of microlayers to de- crease slightly but significantly as wind speeds increased, but not until surface conditions of Beaufort 3. Enrichments persisted at least through Beaufort 5.
One reason for persistent enrichments may be that wind speeds <5 m -s- (Beau- fort 3) do not cause removal of microlayer materials. Surface phenomena, including film pressure (Barger et al. 1974), near- surface velocity (Shemdin 1972), surface roughness (Wu 1969), bubble formation (Wenz 1962), and spray generation (Kraus 1967) do respond to wind speeds <5 m- s-5, indicating that any winds, however slight, will induce some motion and sub- sequent erosion of calm surface structure. Chemical enrichment should therefore also be affected, although not necessarily decrease. Initial advection might, in fact, maintain or enhance observed enrich- ments by increasing fluxes of potential microlayer materials to surfaces, as indi- cated in work by Jarvis (1967), Williams et al. (1980), and Van Vleet and Williams (1983). At some higher wind speed, tur- bulence may increase so that erosion dominates resupply, and enrichments would then decrease. Sea surface de- scriptions for Beaufort 3, at which UV- absorbance enrichments first decreased, specify wave crests beginning to break and the presence of scattered whitecaps, both evidence of enhanced surface tur-
bulence. Harrison et al. (1975) noted changes in the rates of disappearance of certain components of oil slicks coincid- ing with the appearance of whitecaps. Slicks are rarely observed at sea states >Beaufort 3 (present work; Dietz and LaFond 1950; Ewing 1950; Lange and Huhnerfuss 1978). There seems there- fore to be considerable evidence that mi- crolayet DOM is not significantly re- moved by wave action until the waves begin to break.
An additional explanation for persis- tent UV-absorbance enrichments despite increasing wave state is that the thick- nesses of organically enriched layers were greater than the depths of the plate sam- ples, so that removal of microlayer ma- terials would have been evident only when enriched layers were thinned to lesser dimensions. Two observations support this hypothesis. First, fivefold differences in sample depths between plates and screens were not reflected in corresponding enrichment ratios, sug- gesting organically enriched layers in coastal waters of greater thickness than the plate sample depths. Second, al- though plate sample depths increased significantly with increasing wave states (Carlson 1982b), there was no evidence that UV-absorbance enrichments were decreasing until Beaufort 3 conditions, under which conditions plate sample depths were >60 ,m. Deeper samples collected by the -225-,m-depth screen also gave indications of decreased en- richments beginning at Beaufort 3 (Carl- son 1981). These patterns indicate thick organically enriched layers which were being eroded, presumably by increased turbulence associated with wave condi- tions at Beaufort 3. It must be empha- sized that, despite evidence suggesting removal of microlayer materials, signifi- cant UV-absorbance enrichments persist- ed to Beaufort 5 wave states. The fate of microlayer materials at wave states >Beaufort 5 was not examined.
On occasions when samples were col- lected throughout 30 h, sea states suffi- cient to decrease UV-absorbance enrich- ments (-Beaufort 3) occurred frequently in afternoons and infrequently at night, a
This content downloaded from 91.229.229.49 on Sat, 14 Jun 2014 21:16:19 PMAll use subject to JSTOR Terms and Conditions

Microlayer DOM 429
pattern reflected in minimal afternoon and maximal night enrichments. Differences in UV absorbance of microlayer samples collected mornings and afternoons by Daumas (1974) may also be attributed to wave state differences. Other factors are unlikely to have contributed to diel pat- terns. The delivery of terrestrial phenols is independent of time of day. Harvested fucoid macroalgae showed greater exu- dation in the light than in the dark (Ragan and Jensen 1979); if this were so in the field, the patterns would have been op- posite to those observed here. Photo- chemical processes might be expected to result in midday rather than afternoon enrichment minima. Thus variations in sea state, often with diel periodicity, can apparently influence enrichments of mi- crolayer DOM. Additional samplings-In the October
1979 synoptic sampling, salinity and dis- solved and particulate materials were nearly uniform in microlayer concentra- tion and enrichment throughout the mid- and lower estuary. My earlier contention that materials in microlayers of clean sur- faces do not show patchy distributions is thus extended to these scales. This and other evidence (Carlson 1981) that micro- layers and bulkwaters were isohaline, es- pecially in higher salinity waters, indi- cates that the observed microlayer enrichments of salinity-dependent pa- rameters such as UV absorbance were ac- tual surface enrichments and not artifacts of near-surface stratification. Phenolic components, both as UV absorbance and as F-C reactivity, showed high enrich- ments upon initial mixing of lake water with seawater, perhaps indicating rapid exsolution of terrestrial phenols into mi- crolayers, representative of flocculation of dissolved humic acids (Sholkovitz et al. 1978). Increases in ratios of F-C reac- tivity to UV absorbance in high-salinity waters were indicative of macroalgal con- tributions of dissolved phenolic materials (Carlson and Mayer 1980).
Conclusions Data derived from a relatively large
number of samples demonstrated that al- though microlayers were often enriched
in DOC, their concentrations were gen- erally not greatly different from those of bulkwater. Diel, short term, and small- scale spatial variations in microlayer DOC were similar to those in bulkwater. On larger scales, DOC enrichments were sometimes high in oceanic samples but generally low, diminishing with increas- ing concentrations of bulkwater DOC in coastal waters. This pattern may indicate time-dependent increases in the durabil- ity of organic microlayers, or coastal ef- fects such as a decreased availability of microlayer organic materials, or en- hanced removal processes. There was no evidence that intertidal mudflats contrib- uted directly to microlayer DOC, nor any evident relation between biomass of bulkwater or microlayer primary produc- ers and microlayer DOC. Microlayer DOC depletions could not be accounted for, given our present understanding of microlayer removal processes.
UV-absorbing phenolic fractions of mi- crolayer DOM were consistently en- riched. A partitioning relationship, unique among microlayer materials measured to date, described distributions of phenolic materials between microlayers and bulk- waters. In clean surfaces, seasonal pat- terns of phenolic material enrichments were absent and diel, short term, and small-scale variations similar to those in bulkwater. Slick conditions were associ- ated with large enrichments in phenolic material; the presence of slicks intro- duced large variability in microlayer phe- nolic material enrichments. Enrichments of phenolic materials decreased at wave states >Beaufort 3, but persisted through the highest wave states sampled.
References BAIER, R. E., D. W. GOUPIL, S. PERLMUTTER, AND
R. KING. 1974. Dominant chemical composi- tion of sea-surface films, natural slicks, and foams. J. Rech. Atmos. 8: 571-600.
BARGER, W. R., W. H. DANIEL, AND W. D. GAR- RETT. 1974. Surface chemical properties of banded sea slicks. Deep-Sea Res. 21: 83-89.
BARKER, D. R., AND H. ZEITLIN. 1972. Metal-ion concentrations in sea-surface microlayer and size-separated atmospheric aerosol samples in Hawaii. J. Geophys. Res. 77: 5076-5086.
BEZDEK, H. F., AND A. F. CARLUCCI. 1974. Con- centration and removal of liquid monolayers
This content downloaded from 91.229.229.49 on Sat, 14 Jun 2014 21:16:19 PMAll use subject to JSTOR Terms and Conditions
430 Carlson
from a seawater surface by bursting bubbles. Limnol. Oceanogr. 19: 126-132.
BOEHM, P. D., AND J. C. QUINN. 1973. Solubili- zation of hydrocarbons by the dissolved organic matter in sea water. Geochim. Cosmochim. Acta 37: 2459-2477.
BURNEY, C. M., K. M. JOHNSON, D. M. LAVOIE, AND J. McN. SEIBURTH. 1979. Dissolved carbo- hydrates and microbial ATP in the North At- lantic: Concentrations and interactions. Deep- Sea Res. 26: 1267-1290.
BUTLER, E. I., AND S. TIBBETS. 1972. Chemical survey of the Tamar estuary. 1. Properties of the waters. J. Mar. Biol. Assoc. U.K. 52: 681-699.
CARLSON, D. J. 1981. Chemistry and microbiol- ogy of surface microlayers of estuarine and coastal waters of the Gulf of Maine. Ph.D. the- sis, Univ. Maine. 205 p.
. 1982a. Surface microlayer phenolic en- richments indicate sea surface slicks. Nature 296: 426-429.
. 1982b. A field evaluation of plate and screen microlayer sampling techniques. Mar. Chem. 11: 189-208.
, AND L. M. MAYER. 1980. Enrichment of dissolved phenolic material in the surface mi- crolayer of coastal waters. Nature 286: 482- 483.
DAUMAS, R. A. 1974. Influence de la temperature et du developpement planctonique sur le me- canisme d'accumulation de la matiere orga- nique a la surface de la mer. Mar. Biol. 26: 111- 116.
, P. L. LABORDE, T. C. MARTY, AND A. SAL- IOT. 1976. Influence of sampling method on the chemical composition of the water surface film. Limnol. Oceanogr. 21: 319-326.
DAVIES, J. T., AND E. K. RIDEAL. 1963. Interfacial phenomena. Academic.
DIETZ, A. S., L. J. ALBRIUGHT, AND T. TUOMINEN. 1976. Heterotrophic activities of bacterioneus- ton and bacterioplankton. Can. J. Microbiol. 22: 1699-1709.
DIETZ, R. S., AND E. C. LAFoND. 1950. Natural slicks on the ocean. J. Mar. Res. 9: 69-76.
EWING, G. 1950. Slicks, surface films, and internal waves. J. Mar. Res. 9: 161-187.
, AND E. D. McALISTER. 1960. On the ther- mal boundary of the ocean. Science 131b 1374- 1376.
GALLAGHER, J. L. 1975. The significance of the surface film in salt marsh plankton metabolism. Limnol. Oceanogr. 20: 120-123.
GARRETT, W. D. 1965. Collection of slick-forming materials from the sea surface. Limnol. Ocean- ogr. 10: 602-605.
1968. Organic chemistry of natural sea surface films, p. 469-477. In D. W. Hood [ed.], Organic matter in natural waters. Inst. Mar. Sci. Alaska Occas. Publ. 1.
GORTER, E. 1936. Discussion on surface phenom- ena-films. Proc. R. Soc. Lond. Ser. A. 155: 706-708.
GRAHAM, W. F., S. R. PIOTROWICZ, AND R. A.
DUCE. 1979. The sea as a source of atmospher- ic phosphorus. Mar. Chem. 7: 325-342.
GREEN, T., AND D. F. HOUK. 1979. The removal of organic surface films by rain. Limnol. Ocean- ogr. 24: 966-970.
HARRISON, W., M. A. WINNIK, P. T. KWONG, AND D. MACKAY. 1975, Disappearance of aromatic and aliphatic components from small sea-sur- face slicks. Environ. Sci. Technol. 9: 231-234.
HARVEY, G. W., AND L. A. BURZELL. 1972. A sim- ple microlayer method for small samples. Lim- nol. Oceanogr. 17: 156-157.
HUNTER, K. A., AND P. S. Liss. 1981. Organic sea surface films, p. 259-298. In E. K. Duursma and R. Dawson [eds.], Marine organic chemistry. Elsevier.
JARVIS, N. L. 1967. Adsorption of surface-active material at the air-sea interface. Limnol. Oceanogr. 12: 213-221.
JOHNSON, B. D., AND R. C. COOKE. 1979. Bubble populations and spectra in coastal waters: A photographic approach. J. Geophys. Res. 84: 3761-3766.
KATTNER, G. G., AND U. H. BROCKMANN. 1978. Fatty-acid composition of dissolved and partic- ulate matter in surface films. Mar. Chem. 6: 233-241.
KRAus, E. B. 1967. Wind stress along the sea sur- face. Adv. Geophys. 12: 213-255. Academic.
LANGE, P., AND H. HUHNERFUSS. 1978. Drift re- sponse of monomolecular slicks to wave and wind action. J. Phys. Oceanogr. 8: 142-150.
McALICE, B. J. 1979. Hydrographic and nutrient data, Damariscotta River estuary, Lincoln County, Maine. Maine Sea Grant Tech. Rep. 43. 41 p.
MACINTYRE, F. 1974. Chemical fractionation and sea-surface microlayer processes, p. 245-299. In E. D. Goldberg [ed.], The sea, v. 5. Wiley.
MARTY, J. C., A. SALIOT, P. BUAT-MENARD, R. CHESSELET, AND K. A. HUNTER. 1979. Rela- tionship between the lipid composition of ma- rine aerosols, the sea surface microlayer, and subsurface water. J. Geophys. Res. 84: 5707- 5716.
MENZEL, D. W. 1974. Primary productivity and particulate organic matter and the sites of oxi- dation of organic matter, p. 659-678. In E. D. Goldberg [ed.], The sea, v. 5. Wiley.
, AND R. F. VACCARO. 1964. The measure- ment of dissolved and particulate carbon in sea- water. Limnol. Oceanogr. 9: 138-142.
MEYERS, P. A. 1980. Dissolved fatty acids and or- ganic carbon in seawater from the fringing-bar- rier reef at Discovery Bay, Jamaica. Bull. Mar. Sci. 30: 657-666.
NISHIZAWA, S. 1971. Concentration of organic and inorganic material in the surface skin at the Equator, 155?W. Bull. Plankton Soc. Jap. 18: 42-44.
PASSMAN, F. J., T. J. NOVITSKY, AND S. W. WATSON. 1979. Surface microlayers of the North Atlan- tic: Microbial populations, heterotrophic and hydrocarbonoclastic activities, p. 214-226. In
This content downloaded from 91.229.229.49 on Sat, 14 Jun 2014 21:16:19 PMAll use subject to JSTOR Terms and Conditions

Microlayer DOM 431
Microbial degradation of pollutants in marine environments. Workshop Proc. U.S. EPA-600/9- 79-012.
POJASEK, R. B., AND 0. T. ZAJICEK. 1978. Surface microlayers and foams-source and metal transport in aquatic systems. Water Res. 12: 7- 10.
QUINN, J. G., AND P. A. MEYERS. 1971. Retention of dissolved organic acids in seawater by var- ious filters. Limnol. Oceanogr. 16: 129-131.
RAGAN, M. A., AND A. JENSEN. 1979. Quantitative studies on brown algal phenols. 3. Light-me- diated exudation of polyphenols from Asco- phyllum nodosum (L.) Le Jol. J. Exp. Mar. Biol. Ecol. 26: 91-101.
SHARP, J. H. 1973. Total organic carbon in sea- water-comparison of measurements using persulfate oxidation and high temperature com- bustion. Mar. Chem. 1: 211-229.
SHEMDIN, 0. H. 1972. Wind-generated current and phase speed of wind waves. J. Phys. Oceanogr. 2: 411-419.
SHOLKOVITZ, E. R., E. Q. BOYLE, AND N. B. PRICE. 1978. The removal of dissolved humic acids and iron during estuarine mixing. Earth Planet. Sci. Lett. 40: 130-136.
SIEBURTH, J. McN., AND OTHERS. 1976. Dis- solved organic matter and heterotrophic micro- neuston in the surface microlayers of the North Atlantic. Science 194: 1415-1418.
SINGLETON, V. L. 1974. Analytical fraction of the phenolic substances of grapes and wine and
some practical uses of such analyses. Adv. Chem. 137: 184-211.
TAGUCHI, S., AND K. NAKAJIMA. 1971. Plankton and seston in the sea surface of three inlets of Japan. Bull. Plankton Soc. Jap. 18: 20-36.
VAN VLEET, E. S., AND P. M. WILLIAMS. 1983. Surface potential and film pressure measure- ments in seawater systems. Limnol. Oceanogr. 28: 401-414.
WANGERSKY, P. J., AND A. V. HINCKS. 1978. Ship- board intercalibration of filters used to measure particulate organic carbon. Nat. Sci. Eng. Res. Counc. Can. Publ. 16767. 32 p.
WENZ, G. M. 1962. Acoustic ambient noise in the ocean: Spectra and sources. J. Acoust. Soc. Am. 34: 1936-1956.
WHEELER, J. H. 1975. Formation and collapse of surface films. Limnol. Oceanogr. 20: 338-342.
WILLIAMS, P. M. 1967. Sea surface chemistry; Or- ganic carbon and organic and inorganic nitro- gen and phosphorus in surface films and sub- surface waters. Deep-Sea Res. 14: 791-800.
, E. S. VAN VLEET, AND C. R. BOOTH. 1980. In situ measurements of sea-surface film poten- tials. J. Mar. Res. 38: 193-204.
Wu, J. 1969. Wind stress and surface roughness at the air-sea interface. J. Geophys. Res. 74: 444-455.
Submitted: 5 March 1982 Accepted: 11 October 1982
This content downloaded from 91.229.229.49 on Sat, 14 Jun 2014 21:16:19 PMAll use subject to JSTOR Terms and Conditions