Dissolution of wollastonite during the experimental...
21
Dissolution of wollastonite during the experimental manipulation of Hubbard Brook Watershed 1 STEPHEN C. PETERS 1, *, JOEL D. BLUM 1 , CHARLES T. DRISCOLL 2 and GENE E. LIKENS 3 1 Department of Geological Sciences, University of Michigan, Ann Arbor, MI 48109, USA; 2 Department of Civil and Environmental Engineering, Syracuse University, Syracuse, NY 13244, USA; 3 Institute of Ecosystem Studies, Millbrook, NY 12545, USA; *Author for correspondence (e-mail: [email protected]; phone: (610) 758-3660; fax: (610) 758-3677. Address as of September, 2003: Department of Earth and Environmental Sciences, LeHigh University, Bethlehem, PA 18015) Received 24 June 2002; accepted in revised form 20 December 2002 Abstract. Powdered and pelletized wollastonite (CaSiO 3 ) was applied to an 11.8 ha forested watershed at the Hubbard Brook Experimental Forest (HBEF) in northern New Hampshire, U.S.A. during October of 1999. The dissolution of wollastonite was studied using watershed solute mass balances, and a 87 Sr/ 86 Sr isotopic tracer. The wollastonite ( 87 Sr/ 86 Sr = 0.70554) that was deposited directly into the stream channel began to dissolve immediately, resulting in marked increases in stream water Ca concentrations and decreases in the 87 Sr/ 86 Sr ratios from pre-application values of 0.872 mg/L and 0.72032 to values of 2.6 mg/L and 0.71818 respectively. After one calendar year, 401 kg of the initial 631 kg of wol- lastonite applied to the stream channel was exported as stream dissolved load, and 230 kg remained within the stream channel as residual CaSiO 3 and/or adsorbed on streambed exchange sites. Using pre- viously established values for streambed Ca exchange capacity at the HBEF, the dissolution rate for wollastonite was found to be consistent with dissolution rates measured in laboratory experiments. Ini- tially, Ca was released from the mineral lattice faster than Si, resulting in the development of a Ca- depleted leached layer on mineral grains. The degree of preferential Ca release decreased with time and reached stoichiometric proportions after 6 months. Using Sr as a proxy for Ca, the Ca from wollas- tonite dissolution can be accurately tracked as it is transported through the aquatic and terrestrial eco- systems of this watershed. Introduction Chemical weathering of silicate minerals is of central importance to understanding global biogeochemical cycles and long-term trends in the climate of the Earth (Berner et al. 1983; Kump et al. 2000). Chemical mass balance techniques in small watersheds have frequently been used to estimate mineral weathering rates (e.g., Casey et al. (1993); Drever and Zobrist (1992); Likens and Bormann (1995); Mast et al. (1990); Paces (1983) and Velbel (1985)). In this paper, we present two years of geochemical data from a watershed scale experiment where wollastonite (CaSiO 3 ) was applied to a forested catchment, with the goal of characterizing the fate of material applied directly to the stream channel. The experimental design al- lowed us to compare laboratory studies of the rate and mechanism of wollastonite dissolution with a large-scale experiment in a natural stream channel. © 2004 Kluwer Academic Publishers. Printed in the Netherlands. Biogeochemistry 67: 309–329, 2004.
Transcript of Dissolution of wollastonite during the experimental...

Dissolution of wollastonite during the experimentalmanipulation of Hubbard Brook Watershed 1
STEPHEN C. PETERS1,*, JOEL D. BLUM1, CHARLES T. DRISCOLL2 andGENE E. LIKENS3
1Department of Geological Sciences, University of Michigan, Ann Arbor, MI 48109, USA; 2Departmentof Civil and Environmental Engineering, Syracuse University, Syracuse, NY 13244, USA; 3Institute ofEcosystem Studies, Millbrook, NY 12545, USA; *Author for correspondence (e-mail: [email protected];phone: (610) 758-3660; fax: (610) 758-3677. Address as of September, 2003: Department of Earth andEnvironmental Sciences, LeHigh University, Bethlehem, PA 18015)
Received 24 June 2002; accepted in revised form 20 December 2002
Abstract. Powdered and pelletized wollastonite (CaSiO3) was applied to an 11.8 ha forested watershedat the Hubbard Brook Experimental Forest (HBEF) in northern New Hampshire, U.S.A. during Octoberof 1999. The dissolution of wollastonite was studied using watershed solute mass balances, and a 87Sr/86Sr isotopic tracer. The wollastonite (87Sr/86Sr = 0.70554) that was deposited directly into the streamchannel began to dissolve immediately, resulting in marked increases in stream water Ca concentrationsand decreases in the 87Sr/86Sr ratios from pre-application values of 0.872 mg/L and 0.72032 to valuesof ! 2.6 mg/L and 0.71818 respectively. After one calendar year, 401 kg of the initial 631 kg of wol-lastonite applied to the stream channel was exported as stream dissolved load, and 230 kg remainedwithin the stream channel as residual CaSiO3 and/or adsorbed on streambed exchange sites. Using pre-viously established values for streambed Ca exchange capacity at the HBEF, the dissolution rate forwollastonite was found to be consistent with dissolution rates measured in laboratory experiments. Ini-tially, Ca was released from the mineral lattice faster than Si, resulting in the development of a Ca-depleted leached layer on mineral grains. The degree of preferential Ca release decreased with time andreached stoichiometric proportions after ! 6 months. Using Sr as a proxy for Ca, the Ca from wollas-tonite dissolution can be accurately tracked as it is transported through the aquatic and terrestrial eco-systems of this watershed.
Introduction
Chemical weathering of silicate minerals is of central importance to understandingglobal biogeochemical cycles and long-term trends in the climate of the Earth(Berner et al. 1983; Kump et al. 2000). Chemical mass balance techniques in smallwatersheds have frequently been used to estimate mineral weathering rates (e.g.,Casey et al. (1993); Drever and Zobrist (1992); Likens and Bormann (1995); Mastet al. (1990); Paces (1983) and Velbel (1985)). In this paper, we present two yearsof geochemical data from a watershed scale experiment where wollastonite(CaSiO3) was applied to a forested catchment, with the goal of characterizing thefate of material applied directly to the stream channel. The experimental design al-lowed us to compare laboratory studies of the rate and mechanism of wollastonitedissolution with a large-scale experiment in a natural stream channel.
© 2004 Kluwer Academic Publishers. Printed in the Netherlands.Biogeochemistry 67: 309–329, 2004.

Field location & description
The Hubbard Brook Experimental Forest (HBEF) is located within the WhiteMountain National Forest of northern New Hampshire (43°56! N, 71°45! W). Thisstudy was conducted within the 11.8 ha south-facing watershed 1 (W-1, Figure 1).Watershed 1 is a third order perennial catchment with a northern hardwood forestof primarily sugar maple, (Acer saccharum), American beech (Fagus grandifolia),and yellow birch (Betula alleghaniensis), with red spruce (Picea rubens), balsamfir (Abies balsamea), and white birch (Betula papyrifera) at the highest elevationswithin the watershed. The ridgeline at 747 m forms the upper boundary of the wa-tershed, with the east and west boundaries delineated by local topographic highs.The bottom of the watershed is delineated by the stream-gauging weir at 488 melevation. The watershed is underlain by the Silurian age upper Rangeley forma-tion, a rusty weathering pelitic schist of sillimanite metamorphic grade. The bed-rock is covered with a variably thin (0–3 m) layer of Pleistocene ice-contact de-posits with Spodosols (Haplorthods) developed to an average depth of 60 cm(Johnson et al. 2000, 1991).
Studies of the interactions between chemical weathering and solute fluxes havebeen investigated at the HBEF for over 30 years (Johnson et al. 1981, 1968; Likensand Bormann 1995). Precipitation input to W-1 averages 130 cm/yr, with streamoutput accounting for 80 cm; and evapotranspiration the remaining 50 cm (Federeret al. 1990; Likens and Bormann 1995). In 1999–2000, stream discharge rangedfrom 0 to 300 L/s, with a median value of 1.4 L/s. The stream flowed nearly con-tinuously throughout this study, with undetectable discharge occurring for only twodays during the two-year period. High flow events have been used to characterizethe hydrologic flowpaths that influence the concentration of elements during storm-flow generation (Hogan et al. 2000). Both Ca and Sr concentrations were found tobe nearly independent of discharge, while Si and Na exhibited slight dilution dur-ing periods of increased flow.
The long-term depletion of Ca from the soil exchange complex has been ob-served in this (Likens et al. 1996, 1998) and other nearby watersheds (e.g., Baileyet al. (1996) and Hyman et al. (1998)), and provided the impetus to investigate thewatershed response to the experimental addition of Ca. As part of a larger projectdesigned to study the effects of Ca supply on the structure and function of a base-poor forested ecosystem, Ca was applied by helicopter to the watershed forest floorin the form of the mineral wollastonite. The extensive monitoring of the watershedand the accurate chemical and isotopic characterization of the wollastonite allowsthe dissolved material to be traced with a high degree of sensitivity during trans-port through the ecosystem, providing an ideal opportunity for the study of silicateweathering rates. The use of Ca/Sr and 87Sr/86Sr ratios to study Ca biogeochemis-try has been discussed previously (e.g., Capo et al. (1998)) and has been appliedsuccessfully to studies of the Hubbard Brook Experimental Forest and other NewEngland watersheds (e.g., Blum et al. (2000, 2002) and Bailey et al. (1996)). Inthis study, 87Sr/86Sr and Ca/Sr ratios are used to apportion stream water solutes toeither wollastonite dissolution or stream background. These solute fluxes can then
310

be utilized to calculate export rates for the dissolving wollastonite, resulting in ameasurement of the dissolution rate. Before presenting the results of the field ap-plication, we review a few previous field-based Ca manipulation experiments, andthe most relevant laboratory wollastonite dissolution experiments.
Figure 1. Location map of Hubbard Brook Experimental Forest and Watershed-1.
311

Previous Ca manipulation experiments
In an experiment designed to examine the stream response to the addition of basecations, solutions of CaCl2 and NaHCO3 were added to two parallel streams at theHBEF (Hall et al. 2001). The manipulated stream reaches were located approxi-mately 250 m downstream of the watershed-scale experiment described in thisstudy, and have comparable pH values to W-1 (pH 5.6–7). Both CaCl2 and NaHCO3
were added to one stream, while only CaCl2 was added to the other stream, at var-iable rates in order to maintain a stream Ca concentration of ! 120 µeq/L. Solutionchemistry was measured above and 50–80 m below the addition site. Calcium waspreferentially retained relative to Cl in both stream reaches, with more adsorptionobserved in the stream that received both CaCl2 and NaHCO3, resulting in a posi-tive relationship between pH and Ca retention. After additions of CaCl2 andNaHCO3 ceased, Ca was shown to desorb slowly from exchange sites. Over the2-month experiment, Ca retention on the exchange sites within the stream channelwas estimated to be between 0.5 and 2.5 eq Ca/m2 channel area (Hall et al. 2001).
As part of the Experimental Watershed Liming Study (EWLS) in the Adiron-dack Mountains of New York, CaCO3 was applied to both a ponded and a freeflowing watershed (Driscoll et al. 1996). After 2 years, the free flowing watershedhad delivered 2.2% of the CaCO3 to the lake, while the ponded catchment had de-livered 60% (Cirmo and Driscoll 1996). The continuous wetting of the CaCO3 inthe ponded watershed was the primary explanation for faster dissolution. A signif-icant amount of Ca had also adsorbed onto organic matter within wetted areas inthe ponded watershed. The exchangeable fraction of Ca on sphagnum moss withinthe treatment area was approximately 10 times that measured in an adjacent un-treated plot and accounted for nearly 8% of the total CaCO3 applied (Cirmo andDriscoll 1996). A concurrent study examined the behavior of Ca along a 3 kmstream reach draining the watershed area. Before the addition of CaCO3, Ca con-centrations were constant along the length of the stream reach, with a value of 120µeq/L. After the CaCO3 addition, streamwater pH decreased from 6.7 to 5.7 alongthe stream reach, with a corresponding 50–65% reduction in the Ca concentration.While most elements behaved conservatively, Ca was apparently partially removedthrough adsorption onto materials in the streambed.
Laboratory dissolution experiments
Wollastonite dissolution rates have been measured in several studies using fluid-ized bed reactors (Rimstidt and Dove 1986; Weissbart and Rimstidt 2000; Xie andWalther 1994). Most experimental work has been conducted on crushed, sieved,and alcohol washed wollastonite grains in the 75 to 250 µm size range, with BETsurface areas between 0.133 and 0.302 m2/g (Rimstidt and Dove 1986; Weissbartand Rimstidt 2000; Xie and Walther 1994). Rates measured using these techniquesrange from 5.0 ! 10"13 to 1.6 ! 10"12 mol Ca/cm2/s (Figure 2). While some resultsinitially suggested that the dissolution rate is pH dependant (Rimstidt and Dove1986; Xie and Walther 1994), later experiments conducted over a broad range of
312

pH values (pH 2–pH 6) demonstrated that the dissolution rate is not dependent onpH (Weissbart and Rimstidt 2000). The pH of the W-1 stream at the HBEF is withinthe range of pH values studied in laboratory experiments, with a pre-applicationpH value of ! 4.95 and post-application pH values of ! 5.5 to ! 6.0. Dissolutionrates for wollastonite have been shown to be temperature dependent, with the rateat 40 °C approximately 2–3 times faster than at 23.5 °C (Rimstidt and Dove 1986).Dissolution rates calculated using the average annual streamwater temperature andthe activation energy range from 1.6 ! 10"13 to 4.2 ! 10"13 mol Ca/cm2/s.
Wollastonite has been observed to dissolve incongruently in laboratory experi-ments, with Ca released preferentially relative to Si, leading to the development ofa leached layer (Weissbart and Rimstidt 2000; Xie and Walther 1994). The devel-opment of the leached layer results in increases in BET measured surface area anddecreases in release rates of both Ca and Si (Weissbart and Rimstidt 2000). Themorphology of this leached layer surface has been investigated and confirmedthrough interferometry (Grove et al. 2000) and high-resolution transmission elec-tron microscopy (Banfield et al. 1995).
Figure 2. Wollastonite dissolution rates measured in laboratory experiments (Weissbart and Rimstidt2000; Xie and Walther 1994). The gray box delineates the range of dissolution rates (6 ! 10"13 to 1.5 !10"12 mol Ca/cm2/s) from laboratory experiments. Arrows and a box on the x-axis indicate the pH val-ues of the W-1 stream at Hubbard Brook.
313

Methods
Wollastonite was mined from the No. 4 Quarry of the Valentine Mine in the north-western Adirondack Mountains of New York, a skarn deposit related to the Prot-erozoic Diana Complex metasyenite (Gerdes and Valley 1994). The wollastonitewas crushed to a mean grain size of 16 µm and formed into 1 to 3 mm pellets usinga water-soluble lignin sulfonate binder. The specific surface area of the wollasto-nite was measured using gas adsorption (BET) techniques and found to be 1.6 m2/g.
Streamwater samples were collected 10 m above the gauging weir at the base ofW1 in acid-cleaned bottles. Water from lysimeters was pumped using a peristalticpump, syringe filtered through a 0.45 µm polypropylene membrane, and stored inacid cleaned bottles. Elemental analysis of all water samples was conducted usingInductively Coupled Plasma Optical Emission Spectrometry (ICP-OES), Induc-tively Coupled Plasma Mass Spectrometry (ICP-MS) and ion chromatography (IC).The ICP-OES (PE-3300DV, Perkin Elmer, Norwalk, CT) and ICP-MS (ELEMENT,Finnigan, Bremen, Germany) instruments were calibrated using custom multiele-ment standards that were carefully matched to the streamwater composition. Work-ing standards were prepared from concentrated stock solutions the day of analysis.Calibration curves consistently had R2 values greater than 0.9999 and were linearover the calibrated range. Secondary standards (NIST-1643d) at full strength, anddiluted 1:10 to match stream chemistry were analyzed before and after each se-quence of samples. Measured values agreed with certified values to within 5%.
Strontium isotope ratios were determined by Thermal Ionization Mass Spectrom-etry (TIMS). A volume of water containing between 100–300 ng of Sr was evapo-rated and digested in a single drop of concentrated ultrapure HNO3. Samples wereevaporated again, redissolved in 3 M HNO3, and the Sr was separated using a Srspecific resin (Eichrom, Darien, IL, USA). Approximately 75 ng of Sr was evapo-rated, redissolved in 0.3 M H3PO4 and loaded onto tungsten single filaments withTa2O5 powder. The strontium isotopic composition was analyzed using a TIMS(MAT-262, Finnigan, Bremen, Germany) operated in static mode with the back-ground measured at half mass. The 87Sr/86Sr ratios were corrected for instrumentalfractionation by normalizing the 86Sr/88Sr ratio to 0.1194. Repeated measurementsof NBS-987 resulted in a mean 87Sr/86Sr value of 0.710252 ± 0.000013 (n = 161).
Results
Initial conditions
To characterize the chemical variability of the streamwater prior to wollastonite ap-plication, stream samples were collected weekly and analyzed for one year prior tothe date of application (Figures 3a–3g). Sixteen stream samples were also collectedduring precipitation events to measure solute variability during fluctuations in hy-drologic discharge. During the one-year period, the 87Sr/86Sr isotopic composition
314

of streamwater ranged from 0.72014 to 0.72060, (x̄ = 0.72032 ± 0.00006, 1!), andSr concentrations ranged from 2.37 to 7.30 µg/L (x̄ = 5.76 ± 0.49 µg/L, 1!).
Calcium concentrations ranged from 0.71 to 1.06 mg/L (x̄ = 0.87 ± 0.086 mg/L,1!), Na concentrations ranged from 0.59 to 1.24 mg/L (x̄ = 0.87 ± 0.12 mg/L, 1!),and Si concentrations exhibited the largest variability, with concentrations rangingfrom 1.2 to 2.5 mg/L (x̄ = 2.1 ± 0.26 mg/L, 1!) during the pre-application year.The concentrations of Ca and Na have been measured weekly for 36 years, and Siconcentrations for 29 years as part of the Hubbard Brook Ecosystem Study (Likensand Bormann 1995). The one-year pre-application values are statistically identicalto the long-term record for all elements except Ca (Table 1). Calcium concentra-tions had decreased over the long-term study (Likens et al. 1998) and were approx-imately 0.872 mg/L immediately prior to the application, compared to the 36-yearmean of 1.40 mg/L. For consistency, all calculations of changes in streamwaterchemistry due to the wollastonite were based on the one-year pre-application val-ues.
Wollastonite application
The chemical composition of the applied wollastonite is summarized in Table 2.The wollastonite has a considerably lower 87Sr/86Sr ratio and a higher Ca/Sr ratiothan the pre-application stream values. Solutes from wollastonite dissolution, whenmixed with the streamwater, should decrease the 87Sr/86Sr ratio and increase theCa/Sr ratio. The wollastonite was applied at a rate of 4.6 metric tons/ha (1.6 metrictons Ca/ha) over the entire watershed using a helicopter equipped with a 1-ton mo-torized spreader and a GPS navigation system to ensure an even application rate.To determine the amount of wollastonite that had been deposited into the streamchannel, we surveyed the channel area by measuring the bank to bank width at 5-mintervals along the length of the stream. The total streambed area was calculated tobe 1,804 m2, comprising 1.53% of the total 11.8 ha watershed. Using this area andthe application rate of 350 g/m2, approximately 631 kg of the total 55 tons of wol-lastonite is estimated to have fallen directly into the stream channel area during theapplication.
More than 98% of the wollastonite was added to the forest floor rather than thestreambed, and the possible influence of this wollastonite through shallow ground-water flowpaths was considered. Measurements of 87Sr/86Sr and Ca/Sr in watercollected from lysimeters placed in the Oa, Bh, and Bs soil horizons in 3 locationsthroughout the watershed indicate that Ca and Sr derived from wollastonite disso-lution was not substantially transported beyond the upper soil horizons during thefirst year after the application. Groundwater has been shown to contribute the ma-jority of water to streams, even during storm events (Kendall and MacDonnell1998), and solutes from wollastonite would first have to be dissolved and trans-ported in soil water to reach groundwater. Therefore, all calculations assume thatthe streamwater response to the experimental treatment is predominantly due to
315
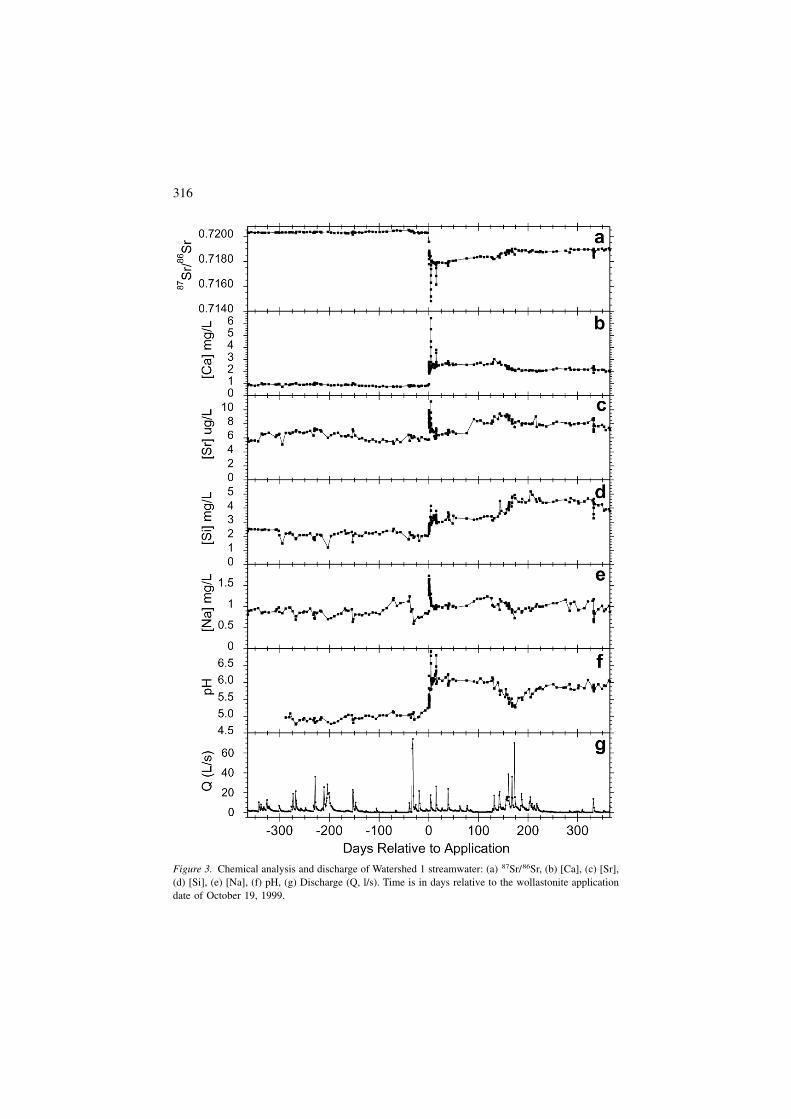
Figure 3. Chemical analysis and discharge of Watershed 1 streamwater: (a) 87Sr/86Sr, (b) [Ca], (c) [Sr],(d) [Si], (e) [Na], (f) pH, (g) Discharge (Q, l/s). Time is in days relative to the wollastonite applicationdate of October 19, 1999.
316

wollastonite dissolving in the streambed without significant contributions from thewollastonite deposited on the land surface.
The potential for suspended transport of particulate wollastonite from the wa-tershed was also considered. To measure particulate export, streamwater sampleswere collected and filtered throughout the experiment at various discharges rangingfrom low flow (min = 0.025 L/s) to stormflow (max = 69 L/s). Particulates retainedon the filters were then digested and analyzed, with detectable Ca found in 6 of 54samples. Two of the six samples were collected on the first day of application, andthe remaining four were collected during stormflow events on days 4, 15, and 161.During stormflow events, all filters with detectable Ca also contained Al and Mg,indicating some transport of minerals other than wollastonite. If all of the Ca wereattributable to wollastonite transport, the two samples obtained on the first day ofapplication would represent particulate Ca concentrations of 44 and 80 µg/L. Thiswould correspond to approximately 3.3% and 6.1% of the total dissolved Ca fromwollastonite during the same period. Similarly for the stormflow periods, particu-late Ca concentrations of 136, 119, and 80 µg/L on days 4, 15, and 161 would cor-respond to 7.7%, 7.6%, and 6.9% of the total Ca concentrations from wollastonitefor the same time periods. Analysis of particulate Al and Mg on the same filters
Table 1. Pre-application chemical composition of streamwater in W1. Variability is expressed as 1!.
36 year pre-application 1 year pre-application
87Sr/86Sr N/A 0.72032 ± .00006Ca 1.40 ± 0.35 mg/L 0.872 ± .086 mg/LSr N/A 6.23 ± 0.57 µg/LNa 0.82 ± 0.16 mg/L 0.86 ± 0.12 mg/LSi 2.00 ± 0.21 mg/L 2.13 ± 0.26 mg/LCa/Sr (mol) N/A 306
Table 2. Wollastonite pellet composition. Major element oxides are listed as weight percent. LOI is losson ignition at 800 °C to constant mass.
Wollastonite
87Sr/86Sr 0.70554CaO 41.6%SiO2 48.3%Ca/Sr (mol) 2,900MgO 1.82%Al2O3 0.49%Na2O 0.25%K2O 0.21%LOI 7.3%Mean particle size 16 µmBET surface area 1.6 m2/g
317

indicated Al concentrations of 40, 35, and 60 µg/L and Mg concentrations of 8, 3.5,and 7 µg/L, suggesting that a significant portion of the exported particulate Ca dur-ing storm events may not have been from wollastonite. In all cases, particulate Caconcentrations represent a maximum of 10% of the total dissolved concentration ofCa from wollastonite and for only limited time periods, and thus can be disregardedfor the purposes of this investigation.
Stream response to wollastonite application
Upon application of the wollastonite to W1 on October 19,1999, the 87Sr/86Sr iso-topic composition and Ca concentration of stream water changed markedly, reach-ing the most extreme values of 0.71481 and 6.43 mg/L during the first precipitationevent four days after the application (Figure 3a, 3b). Within a few weeks, the streamchemistry stabilized to a 87Sr/86Sr isotopic ratio of ! 0.71818 and Ca concentra-tion of ! 2.6 mg/L.
The concentration of Sr in stream water increased immediately, reaching a max-imum value of 11.2 µg/L during a precipitation event 4 days after the applicationdate (Figure 3c). Following the event, Sr concentrations returned to nearly pre-ap-plication values. The concentration of Si in the stream increased to a maximumvalue of 4.17 mg/L immediately after the application date (Figure 3d). This peakwas followed by a twelve-month period with moderately stable concentrations, withan average value of ! 3.4 mg/L. The concentration of Na in stream water increasedafter the application, reaching a maximum value of 1.73 mg/L on the first day ofthe application (Figure 3e). After 4 days, Na concentrations returned to pre-appli-cation values. The Na is attributed to the immediate dissolution of the sodium lig-nin-sulfonate binder used to pelletize the wollastonite, indicating disaggregation ofthese pellets in the stream channel. Streamwater pH increased following the appli-cation, reaching a maximum value of 6.93 during a precipitation event four daysafter the application and then stabilized at an average value of ! 6.0 after 21 days(Figure 3f).
Precipitation events that occurred 1, 4, and 15 days after the application resultedin pulses of increased Ca and Si concentrations, and corresponding decreases in the87Sr/86Sr ratio (Figure 3g). After two months, elevated discharge related to precipi-tation events had either no effect, or only slightly reduced the Ca and Si concen-trations.
Discussion
Initial conditions & immediate stream response
The measurement of stream chemistry for the year prior to the wollastonite appli-cation confirmed that the strontium isotopic composition and Ca concentration ofthis stream were extremely stable, and that the effects of small additions of Ca and
318

Sr bearing material could be distinguished from stream background values. Alsoimportant is the observation that the one year of pre-application data are not sta-tistically different from the 36-year archive of stream chemistry, except for Ca.These data suggest that we have an accurate measure of the pre-application condi-tions with which to compare to the post-application results. The pulses of increasedCa and Si concentrations on days 1, 4 and 15 are most likely due to the dissolutionof the finest particle sizes within the stream banks that were wetted as the waterlevel rose during these high flow periods. Following the initial dissolution of thisfine fraction, concentrations appeared to stabilize for the remainder of the experi-ment. This accelerated dissolution rate early in the experiment is similar to obser-vations made in laboratory dissolution experiments.
Apportioning solutes using Sr isotopes
The dissolution of wollastonite in the stream was examined using a two-componentisotope solute mixing model. A strontium isotope mixing diagram was constructedwith the pre-application stream background and wollastonite endmembers plottedand connected by a thick gray line (Figure 4). Stream chemistry data were plottedas a series of connected points in chronological order. Mixing appears to have beenlinear between the two endmembers, with two large excursions toward the wollas-tonite endmember coinciding with increases in Ca and decreases in 87Sr/86Sr dur-ing post-application precipitation events. The strontium isotopic composition of thestreamwater was the result of the contribution of Sr from wollastonite dissolution(XSr) mixed with the background streamwater Sr, which is described by the fol-lowing equation:
" 87Sr86Sr
#Stream ! "XSr#" 87Sr86Sr
#Wollastonite $ "1 % XSr#" 87Sr86Sr
#Bkgnd
Although the rigorous solution for this mixing relation necessitates the use of87Sr/Srtotal, substituting the 87Sr/86Sr ratio does not significantly alter the resultswhen endmember isotopic compositions are within 10%, as was the case in thisstudy. Solving for XSr, the fraction of streamwater Sr that was attributable to wol-lastonite, yields the equation:
XSr ! $ " 87Sr86Sr#Stream % " 87Sr
86Sr#Bkgnd
" 87Sr86Sr#Wollastonite % " 87Sr
86Sr#Bkgnd%
Using Sr as a proxy for Ca, the mole fraction of Ca in the stream water that was
319

derived from wollastonite dissolution is given by:
XCa ! $ "" 87Sr86Sr#Stream % " 87Sr
86Sr#Bkgnd#"Sr
Ca#Bkgnd
"" 87Sr86Sr#Stream % " 87Sr
86Sr#Bkgnd#"Sr
Ca#Bkgnd $ "" 87Sr86Sr#Wollastonite % " 87Sr
86Sr#Stream#"Sr
Ca#Wollastonite%
where Sr/Ca is the ratio of Sr to Ca in each endmember. This factor (XCa) is plot-ted as a function of stream water 87Sr/86Sr and stream water Ca/Sr in Figure 5, andthen multiplied by the stream water Ca concentration to apportion the solutes toeither the stream background or the dissolution of wollastonite (Figures 6b, 6c).
Calculation of wollastonite dissolution rate
In laboratory experiments, mineral dissolution rates (ri) are generally calculated us-ing the following equation:
ri ! "rf&"'m("in# % 'm("out##
"mass#&Asp#
Figure 4. Isotope mixing diagram. One year of pre-application data are plotted as the streamwaterbackground endmember. The wollastonite endmember from Table 2 plots below the x-axis. The grayline is a linear mixing calculation between these two endmembers. The two large excursions towardsthe wollastonite endmember coincide with storm events immediately following the application. Sampleswere taken hourly during storm events, daily for the first 17 days, and weekly thereafter.
320

where rf is the solution flow rate and ([m](in)"[m](out)) is the change in the soluteconcentrations through a column or reactor. These two variables, taken together,define the release rate for the reaction. This release rate is then divided by the totalsurface area, given by the product of the mass of the reacting substance and itsspecific surface area, Asp. We have treated the stream as a reactor, and thus, thearrangement of all parameters is similar, though larger in scale. The release rate, orflux of Ca from wollastonite dissolution (JCa) is given by:
JCa ! XCa&'Ca(Stream&JH2O
where JH2O was the flux of water measured at the gauging weir. The Ca flux wasthen converted to a mass of exported wollastonite by dividing by the amount of Caper unit of wollastonite (0.345 g/g). This wollastonite flux was then subtracted fromthe initial quantity of wollastonite to determine how much remained in the stre-ambed (Figure 6d). Starting from the initial quantity of wollastonite deposited inthe stream channel of 631 kg, we calculate that an amount of Ca equivalent to ap-proximately 230 kg of wollastonite remained in the stream channel after 365 days.
An apparent dissolution rate (ADR) for wollastonite for each water sample ana-lyzed was then calculated by dividing this Ca flux (JCa) by the mineral surface area
Figure 5. Mixing diagram showing 87Sr/86Sr and Ca/Sr of streamwater as a function of the proportionof Ca from wollastonite (XCa). Solid lines illustrate continuous calculated mixing between the back-ground stream and wollastonite endmembers, with Ca/Sr (circles) and 87Sr/86Sr (squares) plotted forindividual streamwater samples.
321

Figure 6. Streamwater response to wollastonite application. (a) Streamwater 87Sr/86Sr, (b) the fractionof Ca attributable to wollastonite dissolution, (c) the concentration of Ca in streamwater (upper line),and the calculated background concentration of Ca determined by Sr isotopes (lower line) (Note: thedifference between these curves is Ca derived from wollastonite dissolution), (d) the amount of CaSiO3
remaining in the watershed (initial conditions – export), (e) the calculated apparent dissolution rate(ADR) of wollastonite, (f) the predicted streamwater Ca concentration at a dissolution rate of 4.2 !10"13 mol Ca/cm2/s (!) and, 1.6 ! 10"13 mol Ca/cm2/s ("), and (g) stream discharge (Q, in L/s) fol-lowing the application of wollastonite.
322

of the material that was actively dissolving in the stream (Figure 6e).
ADR ! " JCa
mass&Asp#
Calculated ADRs varied by nearly four orders of magnitude during the year-longstudy; which is far beyond the magnitude of variation observed during laboratoryexperiments. Typical variability ranges from factors of 2–3 within studies, to aboutfactors of 2–20 between different studies (e.g., Swoboda Colberg and Drever (1993)and Weissbart and Rimstidt (2000), Xie and Walther (1994)). To determine thecause of the variability observed in our study, we explored the variability in pa-rameters used to calculate the dissolution rate: mineral surface area, hydrologic flux,and streamwater Ca concentration.
The calculation of a dissolution rate uses an estimate of mineral surface area,which is equal to the total mass of reacting material multiplied by the specific sur-face area per unit mass of material. In this experiment, nearly 50% of the total massof wollastonite was exported in solution via the stream. To account for this export,the total reactive mass used in the calculation was reduced during each period ofthe experiment by an amount equal to the wollastonite export during the prior pe-riod. This is a correction that is not necessary in laboratory experiments, since lessthan 5% of the material is usually dissolved by the end of the experimental run. Ifthis reduction in mass were not considered in this calculation, it would result in arate approximately two times slower than the present calculations. The specific sur-face area used in calculations was measured before the application, which is thesame convention employed in laboratory experiments. During the course of labo-ratory experiments, specific surface area of wollastonite has been observed to in-crease by a factor of 2–100 over the starting material. This increase in mineral sur-face area is most likely related to the thickening of the leached layer, which alsoresults in a decrease in release rate. The convention of using the initial specific sur-face area might be expected to influence the rate calculations from this study andlaboratory experiments equally, and should not cause significant discrepancies be-tween dissolution rates. Additionally, changes in the specific surface area and massof dissolving wollastonite would affect the calculated dissolution rates graduallyduring the experiment, and thus could not explain the complex pattern of short-period variations that is observed.
The two remaining parameters used in the calculation of the dissolution rate arethe hydrologic flow rate, and the stream Ca concentration. The interplay betweenthese two variables is critical in laboratory experiments. The behavior of systemsfar from equilibrium is such that an increase in flow rate results in a coincidentdecrease in solute concentration, maintaining a constant release rate. During thisstudy, stream discharge fluctuated from 0.03 to 120 L/s, with little or no corre-sponding change in the stream Ca concentration. This relation might be expected ifstreamwater Ca and Si concentrations were close to saturation with wollastonite orsome other solid mineral phase. However, the most concentrated streamwater sam-
323

ple measured in this study is highly undersaturated with respect to wollastonite,with a saturation index (SI, defined as log(IAP/Ksp) = "7.1). The most saturatedphases are amorphous silica (SI = 0.250 to "0.287).
One possible explanation for the nearly constant Ca concentrations observed inthe stream is that the system was buffered by the cation exchange complex in thehyporheic zone in direct contact with the stream water. To consider the feasibilityof this hypothesis, we used laboratory dissolution rates to predict stream Ca con-centrations in the absence of ion exchange, and then compared them with measuredstream Ca concentration values. For dissolution rates ranging from 1.5 ! 10"12 to 6! 10"13 mol Ca/cm2/s (the full range of experimentally determined values), thestreamwater Ca concentration is predicted using the equation:
'Ca(p !r&n&A
JH2O
where r is the selected dissolution rate, n is the quantity of wollastonite that is dis-solving in the streambed expressed as moles of Ca, and A is the total surface area.The predicted Ca concentrations and the measured streamwater Ca concentrationswere compared and plotted in Figure 6f. Predicted Ca concentrations varied bymore than a factor of 100 while measured concentrations varied by less than a fac-tor of 1.5.
The difference between predicted and calculated Ca concentrations may be dueto the retention or loss of Ca from an exchangeable pool. The amount of Ca se-questered in this pool was investigated by multiplying the predicted Ca concentra-tions discussed above by the hydrologic flux (JH2O) to determine the predicted fluxof Ca from wollastonite dissolution, and then comparing this calculated value withthe measured streamwater Ca flux at the weir. The difference between these twofluxes was either added to or removed from the exchange pool for each time step.This calculation was performed for the two dissolution rates discussed previouslythat bracket all previous laboratory experiments (1.6 ! 10"13, 4.2 ! 10"13
mol Ca/cm2/s), and the rate that would explain dissolution in this system withoutany retention of Ca on exchange sites (1 ! 10"14 mol Ca/cm2/s). The relationshipbetween mineral dissolution rate and stream cation exchange capacity necessary toexplain the stream Ca fluxes was calculated and is plotted in Figure 7a.
Before the addition of wollastonite, the Ca concentration of streamwater (and byinference, the stream bed material Ca cation exchange pool) has been steadily de-clining to a 36 year low (Likens et al. 1996, 1998). The addition of wollastoniteand subsequent changes in stream solute concentrations would be expected to sig-nificantly perturb the streambed cation exchange complex equilibrium. Assumingthat the dissolution rates obtained in laboratory experiments are reasonable esti-mates, the streambed exchange pool appears to have accumulated Ca, reaching aplateau of ! 1.4 eq Ca/m2 approximately 20 days after the wollastonite applica-tion. At this time, the streambed exchange pool had presumably equilibrated withthe considerably higher Ca concentrations in the streamwater. The streambed ex-
324

change capacity of 1.4 eq Ca/m2 compares favorably with data obtained by Hall etal. (2001), who measured the streambed exchange capacities 200 m downstream ofthe W-1 weir to be 0.5 to 2.5 eq Ca/m2. Considering this exchangeable componentof stream chemistry, the wollastonite dissolution rates previously measured in thelaboratory can be reconciled with our observations of the stream response to thewollastonite addition.
This result provides insight into several hypotheses put forth to explain the ob-served differences between laboratory and field measured dissolution rates on thesame silicate minerals. Weathering rates determined using field techniques havetypically been between 1 and 3 orders of magnitude slower than those determinedexperimentally in the laboratory (Velbel 1993). Possible explanations for this dis-crepancy have been discussed extensively (e.g., Blum and Stillings (1995)) and in-
Figure 7. Wollastonite remaining in the stream channel (open circles) with time following the applica-tion of wollastonite. (a) For the dissolution rates of 4.2 ! 10"13 mol Ca/cm2/s 1.6 ! 10"13 mol Ca/cm2/sand 1 ! 10"14 mol Ca/cm2/s (Exchange = 0), the wollastonite remaining is calculated and plotted (thinblack lines). (b) Calculated Ca on the exchange complex (dashed lines). The wollastonite mass equiva-lent of the amount of Ca on exchange sites is given on the left Y-axis. The corresponding exchangecapacity is given on the right Y-axis.
325
clude: the dependence on solution saturation state, difficulties measuring field re-active surface area, unsaturated zone hydrology, and the influence of wetting anddrying cycles. In this experiment, the system was far from equilibrium and nearlycontinuously wetted, much like laboratory column experiments. General agreementof the results of this field experiment with laboratory rates is therefore consistentwith these rate-limiting environmental parameters providing an explanation for thediscrepancy between field and laboratory measured dissolution rates.
Dissolution stoichiometry
The ratio of Ca to Si released from the wollastonite mineral structure in the W-1stream can be illustrated in a graph of Si/Ca vs Sr/Ca (Figure 8). During the firstfew weeks of the experiment, Ca was released at a faster rate than Si. The degreeof preferential release of Ca decreased with time during the first 6 months of theexperiment by which time the release was nearly stoichiometric. Data collected af-ter ! 6 months show a more rapid release of Si than Ca. This difference is consis-tent with experimental results, which show preferential leaching of Ca during theinitial stages of wollastonite dissolution resulting in Ca-depleted mineral surfaces(Weissbart and Rimstidt 2000). While most laboratory experiments only view theinitial release of Ca, this experiment was conducted for a long enough duration toallow the dissolution of the residual Ca-depleted wollastonite mineral phase.
Conclusions
The application of wollastonite to a forested watershed within the HBEF presentsthe opportunity to observe the dissolution of a well-studied silicate mineral in anatural environment. Stream Ca concentrations could be accurately attributed to ei-ther wollastonite dissolution or stream water background using the distinct 87Sr/86Sr and Ca/Sr ratios of both the background stream water and the applied wollas-tonite. After accounting for cation exchange within the stream channel bed mate-rials, the dissolution rate determined in laboratory experiments is consistent withobserved changes in stream chemistry as a result of the wollastonite application.
The analysis of Ca and Si from wollastonite dissolution suggests preferential re-lease of Ca over Si in the initial stages of weathering, followed by a period of sto-ichiometric release, and finally a period of preferential Si release. This observationsupports previous laboratory experimental results that demonstrated the develop-ment of a Ca-depleted surface layer during initial stages of mineral dissolution.
The proportion of Ca from wollastonite dissolution in any ecosystem compo-nent can be quantified using the 87Sr/86Sr and Ca/Sr ratios. Thus, the movement ofCa released by wollastonite dissolution can be traced through the aquatic and ter-restrial ecosystems, allowing us to study the pathways and rates of Ca transfer.
326

Acknowledgements
The authors would like to thank A. Klaue, S. Bailey, D. Buso, S. Palmer, J. Hogan,T.C.W. Ku and A. Jacobson for their contributions. The comments of two anony-mous reviewers improved the manuscipt. Support for this study was provided bythe National Science Foundation and the A. W. Mellon Foundation. The HubbardBrook Experimental Forest is operated and maintained by the Northeastern ForestExperiment Station, U.S. Department of Agriculture, Newtown Square, Pennsylva-nia.
References
Bailey S.W., Hornbeck J.W., Driscoll C.T. and Gaudette H.E. 1996. Calcium inputs and transport in abase-poor forest ecosystem as interpreted by Sr isotopes. Water Resources Research 32: 707–719.
Banfield J.F., Ferruzzi G.G., Casey W.H. and Westrich H.R. 1995. HRTEM study comparing naturallyand experimentally weathered pyroxenoids. Geochimica et Cosmochimica Acta 59: 19–31.
Figure 8. Plot of Sr/Ca vs Si/Ca for wollastonite and streamwater. Pre-application values and their 95%confidence interval are plotted on the right side of the graph. Tie lines connect the edges of the 95%confidence intervals with the wollastonite endmember. Data within this field are indistinguishable from1:1 Ca:Si dissolution. Post application values are plotted in the middle of the graph. Initial values plotbelow the lower tie line indicating Ca > Si release. Samples collected a few months after the applicationshow 1:1 Ca:Si dissolution. Samples taken > ! 6 months after the application show Ca < Si release.
327

Berner R.A., Lasaga A.C. and Garrels R.M. 1983. The carbonate-silicate geochemical cycle and its ef-fect on atmospheric carbon-dioxide over the past 100 million years. American Journal of Science283: 641–683.
Blum A.E. and Stillings L.L. 1995. Feldspar dissolution kinetics. In: White A.F. and Brantley S.L. (eds),Chemical Weathering Rates of Silicate Minerals. Vol. 31. Mineralogical Society of America, Wash-ington, DC, USA, pp. 291–346.
Blum J.D., Klaue A., Nezat C.A., Driscoll C.T., Johnson C.E., Siccama T.G. et al. 2002. Mycorrhizalweathering of apatite as an important Ca source in base-poor forest ecosystems. Nature 417: 729–731.
Blum J.D., Taliaferro E.H., Weisse M.T. and Holmes R.T. 2000. Changes in Sr/Ca, Ba/Ca and 87Sr/86Srratios between trophic levels in two forest ecosystems in the northeastern USA. Biogeochemistry49: 87–101.
Capo R.C., Stewart B.W. and Chadwick O.A. 1998. Strontium isotopes as tracers of ecosystem pro-cesses: theory and methods. Geoderma 82: 197–225.
Casey W.H., Banfield J.F., Westrich H.R. and McLaughlin L. 1993. What do dissolution experimentstell us about natural weathering. Chemical Geology 105: 1–15.
Chamberlin T. 1899. An attempt to frame a working hypothesis of the cause of glacial periods on anatmospheric basis. Journal of Geology 7: 545–584.
Cirmo C.P. and Driscoll C.T. 1996. The impacts of a watershed CaCO3 treatment on stream and wetlandbiogeochemistry in the Adirondack Mountains. Biogeochemistry 32: 265–297.
Drever J.I. and Zobrist J. 1992. Chemical-weathering of silicate rocks as a function of elevation in thesouthern Swiss Alps. Geochimica et Cosmochimica Acta 56: 3209–3216.
Driscoll C.T., Cirmo C.P., Fahey T.J., Blette V.L., Bukaveckas P.A., Burns D.A. et al. 1996. The experi-mental watershed liming study: Comparison of lake and watershed neutralization strategies. Bio-geochemistry 32: 143–174.
Federer C.A., Flynn L.D., Martin C.W., Hornbeck J.W. and Pierce R.S. 1990. Thirty Years of Hydro-metric Data at the Hubbard Brook Experimental Forest, New Hampshire. USDA General TechnicalReport NE-141..
Gerdes M. and Valley J. 1994. Fluid flow and mass-transport at the Valentine wollastonite deposit, Ad-irondack Mountains, New York State. Journal of Metamorphic Geology 12: 589–608.
Grove E.R., Beig M.S. and Luttge A. 2000. Wollastonite dissolution kinetics: temperature, pH depen-dence, and the formation of leached layers studied by VSI. In: Abstracts with Programs. GeologicalSociety of America, Reno, NV, USA.
Hall R.O., Macneale K.H., Bernhardt E.S., Field M. and Likens G.E. 2001. Biogeochemical responsesof two forest streams to a 2-month calcium addition. Freshwater Biology 46: 291–302.
Hogan J.D., Blum J.D. and Driscoll C.T. 2000. Concentration-discharge relationships during stormevents at the Hubbard Brook Experimental Forest. In: EOS, Transactions, San Francisco, (p F465).American Geophysical Union.
Hyman M.E., Johnson C.E., Bailey S.W., April R.H. and Hornbeck J.J. 1998. Chemical weathering andcation loss in a base-poor watershed. Geological Society of America Bulletin 110: 85–95.
Johnson C.E., Driscoll C.T., Siccama T.G. and Likens G.E. 2000. Element fluxes and landscape positionin a northern hardwood forest watershed ecosystem. Ecosystems 3: 159–184.
Johnson C.E., Johnson A.H., Huntington T.G. and Siccama T.G. 1991. Whole-tree clear-cutting effectson soil horizons and organic-matter pools. Soil Science Society of America Journal 55: 497–502.
Johnson N.M., Driscoll C.T., Eaton J.S., Likens G.E. and McDowell W.H. 1981. #Acid rain#, dissolvedaluminum and chemical weathering at the Hubbard Brook Experimental Forest, New Hampshire.Geochimica et Cosmochimica Acta 45: 1421–1437.
Johnson N.M., Likens G.E., Bormann F.H. and Pierce R.S. 1968. Rate of chemical weathering of sili-cate minerals in New Hampshire. Geochimica et Cosmochimica Acta 32: 531–545.
Kendall C. and MacDonnell J.J. 1998. Isotope Tracers in Catchment Hydrology. Elsevier.Kump L.R., Brantley S.L. and Arthur M.A. 2000. Chemical, weathering, atmospheric CO2, and climate.
Annual Review of Earth and Planetary Sciences 28: 611–667.
328
Likens G.E. and Bormann F.H. 1995. Biogeochemistry of a Forested Ecosystem. Springer-Verlag, NewYork, NY, United States.
Likens G.E., Driscoll C.T. and Buso D.C. 1996. Long-term effects of acid rain: Response and recoveryof a forest ecosystem. Science 272: 244–246.
Likens G.E., Driscoll C.T., Buso D.C., Siccama T.G., Johnson C.E., Lovett G.M. et al. 1998. The bio-geochemistry of calcium at Hubbard Brook. Biogeochemistry (Dordrecht) 41: 89–173.
Mast M.A., Drever J.I. and Baron J. 1990. Chemical-weathering in the Loch Vale Watershed, Rocky-Mountain- National-Park, Colorado. Water Resources Research 26: 2971–2978.
Paces T. 1983. Rate constants of dissolution derived from the measurements of mass balance in hydro-logical catchments. Geochimica et Cosmochimica Acta 47: 1855–1863.
Rimstidt J.D. and Dove P.M. 1986. Mineral solution reaction-rates in a mixed flow reactor – wollasto-nite hydrolysis. Geochimica et Cosmochimica Acta 50: 2509–2516.
Swoboda Colberg N.G. and Drever J.I. 1993. Mineral dissolution rates in plot-scale field and laboratoryexperiments. Chemical Geology 105: 51–69.
Velbel M.A. 1985. Geochemical mass balances and weathering rates in forested watersheds of thesouthern Blue Ridge. American Journal of Science 285: 904–930.
Velbel M.A. 1993. Constancy of silicate mineral weathering-rate ratios between natural and experimen-tal weathering – Implications for hydrologic control of differences in absolute rates. Chemical Ge-ology 105: 89–99.
Weissbart E.J. and Rimstidt J.D. 2000. Wollastonite: Incongruent dissolution and leached layer forma-tion. Geochimica et Cosmochimica Acta 64: 4007–4016.
Xie Z.X. and Walther J.V. 1994. Dissolution stoichiometry and adsorption of alkali and alkaline-earthelements to the acid-reacted wollastonite surface at 25 degrees C. Geochimica et Cosmochimica Acta58: 2587–2598.
329


![Investigation of hydrothermal synthesis of wollastonite ...jcpr.kbs-lab.co.kr/file/JCPR_vol.11_2010/JCPR11-3/14[1].348-353.pdf · Investigation of hydrothermal synthesis of wollastonite](https://static.fdocuments.us/doc/165x107/5adae79a7f8b9ae1768dce91/investigation-of-hydrothermal-synthesis-of-wollastonite-jcprkbs-labcokrfilejcprvol112010jcpr11-3141348-353pdfinvestigation.jpg)