Dissipation of atrazine residues from soils
8
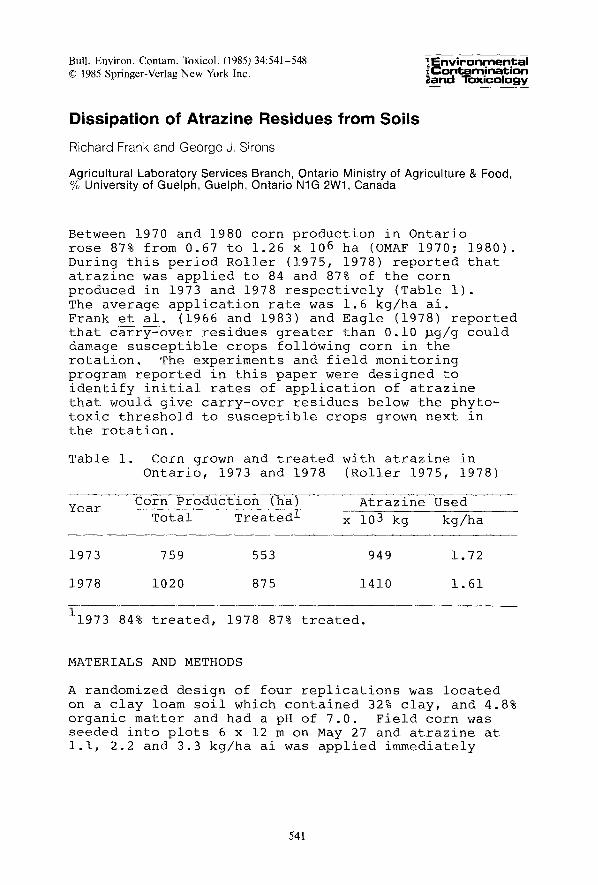
Bull. Environ. Contam. Toxicol. (1985) 34:541-548 1985 Springer-Verlag New York Inc. ~= Environmental jContamination =and Toxicology Dissipation of Atrazine Residues from Soils Richard Frank and George J. Sirons Agricultural Laboratory Services Branch, Ontario Ministry of Agriculture & Food, % University of Guelph, Guelph, Ontario N1G 2W1, Canada Between 1970 and 1980 corn production in Ontario rose 87% from 0.67 to 1.26 x 10⁶ ha (OMAF 1970; 1980). During this period Roller (1975, 1978) reported that atrazine was applied to 84 and 87% of the corn produced in 1973 and 1978 respectively (Table i). The average application rate was 1.6 kg/ha ai. Frank et al. (1966 and 1983) and Eagle (1978) reported that carry-over residues greater than 0.i0 Dg/g could damage susceptible crops following corn in the rotation. The experiments and field monitoring program reported in this paper were designed to identify initial rates of application of atrazine that would give carry-over residues below the phyto- toxic threshold to susceptible crops grown next in the rotation. Table i. Corn grown and treated with atrazine in Ontario, 1973 and 1978 (Roller 1975, 1978) Year Corn Production (ha) Total Treated • Atrazine Used x 103 kg kg/ha 1973 759 553 949 1.72 1978 1020 875 1410 1.61 11973 84% treated, 1978 87% treated. MATERIALS AND METHODS A randomized design of four replications was located on a clay loam soil which contained 32% clay, and 4.8% organic matter and had a pH of 7.0. Field corn was seeded into plots 6 x 12 m on May 27 and atrazine at i.i, 2.2 and 3.3 kg/ha ai was applied immediately 541
-
Upload
richard-frank -
Category
Documents
-
view
212 -
download
0
Transcript of Dissipation of atrazine residues from soils
Bull. Environ. Contam. Toxicol. (1985) 34:541-548 �9 1985 Springer-Verlag New York Inc.
~= E n v i r o n m e n t a l j C o n t a m i n a t i o n =and T o x i c o l o g y
Dissipation of Atrazine Residues from Soils
Richard Frank and George J. Sirons
Agricultural Laboratory Services Branch, Ontario Ministry of Agriculture & Food, % University of Guelph, Guelph, Ontario N1G 2W1, Canada
Between 1970 and 1980 corn production in Ontario rose 87% from 0.67 to 1.26 x 10⁶ ha (OMAF 1970; 1980). During this period Roller (1975, 1978) reported that atrazine was applied to 84 and 87% of the corn produced in 1973 and 1978 respectively (Table i). The average application rate was 1.6 kg/ha ai. Frank et al. (1966 and 1983) and Eagle (1978) reported that carry-over residues greater than 0.i0 Dg/g could damage susceptible crops following corn in the rotation. The experiments and field monitoring program reported in this paper were designed to identify initial rates of application of atrazine that would give carry-over residues below the phyto- toxic threshold to susceptible crops grown next in the rotation.
Table i. Corn grown and treated with atrazine in Ontario, 1973 and 1978 (Roller 1975, 1978)
Year Corn Production (ha)
Total Treated • Atrazine Used
x 103 kg kg/ha
1973 759 553 949 1.72
1978 1020 875 1410 1.61
11973 84% treated, 1978 87% treated.
MATERIALS AND METHODS
A randomized design of four replications was located on a clay loam soil which contained 32% clay, and 4.8% organic matter and had a pH of 7.0. Field corn was seeded into plots 6 x 12 m on May 27 and atrazine at i.i, 2.2 and 3.3 kg/ha ai was applied immediately
541

using a tractor mounted sprayer delivering 40 L/ha of water (Table 2). Soil on the plot was sampled at three depths, namely 0-6, 6-13 and 13-25 cm, 0.2, 2.0, 3.5, 5 and 12 months after application using a probe. The experimental plots were plowed in late October, 5.5 months after application.
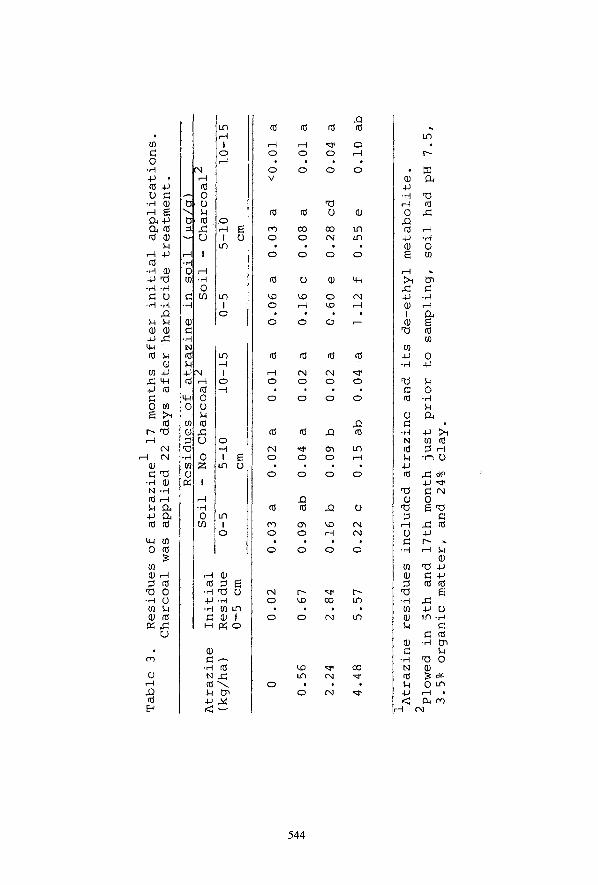
A split plot randomized block design of four replica- tions was located on a loam soil which contained 24% clay and 3.5% organic matter and had a pH of 7.5. Atrazine at 0.56, 2.2 and 4.5 kg/ha ai was applied on May 25 with a tractor mounted sprayer delivering 45 L/ha of water (Table 3). Split plots (6 x 12 m) were treated with activated charcoal 22 days after spraying and the charcoal was incorporated by roto- tiller. The experimental area was plowed in the 5th and 17th month after spraying. Following the second plowing in late October the second year, samples were taken at three depths namely 0-5, 5-10 and 10-15 cm for analysis.
Between 1970 and 1980 surficial soil samples (0-6 cm) were collected from a large number of sites across the province where known rates of atrazine had been applied. These included experimental farms and commercial farms. The data recorded included the rate and time of application and the date of sampling.
The analytical procedure described by Sirons et al. (1973) was used for the extraction and quantitation of atrazine and its metabolite de-ethylatrazine. Air dried soil samples (i00 g) were extracted with 600 ml of a 2:1 acetonitrile-water mixture by mechanical shaker. The initial shake was 40 min and after standing overnight a second shaking for 40 min was given. The extract (ca 500 ml) was filtered through a coarse porosity sintered glass funnel into a second flask. The acetonitrile was evaporated on a rotary evaporator and the water phase was transferred into a separatory funnel with 600 ml of water. The pH was adjusted to 9 by the addition of 0.4 ml of 2N NH40H. Atrazine and its metabolite were partitioned into chloroform. After filtering, the chloroform was evaporated to almost dryness by rotary evaporation at 50oc. Isooctane (i0 ml) was added and the last remnants of chloroform were evaporated off. The residue was dissolved in methanol (5 ml) and injected into a GLC for qualitative and quantitative analysis.
542

Table 2.
Residues
of atrazine
in soil 0.2, 2, 3.5,
5 and 12 months after application
on a
clay
loam soi$ (Field Experiment
I)
Residue of atrazine 2 in dry soil (~g/g)
Half
Atrazine
Soil I
Months after application
Life
Regression
kg/ha
Depth
Dissipation
Equation
(cm)
0.2
2 3.5
5 123
(Months)
t~
4~
i.i
O- 6
0.83 f4
0.50 d
0.37 c
0.23 b
0.08 a
3.6
Log Y
= -0.13 -
0.08X
6-13
0.04 a
0.02 a
0.07 a
0.08 a
0.03 a
r2= 0.98
13-25
0.01 a
0.02 a
0.07 a
0.05 a
0.05 a
F =
125.5
2.2
O- 6
1.38 g
0.90 f
0.60 e
0.40 c
0.09 a
3.0
Log Y
= 0.14 -
0.i0 X
6-13
0.04 a
0.03 a
0.07 a
0.03 a
0.09 a
r2= 0.99
13-25
0.01 a
0.02 a
0.05 a
0.01 a
0.06 a
F =
1044.
3.3
O- 6
2.23 h
1.29 g
0.90 f
0.61 e
0.20 b
3.5
Log Y
= 0.29 -
0.09 X
6-13
0.19 b
0.07 a
0.06 a
0.04 a
0.08 a
r2= 0.98
13-25
0.01 a
0.07 a
0.06 a
0.02 a
0.06 a
F =
126.0
iSoil characteristics
32~ clay, 4.8~ organic matter,
7.1 pH
2Atrazine residues
included atrazine and its de-ethyl metabolite
3plowed in late October,
5.5 months after application
4Significantly
different at P
0.05 by Dumcan's Multiple Range Test
Table
3.
Atrazine
(kg/ha)
Residues
of atrazine I
17 months
after
initial
applications.
Charcoal
was
applied
22 days
after
herbicide
treatment.
....
Residues
of atrazine
in soil
(~g/g)
....
Initial
Soil
- No Charcoal '2
Soil
- Charcoal i
Residue
0-5
5-10
10-15
0-5
5-10
10-15
0-5
cm
cm
cm
%m
4~
4~
0 0.02
0.03
a 0.02
a 0.01
a 0.06
a 0.03
a <0.01
a
0.56
0.67
0.09
ab
0.04
a 0.02
a 0.16
c 0.08
a 0.01
a
2.24
2.84
0.16
b 0.09
b 0.02
a 0.60
e 0.28
cd
0.04
a
4.48
5.57
0.22
c 0.15
ab
0.04
a 1.12
f 0.55
e 0.i0
ab
iAtrazine
residues
included
atrazine
and
its
de-ethyl
metabolite.
2plowed
in 5th
and
17th month
just
prior
to sampling,
soil
had
pH 7.5,
3.5%
organic
matter,
and 24%
clay.

A Tracor 550 GLC fitted with a Coulson conductivity detection system operating in the nitrogen mode was used. Two columns each operated at 210~ were used. The first was 183 cm x 4. mm i.d. glass packed with 6% Carbowax 20M on Aeropak 30 (80-100 mesh), and the second was 61 cm x 4. mm i.d. glass packed with 1.5% cyclohexane dimethanol succinate (CHDMS) on Gas Chrom Q (80-100 mesh). Other instrument temperatures were: �9 �9 o �9 o
in3ector, 245 ;transfer line, 220 ; and pyrolyzer, 860 u. The bridge potential was set at 30V. The quartz pyrolyzer tube was 6.35 mm x 25.4 mm with a 12.7 mm length of strontium hydroxide scrubber. The carrier gas was purified helium set at a flow rate of 70 ml/min for 6% Carbowax 20M column and 200 ml/min for 1.5% CHDMS column. Hydrogen was used in the pyrolyzer at a flow rate of 50 ml/min. The ion- exchange resin used was AG50W-X8 with a mesh size of 20-25 in the hydroxide and hydrogen form. The water flow rate through the cell was 3 ml/min.
Recoveries of atrazine from fortified samples were 86 to 90%.
RESULTS AND DISCUSSION
Atrazine levels in the soil declined exponentially over the 12 month period following a first order regression equation. The half-life dissipation in the upper 0-6 cm varied from 3.0 to 3.6 months (Table 2). Atrazine was observed to increase in concentra- tion in the lower depths of the soil, however these residues were only a tenth of surficial residues collected at 0.2 and 2 months after application. By the end of the 12 month period surficial residues had declined and approached residues in the sub- surface layers.
Seventeen months after application atrazine residues were significantly higher in soil where charcoal had been used than where no charcoal had been added. The area was plowed twice during the period and substan- tial residues of atrazine were found in the 5-10 cm especially where charcoal had been applied (Table 3).
Field monitoring revealed that atrazine residues declined exponentially following the equation Y = a + b Log • where Y was the herbicidal residue in the soil and • the times that had elapsed follow- ing application. Breakdown of the herbicide in the first 5 months appeared more rapid than in the later 7 months. This first 5 month period coincided with late spring and summer temperatures and the later 7
545
months with fall, winter and early spring temperatures. The half-life disappearance of atrazine ranged from 2.4 to 3.0 months (Table 4).
Sheets (1970) pointed out that the persistence of s-triazine herbicides was dependent on a number of soil factors including pH, moisture, temperature and microbiological activity. Breakdown of atrazine in the field appeared to be slower under winter than summer conditions. Hence dissipation of residues in the first 5 months following application in May of each year aPpeared more rapid than in the next 7 months. This was not reflected in Field Experiment I where dissipation took longer than in the field monitored samples. In the field monitored samples half-life dissipation appeared to be 1.4 months in the summer and increased to 3 to 4 months in the winter. Khan et al. (1981) reported half-life dis- appearance of appr-oximately 2 months for atrazine over the first six months after application i.e. during the late spring, summer and early fall months.
Eagle (1978) and Frank et al. (1983) have reported that residues of atrazine below 0.i ~g/g did not affect the growth of susceptible crops, however, at levels between 0.i and 0.2 ~g/kg injury could occur. With levels between 0.2 and 0.3 ~g/g injury eould be severe and above 0.4 ~g/g plant failure occurred. The data presented indicated that on soils where application rates of up to i.i kg/ha were used susceptible crops like winter wheat could be planted five months later. However, variations in soil residue after five months were such, namely 0.13 • 0.10 ~g/kg that crop injury could ensue. Twelve months after application, residues from i.i kg/ha were at or below 0.i0 ~g/g (i.e. 0.06 • 0.04 ~g/g) and soils could be safely planted to susceptible crops. Appli- cations of 2.2 kg/ha left residue of 0.i0 • 0.09 kg/ha that could cause crop injury. The higher application rates of 3.3 kg/ha left residues that could kill susceptible crops. The wide standard deviation of the mean residues 12 months afterapplication appeared to depend on soil temperatures and moisture in summer and the degree of frost in the soil in winter. Char- coal treatments appeared to protect atrazine against microbiological breakdown.
546

Table 4.
Decline of atrazine in a wide range of soils collected
from many locations
Atrazine Residues
in Dry Soil
(~g/g)
Period After
Initial Application
(kg/ha) mean and range
De-ethylated
Application
i.i
2.2
3.3
4.4
5.5
Atrazine
(months)
(0.6-1.6)
(1.7-2.7)
(2.8-3.8)
(3.9-4.9)
(5.0-6.0)
(%)
~a
4~
0.12 Mean
1.10
2.30
3.10
4.10
5.60
3.3
1.0 Mean
0.70
1.24
1.93
2.38
3.34
8.7
2.5 Mean
0.37
0.65
0.93
1.30
2.10
15.3
5.0 Mean
0.13
0.30
0.45
0.64
0.81
21.3
SD
0.i0
0.11
0.12
0.20
-
8.0 Mean
0.i0
0.17
0.29
0.46
0.50
22.6
SD
0.05
0.ii
0.ii
0.18
-
12
Mean
0.06
0.10
0.15
0.21
0.25
22.1
SD
0.04
0.09
0.i0
0.i0
0.13
Half-life
(Mo)
Dissipation
2.4
2.7
Regression Equation Y = a + b log •
2.8
3.0
2.7
a
0.61
1.21
1.70
2.24
3.11
b
-0.57
-1.15
-1.56
-2.02
-2.80
r 2
0.98
0.93
0.94
0.99
0.99
F
183
53
61
448
383
Months to
reach 0.10
8
12
14-16
16-18
18-20
REFERENCES
Eagle DJ (1978) Interpretation of soil analysis for herbicide residues. Weeds 17:241-245
Frank R (1966) Atrazine carry-over in production of sugar beets in southwestern Ontario. Weeds 14:82-85
Frank R, Sirons GJ, Anderson GW (1983) Atrazine: the impact of persistent residues in soil on susceptible crop species. Can J Soil Sci 63:315
Ontario Ministry of Agriculture and Food (1970) Publication 20, Agricultural Statistics for Ontario 1970. Legislative Buildings, Queen's Park, Toronto, Ontario M7A IB6
Ontario Ministry of Agriculture and Food (1980) Publication 20, Agricultural Statistics for Ontario 1978. Legislative Buildings, Queen's Park, Toronto, Ontario M7A i~6
Roller NR (1975) Survey of pesticide use in Ontario, 1973. Economics Branch, Ontario Ministry of Agri- culture and Food, Legislative Buildings, Queen's Park, Toronto, Ontario. M7A IB6
Roller NR (1978) Survey of pesticide use in Ontario, 1978. Economics Branch, Ontario Ministry of Agri- culture and Food, Legislative Buildings, Queen's Park, Toronto, Ontario M7A IB6
Sheets TJ (1970) Persistence of triazine herbicide in soils. Residue Rev. 32:387-310
Khan SU, Marriage PB, Hamill AS (1981) Effect of atrazine treatment of a corn field using different applications, methods, times and additives on the persistence of residues in soil and their uptake by oat plants. J Agr Food Chem 29:216-219
Sirons GJ, Frank R, Sawyer T (1973) Residues of atrazine, cyanazine and their phytotoxic metabolites in a clay loam soil. J Agr Food Chem 21:1016-1020
Received March 9, 1984; accepted April 6, 1984.
548