fej^% Mmw^mlib.catholiccourier.com/1889-october-1892-october... · 'CaffiollM. ' "|i

DISSERTATION
THE C3HEB/FEJ MICE AS A NOVEL PRECLINICAL MOUSE MODEL FOR
MYCOBACTERIUM TUBERCULOSIS:
AN ANALYSIS OF THE HOST PATHOGENESIS AND THE IN VIVO ENVIRONMENT OF
THE NECROTIC GRANULOMA
Submitted by
Emily R. Driver
Department of Microbiology, Immunology, and Pathology
In partial fulfillment of the requirements
For the Degree of Doctor of Philosophy
Colorado State University
Fort Collins, Colorado
Spring 2014
Doctoral Committee: Advisor: Anne Lenaerts
Randall Basaraba Dean Crick Daniel Gustafson

Copyright by Emily R Driver 2014
All Rights Reserved

ABSTRACT
THE C3HEB/FEJ MICE AS A NOVEL PRECLINICAL MOUSE MODEL FOR
MYCOBACTERIUM TUBERCULOSIS:
AN ANALYSIS OF THE HOST PATHOGENESIS AND THE IN VIVO ENVIRONMENT OF
THE NECROTIC GRANULOMA
Mycobacterium tuberculosis (MTB), the causative agent of tuberculosis (TB), infects and
kills millions each year. Actively infected patients exhibit a heterogeneity of disease lesions in
the lungs, which make it difficult for current treatment regimens to effectively cure. Efforts are
underway to develop novel pre-clinical drugs, and this requires a thorough re-evaluation of the
current animal models used to test these formulations. A new mouse model using C3HeB/FeJ
mice, deficient at the sst-1 locus develops a similar heterogeneity of pulmonary lesions to human
disease when aerosol infected with MTB.
The studies presented here have found the C3HeB/FeJ mice develop 3 types of lesions:
type I) necrotic granulomas delineated with a collagen rim, type II) necrotic alveolitis, and type
III) cellular inflammation. Type I lesions, consist of an accumulation of amphophilic cellular
debris admixed with numerous extracellular bacilli. At the periphery of the necrotic core on the
inside of the collagen rim is a cuff with foamy macrophages of variable size, which contain very
large numbers of intracellular bacilli. Type II lesions, the alveolar septal walls remain mostly
intact, while the alveolar spaces are filled with high numbers of dying neutrophils, intact cells,
extracellular bacteria and debris, creating a honeycomb-like necrosis, which is only seen at very
late stage in immunocompetent mouse models. Type III lesions, are disorganized and have a mix
ii

of lymphocytes, macrophages (epitheloid and foamy), and a small number of neutrophils with
low numbers of intracellular bacilli.
The necrotic encapsulated type I granuloma creates an environment that promotes
hypoxia, creates a physical barrier, and causes physiological changes to the various bacterial
populations. The Kramnik mouse model has higher populations of resistant bacteria when drug
treated, such as isoniazid (INH), rifampin (RIF), and pyrazinamide (PZA). These drugs are less
effective when administered as monotherapies in C3HeB/FeJ mice. The adaptations the MTB
undertake in the core of the type I granuloma while under stress not only make drug treatment
less effective, but also make standard acid-fast staining techniques, such as auramine-rhodamine
less efficient at detecting bacilli. While, Sybr Gold, a novel acid-fast stain that binds to nucleic
acid, is capable of staining bacilli throughout infection and in all lesion types. The discrepancy in
staining ability of the two acid-fast stains is indicative of the physical target for auramine-
rhodamine no longer being present or available for staining in the bacilli in the core of the
necrotic granuloma.
The knowledge on histopathology then leads us further to modify the granuloma in the
Kramnik mouse model. Firstly, using collagen disrupters we aimed to improve treatment
efficacy. Secondly, by using clinical TB strains the goal was to advance disease to potentiate
cavitary disease and gain a greater understanding of strain relevance to treatment. Thirdly, by
taking advantage of the structural similarity of the necrotic granuloma and solid cancerous
tumors allow for the translation of therapy technologies, such as liposomal nanoparticles to be
exploited for treatment of MTB. Preliminary findings suggest that the use nanomedicines in TB
therapy may be an effective method of drastically reducing treatment as well as potential issues.
iii

The C3HeB/FeJ mouse strain is a highly relevant disease model that can be used for
determining the efficacy of novel pre-clinical drugs and drug regimens, to gain a better
understanding of disease pathogenesis, to understand the specific immunological events of
disease, and to explore alternatives to standard therapy.
iv

ACKNOWLEDGEMENTS
I would like to extend my heartfelt thanks to my advisor, Anne Lenaerts, who has been a
wonderful mentor to me. She has spent much of her scarce time exploring novel ideas with me
and answering all of my questions. She supported every one of my potential ideas and I cannot
express enough gratitude I have for my experience as a graduate student. I cannot imagine a
better advisor and I hope to have continued collaborations in the future.
I would also like to thank the members of my committee – Randy Basaraba, Dean Crick,
and Dan Gustafson for their insightful questions, encouragement, and suggestions for
experiments. They each taught me how to expand and hone my thinking as an investigator. I
appreciate the time they have taken from their busy schedules to help me through graduate
school.
My warmest thanks go to all current and past members of the Lenaerts and Orme labs, for
their help and support throughout this endeavor. Their assistance with experiments, moral
support, and friendship has been very important to me and without which this would not have
been possible.
Many thanks go to Gavin Ryan who became a dear mentor and friend during his tenure in
the Lenaerts Lab. With his encouragement and willing ear I came to understand microscopy and
that I needed to be more willing to ask for help.
v

I would like to thank Donnie Hoff for his helpfulness throughout my experiments and for
his friendship.
A special thanks goes to Alan Schenkel and Marta Lishnevsky who have helped me
through discussions, moral support, and expertise.
I would like to thank Mercedes Gonzalez-Juarrero and members of her lab for taking the
time to for many discussions on immunology and potential future experiments. Also for use of
equipment and training of specific techniques I used throughout my thesis.
Many thanks go to Diane Ordway and the members of her lab, Lizzie Creissen, Kristie
Capson, Andres Obregon-Henao and Marcela Henao-Tamayo for their expertise in flow
cytometry and their generosity in sharing materials and use of equipment.
Finally, I would like to thank my extended family and friends for their unending support
throughout this endeavor. They have taken time from their lives to read what I have produced
and discuss my work on multiple occasions. I cannot express how much I appreciate their
support.
vi

DEDICATION
I dedicate this thesis to my parents, Richard and Patricia Driver,
and my brother, Peter.
They have done more for me than I can express.
vii

TABLE OF CONTENTS
Abstract ........................................................................................................................................... ii
Acknowledgements ..........................................................................................................................v
Dedication ..................................................................................................................................... vii
Table of Contents ......................................................................................................................... viii
CHAPTER 1: LITERATURE REVIEW .........................................................................................1
1.1 Introduction ................................................................................................................................1
1.2 Persistent Bacilli ........................................................................................................................4
1.2.1 Definitions ...................................................................................................................4
1.2.2 Host Immune Response ...............................................................................................6
1.2.3 Bacterial Metabolism and Transcription Profiles ....................................................10
1.2.4 In Vitro Models of Persistence ..................................................................................12
1.2.5 DosR and Its Role in Persistence ..............................................................................14
1.3 Animal Models of Persistance .................................................................................................16
1.3.1 Wild Type Mice .........................................................................................................16
1.3.2 GKO Mouse Model ...................................................................................................18
1.3.3 Other Mouse Models of Persistence .........................................................................19
1.4 Rationale ..................................................................................................................................26
CHAPTER 2: DEVELOPMENT AND EVALUATION OF THE C3HEB/FEJ MOUSE MODEL
FORMING NECROTIC GRANULOMAS FOR THE TESTING OF M. TUBERCULOSIS
DRUGS ..........................................................................................................................................28
2.1 Introduction ..............................................................................................................................28
viii

2.2 Materials and Methods .............................................................................................................32
2.2.1 Animals .....................................................................................................................32
2.2.2 Bacteria and Drugs ...................................................................................................32
2.2.3 Aerosol Infection and Drug Treatment Schedule......................................................33
2.2.4 Enumeration of Bacterial Load of Lungs and Spleens .............................................33
2.2.5 Enumeration of Drug Resistant Colonies of the Lungs ............................................34
2.2.6 Statistical Analysis ....................................................................................................34
2.2.7 Staining Procedures ..................................................................................................35
2.2.8 Pathology and Microscopy .......................................................................................37
2.3 Results ......................................................................................................................................37
2.3.1 Disease Progression Over Time ...............................................................................37
2.3.2 Histopathology of the Kramnik Mouse Model Throughout Disease Progression ....40
2.3.3 Histopathology of the Balb/c Mouse Model Throughout Disease Progression .......43
2.3.4 Acid-Fast Staining by Kinyoun and Auramine-Rhodamine ......................................44
2.3.5 Pulmonary Granulomas in the Kramnik Mouse Model are Hypoxic .......................46
2.3.6 Anti-tuberculosis Single Drug Treatment is Less Effect in the Kramnik Mouse
Model Compared to the Balb/c Mouse Model ...................................................................47
2.3.7 Kramnik Mice have Higher Numbers of Drug Resistant Colonies ...........................55
2.4 Discussion ................................................................................................................................57
2.5 Funding ....................................................................................................................................66
CHAPTER 3: COMPREHENSIVE ANALYSIS OF THE PROGRESSION OF DISEASE IN
THE NECROTIC GRANULOMA MICROENVIRONMENT OF C3HEB/FEJ MICE
INFECTED WITH MYCOBACTERIUM TUBERCULOSIS .........................................................67
ix

3.1 Introduction ..............................................................................................................................67
3.2 Materials and Methods .............................................................................................................71
3.2.1 Animals .....................................................................................................................71
3.2.2 Bacteria .....................................................................................................................71
3.2.3 Aerosol Infection .......................................................................................................71
3.2.4 Enumeration of Bacterial Load of Lungs and Spleens .............................................71
3.2.5 Pathology and Microscopy Analysis of Tissue Samples ...........................................71
3.2.6 Human Lung Samples ...............................................................................................72
3.2.7 Staining Procedures ..................................................................................................72
3.2.8 Cytometric Bead Array Analysis ...............................................................................73
3.2.9 Immunohistochemistry ..............................................................................................74
3.2.10 Statistical Analysis ..................................................................................................75
3.3 Results ......................................................................................................................................75
3.3.1 Survival of Mice after M. tuberculosis Erdman Infection.........................................75
3.3.2 Kramnik Mouse Model Lesion Pathology.................................................................76
3.3.2.1 Temporal Development of Lesion Pathology .............................................76
3.3.2.2 Granuloma Formation ...............................................................................77
3.3.2.3 Granuloma Fibrosis ...................................................................................83
3.3.3 Bacterial Location in Lung Lesions of the Kramnik Mouse Model over time ..........84
3.3.3.1 Comparison Side by Side of the Acid-Fast Staining of Bacteria by the
Fluorescent Auramine-Rhodamine Method and Detection of Bacilli in Tissues via
a Novel Fluorescent Acid-Fast Staining Method Using Sybr Gold .......................84
3.3.3.2 Human Lesion Bacterial Populations ........................................................86
x

3.3.4 Immunohistochemistry Localization of Macrophage Activity ..................................88
3.3.5 Cytokine and Chemokine Analysis: Significantly distinct cytokine production in
isolated granulomas ...........................................................................................................89
3.4 Discussion ................................................................................................................................92
3.5 Funding ..................................................................................................................................101
CHAPTER 4: THE USE OF LIPOSOMAL NANOPARTICLES AS A NOVEL DRUG
DELIVERY VEHICLE IN C3HEB/FEJ MICE INFECTED WITH MYCOBACTERIUM
TUBERCULOSIS .........................................................................................................................102
4.1 Introduction ............................................................................................................................102
4.2 Materials and Methods ...........................................................................................................108
4.2.1 Animals ...................................................................................................................108
4.2.2 Bacteria ...................................................................................................................108
4.2.3 Liposomal Formulations .........................................................................................108
4.2.4 Aerosol Infection and Drug Treatment Schedule....................................................109
4.2.5 Enumeration of Bacterial Load of the Lungs ..........................................................110
4.2.6 Pathology and Microscopy .....................................................................................110
4.2.7 Staining Procedures ................................................................................................111
4.3 Results ....................................................................................................................................112
4.3.1 Preliminary Results on Liposomal Distribution in Mouse Tissues .........................112
4.3.1.1 Bacterial Burden ......................................................................................112
4.3.1.2 Advanced Lung Pathology of Tuberculosis Infection over time in
C3HeB/FeJ Mice ..................................................................................................112
4.3.1.3 Bacterial Location in the Necrotic Granulomas ......................................114
xi

4.3.1.4 Liposomal Distribution in Necrotic Granuloma Tissue ..........................115
4.3.2 Extensive Pharmacokinetic Evaluation of C3HeB/FeJ and Balb/c Mice ...............118
4.3.2.1 Liposomal Distribution ............................................................................118
4.3.2.2 Rapid Liposome Clearance in Infected Mice ...........................................119
4.4 Discussion ..............................................................................................................................121
4.5 Funding ..................................................................................................................................125
CHAPTER 5: ALTERNATIVE TREATMENT APPROACHES TO AUGMENT CLASSICAL
THERAPY BY ALTERING HISTOPATHOLOGY ..................................................................126
5.1 Introduction ............................................................................................................................126
5.2 Study of an Angiotensin II Inhibitor to Disrupt the Collagen Rim of a Necrotic Granuloma130
5.2.1 Materials and Methods ...........................................................................................131
5.2.1.1 Animals ....................................................................................................131
5.2.1.2 Bacteria and Drugs ..................................................................................131
5.2.1.3 Aerosol Infection and Drug Treatment Schedule ....................................131
5.2.1.4 Enumeration of Bacterial Load of Lungs and Spleens ............................132
5.2.1.5 Pathology and Microscopy ......................................................................132
5.2.1.6 Staining Procedures .................................................................................133
5.2.1.7 Stereology ................................................................................................133
5.2.1.8 Statistical Analysis ...................................................................................134
5.2.2 Results .....................................................................................................................134
5.2.2.1 Treatment of C3HeB/FeJ mice with Losartan Potassium alone as well as
in Combination in an initial small-scale study ....................................................134
xii

5.2.2.2 Stereological Analysis of LK Treated mice show no Difference in Collagen
Deposition ............................................................................................................137
5.2.2.3 Pathological Analysis ..............................................................................138
5.2.2.4 Losartan Potassium as a Pre-Treatment to Chemotherapy .....................143
5.2.3 Result Summary and Conclusion of Losartan Potassium as Treatment Augmentation
..........................................................................................................................................145
5.3 Aim to Increase the Frequency of Cavitary Disease in C3HeB/FeJ mice after Aerosol
Infection of Clinical M. tuberculosis strains ................................................................................146
5.3.1 Materials and Methods ...........................................................................................147
5.3.1.1 Animals ....................................................................................................147
5.3.1.2 Bacteria and Aerosol Infections...............................................................147
5.3.1.3 Enumeration of Bacterial Load of Lungs and Spleens ............................149
5.3.1.4 Pathology and Microscopy ......................................................................149
5.3.1.5 Staining Procedures .................................................................................149
5.3.1.6 Flow Cytometry ........................................................................................149
5.3.2 Results .....................................................................................................................150
5.3.2.1 Survival of mice Infected with W-Beijing Strains from San Francisco ...150
5.3.2.2 Evaluation of Histopathology in the Lungs of C3HeB/FeJ mice Infected
with W-Beijing Strains .........................................................................................151
5.3.2.3 Pathological Progression in the Lungs and Virulence of Clinical Strains in
C3HeB/FeJ mice ..................................................................................................152
5.3.2.4 Studying the Cytokine Profiles in the Lungs of C3HeB/FeJ mice after
Infection with Various Clinical M. tuberculosis strains ......................................155
xiii

5.3.3 Results Summary and Conclusions of Infecting C3HeB/FeJ after Infection with
Clinical Beijing Strains ....................................................................................................158
5.4 Overall Summary of Chapter 5 ..............................................................................................160
5.5 Funding ..................................................................................................................................161
CHAPTER 6: CONCLUDING REMARKS AND FUTURE DIRECTIONS ............................162
CITED REFERENCES ................................................................................................................176
LIST OF ABBREVIATIONS ......................................................................................................196
xiv

CHAPTER 1: LITERATURE REVIEW
1.1 – INTRODUCTION
The tubercle bacillus is an old world infectious agent that is still thriving in the new
world. Currently, Mycobacterium tuberculosis (MTB) has latently infected one-third of the
world’s population. Of the infected individuals, 5-10% will become diseased and can become
infectious during their lifetime generally due to either aging or immunosuppression [1]; and co-
infection with Human Immunodeficiency Virus (HIV) increases reactivation of tuberculosis by
10% per year. MTB killed nearly 1.3 million people in 2012, and has become one of the Big
Three infectious diseases along with HIV and Malaria. In recent years the combined infection
with HIV has accelerated mortality rates [2].
The World Health Organization recognizes the problem MTB poses and recommends for
drug-susceptible tuberculosis (TB), as the standard treatment, 2 months of daily isoniazid (INH,
H), rifampin (RIF, R), ethambutol (EMB, E), and pyrazinamide (PZA, Z) [intensive phase];
followed by 4 months of daily INH and RIF with or without EMB [continuation phase] [3].
Patients within the DOTS program (Directly Observed Therapy Short Course) are carefully
monitored to guarantee that they complete the full course of treatment. There are many obstacles
that impede the DOTS program, especially within developing countries where it is needed most.
To date, estimates suggest that DOTS only reaches a quarter of those in need in some countries
[4].
Progress has been made globally in the treatment of TB but is rather slow. The Stop TB
Partnership with the World Health Organization put forth goals to reduce the global disease
burden by 50% in 2015 and elimination of TB by 2050. This year marks the fifth year that 16 of
1

22 high burden countries had a treatment success rate of 85% or higher of those patients treated,
in large part due to the DOTS program [2].
The lengthy treatment for tuberculosis can result in patient non-compliance; many
patients stop taking their medications as their symptoms improve. A consequence of
withdrawing the medication before the treatment course is finished has resulted in the increase of
mono- and multi-drug resistant TB (MDR-TB). MDR-TB refers to isolates that are resistant to at
least the two first line drugs, RIF and INH. In many parts of the world the incidence of MDR-TB
can be as high as 14% of all TB cases. Extensively-drug resistant TB (XDR-TB) is defined as
those strains that are resistant to both RIF and INH, along with a quinolone and at least one
injectable second line drug such as kanamycin, capreomycin or amikacin. Treatment for MDR
and XDR-TB rely on second and third line TB drugs that are less effective than regimens for
drug susceptible TB, the drugs have greater side-effects and the duration is twice as long as
susceptible TB; and in the case of XDR-TB an effective cure is the best case scenario for only
50% of patients [5]. In 2009, cases of TB resistant to all first and second line drug treatment
regimens were documented in Iran [6], these cases were deemed totally-drug resistant TB (TDR-
TB). TDR-TB patients can remain sputum smear positive after 18 months to 4 years of intensive
treatment [7]. The Centers for Disease Control has called TDR-TB “virtually untreatable” [8].
Recent approval of Bedaquiline (BDQ) for use in MDR and XDR-TB patients is a dramatic
improvement for potential treatments for these patients [9, 10].
The tubercle bacillus is spread from an infected individual to others by coughing, more
specifically by passing infected respiratory droplets from liquefied cavities through the air to
another person. Infectiousness is influenced by several factors: the frequency and force of
someone’s cough, the number of viable bacilli being expelled, the consistency of sputum and the
2

size of aerosolized particles. The moisture in the air and the bacillus’ waxy coat protect it from
drying out while in transmission [11]. After transmission the bacilli are inhaled deep in the lungs
and reach the alveoli. The alveolar macrophages ingest the bacilli but are prevented from
destroying them through several protective mechanisms induced by the bacterium; such as the
bacteria reducing the ability to acidify the phagosome within the macrophages, arresting the
maturation of the phagosome and avoiding fusion of the phagosome with the lysosome [12-14].
The bacilli use the macrophage as a host while they continue replicating. The acquired immune
system is activated with the development of cell-mediated immunity (CMI), which suppresses
the logarithmic bacilli growth [15, 16]. Although TB patients show a heterogeneity in lung lesion
types, the ‘classical granuloma’ is the hallmark of the tuberculosis disease in TB patients, which
is characterized by the formation of a necrotic core that develops within granulomatous lesions
(Figure 1.1).
Figure 1.1. Representative architecture of a TB granuloma. A) A representative lesion with central necrosis from minipig lung tissue. Adapted from Gil et al [17]. B) Schematic of the cellular components of a TB granuloma [18].
Necrosis is a process instigated by the lysis of bacteria laden macrophages as well as
neutrophils, which ultimately create caseous necrosis in the core of the lung lesion. As the bacilli
3

invade more macrophages and neutrophils, the lesion continues to expand. Ultimately, the lesion
becomes an aggregate of epitheloid cells surrounded by a cuff, which include lymphocytes,
plasma cells and fibroblasts. Throughout the newly formed collagen rim, angiogenesis is
ongoing. The central region of the human granuloma becomes devoid of blood vessels, which
renders it hypoxic, and this hypoxia will further increase the propensity for necrosis [19, 20].
Another characteristic of most human lesions is the progressive collagen deposition around the
pulmonary granuloma. At the periphery, Langhans’ giant cells can be present. In the core, an
acellular, eosinophilic region of caseating necrosis can further progress and mineralize or liquefy
later in disease.
1.2 – PERSISTENT BACILLI
1.2.1 Definitions
TTB is difficult to treat and requires extended therapy for effective cure. This long
treatment duration is due to ‘persister’ bacteria, which is a rather elusive and a not well
understood bacterial population [21, 22]. We define the persister bacteria as a population which
can survive antibiotic treatment but are genetically identical to susceptible TB bacteria. These
bacteria are thought to have a distinct physiological state from true susceptible bacteria [23].
Three related terms that describe the phenomenon of these difficult to eradicate bacterial
population frequency used are: latency, dormancy and persistence. The terminology for their use
in TB is often times disputed and therefore for the purpose of this work, we define these terms
more closely. “Latency” is by most, and also here, defined as the clinical state in which a patient
is asymptomatic, non-contagious but skin test positive and often by X-ray shows lesions in the
lung. Latency can result from infection whereby a vigorous CMI response limits to a great extent
4

the initial infection. Latency remains to date in large part a mystery. In addition the exact
location of the bacteria in a latent infection is unclear. “LTBI” (latent tuberculosis infection) has
been a useful term when describing clinical disease for patient management [24]. With more new
examinations becoming available that focus on the heterogeneity of lung lesions from active and
latent TB in patients [25, 26], proper terminology to describe the spectrum of disease states is
imperative. At this time, the incapability to distinguish the several disease states (from sterilizing
immunity, subclinical active, fulminant active disease) is seen as a hindrance to the management
of patients, and to the development of new drugs and vaccines [24, 25].
“Dormancy”, implies a lack of activity and an almost spore-like state. The MTB bacilli
are thought to always have some metabolic activity and therefore the term dormancy seems to be
the least appropriate. “Dormant lesions”, which is terminology often times used in the
histopathology field, describes a lesion composed mostly of mononuclear phagocytes, dendritic
cells, and lymphocytes [27]. The lesion is encapsulated in a fibrotic wall and bacilli within the
lesion are low in numbers. These bacilli are in a ‘state of non- to low-replicating persistence’
[27]. Dormancy is also being used as a term associated with an in vitro model developed by
Wayne that evaluates MTB under depleting oxygen [28, 29].
“Persistence” is the term being used to describe the ability of the bacillus to withstand
various environmental pressures and still remain viable. The environmental factors can be in vivo
stimuli that are encountered within a granuloma, such as low oxygen tension, nutrient starvation,
RNI and NO depletion. In addition, many host immune response features can lead to persistence
such as certain cytokines and chemokines [30]. On the other hand, persisters are also referred to
as the subpopulation of bacteria that can survive antibiotic treatment [23]. These bacteria are
genetically drug susceptible but are more drug tolerant. Initially, it was thought that these drug
5

tolerant bacteria were either non-replicating or slowly replicating [22, 31, 32]. However, more
recently, McKinney et al, in an elegant study described drug tolerance for INH independent of
the replication [33]. Over time the concept of persisters has evolved from a uniform population
to far more complex phenotypes some of which are drug induced, others are stochastic changes
through the pulsating activation of catalase-peroxidase (KatG) or can show epigenetic changes
[21, 34-36]. All of these persistence factors ensuring the survival of the bacteria population under
various environmental pressures.
1.2.2. Host immune response
The host immune response to tuberculosis is complex and not completely elucidated.
Certain key aspects of immune control have been characterized which have assisted in the
development of new therapies, vaccines, and diagnostic tests. The adaptive immune response
plays a critical role in pulmonary host defense against an MTB infection [37]. CD4+ T cells are a
major T cell subset, which plays a central role in host immunity to infection. CD4+ T cells are
differentiated into two populations, T helper 1 (Th1) and T helper 2 (Th2) [38]. Th1
inflammatory cytokines include interferon-gamma (IFN-γ), interleukin-12 (IL-12) and tumor
necrosis factor- alpha (TNF-α), and Th2 suppressive cytokines include IL-4, IL-5, and IL-13.
Th1 CD4+ T cells mediate activation of mononuclear phagocytes, such as macrophages [37].
CD8+ T cells (cytotoxic T cells) are also strong producers of IFN-γ, IL-12, and TNF-α in MTB
infected individuals and, similar to CD4, CD8+ T cells are critical for macrophage activation
[39]. Mice deficient in CD4+ T cells or IFN-γ knockout (GKO) mice, suffer from exacerbated
disease; these animals present with lesions of active neutrophils instead of granulomas consisting
of macrophages and lymphocytes [40-43]. Therefore, the immunocompromised SCID or mouse
6

models deficient in interferon gamma (GKO) can in some ways be seen as a reasonable
comparison to an HIV patient deficient in CD4 T cells. The lack of CD4+ cells in HIV infected
patients is considered to be a major cause of the resurgence of TB in countries with a high HIV
burden, resulting in 20-37% increase in co-morbitity [44-47]. During HIV infection the depletion
of CD4+ T cells results in the highly decreased production of IFN-γ, IL-12 and TNF-α cytokines
[48, 49].
The cytokine IFN-γ has been determined to be a key protective mediator of macrophage
activation and resistance to intracellular pathogens [50, 51]. IFN-γ is mainly produced early on
by macrophages and later at high levels by CD4 positive T-cells, and is crucial for containing the
MTB infection [44, 52, 53]. Within immunocompetent mouse models, the production of IFN-γ
and other cytokines result in the generation of inducible nitric oxide synthase (iNOS) and
reactive nitrogen intermediates (RNI) [54, 55]. These reactive intermediate species are
detrimental and cidal for the bacteria, which has been well established using the murine model.
Mice lacking iNOS have an increased pathologic response and an increased recruitment of
neutrophils [56]. However, the correlation between human TB and iNOS expressing
macrophages is less clear [57-59]. The RNI are toxic to the infected macrophage, which will
result in the death of the host cell creating necrosis and progressive disease [20].
The protective activity of IFN-γ against TB has been shown to be dependent on
expression of the Th1 cytokine IL-12 [60-62]. Similar to GKO mice, mice lacking a functional
IL-12 gene cannot control the growth of the bacterial infection [60, 63]. Another Th-1 cytokine,
IL-23 is co-expressed with IL-12 to drive IFN-γ expression and maintains IL-17 production
throughout infection. The absence of IL-23 does not impact control of bacterial growth early in
infection [64], but in a chronic infection IL-23 KO mice had increased bacterial growth
7

compared to the wild-type C57Bl/6 mice [38]. Both IL-12 and IL-23 deficiency will result in a
reduced IFN-γ cytokine levels in humans. Although there is a deficiency in both of these Th1
cytokines, the TB patients are controlling the infection by developing granulomas with
aggregations of lymphocytes and macrophages in infected organs. This suggests that the IL-12
and IL-23 axis is not as important in humans as was demonstrated in mice [20].
Tumor necrosis factor-alpha (TNF-α) is thought to play a key role in latent infection. The
cytokine activates macrophages, which will result in the production of inducible nitric oxide
synthase (iNOS) and generation of reactivate nitrogen intermediates [57, 65]. Antibodies against
TNF-α, or TNF-α suppression by immunomodulators have resulted in fatal reactivation of latent
tuberculosis infection [20, 66, 67]. TNF-α has also been shown to play a role in regulating
granuloma formation by modulating leukocyte migration. Soluble TNF is a membrane-bound
molecule that is essential for normal granuloma formation and survival following tuberculosis
infection [14]. In the absence of TNF, there is a delay in the initial recruitment of monocytes into
infected tissue, although granuloma formation will occur this is delayed rendering the lesion
more necrotic [20, 68, 69].
Interleukin-10 (IL-10) is an anti-inflammatory cytokine expressed by macrophages,
dendritic cells, neutrophils, B cells and T cells, and is produced to dampen the highly
inflammatory effects of IFN-γ/IL-12 and TNF-α during a tuberculosis infection [70]. Blocking
IL-10 expression has been effective in restoring protective immune cytokines, while inhibiting
the IL-10 receptor during infection resulted in reduced bacterial burdens and increased T cell
recruitment and IFN-γ production [71]. The effects of inhibiting IL-10 production is either
transitory as well as mouse strain dependent. Relatively resistant mouse strains, such as Balb/c
and C57Bl/6, show no difference in bacterial loads in the lungs when lacking IL-10 [72-74].
8

Others have reported a temporary increase in IFN-γ levels, which coincided with a decrease of
the bacterial load in lungs and spleens [70, 75, 76]. The highly susceptible mice (CBA/J) show
increased levels of IL-10 in the lungs with the coinciding decrease of IL-12 and IFN-γ, which
appears to exacerbate the susceptibility of the mice and increase their bacterial burdens [77].
Recently, an elegant study by the same group showed that the administration of an anti-IL-10R
antibody early in infection promotes the formation of mature necrotic granulomas in CBA/J mice
[78]. Lastly, human macrophages infected with MTB produce IL-10, which is able to cause
blockage of the phagosome maturation, ultimately resulting in the survival and replication of the
bacilli [79, 80]. While IL-10 is produced to protect the host from excessive inflammatory
damage from Th1 cytokines, it allows for increased bacterial growth that can be detrimental.
Chemokines are pro-inflammatory mediators also produced after a MTB infection.
Chemokines are small molecular weight proteins involved in immuno-regulatory and
inflammatory functions [81]. Chemokines are categorized into groups based on their N-terminal
cysteine residues, C-, C-C, C-X-C, and C-X3-C subfamilies, where X represents an amino acid.
Many chemokine ligands are inflammatory, such as, CCL2, CCL3, CCL5, CXCL8, CXCL9,
CXCL10, and CXCL11. Induction of CCL2, monocyte chemotatic protein-1 (MCP-1), is of
particular importance due the high levels expressed in broncho-alveolar lavage from pulmonary
TB patients [82]. CCL2 is a strong chemo-attractant of CCR2+ monocytes/macrophages and
CD4+ T cells [81]. CCL2 has been shown to be involved in the formation of the granuloma in
tuberculosis and even to play a role in protection against the bacilli [20, 83]. In pulmonary TB
patients, CCL2 and TNF-α were consistently correlated with increased severity of disease [84].
9

1.2.3 Bacterial metabolism and transcription profiles
MTB can manifest itself and remain alive under varying conditions and disease states,
which makes it one of the most versatile pathogens. Changes in the microenvironment can affect
the bacteria in such a way that they adapt to these new conditions by altering their transcription
profiles and internal metabolism [85-87]. When the bacterium becomes stressed, whether due to
oxygen deprivation, nutrient starvation, or macrophage acidification, it must make adaptations to
survive. One important change the bacterium makes is a shift in its energy source. MTB can
change to using lipids and fatty acids as a carbon source; the bacteria then use an alternative
pathway, the glyoxylate shunt, for metabolism [25, 88-90]. The glyoxylate shunt uses the
enzyme isocitrate lyase (ICL) to catalyze the cleavage of isocitrate into succinate and glyoxylate
[91, 92]. MTB has two types of ICL, ICL1 and ICL2, both of which are required for growth,
survival, and virulence in the macrophage [90, 93] as well as under in vivo conditions [94].
Bacteria deficient in ICL are unable to metabolize fatty acids and are rapidly cleared from
infected macrophages [95], a result observed in humans and mice [94]. Pathogenic MTB during
a persistent infection have an increased expression of ICL, which increases the production of
succinate [89]. The increased succinate under limited O2 enables the MTB to sustain succinate
dehydrogenase activity and oxidative synthesis of ATP, maintain membrane potential, and store
the remainder as TCA precursors to resume oxidative activity upon reoxygenation [89, 96]. MTB
under metabolic stress have mechanisms that allow for continued survival and energy
production.
Specific transcriptional adaptations that allow the bacterium to survive the surrounding
environment and maintain virulence are sigma factors [97]. Of importance, one of the 13 sigma
factors, sigE, controls the bacterial response to external stimuli after phagocytosis [87]. In
10

addition, the sigE factor regulates gene expression that maintains the mycobacterial envelope to
cope with external stress [98]. Other sigma transcripts have shown importance in virulence and
intracellular survival, such as sigD and sigB, sigG and sigH [99, 100]. SigH is an essential
regulator of bacterial to oxidative, nitrosative and heat stresses [101].
To determine the factors and genes of bacterial persistence for MTB have been the center
of intense and still ongoing studies. Through microarray and whole genome sequencing
techniques, a large set of genes has been shown to become activated in states of hypoxia or
environmental stressors. These 48 genes are under the control of a transcription regulator, called
the DosR regulon [102-104] (also discussed in detail under 1.2.5 below). One gene induced
under hypoxia and potentially involved in persistence is acr-2 (also known as hspX controlled by
the DosR), which encodes alpha-crystallin [103, 105-107]. Acr localizes to the inner surface of
the cell membrane and is a member of the small heat shock protein family that forms high
molecular weight aggregates and has chaperone activity in vitro [108]. Acr expression
dramatically increases under hypoxic conditions and due to the powerful regulation under low
oxygen tension could provide insight into the nature and control of the whole genome response
[103, 107, 109]. Acr is considered to be an immunodominant protein since it is found in the sera
of most pulmonary TB patients [110, 111]. In immunocompetent C57Bl/6 mice there was an
increase in bacterial burden, pathogenicity, and increased production of pro-inflammatory
cytokines when infected with an acr-gene disrupted MTB strain. The observed increase in
bacterial burden may be indicative of acr having a global down-regulating effect to prepare the
bacterium for dormancy [112].
11

1.2.4 In vitro models of persistence
In an elegant experiment by Lawrence Wayne, also called the Wayne Model, determined
an in vitro model of persistence for MTB [29]. He discovered that when bacteria are grown in
culture with a closed cap with a limited headspace for oxygen consumption, MTB enter
sequential stages of non-replication. During the transition, Wayne describes two specific non-
replicative stages (NRP): the NRP-1 and NRP-2 stages. These stages reflect discrete metabolic
and drug susceptibility states compared to log-phase growth. During the NRP-1, there is a slow
but logarithmic increase in turbidity that is not reflected in an increase in colony forming units.
There is a high rate of production of glycine dehydrogenase and ATP concentrations are
maintained during this phase. Once the bacilli transition to the NRP-2 stage, the production of
glycine dehydrogenase declines dramatically and ATP decreases slightly. NRP-1 appears to start
about the time the O2-concentration of the medium reaches 1% of the original saturation level.
During transitioning from NRP-1 to NRP-2 stage, the O2 concentration drops below 0.06%.
Throughout the NRP-1 and NRP-2 stages, the drug susceptibility profiles of the bacilli change
with the change in metabolism of the bacilli. INH and ciprofloxacin had negligible effects in the
NRP-1 and NRP-2 stages, while they killed over 90% of actively replicating bacteria.
Metronidazole (MET), an antimicrobial known to function against anaerobes, showed most
effective killing only during late stage NRP-2. These observations suggest an organized
mechanism for dormancy and persistence [29, 113-115]. Current variations of the Wayne model
need approximately 21 days for complete oxygen depletion [116]. In 2010, alterations were
introduced by Voskuil et al [102] using the “Rapid Anaerobic Dormancy” model, (RAD), which
uses a more rapid stirring culture in smaller test tubes. These changes resulted in a more rapid
12

and uniform oxygen depletion within 7-10 days generating a bacterial population that is more
transcriptionally homogenous.
The microarray technology provided a powerful tool to assess expression of many genes
in response to changing environmental conditions [107]. Originally observed in the Wayne
Model, the genetic profile of MTB changes dramatically under hypoxic conditions. Initial
microarray studies showed three genes of particular interest to Schoolnik et al., which were the
Rv3134c/Rv3133c/Rv3132c gene cluster. To investigate the role of this gene cluster individual
mutations were made to dissect its exact function. It was observed at that time that Rv3133c was
required for induction of acr expression under reduced oxygen tension. Since the Rv3133c
product mediates the enhanced expression of at least one gene (acr) in response to low oxygen
tension; it was thought that other genes in the hypoxia regulon could also be under its control
[103, 117]. A more detailed description of the DosR regulon is described below under 1.2.5.
Other in vitro models of persistence have shown characteristics of the MTB bacilli under
reductive stress. The starvation model optimized by Duncan et al [68] showed that bacteria
initially grown in rich media, which are then deprived of that environment, have a decreased
respiration and a severely shut down metabolic profile [68]. These starved bacteria are not
affected when treated with RIF and INH. In contrast, MET has no effect on the starvation phase
bacteria, which is different from the Wayne model. The stationary phase model, allows bacteria
to remain for an extended amount of time in the culture media without agitation. The bacteria
aggregate to the bottom of the flask where a lack of oxygen limits growth [118]. The stationary
phase model was used to describe bacterial transcription factors, such as sigA and sigB. It was
determined that sigA was unresponsive to stress and constitutively active, whereas sigB was up-
13

regulated during stationary phase. SigB has been determined to be required for survival and
virulence of the bacteria [118].
1.2.5 DosR and its role in persistence
The exact function of the DosR regulon is still being studied by multiple investigators
and seems to be more complex than originally thought. Initially, it was thought that the DosR
was necessary for survival via the induction of a robust genetic response to reduced oxygen
tension [103]. It has since been postulated that DosR is required for the optimal transition for
MTB back to aerobic growth and the lack of the DosR regulon is not sufficient to initiate
bacteriostasis [102, 104]. Therefore, some have renamed the regulon as “Dormancy Survival
Regulator” (or DosR) [103]. DosR is a three-component system regulator; composed of two
sensor histidine kinases, DosS or DosT, and a response regulator, DosR [119]. Upon
phosphorylation the DosR regulon then leads to the induction of a set 48 co-regulated genes
under its direct control [102, 104, 120, 121]. The DosS is potentially activated by two related
pathways. Firstly, DosS constitutively binds with oxygen thus suppressing the sensor, when
oxygen is depleted the sensor autophosphorylates leading to DosR activation [122-124].
Secondly, DosS acts as a redox sensor and is susceptible to oxidation rates as a signal for
activation [125, 126]. Other stressors such as NO and CO gases induce the DosR regulon
through these kinase sensors as well. The gases bind to the heme irons of the DosT and DosS,
possibly to displace O2, resulting in activation of the sensor [124, 126, 127].
Further experimentation with the DosR regulon has uncovered more questions in terms of
its exact function in vitro as well as in vivo. The DosR regulon is highly up-regulated in the
initial phases of low oxygen tension but as time progresses shows a decreased expression.
14

During this lag in DosR expression, D. Sherman described, the Enduring Hypoxic Response
(EHR), a cluster of upwards of 230 genes are expressed 4-7 days after oxygen depletion [120]. In
a recent set of experiments performed by Voskuil et al [102], it has been shown that the DosR
regulon is necessary for the shift away from oxygen consumption, to maintain ATP levels and
balance the redox state of the cell as oxygen becomes depleted. The induction of the regulon
prior to respiration inhibition allows the bacilli to transcribe and translate the DosR regulon
before energy becomes limited. While it has been noted that the transcription of the DosR/EHR
is ceased within a few weeks after anaerobiosis, it is the initial expression that remains essential
to ultimate survival and growth. The DosR regulon bacterial mutant after being exposed to
anaerobiosis required an extra week to achieve colonies of countable size as compared to wild
type bacteria. A lack of anaerobic survival, non-culturablilty on solid media, and reduced growth
post-exposure to anaerobiosis, a DosR mutant bacterial strain does not survive well in a
microenvironment that oscillates between oxygenated and hypoxic conditions [128].
The role of DosR in vivo is still under investigation. In the chronic immunocompetent
C57Bl/6 mouse model the DosR KO, complement, and wild type bacterial strains had similar
bacterial burden in the lungs throughout infection [127]. It is not entirely surprising that no
difference in bacterial growth was observed in the mouse model, as there is no hypoxia reached
in the chronic mouse model [128]. However, we observed significant less pathology in mice
infected with the Dos R mutant when compared to the wild-type MTB strain. Converse et al,
showed a DosR mutant strain was attenuated in both the guinea pig and rabbit infection models,
which were chosen for their ability to produce necrotic granulomas with hypoxic regions [127].
The in vivo data suggest that the DosR regulon plays some role in persistence, but it may not the
only factor to establishing or maintaining a chronic or persistent infection in vivo [129, 130].
15

1.3 – ANIMAL MODELS OF PERSISTENCE
1.3.1 Wild type mice
The most widely used in vivo model to the study of TB has been the chronic infection
mouse model [131-137]. The transition to the chronic phase of infection is brought on by the
emergence of acquired CMI, which is mediated by antigen specific T cells and macrophage
activation, and results in the stabilization of bacterial numbers in the lungs [132]. After infection
with TB, macrophages and lymphocytes accumulate in distinct lesions in the lungs of mice as the
infection progresses from the acute to chronic phase [138], with macrophages forming the inner
core and the lymphocytes surrounding the core area. In chronic stages of disease, the number of
epitheloid-type foamy macrophages and lymphocytes increases dramatically. Later in infection,
macrophages might degenerate and coalesce into small patches of interstitial fibrosis. It is
important to note that bacilli remain intracellular throughout infection, and on rare occasions of
necrosis small numbers of bacilli can become extracellular. As infection progresses,
pathogenesis shows a thickening of the alveolar septae, and we see accumulation of
inflammatory cells in the lung parenchyma. Granulomatous lesions are by then characterized by
sheets of epitheloid and foamy macrophages that fill alveoli, which are often demarcated by mild
interstitial fibrosis. As disease progresses the granulomatous lesions enlarge to the point that
many coalesce, leading to consolidation of as much as half of the lung lobe. Small necrotic foci
are often associated with clefts of accumulated cholesterol, which arises from released cytoplasm
of dying cells that are especially rich in fatty acids [139]. Fibrosis of alveolar septae is more
advanced, as indicated by increasing accumulation of collagen among the foamy macrophages.
In late stage chronic disease, extensive remodeling of the lung parenchyma occurs. Chronic
interstitial fibrosis and granulomatous involvement of the lung reaches a degree until individual
16

lesions can no longer be distinguished; many of the macrophages are dead or dying thereby
creating foci of purulent cellular debris [140]. While immunocompetent mice form
granulomatous lesions these tissues were shown not be hypoxic using hypoxia probes currently
available suggesting that the mouse model of persistent TB is not entirely reflective of human
disease [138, 141].
This mouse infection model is versatile and can be adjusted for multiple purposes, such
as vaccine testing, drug treatment, or immunology studies to evaluate MTB. These mice can
endure intravenous infection, a low and high dose aerosol infection, intratracheal and intranasal
infection routes to establish an MTB infection [142]. Drug treatment can begin 30 days post
infection to test drug efficacy in a chronic infection, or the inoculum can be increased to mimic
acute pulmonary TB [143]. Therapy may also begin just a few days after infection to evaluate an
acute infection model before adaptive immunity plays a role in the host profile.
McCune and colleagues at Cornell University developed another mouse model during the
1950s, now better known as the Cornell Model [144-146]. After intravenous infection, as early
as 20 minutes after, mice are treated with antimycobacterial drugs, which reduce the bacterial
burden to nearly undetectable levels. After antibiotic treatment is completed the animals are
allowed to reactivate, either naturally by an extended withdrawal of therapeutics or with the help
of immunosuppressive agents, such as glucocorticoids. This model is often used as a latent
mouse model because of the low bacterial burden [147, 148]. However, it is an drug induced
latency which is not necessarily the same as LTBI and the relapse rates are very hard to predict
[149]. To date, a mouse model showing a more true latent disease state remains elusive.
17

1.3.2 GKO mouse model
Immunocompromised mouse strains are often used in TB research in order to study the
immune response, or for drug treatment purposes. The susceptible transgenic mouse IFN-γ gene
disrupted C57Bl/6 mice (GKO) for instance are being used to rapidly test experimental
compounds against a TB infection, as they cannot control a TB infection. The mouse model
contains mainly actively replicating bacteria, and the infection remains acute. IFN-γ has been
shown to be a protective cytokine secreted by activated T cells and natural killer cells. In the
initial stages of infection, the histopathology of the GKO mice is similar as compared to wild
type C57Bl/6 mice; however, the granulomas of the GKO mice are far less structured [134].
Twenty days after aerosol infection, the number of bacteria in the lungs of GKO mice was 100-
fold higher than in the wild type mice [134]. At this point of infection, the lesions within the
lungs consist of mostly polymorphic cells with a low numbers of monocytes. Later in infection in
the GKO model, about 4 weeks after aerosol infection, we showed that the pathology progresses
significantly [134]. The lungs develop multifocal necrotic areas containing large numbers of
intra-cellular acid-fast bacteria with substantial interstitial hemorrhage and cellular infiltrates of
granulocytes and eosinophils. Lungs of GKO mice are almost totally devoid of mononuclear
cells, have lost their cohesive structure and exhibit advanced caseous necrosis in late stage
infection [134]. The extensive necrotic lesions with extracellular bacilli only form about a week
prior to the mice succumbing to disease. And therefore as an advanced disease model with
necrotic lesions it is not very practical [53].
18

1.3.3 Other animal models of persistence
Other animal models for the study of TB include the guinea pig, rabbit, NHP, rat, goat,
zebrafish, and more recently the minipig [17, 50, 105, 150-155]. For the study of persistent
bacilli and vaccination studies, the guinea pig has jumped to the forefront of TB research [156].
The guinea pig model has several advantages; there are many immunological reagents available,
and they form necrotic primary granulomas which are similar to certain human lesions. Once
infection of the respiratory route occurs, it has been suggested that every inhaled bacterium gives
rise to the formation of a lung lesion. After initial exposure by a low dose aerosol, the infected
guinea pigs develop primary lesions, characterized by a necrotic core [105, 150, 151, 157-162].
The primary lesions differ from secondary lesions which are non-necrotic and originate from
extrapulmonary hematogenous dissemination after the activation of acquired immunity [163].
Vaccination of guinea pigs has shown to produce an overall reduction in size and degree of
necrosis, a reduction in the number of bacilli, prevention of the hematogenous reseeding of
previously unaffected portions of the lung [150, 164].
The progression of pathogenesis in the guinea pig model has been well studied [11, 105,
136, 151, 158-163, 165, 166]. As early as 15 days after aerosol infection, small aggregations of
epitheloid macrophages mixed with granulocytes can be seen. Within one-month post infection
the classic granuloma with a prominent necrotic eosinophilic core packed with karyorrhectic
debris is present throughout the lung section. By two months post-infection, the guinea pig has
necrotizing granulomatous lesions with peripheral fibrosis. Guinea pigs develop distinct regions
of necrosis with defined rings of fibrosis that can progress to mineralization or calcification
within the centralized core of this area. Surrounding this acellular core is a ring of epithelioid
19

macrophages, lymphocytes, and small numbers of multinucleated giant cells, neutrophils and
eosinophils [162, 163].
While the guinea pig is a suitable medium-sized animal model resembling human
pathology features for pathology to date, it does have its disadvantages for preclinical drug
testing. The animals are substantial in size and therefore more expensive than mouse models. For
drug development purposes, the animals also require substantial drug amounts which are usually
not available in early drug discovery efforts. The main disadvantage of using guinea pigs in TB
drug development is however their intolerance to broad-spectrum drugs, which disturb their
delicate gastrointestinal flora which is required to generate their vitamin-C supply [162, 167].
The vitamin-C deficiency can lead to colitis, and cause gut lesions. To combat the resultant
anorexia and in severe cases death an emulsion of drugs in sucrose, vegetable puree,
lactobacillus and vitamin C supplement is often given [162], which might affect results and
should be controlled for.
The rabbit was historically used by Maxwell Lurie to test the resistance and susceptibility
to TB [168]. The granulomas that develop in these particular resistant rabbit strains are highly
reflective of human disease in that they can develop various lesion types including cavitary
disease. Lurie used an inbred New Zealand White rabbit strain, which was susceptible to TB.
However, the strain no longer exists [11]. Other current rabbit strains will clear most of the
infection with MTB H37Rv or Erdman, but are more susceptible to M. bovis [169]. The rabbits,
however, will produce a reliable cavitary model when infected with highly virulent W-Beijing
strains, such as HN878 [170]. For the study of latent disease the rabbit model is infected with
H37Rv or Erdman [155]. Unfortunately, many immunological reagents for rabbit are not widely
available
20

The study of latent tuberculosis is most successful in NHP [50]. NHP are naturally
susceptible to MTB infection and exhibit most characteristics of human disease [171]. After
intratracheal infection, about half of NHP develop latent disease, mimicking human pathogenesis
[171]. The latent stage in the NHP model is defined as animals that have received an infectious
dose, are skin-test positive, show lesions on X-rays but do not develop clinic symptoms [172].
Unfortunately, primates are very expensive and impractical for many scientific programs
including early drug development.
Other animal models of tuberculosis disease such as the zebrafish, rat, goat and minipig
are useful to specific aspects of the study of TB. Zebrafish are naturally susceptible to
Mycobacterium marinum, which replicates in macrophages and produces a chronic
granulomatous infection with necrotic lesions [152, 173]. Zebrafish are small and are easily
manipulated, this allows researchers to develop molecular, genetic, and imaging tools that can be
translated to mammalian models [174]. Immunological tools are difficult to obtain making it
complicated to explore detailed host-bacteria relationships. Rats are primarily used in drug
development and pharmacokinetic testing of new compounds. The Wistar rat and cotton rat
models are resistant to MTB and have the potential to be developed for latent drug testing as the
rat tends to clear TB infection with the onset of the adaptive immunity [153, 175]. However, the
use of more virulent clinical MTB strains give more advanced disease leading to necrotic lesions
in the lungs. Goats can be naturally infected with Mycobacterium caprae, or experimentally
infected with M. bovis or M. tuberculosis. They develop encapsulated necrotic granulomas,
which produce a strong immunological response, such as an increased iNOS and neutrophilic
response, which may account for the highly developed necrotic lesions [154, 176]. Again here,
the immunological reagents are difficult to obtain. The minipig develops a heterogeneous
21

infection when MTB is injected intrathoracically. The minipig has been hypothesized to
represent human LTBI, they develop early cellular phase I lesions which progress into necrotic
encapsulated phase II granulomas by 5-9 weeks post infection [17]. Many of these larger animals
models show pathology that is highly representative of human lesions, however more data on
drug treatment is required to show whether they can add information for pre-clinical drug
investigation, as they are more cost-prohibitive
More recently, various research groups have reported on mouse strains that develop
necrotic lesions after an MTB infection. Currently, five genetically diverse mouse strains have
been described that show necrosis upon infection with MTB: the IL-13 transgenic mouse [177],
CBA/J [178], iNOS -/- [179], I/St [180], and C3HeB/FeJ [181] (summarized in Table 1.1).
The IL-13 transgenic mouse strain was first explored in terms of its pulmonary pathology
associated with asthma and other inhaled antigens. It was found that the removal of IL-13
resulted in a reduction in inflammatory response in the lung [182-184]. As of late, there has been
interest in the role of IL-4R-alpha/IL-13 axis involved in increasing TB-associated pathology
[177]. IL-13 transgenic mice were used to explore TB pathogenesis, and it was seen that mice
over-expressing IL-13 developed centrally necrotizing granulomas and peri-necrotic fibrosis
while wild type and IL-4Ra deficient mice lacked these features [177] (personal communication
with Dr. Ehlers).
Another MTB susceptible mouse strain, CBA/J, which does not have any immunological
defects, has been used to study intracellular cytokines after infection [185] as well as lesion
development when infected with low aerosol doses of MTB [178]. The CBA/J shares some
similarities with human disease with extensive granulomatous infiltration, necrosis, and fibrosis.
Studies done by Turner et al [77, 78] have shown increased levels of IL-10 and a decrease in
22

IFN-γ and IL-12 production. Judicious administration of anti-IL-10R antibody can successfully
promote the development of mature necrotic granulomas in the CBA/J mice [78]. The CBA/J
mouse model may be helpful in understanding neutrophils in MTB disease progression [178].
Table 1.1 Mouse Strains that Develop Necrotic Granulomas when infected with MTB
STRAIN DEFECT LUNG
FEATURES OTHER
DISEASES AVAILABILITY
IL-13 TRANSGENIC
Over-expression of IL-13/IL-4Ra
Necrotic lesions with peri-
necrotic fibrosis
Used to evaluate asthma and lung
inflammation
Requires in-house breeding colony
CBA/J
No TB related defect. Early
parental strain derived from same strain as
C3H
Early administration
of multiple doses of IL-10
promotes development of
necrotic encapsulated granulomas
Interstitial cystitis, cochlear nucleus,
thyroiditis, and lung injury
Commercially available
*difficult breeders
iNOS -/-
Knock-out of inducible Nitric
Oxide production
Uncontrolled bacterial growth
and development of
abscesses
Lung inflammation
and fungal infections
Requires in-house breeding colony
I/St Deficient gene locus Ts-1 on chromosome 1
Large regions of necrosis with
fibrosis
Intracellular pathogens: Chylamydia
pneumoniae and Salmonella
enterica
Requires in-house breeding colony
C3HeB/FeJ Deficient gene sst-1 locus on chromosome 1
3 types of advances
lesions with necrotic
encapsulated granulomas, necrotizing
alveolitis, and cellular
infiltrates
Intracellular pathogens:
Listeriosis and Leishmaniasis
Commercially available
*good breeders
23

Mice deficient in iNOS (inducible nitric oxide), a key reactive species component, have
uncontrolled growth bacilli and develop encapsulated abscesses in the lung [186, 187]. Early in
infection, the presence of iNOS is important for the control but it may also be linked to
antibacterial activity in chronic infection when induced in foamy macrophages [188]. iNOS KO
mice have an increased production of Gr1+, CD4+ and CD8+ cells compared to wild type mice
when infected with MTB [179].
The I/St mouse strain described by Apt et al will develop necrotic granulomas when
infected with MTB [189]. The functional differences between the I/StSnEgYCit (I/St) and
A/SnEgYCit (A/Sn) mouse strains are still being determined but it has been described that the
I/St has increased severity of lung pathology [190]. The I/St mouse strain has a recessive allele
of a single locus on chromosome 1, the resultant effect are macrophages are no longer efficient at
killing MTB. The gene locus has been named the Ts-1 (or tuberculosis sensitivity-1) by Apt et al
[189]. It should be noted that the I/St mice that are hypersusceptible to MTB are found to be
resistant to M. avium [191].
Lastly, the C3HeB/FeJ mouse strain, a sub-strain of the C3H strain able reliably develops
necrotic granulomas upon MTB infection. It was Igor Kramnik [181, 192] who performed most
of the initial studies for tuberculosis on this mouse strain, hence the tuberculosis mouse model
now being addressed by most as the “Kramnik mouse model”. The mouse strain has been found
to be susceptible to TB disease but is otherwise completely immunocompetent. The strain is
characterized by a de novo mutation of the Ipr1 (intracellular pathogen resistance 1) gene of the
sst-1 (super susceptibility to tuberculosis 1) locus on chromosome 1 of the mouse genome [193-
195]. Originally, the sst1 locus was thought to be associated with a 12-transmember domain
molecule, Nramp (natural resistance-associated macrophage protein 1), also on chromosome 1.
24

Nramp controls host resistance to intracellular pathogens including M. bovis and MTB [192,
196]. This was later however shown not to be the case, and it has since been determined that Ipr1
and Nramp are two distinct genetic locations 10-12 centimorgan apart on chromosome 1 [181].
The sst1 mutation is largely lung specific, and spleen and liver hematogenous
dissemination of MTB has been found similar to other mouse strains [192]. After early infection
with MTB C3HeB/FeJ mice develop large regions of diffuse necrosis that become organized
with time. Later in infection there are distinct regions of acellular necrosis encompassed with
epithelioid macrophages, lymphocytes, neutrophils and eosinophils. The mean survival time after
an intravenous infection with 105 colony-forming units of MTB is 3.5-5.5 weeks whereas for low
dose aerosol with 15-30 colony-forming units is 20-30 weeks. In vitro in macrophage cultures
from C3HeB/FeJ mice, this locus had an effect on macrophage-mediated control of MTB [197].
While the mutation has an effect on innate immunity, it is unclear what exact function the sst-1
controls. It has been determined that iNOS does not seem to play a role, the iNOS levels were
unaffected by the sst-1 mutation within the lung. Since the sst1 gene has such a dramatic effect
on the susceptibility in mice, further studies are underway by Kramnik et al. to address whether
the human homolog, SP110, also results in susceptibility to pulmonary TB [198, 199].
Potential uses for these mouse models developing advanced pathology are countless.
Currently, work is being done to explore positron emission tomography on the Kramnik mouse
model and the relation to drug treatment [200]. The Kramnik mouse model can be easily used
and lesions visualized using the PET scan equipment and can thereby effectively reduce the
numbers of animals needed to evaluate the effectiveness of drug therapy.
25

1.4 – RATIONALE
This goal of this thesis is to develop and optimize a model more reflective of human TB
disease capable of recapitulating clinical outcomes when evaluating drugs and drug regimens. To
achieve this objective a small animal model, such as a mouse model, is optimal due to the ease of
manipulation and large-scale reproducibility. The C3HeB/FeJ mouse strain develops necrotic
encapsulated granulomas similar to those found in human and NHP TB pulmonary disease.
Through comprehensive analysis of histopathology, immune response, and drug treatments we
aim to propose the C3HeB/FeJ mouse strain as a novel representative mouse model for the study
of MTB.
Specific Aim 1: To develop a reliable mouse model that reflects human disease; C3HeB/FeJ
mice are infected with MTB, which will develop necrotic encapsulated granulomas with specific
pathological features of advanced disease. C3HeB/FeJ mice develop features such as a collagen
rim, hypoxia, and neo-angiogenesis, which will create a microenvironment refractory to
chemotherapies that are not effective on actively replicating bacteria.
Specific Aim 2: To gain a better understanding of multiple aspects of the Kramnik mouse model
in terms of lesion progression, bacterial location, and cell-specific cytokine production.
C3HeB/FeJ mice infected with MTB will give us a greater understanding of the role local
microenvironment has in the development of a heterogencity of lesion types reflective of human
disease.
26

Specific Aim 3: Utilize the C3HeB/FeJ mouse model as a tool to improve treatment by using
various approaches: 1) by indentifying single drugs that are also effective against advanced
disease displaying necrotic lesions, 2) by co-treatment that improves pathology, 3) by using
alternative delivery systems adapted to advanced lesion types. The adjunctive therapy
approaches and knowledge gained from a small animal preclinical cavitary disease model will
improve drug therapy and shorten TB treatment duration.
The C3HeB/FeJ mouse model may be an important tool for the field of TB research and
other granulomatous diseases. This mouse model fills a gap in the late stage TB pre-clinical drug
discovery pipeline. In TB drug development compounds are initially evaluated in an acute mouse
model in order to know whether sufficient drug exposure is obtained that can lead to efficacy in
the lung. A more chronic infection mouse model is then used to provide drug efficacy
information over long treatment durations against an intracellular infection. The Kramnik mouse
model provides the TB field with the opportunity to determine the killing kinetic profile of a
drug against more advanced disease: under such pressures as in vivo hypoxia, against
extracellular bacteria, and a higher resistance frequency. The future will tell whether the
Kramnik mouse model will fill a niche and add more information than the classical mouse
models, or eventually will replace them. However in the meantime, there is much information to
be gained from studying this mouse model in terms of pathology, persistence, and immunology
that defines the lesion. Eventually, this mouse model will be instrumental in furthering the
treatment of the TB epidemic.
27

CHAPTER 2 – DEVELOPMENT AND EVALUATION OF THE C3HEB/FEJ MOUSE
MODEL FORMING NECROTIC GRANULOMAS FOR THE TESTING OF M.
TUBERCULOSIS DRUGS*
2.1 – INTRODUCTION
Mycobacterium tuberculosis (MTB) like other pathogenic bacteria can adapt to a wide
variety of microenvironments and survive for many months even following aggressive
combination drug therapy. In controlled in vitro studies, bacilli have been shown to survive
nutrient and oxygen depletion as well as microenvironments with high carbon monoxide and
nitric oxide concentrations [29, 130, 201]. These adaptation strategies are thought to facilitate
survival of MTB as the pulmonary environment changes due to immune-mediated pressure,
sequestration of the bacilli within granulomas, and in response to chemotherapeutic treatment.
One of the hallmarks of human tuberculosis (TB) infection is the development of
granulomatous inflammatory lesions with central caseous necrosis that form first in the lungs but
can involve essentially any part of the body resulting in extra-pulmonary tuberculosis [202]. In
post-primary disease that can occur decades after initial exposure, aggressive and more
destructive cavitary lesions often develop in the apical lung lobes, which are significantly less
responsive to long-term, combination drug therapy. While cavitary lesions often communicate
with conducting airways, necrotic granulomas are thought to be refractory to drug therapy
* Portions have been previously published in Antimicrobial Agents and Chemotherapeutics
Copyright © 2012, American Society for Microbiology. All Rights Reserved.
doi:10.1128/AAC.00217-12
28

because the microenvironment is hypoxic or microaerophilic, low in nutrients, and has a higher
concentration of carbon monoxide than more normal lung parenchyma [203]. These changes in
the lung microenvironment are thought to trigger the bacilli to alter their metabolic profile
making them more tolerant of drug therapy, especially those therapies that are most effective
against actively replicating bacilli [14, 204]. In addition, encapsulation of lesions by fibrous
connective tissue may represent a physical barrier to drug penetration which was recently
indicated in a study using the rabbit model [205]. We have shown in animal models that develop
necrotic lesions that the majority of bacilli are extracellular admixed with debris from necrotic
host cells [167]. Because these lesions more closely mimic what occurs in humans with naturally
occurring TB, it desirable to evaluate any promising new TB drug regimen under similar,
clinically relevant in vivo conditions. While the mouse model has proven its usefulness in TB
drug development [53, 206-209], the most commonly used mouse strains fail to develop
organized granulomas with central necrosis. This has been the main reason other model species
have been explored for drug testing [90]. While other TB animal models, such as the guinea pig
[162, 210], rabbit [155, 211], and NHP [50] form necrotic granulomas, each has drawbacks that
limit their usefulness for preclinical drug testing [212]. The NHP following a natural and
experimental MTB infection develops a variety of lesion types that more closely mimic the
human disease, but widespread use of this model is cost prohibitive for extensive preclinical drug
evaluations [50, 212, 213]. The rabbit model forms necrotic granulomas and cavitary lesions
following infection with M. bovis and highly virulent clinical MTB strains [155], however, the
rabbit model is also expensive to maintain. Additional drawbacks include pathogen containment
concerns, since rabbits shed MTB in the urine, and are highly susceptible to concurrent
infections with Pasteurella and Bordetella bronchiseptica [the latter also seen in guinea pigs].
29

The guinea pig model develops necrotic granulomas and while more cost effective, is limited by
the inability to tolerate certain drug classes resulting in dysbacteriosis and vitamin-C deficiency
after treatment with broad-spectrum antibiotics [162]. Of practical concern, for the larger animal
models a substantial quantity of drug is required to reach therapeutic tissue levels, which is
generally not available during the early preclinical stages of TB drug development.
Whereas the most widely used laboratory mouse strains such as Balb/c and C57BL/6
show little evidence of caseous necrosis and fibrosis [181, 214] a mouse strain with a recessive
allele, the C3HeB/FeJ mice, which was firstly described by Igor Kramnik et al. in context of an
MTB infection [192], develops highly organized encapsulated necrotic lesions following a TB
infection. We will from this point forward refer to this mouse model, as is also done by others, as
the “Kramnik mouse model” [200]. Kramnik’s group observed that although C3HeB/FeJ mice
had no overt immunodeficiency, they were highly susceptible to infection with TB. More
importantly, these mice developed pulmonary granulomas that more closely resembled human
lesions, which was a significant limitation of conventional mouse models of TB. Using a forward
genetic approach, they identified a region at the 54.0 cM location of chromosome 1, termed the
‘super-susceptibility to tuberculosis-1’ (sst1) locus which was responsible for a decreased ability
to control TB multiplication in the lungs. More importantly, the susceptible sst1 allele was
shown to control the formation of caseous necrosis of pulmonary lesions [215]. Further work
using positional cloning identified the ‘Intracellular pathogen resistance-1’ (Ipr1) isoform of the
‘interferon-inducible-75’ (Ifi75) gene as responsible for a significant proportion of the increased
susceptibility of the C3HeB/FeJ mice [194]. Ipr1 negative mice fail to control bacterial
replication to the same extent as wild-type control mice, even though major pathways controlling
macrophage responsiveness (nitric oxide production and upregulation by IFN-γ) were
30
demonstrated to be intact [197]. More importantly, infected macrophages from Ipr1 negative
mice preferentially die by necrosis as opposed to apoptosis.
In the Kramnik mouse model the bacterial load increases to high numbers and the lung
pathology progresses dramatically following a low dose infection with TB. This has been
described after an intravenous dose of 105 CFU, or an aerosol infection of 15-30 CFU per mouse
[181, 193]. Necrotic microfoci are observed after two weeks following infection, and progress to
highly organized encapsulated lesions at later stages of disease, when the bacterial load in the
lungs can reach 108 CFU or higher [181, 216]. The lesion necrosis in the Kramnik mouse model
occurs primarily in the lung, whereas the infection appears to be better controlled in other organs
such as in the spleen and liver [181].
Since the C3HeB/FeJ mice displayed an increased susceptibility to TB infection but
possessed an otherwise intact and functional immune system, and due to the formation of
necrotic lung lesions resembling human pulmonary lesions, we hypothesized that the Kramnik
mouse model may represent a novel model for preclinical screening of new, desperately needed
TB drugs. This mouse model also lends itself to advanced imaging techniques such as Positron
Emission Tomography (PET) which allowed the investigators to follow disease progression in
real time [200].
In this study, we compared disease progression, pathology, location of bacilli, and
responsiveness to monotherapy with multiple drugs in the Kramnik mouse model and Balb/c
mice that differ in their response to experimental TB infection.
31

2.2 – MATERIALS AND METHODS
2.2.1 Animals
Female specific pathogen-free C3HeB/FeJ and Balb/c mice aged 6-8 weeks were
purchased from Jackson Laboratories, Bar Harbor ME. Mice were housed in a bio-safety level III
animal facility and maintained with sterile bedding, water and mouse chow. Specific pathogen-
free status was verified by testing sentinel mice housed within the colony.
2.2.2 Bacteria and drugs
M. tuberculosis Erdman strain (TMCC 107) was used for drug evaluations in mice and
prepared as previously described [116, 217]. Briefly, the bacteria were originally grown as a
pellicle to generate low passage seed lots [116]. Working stocks were generated by growing to
mid-log phase in Proskauer-Beck medium containing 0.05% Tween 80 (Sigma Chemical Co., St.
Louis, MO) in three passages, enumerated by colony counting on 7H11 agar plates, divided into
1.5 ml aliquots and stored at -70°C until use.
Isoniazid (INH), rifampin (RIF), pyrazinamide (PZA) and metronidazole (MET) were
obtained from Sigma Chemical Co. (St. Louis, MO). Linezolid (LZD) was purchased from
21CEC (East Sussex, United Kingdom). Drugs were prepared for the treatment of the mouse
models as described before [116]. Briefly, RIF was dissolved in 100% DMSO, with subsequent
dilution in sterile water prior to administration. The final concentration of DMSO in the drug
preparation was 5%. INH and PZA were dissolved in sterile water. MET and LZD were
formulated in 0.5% methylcellulose (Sigma Chemical Co.).
32

2.2.3 Aerosol infection and drug treatment schedule
C3HeB/FeJ mice were exposed to a low-dose aerosol infection with M. tuberculosis in a
Glas-Col inhalation exposure system, as previously described [217], resulting in an average of 55
bacteria in the lungs on the day of exposure. Balb/c mice were exposed to a high-dose aerosol
infection with an undiluted logarithmically growing broth culture of MTB (optical density at 800
nm of ~1.0) [218, 219]. Five mice were sacrificed the following day to determine the number of
CFU implanted in the lungs.
Both mouse strains were treated with the following drugs: INH (25 mg/kg), RIF (10
mg/kg), PZA (150 mg/kg), MET (200 mg/kg) and LZD (100 mg/kg). For the Balb/c mice, drug
treatment with single drugs started two weeks post infection and occurred 5 days per week via
oral gavage. Mice were euthanized after 2, 4, 6 and 8 weeks of treatment by CO2 inhalation. For
the Kramnik mouse model, drug treatment with single drugs started 6 weeks post infection and
occurred 5 days per week via oral gavage. Mice were euthanized after 2, 4, and 7 weeks of
treatment by CO2 inhalation. For all mice, the left lung lobes were homogenized and the bacterial
load determined by serial dilution on 7H11 agar plates.
2.2.4 Enumeration of bacterial load of lungs and spleens
At the time of sacrifice, left and right lung lobes as well as the spleens were aseptically
removed. The right caudal lung lobe was perfused with fixative for pathology analysis. The left
and right cranial lung lobes were used for bacterial enumeration and disrupted with a tissue
homogenizer (Glas-Col Inc., Terra Haute, IN). The number of viable organisms was determined
by plating serial dilutions of lung homogenate on Middlebrook 7H11 agar plates supplemented
33

with OADC (GIBCO BRL, Gaithersburg, MD). Colonies were counted after at least 21 days of
incubation at 37°C [116].
2.2.5 Enumeration of drug resistant colonies of the lungs
Upper right lung lobes were collected from the drug treatment trials of the final two
treatment time points from both Balb/c and Kramnik mice. The lung lobes were disrupted with a
tissue homogenizer, serially diluted and plated on Middlebrook 7H11 agar plates supplemented
with OADC as well as on Middlebrook 7H11-OADC agar plates supplemented with specific
concentrations of drugs for resistance enumeration. The drug-containing 7H11 plates had the
following drug concentrations: 0.4 mg/mL of RIF, 4 mg/mL of INH and 8 mg/mL of LZD.
Colonies were counted after at least 21 day of incubation at 37°C and kept for 10 weeks to ensure
all viable colonies would be detected. The detection limit of the lung and spleen plating
procedure was 150 CFU, and 50 CFU respectively. The viable bacterial counts of whole organs
were calculated, converted to logarithms [CFU counts were log-transformed as Log10(x + .001),
where x equals the total organ CFU count]. The data were expressed as the mean Log10 CFU ±
the standard error of the mean for each group.
2.2.6 Statistical analysis
The viable CFU counts were converted to logarithms, which were then evaluated by a one-
way analysis of variance and two-way analysis of variance, followed by a multiple comparison
analysis of variance by a one-way Tukey test and Dunnett test (SAS Software program, Research
Triangle Park, NC). Differences were considered significant at the 95% level of confidence.
34

2.2.7 Staining procedures
At each sacrifice, the right caudal lung lobe was infused with 10% neutral-buffered
formalin and preserved until processed for histopathological assessment. Five micrometer thick
paraffin sections were stained with TB Auramine-Rhodamine T as per manufacturer’s
instructions (Becton-Dickinson, Sparks, MD), with modifications in order to visualize bacteria as
well as the surrounding lung tissue [134]. A combination fluorescent staining method was used
by combining Auramine O and Rhodamine B to stain the bacteria (AR; Becton Dickinson),
Hematoxylin QS for staining tissue (HQS; Vector Laboratories, Inc., Burlingame, CA), and 4’6-
diamidino-2-phenylindole dihydrochloride for staining nuclei (DAPI; Sigma Chemical Co.).
Briefly, tissue sections were dewaxed in xylene and rehydrated through a graded alcohol series,
then stained with TB Auramine-Rhodamine T for 30 min. After washing excess stain with
ddH2O, slides were decolorized with TB Decolorizer TM (BD) until the excess stain dissolved.
Counterstaining was performed with Hematoxylin QS for ~5 sec. After washing excess
Hematoxylin with ddH2O, slides were stained for 15 min. with DAPI (200 ng/mL final
concentration) and washed in ddH2O.
Lung tissue sections were stained to visualize the bacteria with the sensitive acid fast
staining method with Kinyoun’s carbol fuchsin (Rowley Biochemical Institute, Danvers, MA)
stain in a method described by the United States Armed Forces Institute of Pathology (AFIP
1968). Five micrometer thick paraffin sections were dewaxed in xylene and rehydrated through a
graded alcohol series, rinsed with tap water, then stained with Kinyoun’s carbol fuchsin for 30
min at 60°C. Excess stain was rinsed with ddH2O and slides were decolorized with 3% HCl acid
alcohol wash until pale pink. Counterstaining was achieved with TB Methylene Blue (Becton-
35

Dickinson) for ~10 sec as per manufacturer’s recommendations. Excess methylene blue was
washed away with ddH2O.
For staining of collagen deposition, Picrosirius red was used to detect the extent of
collagen fibrils made and thickness of collagen as it ages. Picrosirius red can distinguish between
new and already established collagen depositions. Newer collagen consists of thin fibrils that
stain green to yellow, while older, thicker collagen stains orange to deep red [220]. The staining
method used was previously established by Early et al. [221]. Briefly, section slides were stained
with Vector’s formulation of Mayer’s Iron Hematoxylin (Vector Laboratories) for 8 min at room
temperature then rinsed under tap water until clear. Slides were submerged in a bath of 0.1%
Sirius red in saturated picric acid (Electron Microscopy Sciences, Hatfield, PA) in the chemical
hood for 1 hr at room temperature. Subsequently, slides were submerged for 2 min into two
acidified water baths (0.5% glacial acetic acid). Finally the slides were dehydrated for 2 min in
distilled water, 3 min in 70% isopropanol, 3 min in two changes of 96% isopropanol, and 3 min
in two changes of 100% isopropanol baths. The slides were cleared once in xylene and mounted
with Permount mounting media (Fisher Scientific, Pittsburg, PA).
To visualize hypoxic regions in lung tissues, the pimonidazole Hypoxyprobe (Chemicon,
Burlington MA) immunohistochemical staining technique was used. Mice were intraperitoneally
injected with pimonidazole hydrochloride at a dose of 60 mg/kg at least 1 hour prior to sacrifice.
Antigens were retrieved on deparaffinized tissues with pronase (Fisher Scientific) for 40 min at
40°C. After reduction of endogenous peroxidase activity with 3% hydrogen peroxide for 20 min,
the anti-pimonidazole antibody Hypoxyprobe-1MAb1 (dilution 1:50; Chemicon), was added
overnight at 4°C with biotinylated reagent (Vector Laboratories). The reaction was visualized by
AEC (Vector Laboratories) [141].
36

2.2.8 Pathology and microscopy
The right caudal lobe from each mouse was collected at necropsy and fixed in 10%
neutral buffered formalin in phosphate buffered saline (PBS). Tissue sections were embedded in
paraffin and cut to 5 μm thickness on a microtome. Subsequent tissue sections were mounted on
glass slides, deparaffinized and stained either with Hematoxylin and eosin (H & E), Picrosirius
red, pimonidazole or AR fluorescent stain. Fluorescent sections were visualized using a Nikon
Intensilight mercury vapor lamp and scanned using a Nikon TE-I motorized microscope
controlled by Nikon NIS Elements software (Nikon, Melville, NY) with FITC, TRITC and DAPI
filters. Light microscopy sections were visualized using an Olympus BX41 with Olympus DP70
camera controlled by Olympus DP Software (Olympus, Melville, NY).
2.3 – RESULTS
2.3.1 Disease progression over time
Balb/c mice were infected with a high dose aerosol (4.04 ± 0.06 Log10 CFU one day post
infection) to achieve a similar pulmonary bacterial load as the highly susceptible Kramnik mice
by the initiation of drug treatment (day 12). At day 12 after aerosol infection, the bacterial
burden within the lungs had increased to 7.47 ± 0.06 Log10 CFU, at which point
chemotherapeutic treatment was initiated. At day 17 after aerosol, the lung burden had increased
to 8.24 ± 0.14 Log10 CFU after which the first mice from the untreated control group began to
display clinical symptoms and had to be humanely euthanized. By day 26, only two mice
remained from the untreated control group and the pulmonary bacterial load had increased to 8.3
± 0.7 Log10 CFU with both animals exhibiting severe clinical signs of infection (Table 2.1).
37

Table 2.1. Bacterial numbers in lungs and spleens one day post infection, 12 days post infection (start of drug treatment), and after 2, 4, 6 and 8 weeks of treatment in Balb/c micea Log10 CFU ± SEM Treatment Regimen Lung Lobe nb/N Spleen nb/N Day 1, Balb/c 4.04 ± 0.06 5/5 Day 12, Balb/c (Pre-Treatment Controls) 7.47 ± 0.06 5/5 3.65 ± 0.20 5/5 Day 17, Balb/c 8.24 ± 0.14 7/7 5.36 ± 0.12 7/7 Day 26, Balb/c 8.30 ± 0.70 2/2 5.65 ± 0.13 2/2 2 weeks INH, Balb/c 5.50 ± 0.08 5/5 1.94 ± 0.24 2/5 2 weeks RIF, Balb/c 5.11 ± 0.11 5/5 2.49 ± 0.24 4/5 2 weeks LIN, Balb/c 5.55 ± 0.08 5/5 4.21 ± 0.12 5/5 2 weeks PZA, Balb/c 6.11 ± 0.00 1/5c 4.50 ± 0.13 5/5 2 weeks MET, Balb/c 8.13 ± 0.40 7/7 5.23 ± 0.09 7/7 4 weeks INH, Balb/c 4.98 ± 0.03 5/5 0.00 ± 0.00 0/5 4 weeks RIF, Balb/c 4.56 ± 0.08 5/5 1.90 ± 0.10 3/5 4 weeks LIN, Balb/c 5.18 ± 0.12 5/5 4.14 ± 0.13 5/5 4 weeks PZA, Balb/c 5.58 ± 0.07 5/5 4.82 ± 0.10 5/5 6 weeks INH, Balb/c 4.56 ± 0.09 5/5 0.00 ± 0.00 0/5 6 weeks RIF, Balb/c 3.31 ± 0.02 5/5 0.00 ± 0.00 0/5 6 weeks LIN, Balb/c 4.03 ± 0.06 5/5 3.77 ± 0.12 5/5 6 weeks PZA, Balb/c 5.28 ± 0.07 5/5 4.99 ± 0.09 5/5 8 weeks INH, Balb/c 3.62 ± 0.06 5/5 0.00 ± 0.00 0/5 8 weeks RIF, Balb/c 3.36 ± 0.29 5/5 0.34 ± 0.34 1/5 8 weeks LIN, Balb/c 3.71 ± 0.16 4/5 3.70 ± 0.17 4/5 8 weeks PZA, Balb/c 5.51 ± 0.09 5/5 5.15 ± 0.10 5/5 aData are Log10 CFU counts in the lung and spleen. bn/N, number of mice that yielded viable CFU data (n) over the total number of mice that group (N). cOne mouse yielded viable colonies due to technician error
For the infection of the Kramnik mouse model, preliminary experiments were performed
to establish a non-lethal bacterial inoculum that would still allow progression of the disease to
state exhibiting caseous necrotic lesions. These initial experiments showed that an aerosol
infection resulting in an average of 84.4 CFU in the lungs on day one after aerosolization gave
rise to an average bacterial burden of 9.14 ± 0.17 Log10 CFU in the lungs by day 30, however,
the study had to be terminated early at day 44 due to mortalities. To reduce the mortality rate of
38

the infected mice and increase the timeline of the experiment, a final protocol was used where
mice were infected with an average of 55 CFU, which resulted in a productive TB infection,
generated necrotic lesions after 40 days, showed a stable chronic infection of about 108 CFU, and
allowed survival of the Kramnik mice to at least 90 days (data not shown).
To test the efficacy of single drug treatments, the Kramnik mice were aerosol infected
with an average of 57 bacteria in the lungs per mouse. By 6 weeks of infection, the bacterial load
in the lungs of the Kramnik mice had reached 6.85 Log10 CFU, at which time drug therapy was
initiated. The pulmonary bacterial load continued to increase slowly in the lungs of the untreated
Kramnik control mice throughout the duration of the experiment. By 13 weeks of infection,
Kramnik mice had an average of 7.92 Log10 CFU in their lungs, at which point the experiment
had to be terminated due to increased morbidity and clinical signs of disease (Table 2.2).
39

Table 2.2. Bacterial numbers in lungs and spleens one day post infection, 42 days post infection (start of drug treatment), and after 2, 4 and 7 weeks of treatment in Kramnik micea Log10 CFU ± SEM Treatment Regimen Lung Lobe nb/N Spleen nb/N Day 1, Kramnik 1.57 ± 0.21 5/5 Day 42, Kramnik (Pre-Treatment Controls) 6.85 ± 0.44 5/5 4.48 ± 0.06 4/5 2 weeks Control, Kramnik 6.77 ± 0.41 5/5 4.57 ± 0.11 5/5 2 weeks INH, Kramnik 5.52 ± 0.54 5/5 2.82 ± 0.09 5/5 2 weeks RIF, Kramnik 5.31 ± 0.19 5/5 3.30 ± 0.23 5/5 2 weeks LIN, Kramnik 6.24 ± 0.31 5/5 4.10 ± 0.12 5/5 2 weeks PZA, Kramnik 6.53 ± 0.39 5/5 4.41 ± 0.24 5/5 2 weeks MET, Kramnik 6.35 ± 0.39 5/5 4.52 ± 0.14 5/5 4 weeks Control, Kramnik 7.25 ± 0.46 5/5 4.94 ± 0.13 5/5 4 weeks INH, Kramnik 5.43 ± 0.62 5/5 4.08 ± 0.16 5/5 4 weeks RIF, Kramnik 4.82 ± 0.61 5/5 2.68 ± 0.18 5/5 4 weeks LIN, Kramnik 5.68 ± 0.46 5/5 3.95 ± 0.26 5/5 4 weeks PZA, Kramnik 6.74 ± 0.71 5/5 4.40 ± 0.29 5/5 4 weeks MET, Kramnik 7.58 ± 0.45 5/5 4.67 ± 0.18 5/5 7 weeks Control, Kramnik 7.98 ± 0.27 4/4 5.46 ± 0.21 4/4 7 weeks INH, Kramnik 6.22 ± 1.61 3/5 1.95 ± 0.49 4/5 7 weeks RIF, Kramnik 5.13 ± 0.48 4/5 0.79 ± 0.49 2/5 7 weeks LIN, Kramnik 4.97 ± 0.68 9/9 3.44 ± 0.36 9/9 7 weeks PZA, Kramnik 6.57 ± 0.44 9/9 4.36 ± 0.21 9/9 7 weeks MET, Kramnik 7.50 ± 0.42 5/5 4.86 ± 0.12 5/5 _____________________________________________________________________________ aData are Log10 CFU counts in the lung and spleen. bn/N, number of mice that yielded viable CFU data (n) over the total number of mice that group (N).
2.3.2 Histopathology of the Kramnik mouse model throughout disease progression
At the initiation of drug treatment, the Kramnik mice had small foci of mixed
inflammation composed primarily of lymphocytes and macrophages (Figure 2.1A). In the early
stages of cell necrosis, macrophage and lymphocytes were accompanied by infiltrates of
granulocytes within alveolar spaces (Figure 2.1B). Necrotic foci expanded in size rapidly
between 6 and 10 weeks after aerosol infection. The accumulation of necrotic and fragmented
40

nuclei within the alveolar spaces is evident by basophilic staining with the progression of
disease.
Figure 2.1. Experimental infection of C3HeB/FeJ mice with the Erdman strain of M. tuberculosis progresses to form expansive lung lesions with liquefactive necrosis. (A) Non-necrotic lung lesions in the early stages of development are composed primarily of lymphocytes and foamy macrophages (B) With the progression of disease, there is early neutrophil infiltration centered around small foci of lesion necrosis (arrow). (C) At 10 weeks of infection, multiple lesions with central liquefactive necrosis (N) are delineated from the more normal parenchyma by a fibrous capsule (arrowhead). (D) At 13 weeks of infection necrotic lesions extend into the surrounding parenchyma (upper inset) and coalesce. (E) A higher magnification image from upper inset in D, shows severe necrotizing alveolitis (NA) delineated by remnants of intra-alveolar septal walls. (F) A higher magnification image within the lower inset in D showing a fibrous capsule delineating compressed lung parenchyma (upper right corner) from a layer of foamy macrophages (white arrow) and central liquefactive necrosis (N). Stain: Hematoxylin and Eosin.
At 10 weeks of infection, necrotic lesions were demarcated from more normal
parenchyma by a capsule of fibrous connective tissue (Figure 2.1C). Besides encapsulated
lesions, the alveoli filled with necrotic debris (necrotizing alveolitis) but the inter-alveolar septae
were often intact. (Figure 2.1D, E). By 13 weeks of infection, an inner layer of foamy
41

macrophages separated the necrotic core from the fibrous capsule. Therefore in the Kramnik
mouse, two distinct lesion types emerged in the lung, those being encapsulated lesions with
liquefactive necrosis (Figure 2.1F), and the more extensive but unencapsulated necrotizing
alveolitis (Figure 2.1E). Occasionally, the encapsulated lesions developed central cavities
(Figure 2.2D) lined predominately by granulocytes (Figure 2.2E). Other pathology features seen
were individual cell necrosis with intracellular and extracellular cholesterol clefts (Figure 2.2C),
and the proliferation of blood filled vessels at the periphery of the lesions indicative of early neo-
angiogenesis (Figure 2.2A and 2.2B).
Figure 2.2. Other manifestations of experimental Erdman infection of C3HeB/FeJ mice include neovascularization, individual foamy macrophage necrosis, cholesterol cleft formation and cavitary lesions. (A) Higher magnification of the fibrous capsule from a lung lesions with liquefactive necrosis shows an increase in blood filled capillaries and infiltrates of mixed inflammatory cells. (B) A higher magnification of the region depicted by the square in A showing numerous blood filled capillaries (arrowheads). (C) Besides liquefactive necrosis, lesions have individual foamy macrophage (blue arrow) necrosis with intracellular and extracellular cholesterol clefts (black arrow). (D) Encapsulated lesions with liquefactive necrosis occasionally have central cavitation (Ca). A higher magnification image of the inner surface of the cavitary lesions depicted by the square in D showing a dense accumulation of neutrophils (arrow) admixed with foamy macrophages and lymphocytes. Stain: Hematoxylin and Eosin.
42

Picrosirius red staining was used to visualize new and established collagen fibrils within
the fibrous capsule surrounding necrotic lesions [221]. The Picrosirius stains established a
mixture of collagen deposits with thick (1.6-2.4 microns) fibrils that stained dark red/orange, and
thin fibrils (0.8 micron or less) that stained bright yellow/green in the later stages of infection
(Figure 2.3A, B).
Figure 2.3. Lung lesions with liquefactive necrosis from C3HeB/FeJ mice experimentally infected with the Erdman strain of M. tuberculosis are delineated by fibrous connective tissue. (A) Newer, immature collagen fibrils (F) are admixed with more mature collagen (yellow, birefringence). (B) A higher magnification image of the fibrous capsule depicted by the rectangle in (A) showing both immature collagen fibrils (yellow, birefringence) and mature collagen fibers (red staining). Stain: Picrosirius red.
2.3.3 Histopathology of the Balb/c mouse model throughout disease progression
At the initiation of treatment (2 weeks after high dose aerosol), Balb/c mice had small
foci of inflammation composed predominately of lymphocytes and smaller accumulations of
epithelioid macrophages with no evidence of necrosis. To evaluate the response to the high dose
aerosol infection, several untreated animals were euthanized at three and four weeks following
infection, which is the time the first mice succumbed to disease. At three-weeks, larger foci of
inflammation were accompanied by early individual cell necrosis that occupied approximately
43

5% of the lung lobe evaluated. Necrotic cells were characterized by nuclear fragmentation
(karyorrhexis) and an increase in foamy macrophages. By four-weeks, approximately 15% of the
lung parenchyma from Balb/c mice had developed multifocal to coalescing foci of
granulomatous inflammation with scattered foci of necrosis (data not shown).
2.3.4 Acid-Fast staining by Kinyoun and Auamine-Rhodamine
Kinyoun Carbol-Fuchsin staining is an acid fast staining technique also used clinically as
an alternative to Ziehl-Neelsen [222]. At every stage of infection, the Kinyoun staining method
stained high numbers of bacteria in the Kramnik mouse lungs throughout the progression of
disease (Figure 2.4). At 6 weeks, primarily extracellular bacteria were concentrated within
necrotic lung lesions (Figure 2.4A). Few intracellular bacilli were within foamy macrophages
within alveoli and within the necrotic center adjacent to the fibrous capsule. At 10 and 13 weeks
of infection, the Kinyoun stain continued to detect very high numbers of extracellular bacilli
within the necrotic lung lesions (Figure 2.4B, C).
The Auramine-Rhodamine (AR) stain combined with DAPI and Hematoxylin was also
used to visualize acid-fast MTB within the surrounding tissue by fluorescence microscopy. Over
the course of the disease in the Kramnik mouse model, AR gradually stained fewer bacteria (as
seen in Figure 2.4D, E, and F). This gradual decrease in AR staining is first seen in the center of
the necrotic lesion, which then expanded outward ultimately resulting in the majority of bacteria
becoming AR negative (Figure 2.4F). At 6 weeks of infection, pockets of intracellular bacilli
were seen in inflammatory foci composed of lymphocytes and foamy macrophages (Figure
2.4D). At 10 weeks of infection, extracellular, AR positive bacilli were concentrated at the rim of
the necrotic lesions. Very few small foci of intracellular bacilli can be found on the outside of
44

collagen rim (Figure 2.4E, insert 1 and insert 2). At 13 weeks of infection, few AR positive
bacilli were seen within or outside the lesion (Figure 2.4F and inset).
Figure 2.4. Different staining techniques reveal phenotypic differences in bacilli in the late stage of experimental infection of C3HeB/FeJ mice with the Erdman strain of M. tuberculosis. Images A and D are serial sections of lesions from mice 6 weeks after infection. B and E are serial sections of lesions from mice 10 weeks after infection and C and F are serial sections of lesions from untreated control mice at 13 weeks after infection. Kinyoun stained sections A, B and C detect numerous intra and extracellular bacilli. (A) At 6 weeks of infection, bacilli are primarily intracellular, whereas at 10 weeks (B) the majority of bacteria are located within necrotic granulomas. (C) 13 weeks post infection showing the center of liquefactive necrotic lung lesion positive for AFB. Auramine-Rhodamine stained sections (D), (E), and (F) lose the ability to detect bacilli over infection. (D) At 6 weeks intracellular bacilli are clearly seen. With magnification inset of intracellular staining. (E) At 10 weeks the central region of necrotic granuloma is devoid of fluorescent bacilli. Inset 1, the center of necrotic lesion has reduction in A/R positive bacilli. Inset 2, the edge of the necrotic lesion retains the majority of detectable staining. (F) At 13 weeks the entirety of the necrotic lung lesion is without stain, save the very edge of the rim, depicted in inset.
45

2.3.5 Pulmonary granulomas in the Kramnik mouse model are hypoxic
The hypoxic nature of necrotic TB granulomas has been reported in other animal models
for TB infection, such as guinea pigs, rabbits and NHP [134, 212], but is generally not observed
in the mouse model of infection [223]. We evaluated oxygen tension in the Kramnik model using
immunohistochemical detection of pimonidazole hydrochloride (Hypoxyprobe) adducts
throughout the progression of disease. The use of Hypoxyprobe identified the presence of
hypoxic cells around the edges of caseous granulomas when performed at 10 and 13 weeks post
aerosol infection (Figure 2.5A, 2.5B). The hypoxia staining was more prominently centered
around alveolar necrosis in areas of pulmonary pneumonia (Figure 2.5C). As the activated
intermediate of pimonidazole is only produced within viable cells under conditions of low
oxygen tension, the central necrotic tissue does not directly stain with Hypoxyprobe due to a lack
of intact, viable cells.
46

Figure 2.5. Lung lesions with liquefactive necrosis from C3HeB/FeJ mice experimentally infected with the Erdman strain of M. tuberculosis show evidence of hypoxia. (A) Immunohistochemical staining for the hypoxia marker pimonidazole within a lung lesion with liquefactive necrosis (N) showing multiple positive stained cells. (B) A higher magnification of the region depicted by the square in (A) showing multiple cells staining positive for pimonidazole adducts. (C) Viable remnants of interalveolar septal walls within a region with necrotizing alveolitis have residual cells that stain positive for pimonidazole. Counter stain: Hematoxylin.
2.3.6 Anti-tuberculosis single drug treatment is less effective in the Kramnik mouse model
compared to the Balb/c mouse model
The goal of these experiments was to investigate and compare the killing kinetics of a
panel of single TB drugs in the Balb/c and Kramnik mouse models. For the purposes of these
experiments, we aimed to achieve similar bacterial numbers in the lungs of both Balb/c and
Kramnik mice at the initiation of drug treatment. To achieve this, Balb/c mice were infected with
47

a high dose aerosol (depositing ~11,000 CFU within the lungs) in order to reach ~108 bacilli in
the lungs at the start of drug treatment (14 days post infection). This bacterial load is similar to
that reached by day 42 in Kramnik mice following a low dose aerosol infection (~80 CFU).
Treatment cohorts of Balb/c mice were sacrificed at specific time intervals of 2, 4, 6 and 8 weeks
of treatment. Treatment cohorts of the Kramnik mice were sacrificed at specific time intervals of
2, 4, and 7 weeks of treatment. Following aerosol infection but prior to initiating drug treatment,
17 Kramnik mice showed significant weight loss and became moribund as determined by the
IACUC regulations. These animals were humanely euthanized and the remaining animals were
re-randomized into treatment groups.
All untreated Balb/c mice infected with ~11,000 CFU began to show overt signs of
clinical disease (ruffled fur, lethargy, trembling) by 26 days post infection and had to be
humanely euthanized. In contrast INH treatment in Balb/c mice showed a significant reduction in
the bacterial load in the lungs at all time points versus untreated controls at the start of treatment
(p < 0.0001; Figure 2.6A). In addition, the bacterial load in the lungs of Balb/c mice continued to
decrease statistically for all the time points evaluated (p < 0.005). After an initial decrease of
approximately 2 Log10 CFU in the first two weeks, the bacterial load continued to decrease
another 2 logs over the next 6 weeks. When we compared the activity of INH in Balb/c mice
with the Kramnik mouse model, the reduction in bacterial load in the lungs was far less
pronounced. After 2 weeks of treatment, the Kramnik mice showed a reduction of 1.25 Log10
CFU when compared to the untreated controls at the start of treatment (p = 0.1; Figure 2.6B).
While after 4 and 7 weeks of treatment, the reduction in the bacterial load in lungs was smaller
versus the untreated controls at the start of treatment (p = 0.09 and p = 0.5 respectively).
Comparison between treatment time points revealed no significant change in the Kramnik mouse
48

model over time. Evaluation of Balb/c and Kramnik mice by two-way ANOVA revealed highly
significant differences in the lungs following INH treatment (p < 0.001).
Figure 2.6. Isoniazid (INH) treatment at 25 mg/kg is less effective in C3HeB/FeJ mice against the Erdman strain of M. tuberculosis as compared to the Balb/c mouse strain. (A) In Balb/c mice the reduction in CFUs in the lung (filled symbols) and spleen (open symbols) was biphasic, whereas, in the C3HeB/FeJ mouse strain (B) the killing kinetics in the lung were attenuated as was the efficacy in the spleen. (*) Untreated control mice were euthanized at day 26 due to morbidities. (ND) No bacterial colonies detected; detection limit = 50 CFU.
In spleens, INH treatment was highly effective for Balb/c mice resulting in a non-
culturable state at 4 weeks of treatment. At all time points the reduction in bacterial load was
highly significant when compared to untreated controls at treatment start (p < 0.0001; Figure
2.6A). In the Kramnik mouse model, there was a reduction in spleens, however it failed to reach
a non-culturable state. The decrease in the bacterial load in the spleen only became significantly
different from the untreated controls at the start of treatment after 7 weeks of INH therapy
(Figure 2.6B). Surprisingly, after 4 weeks of treatment the bacterial load was higher than that
observed after 2 weeks (p < 0.05).
Treatment with RIF showed very similar killing kinetics as the ones described for INH.
After the initial 2 weeks of RIF treatment, Balb/c mice showed a reduction of the bacterial load
in lungs of 2.36 logs versus untreated controls at the start of treatment (p < 0.0001). The bacterial
load in the lung continued to decrease at a highly significant rate throughout RIF treatment
49

(Figure 2.7A), except for the 6 and 8 week treatment interval when there was no statistically
significant decrease in log CFU (p = 0.8). After an initial decrease of ~2.5 Log10 CFU in the first
two weeks, the bacterial load continued to decrease another 2 logs over the next 6 weeks. After 2
weeks of RIF treatment, the Kramnik mice showed a reduction in bacterial load of 1.47 logs (p <
0.01), and after 4 weeks the bacterial number only decreased another ~1 Log10, totaling a 2.43
log reduction versus the untreated controls at the start of treatment (p < 0.005; Figure 2.7B). At
the final sacrifice point for the Kramnik mouse model, the results showed a significant reduction
versus the untreated controls (reduction of 2.85 logs; p < 0.05) but there was not a significant
change between 2, 4 and 7 weeks of treatment. There was no significant difference seen between
Balb/c and Kramnik mice at the 2 week time point, however, for the subsequent timepoints the
treatment results for Balb/c and Kramnik mice were significantly different (p < 0.001).
Figure 2.7. Rifampin (RIF) treatment at 10 mg/kg is less effective in C3HeB/FeJ mice against the Erdman strain of M. tuberculosis as compared to the Balb/c mouse strain. (A) In Balb/c mice the reduction in CFUs in the lung (filled symbols) and spleen (open symbols) was biphasic, whereas, in the C3HeB/FeJ mouse strain (B) the killing kinetics in the lung were attenuated as was the efficacy in the spleen. (*) Untreated control mice were euthanized at day 26 due to morbidities. (ND) No bacterial colonies detected; detection limit = 50 CFU. In spleens, similar results were obtained for RIF as those described for the lungs however
they were less pronounced. Treatment with RIF was highly effective in the spleens of Balb/c
50

mice resulting in a non-culturable state at 6 weeks of treatment (only 1 colony was observed in
one mouse at 8 weeks). For all time points of the Balb/c mice, the CFU were significantly
reduced when compared to untreated controls at the start of treatment (p < 0.0001; Figure 2.7A).
For the Kramnik mouse model, the spleens also showed a more gradual decrease in the bacterial
load over time with a dramatic decrease at the 7-week time point being the only statistically
significant time point compared to pretreatment controls (p < 0.0001; Figure 2.7B). However, the
Kramnik mice failed to reach a non-culturable state. Balb/c and Kramnik mice were not
significantly different throughout the course of treatment when compared by two-way ANOVA.
For LZD, superior killing kinetics was observed in Balb/c mice versus Kramnik mice in
lungs; however the activity in spleen was static in both mouse models. At all time points
throughout the experiment there was an insignificant decrease in the lung bacterial load in the
Balb/c strain when compared to the untreated controls at treatment start and between treatment
groups. In the Kramnik mouse model there was a lack of significant drug activity early on (after
2 and 4 weeks of treatment) versus the untreated controls at the start of treatment. After 7 weeks
of LZD treatment, a significant increase in activity was observed in the Kramnik mice with a
bacterial log reduction of 1.85 logs compared to the untreated controls at the start of treatment (p
< 0.005). Comparison between treatment groups demonstrated a slight reduction in bacterial load
from 2 weeks to 7 weeks of treatment (p < 0.05) as the activity of LZD increased over time in the
Kramnik mouse model. Comparison by two-way ANOVA showed that the Balb/c and Kramnik
mice were significantly different throughout infection (p < 0.01).
LZD treatment showed in the spleens of Balb/c mice an initial increase of 0.6 logs in
bacterial load compared to the untreated controls at the start of treatment (p < 0.01) at 2 weeks,
but showed no additional statistically significant change after this (Figure 2.8A). For the
51

Kramnik mice, the bacterial load in the spleen initially showed an increase, followed by a
continued decrease at every time point after the start of treatment, none of which were
statistically significant when compared to the start of therapy (Figure 2.8B). Spleen data in
Balb/c and Kramnik mice were not significantly different throughout the course of treatment
when compared to each other through two-way ANOVAs.
Figure 2.8. Linezolid (LZD) treatment at 100 mg/kg is less effective in C3HeB/FeJ mice against the Erdman strain of M. tuberculosis as compared to the Balb/c mouse strain. (A) In Balb/c mice the reduction in CFUs in the lung (filled symbols) and spleen (open symbols) was biphasic, whereas, in the C3HeB/FeJ mouse strain (B) the killing kinetics in the lung were attenuated as was the efficacy in the spleen. (*) Untreated control mice were euthanized at day 26 due to morbidities.
In the lungs, PZA had highly significant activity in Balb/c mice at 2, 4, 6, and 8 weeks of
continuous treatment (p < 0.0001) when compared to the untreated controls from the start of
treatment (Figure 2.9A). When comparing the activity over the different treatment times, there
was a significant change (p < 0.01) in bacterial load between week 2 and 4 of treatment, whereas
the reduction was not statistically significant when comparing treatment groups at 4 versus 8
weeks (p > 0.5). In the Kramnik mouse model, there was no significant change in the bacterial
load in the lungs over 7 weeks of treatment (p > 0.5). The untreated controls of the Kramnik
52

mouse model continued to have an increase in bacterial load of about 1 Log10CFU in lungs,
resulting in a statistically significant reduction of the bacterial load in the PZA treated mice
versus the untreated controls (p ≥ 0.03; Figure 2.9B).
Figure 2.9. Pyrazinoic acid (PZA) treatment at 150 mg/kg is bacteriostatic in C3HeB/FeJ mice against the Erdman strain of M. tuberculosis as compared to the Balb/c mouse strain. (A) In Balb/c mice the reduction in CFUs in the lung (filled symbols) and spleen (open symbols) was more pronounced in the early stages of infection but was less effective late. (B) PZA treatment of C3HeB/FeJ mice prevented the progressive bacterial growth seen in control animals (diamonds) and therefore was bacteriostatic in the lung and spleen. (*) Untreated control mice were euthanized at day 26 due to morbidities. In the spleens of Balb/c mice, PZA treatment showed an initial non-significant increase in
bacterial load after 2 weeks (+ 1 Log10 CFU), followed by a significant increase at each
subsequent time point versus the untreated controls at the start of treatment (p < 0.01). At the end
of 8 weeks of treatment the bacterial loads in spleens in Balb/c mice showed a highly significant
increase (+1.5 Log10 CFU) from untreated controls at the start of treatment (p < 0.001; Figure
2.9A). In the Kramnik mouse model, PZA activity was not significant at any time point
throughout the experiment versus the untreated controls at the start of treatment. There was a
~0.5 Log10 CFU increase from the start of treatment to 2, 4 and 7 weeks of therapy, which then
remained stable at about 4.4 Log10 CFU (p ≥ 0.1). Comparing the data from Balb/c and Kramnik
53

mice by means of two-way ANOVAs throughout infection showed a highly significant
difference in the lung (p < 0.005) and a non-significant result in the spleens of both mouse
models.
MET was administered at a high dose of 200 mg/kg in order to maximize the chance of
observing drug activity. Previously reported pharmacokinetic data by others described that 15
mg/kg MET was sufficient to reach 4.6-11.3 mg/ml peak serum concentration similar to humans
[224-226]. MET did not show any activity in lungs and spleen in both the Balb/c and Kramnik
mouse models. Due to the lack of significant activity, Balb/c mice infected by a high dose
aerosol became moribund after 2 weeks of therapy with MET and required humane euthanasia.
Therefore, only the 2 week time point was available to collect data for the Balb/c mice and the
results enumerating the bacterial load were not significantly different when compared to
untreated control mice (Figure 2.10A). In the Kramnik mice, MET showed no significant
reduction in bacterial load when compared to the untreated control groups from the start of
treatment (p ≥ 0.2).
In both the Balb/c and the Kramnik mice, MET treatment showed no observable activity
in the spleen. None of the results were statistically significant when compared to the untreated
control groups (p ≥ 0.3; Figure 2.10B).
54

Figure 2.10. Metronidazole (MET) treatment at 200 mg/kg is not effective against the Erdman strain of M. tuberculosis in either Balb/c or C3HeB/FeJ mice. (A) In the Balb/c mouse strain MET had no effect in the reduction of CFUs in the lung (filled symbols) and spleen (open symbols) and resulted in early mortality. (B) In the C3HeB/FeJ mouse strain MET had no effect throughout entire study in the lung and spleen. (*) Untreated control mice were euthanized at day 26 due to morbidities.
2.3.7 Kramnik mice have higher numbers of drug resistant colonies
The high bacterial loads in the lungs at the start of drug treatment of both the Balb/c and
Kramnik mouse models led us to question whether the frequency of drug resistant mutants would
increase following prolonged drug treatment. To quantify drug resistance, serial dilutions of
mouse lung homogenates were simultaneously plated on 7H11 agar plates and 7H11 plates
containing the drug administered to each group. Balb/c mice (which harbored 7.37 ± 0.09 Log10
CFU at the start of drug treatment) showed few resistant colonies over the duration of therapy
with INH, RIF or LZD (Table 2.3). At each time point tested for the Balb/c mice, there were only
1-2 animals exhibiting few resistant colonies.
55

Table 2.3. Numbers of drug susceptible and drug resistant bacterial colonies isolated from lungsa ________________________________________________________________________________ Balb/c Lung Data Kramnik Lung Data ____________________________________ ______________________________________ Treatment CFU ± SEM nb/N Treatment CFU ± SEM nb/N Start of Treatment 7.47 ± 0.06 5/5 Start of Treatment 6.85 ± 0.44 5/5 4 weeks Control 7H11 7.58 ± 0.42 5/5 7 weeks Control 7H11 8.26 ± 0.52 4/4 6 weeks INH 7H11 4.89 ± 0.09 5/5 4 weeks INH 7H11 4.91 ± 0.67 5/5 6 weeks INH R 0.5 ± 0.5 1/5* 4 weeks INH R 1.26 ± 1.26 1/5† 8 weeks INH 7H11 3.99 ± 0.07 5/5 7 weeks INH 7H11 5.72 ± 1.11 5/5 8 weeks INH R 0.5 ± 0.5 1/5* 7 weeks INH R 4.47 ± 1.83 3/5 6 weeks RIF 7H11 3.53 ± 0.06 5/5 4 weeks RIF 7H11 4.39 ± 0.64 5/5 6 weeks RIF R 0 ± 0 0/5 4 weeks RIF R 0 ± 0 0/5 8 weeks RIF 7H11 3.37 ± 0.24 5/5 7 weeks RIF 7H11 5.47 ± 0.68 4/4 8 weeks RIF R 0.99 ± 0.61 2/5* 7 weeks RIF R 3.57 ± 1.26 3/4 6 weeks LZD 7H11 4.41 ± 0.07 5/5 4 weeks LZD 7H11 5.47 ± 0.46 5/5 6 weeks LZD R 0 ± 0 0/5 4 weeks LZD R 0 ± 0 0/5 8 weeks LZD 7H11 4.24 ± 0.07 5/5 7 weeks LZD 7H11 4.96 ± 0.94 5/5 8 weeks LZD R 0.68 ± 0.68 1/5‡ 7 weeks LZD R 0 ± 0 0/5 ________________________________________________________________________________ aData are Log10 CFU counts in the lung. Right upper lung lobes were plated on 7H11 plates with and without drugs (INH 4 mg/mL, RIF 0.4 mg/mL and LZD 8 mg/mL). The last two treatment time points for both Balb/c and Kramnik models were plated on drug containing plates. bn/N, number of mice that yielded viable CFU data (n) over the total number of mice that group (N). (*) Indicates only 1 colony per 1 mouse detected. (†) Indicates 1 mouse with a high number of colonies, a potential outlier. (‡) Indicates 1 mouse with 8 colonies
The Kramnik mouse model (which had 6.85 ± 0.44 Log10 CFU at the start of drug
treatment) showed a dramatic increase in resistant colonies from 4 weeks to 7 weeks of single
drug treatment. After treatment with INH for 4 weeks, one mouse out of 5 showed a small
number of resistant colonies, whereas after 7 weeks of treatment 3 of 5 mice had a large number
(4.47 ± 1.83 Log10 CFU) of resistant colonies. Treatment with RIF resulted in the presence of
resistant colonies only after 7 weeks on treatment; in which 3 of 4 animals exhibited 3.57 ± 1.26
56

Log10 CFU of resistant colonies. Throughout the duration of treatment with LZD, non-culturable
resistant colonies were observed in the Kramnik mice (Table 2.3). For PZA, drug resistance was
not evaluated by culturing due to the difficulty of observing robust PZA activity on drug
containing plates [227].
2.4 – DISCUSSION
In this study, we compared the response of the novel C3HeB/FeJ Kramnik mouse model
to the more conventional Balb/c mouse model following aerosol infection with MTB and
monotherapy using a panel of five clinically relevant drugs. This study was driven by the need
for a mouse model of TB infection that more closely mimics the pathology of naturally occurring
TB in humans, to facilitate more realistic in vivo drug testing against non-replicating or slowly
replicating persistent TB.
The most unique feature of the lung lesions that developed in Kramnik mice was the
formation of multiple discrete encapsulated lesions with central liquefactive necrosis as well as
areas of necrotizing alveolitis. In contrast, the more widely used Balb/c strain of mice developed
less extensive foci of mixed inflammatory cells with minimal cellular necrosis. Unlike the Balb/c
mouse strain, the Kramnik mouse model showed evidence of lesion hypoxia, fibrosis,
liquefactive necrosis, and occasional cavity formation. The use of immunohistochemistry to
detect adducts of pimonidazole as an indicator of hypoxia showed that residual viable cells
within necrotic lesions were under hypoxic stress at the time points tested. For most late
timepoints, pimonidazole staining was most often concentrated in clusters of foamy macrophages
rather than areas of liquefactive necrosis. This can be explained either by a lack of viable cells
57

capable of metabolizing pimonidazole or the regions of liquefactive necrosis being anoxic rather
than hypoxic.
A critical component of lung lesions of TB infected Kramnik mice was the deposition of
collagen that delineated foci of liquefactive necrosis from more normal lung parenchyma. The
picrosirius red staining showed a mixture of mature and immature collagen fibrils suggesting that
there was continuous remodeling of the capsule and that the granuloma is therefore a highly
dynamic structure which is in contrast to common belief. While not investigated in these studies,
the formation of a fibrous capsule is likely under the influence of cytokines and chemokines that
promote collagen deposition, an important feature of human TB lesions. Further studies to
characterize these important immunological mediators are currently underway.
Another important feature of the encapsulated lesions in the Kramnik model was the
accumulation of macrophages with abundant foamy cytoplasm that formed the most inner layer
of viable cells (located directly on the inside of the fibrous capsule). Foamy macrophages are not
only a consistent feature in multiple animal models of TB but are also present in human TB
lesions. The role foamy macrophages play in the pathogenesis of lesion formation or persistence
of bacilli is unknown but recent studies suggest that they contribute to the deposition of collagen
via the production of GM-CSF [228, 229]. In both Kramnik and Balb/c mice, the accumulation
of foamy macrophages was often accompanied by cholesterol deposition. Cholesterol derived
from the cell membrane of necrotic host cells forms characteristic clear clefts in microscopy
sections. The crystallized cholesterol is solubilized and removed by the fixation process;
however, the original location between clusters of foamy macrophages and the site of individual
cell necrosis is preserved. It has been shown primarily using in vitro cultures that bacilli in
microenvironments of hypoxia and nutrient deprivation adapt by altering their metabolism to
58

utilize lipids [139, 230]. It has been hypothesized that host cholesterol is utilized as an energy
source for the bacteria in this inhospitable environment of hypoxia and cellular debris. Studies
have shown upregulation of genes for lipid sequestration and metabolism in human patients
infected with TB, representing pathogen-mediated dysregulation of host lipid metabolism [230].
Although commonly used as an alternative to the mouse model, evaluating drug therapy
in the guinea pig model, which develops necrotic granulomas, has presented some challenges.
Guinea pigs clear the first-line TB drugs [167] moxifloxacin and PA-824 [210] very quickly
[even more rapidly than mice], resulting in the need for much larger drug doses in order to
achieve similar drug exposures over time. This leads to substantial drug intolerability, as guinea
pigs are especially susceptible to perturbations in the normal intestinal flora caused by broad-
spectrum antibiotics. Although many methods have been attempted to add vitamin supplements
and probiotics to their diet [162], adverse effects may still occur and could potentially skew
study results. Interestingly though, several studies to date have shown that guinea pigs, when
compared directly with mice, have greater and faster bacterial killing after drug treatment [157,
162, 210]. This is surprising as one would expect the bacteria within the caseous necrotic lesions
of infected guinea pigs to be more drug refractory (due to the slowed metabolism of the bacteria,
and/or drug penetration issues) versus the bacilli in the inflammatory lesions of the classical
mouse model.
Healing of lesions by dystrophic mineralization, which is a prominent pathological
feature in human TB and in the guinea pig TB model [166, 231, 232], is not a response observed
readily in the Kramnik mouse model. There are species differences in the rate of mineral
deposition and the shortened survival time may explain why mineralization is not seen in the
Kramnik and other mouse models of TB.
59

To visualize the TB bacilli in the lung lesions of the Kramnik mice during disease
progression, different acid-fast stains were used. In an earlier report, we described a novel triple-
staining method which identified TB bacilli as well as the surrounding tissues in the mice and
guinea pigs [134]. While the vast majority of bacilli identified in pulmonary lesions of Balb/c
mice were intracellular, the majority of bacilli present in the Kramnik mice were extracellular. In
addition, comparison of the AR and Kinyoun Carbol-Fuchsin staining methods revealed
differences in the number of stained bacteria identified in the Kramnik mouse model over the
course of infection. In the Kramnik mice, the bacilli appear to lose their AR acid-fastness as the
disease progressed into large hypoxic, liquefactive, necrotic granulomas. The decrease in AR
positive bacilli is noticeable starting from the center of the necrotic lesion and continuing
outward throughout disease progression until eventually all bacteria within the lesion core
become AR negative. This is in sharp contrast with the results obtained after Kinyoun staining
where the bacteria within the granulomas remain positively stained over time. Although the exact
target of both staining methods is still being debated [136], these results suggest that the lack of
detection with AR over time is due to a change in the bacterial phenotype. As AR still stains
bacteria under hypoxic conditions in vitro [136], as well as in guinea pig lung lesions [134], it is
unclear why the particular bacterial population in the Kramnik mice causes these negative
staining results. Genetic approaches will be required to examine the changes in the bacterial
phenotype in the lungs of the Kramnik mice.
To assess the suitability of the Kramnik mouse model for evaluation of new TB drugs
and treatment regimens, the efficacy of a panel of five single drugs was compared in Kramnik
mice that form necrotic lesions versus Balb/c mice solely forming non-necrotic or inflammatory
lesions. Mice were infected via aerosol with pursuant chemotherapeutic treatment for 7 to 8
60

weeks. Examination of the bacterial load in the lungs and the spleens revealed that the Kramnik
mice had a significantly refractory response to drug treatment using INH, RIF, LZD, or PZA
monotherapy when compared to Balb/c mice. This refractory effect in the Kramnik mice was
most pronounced for PZA, as PZA treatment was highly effective in the Balb/c mice [99% of
bacteria were eradicated in 4 weeks], whereas no decrease in bacterial CFU was observed in the
lungs of the Kramnik mice from the start of treatment. At 150 mg/kg, PZA contained the
bacterial load in the lungs of the Kramnik mouse model over the course of treatment whereas in
the untreated Kramnik controls there was a slowed but continuous growth observed [1 Log10
over 7 weeks]. This study was limited as only one single PZA drug dose was tested, and
therefore it is possible that a higher drug dose might show clear bactericidal activity in vivo. As
the lack of PZA activity in the Kramnik mouse model might have significant clinical
implications, it will be crucial to investigate a higher dose range in this mouse model. Overall,
the data obtained showed that the reduction in bacterial load in the Balb/c model far exceeded the
results seen in the Kramnik mouse model. This is in contrast to what we expected from previous
in vitro data describing PZA as primarily active against persistent bacilli [233]. Earlier in vitro
data identified some of the conditions required for potentiating PZA activity. Anaerobic
conditions have been shown to enhance the activity of PZA, and older cultures of TB are
somewhat more sensitive to PZA [234, 235]. PZA is known to show better in vitro activity at
lower pH [235], and to have better efficacy against intracellular bacilli in the macrophage
infection model [236]. To date, limited information is available on what bacterial population
PZA may target in vivo. A few earlier reports showed activity of PZA against TB using mouse
models infected via different routes and with different inoculum sizes (reviewed in [237]). The
reason for the failure to observe any cidal activity in the Kramnik mouse model cannot merely be
61

attributed to the extracellular nature of the bacteria or penetration across the granuloma as PZA
has been shown to have activity in the guinea pig model of infection [238]. It is remarkable that
the mechanism of action for PZA, one of the three pillar TB drugs, remains largely a mystery
after many years. As these results would have significant clinical implications, more studies are
required to assess PZA resistance frequencies in vivo, evaluate multiple PZA doses, and measure
PZA penetration in lung lesions using the Kramnik mouse model.
Metronidazole on the other hand did not show any activity in either mouse infection
model even though excessively high doses were administered. MET, a drug which requires
anaerobic conditions for activation, has been previously reported to lack demonstrable activity in
mice [225, 226] whose lesions fail to become hypoxic [138], but has shown demonstrable
activity in rabbits against M. bovis [212] and is currently being evaluated in non-human primates.
Metronidazole also lacked activity in guinea pigs, but the conclusions were limited due to the
increased inflammation in the lung and toxicity of the drug [167]. While there are currently no
clinical data confirming the activity of MET in TB patients, the additional evaluation in other
animal models might indicate which conditions are required in order to observe MET activity in
vivo.
In the drug studies described here, the bacillary burden in the lungs of both mouse models
was high at the start of treatment [6.85 Log10 in Kramnik and 7.45 Log10 in Balb/c mice], which
increases the likelihood of drug resistance following single drug treatment. To measure the
appearance of INH, RIF, and LZD resistance, plating of tissue homogenates was performed on
7H11 agar plates as well as on agar plates containing the respective drugs. Although the bacterial
load at the start of treatment in Balb/c mice was approximately four times higher than in the
Kramnik model, only few single resistant mutants in a minority of Balb/c mice were observed for
62

INH and RIF after 6 and 8 weeks. This is in great contrast with the drug resistance observed in
the Kramnik mouse model, where we observed a substantial increase in the number of bacilli that
were drug resistant after 7 weeks of treatment with INH (up to 4.47 Log10 resistant CFU) or RIF
(up to 5.72 Log10 resistant CFU). The exact reason for the higher number of drug resistant
bacteria following treatment in the Kramnik mouse model is not clear, but it is crucial to
understand the mechanism as this could have significant clinical implications.
We speculate that the high prevalence of resistant mutants might be due to multiple
causes; such as having sub-therapeutic drug exposure levels, a weakened immune response, or an
altered bacterial mutation rate in the Kramnik mice. First, due to the highly organized and
encapsulated nature of the granulomas observed in the Kramnik mice, it is possible that bacteria
within the granulomas received subtherapeutic exposure levels of drug due to poor drug
penetration. This could facilitate survival and selection of low level drug resistant mutants in
Kramnik mice, which would not be observed in the primarily inflammatory lesions of Balb/c
mice. For moxifloxacin, a recent elegant study measured an increased drug distribution in
cellular regions of granulomas and uptake by macrophages, but a decreased penetration into the
cores of necrotic rabbit lesions [205]. The same was predicted for the standard clinical drugs via
a recent mathematical modeling study and confirmed through plasma and tissue pharmacokinetic
studies by the same group [239]. A second explanation for the increased frequency of drug
resistance in Kramnik mice might be that the precursor mutation frequency in both mouse
models is in fact the same, but the immune pressure in the Balb/c mice selectively kills drug
resistant mutants which are less fit for in vivo survival than their drug susceptible counterparts
due to its fully activated immune response. Although the C3HeB/FeJ mice do not have any
broadly systemic immune deficiencies, an altered or weakened immune response as the result of
63

inactivation of the Ipr1 gene may selectively decrease immune-mediated pressure on drug
resistant mutants. Recent studies in athymic nude mice support this finding revealing a
remarkable propensity to select drug-resistant mutants. Daily treatment with human-equivalent
doses of RIF-INH-PZA for 2 months followed by RIF-INH selected INH-resistant mutants in the
majority of mice, and was only prevented by the addition of EMB [240]. In support of this
hypothesis, clinical studies of individuals co-infected with HIV and TB, and treated with INH
and rifapentine [241] or rifabutin and INH [242] were significantly more likely to develop
rifamycin monoresistance, especially in patients with the lowest CD4 T cell counts. Rifamycin
resistance is rarely observed in immunocompetent individuals, even under conditions of poor
treatment compliance which facilitates the emergence of drug resistance, implicating a positive
role for host immunity in suppression of acquired drug resistance. If the weakened immune
response of the Kramnik mouse model is the cause of the increased resistant bacterial numbers,
the Kramnik mouse model would have the additional benefit of assessing resistance frequencies
of single drugs and drug regimens before advancing to clinical trials. Besides efficacy and
sterilizing potential of drug regimens, the assessment of the potential for bacterial resistance is
the most important criteria for a new regimen. A third explanation, and perhaps the most
intriguing one, is the occurrence of a heightened bacterial mutation frequency within the hypoxic
regions of necrotic granulomas found in the Kramnik mouse model. Recently, a study using
latently infected non-human primates described that hypoxic conditions can suppress the
expression of DNA repair enzymes, thereby resulting in higher mutation frequencies [243]. A
recent study done by McKinney, et al., that may further complicate determining the cause of INH
resistance showed that KatG pulses in the presence of INH [33]. This pulsating bursting of KatG
expressions creates divergent populations of bacilli that can and cannot be killed by INH
64

independent of replication. Further studies examining the specific mutations of the drug-resistant
colonies and the mutation frequencies at different times following treatment are necessary to
answer these questions, and are currently underway. Spontaneously resistant mutants will be
isolated and sequenced, and compared to published mutations observed in vitro and in clinical
isolates. This will allow us to assess the frequency of each mutation and to determine whether a
loss of fitness is observed for some of the selected mutants in vivo. For instance certain frequent
katG mutants isolated from clinical specimens can only be collected in vitro but are not observed
in the classical mouse model or in the guinea pig [157].
Mice have many advantages as an animal model for preclinical screening of desperately
needed anti-TB drugs, and the Kramnik mouse model in particular, has unique pathologic
features that have similarities to human TB. Based on the morphologic features and the host-
pathogen relationship, the Kramnik mouse model has a critical advantage over the more
commonly used mouse strains to evaluate novel preclinical therapies against persisting bacteria.
Another advantage of using the Kramnik mouse compared to other larger species is that parallel
drug killing kinetics can be achieved using an acute (Balb/c; actively replicating bacteria) and
chronic (C3HeB/FeJ; slowly replicating bacteria) mouse model which will generate useful
information regarding the in vivo pharmacodynamics of a drug in both models. This information
may well prove essential for screening novel drugs against persistent, slowly replicating bacilli,
and can be used to further define the role poor drug penetration has in failed drug responses. To
our knowledge this is the only small animal model that can provide this at this point. Moreover,
the Kramnik model minimizes the need to reevaluate PK kinetics and perform cross-species
bridging experiments [157, 167, 210].
65

In these studies we showed that the Kramnik mouse responded to aerosol infection with
the formation of hypoxic, encapsulated lung lesions with liquefactive necrosis, which contained
numerous extracellular bacilli that were less susceptible to drug therapy as compared to Balb/c
mice. In contrast, Balb/c mice developed less extensive foci of mixed inflammatory cells that
harbored primarily intracellular bacilli and had minimal individual cellular necrosis. Using these
two models we examined the effect lesion morphology had on the response to treatment with a
panel of clinically relevant TB drugs that differed in their mode of action. Enumeration of the
pulmonary bacterial load showed that most single drugs tested were highly effective in the
Balb/c mouse model with primarily intracellular bacilli, whereas Kramnik mice had mostly
extracellular bacilli that were refractory to treatment. Overall, the results from the experiments
presented here demonstrate that the Kramnik mouse model has great promise to evaluate novel
preclinical drugs in a more stringent animal model possessing liquefactive necrotic granulomas
containing persistent bacteria.
2.5 – FUNDING
This work was supported by the Bill and Melinda Gates Foundation under Drug
Accelerator grant ID number 42589, “Assay Standardization.” and the National Institutes of
Health (NIH) Contract NO1 AI-95385 at Colorado State University, Fort Collins
66

CHAPTER 3 – COMPREHENSIVE ANALYSIS OF THE PROGRESSION OF DISEASE
IN THE NECROTIC GRANULOMA MICROENVIRONMENT OF C3HEB/FEJ MICE
INFECTED WITH MYCOBACTERIUM TUBERCULOSIS
3.1 - INTRODUCTION
Mycobacterium tuberculosis (MTB) is the causative agent of the highly insidious disease
tuberculosis that infected 8.4 million new people and killed 1.4 million in 2011 alone [2].
According to the World Health Organization, progress has been made in both the treatment and
control of tuberculosis (TB); however, the overall burden remains a substantial obstacle to
eradication [2]. Current therapy consists of a multi-drug cocktail administered up to 9 months for
susceptible TB. While the current treatment regimen is effective against drug susceptible
tuberculosis when followed completely, it is cumbersome for patients and often results in
noncompliance [244]. Many of the TB drugs were discovered more than 50 years ago, just
recently great strides have been made in drug discovery with a new TB drug being approved for
use in MDR-TB patients, Bedaquiline (BDQ) by Johnson and Johnson [9, 10]. According to the
last report of the Working Group for New TB Drugs (June 2013), there are currently 21 drugs in
the pipeline ranging from animal model preclinical testing to Phase III clinical trials. The
renewed effort to develop effective and safe drugs for the expedient treatment of TB has also
required a thorough evaluation of current animals models used in preclinical development to
evaluate and prioritize these compounds as single agents as well as drug combinations.
TB is a uniquely difficult disease to model in animals due to the heterogeneity in lesion
types and disease manifestation in TB patients. For human pulmonary TB, a true hallmark of
active disease is the encapsulated caseous necrotic granuloma and cavity formation [203]. While
67

NHP may most closely replicate tuberculosis disease (the active as well as the latent disease
state), they are prohibitively expensive and are not conducive to large-scale early pre-clinical
drug trials [50, 213, 245]. Mice have the distinct advantage of being easy to handle and house,
and are economical, allowing researchers to investigate novel compounds as well as multiple
drug regimens on a larger scale. However, the most widely used mouse models do not develop
the advanced pathology seen in TB patients, and does not form the characteristic encapsulated
necrotic granulomas after MTB infection. The standard mouse model forms non-necrotic
inflammatory granulomas that contain predominantly intracellular bacteria [134, 160]. Other
animal models, such as the guinea pig, develop the necrotic primary granulomas and their lesions
trend toward sclerotic healing [246], containing low numbers of bacilli per lesion [167]. Though
guinea pigs can develop the desired pathological features they are often intolerant to treatment
with broad-spectrum antibiotics [162, 167, 245]. We, and others, described earlier a mouse
model that shows remarkable similar lung pathology to that observed in humans when in infected
with MTB [131, 181, 192, 200, 247, 248], the so-called Kramnik mouse model. This mouse
model, using the C3HeB/FeJ mouse strain, develops liquefactive necrotic encapsulated lesions
upon a TB infection [131, 181, 192, 200, 247, 248]. This model gives researchers a rare
opportunity to study TB in a heterogeneity of lesions as related to human disease etiology in a
small animal model.
The Kramnik mouse is characterized by a de novo mutation in the sst-1, super
susceptibility to tuberculosis-1 region [193]. In animals that lack a functional sst-1 a large subset
of macrophages are non-functional allowing for rapid progression of early infection [195]. There
is a significant early inflammatory response with a high numbers of neutrophils infiltrating.
Bacteria are shown to reside within the macrophages and neutrophils in mid- to late infection. It
68

is this large influx of inflammatory cells, which precedes the onset of the necrotic response
[131]. Innate immunity appears not to be affected, however, T-cell recruitment is greatly
impaired and a strong pro-inflammatory response is being promoted [179]. The Kramnik mouse
model when infected with a very low aerosol dose (50-75 CFU/mouse) will develop consistent
necrotic lesions 6-8 weeks post aerosol infection [131]. We showed in this earlier publication
that the Kramnik mouse model has high numbers of both intracellular as well as extracellular
bacilli. The heterogeneity in lesion types observed in the Kramnik mouse model which contain
both intracellular and extracellular bacilli per lesion, is again similar to what is seen in human
lesions [14]. This model provides an economical alternative of other animal models with necrotic
lesions (such as guinea pigs, rabbits, rats and NHP, [50, 155, 162, 175]), most of which have far
fewer bacteria numbers per lesion or per gram of tissue [212].
In order to locate and study the bacterial population in the various lesion types, we
employed a novel acid-fast staining method that utilizes the same principles as the clinically used
auramine-rhodamine fluorescent dye but is significantly more sensitive [249]. Using the
fluorochrome Sybr ® Gold (Ryan et al., submitted) in a phenol based diluent; we can reliably
stain the majority of mycobacterial phenotypes as compared to other current acid fast staining
methods (Ryan et al., submitted). Using the Sybr Gold staining method on in vitro samples, we
were able to detect 99% of the bacilli in actively replicating, hypoxic and sputum cultures versus
auramine-rhodamine (54-74%) and carbol-fuschin (66-85%) staining methods (Ryan et al.,
submitted). This report is the first in showing the results of this novel Sybr Gold acid-fast
staining approach on in vivo processed samples by using the dye in Kramnik mouse and human
tissues.
69

The progression of the pathology in the Kramnik mouse model is indicative of changes in
the host immune response and the pathogen-host interaction. Most studies evaluating the
immune response after a MTB infection were performed in mouse models while evaluating the
cytokine profiles systemically in sera or on a whole lung homogenate [72, 77, 250]. More recent
studies in non-human primates showed a distinct cytokine microenvironment in individual
lesions by using immunohistochemistry and ELISA [24]. They found cellular populations that
surround the granuloma that produce specific markers that are reminiscent of germinal centers in
lung tissue such as B-lymphocyte markers CD20 and CXCR5. The discrete lesions in the
Kramnik mouse model will allow for isolation of specific lesions thereby studying the immune
environment and the precise location of immune cells and cytokine production.
Our goal is to give a detailed evaluation of the pathological response of the Kramnik
mouse model when infected with MTB. By sampling animals throughout infection, we are able
to obtain a comprehensive assessment of the pathological features over time and compare it to
known human pathological data. By using the highly sensitive novel acid-fast approach we were
able to locate the bacteria throughout infection. By combining the data from the histopathology
analysis and from the immunology studies it showed that the early inflammatory response might
determine the progression of disease. The Kramnik mouse model seems to show several parallels
to human disease in terms of pathology and importance of early, inflammatory neutrophilic
response compared to the immunocompetent mouse strains and therefore a reasonable
representation of TB disease.
70

3.2 – MATERIALS AND METHODS
3.2.1 Animals
See Methods in Chapter 2
3.2.2 Bacteria
See Methods in Chapter 2
3.2.3 Aerosol Infection
See Methods in Chapter 2
3.2.4 Enumeration of bacterial load of lungs and spleen
See Methods in Chapter 2
3.2.5 Pathology and microscopy analysis of tissue samples
Infection matched whole lung and spleen samples were collected at necropsy and fixed in
4% paraformaldehyde in phosphate buffered saline (PBS). Tissue sections were embedded in
paraffin and sectioned to 5μm thickness. Subsequent tissue sections were mounted on glass
slides, deparaffinized and stained either with: Hematoxylin and eosin (H & E), auramin-
rhodamine fluorescent stain, Masson’s Trichrome collagen stain, or the Sybr Gold fluorescent
stain (Ryan et al., submitted) as described below. Sections stained with fluorescence dyes were
visualized using a Nikon Intensilight mercury vapor lamp and scanned using a Nikon TE-I
motorized microscope controlled by Nikon NIS Elements software (Nikon, Melville, NY) with
FITC, TRITC and DAPI filters. Light microscopy sections were visualized using an Olympus
71

BX41 with Olympus DP70 camera controlled by Olympus DP Software (Olympus, Melville,
NY) [131, 136].
3.2.6 Human lung samples
Human lung samples were acquired from Dr. Edward Chan from National Jewish
Hospital (Denver, CO). Six anonymized patients with MDR-TB had re-sected lung tissue fixed
and embedded in paraffin blocks.
3.2.7 Staining procedures
At each terminal sacrifice, the whole mouse lung lobes were infused with 4%
paraformaldehyde (EMS, Hatfield, PA) and preserved for 48 hours in paraformaldehyde, then
washed and kept in 70% ethanol until processed for histopathological assessment. The novel
acid-fast staining method using the Sybr Gold fluorescent dye was used as previously described
by our laboratory. Briefly, the dye is diluted 1:1000 in a stain solution of phenol (8 g), glycerin
(60 mL), isopropanol (14 mL), and distilled water (26 mL). The slides were heated on a block at
65oC for 5 minutes and then cooled at room temperature for an additional 5 minutes. The tissue
sections were washed with acid alcohol (0.5% HCL, 70% isopropanol, 29.5% water) for three
minutes, then washed with water and counterstained with Hematoxyin QS for 5-10 seconds. The
excess hematoxyin was washed away with ddH2O and slides were subsequently stained with
DAPI (200 ng/mL final concentration) ~10 minutes and washed again with water. Slides were
mounted with Prolong Gold antifade mounting media.
Collagen was stained in the mouse tissue sections using the Masson’s Trichome Kit
(American MasterTech, California) using the manufacturer’s procedure. Briefly, tissue sections
72

were dewaxed in xylene and rehydrated through a grades alcohol series. The sections were
briefly rinsed in water and heated at 56oC for 1 hour with Bouin’s Fluid. Slides were washed
then stained with Weigert’s Hematoxylin. Rinse slides, stain in Biebrich Scarlet-Acid Fuchsin
for 15 minutes, after which they were rinsed. Slides were stained with phosphomolybdic /
phosphotungstic acid for 5 minutes and placed directly into Aniline Blue stain for 10 minutes,
then rinsed. Slides were then placed in 1% acetic acid for 3 minutes followed and dehydrated by
a graded alcohol series and xylene. Slides were hard mounted with Surgipath MM24 Mounting
Media (Leica Biosystems, Richmond VA).
3.2.8 Cytometric Bead Array Analysis
For this experiment, five infected C3HeB/FeJ mice (10 weeks after low dose aerosol
infection) and 5 naïve C3HeB/FeJ mice were used and organs were aseptically collected. Tissue
from whole lung, isolated granulomas, infected lung tissue without gross lesions (non-
granulomatous), spleen, lymph nodes, and serum from each animal were collected. Tissues were
disrupted using the Bullet Blender from Next Advance (Avervill Park, NY). Cytokine profiles
were measured by using the mouse inflammation CBA kit from BD Biosciences (Franklin Lakes,
NJ), which analyzed IL-6, IL-10, IL-12, TNF-α, IFN-γ, and MCP-1. A FACSCanto II and FloJo
software were used for analysis. The cytokine levels of samples were calculated by extrapolating
the mean fluorescence intensity (MFI) by using the standard curves for every cytokine
respectively.
73

3.2.9 Immunohistochemistry
Paraffin embedded blocks from each group of mice were cut in sections of 5-7 µm using
a microtome and placed onto slides. Thereafter, the paraffin was removed from the tissue
sections using EZ-DeWax solution (Biogenex Lab, San Ramon, CA) and were rehydrated by
passing the sections through graded ethanol solutions and finally transferred into a bath
containing PBS. Following this step, sections were washed and after blocking the tissue
endogenous peroxidase with Peroxidased 1 (Biocare, CA) during 5 min at room temperature.
Thereafter the sections were treated with antigen retrieval using the citrate buffer (Dako, CO)
and pressure cooker standard procedure. The unspecific binding of antibodies was blocked by
incubating the sections for 5 mintues at room temperature in background eraser (Biocare, CA)
and then each section was incubated overnight at room temperature with a primary antibody
raised against murine F4/80, lysozyme, and IL-10 antigens. After washing the slides three times
for 5 min in PBS at RT, the slides were incubated again with the appropriate secondary antibody
for 60 min at RT. Thereafter the specific antibody binding reaction was amplified using one of
the Tyramide Signal Amplification (TSA) system using a kit purchased from PerkinElmer Life
and Analytical Sciences Inc, (Boston, MA). This step was done with an adaptation of the
manufacturer’s instructions, briefly, when the TSA system was performed, after incubation with
the secondary antibody, the sections were incubated with strept-aviding conjugate to horseradish
peroxidase (SA-HRP) at a dilution 1/100 for 30 min at RT followed by a 2 min incubation at RT
with the biotinylated TSA reagent. After the amplification step, the slides were washed and
incubated again for 5 min with the chromogen substrate for HRP either 3,3’-diaminobenzidine
(Impact DAB; VectorLab, MI) or aminoethycarbazole (Impact AEC; VectorLab, MI). Finally the
slides were counter stained by immersing the sections for 1 min in Mayer’s Hematoxylin
74

(DakoCytomation, Carpenteria, CA) and mounted for microscopic observation using coverslip
and Histomount mounting media (Zymed, San Francisco, CA). As a negative control the
procedure described above was also carried out omitting the primary antibody step. Sections
were examined using an Olympus X70 microscope.
3.2.10 Statistical analysis
See Methods in Chapter 2
3.3 - RESULTS
3.3.1 Survival of mice after M. tuberculosis Erdman infection
When infected with MTB, the C3HeB/FeJ mouse strain showed a wide range of
outcomes in terms of disease progression. Between 25-42 days post aerosol infection, 25-40% of
the infected animals progress with rapid disease, and will succumb to disease (Figure 3.1).
Figure 3.1. Survival curve of mortality of untreated C3HeB/FeJ mice infected with Mycobacterium tuberculosis. 183 mice of 280 survived initial 50 days of infection resulting in a 35% mortality rate.
Survival of Infected C3HeB/FeJ Mice
0 25 50 75 100 125 150 175 2000
102030405060708090
100110
Days Elapsed
Perc
ent s
urvi
val
75

These animals were humanely euthanized per IACUC requirements based on more than
20% weight loss. The remaining mice after 42 days post aerosol infection show a very different
outcome in that they either have no external signs of infection or their weight and other
indicators stabilize. This distinct mouse population that succumbs to disease was studied for
pathology and shows very few to none defined necrotic, fibrotic lesions but in contrast shows
mainly a vast neutrophilic infiltration and extensive collapse of the lung parenchyma. Due to the
early mortality of the mice with predominantly the uncontrolled neutrophillic lesions, the
remaining mice were more likely to show the necrotic, fibrotic lesions.
3.3.2 Kramnik Mouse Model Lesion Pathology
3.3.2.1 Temporal development of lesion pathology
The C3HeB/FeJ mouse strain when aerosol infected with a low inoculum of MTB (of
approx. 50 bacteria per mouse) develops cellular lesions early on which are consisting of mixed
mononuclear cells. After one-month post aerosol, a clear distinction in lesion types is already
visible mainly based on the proportion of three distinct cell types of neutrophils, macrophages
and lymphocytes seen in the histological examination of lung tissue. The early cellular
composition appears to determine the progression to the various lesion types throughout further
disease. Three lesion types can be distinguished: I) the classical granuloma with discriminative
necrotic core and fibrotic collagen rim, II) the uncontrolled, highly inflammatory lesion with
neutrophilic dominance, and III) the cellular lesion with mixed mononuclear cell composition
(lymphocytes/macrophages).
76

3.3.2.2 Granuloma formation
The lung bacterial load at 4 weeks post-aerosol infection rapidly increases to 6.47 ± 0.34
log10CFU. The early lesion development shows alveolar thickening and inflammation of septal
walls (Figure 3.2E), however the extent of lung lesion involvement is limited and most of the
lung is still uninvolved lung parenchyma (Figure 3.2B). At this early stage in infection beginning
stages of lesions are visible with karyorrhectic nuclei and foamy macrophages (Figure 3.2D).
The various characteristics of the three lesion types are becoming apparent. The early type I
lesion show an organized assembly of epitheloid and foamy macrophages with neutrophils
infiltration and pockets throughout the affected parenchyma. The early type II lesion
development is less organized and a massive number of neutrophils are attracted (Figure 3.2A).
The early type III lesion develops as a result of the accumulation of lymphocytes, epithelioid and
foamy macrophage as well as neutrophil accumulation. This is very similar as what has been
described for other immunocompetent mouse strains such Balb/c and C57BL/6 mice [134].
At 6 weeks post infection at 7.53 ± 0.21 log10, overall the lung histopathology is
becoming more severe and the various lesion types are heterogeneous within the different lung
lobes of one animal as well as between groups of animals. Figure 3.3A represents the distinct
heterogeneity encountered in one animal throughout the lung lobes at 6 weeks post infection.
Two of the five lobes have the encapsulated necrotic type I lesion while the other three lobes
have type II and III lesions showing inflammatory lesions. The lung involvement is still limited
at this time point with several regions of normal lung parenchyma (Figure 3.3B). The
heterogeneity in lesion types within one animal is a common occurrence in early infection.
During this time span there is also a greater variance in the severity of the lesions. There are the
more severe encapsulated necrotic type I lesions with the beginnings of a highly eosinophilic
77

core and a well-developed collagen rim as seen in (Figures 3.3D and E), whereas other type I
lesions have yet to progress to the more liquefactive state of necrosis. From Figure 3.3C the
mixed composition of foamy macrophages and neutrophils that are necrotizing is apparent but is
still retaining some shape.
Figure 3.2. Early lung lesion heterogeneity at 4 weeks post aerosol infection (PAI). (A) 5 lung lobes of one representative mouse (0.4x). (B) Normal lung parenchyma (4x). (C) Early clustering of necrotic debris and lesion foci (Arrow) (20x). (D) Predominantly cellular lesion, majority foamy macrophages (white arrow head) with lymphocytes and pockets of necrotic cells (black arrow head) (20x). (E) Cellular lesion with predominantly necrotic cells (black arrow head) and some lymphocytes (20x). Stain: hematoxylin and eosin.
Also the type II lesion becomes apparent at this time in infection, showing necrotizing
alveolitis (Figure 3.3E). The alveolar septal walls remain mostly intact, while the alveolar spaces
are filled with high numbers of dying neutrophils, intact cells, bacteria and debris, creating a
78

honeycomb-like necrosis, which is only seen at very late stage in immunocompetent mouse
models [134]. These lesions seem to develop in conjunction with the encapsulated necrotic
lesions (in Figure 3.3A, indicated by a black arrow). In a proportion of the mice, the type II
lesions can involve the entirety of the lung lobe leaving limited normal lung parenchyma in that
lung lobe. This is likely resulting in a proportion of the mice starting to lose body weight and
succumb to disease between day 35 - 45 post aerosol (peak at 42 days).
At eight weeks post-aerosol infection the bacterial load was stabilized at 7.96 ± 0.42
log10CFU (as shown in Figure 3.6 and Figures 3.4A and 3.7), and more than 67% of the lung
lobes have necrotic, or type III lesions. The histopathology shows a similar distribution in lesion
types as described for the earlier time point, with progression of the severity of the lesion types.
Especially for type II lesions, the necrotizing alveolitis can expand significantly at this stage of
disease. The encapsulated necrotic granulomatous lesions are large and multi-lobulated that may
suggest the coalescing of multiple necrotic lesions. At this later time point the necrotic lesions
type I are composed of an eosinophilic core with a large area of necrotic cell debris with mainly
extracellular bacilli. It should be noted that even with the large regions of lung destruction there
remains whole sections of lung, even whole lobes, unaffected by disease (Figure 3.4B). These
uninvolved lung lobes contribute to the large heterogeneity and variation that is seen when
measuring levels of necrosis and bacterial burden (shown in Figures 3.6 and 3.7).
79

Figure 3.3. All lesion types represented at 6 weeks PAI with host response. (A) 5 lung lobes of one representative mouse (0.4x). (B) Normal lung parenchyma (4x). (C) Type III lesion, cellular lesion with high numbers foamy macrophages, lymphocytes (small arrow head) and small numbers of neutrophils (20x). (D) The edge of Type I lesion, collagen capsule with foamy macrophage rim, necrotic neutrophil region and central eosinophilic core (20x). (E) Type II lesion, necrotic material filling the alveolar spaces (large arrow in A) (20x). (F) Large region of diffuse collagen fibrils stained with Masson’s Trichrome (20x). (G) Collagen surrounding a type I lesion stained with Masson’s Trichrome (20x). Stain: hematoxylin and eosin.
From ten to twelve weeks post aerosol infection the bacterial load in the lungs is
maintained around 8.09 ± 0.09 log10CFU, and the mice show developed lesions with liquefactive
necrosis (Figure 3.5A). These lesions, the majority type I lesions, consist of an accumulation of
80

amphophilic cellular debris admixed with numerous extracellular bacilli. At the periphery of the
necrotic core on the inside of the collagen rim is a cuff with foamy macrophages of variable size,
which contain very large numbers of intracellular bacilli. In Figure 3.5B a distinct line of
functional macrophages delineated by the collagen border of the necrotic granuloma is observed.
The numbers of intracellular bacteria in especially foamy cells can become numerous, as seen in
serial sections of H&E (Figure 3.5C) and acid-fast stained tissue (Figure 3.10B).
Figure 3.4. 8 weeks PAI, majority of lesions are necrotic. (A) 5 lung lobes of one representative mouse (0.4x). (B) Normal lung parenchyma (4x). (C) Type I lesion with large collagen capsule and necrotic karyorrhectic neutrophils (20x). (D) Large type I lesion coalesce with collagen insets (black arrow) (20x). Stain: hematoxylin and eosin.
81
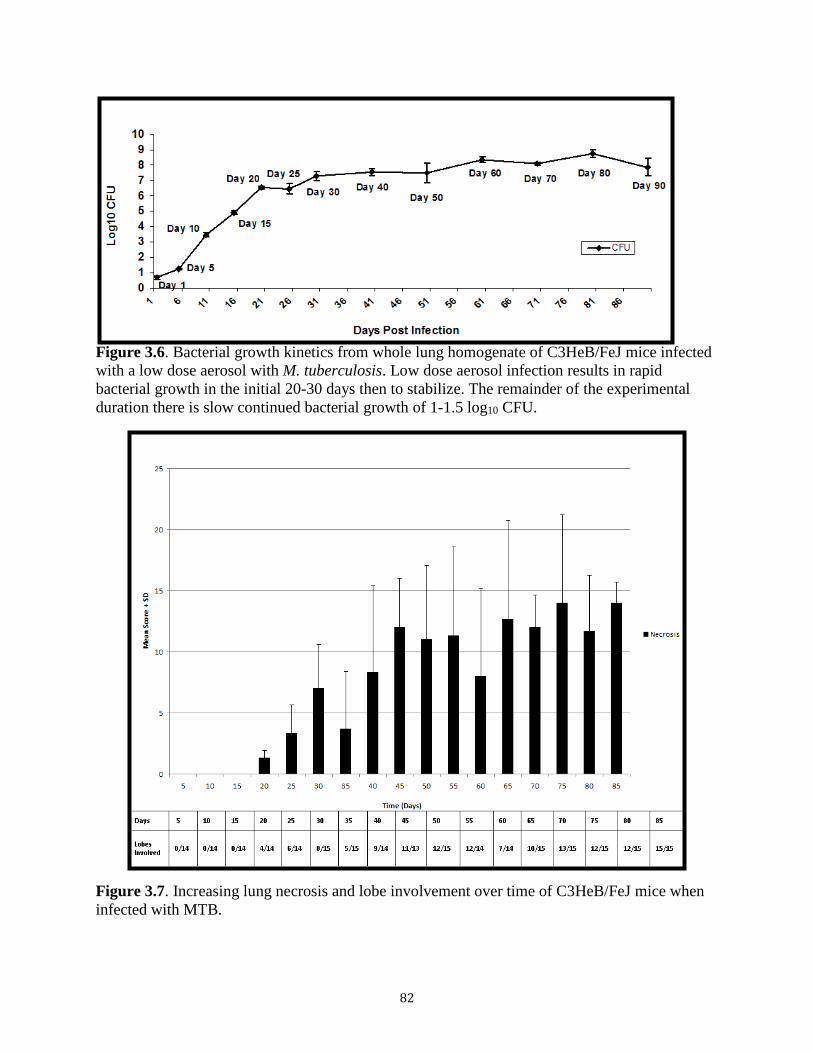
Figure 3.6. Bacterial growth kinetics from whole lung homogenate of C3HeB/FeJ mice infected with a low dose aerosol with M. tuberculosis. Low dose aerosol infection results in rapid bacterial growth in the initial 20-30 days then to stabilize. The remainder of the experimental duration there is slow continued bacterial growth of 1-1.5 log10 CFU.
Figure 3.7. Increasing lung necrosis and lobe involvement over time of C3HeB/FeJ mice when infected with MTB.
82

3.3.2.3 Granuloma fibrosis
Early in disease at the edges of the cellular lesion, early deposition of collagen is already
visible based on Masson’s trichome staining. There is a thickening surrounding the areas of
disease in Figure 3.2C. As lesions develop the fibrosis takes different forms, at 6 weeks post
aerosol infections the collagen can surround the type I lesion (Figure 3.3G) and also be
intermixed in the lung parenchyma (Figure 3.3F). In Figure 3.4D is the presence of a well-
defined collagen inset acting as a division of two lesions that have coalesced as disease as
progressed. By 10 weeks post aerosol infection, the further encapsulation of lesions is observed
as a fibrous matrix as seen with trichrome collagen staining which indicative of lesion healing
(Figure 3.5D).
Figure 3.5. 10 week PAI, type I and II lesions represented with continued presence of normal lung tissue. (A) 5 lung lobes of one representative mouse (0.4x). (B) Normal lung parenchyma (4x). (C) Type I lesion (20x). (D) Large section of collagen fibrils stained with Masson’s Trichrome (10x). (E) Type II lesion with airway obstructed with necrotic debris (black arrow) (20x). Stain: hematoxylin and eosin.
83

3.3.3 Bacterial Location in Lung Lesions of the Kramnik mouse model over time
3.3.3.1 Comparison side by side of the acid-fast staining of bacteria by the fluorescent auramine-
rhodamine method and detection of bacilli in tissues via a novel fluorescent acid staining method
using Sybr Gold
As we have shown before MTB bacteria can survive intra- as well as extracellular
environment within the lung in mice and guinea pigs [131, 134]. We have already described that
the AR staining method gradually stained fewer bacteria over the course of the disease in the
Kramnik mouse model [131]. In this study we further demonstrate that that acid fast with Sybr
Gold staining results in enhanced detection of the MTB bacteria when compared to AR staining.
For this purpose early and late lesions were stained using the AR staining method. The bacteria
were visualized easily in the early lesions however; it becomes more difficult to stain all bacteria
with the AR method as infection progresses (Figure 3.9A) [131]. Serial sections of the same
lesion were also used for staining with the novel Sybr Gold staining method
Figure 3.8 shows lung sections with the location of bacteria visualized via the green
fluorescent Sybr Gold staining method, a newly developed acid-fast staining protocol (Ryan et
al., submitted). Early in infection (from 4-8 weeks), the bacilli were found mostly intracellular in
macrophages or neutrophils surrounding airways and vessels (Figure 3.8A and B). The bacteria
are clustered in lesions consisting of immune cells, which were visualized by DAPI nuclei
staining.
84

Figure 3.8. Sybr Gold stain revel the bacterial location in Type II and Type III lesions at late stage of infection with the Erdman strain M. tuberculosis (10-12 weeks post aerosol infection). (A) Bacterial clustering intracellular in lung tissue near bronchioles at 10 weeks post aerosol infection, Type III lesion (20x). (B) Diffuse intracellular bacteria at 12 weeks post aerosol infection, Type III lesion (20x). (C) High concentration of extracellular stained bacteria in necrotic debris, Type II lesion (10x). (D) Large mass of stained extracellular bacteria, necrotic debris and cellular remanants in a bronchiole (40x). Stain: Sybr Gold and Dapi.
As the type I lesion develops liquefactive necrosis the bacteria in the center of the lesion
transition to an extracellular environment as the host cells become necrotic. In these late stages
of disease in the Kramnik mouse model (10-12 weeks post aerosol infection), very high numbers
of extracellular bacteria are being detected within the necrotic granuloma using the Sybr Gold
staining protocol. In addition, a sizeable concentration of bacteria is also present intracellularly
in the foamy macrophages that surround the karyorrhectic nuclei (Figure 3.9B). The remaining
bacteria are present in the center of the necrotic lesion (Figure 3.9D). At this time we can only
estimate and speculate that most bacteria in lesion type I are extracellular in late stages of
infection due to the high bacterial burden concentrated in the lesions. For the type II lesion which
is characterized by necrotizing alveolitis, high burdens of extracellular bacteria are detectable
85

using the Sybr Gold staining method in the necrotic debris within the intact alveolar spaces
(Figure 3.8C). Even in airways the necrotizing alveolitis is visible, and extensive necrotic debris
is seen comprising of high numbers of extracellular bacteria blocking the airways (Figure 3.8D).
Figure 3.9. Differences in bacterial detection by acid-fast staining techniques. Images A and C have been stained with auramine-rhodamine. Serial sections B and D have been stained with Sybr Gold. (A) Type I lesion stained with auramine-rhodamine with reduced staining in the center of the lesion (10x). (B) Serial section of A, Type I lesion stained with Sybr Gold (10x). (C) Central region of necrotic lesion, type I lesion, stained with auramine-rhodamine (40x). (D) Serial section of C, central region of necrotic lesion, type I lesion, stained with Sybr Gold (40x).
3.3.3.2 Human lesion bacterial populations
Lung sections were derived from re-sected human lung tissue of MDR-TB patients that
were on treatment for a significant amount of time were used to determine the presence of MTB
86

bacteria using the Sybr Gold method of staining large excised necrotic granulomas obtained from
human lungs stained by the Sybr Gold approach, demonstrated a high bacterial number.
Using the Sybr Gold staining technique described above on the lung tissue, we were able
to visualize the large numbers of bacteria in human TB cavitary lesions. Fig 3.10 shows the
morphology of the human TB lesion with a center necrotic region, the excised lesion is large and
diffuse. The surrounding tissue is composed of an intermix of collagen and other infiltrates.
Throughout the lesion we can see the presence of foamy macrophages. When stained with Sybr
Gold the only region that detects bacilli is the necrotic core of the dissected lesion, with
primarily extracellular bacteria.
Figure 3.10. Excised human necrotic lesion from patients with MDR-TB. Images A and B bacterial location detected with sybr gold staining and Images C and D tissue architecture stained by H&E. (A and B) Necrotic lesion with extracellular bacteria stained with sybr gold and dapi, 10x and 40x, respectively. (C and D) Necrotic human lung tissue with remnant of lung parenchyma stained with hematoxylin and eosin (10x).
87

3.3.4 Immunohistochemistry localization of macrophage activity
In late stage disease, as described above, the type I lesions have distinct populations of
cells types that surround the necrotic lesion. To determine the phenotypic characteristics of the of
specific cell types within a tissue section we used F4/80, IL-10 and lysozyme
immunohistochemistry (IHC). Lysozyme is a constitutive enzyme of macrophage with effective
antimicrobial activity including activity against MTB [251]. Using IHC we demonstrated that
interstitial macrophages within the parenchyma and macrophages within the type II and III
lesions (Figure 3.11) have strong staining for lysozyme, an antimicrobial enzyme. However, it is
important to notice that that the foamy macrophages, which contain large numbers of bacilli, are
negative for lysozyme production. Similar IHC staining for F4/80 marker, indicative of
functional macrophages, demonstrated that some macrophages but not all within type I and type
II lesions were positive for the F4/80 marker. Furthermore it was interesting to find that a cuff of
macrophages surrounding the foamy cell layer in the type I lesions have strong staining for the
F4/80 marker. Interestingly the foamy cells in any of the three types of lesions were negative for
the F4/80 marker. (Figure 3.11), Previous report from our lab [72, 77] demonstrated that foamy
cells are positive for IL-10 cytokine. Thus, we performed IHC for IL-10 cytokine. IL-10 is
strongly expressed by the foamy macrophages within the type I and II and III lesions. Altogether,
the IHC staining demonstrated that the IL-10 is in the interior rim of the necrotic encapsulated
lesion (Figure 3.11) while functional macrophages, positive for lysozyme and F4/80 are
segregated on the outer rim of the lesion. This staining pattern creates a distinct
microenvironment of the type I lesion not seen in lesion types II or III.
88

Figure 3.11. Cytokine expression is shown to microenvironment specific based on immunohistochemistry staining. A, B and C positive staining for lysozyme (red): A: interstitial Mo in parenchyma strongly positive for lysozyme B: type II lesion showing very few MO positive for lysozyme and foamy cells negative for lysozyme C: type I lesion with foamy cell rim and MO (compare to F4/80 positive MO in F and G) negative for lysozyme D and E: positive staining for IL-10 (red) in type I lesion and in foamy cells in rim of Type lesion (E) F and G: F4/80 staining in macrophages over the foamy cell rim in a type I granuloma.
3.3.5 Cytokine and Chemokine Analysis: Significantly distinct cytokine production in isolated
granulomas
In order to better understand the development of the unique pathologic features in the
Kramnik mouse model, we performed a preliminary immune assay to identify key immune
events. Through the use of a cytometric bead analysis (CBA) we were able to measure the levels
89

of inflammatory cytokines produced by diseased animals. The cytokines measured by this assay
were IL-6, IL-10, IL-12, IFN-γ, TNF-α, and MCP-1.
The results from the CBA assay showed an upregulation of the inflammatory profile of
cytokines locally at the granuloma itself when compared to non-granulomatous tissue. There
were increased protein levels of MCP-1, TNF-α, IL-6, and IL-10 in the granuloma versus the
whole lung tissue, and a decreased level IFN-γ in the isolated granuloma (p < 0.05). IL-12 levels
were not significantly different in all studied tissue samples (data not shown). The opposing
cytokine expression profiles of IL-10 and IFN-γ were most striking. IL-10 protein levels were
significantly greater within the granuloma and IFN-γ levels were significantly greater outside the
granuloma, as compared to whole lung cytokine levels (p < 0.0005 and p < 0.05, respectively).
When we examined the cytokine levels in the excised granulomas the increased cytokine levels
of MCP-1, IL-6, IL-10 and TNF-α were highly concentrated in the granulomatous lesions as
shown in Figure 3.12.
In the CBA assay, Figure 3.12, the expression of MCP-1 from the isolated granulomas
was found highly significant (p < 0.0001) when compared to both the naïve lung and non-
granulomatous tissue. MCP-1 levels from granuloma show more than a 40-fold increase from the
naïve lung tissue. Comparing the MCP-1 level of the isolated granulomas to the whole lung with
lesions there is an increase of cytokine production of 1.5-fold, which is not a significant finding
(p > 0.2). Further analysis showed the cytokine produced by the non-involved lung tissue is
nearly a third less compared to the isolated granulomas (p < 0.0001).
90

Figure 3.12. Cytokine expression is specific to microenvironment. IL-6 is highly significantly expressed in the granuloma compared to naïve lung (p<0.0001), whole lung (p<0.001), and non-involved lung (p<0.05). TNF-α, inflammatory cytokine, has increased expression in the whole lung and granuloma, both significantly higher than naïve (p<0.01) and non-involved lung (p<0.05). TNF-α low level expression in the lymph node not significant to naïve lymph node. IL-10 expression is higher but not significant in granuloma than whole lung. Both whole lung and granuloma are significant higher than naïve lung (p<0.001) and non-involved lung (p<0.001). IL-10 is highly significant (p<0.0001) expressed in the lymph node compared to naïve lymph node. IFN-g expression is higher in the whole lung but not significant than expression in the granuloma. Whole lung IFN-g expression is significantly higher (p<0.001) than naïve lung. IFN-g lymph node expression is significant (p<0.001) compared to naïve lymph node. MCP-1 expression is highly significant in the granuloma compared to whole lung (p<0.0001), naïve lung (p<0.0001), and non-involved lung (p<0.0001). All cytokine expression in the spleen was not significant to naïve spleen.
91

Other inflammatory cytokines, such as IL-6 and TNF-α, gave a similar trend in cytokine
profile to that of MCP-1. The excised granuloma has 3-fold the level of IL-6 and TNF-α when
compared to infected non-involved lung tissue. These are highly significant differences of
cytokine production that are localized to specific regions of infected tissue (p < 0.001 and
0.0005, respectively). The results show that the local microenvironment of the granuloma has an
increased production of inflammatory cytokines as well as down regulation of IFN-γ production,
when compared to the whole lung.
3.4 – DISCUSSION
The main goals of this study were to perform an in-depth examination of the progression
of pathology in the Kramnik mouse model for its potential future use in TB drug development,
with a special focus on the location of bacteria within the lung lesions. In addition, this study
aimed to compare the characteristic pathology features in the mouse model to published human
data to assess to what extent it reflects features of human disease.
The lung pathology in the Kramnik mouse model shows prominent heterogeneity in lung
lesion types across the lung lobes in a single mouse, as well as between mice infected for the
same amount of time. This heterogeneity in lesion types is also seen in TB patients as described
in a comprehensive color atlas of pulmonary TB [252]. This is, for the ultimate use of this model
in TB drug development, both an advantage in that an optimal treatment regimen should be
effective under all conditions, as well as a disadvantage as the heterogeneity of lesions results in
larger standard deviations between mice from treatment groups and therefore require a higher
number of animals per group. For current drug trials in our laboratory using the Kramnik mouse
model, treatment is started at 8 weeks post aerosol infection to ensure the development of more
92

mature, encapsulated necrotic lesions within the majority of the mice in at least one of the lung
lobes. We identified three lesion types in the Kramnik mouse model that can best be described
as; type I, the classical granuloma with a necrotic core, type II, the uncontrolled rapid bacterial
growth with large neutrophilic accumulation, and type III, the cellular lesion with a mixed
mononuclear cell composition.
The genetic mutation in the sst-1 loci [195] of chromosome 1 in the C3HeB/FeJ mice,
infected macrophages have been described to die by necrosis rather than apoptosis, which result
in the typical encapsulated lesions that are characteristic for this strain [131, 192-195, 197]. Our
experimental conditions using 50-75 CFU of MTB Erdman per mouse, produce advanced type I
lesions by 8-10 weeks after aerosol infection. Type II lesions have a high bacterial burden,
similar to type I lesions, without organization of the extracellular matrix. The animals that have a
predominantly type II lesions tend to succumb to disease early, 28-45 days after infection, and
result in approximately 35% of the mortality seen in experimental animals prior to the initiation
of the adaptive immunity (Figure 3.1). Other uniquely susceptible mouse strains have shown
similar survival curves when infected with MTB, such as the CBA/J and IL-10-/- knockout mice
[71, 178, 250]. For type III lesion, a cellular lesion composed of mononuclear cell types
(macrophages/lymphocytes). This lesion is disorganized and has a mix of lymphocytes,
macrophages (epitheloid and foamy), and a small number of neutrophils. The early signals in the
innate immune response likely trigger these various responses, but the mechanism is unclear.
The rate of lesion progression can be accelerated by increasing the infectious dose or by using a
more virulent MTB challenge strain, similar to what is seen in the guinea pig [165]. Also early
experimentation done by Igor Kramnik [194] showed that these mice were able to develop the
liquefactive necrotic lesions in the lungs within 4 weeks when infected intravenously with a
93

higher dose. Other laboratories using the H37Rv MTB strain show less mortality over the course
of infection, slower progression of disease but more heterogeneity due to a higher variance of the
three lesion types across mice. To establish the experimental conditions is important when
determining the type of disease progression sought and the use of the model.
The early immune events seem to determine what lesion type will develop, unlike our
earlier belief that one lesion type will likely advance to another. In addition, the recruitment of
high numbers of neutrophils towards the site of infection in this mouse model is the dominant
cell type and likely the cause of the massive necrosis that is so characteristic to the mouse strain.
For a type I lesion, the early lesion consists of a mixed macrophage and neutrophilic composition
in an organized manner, and even at the early stage epitheloid cells are observed with some
minor collagen deposition. In later stages of the progression type I lesion a thickening and an
ongoing remodeling of the collagen rim occurs and neo-vascularization within the fibrous rim is
observed. Based on earlier work we are able to surmise from picrosirius red staining techniques,
which visualize collagen that the host is constantly adapting to infection [131]. This stepwise
progression in pathology of disease is in many aspects similar to what is seen in cancer field for
solid tumors where the development of hypoxia, necrosis, and collagen depositions are common
features [253]. Therefore, certain treatments options directed towards hypoxia, neo-angiogenesis,
and remodeling of the collagen rim like vascular endothelial growth factor (VEGF), anti-TGF-β,
and Losartan Potassium from the field of oncology should be investigated as augmentation to
treatments or treatments themselves due to the similarities to TB [253-255].
The type I lesion can evolve and form a cavity after expelling its liquefied content [131].
The cavity formation in the Kramnik mouse model is characterized by loss of normal lung
parenchyma, which is replaced by neutrophilic infiltrates and the necrotic material from center of
94

granuloma lesion have eroded into an airway [14, 204]. The cavitary lesion is then an opening in
the center of the lesion that allows for transmission of the bacilli to another person or
experimental animal [159]. This is currently an infrequent event under the current experimental
conditions (0.5-1%). Cavitary disease is known to be an important cause for treatment failure in
TB patients by increase of relapse of infection in cavitary cases, showing higher incidences of
resistance, and it’s important in transmission of the disease [256]. Knowledge regarding the
progression of disease in the Kramnik mouse model is assisting us with our attempts to increase
cavitation, currently experiments are underway to change the course of disease by influencing
the cytokine environment as well as drug treating the animals to increase the healing process of
the necrotic lesions and allow for relapse of infection.
Two prominent cell types are observed in the lesions characterizing the Kramnik mouse
model: foamy macrophage and the significant neutrophilic response. Both cell types appear to be
ineffective in bacterial killing and permissive to bacterial growth thereby carrying a substantial
number of bacteria. Other groups have shown macrophages and neutrophils infected with MTB
are prevented from undergoing apoptosis and allow for intracellular growth of the bacterium,
possibly providing a source of nutrition [257-260]. Human TB granulomas have been described
as having central caseous necrosis surrounded by a large cuff of epithelioid histiocytes mixed
with lymphocytes [252]. Peripheral to this cuff, which shows similarity to what is observed in
the Kramnik mouse model, is the fibrous collagen encapsulation and vascular remodeling. This
collagen matrix encompasses a network of neo-vascularization. This lesion while technically a
granuloma is more appropriately described as pyogranulomatous due to co-localization of
macrophages and neutrophils. Also similar to the Kramnik model in the alveolar spaces
surrounding the necrotic granuloma there are numerous alveolar macrophages. In the Kramnik
95

mouse model these macrophages stain positive for the marker F4/80. While the microscopic
structural features are comparable between the human and Kramnik mouse model, there are
differences in the relative proportion of cell types. Most notable is the distinct lack of
lymphocytic recruitment in the Kramnik mouse model, which are prominent in chronic human
TB lesions.
Human disease, like the Kramnik mouse model, has been shown to produce similar
heterogeneity of lesions. It is known that human lesions contain a lymphocytic infiltration early
in infection as well as macrophages [14]. Early lesions are similar to what is seen in the Kramnik
mouse model; septal wall swelling and desquamation, vasodilatation of capillaries and early
influx of inflammatory cells [203, 252]. As infection progresses several types of lesions have
been described in the literature. Georges Canetti in 1944 performed some of the most complete
assessment of the wide range of lesion types from cadavers of patients who died from primary
TB and other diseases. TB patients tend to develop what is described as a fibrino-macrophagic
alveolitis [203], which has similar characteristics to the necrotizing alveolitis seen in the
Kramnik mouse model. The septal walls of infected lung remain mostly intact with addition of
fibrin in bundles; there are large numbers of macrophages and the occasionally neutrophils.
Necrotizing alveolitis in the Kramnik model is more neutrophil dominated and has fewer
macrophages but the high bacterial load is similar to what was seen by Dr. Canetti [203]. In more
recent publications, more extensive reports on the larger exudative aggregates are described to be
composed of lymphoid cells and these have been defined as TB pneumonia due to the
obstruction of the alveolar spaces [252, 256, 261-263].
A disease feature thoroughly described by Dr. Canetti and only recently re-evaluated in
current literature is the prominence of neutrophil involvement in human disease [203, 264]. In
96

the Kramnik mouse model the neutrophilic response dominates, in human disease neutrophils do
play a role in those lesion types depicted as polymorphonuclear alveolitis. A lesion where the
alveoli are filled with neutrophils and the occasional macrophage, have the highest bacterial
numbers relative to other lesion types. This is also evident in the Kramnik model where
especially the type II lesion consists of high numbers of neutrophils and enormous bacterial
burden. Other groups have been showing the importance of neutrophils in bacillary transport
especially in the transmission stage of disease in humans [265].
In recent years the focus on bacillary location in disease has gained more interest
especially in light of the applications in drug delivery and questions concerning drug penetration
across granulomas [205]. Other animal models, which develop necrotic lesions, such as the
rabbit, the guinea pig or the NHP model, all of which have low bacterial numbers per lesion or
per gram of tissue. For the NHP, extensive work was performed to correlate specific
microenvironments of necrotic, non-necrotic, and suppurative lesions with the bacillary burden
and cytokines levels present in those lesions [24]. Unfortunately, in the macaque model the
overall low numbers of bacilli present make it very difficult to reach conclusions about the
environments in which the bacteria are thriving. One of the major advantages of the Kramnik
mouse model is the highly organized suppurative lesions containing high bacteria burdens. In an
earlier paper, we showed the results of classical acid fast staining methods [131, 134]. We stated
that the fluorescent AR showed reduced staining of bacilli within the core of the lesion, although
with the Ziehl Neelsen staining method it was clear that the caseum was also packed with
bacteria [131]. In this paper, we report for the first time the staining results using a novel acid-
fast staining method based on Sybr Gold on in vivo sections. Sybr Gold is a fluorescent nucleic
acid stain, which visualizes a significantly greater number of bacilli in vitro that are acid-fast
97

negative with current clinically used acid fast stains (Driver et al., submitted). The new staining
method is highly sensitive, has far less background as it only becomes fluorescent when binding
to nucleic acids. The stain is then solely retained by the bacteria due to the acid wash at the end
of the staining protocol. In vitro cultures, Sybr Gold detects 99% of bacteria in both actively
replicating aerobic and NRP hypoxic cultures (Ryan et al., submitted). Transmitted light
microscopy with Ziehl-Neelsen fuchsin stain and fluorescence microscopy with auramine O and
AR stains detected only 54% to 86% of cultured MTB. Because of Sybr Gold’s ability to
distinguish more phenotypes of bacilli we now have found it to be a superior stain to auramine-
rhodamine both in vivo and in vitro. In type III lesions and early in infection the bacteria are
easily distinguished as intracellular in Figure 3.8A and B; they are surrounded by cells with large
nuclei, lymphocytes and macrophages. As in the other lesion types the bacteria survive
predominantly within the foamy macrophages. The uncontrolled inflammation and necrotic
debris in the alveolar spaces in the type II lesion have a high burden of acid-fast bacteria (Figure
3.8C and D). The necrotic neutrophils and macrophages with high numbers of extracellular
bacteria also fill the airway creating obstruction. The type I lesions, like type II lesions, have a
high bacterial burden that are detected by the Sybr Gold stain. The necrotic core of the
encapsulated lesion contain extracellular bacilli while the predominantly foamy macrophage rim
contain large numbers of intracellular bacilli. The foamy macrophages that surround the lesion
are not only permissive to bacilli survival but seems to allow for growth and replication. The
MTB modulate macrophage lipid-sensing receptors to create a foamy environment to allow the
bacteria to thrive [266]. Compared to the auramine-rhodamine stain in Figure 3.9A and C the
staining ability of the Sybr Gold to comprehensively stain the acid-fast bacteria in the necrotic
core is depicted in Figure 3.9B and D. The change in auramine-rhodamine acid-fast bacteria is
98

indicative of a conformational change in the central most bacteria. This may be due to the
hypoxic environment [131, 247] and/or the environmental and oxidative stress [243].
Human cytokine production has shown intriguing results with IFN-γ, IL-10 and TNF-α
all being predictive of disease and disease outcome [78, 267, 268]. Several studies [268, 269]
point to IFN-γ as being a reliable marker for active disease that will become reduced after
treatment. In standard mouse models whole lung homogenate is used on non-necrotic granuloma
forming models to gain single cell suspensions for either flow cytometry or ELISA [78, 267]
resulting in data that may not be representative of natural disease states. A great benefit of the
Kramnik mouse model is the ability to use a small animal model that develops these
encapsulated necrotic granulomas which can be dissected from the rest of the uninvolved lung.
We were able to obtain serum, tissue sections of whole lung with lesions, individual lesions, and
infected lung tissue without grossly visible lesions from individual animals at 10 weeks post
aerosol infection. This isolation technique allowed us to analyze the distinct environments of
either the lung as a whole, the local environment of the granuloma as well as the systemic
cytokine profiles. The use of the whole lung has resulted in the assertion that the control of
bacterial growth begins earlier in more resistant a mouse strain, such as the C57Bl/6. This data
may contribute the lack of growth control seen in the Kramnik mouse model. The C57Bl/6 mice
had significantly high levels of TNF-α and IL-12 when after being exposed to infection for a
short period of time, within the first week. At this time it is difficult to speculate the cytokine
profile of the Kramnik mice at early infection. To date, we have only explored the cytokine
expression late in infection.
In the NHP model, Joanne Flynn and colleagues have examined B cell function and other
T cells [24]. They, too, isolated granulomatous tissue to examine and correlate
99

microenvironments with cytokine, T cell and B cell flow cytometry data. They found distinct
cellular populations that surround the granuloma that produce specific markers that are
reminiscent of germinal centers in lung tissue such as B-lymphocyte markers CD20 and CXCR5
[270]. By fluorescent IHC staining the B cell markers are positioned around the lymphocytic cuff
corresponds to our CBA data of the distinct microenvironment determined by the excising of
discreet necrotic granulomas. This data also corresponds with the IHC data in Figure 3.11, which
demonstrate the functionality of specific cell types within lesions.
IL-10 is highly expressed by foamy macrophages, as seen in Figure 3.11, by using the
CBA assay we are able to confirm significant IL-10 expression from the granuloma. The foamy
macrophages are located on the inner cuff of the granuloma, while the whole lung and non-
involved lung have significantly lower levels of IL-10 expression. IFN-γ is a protective Th1
cytokine which is known to inhibit the expression of IL-10 [78, 271, 272]. IL-10 was expressed
at significantly higher levels in samples derived from granuloma than in samples derived from
whole lung and non-involved lung. Conversely, the levels of IFN-γ expression in samples
derived from granuloma were lower than in samples derived from whole lung and non-involved
lung. Furthermore the levels of IFN-γ measured in the granuloma samples were statistically no
different from those derived from naïve animals. However, the levels of expression of IFN-γ
found in the non-granulomatous lung and whole lung have 5x and 10x more cytokine than naïve
mice, respectively. With the use of a CBA assay we are able to measure actual cytokine protein
expression levels from tissue homogenate and plasma samples that are then correlated to IHC.
While modulated foamy macrophages are located on the inner cuff of the granuloma, functional
or activated macrophages are designated to the outer rim of the granuloma. Stains F4/80 and
lysozyme in Figure 3.11 distinguished this activity. F4/80 is useful marker of macrophage
100

“interaction with tissue microenvironment in situ, e.g. in granuloma formation” as described by
S. Gordon [273]. The clear functional line of F4/80 and lysozyme positive and negative cells is
very distinct; this change in functional macrophages may be the interface of cytokine interaction,
drug interaction and nutrient exchange of type I lesions that make them difficult to treat. This
distinctive line of foamy and ‘functional’ macrophages prompts speculation the foamy
macrophages are a barrier created by the bacilli to prevent destructive inflammatory cytokine
action.
The Kramnik mouse model continues to be a useful model to study the pathological
features of MTB infection. Through the use of this mouse model we have been able to determine
three distinct lesion types present in late stage infection. With the use of advanced and novel
acid-fast techniques we are able to characterize well-defined bacterial populations for these
lesions. The discreet microenvironments defined by cytokine analysis give us insight into the
immunological events that help form the pathological features in late disease. These finding
suggest that modulating those cytokines may augment the disease to be more amenable to
treatment and therefore shortening the duration.
3.5 – FUNDING
This work was supported by The Bill and Melinda Gates Foundation grant ID number 1033596
“Evaluation of a New Murine Model Testing Tuberculosis Chemotherapy” at Colorado State
University.
101

CHAPTER 4 – THE USE OF LIPOSOMAL NANOPARTICLES AS A NOVEL DRUG
DEVILERY VEHICLE IN C3HEB/FEJ MICE INFECTED WITH MYCOBACTERIUM
TUBERCULOSIS
4.1 – INTRODUCTION
Mycobacterium tuberculosis (MTB) has infected 8.6 and killed 1.3 million people in
2012 [2]. Current treatment protocols for susceptible tuberculosis (TB) disease require 2 months
of intensive daily isoniazid (H), rifampicin (R), pyrazinamide (Z), and ethambutol (E) followed
by a continuation phase of 4 months of daily isoniazid and rifampicin (Table 4.1) [3].
Table 4.1. Recommended Treatment Regimens for New Cases of Tuberculosis Patient Category Diagnostic Category Treatment regimensa Initial phase Continuation phase I New smear-positive patients, Preferred Preferred new smear-negative patients 2 HRZEb 4 HR with extensive parenchymal 4 (HR)3 involvement, concomitant HIV- related diseases or severe forms Optional Optional of extrapulmonary TB 2 HRZE 6 HE Optional Optional 2 (HRZE)3 4 (HR)3 a Numbers preceding regimens indicate the length of treatment in months. Subscript numbers following regimens indicate the frequency of administration per week. When no subscript numbers are given, the regimen is daily b Streptomycin may be used instead of ethambutol and it should replace ethambutol in tuberculosis meningitis
* Adapted from Implementing the stop TB strategy: A handbook for national tuberculosis control programmes, Geneva, World Health Organization, 2008 (WHO/HTM/TB/ 2008.401) [3]
102

Susceptible TB can be effectively cured if these medications are taken in full and
correctly; unfortunately, treatment can have severe side effects and patient compliance is
difficult to maintain for the necessary 6-9 months.
Recent progress has been made in developing new treatments to shorten the duration and
reduce resistance; there are currently 21 drugs in the “pipeline” from the animal model
preclinical testing phase to Phase III clinical trials (Working group for New TB Drugs 2013).
Among these new TB drugs, one drug has been recently approved by the FDA for clinical use
against MDR-TB, which is Bedaquiline (BDQ), by Johnson and Johnson [9, 10, 274, 275].
Despite these recent achievements, the majority of the drugs used today were discovered over 50
years ago. Due to the increase in drug resistant TB, it has become imperative to also explore
novel approaches to improve the current treatment regimens.
The extensive length of treatment is thought to be caused by a proportion of bacilli that
are refractory to treatment due their surroundings in the lung [14]. Bacteria are located within
heterogeneous lesion types, and the advanced necrotic, fibrous lesions create a hostile
environment for the bacteria that can reduce their susceptibility to drugs and can affect drug
penetration throughout the lesion [205]. The salient characteristic of active TB in patients is the
development of necrotic lesions that can progress to cavitation in the lung. The necrotic lesion
consists of a central caseous necrosis region which is surrounded by a large cuff of epithelioid
histiocytes mixed with lymphocytes [252]. Peripheral to the cellular cuff is the fibrous collagen
matrix and within the collagen deposition signs of vascular remodeling can be observed. Other
lesion types exist in human disease such as post primary tuberculosis lipid pneumonia, which is
presented by an accumulation of foamy macrophages in alveoli typically found in the upper lung
lobes [262], and polymorphonuclear alveolitis where the alveoli are filled with neutrophils with
103

the occasional macrophage [203]. Animal models that recapitulate the necrotic granuloma
pathology tend to be large, cost-prohibitive, or difficult to work with, such as non-human
primates, rabbits, minipigs, goats, and guinea pigs [17, 50, 154, 155, 162]. In order to model
multiple lesion types seen in TB patients in an animal model, which is small and easily
manipulated, a novel mouse model using the C3HeB/FeJ mouse strain, has been shown to
present caseous necrotic lesions when aerogenically or intravenously infected with MTB [181,
193]. The mouse strain is characterized by a de novo mutation in the sst-1, which is the super
susceptibility to tuberculosis-1 region [192]. In mice that lack a functional sst-1 allele, a large
subset of macrophages are non-functional which allows for a rapid progression of early infection.
This results in a high inflammatory response and influx of neutrophils in the lungs of infected
animals [131, 197].
C3HeB/FeJ mice infected with MTB will develop three distinctive lesion types after
about 6-8 weeks of aerosol infection. The three lesions types can be histologically distinguished
as follows. Type I lesion is observed as the classical necrotic granuloma with a defined
eosinophilic core, fibrotic collagen rim, and neo-angiogenesis. Lesion type II is observed as the
highly inflammatory, uncontrolled lesion with neutrophilic dominance. Types I and II lesions
have been shown to have distinct regions of hypoxia, the core of the necrotic granuloma is
possibly nearly anoxic [131, 247]. And type III lesions are observed as cellular lesions with a
mixed composition of mononuclear cells (lymphocytes / macrophages) (Driver, chapter 3
manuscript in preparation). We described earlier that C3HeB/FeJ mice when infected with a low
aerosol dose (50-75 CFU/mouse) will develop consistently necrotic lesions 6-10 weeks post
infection [131] (Driver et al. submitted, Irwin et al. submitted). These mice have a refractory
104

response to single drug treatment and a higher frequency of resistant bacteria in the lung and
spleen [131].
Certain pathological features as seen in the lesion type I in lungs after TB infection are
remarkably similar to what is seen in solid tumors, such as carcinomas, melanomas, and
neuroblastomas [276]. These neoplastic tumors are hypoxic, centrally necrotic, develop a
complex capillary network, and show an inflammatory mononuclear response [253, 277]. The
tumor stroma is a supportive structural capsule around the tumor made of an extracellular matrix,
consisting of cancer-associated fibroblasts (CAF), tumor-associated macrophages (TAMs),
tumor-associated neutrophils (TANs), fibronectin, and collagen [278, 279]. The stroma is a
contributing factor to drug resistance by creating a physical barrier to treatment [280, 281]. Solid
tumors have attributes that create a specific environment such as non-functioning lymphatics and
neo-angiogenesis which is characterized by the tumor blood vessels being tortuous and highly
irregular [282, 283]. The tumor blood vessels are composed of defective endothelial cells with
wide fenestrations, they have irregular vascular alignment, lack a smooth muscle layer and
innervations [284-288]. This leaky vasculature leads to a phenomenon known as enhanced
permeability and retention (EPR). These abnormal blood vessels proliferate predominately at the
tumor periphery and this phenomenon leaves many central areas of the tumor avascular [284].
This lack in vascularity leads to un-perfused regions, which creates microenvironments that are
devoid of oxygen, are low in pH, and gives rise to necrosis [289, 290] which ultimately leads to
decreased drug efficacy and tumor progression.
To compensate for the physical barriers in solid tumors, over 20 nanomedicines have
been approved for use in oncology by the FDA [291]. Nanomedicines have the advantage of
extended drug-exposures, controlled drug-release kinetics, and improved patient compliance due
105

to less frequent dosing schedule [292-294]. Also many chemotherapeutics have adverse side
effects that are diminished with more direct delivery approaches of the nanoparticles to tumors
[289]. The liposomal formulations increase the therapeutic index of many antineoplastic drugs,
such as the pegylated liposomal doxorubicin and liposomal daunorubicin [291, 295]. Liposomal
formulations have had moderate success in the treatment of ovarian cancer and Kaposi’s sarcoma
[296, 297]. A recent study has shown improved tumor penetration of doxorubicin in a dextran-
aldehyde nanocarrier formulation [293].
In order to target a liposome to a certain organ, tissue or cell type, the amphiphile bilayer
of the liposomal nanoparticle allows for conjugation of different types of targeting ligands.
Antibodies and antibody fragments, small molecules such as folate, sugars, and even nucleic
acids can be conjugated to nanoparticles (Figure 4.1) [298, 299].
Figure 4.1. Example of a targeted drug containing nanoliposome [300].
106

Folic acid antagonists have been used as an important co-factor in cancer treatments even
prior to the era of nanoparticles [301]. The folate binding protein, a glycosylphosphatidyl-
inositol-anchored cell surface receptor for the vitamin folic acid, is overexpressed in many
human cell types, such as macrophages during inflammation [302, 303]. This overexpression of
folate binding protein can be exploited as a homing target for folic acid bound liposomes. This
creates an effective targeting mechanism to direct liposomes to the site of inflammation.
The morphology of solid tumors and type I necrotic granulomas observed in C3HeB/FeJ
mice show striking similarities, which may result in similar challenges in terms of drug delivery
to the caseum of the necrotic tumor/lesion. Necrotic lesions of TB infected Kramnik mice have
similar characteristics of hypoxia, central necrosis, a decreased drug responsiveness, lack in
vacularization as solid tumors that are devoid from blood flow due to interstitial fluid pressure
(IFP). Like solid tumors, TB granulomas contain non-functional, foamy macrophages
surrounding the central core of the necrotic granuloma. The cellular layer of foamy macrophages
is delineated with a collagen rim, which contain functional macrophages through the collagen
depositions as well on the exterior. It is also within the collagen rim that signs of neo-
vasularization are apparent. These morphological similarities of collagen deposition, macrophage
accumulation, and neo-angiogenesis of a cancerous tumor, which is also seen in a TB granuloma,
piqued the interest of Merrimack Pharmaceuticals, a pharmaceutical company based in
Cambridge, MA, in evaluating the potential application of liposomal nanoparticle drug delivery
in order to treat TB. As with cancerous tumors, they hypothesized that the liposomes would
accumulate mainly within macrophages (activated/foamy) and would directly deliver drug to the
site of the granuloma. Scientists at Merrimack have previously shown benefit from targeted and
107

non-targeted delivery of liposomal formulations of chemotherapeutics including doxorubicin and
irinotecan against solid tumors [304-307].
By using a folate-targeted liposomal nanoparticle drug delivery approach to TB our long-
term goal is to achieve a highly, sustained drug release at the site of infection, thereby shortening
extensively the treatment duration, and potentially reducing side effects of drug treatment. In this
preliminary study, we evaluated the pharmacokinetics profiles of empty liposomes over time in
plasma and different tissues of infected and uninfected Balb/c and Kramnik mice. In addition, we
aimed to evaluate our hypothesis to show that the liposomal nanoparticles will predominantly
target the macrophages of the necrotic granuloma in the lungs of TB infected Kramnik mice. To
our knowledge this is the first experiment to evaluate liposomal nanoparticles as a drug delivery
system for the treatment of TB.
4.2 – METHODS AND MATERIALS
4.2.1 Animals
See Methods in Chapter 2
4.2.2 Bacteria
See Methods in Chapter 2
4.2.3 Liposomal formulations
Proprietary information from Merrimack Pharmaceutical Inc. Cambridge MA
108

4.2.4 Aerosol infection and drug treatment schedule
For a preliminary tissue distribution study, C3HeB/FeJ mice were exposed to a low-dose
aerosol infection with MTB. The mice were placed in a Middlebrook Aerosol Generation Device
(Glas-Col Inc., Terra Haute, IN) [217]. Compressed air is pumped into the chamber through a
venturi nebulizer, in which we placed 5 ml of suspension of bacteria at a concentration of 106/ml.
After 30 minutes the nebulizer will be emptied and the mice will have inhaled to 50-100 bacilli
into their lungs, which resulted in an average of 70, 133, and 84 (day 28, 60, and 90,
respectively) bacteria at day 1 for three separate infections. In a subsequent, more extensive
pharmacokinetic study with both C3HeB/FeJ and Balb/c, mice were exposed to a low-dose
aerosol infection with MTB, which resulted in 43 average bacteria at day 1.
The goal was to study the liposomal distribution at various stages of lesion developed; an
early time point when only cellular lesions were present, an intermediate time point when
necrosis had developed and a late time point with severe and highly necrotic, fibrotic lesions.
Thereto, in the initial study C3HeB/FeJ mice were separated into three infection groups (28, 60
and 90 days post-aerosol infection) resulting in three stages of infection at sacrifice. Ten days
prior to sacrifice mice receiving the targeted liposomes are transitioned to a sterile folic acid free
diet (Dyets, Bethlehem, PA). Mice were injected (IV) with either untargeted or folate-targeted
liposomes Cy-5 (fluorescently far red) 24 or 48-hour prior to sacrifice by CO2 inhalation.
A more thorough pharmacokinetic experiment was performed on C3HeB/FeJ and Balb/c
mice after 10 weeks of infection. Both mouse strains are IV injected with a combination of non-
targeted Cy-3 and targeted Cy-5 (fluorescent orange and far red, respectively), non-targeted Cy-5
and targeted Cy-3, and a control dual non-targeted Cy-5 and Cy-3 (data not shown). The dual
injection allows for tracking of the targeted liposomes. Mice were sacrificed by CO2 inhalation
109

after 6, 24, 48, 96 and 168 hours post injection. Mice with targeted liposomes were on a folic
acid free diet (Dyets, Bethlehem, PA) 10 days prior to injection with liposomes.
4.2.5 Enumeration of bacterial load of the lungs
See Methods in Chapter 2
4.2.6 Pathology and microscopy
At every sacrifice point, the animal is centrally perfused first with phosphate buffered
saline (PBS) with 0.04% EDTA, followed by perfusion with 4% paraformaldehyde in PBS
placing an 18 gauge needle in the right atrium. Whole lung, excised granuloma, spleen, left liver
lobe, left kidney, and heart are collected from all animals. After 48 hours of fixation, tissues were
sent to Merrimack Pharmaceuticals for further processing, immunostaining, and imaging of
liposomes.
Tissue sections were embedded in paraffin and cut to 5 μm thickness on a microtome.
Subsequent tissue sections were mounted on glass slides, deparaffinized and stained either with
Hematoxylin and eosin (H & E) and Sybr gold fluorescent stain. Fluorescent sections were
visualized using a Nikon Intensilight mercury vapor lamp and scanned using a Nikon TE-I
motorized microscope controlled by Nikon NIS Elements software (Nikon, Melville, NY) with
FITC, TRITC and DAPI filters. Light microscopy sections were visualized using an Olympus
BX41 with Olympus DP70 camera controlled by Olympus DP Software (Olympus, Melville,
NY) at Colorado State University.
Slides immunohistological stained with anti-CD31 and Cy-5 were visualized at
Merrimack Pharmaceuticals (Cambridge, MA).
110

4.2.7 Staining procedures
Lung tissue sections were stained at Merrimack by Violette Paragas to visualize the
liposomes, endothelial cells, and nuclei. The slides were rehydrated in phosphate buffered saline
(PBS) for five minutes followed by incubation with rat anti-mouse CD31-Cy3 (1:100) in
DaVinci antibody diluent for 4 hours at room temperature. After wash with PBS, a secondary
incubation with goat anti-rat Alexa 555 (1:500) in DaVinci antibody diluent for 30 minutes at
room temperature. Excess stain was rinsed with PBS, and then stained with Hoechst for 5
minutes at room temperature. Wash excess stain with PBS and mount with ProLong Gold
mounting media (Invitrogen, Grand Island, NY).
The novel acid-fast staining method using the Sybr Gold (Invitrogen, Grand Island, NY)
fluorescent dye was used as previously described by our laboratory. Briefly, the dye is diluted
1:1000 in a stain solution of phenol (8 g), glycerin (60 mL), isopropanol (14 mL), and distilled
water (26 mL). The slides were heated on a block at 650C for 5 minutes and then cooled at room
temperature for an additional 5 minutes. The tissue sections were washed with acid alcohol
(0.5% HCL, 70% isopropanol, 29.5% water) for three minutes, then washed with water and
counterstained with Hematoxyin QS for 5-10 seconds. The excess hematoxyin was washed away
with ddH2O and slides were subsequently stained with DAPI (200 ng/mL final concentration)
~10 minutes and washed again with water. Slides were mounted with Prolong Gold antifade
mounting media.
All drug measurements of fluorescently tagged liposomes in plasma and organs of
infected mice was performed at Merrimack by Dmitri Kirpotin.
111

4.3 – RESULTS
4.3.1 Preliminary results on liposomal distribution in mouse tissues
4.3.1.1 Bacterial burden
To determine the distribution of liposomes post intravenous injection, we used
macrophage folated-targeted and non-targeted liposomes in infected C3HeB/FeJ mice. To study
liposomal distribution at different stages of lesion pathology, mice were sacrificed at either 28,
60 and 90 days after three separate aerosol infections. The mice, at these three distinct stages of
infection, were injected with the liposomes and allowed to rest for either 24 or 48 hours to allow
maximum distribution. At the time of sacrifice the mice had reached a bacterial load ranging
from 6.5 - 8.8 log10 CFU in the lungs (Table 4.2).
Table 4.2. Bacterial burden in M. tuberculosis infected C3HeB/FeJ mice at sacrifice
Infection Group Log10 CFU Day 28 8.89 Day 60 6.40 Day 90 6.64
4.3.1.2 Advanced lung pathology of tuberculosis infection over time in C3HeB/FeJ mice
The goal was to study the liposomal distribution at various stages of lesion developed.
Liposomes were injected either at 24 or 48 hours prior to sacrifice in order to find the timepoint
giving the most optimal liposomal distribution in the lesion. The tissue from the 48-hour post
injection time point yielded the most distinctive signal for both the day 60 and 90 days post-
aerosol infection.
At the early time point (28 days post aerosol), mice show only one single lesion type
which are the small, early inflammatory lesions as expected [131, 308].
112

At the later time points (60 and 90 days after aerosol infection), we can distinguish three
different lesion types in the lungs of the C3HeB/FeJ mice. The distinct lesion types can be
distinguished by the proportions of specific cell types in the early lesions, such as neutrophilic
infiltrates, macrophages, and lymphocytes. We have classified the lesions in the C3HeB/FeJ
mice into three morphologically distinct types, as follows: I) the classical granuloma with
discrete necrotic core and fibrotic collagen rim, II) the highly uncontrolled inflammatory lesion
with neutrophilic dominance, and III) the cellular lesion with mixed mononuclear cell
composition (lymphocytes/macrophages).
For this particular study, we focused primarily on the type I necrotic lesions at later
timepoints post aerosol infection. From the day 60 time point on, the type I lesions are well
developed, with prominent large, necrotic granulomas with a complex collagen rim (Figure 4.2A,
B, and C). The type I lesions have a large central necrotic region, which is surrounded by a rim
of karyorrhectic neutrophils and an outer ring a foamy macrophages. The lesion is encased with
fibrils of collagen and sporadic blood vessels. The collagen fibrotic rim is lined on the inside by
the foamy macrophages, and dispersed throughout the rim as well as outside functional
macrophages are located. The foamy macrophages within the necrotic granuloma are heavily
burdened with acid-fast bacteria.
At 90 days post infection, the mice had predominantly type I lesions and there were also
a small number of type II lesions in the lung parenchyma. Type II lesions consists of high
neutrophilic accumulation and high macrophage burden, do not show the collagen rim or the
foamy macrophage layer (Figure 4.2D).
113

Figure 4.2. Late stage necrotic lesions from C3HeB/FeJ mice infected with Mycobacterium tuberculosis. (A) Type I necrotic granuloma with well-developed collagen rim and necrotic core 4x. (B) Coalesced necrotic granuloma, type I, less organized but retains collagen rim and foamy macrophages ring 4x. (C) Early necrotic granuloma, core consists entirely of necrotic cellular debris with large extracellular matrix 4x. (D) Highly destructive type II necrotic alveolitis 4x. Hematoxylin and Eosin.
4.3.1.3 Bacterial location in the necrotic granulomas
Late stage lung tissue was stained with fluorescent Sybr Gold stain to detect acid-fast
bacteria in the necrotic granulomas. In figure 3 is the clear observation of bacteria in the cellular
layer of foamy macrophages (Figure 4.3A) and throughout the necrotic core (Figure 4.3B) of the
necrotic type I granuloma. The type II lesion had a high bacterial burden throughout the lesion
(Figure 4.3C).
114

Figure 4.3. High concentration of bacteria stained with Sybr Gold (fluorescent green) in type I and II lesions. (A and B) Acid-fast Sybr Gold stained bacteria in the foamy macrophages of the rim of the type I lesion 20x (A) and the whole necrotic granuloma 10x (B). (C) Type II lesion with uncontrolled bacterial growth and cellular debris within the alveolar spaces 20x. Sybr Gold and DAPI
4.3.1.4 Liposomal distribution in necrotic granuloma tissue
Lung tissues were also processed by Merrimack Pharmaceuticals to study the spatial
location of the liposomal nanoparticles within the necrotic granuloma at 60 and 90 days post
aerosol infection after 48 hours post injection. Targeted liposomes containing folic acid in their
outer lipid layer were used to bind to the folic acid receptors expressed on endothelial cells
surrounding the lesions by coating the nanoparticle with folic acid [309]. Feeding the mice a
folic acid free mouse chow will leave the binding receptors on macrophages surrounding and
within the necrotic granulomas open. The liposomes with folic acid moieties are the only
available source of ‘free’ folic acid and easily target and bind to the open receptors on the
macrophages. The non-targeted the liposomes were expected to be more prevalent in the
vasculature of the tissue. These microscopic assessments are preliminary, as more sections and
more have to be studied to make firm conclusions.
At 60 days post aerosol infection, the initial assessment showed that both the targeted and
the non-targeted liposomes could be distinguished in the lung sections of the TB infected mice
115

(Figure 4.4). In figure 4.4A, the non-targeted liposomes are visualized as pink staining and
remain in the vasculature, which surround the necrotic lesion within the lung parenchyma. The
folate-targeted liposomes in figure 4.4B demonstrate that the liposomes have migrated from the
vasculature to the cellular matrix surrounding the necrotic type I lesion. The targeted liposomes
appear to remain in the active macrophages that surround the granuloma (Figure 4.4C). These
macrophages have been determined to be active based on positive F4/80 IHC staining performed
by Dr. Gonzalez-Juarrero (data not shown). Directly interior of the functional macrophages are
the heavily bacterial burdened foamy macrophages which has shown preliminary data of
liposomal penetration.
Liposomal distribution at 90 days post aerosol infection was largely similar to 60 days
post aerosol infection. The non-targeted liposomes in figure 4.5A seem to remain largely within
the endothelial tissue surrounding a blood vessel on the outside of a necrotic lesion. The targeted
liposomes are shown to more likely to penetrate the type II necrotic lesion in figure 4.5B. The
targeted liposomes are present throughout the tissue. Type I lesions with targeted liposomes have
distinct liposome penetration to the inner rim before the necrotic central core. At this time it is
not possible to determine if the liposomes are in the foamy macrophages or the functional
macrophages external to the collagen rim (Figure 4.5C).
116

Figure 4.4. Liposomal distribution of non-targeted and targeted 60 days post aerosol infection. (A) Non-targeted Cy-5 liposome distribution remains within the endothelium1x (B) Targeted Cy-5 liposomes into the macrophages surrounding the necrotic granuloma 2x (C) Inset of targeted Cy-5 liposomes in the macrophages 10x (Images Propriety of Merrimack Pharmaceuticals, Cambridge, MA)
Figure 4.5. Liposomal distribution of non-targeted and targeted 90 days post aerosol infection. (A) Non-targeted Cy-5 liposomes trapped within the vessels surrounding the lesion 20x (B) Targeted Cy-5 liposomes in a type II necrotic alveolitis lesion 4x (C) Targeted Cy-5 liposomes in late stage type I granuloma 1x (Images Propriety of Merrimack Pharmaceuticals, Cambridge, MA)
117

4.3.2 Extensive pharmacokinetic evaluation of liposomal levels in C3HeB/FeJ and Balb/c mice
4.3.2.1 Liposomal tissue distribution
To examine the ADME properties (absorption, distribution, metabolism, and excretion)
of the liposomes, a pharmacokinetic study was performed using infected C3HeB/FeJ and Balb/c
mice at 10 weeks post aerosol infection. Mice were sacrificed at 6, 24, 48, 72, and 168 hours
after injection of the liposomal formulation, and plasma and various organs collected.
The results showed the highest liposomal levels in plasma and livers of the infected
animals at the first measured time point (6 hours after injection). High liposomal levels were
maintained in the liver. In the C3HeB/FeJ mice, both the targeted and non-targeted liposomes are
cleared from the plasma by 24 hours post injection. There are detectable levels of non-targeted
liposome in the plasma at 24 hours but these are greatly reduced compared to the 6 hour time
point. The targeted liposomes are cleared after 6 hours in plasma (Figure 4.6). The Balb/c mice
show a similar profile of tissue distribution, prominent accumulation in the liver throughout 168
hours and a peak in the plasma at 6 hours for both non-targeted and targeted (data not shown).
118

Figure 4.6. Liposome tissue distribution is predominantly in the liver for both C3HeB/FeJ and Balb/c mice for targeted and non-targeted liposomes. Balb/c mice and C3HeB/FeJ mice have measureable liposomes in the liver and 6 hour plasma collection in both targeted and non-targeted liposomes. (Data Propriety of Merrimack Pharmaceuticals, Cambridge, MA)
4.3.2.2 Rapid liposome clearance in infected mice
The next goal of this study was to assess tissue distribution of the liposomes over time in
both infected Balb/c and C3HeB/FeJ mice. For this purpose, mice were sacrificed at 6, 24, 48,
72, and 168 hours and plasma and whole lung and excised granulomas were collected. The
results showed that both C3HeB/FeJ and Balb/c mice had significantly increased clearance of the
liposomes in the plasma (Figure 4.7) for all groups. The liposomal formulations used for the
MTB infected C3HeB/FeJ and Balb/c mice had a reduced half-life of approximately 10 hours.
119

Measuring liposomes within excised granulomas and grossly uninvolved lung tissue
showed similar liposomal levels for all tissue types and for both mouse strains. The measureable
percentage of the injected liposomes at the first time point (6 hours) was less than 4% ID/g
(Injected Dose/gram) for all targeted/non-targeted combinations (Figure 4.8). The low
measurements may be due to the sample size, early clearance prior to first measurement, or poor
targeting of the folate liposome.
Figure 4.7. Rapid liposomal clearance in infected C3HeB/FeJ and Balb/c mice in the plasma. Combination of Cy-3 and Cy-5, targeted and non-targeted labeled liposomes measured as % injected dose per gram of tissue over hours in animal. (Data Propriety of Merrimack Pharmaceuticals, Cambridge, MA)
120

Figure 4.8. Low-level liposome detected in C3HeB/FeJ and Balb/c mice in both granuloma and healthy lung tissue throughout all time points. Combination of Cy-3 and Cy-5, targeted and non-targeted labeled liposomes measured % injected-dose per grams of tissue over hours in animal. (Data Propriety of Merrimack Pharmaceuticals)
4.4 – DISCUSSON
In this pilot study, and in collaboration with Merrimack Pharmaceuticals, we aimed to
evaluate the distribution of a novel liposomal delivery approach at the cellular level in lung
lesions by microscopy, and at the tissue level in TB infected animals using analytical tools. The
liposomal formulations used for this study were pegylated liposomes targeted to macrophages by
folic acid, were prepared by Merrimack Pharmaceuticals specialized in using liposomes for
cancer therapies. For these initial studies, the liposomal formulations did not encapsulate drugs
but fluorescent dyes in order to track the distribution. The striking similarities of the lung lesion
types observed in TB infections and in solid tumors instigated this study. By using a mouse
model, the C3HeB/FeJ strain, which more closely resembles the specific pathologic features of
121

human TB disease, we opted to evaluate this novel liposomal nanoparticle drug delivery system
in a relevant in vivo TB mouse model.
The most prominent lesion in the C3HeB/FeJ mice (type I necrotic granuloma lesion) has
many similarities to solid tumors in oncology. They both present with hypoxia, necrotic cellular
material, fibrous collagen outer rim, and the development of a surrounding capillary network.
C3HeB/FeJ mice were injected with the fluorescently labeled liposomes at different stages of
infection with MTB with progression of pathology. To target liposomes towards macrophages,
folic acid was anchored to the lipid bilayer of the liposomal formulation, which will bind to
macrophages that over-express folic acid binding protein. Based on the fluorescent microscopic
images, the location of the liposomes was studied within the different lesion types in the lungs.
The specific location of targeted and non-targeted liposomes was ascertained in both the type I
and II necrotic granulomatous lung lesions. At later stages of infection, we saw clear liposomal
presence both in the lung and lesions [Figure 4.4 and 4.5]. It appeared as if the non-targeted
liposomes remained predominantly in the vasculature surrounding the lesions, while targeted
liposomes might have extravasated from the vessels into the foamy macrophages cell layer.
These observations are preliminary at best and will need further thorough investigation by
studying more sections per mouse and more animals. Initial confocal microscopy data suggests
liposomes crossing the collagenous fibrils and entering the foamy macrophages, which is where
large numbers of bacteria reside (data not shown). In our previous work, we showed that there
are clearly two distinct macrophage populations (Driver et al., submitted). On the periphery of
the necrotic lesion, there are functional macrophages that can be distinguished by expression of
F4/80 [273] and lysozyme [251]. This is in contrast to the foamy macrophages which show high
122

expression levels of IL-10 [72] and the DEC-205 marker [310], and appear to be permissive to
bacterial growth.
It has been shown that after intravenous injection, both the targeted and non-targeted
liposomes achieve high levels in the liver as well as in the plasma, before liposomal levels reach
the lungs and lung lesions. The first pharmacokinetic study determined the concentration of
liposomes in plasma, liver, spleen, lung, and excised granuloma over a 4-day period in
uninfected mice. The results showed that initially the liposomes enter the plasma with a peak at 6
hours that is absent by 24 hours. In the liver, the liposomal level is highest and maintained
throughout analysis (Figure 4.6). It should be noted that at the earliest measured time point of 6
hours there was little to no measureable liposomes in the grossly non-involved lung and
granuloma tissue.
This lack of measurable liposomes in the lung and granuloma even at 6 hours might be
problematic. By examining the % injected dose of the liposome over time, a very short half-life
is observed in the plasma (Figure 4.7). This short half-life in the plasma translates to low levels
of liposomes in the lung tissue throughout time (Figure 4.8) for both C3HeB/FeJ and Balb/c
mice. This rapid clearance of the liposomes was a surprising finding and is not entirely clear at
this time. We speculate that this may due to the primed immune system of the infected animals.
This may also indicate that the liposome were in fact not reaching the target since both targeted
and non-targeted had similar detectable low-levels. Based on shared information from
Merrimack Pharmaceuticals Inc., it has been determined that liposomes IV injected into
tuberculosis infected mice are cleared from the mice much faster than in cancer mouse models
previously tested. In previously determined liposomal formulations the half-life of the liposomes
in the plasma is approximately 60 hours for neoplastic models (data not shown). A phenomenon
123

known as accelerated blood clearance (ABC) is seen in multi-dose PEGylated liposomes and is
due to an increased IgM antibody response [311-313]. This is likely not the reason to explain the
more rapid clearance in our study as we only used a single dose. A more likely rationale is the
presence of immune cells (such as Kupffer cells, specialized macrophages) in the liver which are
known to easily trap nanoparticles and lower tissue penetration [314]. To confirm this hypothesis
another pharmacokinetic study was performed on naïve and infected Balb/c mice. This study did
indeed confirm that infected mice had an accelerated rate of clearance in the plasma and organs
(data not shown). To counter the rapid clearance of the liposomes, adjustments are now being
made to the exterior of the liposomes to prevent early phagocytosis. Delaying this response will
allow for greater drug exposure and keeping the intermittent dosing schedule to fewer dosages.
These approaches are currently underway.
Liposomal nanoparticles as a novel method for drug delivery for specific infectious
diseases might have promise for more local drug delivery with fewer side effects. For an MTB
infection, we were able to show that liposomes track to the lungs and are able to accumulate near
the vicinity of the necrotic granuloma in the lungs of the infected C3HeB/FeJ mice. Changing the
composition of the liposomes may be needed to extend the liposome distribution allowing for
longer drug exposure and better-controlled drug release. Further research is currently being
performed to determine the bactericidal efficacy of liposomes carrying TB drugs. At this time it
is believed that drug delivery by liposomes could have an effect on treatment duration, reduction
of bacterial resistance and medication side effects, thereby improving patient compliance.
124

4.5 – FUNDING
Funding provided by Merrimack Pharmaceuticals Inc., Cambridge, Massachusetts Grant
“Assessment of liposomal drugs alone and in combination for TB efficacy”.
125

CHAPTER 5 - ALTERNATIVE TREATMENT APPROACHES TO AUGMENT
CLASSICAL THERAPY BY ALTERING HISTOPATHOLOGY
5.1 – INTRODUCTION
In active tuberculosis (TB) disease, one of the most prominent lesion types is the necrotic
granuloma The granuloma can be seen as a way for the host to sequester the bacteria in an
isolated region in the lung, whereas it is hypothesized, by some, to be a successful feature of
survival for the MTB [260]. A granuloma in the initial stages of disease is recruiting high
numbers of cellular infiltrates of NK cells, neutrophils, activated macrophages, non-activated
macrophages, lymphocytes and others [160]. These immune cells produce high levels of
cytokine and chemokines to recruit more inflammatory cells [315]. All of these immune cells
promote inflammation and remodeling of the lung tissue to cope with the infection [265, 316,
317]. The constant remodeling of the lung tissue can be seen by the perpetual changes to
collagen as we observed earlier by picrosirius red staining which stains recently deposited as
well as established collagen in the C3HeB/FeJ mouse model when infected with MTB [131]. For
certain drugs it has been shown very elegantly by Veronique Dartois et al. using MALDI-MRM-
MS [205], that a drug such as Moxifloxacin (MXF), accumulates in the tissue surrounding a
necrotic lesion and that the collagen rim, angiogenesis, and cellular make up of the granuloma
may be acting as a barrier to allow drug penetration
Necrotic granulomas, in particular cavitary lesions, are problematic for treatment of TB
patients on this on several levels: cavitary disease has been shown to give high levels of
transmission [159], they are more difficult to treat with a higher rate of relapse, and have a
higher resistance frequency within the cavitary lesion [256]. NHP can produce cavitary lesions
126

but do so variably [204, 213]. Rabbits, goats, and pigs are able to produce cavitary lesions more
reliably but are still cost prohibitive to work with for pre-clinical drug development [160, 176].
The C3HeB/FeJ mouse strain or Kramnik mouse model has the ability to develop the key
necrotic granulomas with a high frequency [181]. Usually these necrotic lesions do not progress
further into cavitary disease and this remains an infrequent event (only one or two mice out 100
develop a cavitary lesion). If we would be able to increase this frequency, this would better
recapitulate all aspects of human disease. These would create new opportunities to study aspects
of TB disease treatment largely left unanalyzed at this time.
The effects of collagen disruptors have been researched with increasing regularity for
chronic diseases like myocardial fibrosis [318], idiopathic fibrosis [319], cirrhosis [320, 321] and
for cancer [254]. These compounds have the ability to prevent the development of host collagen
which allows for more normal lung function and thereby increasing the efficacy of drug
treatment. Losartan potassium (LK), an angiotensin II receptor antagonist, is being used
clinically for chronic heart failure and hypertension by altering the renin-angiotensin-aldosterone
axes which prevents vasoconstriction [322]. Further downstream effects of blocking the AGTR1
(angiotensin II receptor, type 1) (Figure 5.1) include the inhibition of fibrinogen, collagen I,
fibronectin, and collagen II production and suppression of TGF-β1 from thrombospondin-1
[323].
127

Figure 5.1. Schematic of the angiotension receptor II pathway showing the downstream effects of upregulation of TGF-β and the eventual increase of fibrinogenesis [324]
It has been shown that LK is able to significantly reduce the fibrotic rim from human
fibrosarcoma implanted in mice when injected intraperitoneally for 2 weeks [325]. LK has an
oral bioavailability of 35% [326], due to first pass metabolism. LK is metabolized by CYP3A4
and CYP2C9 into a highly active carboxylic acid metabolite E-3174 [327]. This would mean that
in light of TB treatment, this could result in the faster clearance of compounds affected by CYP
enzymes, such as rifampin. Mice treated with a single dose of damaging bleomycin (another
fibrolytic compound) with follow up treatment of LK showed conflicting results in different
studies [328, 329]. One of the studies showed effect of LK to reduce the fibrotic effects of
bleomycin [328], whereas the second study determined that using LK limited the effect of
treatment of pulmonary fibrosis [329]. To our knowledge collagen disruptors have not been used
in the treatment of TB. Another research group using an indirect approach to alter the collagen
deposition has used anti-TNFα therapy in combination with standard drug treatment, which
showed that anti-TNF therapy hastened bacterial clearance with standard drug therapy [330].
Over the last years, more information has become available on the epidemiology,
immunology, virulence, transmittability as well as the lung pathology of the diverse clinical TB
128

strains [331]. Many clinical strains show extensive cavitary disease in TB patients [332]. W-
Beijing strains are thought to have increased pathogenicity, an inclination towards drug
resistance, and appear less response to the BCG vaccination [169, 333]. In order to generate
cavitary disease, animals such as rabbits, goats, and pigs, require infection with highly virulent
clinical strains [154, 160, 176]. The geographic locations and epidemiological studies have
divided MTB strains into six major phylogenic clades [334-338], East African, East Asian, Euro-
American, Indo-Oceanic, and 2 West African (M. africanum) clades [336]. Significant clade
specific differences have been performed more recently studied in animal models by studying the
survival, bacterial burden, histopathological changes, and immunological response [232, 339].
W-Beijing strains are within the East Asian clade and are the source of several recent
virulent, outbreaks worldwide [340]. Currently, W-Beijing strains are identified by their regions
of difference (RD), which are large regions of sequences prone to polymorphisms. Over 30 RDs
have been described and strains have been classified based on genomic deletions [341]. For the
mouse studies described below, we opted to use TB strains with known diverse characteristics
regarding transmittability and progression of disease. Several reports on population studies based
in San Francisco, CA [341, 342] and Houston, TX [343] have reported several TB strains that
cause pulmonary disease with a high incidence of cavitary formation. The sublineages from San
Francisco (RD): RD207 and RD181 produced advanced necrotic granulomas in experimental
guinea pig infections [165]. RD207 sublineage was reported to be highly virulent and highly
transmissible. The population studies showed RD207 had the highest incidence of secondary
infection [165]. In the guinea pig model, it produces multiple highly necrotic lesions within 30
days [165]. The RD181 sublineage is a less virulent sublineage in humans and in the guinea pig
under experimental conditions [165]. The strains from the RD181 sublineage are able to control
129

inflammation, and the pathogenicity is milder. In 1995, a W-Beijing strain, now known as
HN878, caused 3 disease clusters and infected over 60 people in Houston [170]. HN878 is highly
virulent and is commonly used in rabbit models of TB infection [204] and has been shown to be
hypervirulent in mice [344, 345].
Host immunogenic responses to W-Beijing strains have shown a reduced overall Th1
profile, specifically in IFN-γ expression levels [346]. It has since been determined that mice
infected with HN878 initially produce a strong IFN-γ response that wanes and there is an
increase in T regulatory cells, such as Foxp3+ [333]. There is considerable early Th1 expansion
of CD4+ cells in mice infected with HN878. This phenomenon is seen in other W-Beijing
strains, a large increase of mRNA expression of IFN-γ that wanes over time and showing a
delayed upsurge in mRNA expression of Foxp3+ and other Th2 cytokines [345]. For other RD
sublineages a similar pattern is observed. Highly virulent RD207 have high expression levels of
Foxp3+ and low IFN-γ, whereas RD181 has increased expression of IFN-γ later in infection
[165]. The significant differences observed in cytokine profiles observed within the W-Beijing
East Asian clade in different animal models demonstrates that the importance of using clinical
strains for pre-clinical testing and model development.
5.2 Study of an angiotensin II inhibitor to disrupt the collagen rim of a necrotic granuloma
As discussed in the introduction, LK is potent angiotensin II inhibitor with downstream
effects to fibrinogen and collagen formation. LK has shown great promise in altering the fibrotic
rim of cancerous tumors and idiopathic pulmonary fibrosis. We hypothesize that the same effects
of LK on the disruption of collagen deposition in necrotic lung lesions could be translated into an
augmentation of treatment efficacy for MTB. Our hypothesis is that the use of LK will disrupt
130

the collagen rim of the necrotic lung lesions to allow for greater drug penetration thereby
resulting in a greater efficacy by reducing the bacterial burden of the TB infected C3HeB/FeJ
mice. Our approach will include the administration of LK prior to and in combination with TB
drug therapy. Comprehensive analysis of the effects of LK treatment will include the
enumeration of the bacterial load in the lungs, histopathology of the lung, distribution of collagen
as well as the location of bacteria using staining techniques.
5.2.1 – MATERIALS AND METHODS
5.2.1.1 Animals
See Methods in Chapter 2
5.2.1.2 Bacteria and drugs
See bacterial preparation in Chapter 2
Isoniazid (INH) and moxifloxacin (MXF) were obtained from Sigma Chemical Co. (St.
Louis, MO). Losartan Potassium (LK) was purchased from Santa Cruz Biotechnology, Inc.
(Dallas, TX). Drugs were prepared for the treatment of the mouse models as described before
[116]. INH, MXF, and LK were dissolved in sterile water.
5.2.1.3 Aerosol infection and drug treatment schedule
C3HeB/FeJ mice were exposed to a low-dose aerosol infection with MTB in a Glas-Col
inhalation exposure system, as previously described [217], resulting in an average of 15 bacteria
in the lungs for the first experiment and undetectable for the second experiment on the day of
131

exposure. Five mice were sacrificed the following day to determine the number of CFU
implanted in the lungs.
For the first experiment the mice were treated with the following drugs: INH (25 mg/kg),
LK (50 mg/kg), and INH+LK (25+50 mg/kg) for 6 weeks. There was a necessary drop in dose
due to acute mortality for LK from 50 to 20 mg/kg at week 2 of treatment for the remainder of
the first experiment, as a combination and single treatment. Drug treatment started 3 weeks post
infection and occurred 5 days per week via oral gavage. Mice were euthanized after 3 and 6
weeks of treatment by CO2 inhalation. For all mice, the whole lungs were homogenized and the
bacterial load determined by serial dilution on 7H11 agar plates.
For the second experiment, 4 weeks post aerosol infection mice were treated with LK (20
mg/kg) for 2 weeks prior to drug treatment. After two weeks of treatment, mice were given the
following drugs: MXF (100 mg/kg), LK (20 mg/kg), MXF without LK pre-treatment (100
mg/kg). Mice were euthanized after 2 and 5 weeks of treatment by CO2 inhalation. For all mice,
the whole lungs were homogenized and the bacterial load determined by serial dilution on 7H11
agar plates.
5.2.1.4 Enumeration of bacterial load of lungs and spleens
See Methods in Chapter 2
5.2.1.5 Pathology and microscopy
See Methods in Chapter 2
132

5.2.1.6 Staining procedures
See Methods in Chapter 2 for picrosirus red stain and Chapter 3 for H&E and Sybr Gold
Methodologies
5.2.1.7 Stereology
Stereo Investigator 8.2 (MBF Biosciences, Williston, VT) was used to analyze lung tissue
features: lung, lesion and collagen deposition, described in Ordway et al [162]. Briefly,
stereological analyses of tissue sections were performed with the investigator blind to treatment
groups. The stereology workstation consisted of a Nikon 80i Research Microscope equipped for
brightfield and fluorescence microscopy with CFI objectives (2x/0.01 Plan Apo, 4x/0.2 Plan
Apo, 10x/0.30 Plan Fluor, 20x/0.75 Plan Apo, 40x/0.75 Plan Fluor, 100x/1.40Plan Apo), 3-zxis
computer-controlled stepping stage with linear grid encoders, Z-axis motorized specimen stage
for automated sampling, PC with frame grabber board, color digital camera, 24-in monitor and
stereology and virtual slice Zoomify software with the following; 3D serial section
reconstruction, solid modeling, virtual slice, confocal and MRI modules. The lung and lesion
area were determined using the area fraction factionator (AFF) method on representative
hematoxylin and eosin (H & E) stained sections. The area of inflammation and collagen relative
to the normal lung parenchyma was estimated from representative lung sections evaluated at
40X. A total of 7-10 fields are selected randomly by the computer (Figure 5.2) and a counting
frame (550 µm2 ) containing probe points with a grid spacing of 40 µm is used to define lesion,
collagen, and lung. The data was expressed as the mean ratio of lesion area to lung area of all the
animals within a treatment group.
133

Figure 5.2. Schematic of stereology approach to lung slides using Stereo Investigator.
5.2.1.8 Statistical analysis
See Methods in Chapter 2
5.2.2 – RESULTS
5.2.2.1 Treatment of C3HeB/FeJ mice with Losartan Potassium alone as well as in combination
in an initial small scale study
Susceptible C3HeB/FeJ mice infected with MTB Erdman began treatment at 3 weeks
post-infection. At the start of treatment the bacterial burden was 6.73 ± 0.22 log10 in the whole
lungs of five sample mice. At 6 weeks post aerosol infection untreated mice peaked at 8.75 ±
0.55 log10 with a 0.5 log decrease at 9 weeks to 8.27 ± 0.48 log10. Mice treated with INH alone
for 3 weeks reduced the load to 8.01 ± 0.38 log10 in the lungs and further reduction to 6.29 ±
0.34 log10 after 6 weeks of treatment. LK treatment alone resulted in 8.57 ± 0.58 log10 after 3
weeks of treatment and reduced to 6.01 ± 0.45 log10 after 6 weeks of treatment. The LK group
had a high mortality resulting in a survival bias of the remaining mice. These mice have a low
bacterial burden and less severe histopathology. Combination treatment of INH+LK resulted in
6.6 ± 0.69 log10 after 3 weeks of treatment and 7.19 ± 0.47 log10 after 6 weeks of treatment
(Figure 5.3).
134

Figure 5.3. Losartan Potassium treatment, alone and in combination, in the lungs show no difference in the bacteria load in the lungs of TB infected mice.
The bacterial burden in the spleen was also investigated after 3 and 6 weeks of treatment.
The bacterial numbers in spleens increased, from 5.52 ± 0.2 to 5.94 ± 0.25 log10 in the control
mice. Mice treated with INH showed a reduction in bacterial burden of <1.5 logs from 4.2 ± 0.12
to 2.49 ± 0.13 log10. There was a 2-log reduction in bacterial burden in the spleen of mice
treated with LK alone (5.89 ± 0.45 dropped to 3.85 ± 0.54 log10), as a result of the survival bias
also observed in the lungs. Combination treatment of INH+LK resulted in 5.13 ± 0.19 log10 at 6
weeks and 4.8 ± 0.04 log10 at 9 weeks post aerosol infection (Figure 5.4).
At 4 weeks post aerosol infection (1 week of treatment) mice from all groups and
controls began losing significant weight. Within 40 days post infection 13.88% of the mice
needed to be humanely euthanized or succumbed to disease. At 45 days 11.78% and at 50 days
8.69% of the remaining mice required euthanasia due to declining weight and overall health
condition (Table 5.1).
0123456789
10
-3 wk 0 3 wk 6 wk
Log
10 C
FU
Weeks Post Aerosol Infection
ControlINHLKLK+INH
135

Figure 5.4. Losartan Potassium treatment, alone and in combination, in the spleen show no difference between treatment groups.
Table 5.1. Percentage of C3HeB/FeJ mouse mortality after infection with M. tuberculosis
Days Post Aerosol Infection % Mortality 20 days 0 30 days 0 40 days 13.88 45 days 11.76 50 days 8.69 60 days 4.76
Large numbers of animals designated to treatment groups succumbed to disease within
the 40-50 day timeframe, likely caused by the LK treatment. Twenty-nine percent of the control
mice, 50% of LK single treatment, and 29% of combination of INH+LK mice required
euthanasia or succumbed to disease within 60 days post aerosol infection (Table 5.2). The large
number of mouse mortality in all treatment groups makes it difficult to draw conclusions on the
efficacy of adjunctive therapy in combination or alone. The mice at the end of the trial showed
lower bacterial burdens and had less pathological inflammation.
012345678
3 wk 6 wk
Log
10 C
FU
Weeks Post Aerosol Infection
ControlINHLKLK+INH
136

Table 5.2. Mouse mortality separated into specific treatment groups after the start of treatment at 3 weeks post aerosol infection Treatment Group # animals % of group Control 10 29 INH 0 0 LK 12 50 INH+LK 7 29
5.2.2.2 Stereological analyses of LK treated mice show no difference in collagen deposition
To calculate the area of disease and collagen in the lungs throughout treatment, the
stereology approach was used to determine if there were relevant differences between the groups.
As described in the Methods the Stereo Investigator 8.2 (MBF Biosciences, Williston, VT) was
used to analyze lung tissue features: lung, lesion and collagen deposition. The lung and lesion
area was determined using the area fraction factionator (AFF) method H&E stained sections. The
area of inflammation and collagen relative to the normal lung parenchyma will be estimated from
representative lung sections evaluated at 40X. A total of 7-10 fields are selected randomly by the
computer (Figure 5.2) and a counting frame (550 µm2 ) containing probe points with a grid
spacing of 40 µm is used to define lesion, collagen, and lung. The data is expressed as the mean
ratio of lesion area to lung area of all the animals within a treatment group.
Analysis of the stereology results showed the mice at the start of treatment, 3 weeks post aerosol
infection; the pre-treatment group lung tissue was composed of 85% healthy lung parenchyma,
11% early lesion necrosis and 4% collagen. Three weeks of treatment results in relatively
equivalent amounts of lesion (red bars) and collagen (green bars) in all treatment groups, 61%,
45%, 49%, and 52% and 8%, 8%, 9%, and 10% in control, INH, LK and INH+LK, respectively.
By 6 weeks of treatment the lesion and collagen composition remained stable for all groups at
54%, 53%, 67%, and 52% and 16%, 14%, 8%, and 12%, for the control, INH, LK and INH+LK
137

groups, respectively (Figure 5.5). In summary, the stereology results from the different treatment
groups were inconclusive in terms of observed differences in amount of necrotic lesion, collagen,
and lung tissue.
Figure 5.5. Average percent of tissue types show no difference between treatment groups over time. Collective measurement of lung parenchyma, necrosis, and collagen by stereology throughout infection.
5.2.2.3 Pathological analysis
Besides the quantitative histopathology analysis via stereology, we also assessed more
qualitatively the potential changes in pathology by LK treatment. To investigate histopathology
staining with H&E, picrosirus red, and acid-fast Sybr Gold staining techniques were used to
study lesion progression, collagen deposition, and bacterial location. At the start of treatment the
animals showed mainly cellular lesions consisting of foamy and epithelioid macrophages,
lymphocytes, and neutrophils (Figure 5.6A and B).
0102030405060708090
100
Treatment Groups
Lung
Lesion
Collagen
138

Figure 5.6. Cellular infiltrates with accumulation of neutrophils at the start of treatment. (A) A cellular lesion of foamy macrophages, lymphocytes, and neutrophils 10x. (B) A larger lesion of early necrosis, a high number of neutrophils with lymphocytes and foamy macrophages 10x
Three weeks of treatment resulted in a heterogeneous pathological response in the
C3HeB/FeJ mice. Figure 5.7A is a visual representation of type III cellular lesions, composed of
lymphocytes, epithelioid and foamy macrophages, as well as neutrophils, (as defined in chapter
3). Three weeks of LK treatment also showed type I lesions (as shown in Figure 5.7B) with a
large necrotic lesion with a highly eosinophilic core, a foamy macrophage rim surrounded by
collagen and neo-angiogenesis. Mice treated with INH alone and with INH+LK combination
appear to have more type I lesions compared to the other lesion types at 3 weeks of treatment
(Figure 5.7C and D).
After six weeks of treatment, the animals from drug treatment groups had a
heterogeneous pathological response (data not shown). The control mice (Figure 5.8), showed a
highly necrotic response that was very eosinophilic when stained with H&E. In Figure 5.8A, a
large accumulation of neutrophils is seen in a region of amorphous debris. While, in figure 5.8B,
a representative of a classic type I lesion is seen.
139

Figure 5.7. Varied lesion development at 6 weeks post aerosol infection, 3 weeks of treatment, from different treatment groups. (A) Type III cellular lesion from 3 weeks of Losartan Potassium (LK) treatment 4x. (B) LK treatment produces type I lesion with the thick collagen rim and necrotic core 10x. (C) A representative type I lesion from 3 weeks of INH treatment 4x. (D) A more diffuse lesion, highly necrotic with collagen deposition around the outside. Representative of type II and type I lesions from combination INH+LK treatment 10x.
Figure 5.8. Highly necrotic lesions at 9 weeks post aerosol infection. (A) Core of a necrotic lesion from control mice shows distinct neutrophils and an eosinophilic core 20x. (B) The edge of a type I lesion with necrotic core with foamy macrophage rim 10x.
140

To determine any effects of the drug treatments on collagen depositions, we used
picrosirius red stain. As stated in chapter 2, dark red and orange stain is indicative of larger,
thicker and therefore older collagen fibrils, as seen in control animals (Figure 5.9A), while the
yellow and green stain are indicative of smaller, thinner, and newer collagen fibrils, as were
observed in our INH and LK treated animals (5.9B and C). In the combination INH+LK treated
mice, there seemed to be a trend towards seeing less collagen deposits at 3 weeks of treatment
(Figure 5.9D). Although these preliminary observations showed to be interesting, they are not
quantitative and should be interpreted with care.
Figure 5.9. Combination treatment visually seems most effective in disrupting collagen rim. (A) Red/orange stained collagen surrounding a lesion at 6 weeks post aerosol infection in control mice 10x. (B) The advanced collagen rim from INH treated mice for 3 weeks is mostly made from thin collagen fibrils determined from the yellow/green stain 10x. (C) The mix of red and yellow collagen fibrils in the LK treated mice 10x. (D) Combination INH+LK treated mice qualitatively has the least amount of collagen. The collagen fibrils present are thicker red/orange 4x
141

In order to determine whether the LK treatment alone or in combination had any effect on
the bacterial location in the lungs, we used the acid-fast fluorescent stain, Sybr Gold. Early on,
the Sybr Gold staining showed that bacterial location mainly clustered around nuclei and pockets
of lymphocytes (Figure 5.10A and B). Control mice at 3 weeks of treatment, which is 6 weeks
post aerosol infection, has a large number of bacteria that concentrate in border of foamy
macrophages in the rim of a type I lesion (Figure 5.10C). At 6 weeks of treatment, which is 9
weeks post infection, mice from the LK treatment group showed a well defined type I lesion
(Figure 5.10D), with a high concentration of acid-fast positive bacteria in the foamy macrophage
rim and a large accumulation of bacteria throughout the necrotic lesion.
Figure 5.10. Sybr gold fluorescent staining show the transition from intracellular to extracellular at late stage. (A and B) Clusters of bacteria (green) around pockets of nuclei stained with DAPI (blue) for pre-treatment mice 20x. (C) The bacteria are concentrated around the rim of the necrotic lesion and throughout the core of control mice at 6 weeks post aerosol infection 20x. (D) Type I lesion from 6 weeks post-treatment of LK show bacteria in the rim and throughout the core of the necrotic lesion 10x.
142

Two important lessons were learned from this initial trial were to lower the LK dose in
order to reduce adverse effects, and instead of co-treatment of LK and chemotherapy to study
pre-treatment of LK prior to TB treatment.
5.2.2.4 Losartan Potassium as a pre-treatment to chemotherapy
Due to the catastrophic mortality of the first pilot study, a lower infectious dose and a
shorter, pre-treatment course of LK was used. To explore the benefit of collagen breakdown
prior to chemotherapy, LK was used as a pre-treatment. Infected C3HeB/FeJ mice were either
initially treated with LK or untreated for 2 weeks with follow up treatment with MXF, LK, or
untreated for an additional 3 weeks. The experimental design resulted in the following groups:
LK alone (2 wks), LK (2wks) + MXF (3 wks), MXF (3 wks), and an untreated group.
C3HeB/FeJ mice were infected with MTB Erdman and allowed to reach peak infection 5.91 ±
0.32 log10 in the lungs for 4 weeks before the start of treatment. At the start of treatment, mice
were treated with LK alone for 2 weeks whereas a control group was left untreated. At the end of
2 weeks pre-treatment with LK, the mice reached a bacterial burden of 7.49 ± 0.38. Untreated
mice had a bacterial burden of 7.27 ± 0.4 log10. The results of the treatment groups versus the
untreated controls were not statistically significantly different (P > 0.05) (Figure 5.11).
143

Figure 5.11. Pre-treatment with Losartan potassium does not have a significant change in bacterial burden in C3HeB/FeJ mice.
The spleens of C3HeB/FeJ mice at the start of pre-treatment had a bacterial burden of 4.7
± 0.23 log10. After 2 weeks of LK treatment or untreated the mice reached 4.53 ± 0.27 or 4.47 ±
0.23 log10, respectively. Mice continually treated with LK for a further 3 weeks were terminated
with a bacterial load of 4.10 ± 0.15 log10, while mice treated only with MXF (3 wks) had a 0.5
log reduction to 3.52 ± 0.14 log10 CFU (p < 0.05) to the control mice. The combination of pre-
treatment of LK followed by MXF had a 1 log reduction to 3.04 ± 0.17 log10 CFU (p < 0.01)
from the control mice (Figure 5.12). Pre-treatment with LK had no effect on the efficacy of
MXF, When groups LK (2 wks) + MXF (3 wks) to MXF (3 wks) were compared, there was no
statistically significant difference (p = 0.11).
0123456789
0 2 weeks 5 weeks
Log1
0 C
FU
Time (Weeks)
ControlLKLK/MXFMXF
144

Figure 5.12. Moxifloxacin treatment has a statistically significant bacterial reduction in the spleen, LK pre-treatment does not have an effect. After 5 weeks of treatment, 9 weeks post aerosol infection; mice treated with LK had 4.10 log10, MXF had 3.52 log10* (p=0.03), and LK/MXF 3.04 log10* (p=0.01).
5.2.3 Result summary and conclusions of Losartan potassium as treatment augmentation
Our goal was to use an anti-fibrolitic to manipulate the collagen rim of the granuloma and
increase chemotherapeutic efficacy. To achieve this objective LK was given to C3HeB/FeJ mice,
which are capable of developing necrotic granulomas, alone and in combination with a highly
effective first line TB drug, INH. To draw final conclusions from the data set of the first
experiment has been complicated by a few factors. First, we saw a high mortality rate of the
Kramnik mice caused by a highly virulent infection, which we and others have seen (Driver et al.
submitted, Irwin et al. manuscript submitted), and by the adverse of LK treatment. The mortality
was highest in the LK group alone group (50% mortality); and therefore it is possible that the
results of the remaining mice were skewed to those with lower bacterial numbers (Figure 3). In
the histopathology analysis using stereology, there was little change seen in the percentage of
lesion involvement and collagen deposition between the treatment groups in the 3 and 6 weeks of
0
1
2
3
4
5
6
0 2 weeks 5 weeks
Log1
0 C
FU
Time (weeks)
ControlLKLK/MXFMXF
145

treatment groups. The high mortality in the LK group may be the result of the healing/resolving
of the granulomatous lesions, releasing organisms in the lung, causing an uncontrolled
inflammatory response. We can speculate that this resolved lesion may have been the biological
equivalent of ‘opening Pandora’s Box’ and without a highly effective combination therapy to
counteract the upsurge in bacteria and cytokines the mice might succumb quickly. As a
consequence of the high mortality the animals able to survive had a lower bacterial burden, less
pathological changes, and fewer clinical symptoms, such as weight loss. In contrast, the
mortality might just be caused by the LK treatment itself and therefore lower dosages might be
utilized in future experiments.
Due to the catastrophic mortality of the first pilot study, a lower infectious dose and a
shorter, pre-treatment course of LK was used. We hypothesized that pre-treatment with a low
dose, short course LK treatment would modify the collagen rim in order to have more efficient
drug penetration, especially for those drugs known to accumulate outside the lesion such as
MXF. Using LK as a pre-treatment in the second experiment showed some promise, but the
results of the study with the current design were not statistically significant reducing the bacterial
load in the lung. A future study with longer durations of the treatment lengths of LK as well as
MXF may result in greater effects in CFU reductions as well as in altering pathology, increase
the could answer that question.
5.3 Aim to increase the frequency of cavitary disease in C3HeB/FeJ mice after aerosol infection
of clinical M. tuberculosis strains
W-Beijing clinical strains are of the most virulent and highly transmittable East Asian
lineages of MTB in the world. The hypothesis of this study was to use W-Beijing clinical
146

strains for mouse infection to produce higher incidences of cavitary disease in susceptible
C3HeB/FeJ mice, thereby creating a reliable cavitary model to test future drug treatment
protocols. This will be accomplished by using W-Beijing strains known to produce disease
progression, ranging from moderate to severe in other mouse and guinea pigs models [333].
These strains evaluated also have shown a history of producing cavitary disease in human
patients [165]. The outcome of the proposed mouse study will aim to assess bacterial burden,
histopathological evaluations of tissue, and performing flow cytometry of T cells responses in
the lungs of these infected animals.
5.3.1 – MATERIALS AND METHODS
5.3.1.1 Animals
See Methods in Chapter 2
5.3.1.2 Bacteria and aerosol infections
M. tuberculosis Erdman strain (TMCC 107) was used for drug evaluations in mice and
prepared as previously described [116, 217]. Briefly, the bacteria were originally grown as a
pellicle to generate low passage seed lots [116]. Working stocks were generated by growing to
mid-log phase in Proskauer-Beck medium containing 0.05% Tween 80 (Sigma Chemical Co., St.
Louis, MO) in three passages, enumerated by colony counting on 7H11 agar plates, divided into
1.5 ml aliquots and stored at -70°C until use.
W-Beijing strains of MTB characterized by the region of difference (RD) were acquired
from Kato-Maeda laboratory in San Francisco [165]. We used three strains 4147 and 3507
(RD181) and 5097 (RD207) (Table 5.3). Briefly, strains were grown in 7H9 media containing
147

0.05% Tween-80 and frozen in aliquots at -70oC until use. Strain HN878, a W-Beijing strain,
recovered from patients in Houston, TX [170] provided by the Kreiswirth laboratory, has been
used to reliably produce cavitary lesions in the rabbit model. The W-Beijing strains (5097, 3507,
and 4147) from Kato-Maeda laboratory have shown a large necrosis to lesion ratio in previous
guinea pig experiments by 30 days of infection. The RD207-5097 grew quickly and was the most
severe, while the RD181 sublineage was less severe.
Table 5.3. Lineages and infectivity of clinical strains Lineage Laboratory Transmission Chest X-ray Erdman TMCC Low No cavities HN878 Kreiswirth High Cavities RD207-5097 Kato-Maeda High Abnormal; no cavities RD181-3507 Kato-Maeda Low Cavities RD181-4147 Kato-Maeda Moderate Cavities
In the first experiment, the C3HeB/FeJ and Balb/c mice were exposed to a low-dose
aerosol infection with MTB RD207-5097 or RD181-3507, via a Glas-Col inhalation exposure
system, as previously described [217], which resulted in 266 and 89 CFU/mouse, respectively. In
the second experiment, the C3HeB/FeJ and Balb/c mice were exposed to a low-dose aerosol
infection of MTB Erdman, RD181-3057, RD181-4147, or HN878 which resulted in an average
of 8.3, 86.6, 25, and 33.3 CFU, respectively, in the lungs on the day of exposure. In order to
enumerate the bacteria implanted in the lungs, for every MTB strain three Balb/c mice were
sacrificed the following day.
148

5.3.1.3 Enumeration of bacterial load of lungs and spleens
See Methods in Chapter 2
5.3.1.4 Pathology and microscopy
See Methods in Chapter 2
5.3.1.5 Staining procedures
See Methods in Chapter 2
5.3.1.6 Flow cytometry
Cells were harvested from the lungs as described before [347]. Briefly, during necropsy,
lungs were perfused with heparin (Sigma, St. Louis, MO). Thereafter, organs were minced and
incubated for 30 min at 37°C with collagenase and DNAseI (Sigma), passed through a cell
strainer and harvested by centrifugation. For antibody staining, cells were initially incubated with
10 µg/ml of FcBlock (anti-CD16/CD32, clone 93) for 20 min at 4°C. Thereafter, cells were
stained with the following antibodies (all antibodies were from eBioscience, San Diego, CA) for
20 min at 4°C in the presence of FcBlock: anti-Gr1 (clone RB6-8C5), anti-CD11b (clone
M1/70), anti-CD11c (clone N418), anti-CD4 (clone GK1.5), or anti-CD8 (clone 53-6.7).
For intracellular cytokine staining [179] lung cells were stimulated for 4 hrs with anti-
CD3 and anti-CD28 in the presence of Golgi-Stop (BDsciences). Cells were resuspended in
permeabilization buffer using a commercial kit (Foxp3 Staining BufferSet; eBiosciences) and
incubated for 30 min at room temperature. Cells were washed again and resuspended in
Perm/Wash buffer containing labeled mAbs against Foxp3 (FJK-16s, Rat IgG2a), IL-17A
149

(eBio17B7, Rat IgG2a, K) and IL-17F (eBio18F10, Rat IgG2a), or IFNg (XMG1.2, rat IgG1),
and incubated for 30 min at 4 _C. The cells were resuspended in PBS containing 0.05% sodium
azide prior to analysis. Data acquisition was performed on a LSR-II flow cytometer (BD) and
100,000 events were analyzed. Data was analyzed using FACSDiva version 6 (Becton Dickinson
Instrumentation).
5.3.2 – RESULTS
5.3.2.1 Survival of mice infected with W-Beijing strains from San Francisco
A small pilot study was performed initially to evaluate the growth kinetics of clinical
strains RD181-3507 and RD207-5097. Both C3HeB/FeJ mice and immunocompetent Balb/c
mice were infected with each strain. Day one post aerosol infection, the mice infected with
RD207-5097 showed an average of 266 CFU per mouse, and the bacterial load of RD181-3507
was 89 CFU.
For strain RD207-5097, the C3HeB/FeJ mice continued to gain weight for two weeks but
rapidly began to lose weight thereafter. The rapid weight loss resulted in the need for humane
euthanasia of the mice within a month post-aerosol infection (Figure 5.13). For the
immunocompetent Balb/c mice infected with RD207-5097, the mice were able to control
infection for 3 months post-aerosol infection. Bacterial plating of day 1 infection of RD207-5097
showed however contamination in the bacterial stock used for infection (gift from a
collaborator), and therefore the results with this strain cannot be used for any data interpretation.
Both the C3HeB/FeJ and Balb/c mice infected with RD181-3507 continued to gain
weight and remain healthy during the 3-month experimental duration (Figure 5.13).
150

Figure 5.13. Highly virulent clinical strain RD207-5097 has increased mortality in susceptible C3HeB/FeJ mouse strain. C3HeB/FeJ mice infected with RD207-5097 have increased weight loss and morbidity versus mice infected RD181-3507. Balb/c mice infected with either RD207-5097 or RD181-3507 are able to continue thrive until the conclusion of the experiment.
5.3.2.2 Evaluation of histopathology in the lungs of C3HeB/FeJ mice infected with W Beijing
strains
Based on the data from the pilot study, a new experiment was conducted to evaluate the
histopathology after infection with several Beijing strains. For this purpose, C3HeB/FeJ and
Balb/c mice were infected with Erdman, RD181-4147, RD181-3507 and HN878. Three Balb/c
mice for each strain were used to determine the infection exposure on day one. The results
showed an expected CFU per mouse for the various MTB strains; Erdman, RD181-3507,
RD181-4147, and HN878 giving an average of 8.3, 86.6, 25, and 33.3 CFU in the whole lungs,
respectively.
MTB Erdman, our main laboratory strain, showed an expected growth curve over 6
weeks from the time of infection (Figure 5.14A), growing exponentially to 8 logs even with a
low infectious dose. The RD181 sublineages began with a slow growth in the lungs, however at
6 weeks post aerosol infection also reached 8 logs. HN878 followed a similar growth kinetic as
Erdman but was more virulent reaching 8 logs at 4 weeks and remaining at that bacterial load at
151

6 weeks. The already high bacterial load at 4 weeks resulted in increased mortality of mice
infected with HN878 with 8% of the mice needing to be humanely euthanized early.
The bacterial burden of the spleens for all strains was increasing over time but largely
similar for all the strains evaluated, with approximately 1.75, 4.8, and 5.3 Log10 CFU at 2, 4,
and 6 weeks, respectively (Figure 5.14B).
Figure 5.14. C3HeB/FeJ mice infected with clinical strains of M. tuberculosis show no statistical difference in bacterial burden in the lung (A) and spleens (B).
5.3.2.3 Pathological progression in the lungs and virulence of clinical strains in C3HeB/FeJ
mice
The progression of disease highly depends on virulence of the MTB strain used to infect
the susceptible C3HeB/FeJ mouse strain. At 2 weeks after aerosol, MTB Erdman, as well as the
RD181-3507 and 4147 strains, showed moderate alveolar thickening in the lungs, an
accumulation of lymphocytes, and a small number of neutrophils being recruited (Figure 5.14A
and B, respectively). The W-Beijing strain, HN878, showed for all three mice at 2 weeks post
aerosol already the presence of large regions of type I and type II lesions (lesion types are more
detail described Chapter 3) (Figure 5.15C).
Lungs
0
1
2
3
4
5
6
7
8
9
10
1 14 28 42
Days Post Aerosol Infection
Log
10 C
FU
Erdman35074147HN878
Spleens
0
1
2
3
4
5
6
7
8
9
10
14 28 42
Days Post Aerosol Infection
Log
10 C
FU Erdman35074147HN878
152

Figure 5.15. Virulent HN878 has early severe pathological features. (A) Midori strain 3507 and (B) Midori strain 4147, at 2 weeks post-aerosol infection results in accumulation of cellular infiltrates with neutrophils and early necrosis 20x. (C) HN878 at 2 weeks post-aerosol infection has type I necrotic lesions with moderately developed collagen rim 4x.
At four weeks post aerosol infection, the lesions from the mice infected with MTB
Erdman, 3507, or HN878 strains have progressed predominantly to type II lesions (Figure 5.16).
These lesions show extended cellular necrosis with cellular accumulation of lymphocytes, foamy
macrophages, and neutrophils. Mice infected with RD181-4147 show mainly cellular type III
lesions (Figure 5.16D). The inset from figure 5.16D shows an airway of the cellular lesion with a
high number of intact neutrophils obstructing the bronchiole.
At six weeks post-aerosol infection, all strains showed developed advanced lung
pathology in the C3HeB/FeJ mice. Mice infected with MTB Erdman showed all three types of
lesions in the lungs; type I granulomas with central necrosis and collagen rim (Figure 5.17A),
type II lesions with neutrophilic infiltrates and necrotic alveolitis, and the cellular type III lesions
(not shown). The W-Beijing strain HN878 produced multi-lobulated type I necrotic lesions
(Figure 5.17B). The strain RD181-3507 continued to predominantly result in heavily necrotic
disorganized type II lesions (not shown). RD181-4147 showed pathology very similar to MTB
Erdman in developing all three types of lesions with a predominance of type I (Figure 5.17D)
and type II lesions. In summary, the clinical strains showed a range in pathology that mainly
153

depends on virulence of the strain, as is observed in the guinea pig model [348]. The highly
virulent strains with high transmission had a rapid acceleration of pathological features with
increased mortality. The lower transmission strains did develop more advanced pathology but the
low inoculums slowed progression.
Figure 5.16. Four weeks post-aerosol infection results in type II necrotic lesion for Erdman, 3507, and HN878 in C3He/FeJ mice. (A, B, and C) At 4 weeks post aerosol infection mice infected with Erdman, 3507, and HN878, respectively, result in predominantly type II lesions 10x. (D) Mice infected with 4147 at 4 weeks post infected predominantly result in type III cellular lesion 10x, (Inset) airway with cellular debris composed of neutrophils 20x
154

Figure 5.17. Six weeks post aerosol infection mice developed advanced lesions with both laboratory and clinical strains. (A) Type I lesion in mice infected with laboratory strain Erdman 4x. (B) Large multilobulated type I lesion from HN878 W-Beijing strain 2x. (C) Loosely formed collagen fibrils from W-Beijing strain HN878 20x. (D) Strain 4147 produced type I lesions at 6 weeks post aerosol infection 4x.
5.3.2.4 Studying the cytokine profiles in the lungs of C3HeB/FeJ mice after infection with
various clinical M. tuberculosis strains
In order to assess whether these differences in growth kinetics and in pathology
progression were also reflected by a difference in cellular immune profiles, we were interested in
measuring the cytokine profiles after infection with the various clinical strains. At the four and
six week time points, 3 mice were sampled from every group for flow cytometry, if mice were
available. Due to the high virulence of the HN878 strain lung samples, were only available for 4
weeks post aerosol infection. Erdman, 3507, and 4147 had samples analyzed for 4 and 6 weeks
post aerosol infection.
155

To obtain a preliminary view of the predominant immune response elicited from each TB
strain, we focused on IFN-γ expression, IL-17 expression, Foxp3+ expressing cells, and Gr1+hi
cell composition profiles (Figure 5.18).
Figure 5.18. Cellular expression profiles of W-Beijing strains show distinct characteristics of each strain. HN878 (red square), highly virulent has high expression of myeloid Gr1+hi only. RD181-4147 (triangle) shows an increase in Foxp3+ and Gr1+ trending toward a repressive cytokine expression. RD181-3507 (upside down triangle) shows a decrease in Foxp3+, an increase in IFN-γ and IL-17, trending toward a more inflammatory profile. Erdman (square) shows a balanced expression of moderate increase of Foxp3+ and an increase in IL-17.
156

These specific cytokines were chosen to study the Th1 IFN-γ response, Th17 protective
response measured by IL-17, T regulator cells measured by Foxp3+, and a myeloid progenitor
marker Gr1+ to measure granulocyte infiltration. The highly virulent, high transmission strain
HN878 had low expression of IFN-γ, IL-17, and low numbers Foxp3+ cells. HN878 had the
highest levels of Gr1+hi (myeloid granulocytes) at 4 weeks than the other strains at either
sacrifice. From 4 weeks to 6 weeks post aerosol infection with either the MTB Erdman, 3507,
and 4147 strains showed a 0.5 log increase in Gr1+hi cells, which is also confirmed
pathologically. There is a large increase in necrotic lesions within the 2-week period for those
strains. The higher virulence of HN878 correlated with decreased Th1 response (lower IFN-γ and
IL-17), increase in T reg cells (Foxp3+) and increase in neutrophil recruitment (Gr1+hi). RD181-
3507 W-Beijing strain has been reported to have low transmission and low virulence in human
and in previous guinea pig models [165]. Based on the C3HeB/FeJ flow cytometry data, there
was a decrease in cells expressing Foxp3+, and a ~0.5 log an increase in IFN-γ and IL-17
expression. Conclusions are confounded by the large standard deviations from the Foxp3 and
IFN-γ levels there may be little and therefore difference in cytokine expression over time is
likely not statistically significant. In general, infection with the RD181-3507 strain showed more
a Th1 expression profile.
RD181-4147 W-Beijing strain is also of the same sublineage as the 3507 strain but had
more moderate growth and infectivity in the guinea pig model. The 4147 strain showed a
cytokine profile that was the converse of the profile seen for the 3507 strain; showing a moderate
increase (~0.2 log) of Foxp3+, a steady expression of IL-17, and a 1 log decrease of cells
expressing IFN-γ. As infection progresses, the strain 4147 showed an increase of Treg and a
decrease of inflammatory cytokines, which could lead to greater uncontrolled bacterial growth.
157

When evaluating the MTB Erdman strain, a slight increase of Foxp3+ expression was
observed with a large standard deviation (Figure 5.18). From 4 weeks to 6 weeks IFN-γ
expression remains steady but also has a large standard deviation and therefore may transition
more over time. IL-17 had a distinct increase of ~0.5log at 6 weeks post aerosol infection.
Overall, the MTB Erdman showed a predominant Th1 response.
The HN878 strain had a highly inflammatory response with high expression of Gr1+hi
and low expression of Foxp3+. RD181-3507 and Erdman have similar Th1 expression profiles of
small inflammatory increase, IFN-γ, Gr1+, and IL-17, and a 0.25 log decrease of suppressor
Foxp3+. Strain RD181-4147 has an increase in Foxp3+ expression and a large granulocyte Gr1+
expression both IFN-γ and IL-17 expression are low.
5.3.3 Results summary and conclusions of infecting C3HeB/FeJ after infection with clinical
Beijing strains
Our goal was to use virulent clinical strains to promote cavitary lesion production in
C3HeB/FeJ mice already capable of developing necrotic granulomas. A range of W-Beijing
strains were chosen, from the highly virulent HN878 to less virulent RD181-3507 strain to allow
for a varied pathological response over a 6 week period after infection. Highly virulent HN878
strain had a neutrophilic response. This was observed by 2 and 4 weeks post aerosol infection
histopathology, the samples had predominantly type II neutrophilic lesions, which correlated
with the highest expression of Gr1+hi at 4 weeks. HN878 was the only strain that had mortality
within 25-40 days post aerosol infection, 8% of the mice were humanely euthanized. Erdman and
RD181-3507 followed a similar pathogenesis. Large standard deviations in IFN-γ and Foxp3+
expression confound the small changes in expression observed in both Erdman and RD181-3507.
158

Both strains have a trend to a Th1 inflammatory profile with an increase in Gr1+hi expression.
The two strains have a similar cytokine profile also have a similar histopathogenesis. Initially,
both strains have early cellular lesions at 2 weeks post aerosol infection, followed by
predominantly type II lesions with the occasional type I necrotic granuloma at 4 weeks. By 6
weeks the infected mice had an intermix of all three lesion types, I, II, and III. RD181-4147 did
not begin to develop type I or type II lesions until 6 weeks post-aerosol infection. At 4 weeks
post aerosol infection mice infected with 4147 had predominantly type III cellular lesions. This
correlated with dramatic 1.0 log decrease of IFN-γ from 4 to 6 weeks post-aerosol infection.
There was also an increase in Foxp3+ with a large standard deviation and an increase in Gr1+hi
expression.
While cavitary lesions were not produced from this pilot trial many new aspects of TB
disease can be learned. This was the first attempt to use clinical strains to infect C3HeB/FeJ
mice. We learned that the hyper-virulent strains are too severe for the highly susceptible mouse
strain and precautions should be taken. We are particularly excited with the results obtained with
the more moderately virulent clinical strains as these could also be used to confirm pre-clinical
drug data from the Kramnik mouse model from laboratory strains. If a drug or drug regimen
would also perform well against a clinical strain in the Kramnik mouse model, this would
increase confidence to advance the drug forward in TB drug development. Also we come away
with the knowledge that each clinical strain has its own unique pathology and immune response
characteristics. It may be more reasonable to adapt the immunological profile of the animal
through siRNA or neutralizing antibodies to create a host environment more amenable to
cavitary disease.
159

5.4 – Overall Summary Chapter 5
In this chapter the overall goal was to change the pathology of the lung lesions in the
C3HeB/FeJ mice by altering the necrotic granuloma: first to resolve the necrotic lesion in order
to enhance treatment, and second to direct the model towards cavitary disease as this reflects
more pathology features from human disease. The necrotic granuloma is difficult to treat, it
encapsulates the majority of the bacteria, and much is still unknown about its formation and core
environment at this time. The goals of this chapter included using a collagen disrupter to attempt
to resolve, at least in part, the granuloma, thereby changing the oxygen and nutrient content,
which may ultimately alter the bacterial metabolic state potentially making them more amenable
to drug treatment. The next goal consisted of using clinical strains to drive the Kramnik mouse
model into producing cavitary lesions, reliably, which would give researchers a resource to
investigate new preclinical drugs against a specific lesion type in a small animal model.
LK as a collagen disruptor does show promise when used as a pre-treatment for a short
duration. Using LK for extended periods of time in an infectious disease, like TB, is problematic
as was observed. The inhibition or break down of collagen deposition in a TB granuloma will not
only allow drugs that have penetration problems into the granuloma, but it also may allow for
bacterial dissemination into previously unaffected lung parenchyma. This upsurge in bacterial
dissemination could then cause a large influx of inflammatory cytokines, which may do more
damage to lung tissue than disease if not controlled by drug treatment. Observationally, the mice
from the LK group, which were humanely euthanized due to severe clinical symptoms, had
exceedingly congested lung tissue compared to other mice euthanized early. The issue of
bacterial dissemination has been raised by others that are using techniques such as neutralizing
160

TNF-α therapy to enhance treatment efficacy [330]. Success was dependent upon aggressive
multi-drug treatment.
The usage of clinical strains to manipulate the granuloma environment of the C3HeB/FeJ
mouse was informative. Each individual clinical strain had a distinct cytokine response despite
all the strains being of the W-Beijing lineage, this information needs to be taken into
consideration when using clinical strains. We observed that C3HeB/FeJ mice infected with
highly virulent strains had increased inflammatory response and increased mortality. The
moderately virulent clinical strains 3507 and 4147 show promise for future to confirm drug
efficacy data already established for laboratory strains. Additional efficacy data may be obtained
from using both 3507 and 4147 since they seem to have opposing immune responses. RD181-
3507 has a predominantly Th1 inflammatory response and RD181-4147 has a more Th2
response with necrotic lesions developing later in infection. These differences can be exploited to
determine the efficacy of drugs and drug regimens on the different infectious cytokine profiles.
Other groups have worked extensively with guinea pigs but due to their sensitivity to broad-
spectrum antibiotics [162, 333]; a mouse model may give more insight into novel drugs activity.
5.5 – FUNDING
This work was supported by The Bill and Melinda Gates Foundation grant ID 1033596
“Evaluation of a New Murine Model Testing Tuberculosis Chemotherapy” at Colorado State
University and National Institute of Allergy and Infectious Disease (NIAID) Indefinite Delivery
Quantity (IDIQ) Task Order HHSN272201000009I/01 “Mouse models for the early stage of lead
drug candidates against mycobacterial species”.
161

CHAPTER 6 – CONCLUDING REMARKS AND FUTURE DIRECTIONS
Mycobacterium tuberculosis (MTB) continues to kill 1.3 million and infects 8.6 million
individuals every year and effective eradication is complicated by the presence of MDR-TB and
XDR-TB. Tuberculosis (TB) patients suffer from wide-ranging disease manifestations that result
in diverse lung pathology. The lung pathology shows highly heterogeneous lesion formation
caused by the bacterium. Lesions in TB patients can present as fibrotic, highly cellular, necrotic,
liquefactive, to cavitary disease. Successful treatment should address all these disease states.
Current preclinical drug development is mostly achieved through the use of the standard mouse
model, C57Bl/6 or Balb/c. These mice develop a chronic infection and have proven be useful in
determining the efficacy of novel preclinical drugs. Other animal models are also being used in
TB research; such as guinea pigs, rabbits, minipigs, and NHP, among other animal models, all of
which can develop necrotic granulomas, which are more similar to human disease. However, of
these larger animal models have their own strengths and weaknesses for preclinical drug
discovery. The guinea pig is highly intolerant to broad-spectrum antibiotics and proactive steps
need to be taken to ensure the health of the animal during treatment. The rabbit and minipig both
regularly develop cavitary disease but are large, cost prohibitive, and it is difficult to acquire the
amount of necessary experimental compound for drug efficacy studies early in drug
development. NHP is by far the most relevant model to human disease, as 30% will become
latently infected; but again they are cost prohibitive and not practical for high throughput testing
of novel compounds. The Kramnik mouse model, using the C3HeB/FeJ mouse strain, shows
lung pathology that is more similar to human disease in pathology when compared to the more
classical mouse models.
162

The C3HeB/FeJ mouse strain is a substrain of the C3H/HeN parental mouse strain and is
highly susceptible to TB. It was determined through forward genetic analysis that the C3HeB/FeJ
substrain was deficient at “the super susceptible to tuberculosis-1” (sst1) locus, which is
responsible for the uncontrolled bacterial growth in the lungs [215]. In the studies discussed here,
we evaluated whether the C3HeB/FeJ strain can add beneficial information to TB drug
development and whether it has a role in the evaluation of new compounds and drug regimens,
host pathology, and the interaction between bacteria and drug.
In a first set of studies, we evaluated whether the C3HeB/FeJ mouse strain would develop
the relevant lung pathology consistently that was previously described to be similar to several
pathology features seen in human TB patients. By means of a low dose aerosol infection of 50-
75 CFU per mouse, we achieved a consistent infection with the presence of well-developed
necrotic lung lesions at 8 weeks post aerosol infection. The resulting lung lesions had an inherent
heterogeneity, which required further investigation. Comprehensive evaluation of multiple
experiments determined three distinct lesion types in lungs of C3HeB/FeJ mice which develop
after a low dose aerosol infection. We defined these lesions as: 1) the type I lesion which is the
classic encapsulated necrotic granuloma, a highly necrotic core with neutrophil dominance and a
fibrotic collagen rim; 2) the type II lesions which shows rapid necrotic alveolitis, consisting of
large numbers of neutrophils and bacteria that congest the alveolar spaces with remnants of the
alveolar septa remaining in the lesion, and 3) a type III lesion which presents itself as a cellular
lesion, consisting of mononuclear cells (lymphocytes/macrophages) and which is similar to the
lesions found in other immunocompetent mouse models.
The development to the three distinct lesion types appears to develop early on, and seems
to not be based on a sequential progression of the disease from lesion type II to lesion type I as
163

we originally thought or as what is seen in other animal models such as the guinea pig [167]. The
type I lesion has a well-defined necrotic core that is surrounded by a rim of collagen that
eventually progresses to a fibrotic capsule surrounding the lesion. Even early on (6 weeks post
infection), the initial development of this well-structured, controlled lesion type can be
visualized. On the inside of the collagen rim, we see a multicellular layer of distinct foamy
macrophages. More closely to the core of the lesion there is evidence of recent necrotic
(karyorrhectic) neutrophils, where in the core only cellular debris without any cellular
distinctions can be seen. C3HeB/FeJ mice are infected with MTB, they develop other lesions
than a type I lesion and it became clear these other lesions were indicative of an alternative
immune pathway in the host. An early lesion, which is largely composed of lymphocytes as well
as macrophages, will progress further into a type III lesion, resembling closely the lesions types
found in immunocompetent mouse strains. It is then also not surprising that this type III lesion is
best controlled by the immune response and has low bacterial numbers. On the other hand, when
lesions have a higher neutrophil content early on, these progress to either a type I or II lesion.
The factors that determine the differentiation between type I or type II lesions are unknown at
this time, but could be the rate of the neutrophilic influx and time for the host to respond. We
speculate the difference in lesion development may be due to the variation in genetic distribution
in the animals. The functional gene within the sst-1 locus encompasses a region known for being
highly repetitive, the HSR (homogenously stained region repeat), and chromosome 1 has
approximately 40 copies of the HSR. The high copy number may have a high number of
incomplete copies or a heterogeneous distribution of the sst-1 in the mice that predominantly
develop type III lesions. This heterogeneity of lesion development and overall survival is also
seen in the CBA/J model of MTB [178] and DBA/2 model of avian influenza [349]. To evaluate
164

this hypothesis genetic analysis could be used, such as RT-PCR, to determine the functional sst-1
copy number in mice that develop type I, II and III lesions.
Due to the inherent finality of our studies (using terminal sacrifice to collect tissues), it is
difficult to establish the trajectory of the progression of the disease towards the specific lesion
types. Advanced imaging techniques could be used to track the advancement of lesions
throughout infection in the same animals. Imaging such as x-ray imaging, magnetic resonance
imaging (MRI) and positron emission topography (PET) are all successful techniques used in
tracking lesion size and location in mice and other species for MTB and other diseases.
Currently, x-ray has been used to track disease modeling in goats aerosol infected with
Burkholderia pseudomallei [350] and TB infection in humans and NHP [171]. Decades ago, x-
ray technology was used to determine the relationship of TB lesion and lung distribution from ex
vivo guinea pig lungs, which for instance demonstrated that similar to humans, guinea pig lesions
also developed in the apical lung lobes [351]. Comparing the ability of x-ray and MRI to detect
early lesions in rhesus macaques infected with a range of bacterial inocula, it was determined
MRI was more sensitive. MRI was used to detect lesions prior to onset of clinical manifestations
[171]. PET has been used detect and monitor TB disease and treatment through [18F]fluoro-
dexyglucose activity in the tissue in mice, rabbits, NHP and humans but has a detection limit for
lesions greater than 1mm [200, 352-355]. Recently, Jain et al. has adapted the technology to use
a radiolabeled ligand with higher specificity than [18F]. The translocator protein (TSPO) with
radiolabeled DPA-713, [25I]iodo-DPA-713, is highly expressed in the lung and specifically in
macrophages during inflammation. This marker has shown great promise in mice for early lesion
detection, as it is able to detect smaller lesions in mice within 3 weeks of infection [353].
165

Imaging techniques in conjunction with immunological assays may allow us a greater
understanding of the various lesion types in disease over time in the same animal.
For drug development purposes, drug efficacy of a novel compound requires sufficient
drug exposure at the site of infection, where the bacteria are located. By means of several acid-
fast staining techniques, we located the various bacterial locations within the lung lesions
throughout infection in the Kramnik mouse model. By comparing the results of diverse staining
techniques it became clear that the majority of bacilli are located in the type I and type II lesions.
Commonly used stains such as kinyoun carbol-fuchsin and AR revealed large numbers of
bacteria within the foamy macrophages and within the necrotic core of the granuloma. Once the
lesions expand over time the lesions can coalesce into one large lesion. With several acid-fast
stains we were able to locate intra-as well as extracellular bacterial populations within the type I
lesion. The foamy macrophages are heavily infected with bacteria and seem to be permissive to
bacterial replication and/or persistence. In the core, high bacterial numbers can be visualized
extracellularly within the cellular debris. With the clinically used acid-fast stains, the bacterial
population in the center of the core showed to be less fluorescent which we speculate is
indicative of a bacterial metabolic change. In addition, some intracellular bacteria are present in
the functional macrophages on the outside of the collagen rim. However, these bacterial numbers
seem to be low when compared to the numbers observed in the core and foamy macrophage
layer. At the current time, the exact proportion of intracellular versus extracellular in the lungs of
the C3HeB/FeJ mice is difficult to quantify. As these are important questions to answer in terms
of drug development, future experiments using the Nikon software could be used to quantify the
staining intensity and enumerate the extracellular bacteria numbers within the necrotic
granuloma and intracellular bacteria in foamy macrophages that surround the type I lesion. In the
166

type II lesions, the majority of bacteria were found extracellularly within neutrophilic debris in
the remnants of the alveolar spaces of the lung parenchyma. The high numbers of neutrophils in
these lesions is remarkable. Generally neutrophils are short-lived but the high neutrophil
numbers suggest that they might be non-functional and persistent. To account for this high
number, it also not clear whether there is initially replication of the neutrophils are whether
throughout disease there is continuous recruitment of these cells to the core of the lesions. The
latter is suggested by some preliminary microscopic analysis whereby neutrophils are being
observed to enter type I lesions through the collagen fibrils. More recent evidence shows the
importance of neutrophils in human disease [265]. Barry et al, have shown that neutrophils are
the predominant cell type with intracellular bacteria from broncho alveolar lavage and sputum
samples. We further speculate that the neutrophils may be behaving similarly as infected
macrophages. Evidence has shown when macrophages are infected with MTB there is an
upregulation in factors that inhibit apoptosis, promote necrosis, and allow the bacteria to evade
elimination and promote bacterial growth [259]. When in the macrophage MTB suppresses
PGE2, which has non-inflammatory function, and increases LXA4, which is a pro-necrotic factor,
the macrophage will undergo necrosis [356]. In order to study these aspects in neutrophils, the
expression of PGE2, LXA4, and other factors that inhibit apoptosis, such as BAX and BAK could
be studied, and the sustainability and functionality of the neutrophils examined. Also studying
the neutrophilic response by modulating and timing of the influx of neutrophils in the Kramnik
mouse model could initiate a new line of research reflective of human disease [308, 357].
Staining with the AR acid-fast protocol showed a distinct lack of stained bacteria in the
most centralized center of the necrotic granuloma. At this time the exact target of the AR stain is
unknown but early results suggest that this a cell wall component of the mycobacteria (personal
167

communication, Dr. Dean Crick). This lack of staining in the center of the necrotic core suggests
that the bacterial target is either masked (e.g. by thickening of cell wall as has been described,
[358]) or might not be expressed under the environmental conditions where the bacteria are
located. In the center of the lesion core it is believed to be hypoxic, low in nutrients, and
containing mostly cellular debris which could render the bacteria in a transcriptionally altered
persistent state. A major part of this work was performed with a novel acid-fast staining method
from our laboratory, the Sybr Gold acid-fast stain which binds to nucleic acids. Sybr Gold
staining is highly sensitive able to reliably stain 99% of in vitro cultures (Ryan et al., submitted).
It was shown to have greater long-term stability and less overall background fluorescence. Sybr
Gold staining showed the presence of acid-fast positive bacteria within the necrotic core of serial
histopathology sections that AR was unable to detect. Sybr Gold staining in the core was also not
as bright as for the bacteria within the foamy macrophages on a per bacterium basis. We
speculate bacteria within the foamy macrophages are/were actively replicating in permissive
hosts, with a nutrient supply from lipids provided by the macrophage. While bacteria within the
necrotic core are less likely to replicate and are rather in a persistent state, exposed to anoxia,
nutrient starvation, and oxidative stress. Therefore the mycolic acids in the persistent might be
packed differently and more difficult to bind.
The use of immunological tools have helped the TB field tremendously in understanding
the key cytokines and other immune molecules that have a pro-inflammatory (Th1) or a anti-
inflammatory role (Th2) in the progression of disease. We utilized this knowledge to determine
the immune microenvironment of the lung and of specific lesion types in the lungs of the
C3HeB/FeJ mouse model at late stages of infection. Preliminary examination of inflammatory
cytokines and IHC staining analyzed the immune environment of the encapsulated type I
168

necrotic granuloma. With the CBA, we showed in the whole lung a predominant pro-
inflammatory response observed by an increased expression of monocyte chemoattractant
protein-1 (MCP-1, CCL2), interferon-gamma (IFN-γ), tumor necrosis factor-alpha (TNF-α),
interleukin-6 (IL-6), and interleukin-10 (IL-10) cytokines. This increased expression was more
predominant in the excised necrotic granuloma; high levels of cytokines IL-6, TNF-α, and
chemokine MCP-1 were observed. The CBA showed higher levels of IFN-γ in non-
granulomatous lung and whole lung tissue. IL-10, an immune dampening cytokine, showed high
levels of expression in the excised granuloma. The IHC staining data correlated nicely with the
CBA results and determined that the IL-10 expression was nearly exclusive to the foamy
macrophages within the necrotic granuloma. These foamy macrophages also house high bacterial
numbers, potentially due to dampened immune response. Markers that are specific for functional
macrophages, such as F4/80 and lysozyme, show distinct cellular locations directly outside of the
foamy macrophage rim of the necrotic granuloma. F4/80 staining shows a sharp delineation of
positive cells outside of the foamy macrophage layer the necrotic granuloma. The foamy
macrophages from all three lesions types were negative for F4/80 staining. Lysozyme, an
enzyme that is constitutively expressed by activated macrophages, was also not expressed by
foamy macrophages indicating a lack of (phagocytic) activity. The results of the CBA and the
IHC showed a specific cellular composition and cytokine expression profile for the type I
necrotic granuloma creating a distinct local microenvironments. The production of specific
cytokines may be driven by the bacteria themselves, we speculate the bacteria within the foamy
macrophages may be creating an environment inclined to produce IL-10 that dampens
inflammatory cytokines allowing for growth and survival. In vitro analysis of IL-10 and
lysozyme production from pre-infected and post-infected macrophages to determine the
169

transition from pro-inflammatory to anti-inflammatory cytokine profile may be useful in
establishing the bacilli role.
The knowledge of the specific immune environment could also be useful in
immunotherapy which when combined with classical drug treatment has been hypothesized to
augment treatment regimens. Various research groups are currently exploring this option by
using immunomodulators, small interfering RNA (siRNA), corticosteroids, and non-steroidal
anti-inflammatory drugs [359]. The use of siRNA treatments of specific cytokines for instance
may be useful in preventing or resolving the formation of the necrotic granuloma thereby
allowing for more effective treatment [360]. Corticosteroids reduce inflammation and fibrosis,
and have been used as beneficial adjunctive therapy for TB [361, 362]. Ibuprofen and aspirin
have shown to enhance the activity of PZA in MTB infected mice and reduce lung pathogenesis
[363]. Promising work is already being achieved with anti-TNF-α in combination with multidrug
therapy in C3HeB/FeJ mice by Johns Hopkins University [330] and adding IL-10 to reduce
inflammatory cytokine expression at key points during infection have been shown to regulate the
formation of the granuloma in CBA/J mice [78]. Reducing MCP-1 levels may change the
cellular composition of the granuloma and prevent the development of a large, permissive
reservoir of foamy macrophages for intracellular bacterial replication.
The described pathological features of the Kramnik mouse model make it an appropriate
model to investigate further for preclinical drug evaluation purposes. The ultimate goal of the
model is to study drugs and drug regimen in a mouse model with advanced pathology in order
reproduce human drug trial results more accurately. Initial studies using single drug treatments
demonstrate that the C3HeB/FeJ mouse strain has generally a more refractory response to most
drugs. Importantly, compounds such as INH and RIF rapidly kill the majority of bacteria in the
170

first two weeks, but it takes months to kill the remaining persisting bacteria. PZA shows to be
less effective in the Kramnik mouse model where it is highly effective in the Balb/c mouse
model. Interestingly, PZA shows more activity in some Kramnik mice than others within the
same treatment group. We speculate that PZA is less effective against those mice that show
mostly type I lesions.
Currently in our laboratory, there are multiple drug studies being conducted using the
C3HeB/FeJ mice examining more experimental single drug treatments and drug combinations.
These also include the recapitulation of clinical trial data, such as the REMOX trial in the
Kramnik mouse model. In the ongoing REMOX clinical trial, the role of a fluoroquinolone,
MXF, is being studied in the standard regimen for drug susceptible TB whereby MXF is
replacing INH, or is replacing EMB in the standard combination treatment of MTB. In both the
Kramnik mouse model and Balb/c mice, the bactericidal activity of MXF-containing regimens
was similar as this of the standard regimen in both mouse strains, whereas for the relapse studies
the MXF-containing regimens showed to be superior to the standard regimen and again for both
mouse strains.
Recently, novel therapeutics (Bedaquiline [10], PA-824 [364]) and those of renewed
interested (Clofazimine [365]) have been evaluated in human EBA trials conducted by the
Global Alliance of TB Drug Development in NC-002 (published) and NC-003 (recent data,
presented at World Lung Health meeting Oct. 2013). One of the most important findings of the
NC-003 clinical trial was the lack of activity of CFZ alone and when added to other drugs (such
as PA-824, BDQ) in the two-week clinical trial. A clinical EBA trial is only assessing the
activity of a novel drug in sputum samples during the first two weeks of treatment, and therefore
the sterilizing activity after long-term exposure is not being studied in such a trial. However, the
171

lack of activity was in fact recapitulated in the Kramnik mouse model, where CFZ showed no to
little activity alone as well as in combination with BDQ, and this in contrast to seeing strong
activity in the classical Balb/c mouse model. At this point, further investigation is being
conducted to try and understand the lack of activity. Our current hypotheses are twofold: CFZ
may be unable to penetrate the necrotic granuloma or the state of bacilli and environment are
unresponsive to CFZ treatment. We have preliminary data that shows that both hypotheses might
be responsible for the lack of CFZ activity. This new data evaluating CFZ in the Kramnik mouse
model affirms the potential benefit for a model that represents the human disease condition The
Kramnik mouse model could be an additional tool that can answer focused questions and
increase the confidence of a drug or identified drug regimen prior to advancing into a human
trial.
The bacterial tolerance to drug treatment has become an area of contention as to the
cause. We consider that the inability of AR stain to detect specific bacteria within the necrotic
core and the inability of specific drugs to penetrate the type I granuloma are indicative of the
environment within the inner core. The MTB are undergoing drastic physiological changes
within the necrotic type I granuloma due to the environment. There is evidence to suggest there
is an increase in mutation rate due to DNA damage from oxidative stress from the necrotic core
[243]. In the Kramnik mouse model the large population of macrophages and we speculate the
subsequent production of iNOS may be partially responsible for contributing to the hostile
mutagenic environment. This could be determined by measuring the functional NOS production
of infected macrophages from C3HeB/FeJ mice.
The unique pathology of the Kramnik mouse model make the C3HeB/FeJ mouse strain a
useful resource for exploring a plethora of alternative approaches to treatment. An example of
172

this is reflected by our pilot study conducted with the pharmaceutical company Merrimack
Pharmaceuticals Inc., specialized in oncology treatments, using a liposomal drug delivery system
for tuberculosis. The preliminary work conducted with the company, is the start of a larger
project, which aims to explore how the physical environment of the necrotic granuloma, which is
remarkably similar to solid cancerous tumors, can be exploited to enhance treatment of MTB.
Preliminary results, which mainly focused on the type I lesions so far, show active tracking of
fluorescently labeled liposomal formulations to the functional macrophages on the outside of the
collagen rim as well as in the foamy macrophages on the inside of the collagen capsule. Cursory
evaluation with confocal microscopy showed that the liposomal nanoparticles appear to cross to
some extent the collagen fibrils into the foamy macrophages, which contain high numbers of
bacteria. However, most liposomal accumulation could be observed on the outside of the fibrous
capsule within the functional macrophages. More confocal analysis is required on a larger
sample size as well as expanding the results to other lesion types. At this early stage in the
project, one drawback encountered by our studies is the overall rapid clearance of the liposomes
primarily in infected animals. The liposomal nanoparticles used have a specific pegylated
makeup and this may actually make the liposomes a target for increased phagosomal digestion.
Currently, pharmacokinetic evaluations are being performed on a library of various liposomal
formulations to delay phagosome uptake of the liposomes. In a coordinated effort, investigation
of the hypothesis is ongoing that due to infection, activated macrophages and other immune cells
more readily take up and destroy the liposomes is also being performed.
Further experimentation involving the liposomal nanoparticles is to assess drug efficacy
of drug-encapsulated nanoparticles and compare this to free drug. A mouse drug study is
currently ongoing in our laboratory that is evaluating a first liposomal formulation that
173

encapsulates a TB drug in order to evaluate its efficacy when given intermittently and compare
to the efficacy of the free drug when given daily. As the liposomal formulations are to be
administered by injection route, the practical implications of this approach remain to be seen.
The goal of the nanoparticles is therefore aimed to drastically reduce treatment duration, from
several months to weeks with direct delivery of drug with sufficient accumulation at the site of
infection. These liposomal formulations could also be applied for other difficult to treat
infectious diseases, such as Pseudomonas aeruginosa, which is a biofilm forming bacterium that
is a tremendous problem for the medical field by contaminating equipment thereby infecting
patients. A directed, high dose of medication could potentially result in faster treatments and
reduced resistance.
Another alternative approach to the classical tuberculosis treatment is to improve lung
pathology to increase drug exposure at the site of infection. Disruptors of the physical barrier,
which is the fibrous capsule of the necrotic lesion, could be a viable alternative to facilitate drug
therapy. Elegant work by Dartois, et al. looking at drug penetration has shown by MALDI
imaging of rabbit lesions infected with MTB, that MXF accumulates mainly in macrophages on
the outside of the necrotic lesions and that less drug reaches the cores of these lesions. A pilot
study has been performed with the Kramnik mouse model by V. Dartois (Rutgers Institute, NJ)
using MALDI imaging, showed very similar results for CFZ. As discussed above, an
improvement of the pathology may be achieved with immuno-modulators but could potentially
also be achieved with, for instance, anti-fibrolitics currently on the market. A pilot study was
performed to assess the potential of LK as a collagen disruptor. LK is currently clinically being
used as an anti-fibrolitic agent in cases of idiopathic pulmonary fibrosis, liver cirrhosis, and
myocardial fibrosis. When LK was used as a pre-treatment, prior to treatment with MXF, we saw
174

some added activity when compared to MXF alone. There were however some technical issues
with the experiment regarding dosages of the LK compound and high mortality rate of mice. A
longer-term treatment of mice with established infection with an adjusted dose of LK might give
the answer. In addition other anti-fibrolitic compounds could be included in the follow-up study,
such as pirfenidone [366]. This compound has shown clinical success in the treatment of
idiopathic pulmonary fibrosis. This goal could also be accomplished with techniques used in
oncology, such as the judicious addition of VEG-F to restore proper vasculature to the hypoxic
necrotic granuloma to allow for better drug penetration [367].
In summary, the Kramnik mouse model is an exciting new mouse model. The
C3HeB/FeJ mouse strain has gained considerable interest throughout the field and is based on I.
Kramnik’s work and ours being utilized by researchers around the globe to study many facets of
TB disease. Pathologically, it is more representative of tuberculosis disease and this allows us to
explore the cellular composition, immunological function, bacterial status and location, response
to drug treatment, and alternatives to traditional therapy on a large scale. Substantial research has
been done on the optimization of the TB infected C3HeB/FeJ mouse model itself but there are
many research areas of MTB that still need further investigation, such as those outlined in this
chapter. The Kramnik mouse model may be instrumental in answering lingering questions and
furthering our knowledge about TB in man.
175

CITED REFERENCES
1. Parrish, N.M., J.D. Dick, and W.R. Bishai, Mechanisms of latency in Mycobacterium tuberculosis. Trends Microbiol, 1998. 6(3): p. 107-12.
2. WHO, Global Tuberculosis Report. 2013: Geneva. 3. WHO, Implementing The Stop TB Strategy: A handbook for national tuberculosis control
programmes. 2008: Geneva. 4. WHO, Tuberculosis Fact Sheet. 2013. 5. WHO, Global Tuberculosis Report. 2009: Geneva. 6. Velayati, A.A., et al., Emergence of new forms of totally drug-resistant tuberculosis
bacilli: super extensively drug-resistant tuberculosis or totally drug-resistant strains in iran. Chest, 2009. 136(2): p. 420-5.
7. Velayati, A.A., P. Farnia, and M.R. Masjedi, The totally drug resistant tuberculosis (TDR-TB). Int J Clin Exp Med, 2013. 6(4): p. 307-9.
8. Klopper, M., et al., Emergence and spread of extensively and totally drug-resistant tuberculosis, South Africa. Emerg Infect Dis, 2013. 19(3): p. 449-55.
9. Gras, J., Bedaquiline for the treatment of pulmonary, multidrug-resistant tuberculosis in adults. Drugs Today (Barc), 2013. 49(6): p. 353-61.
10. Grosset, J.H. and N.C. Ammerman, Dose-ranging activity of the newly registered antituberculosis drug bedaquiline (TMC207). Expert Rev Anti Infect Ther, 2013. 11(7): p. 649-51.
11. Dannenberg, A.M. and American Society for Microbiology. Pathogenesis of human pulmonary tuberculosis : insights from the rabbit model. 2006; xiv, 453 p.].
12. MacMicking, J.D., Recognizing macrophage activation and host defense. Cell Host Microbe, 2009. 5(5): p. 405-7.
13. Rohde, K., et al., Mycobacterium tuberculosis and the environment within the phagosome. Immunol Rev, 2007. 219: p. 37-54.
14. Russell, D.G., et al., Foamy macrophages and the progression of the human tuberculosis granuloma. Nat Immunol, 2009. 10(9): p. 943-8.
15. Kaufmann, S.H., Protection against tuberculosis: cytokines, T cells, and macrophages. Ann Rheum Dis, 2002. 61 Suppl 2: p. ii54-8.
16. Kolls, J.K., CD4(+) T-cell subsets and host defense in the lung. Immunol Rev, 2013. 252(1): p. 156-63.
17. Gil, O., et al., Granuloma encapsulation is a key factor for containing tuberculosis infection in minipigs. PLoS One, 2010. 5(4): p. e10030.
18. Guirado, E. and L.S. Schlesinger, Modeling the Mycobacterium tuberculosis Granuloma - the Critical Battlefield in Host Immunity and Disease. Front Immunol, 2013. 4: p. 98.
19. Russell, D.G., et al., Mycobacterium tuberculosis wears what it eats. Cell Host Microbe, 2010. 8(1): p. 68-76.
20. Saunders, B.M. and W.J. Britton, Life and death in the granuloma: immunopathology of tuberculosis. Immunol Cell Biol, 2007. 85(2): p. 103-11.
21. Zhang, Y., Advances in the treatment of tuberculosis. Clin Pharmacol Ther, 2007. 82(5): p. 595-600.
22. Bigger, J.W., Treatment of staphylococcal infections with penicillin - By intermittent sterilisation. Lancet, 1944. 2: p. 497-500.
176
23. Zhang, Y., W.W. Yew, and M.R. Barer, Targeting persisters for tuberculosis control. Antimicrob Agents Chemother, 2012. 56(5): p. 2223-30.
24. Phuah, J.Y., et al., Activated B cells in the granulomas of nonhuman primates infected with Mycobacterium tuberculosis. Am J Pathol, 2012. 181(2): p. 508-14.
25. Barry, C.E., 3rd, et al., The spectrum of latent tuberculosis: rethinking the biology and intervention strategies. Nat Rev Microbiol, 2009. 7(12): p. 845-55.
26. Lin, P.L. and J.L. Flynn, Understanding latent tuberculosis: a moving target. J Immunol, 2010. 185(1): p. 15-22.
27. Gengenbacher, M. and S.H. Kaufmann, Mycobacterium tuberculosis: success through dormancy. FEMS Microbiol Rev, 2012. 36(3): p. 514-32.
28. Gomez, J.E. and J.D. McKinney, M. tuberculosis persistence, latency, and drug tolerance. Tuberculosis (Edinb), 2004. 84(1-2): p. 29-44.
29. Wayne, L.G. and L.G. Hayes, An in vitro model for sequential study of shiftdown of Mycobacterium tuberculosis through two stages of nonreplicating persistence. Infect Immun, 1996. 64(6): p. 2062-9.
30. Ehlers, S., Immunity to tuberculosis: a delicate balance between protection and pathology. FEMS Immunol Med Microbiol, 1999. 23(2): p. 149-58.
31. Hobby, G.L., K. Meyer, and E. Chaffee, Observations on the mechanism of action of penicillin. Proc soc. exp. biol. med, 1942. 50: p. 281-285.
32. McDermott, W., et al., Isonicotinic acid hydrazide in tuberculosis in man. Trans Assoc Am Physicians, 1952. 65: p. 191-202.
33. Wakamoto, Y., et al., Dynamic persistence of antibiotic-stressed mycobacteria. Science, 2013. 339(6115): p. 91-5.
34. Li, Y. and Y. Zhang, PhoU is a persistence switch involved in persister formation and tolerance to multiple antibiotics and stresses in Escherichia coli. Antimicrob Agents Chemother, 2007. 51(6): p. 2092-9.
35. Luidalepp, H., et al., Age of inoculum strongly influences persister frequency and can mask effects of mutations implicated in altered persistence. J Bacteriol, 2011. 193(14): p. 3598-605.
36. Ma, M.J., et al., Toll-like receptors, tumor necrosis factor-alpha, and interleukin-10 gene polymorphisms in risk of pulmonary tuberculosis and disease severity. Hum Immunol, 2010. 71(10): p. 1005-10.
37. Chen, K. and J.K. Kolls, T cell-mediated host immune defenses in the lung. Annu Rev Immunol, 2013. 31: p. 605-33.
38. Khader, S.A., et al., IL-23 is required for long-term control of Mycobacterium tuberculosis and B cell follicle formation in the infected lung. J Immunol, 2011. 187(10): p. 5402-7.
39. Woodworth, J.S. and S.M. Behar, Mycobacterium tuberculosis-specific CD8+ T cells and their role in immunity. Crit Rev Immunol, 2006. 26(4): p. 317-52.
40. Flynn, J.L. and J. Chan, Immunology of tuberculosis. Annu Rev Immunol, 2001. 19: p. 93-129.
41. Mogues, T., et al., The relative importance of T cell subsets in immunity and immunopathology of airborne Mycobacterium tuberculosis infection in mice. J Exp Med, 2001. 193(3): p. 271-80.
42. Pearl, J.E., et al., Inflammation and lymphocyte activation during mycobacterial infection in the interferon-gamma-deficient mouse. Cell Immunol, 2001. 211(1): p. 43-50.
177

43. Cooper, A.M., Cell-mediated immune responses in tuberculosis. Annu Rev Immunol, 2009. 27: p. 393-422.
44. Cooper, A.M., et al., Disseminated tuberculosis in interferon gamma gene-disrupted mice. J Exp Med, 1993. 178(6): p. 2243-7.
45. Getahun, H., et al., HIV infection-associated tuberculosis: the epidemiology and the response. Clin Infect Dis, 2010. 50 Suppl 3: p. S201-7.
46. Kalsdorf, B., et al., HIV-1 infection impairs the bronchoalveolar T-cell response to mycobacteria. Am J Respir Crit Care Med, 2009. 180(12): p. 1262-70.
47. Mukadi, Y., et al., Spectrum of immunodeficiency in HIV-1-infected patients with pulmonary tuberculosis in Zaire. Lancet, 1993. 342(8864): p. 143-6.
48. Geldmacher, C., et al., Preferential infection and depletion of Mycobacterium tuberculosis-specific CD4 T cells after HIV-1 infection. J Exp Med, 2010. 207(13): p. 2869-81.
49. Geldmacher, C., et al., Early depletion of Mycobacterium tuberculosis-specific T helper 1 cell responses after HIV-1 infection. J Infect Dis, 2008. 198(11): p. 1590-8.
50. Flynn, J.L., et al., Non-human primates: a model for tuberculosis research. Tuberculosis (Edinb), 2003. 83(1-3): p. 116-8.
51. Tufariello, J.M., J. Chan, and J.L. Flynn, Latent tuberculosis: mechanisms of host and bacillus that contribute to persistent infection. Lancet Infect Dis, 2003. 3(9): p. 578-90.
52. Flynn, J.L., et al., An essential role for interferon gamma in resistance to Mycobacterium tuberculosis infection. J Exp Med, 1993. 178(6): p. 2249-54.
53. Lenaerts, A.J., et al., Rapid in vivo screening of experimental drugs for tuberculosis using gamma interferon gene-disrupted mice. Antimicrob Agents Chemother, 2003. 47(2): p. 783-5.
54. McDonough, K.A., Y. Kress, and B.R. Bloom, The interaction of Mycobacterium tuberculosis with macrophages: a study of phagolysosome fusion. Infect Agents Dis, 1993. 2(4): p. 232-5.
55. Orme, I.M., et al., Cytokine secretion by CD4 T lymphocytes acquired in response to Mycobacterium tuberculosis infection. J Immunol, 1993. 151(1): p. 518-25.
56. Cooper, A.M. and S.A. Khader, The role of cytokines in the initiation, expansion, and control of cellular immunity to tuberculosis. Immunol Rev, 2008. 226: p. 191-204.
57. Chan, J. and J. Flynn, The immunological aspects of latency in tuberculosis. Clin Immunol, 2004. 110(1): p. 2-12.
58. MacMicking, J.D., et al., Identification of nitric oxide synthase as a protective locus against tuberculosis. Proc Natl Acad Sci U S A, 1997. 94(10): p. 5243-8.
59. Nathan, C. and M.U. Shiloh, Reactive oxygen and nitrogen intermediates in the relationship between mammalian hosts and microbial pathogens. Proc Natl Acad Sci U S A, 2000. 97(16): p. 8841-8.
60. Cooper, A.M., et al., Interleukin 12 (IL-12) is crucial to the development of protective immunity in mice intravenously infected with mycobacterium tuberculosis. J Exp Med, 1997. 186(1): p. 39-45.
61. Khader, S.A., et al., Interleukin 12p40 is required for dendritic cell migration and T cell priming after Mycobacterium tuberculosis infection. J Exp Med, 2006. 203(7): p. 1805-15.
62. Cooper, A.M., K.D. Mayer-Barber, and A. Sher, Role of innate cytokines in mycobacterial infection. Mucosal Immunol, 2011. 4(3): p. 252-60.
178

63. Orme, I.M. and A.M. Cooper, Cytokine/chemokine cascades in immunity to tuberculosis. Immunol Today, 1999. 20(7): p. 307-12.
64. Khader, S.A., et al., IL-23 compensates for the absence of IL-12p70 and is essential for the IL-17 response during tuberculosis but is dispensable for protection and antigen-specific IFN-gamma responses if IL-12p70 is available. J Immunol, 2005. 175(2): p. 788-95.
65. Ulrichs, T. and S.H. Kaufmann, Mycobacterial persistence and immunity. Front Biosci, 2002. 7: p. d458-69.
66. Botha, T. and B. Ryffel, Reactivation of latent tuberculosis infection in TNF-deficient mice. J Immunol, 2003. 171(6): p. 3110-8.
67. Chakravarty, S.D., et al., Tumor necrosis factor blockade in chronic murine tuberculosis enhances granulomatous inflammation and disorganizes granulomas in the lungs. Infect Immun, 2008. 76(3): p. 916-26.
68. Fenhalls, G., et al., In situ detection of Mycobacterium tuberculosis transcripts in human lung granulomas reveals differential gene expression in necrotic lesions. Infect Immun, 2002. 70(11): p. 6330-8.
69. Flynn, J.L., et al., Tumor necrosis factor-alpha is required in the protective immune response against Mycobacterium tuberculosis in mice. Immunity, 1995. 2(6): p. 561-72.
70. Redford, P.S., P.J. Murray, and A. O'Garra, The role of IL-10 in immune regulation during M. tuberculosis infection. Mucosal Immunol, 2011. 4(3): p. 261-70.
71. Beamer, G.L., et al., Interleukin-10 promotes Mycobacterium tuberculosis disease progression in CBA/J mice. J Immunol, 2008. 181(8): p. 5545-50.
72. Higgins, D.M., et al., Lack of IL-10 alters inflammatory and immune responses during pulmonary Mycobacterium tuberculosis infection. Tuberculosis (Edinb), 2009. 89(2): p. 149-57.
73. Jung, Y.J., et al., Increased interleukin-10 expression is not responsible for failure of T helper 1 immunity to resolve airborne Mycobacterium tuberculosis infection in mice. Immunology, 2003. 109(2): p. 295-9.
74. North, R.J., Mice incapable of making IL-4 or IL-10 display normal resistance to infection with Mycobacterium tuberculosis. Clin Exp Immunol, 1998. 113(1): p. 55-8.
75. Redford, P.S., et al., Enhanced protection to Mycobacterium tuberculosis infection in IL-10-deficient mice is accompanied by early and enhanced Th1 responses in the lung. Eur J Immunol, 2010. 40(8): p. 2200-10.
76. Roach, D.R., et al., Endogenous inhibition of antimycobacterial immunity by IL-10 varies between mycobacterial species. Scand J Immunol, 2001. 54(1-2): p. 163-70.
77. Turner, J., et al., In vivo IL-10 production reactivates chronic pulmonary tuberculosis in C57BL/6 mice. J Immunol, 2002. 169(11): p. 6343-51.
78. Cyktor, J.C., et al., IL-10 inhibits mature fibrotic granuloma formation during Mycobacterium tuberculosis infection. J Immunol, 2013. 190(6): p. 2778-90.
79. O'Leary, S., M.P. O'Sullivan, and J. Keane, IL-10 blocks phagosome maturation in mycobacterium tuberculosis-infected human macrophages. Am J Respir Cell Mol Biol, 2011. 45(1): p. 172-80.
80. Shaw, T.C., L.H. Thomas, and J.S. Friedland, Regulation of IL-10 secretion after phagocytosis of Mycobacterium tuberculosis by human monocytic cells. Cytokine, 2000. 12(5): p. 483-6.
81. Rollins, B.J., Chemokines. Blood, 1997. 90(3): p. 909-28.
179

82. Sadek, M.I., et al., Chemokines induced by infection of mononuclear phagocytes with mycobacteria and present in lung alveoli during active pulmonary tuberculosis. Am J Respir Cell Mol Biol, 1998. 19(3): p. 513-21.
83. Kipnis, A., et al., Role of chemokine ligand 2 in the protective response to early murine pulmonary tuberculosis. Immunology, 2003. 109(4): p. 547-51.
84. Hasan, Z., et al., CCL2 responses to Mycobacterium tuberculosis are associated with disease severity in tuberculosis. PLoS One, 2009. 4(12): p. e8459.
85. Kendall, S.L., et al., What do microarrays really tell us about M. tuberculosis? Trends Microbiol, 2004. 12(12): p. 537-44.
86. Marrero, J., et al., Gluconeogenic carbon flow of tricarboxylic acid cycle intermediates is critical for Mycobacterium tuberculosis to establish and maintain infection. Proc Natl Acad Sci U S A, 2010. 107(21): p. 9819-24.
87. Schnappinger, D., et al., Transcriptional Adaptation of Mycobacterium tuberculosis within Macrophages: Insights into the Phagosomal Environment. J Exp Med, 2003. 198(5): p. 693-704.
88. Bloch, H. and W. Segal, Biochemical differentiation of Mycobacterium tuberculosis grown in vivo and in vitro. J Bacteriol, 1956. 72(2): p. 132-41.
89. Eoh, H. and K.Y. Rhee, Multifunctional essentiality of succinate metabolism in adaptation to hypoxia in Mycobacterium tuberculosis. Proc Natl Acad Sci U S A, 2013. 110(16): p. 6554-9.
90. Munoz-Elias, E.J. and J.D. McKinney, Mycobacterium tuberculosis isocitrate lyases 1 and 2 are jointly required for in vivo growth and virulence. Nat Med, 2005. 11(6): p. 638-44.
91. Lorenz, M.C. and G.R. Fink, Life and death in a macrophage: role of the glyoxylate cycle in virulence. Eukaryot Cell, 2002. 1(5): p. 657-62.
92. Vanni, P., et al., Comparative structure, function and regulation of isocitrate lyase, an important assimilatory enzyme. Comp Biochem Physiol B, 1990. 95(3): p. 431-58.
93. Sharma, V., et al., Structure of isocitrate lyase, a persistence factor of Mycobacterium tuberculosis. Nat Struct Biol, 2000. 7(8): p. 663-8.
94. McKinney, J.D., et al., Persistence of Mycobacterium tuberculosis in macrophages and mice requires the glyoxylate shunt enzyme isocitrate lyase. Nature, 2000. 406(6797): p. 735-8.
95. Blumenthal, A., et al., Simultaneous analysis of multiple Mycobacterium tuberculosis knockdown mutants in vitro and in vivo. PLoS One, 2010. 5(12): p. e15667.
96. Norman, E., et al., Lipid synthesis in mycobacteria: characterization of the biotin carboxyl carrier protein genes from Mycobacterium leprae and M. tuberculosis. J Bacteriol, 1994. 176(9): p. 2525-31.
97. Cole, S.T., Comparative mycobacterial genomics. Curr Opin Microbiol, 1998. 1(5): p. 567-71.
98. Fontan, P.A., et al., Mycobacterium tuberculosis sigma factor E regulon modulates the host inflammatory response. J Infect Dis, 2008. 198(6): p. 877-85.
99. Cappelli, G., et al., Profiling of Mycobacterium tuberculosis gene expression during human macrophage infection: upregulation of the alternative sigma factor G, a group of transcriptional regulators, and proteins with unknown function. Res Microbiol, 2006. 157(5): p. 445-55.
180

100. Raman, S., et al., Transcription regulation by the Mycobacterium tuberculosis alternative sigma factor SigD and its role in virulence. J Bacteriol, 2004. 186(19): p. 6605-16.
101. Raman, S., et al., The alternative sigma factor SigH regulates major components of oxidative and heat stress responses in Mycobacterium tuberculosis. J Bacteriol, 2001. 183(20): p. 6119-25.
102. Leistikow, R.L., et al., The Mycobacterium tuberculosis DosR regulon assists in metabolic homeostasis and enables rapid recovery from nonrespiring dormancy. J Bacteriol, 2010. 192(6): p. 1662-70.
103. Voskuil, M.I., et al., Inhibition of respiration by nitric oxide induces a Mycobacterium tuberculosis dormancy program. J Exp Med, 2003. 198(5): p. 705-13.
104. Minch, K., T. Rustad, and D.R. Sherman, Mycobacterium tuberculosis growth following aerobic expression of the DosR regulon. PLoS One, 2012. 7(4): p. e35935.
105. Kashino, S.S., et al., Guinea pig model of Mycobacterium tuberculosis latent/dormant infection. Microbes Infect, 2008. 10(14-15): p. 1469-76.
106. Yuan, Y., et al., The 16-kDa alpha-crystallin (Acr) protein of Mycobacterium tuberculosis is required for growth in macrophages. Proc Natl Acad Sci U S A, 1998. 95(16): p. 9578-83.
107. Sherman, D.R., et al., Regulation of the Mycobacterium tuberculosis hypoxic response gene encoding alpha -crystallin. Proc Natl Acad Sci U S A, 2001. 98(13): p. 7534-9.
108. Yuan, Y., D.D. Crane, and C.E. Barry, 3rd, Stationary phase-associated protein expression in Mycobacterium tuberculosis: function of the mycobacterial alpha-crystallin homolog. J Bacteriol, 1996. 178(15): p. 4484-92.
109. Vasudeva-Rao, H.M. and K.A. McDonough, Expression of the Mycobacterium tuberculosis acr-coregulated genes from the DevR (DosR) regulon is controlled by multiple levels of regulation. Infect Immun, 2008. 76(6): p. 2478-89.
110. Lee, B.Y., S.A. Hefta, and P.J. Brennan, Characterization of the major membrane protein of virulent Mycobacterium tuberculosis. Infect Immun, 1992. 60(5): p. 2066-74.
111. Verbon, A., et al., The 14,000-molecular-weight antigen of Mycobacterium tuberculosis is related to the alpha-crystallin family of low-molecular-weight heat shock proteins. J Bacteriol, 1992. 174(4): p. 1352-9.
112. Stewart, J.N., et al., Increased pathology in lungs of mice after infection with an alpha-crystallin mutant of Mycobacterium tuberculosis: changes in cathepsin proteases and certain cytokines. Microbiology, 2006. 152(Pt 1): p. 233-44.
113. Wayne, L.G., Dormancy of Mycobacterium tuberculosis and latency of disease. Eur J Clin Microbiol Infect Dis, 1994. 13(11): p. 908-14.
114. Wayne, L.G. and K.Y. Lin, Glyoxylate metabolism and adaptation of Mycobacterium tuberculosis to survival under anaerobic conditions. Infect Immun, 1982. 37(3): p. 1042-9.
115. Wayne, L.G. and H.A. Sramek, Metronidazole is bactericidal to dormant cells of Mycobacterium tuberculosis. Antimicrob Agents Chemother, 1994. 38(9): p. 2054-8.
116. Lenaerts, A.J., et al., Preclinical testing of the nitroimidazopyran PA-824 for activity against Mycobacterium tuberculosis in a series of in vitro and in vivo models. Antimicrob Agents Chemother, 2005. 49(6): p. 2294-301.
117. Boon, C. and T. Dick, Mycobacterium bovis BCG response regulator essential for hypoxic dormancy. J Bacteriol, 2002. 184(24): p. 6760-7.
181

118. Hu, Y. and A.R. Coates, Transcription of two sigma 70 homologue genes, sigA and sigB, in stationary-phase Mycobacterium tuberculosis. J Bacteriol, 1999. 181(2): p. 469-76.
119. Roberts, D.M., et al., Two sensor kinases contribute to the hypoxic response of Mycobacterium tuberculosis. J Biol Chem, 2004. 279(22): p. 23082-7.
120. Rustad, T.R., et al., The enduring hypoxic response of Mycobacterium tuberculosis. PLoS One, 2008. 3(1): p. e1502.
121. Voskuil, M.I., Mycobacterium tuberculosis gene expression during environmental conditions associated with latency. Tuberculosis (Edinb), 2004. 84(3-4): p. 138-43.
122. Ioanoviciu, A., et al., DevS oxy complex stability identifies this heme protein as a gas sensor in Mycobacterium tuberculosis dormancy. Biochemistry, 2009. 48(25): p. 5839-48.
123. Ioanoviciu, A., et al., DevS, a heme-containing two-component oxygen sensor of Mycobacterium tuberculosis. Biochemistry, 2007. 46(14): p. 4250-60.
124. Sousa, E.H., et al., DosT and DevS are oxygen-switched kinases in Mycobacterium tuberculosis. Protein Sci, 2007. 16(8): p. 1708-19.
125. Cho, H.Y., et al., Structural insight into the heme-based redox sensing by DosS from Mycobacterium tuberculosis. J Biol Chem, 2009. 284(19): p. 13057-67.
126. Kumar, A., et al., Mycobacterium tuberculosis DosS is a redox sensor and DosT is a hypoxia sensor. Proc Natl Acad Sci U S A, 2007. 104(28): p. 11568-73.
127. Converse, P.J., et al., Role of the dosR-dosS two-component regulatory system in Mycobacterium tuberculosis virulence in three animal models. Infect Immun, 2009. 77(3): p. 1230-7.
128. Bartek, I.L., et al., The DosR regulon of M. tuberculosis and antibacterial tolerance. Tuberculosis (Edinb), 2009. 89(4): p. 310-6.
129. Gill, W.P., et al., A replication clock for Mycobacterium tuberculosis. Nat Med, 2009. 15(2): p. 211-4.
130. Rustad, T.R., et al., Hypoxia: a window into Mycobacterium tuberculosis latency. Cell Microbiol, 2009. 11(8): p. 1151-9.
131. Driver, E.R., et al., Evaluation of a mouse model of necrotic granuloma formation using C3HeB/FeJ mice for testing of drugs against Mycobacterium tuberculosis. Antimicrob Agents Chemother, 2012. 56(6): p. 3181-95.
132. Flynn, J.L. and J. Chan, Tuberculosis: latency and reactivation. Infect Immun, 2001. 69(7): p. 4195-201.
133. Henao-Tamayo, M., et al., A mouse model of tuberculosis reinfection. Tuberculosis (Edinb), 2012. 92(3): p. 211-7.
134. Hoff, D.R., et al., Location of intra- and extracellular M. tuberculosis populations in lungs of mice and guinea pigs during disease progression and after drug treatment. PLoS One, 2011. 6(3): p. e17550.
135. Khader, S.A., et al., In a murine tuberculosis model, the absence of homeostatic chemokines delays granuloma formation and protective immunity. J Immunol, 2009. 183(12): p. 8004-14.
136. Ryan, G.J., et al., Multiple M. tuberculosis phenotypes in mouse and guinea pig lung tissue revealed by a dual-staining approach. PLoS One, 2010. 5(6): p. e11108.
137. Reisfeld, B., et al., A physiologically based pharmacokinetic model for capreomycin. Antimicrob Agents Chemother, 2012. 56(2): p. 926-34.
182

138. Tsai, M.C., et al., Characterization of the tuberculous granuloma in murine and human lungs: cellular composition and relative tissue oxygen tension. Cell Microbiol, 2006. 8(2): p. 218-32.
139. Miner, M.D., et al., Role of cholesterol in Mycobacterium tuberculosis infection. Indian J Exp Biol, 2009. 47(6): p. 407-11.
140. Rhoades, E.R., A.A. Frank, and I.M. Orme, Progression of chronic pulmonary tuberculosis in mice aerogenically infected with virulent Mycobacterium tuberculosis. Tuber Lung Dis, 1997. 78(1): p. 57-66.
141. Aly, S., et al., Oxygen status of lung granulomas in Mycobacterium tuberculosis-infected mice. J Pathol, 2006. 210(3): p. 298-305.
142. Franzblau, S.G., et al., Comprehensive analysis of methods used for the evaluation of compounds against Mycobacterium tuberculosis. Tuberculosis (Edinb), 2012. 92(6): p. 453-88.
143. Kelly, B.P., et al., Low-dose aerosol infection model for testing drugs for efficacy against Mycobacterium tuberculosis. Antimicrob Agents Chemother, 1996. 40(12): p. 2809-12.
144. McCune, R.M., et al., The influence of streptovaricin used alone and with isoniazid in an experimental tuberculous infection in animals, and some clinical observations. Am Rev Tuberc, 1957. 75(4): p. 659-66.
145. McCune, R.M., et al., Microbial persistence. I. The capacity of tubercle bacilli to survive sterilization in mouse tissues. J Exp Med, 1966. 123(3): p. 445-68.
146. McCune, R.M., F.M. Feldmann, and W. McDermott, Microbial persistence. II. Characteristics of the sterile state of tubercle bacilli. J Exp Med, 1966. 123(3): p. 469-86.
147. Miyazaki, E., R.E. Chaisson, and W.R. Bishai, Analysis of rifapentine for preventive therapy in the Cornell mouse model of latent tuberculosis. Antimicrob Agents Chemother, 1999. 43(9): p. 2126-30.
148. Scanga, C.A., et al., Reactivation of latent tuberculosis: variations on the Cornell murine model. Infect Immun, 1999. 67(9): p. 4531-8.
149. Lenaerts, A.J., P.L. Chapman, and I.M. Orme, Statistical limitations to the Cornell model of latent tuberculosis infection for the study of relapse rates. Tuberculosis (Edinb), 2004. 84(6): p. 361-4.
150. Basaraba, R.J., et al., Decreased survival of guinea pigs infected with Mycobacterium tuberculosis after multiple BCG vaccinations. Vaccine, 2006. 24(3): p. 280-6.
151. Basaraba, R.J., et al., Pulmonary lymphatics are primary sites of Mycobacterium tuberculosis infection in guinea pigs infected by aerosol. Infect Immun, 2006. 74(9): p. 5397-401.
152. Cosma, C.L., et al., Zebrafish and frog models of Mycobacterium marinum infection. Curr Protoc Microbiol, 2006. Chapter 10: p. Unit 10B 2.
153. Elwood, R.L., et al., The American cotton rat: a novel model for pulmonary tuberculosis. Tuberculosis (Edinb), 2007. 87(2): p. 145-54.
154. Gonzalez-Juarrero, M., et al., Experimental aerosol Mycobacterium bovis model of infection in goats. Tuberculosis (Edinb), 2013. 93(5): p. 558-64.
155. Manabe, Y.C., et al., The aerosol rabbit model of TB latency, reactivation and immune reconstitution inflammatory syndrome. Tuberculosis (Edinb), 2008. 88(3): p. 187-96.
156. Lenaerts, A.J., M.A. Degroote, and I.M. Orme, Preclinical testing of new drugs for tuberculosis: current challenges. Trends Microbiol, 2008. 16(2): p. 48-54.
183

157. Ahmad, Z., et al., Biphasic kill curve of isoniazid reveals the presence of drug-tolerant, not drug-resistant, Mycobacterium tuberculosis in the guinea pig. J Infect Dis, 2009. 200(7): p. 1136-43.
158. Basaraba, R.J., et al., Lymphadenitis as a major element of disease in the guinea pig model of tuberculosis. Tuberculosis (Edinb), 2006. 86(5): p. 386-94.
159. Dharmadhikari, A.S., et al., Natural infection of guinea pigs exposed to patients with highly drug-resistant tuberculosis. Tuberculosis (Edinb), 2011. 91(4): p. 329-38.
160. Helke, K.L., J.L. Mankowski, and Y.C. Manabe, Animal models of cavitation in pulmonary tuberculosis. Tuberculosis (Edinb), 2006. 86(5): p. 337-48.
161. Lenaerts, A.J., et al., Location of persisting mycobacteria in a Guinea pig model of tuberculosis revealed by r207910. Antimicrob Agents Chemother, 2007. 51(9): p. 3338-45.
162. Ordway, D.J., et al., Evaluation of standard chemotherapy in the guinea pig model of tuberculosis. Antimicrob Agents Chemother, 2010. 54(5): p. 1820-33.
163. Turner, O.C., R.J. Basaraba, and I.M. Orme, Immunopathogenesis of pulmonary granulomas in the guinea pig after infection with Mycobacterium tuberculosis. Infect Immun, 2003. 71(2): p. 864-71.
164. McMurray, D.N., Recent progress in the development and testing of vaccines against human tuberculosis. Int J Parasitol, 2003. 33(5-6): p. 547-54.
165. Kato-Maeda, M., et al., Beijing sublineages of Mycobacterium tuberculosis differ in pathogenicity in the guinea pig. Clin Vaccine Immunol, 2012. 19(8): p. 1227-37.
166. Shang, S., et al., Activities of TMC207, rifampin, and pyrazinamide against Mycobacterium tuberculosis infection in guinea pigs. Antimicrob Agents Chemother, 2011. 55(1): p. 124-31.
167. Hoff, D.R., et al., Metronidazole lacks antibacterial activity in guinea pigs infected with Mycobacterium tuberculosis. Antimicrob Agents Chemother, 2008. 52(11): p. 4137-40.
168. Lurie, M.B., P. Zappasodi, and C. Tickner, On the nature of genetic resistance to tuberculosis in the light of the host-parasite relationships in natively resistant and susceptible rabbits. Am Rev Tuberc, 1955. 72(3): p. 297-329.
169. Tsenova, L., et al., Virulence of selected Mycobacterium tuberculosis clinical isolates in the rabbit model of meningitis is dependent on phenolic glycolipid produced by the bacilli. J Infect Dis, 2005. 192(1): p. 98-106.
170. Manca, C., et al., Mycobacterium tuberculosis CDC1551 induces a more vigorous host response in vivo and in vitro, but is not more virulent than other clinical isolates. J Immunol, 1999. 162(11): p. 6740-6.
171. Rayner, E.L., et al., Early lesions following aerosol infection of rhesus macaques (Macaca mulatta) with Mycobacterium tuberculosis strain H37RV. J Comp Pathol, 2013. 149(4): p. 475-85.
172. Capuano, S.V., 3rd, et al., Experimental Mycobacterium tuberculosis infection of cynomolgus macaques closely resembles the various manifestations of human M. tuberculosis infection. Infect Immun, 2003. 71(10): p. 5831-44.
173. Tobin, D.M. and L. Ramakrishnan, Comparative pathogenesis of Mycobacterium marinum and Mycobacterium tuberculosis. Cell Microbiol, 2008. 10(5): p. 1027-39.
174. Egen, J.G., et al., Macrophage and T cell dynamics during the development and disintegration of mycobacterial granulomas. Immunity, 2008. 28(2): p. 271-84.
184

175. Singhal, A., et al., BCG induces protection against Mycobacterium tuberculosis infection in the Wistar rat model. PLoS One, 2011. 6(12): p. e28082.
176. Sanchez, J., et al., Microscopical and immunological features of tuberculoid granulomata and cavitary pulmonary tuberculosis in naturally infected goats. J Comp Pathol, 2011. 145(2-3): p. 107-17.
177. Jung, Y.J., et al., Evidence inconsistent with a negative influence of T helper 2 cells on protection afforded by a dominant T helper 1 response against Mycobacterium tuberculosis lung infection in mice. Infect Immun, 2002. 70(11): p. 6436-43.
178. Major, S., J. Turner, and G. Beamer, Tuberculosis in CBA/J mice. Vet Pathol, 2013. 50(6): p. 1016-21.
179. Obregon-Henao, A., et al., Gr1(int)CD11b+ myeloid-derived suppressor cells in Mycobacterium tuberculosis infection. PLoS One, 2013. 8(11): p. e80669.
180. Majorov, K.B., et al., Different innate ability of I/St and A/Sn mice to combat virulent Mycobacterium tuberculosis: phenotypes expressed in lung and extrapulmonary macrophages. Infect Immun, 2003. 71(2): p. 697-707.
181. Kramnik, I., et al., Genetic control of resistance to experimental infection with virulent Mycobacterium tuberculosis. Proc Natl Acad Sci U S A, 2000. 97(15): p. 8560-5.
182. Lewis, C.C., et al., Unique and overlapping gene expression patterns driven by IL-4 and IL-13 in the mouse lung. J Allergy Clin Immunol, 2009. 123(4): p. 795-804 e8.
183. McKenzie, G.J., et al., Simultaneous disruption of interleukin (IL)-4 and IL-13 defines individual roles in T helper cell type 2-mediated responses. J Exp Med, 1999. 189(10): p. 1565-72.
184. Padilla, J., et al., IL-13 regulates the immune response to inhaled antigens. J Immunol, 2005. 174(12): p. 8097-105.
185. Junqueira-Kipnis, A.P., et al., Interleukin-10 production by lung macrophages in CBA xid mutant mice infected with Mycobacterium tuberculosis. Immunology, 2005. 115(2): p. 246-52.
186. Guirado, E., et al., Intragranulomatous necrosis in pulmonary granulomas is not related to resistance against Mycobacterium tuberculosis infection in experimental murine models induced by aerosol. Int J Exp Pathol, 2006. 87(2): p. 139-49.
187. Scanga, C.A., et al., The inducible nitric oxide synthase locus confers protection against aerogenic challenge of both clinical and laboratory strains of Mycobacterium tuberculosis in mice. Infect Immun, 2001. 69(12): p. 7711-7.
188. Cooper, A.M., et al., IFN-gamma and NO in mycobacterial disease: new jobs for old hands. Trends Microbiol, 2002. 10(5): p. 221-6.
189. Nikonenko, B.V., et al., Comparative analysis of mycobacterial infections in susceptible I/St and resistant A/Sn inbred mice. Tuber Lung Dis, 2000. 80(1): p. 15-25.
190. Nikonenko, B.V., et al., [Genetic aspects of experimental tuberculosis in mice]. Genetika, 1986. 22(5): p. 851-4.
191. Kondratieva, E.V., et al., I/St mice hypersusceptible to Mycobacterium tuberculosis are resistant to M. avium. Infect Immun, 2007. 75(10): p. 4762-8.
192. Kramnik, I., P. Demant, and B.B. Bloom, Susceptibility to tuberculosis as a complex genetic trait: analysis using recombinant congenic strains of mice. Novartis Found Symp, 1998. 217: p. 120-31; discussion 132-7.
193. Kramnik, I., Genetic dissection of host resistance to Mycobacterium tuberculosis: the sst1 locus and the Ipr1 gene. Curr Top Microbiol Immunol, 2008. 321: p. 123-48.
185

194. Pan, H., et al., Ipr1 gene mediates innate immunity to tuberculosis. Nature, 2005. 434(7034): p. 767-72.
195. Yan, B.S., et al., Genetic architecture of tuberculosis resistance in a mouse model of infection. Genes Immun, 2006. 7(3): p. 201-10.
196. Medina, E. and R.J. North, Resistance ranking of some common inbred mouse strains to Mycobacterium tuberculosis and relationship to major histocompatibility complex haplotype and Nramp1 genotype. Immunology, 1998. 93(2): p. 270-4.
197. Yan, B.S., et al., Progression of pulmonary tuberculosis and efficiency of bacillus Calmette-Guerin vaccination are genetically controlled via a common sst1-mediated mechanism of innate immunity. J Immunol, 2007. 179(10): p. 6919-32.
198. Babb, C., et al., SP110 polymorphisms are not associated with pulmonary tuberculosis in a South African population. Hum Genet, 2007. 121(3-4): p. 521-2.
199. Tosh, K., et al., Variants in the SP110 gene are associated with genetic susceptibility to tuberculosis in West Africa. Proc Natl Acad Sci U S A, 2006. 103(27): p. 10364-8.
200. Davis, S.L., et al., Noninvasive pulmonary [18F]-2-fluoro-deoxy-D-glucose positron emission tomography correlates with bactericidal activity of tuberculosis drug treatment. Antimicrob Agents Chemother, 2009. 53(11): p. 4879-84.
201. Ehlers, S., Lazy, dynamic or minimally recrudescent? On the elusive nature and location of the mycobacterium responsible for latent tuberculosis. Infection, 2009. 37(2): p. 87-95.
202. Hunter, R.L., C. Jagannath, and J.K. Actor, Pathology of postprimary tuberculosis in humans and mice: contradiction of long-held beliefs. Tuberculosis (Edinb), 2007. 87(4): p. 267-78.
203. Canetti, G., The tubercule bacillus in the pulmonary lung lesion of man. . 1955, New York: Springer.
204. Kaplan, G., et al., Mycobacterium tuberculosis growth at the cavity surface: a microenvironment with failed immunity. Infect Immun, 2003. 71(12): p. 7099-108.
205. Prideaux, B., et al., High-sensitivity MALDI-MRM-MS imaging of moxifloxacin distribution in tuberculosis-infected rabbit lungs and granulomatous lesions. Anal Chem, 2011. 83(6): p. 2112-8.
206. Davies, G.R., et al., Evaluation of new antituberculosis drugs in mouse models. Antimicrob Agents Chemother, 2007. 51(1): p. 403; author reply 403-4.
207. Jain, S.K., et al., Accelerated detection of Mycobacterium tuberculosis genes essential for bacterial survival in guinea pigs, compared with mice. J Infect Dis, 2007. 195(11): p. 1634-42.
208. Nuermberger, E.L., et al., Moxifloxacin-containing regimens of reduced duration produce a stable cure in murine tuberculosis. Am J Respir Crit Care Med, 2004. 170(10): p. 1131-4.
209. Rosenthal, I.M., et al., Potent twice-weekly rifapentine-containing regimens in murine tuberculosis. Am J Respir Crit Care Med, 2006. 174(1): p. 94-101.
210. Ahmad, Z., et al., Comparison of the 'Denver regimen' against acute tuberculosis in the mouse and guinea pig. J Antimicrob Chemother, 2010. 65(4): p. 729-34.
211. Nedeltchev, G.G., et al., Extrapulmonary dissemination of Mycobacterium bovis but not Mycobacterium tuberculosis in a bronchoscopic rabbit model of cavitary tuberculosis. Infect Immun, 2009. 77(2): p. 598-603.
212. Via, L.E., et al., Tuberculous granulomas are hypoxic in guinea pigs, rabbits, and nonhuman primates. Infect Immun, 2008. 76(6): p. 2333-40.
186

213. Lin, P.L., et al., Early events in Mycobacterium tuberculosis infection in cynomolgus macaques. Infect Immun, 2006. 74(7): p. 3790-803.
214. Keller, C., et al., Genetically determined susceptibility to tuberculosis in mice causally involves accelerated and enhanced recruitment of granulocytes. Infect Immun, 2006. 74(7): p. 4295-309.
215. Pichugin, A.V., et al., Dominant role of the sst1 locus in pathogenesis of necrotizing lung granulomas during chronic tuberculosis infection and reactivation in genetically resistant hosts. Am J Pathol, 2009. 174(6): p. 2190-201.
216. Sissons, J., et al., Multigenic control of tuberculosis resistance: analysis of a QTL on mouse chromosome 7 and its synergism with sst1. Genes Immun, 2009. 10(1): p. 37-46.
217. Orme, I.M., Immune responses in animal models. Curr Top Microbiol Immunol, 1996. 215: p. 181-96.
218. De Groote, M.A., et al., Comparative studies evaluating mouse models used for efficacy testing of experimental drugs against M. tuberculosis. Antimicrob Agents Chemother, 2010.
219. Nuermberger, E., et al., Combination chemotherapy with the nitroimidazopyran PA-824 and first-line drugs in a murine model of tuberculosis. Antimicrob Agents Chemother, 2006. 50(8): p. 2621-5.
220. Dayan, D., et al., Are the polarization colors of picrosirius red-stained collagen determined only by the diameter of the fibers? Histochemistry, 1989. 93(1): p. 27-9.
221. Early, M.A., et al., Non-invasive diagnosis of early pulmonary disease in PECAM-deficient mice using infrared pulse oximetry. Exp Mol Pathol, 2009. 87(2): p. 152-8.
222. Somoskovi, A., et al., Lessons From a Proficiency Testing Event for Acid-Fast Microscopy. Chest, 2001. 120(1): p. 250-257.
223. Orme, I.M., The mouse as a useful model of tuberculosis. Tuberculosis (Edinb), 2003. 83(1-3): p. 112-5.
224. Barry, C.E., H.I. Boshoff, and C.S. Dowd, Prospects for Clinical Introduction of Nitroimidazole Antibiotics for the Treatment of Tuberculosis. Current Pharmaceutical Design, 2004. 10: p. 3239-3262.
225. Brooks, J.V., S.K. Furney, and I.M. Orme, Metronidazole Therapy in Mice Infected with Tuberculosis. Antimicrob Agents Chemother, 1999. 43(5): p. 4.
226. Dhillon, J., et al., Metronidazole has no antibacterial effect in Cornell model murine tuberculosis. Int J Tuberc Lung Dis, 1998. 2(9): p. 7.
227. Singh, P., et al., Comparative evaluation of Lowenstein-Jensen proportion method, BacT/ALERT 3D system, and enzymatic pyrazinamidase assay for pyrazinamide susceptibility testing of Mycobacterium tuberculosis. J Clin Microbiol, 2007. 45(1): p. 76-80.
228. Li, M., et al., Emergence of Fibroblasrs with A Proinflammatory Epigenetically Altered Phenotype in Severe Hypoxic Pulmonary Hypertension. J Immunol, 2011. 187(5): p. 2711-2722.
229. Schnoor, M., et al., Production of Type VI Collagen by HUman Macrophages: A New Dimension in Macrophage Functional Heterogeneity. J Immunol, 2008. 180: p. 5707-5719.
230. Kim, M.J., et al., Caseation of human tuberculosis granulomas correlates with elevated host lipid metabolism. EMBO Mol Med, 2010. 2(7): p. 258-274.
187

231. Basaraba, R.J., Experimental tuberculosis: the role of comparative pathology in the discovery of improved tuberculosis treatment strategies. Tuberculosis (Edinb), 2008. 88 Suppl 1: p. S35-47.
232. Palanisamy, G.S., et al., Clinical strains of Mycobacterium tuberculosis display a wide range of virulence in guinea pigs. Tuberculosis (Edinb), 2009. 89(3): p. 203-9.
233. Heifets, L. and P. Lindholm-Levy, Pyrazinamide sterilizing activity in vitro against semidormant Mycobacterium tuberculosis bacterial populations. Am Rev Respir Dis, 1992. 145(5): p. 1223-5.
234. Wade, M.M. and Y. Zhang, Anaerobic incubation conditions enhance pyrazinamide activity against Mycobacterium tuberculosis. J Med Microbiol, 2004. 53(Pt 8): p. 769-73.
235. Zhang, Y. and D. Mitchison, The curious characteristics of pyrazinamide: a review. Int J Tuberc Lung Dis, 2003. 7(1): p. 6-21.
236. Crowle, A.J., J.A. Sbarbaro, and M.H. May, Inhibition by pyrazinamide of tubercle bacilli within cultured human macrophages. Am Rev Respir Dis, 1986. 134(5): p. 1052-5.
237. Solotorovsky, M., et al., Pyrazinoic acid amide; an agent active against experimental murine tuberculosis. Proc Soc Exp Biol Med, 1952. 79(4): p. 563-5.
238. Ahmad, Z., et al., Dose-dependent activity of pyrazinamide in animal models of intracellular and extracellular tuberculosis. Antimicrob Agents Chemother, 2011: p. 26.
239. Kjellsson, M.C., et al., Penetration of anti-tuberculosis agents in rabbit pulmonary lesions: a pharmacokinetic evaluation. Antimicrob Agents Chemother, 2011: p. 46.
240. Zhang, M., et al., Treatments of Tuberculosis with Rifamycin-containing Regimens in Immune-deficient Mice. Am J Respir Crit Care Med, 2011. 183(9): p. 1254-1261.
241. Vernon, A., et al., Acquired rifamycin monoresistance in patients with HIV-related tuberculosis treated with once-weekly rifapentine and isoniazid. Tuberculosis Trials Consortium. Lancet, 1999. 353(9167): p. 1843-7.
242. Burman, W., et al., Acquired rifamycin resistance with twice-weekly treatment of HIV-related tuberculosis. Am J Respir Crit Care Med, 2006. 173(3): p. 350-6.
243. Ford, C.B., Philana Ling Lin, Michael R Chase, Rupal R Shah, Oleg Iartchouck, James Galagan, Nilofar Mohaideen, Thomas R Ioerger, James C Sacchettini, Marc Lipsitch, JoAnne L Flynn and Sarah M Fortune, Use of whole genome sequencing to estimate the mutation rate of Mycobacterium tuberculosis during latent infection. Nature Genetics, 2011. 43(5): p. 482-486.
244. Larppanichpoonphol, P., et al., Poor compliance makes treatment of latent tuberculosis infection unsatisfactory. J Prim Care Community Health, 2012. 3(4): p. 246-50.
245. Lin, P.L., et al., CD4 T cell depletion exacerbates acute Mycobacterium tuberculosis while reactivation of latent infection is dependent on severity of tissue depletion in cynomolgus macaques. AIDS Res Hum Retroviruses, 2012. 28(12): p. 1693-702.
246. Smith, D.W. and G.E. Harding, Animal model of human disease. Pulmonary tuberculosis. Animal model: Experimental airborne tuberculosis in the guinea pig. Am J Pathol, 1977. 89(1): p. 273-6.
247. Harper, J., et al., Mouse model of necrotic tuberculosis granulomas develops hypoxic lesions. J Infect Dis, 2012. 205(4): p. 595-602.
248. Rosenthal, I.M., et al., Dose-ranging comparison of rifampin and rifapentine in two pathologically distinct murine models of tuberculosis. Antimicrob Agents Chemother, 2012. 56(8): p. 4331-40.
188

249. Minion, J., et al., Fading of auramine-stained mycobacterial smears and implications for external quality assurance. J Clin Microbiol, 2011. 49(5): p. 2024-6.
250. Gonzalez-Juarrero, M., et al., Disruption of granulocyte macrophage-colony stimulating factor production in the lungs severely affects the ability of mice to control Mycobacterium tuberculosis infection. J Leukoc Biol, 2005. 77(6): p. 914-22.
251. Chandrasekhar, S. and M.K. Mukherjee, Intracellular tubercle bacilli-alveolar macrophage lysosomal enzymes interaction in experimental tuberculosis. Clin Immunol Immunopathol, 1990. 56(2): p. 185-201.
252. Leong, F.J., V. Dartois, and T. Dick, A Color Atlas of Comparative Pathology of Pulmonary Tuberculosis. 2011, Boca Raton, FL: CRC Press Taylor and Francis Group.
253. Park, M.S., et al., The role of chemotherapy in advanced solitary fibrous tumors: a retrospective analysis. Clin Sarcoma Res, 2013. 3(1): p. 7.
254. Chauhan, V.P., et al., Angiotensin inhibition enhances drug delivery and potentiates chemotherapy by decompressing tumour blood vessels. Nat Commun, 2013. 4: p. 2516.
255. McIntyre, A., et al., Carbonic anhydrase IX promotes tumor growth and necrosis in vivo and inhibition enhances anti-VEGF therapy. Clin Cancer Res, 2012. 18(11): p. 3100-11.
256. Hunter, R.L., et al., Trehalose 6,6'-dimycolate and lipid in the pathogenesis of caseating granulomas of tuberculosis in mice. Am J Pathol, 2006. 168(4): p. 1249-61.
257. Behar, S.M., et al., Apoptosis is an innate defense function of macrophages against Mycobacterium tuberculosis. Mucosal Immunol, 2011. 4(3): p. 279-87.
258. Blomgran, R., et al., Mycobacterium tuberculosis inhibits neutrophil apoptosis, leading to delayed activation of naive CD4 T cells. Cell Host Microbe, 2012. 11(1): p. 81-90.
259. Chen, M., et al., Lipid mediators in innate immunity against tuberculosis: opposing roles of PGE2 and LXA4 in the induction of macrophage death. J Exp Med, 2008. 205(12): p. 2791-801.
260. Ehlers, S. and U.E. Schaible, The granuloma in tuberculosis: dynamics of a host-pathogen collusion. Front Immunol, 2012. 3: p. 411.
261. Hunter, R.L., On the pathogenesis of post primary tuberculosis: the role of bronchial obstruction in the pathogenesis of cavities. Tuberculosis (Edinb), 2011. 91 Suppl 1: p. S6-10.
262. Hunter, R.L., Pathology of post primary tuberculosis of the lung: an illustrated critical review. Tuberculosis (Edinb), 2011. 91(6): p. 497-509.
263. Calderon, V.E., et al., A humanized mouse model of tuberculosis. PLoS One, 2013. 8(5): p. e63331.
264. Lowe, D.M., et al., Neutrophils in tuberculosis: friend or foe? Trends Immunol, 2012. 33(1): p. 14-25.
265. Eum, S.Y., et al., Association of antigen-stimulated release of tumor necrosis factor-alpha in whole blood with response to chemotherapy in patients with pulmonary multidrug-resistant tuberculosis. Respiration, 2010. 80(4): p. 275-84.
266. Mahajan, S., et al., Mycobacterium tuberculosis modulates macrophage lipid-sensing nuclear receptors PPARgamma and TR4 for survival. J Immunol, 2012. 188(11): p. 5593-603.
267. Arko-Mensah, J., et al., Resistance to mycobacterial infection: a pattern of early immune responses leads to a better control of pulmonary infection in C57BL/6 compared with BALB/c mice. Vaccine, 2009. 27(52): p. 7418-27.
189

268. Pokkali, S. and S.D. Das, Augmented chemokine levels and chemokine receptor expression on immune cells during pulmonary tuberculosis. Hum Immunol, 2009. 70(2): p. 110-5.
269. den Hertog, A.L., et al., Early specific host response associated with starting effective tuberculosis treatment in an infection controlled placebo controlled mouse study. PLoS One, 2013. 8(2): p. e57997.
270. Kozakiewicz, L., et al., The role of B cells and humoral immunity in Mycobacterium tuberculosis infection. Adv Exp Med Biol, 2013. 783: p. 225-50.
271. Cavalcanti, Y.V., et al., Role of TNF-Alpha, IFN-Gamma, and IL-10 in the Development of Pulmonary Tuberculosis. Pulm Med, 2012. 2012: p. 745483.
272. Cilfone, N.A., et al., Multi-scale modeling predicts a balance of tumor necrosis factor-alpha and interleukin-10 controls the granuloma environment during Mycobacterium tuberculosis infection. PLoS One, 2013. 8(7): p. e68680.
273. Gordon, S., et al., F4/80 and the related adhesion-GPCRs. Eur J Immunol, 2011. 41(9): p. 2472-6.
274. Balemans, W., et al., Novel antibiotics targeting respiratory ATP synthesis in Gram-positive pathogenic bacteria. Antimicrob Agents Chemother, 2012. 56(8): p. 4131-9.
275. Diacon, A.H., et al., Randomized pilot trial of eight weeks of bedaquiline (TMC207) treatment for multidrug-resistant tuberculosis: long-term outcome, tolerability, and effect on emergence of drug resistance. Antimicrob Agents Chemother, 2012. 56(6): p. 3271-6.
276. Jain, R., et al., Treatment induced necrosis versus recurrent/progressing brain tumor: going beyond the boundaries of conventional morphologic imaging. J Neurooncol, 2010. 100(1): p. 17-29.
277. Quaia, E., et al., Radiologic-pathologic correlations of intratumoral tissue components in the most common solid and cystic renal tumors. Pictorial review. Eur Radiol, 2005. 15(8): p. 1734-44.
278. Mueller, M.M. and N.E. Fusenig, Friends or foes - bipolar effects of the tumour stroma in cancer. Nat Rev Cancer, 2004. 4(11): p. 839-49.
279. Radisky, D., C. Hagios, and M.J. Bissell, Tumors are unique organs defined by abnormal signaling and context. Semin Cancer Biol, 2001. 11(2): p. 87-95.
280. Feig, C., et al., The pancreas cancer microenvironment. Clin Cancer Res, 2012. 18(16): p. 4266-76.
281. Yun, C.O., Overcoming the extracellular matrix barrier to improve intratumoral spread and therapeutic potential of oncolytic virotherapy. Curr Opin Mol Ther, 2008. 10(4): p. 356-61.
282. Vakoc, B.J., et al., Three-dimensional microscopy of the tumor microenvironment in vivo using optical frequency domain imaging. Nat Med, 2009. 15(10): p. 1219-23.
283. Jain, R.K., Determinants of tumor blood flow: a review. Cancer Res, 1988. 48(10): p. 2641-58.
284. Fang, J., H. Nakamura, and H. Maeda, The EPR effect: Unique features of tumor blood vessels for drug delivery, factors involved, and limitations and augmentation of the effect. Adv Drug Deliv Rev, 2011. 63(3): p. 136-51.
285. Fang, J., T. Sawa, and H. Maeda, Factors and mechanism of "EPR" effect and the enhanced antitumor effects of macromolecular drugs including SMANCS. Adv Exp Med Biol, 2003. 519: p. 29-49.
190

286. Seki, T., J. Fang, and H. Maeda, Enhanced delivery of macromolecular antitumor drugs to tumors by nitroglycerin application. Cancer Sci, 2009. 100(12): p. 2426-30.
287. Maeda, H., et al., Vascular permeability enhancement in solid tumor: various factors, mechanisms involved and its implications. Int Immunopharmacol, 2003. 3(3): p. 319-28.
288. Greish, K., et al., Macromolecular therapeutics: advantages and prospects with special emphasis on solid tumour targeting. Clin Pharmacokinet, 2003. 42(13): p. 1089-105.
289. Jain, R.K. and T. Stylianopoulos, Delivering nanomedicine to solid tumors. Nat Rev Clin Oncol, 2010. 7(11): p. 653-64.
290. Leunig, M., et al., Angiogenesis, microvascular architecture, microhemodynamics, and interstitial fluid pressure during early growth of human adenocarcinoma LS174T in SCID mice. Cancer Res, 1992. 52(23): p. 6553-60.
291. Zhang, Y., et al., Antimetastatic activities of pegylated liposomal doxorubicin in a murine metastatic lung cancer model. J Drug Target, 2008. 16(9): p. 679-87.
292. Torchilin, V.P., Targeted pharmaceutical nanocarriers for cancer therapy and imaging. AAPS J, 2007. 9(2): p. E128-47.
293. Sagnella, S.M., et al., Dextran-based Doxorubicin nanocarriers with improved tumor penetration. Biomacromolecules, 2014. 15(1): p. 262-75.
294. Li, Y., et al., Delivery of nanomedicines to extracellular and intracellular compartments of a solid tumor. Adv Drug Deliv Rev, 2012. 64(1): p. 29-39.
295. Drummond, D.C., et al., Pharmacokinetics and in vivo drug release rates in liposomal nanocarrier development. J Pharm Sci, 2008. 97(11): p. 4696-740.
296. Gordon, A.N., et al., Recurrent epithelial ovarian carcinoma: a randomized phase III study of pegylated liposomal doxorubicin versus topotecan. J Clin Oncol, 2001. 19(14): p. 3312-22.
297. Gill, P.S., et al., Randomized phase III trial of liposomal daunorubicin versus doxorubicin, bleomycin, and vincristine in AIDS-related Kaposi's sarcoma. J Clin Oncol, 1996. 14(8): p. 2353-64.
298. Noble, C.O., et al., Development of ligand-targeted liposomes for cancer therapy. Expert Opin Ther Targets, 2004. 8(4): p. 335-53.
299. Sapra, P. and T.M. Allen, Ligand-targeted liposomal anticancer drugs. Prog Lipid Res, 2003. 42(5): p. 439-62.
300. Nanopharmaceuticals.org/Liposomes.html. 2005. 301. Knight, C.B., P.C. Elwood, and B.A. Chabner, Future directions for antifolate drug
development. Adv Enzyme Regul, 1989. 29: p. 3-12. 302. Lee, R.J. and P.S. Low, Delivery of liposomes into cultured KB cells via folate receptor-
mediated endocytosis. J Biol Chem, 1994. 269(5): p. 3198-204. 303. Agrawal, A.K., et al., Improved stability and antidiabetic potential of insulin containing
folic acid functionalized polymer stabilized multilayered liposomes following oral administration. Biomacromolecules, 2014. 15(1): p. 350-60.
304. Drummond, D.C., et al., Optimizing liposomes for delivery of chemotherapeutic agents to solid tumors. Pharmacol Rev, 1999. 51(4): p. 691-743.
305. Drummond, D.C., et al., Development of a highly active nanoliposomal irinotecan using a novel intraliposomal stabilization strategy. Cancer Res, 2006. 66(6): p. 3271-7.
306. Kirpotin, D.B., et al., Building and characterizing antibody-targeted lipidic nanotherapeutics. Methods Enzymol, 2012. 502: p. 139-66.
191

307. Reynolds, J.G., et al., HER2-targeted liposomal doxorubicin displays enhanced anti-tumorigenic effects without associated cardiotoxicity. Toxicol Appl Pharmacol, 2012. 262(1): p. 1-10.
308. Marzo, E., et al., Damaging role of neutrophilic infiltration in a mouse model of progressive tuberculosis. Tuberculosis (Edinb), 2014. 94(1): p. 55-64.
309. Lee, R.J. and P.S. Low, Folate-mediated tumor cell targeting of liposome-entrapped doxorubicin in vitro. Biochim Biophys Acta, 1995. 1233(2): p. 134-44.
310. Welsh, K.J., et al., Immunopathology of postprimary tuberculosis: increased T-regulatory cells and DEC-205-positive foamy macrophages in cavitary lesions. Clin Dev Immunol, 2011. 2011: p. 307631.
311. Yang, Q., et al., Accelerated drug release and clearance of PEGylated epirubicin liposomes following repeated injections: a new challenge for sequential low-dose chemotherapy. Int J Nanomedicine, 2013. 8: p. 1257-68.
312. Zhao, Y., et al., A frustrating problem: accelerated blood clearance of PEGylated solid lipid nanoparticles following subcutaneous injection in rats. Eur J Pharm Biopharm, 2012. 81(3): p. 506-13.
313. Suzuki, T., et al., Accelerated blood clearance of PEGylated liposomes containing doxorubicin upon repeated administration to dogs. Int J Pharm, 2012. 436(1-2): p. 636-43.
314. Ishida, T., S. Kashima, and H. Kiwada, The contribution of phagocytic activity of liver macrophages to the accelerated blood clearance (ABC) phenomenon of PEGylated liposomes in rats. J Control Release, 2008. 126(2): p. 162-5.
315. Doherty, T.M., Immunotherapy for TB. Immunotherapy, 2012. 4(6): p. 629-47. 316. Feng, C.G., et al., NK cell-derived IFN-gamma differentially regulates innate resistance
and neutrophil response in T cell-deficient hosts infected with Mycobacterium tuberculosis. J Immunol, 2006. 177(10): p. 7086-93.
317. Lockhart, E., A.M. Green, and J.L. Flynn, IL-17 production is dominated by gammadelta T cells rather than CD4 T cells during Mycobacterium tuberculosis infection. J Immunol, 2006. 177(7): p. 4662-9.
318. Diez, J., et al., Losartan-dependent regression of myocardial fibrosis is associated with reduction of left ventricular chamber stiffness in hypertensive patients. Circulation, 2002. 105(21): p. 2512-7.
319. Noble, P.W., et al., Pirfenidone in patients with idiopathic pulmonary fibrosis (CAPACITY): two randomised trials. Lancet, 2011. 377(9779): p. 1760-9.
320. Yoshiji, H., et al., Losartan, an angiotensin-II type 1 receptor blocker, attenuates the liver fibrosis development of non-alcoholic steatohepatitis in the rat. BMC Res Notes, 2009. 2: p. 70.
321. Sookoian, S., M.A. Fernandez, and G. Castano, Effects of six months losartan administration on liver fibrosis in chronic hepatitis C patients: a pilot study. World J Gastroenterol, 2005. 11(48): p. 7560-3.
322. Ma, T.K., et al., Renin-angiotensin-aldosterone system blockade for cardiovascular diseases: current status. Br J Pharmacol, 2010. 160(6): p. 1273-92.
323. Cohn, R.D., et al., Angiotensin II type 1 receptor blockade attenuates TGF-beta-induced failure of muscle regeneration in multiple myopathic states. Nat Med, 2007. 13(2): p. 204-10.
192

324. Sironi, L., et al., Anti-inflammatory properties of drugs acting on the renin-angiotensin system. Drugs Today (Barc), 2005. 41(9): p. 609-22.
325. Diop-Frimpong, B., et al., Losartan inhibits collagen I synthesis and improves the distribution and efficacy of nanotherapeutics in tumors. Proc Natl Acad Sci U S A, 2011. 108(7): p. 2909-14.
326. Lo, M.W., et al., Pharmacokinetics of losartan, an angiotensin II receptor antagonist, and its active metabolite EXP3174 in humans. Clin Pharmacol Ther, 1995. 58(6): p. 641-9.
327. Stearns, R.A., et al., Biotransformation of losartan to its active carboxylic acid metabolite in human liver microsomes. Role of cytochrome P4502C and 3A subfamily members. Drug Metab Dispos, 1995. 23(2): p. 207-15.
328. Molina-Molina, M., et al., Losartan attenuates bleomycin induced lung fibrosis by increasing prostaglandin E2 synthesis. Thorax, 2006. 61(7): p. 604-10.
329. Keogh, K.A., et al., Angiotensin II antagonism fails to ameliorate bleomycin-induced pulmonary fibrosis in mice. Eur Respir J, 2005. 25(4): p. 708-14.
330. Skerry, C., et al., Adjunctive TNF inhibition with standard treatment enhances bacterial clearance in a murine model of necrotic TB granulomas. PLoS One, 2012. 7(6): p. e39680.
331. Comas, I. and S. Gagneux, A role for systems epidemiology in tuberculosis research. Trends Microbiol, 2011. 19(10): p. 492-500.
332. Kato-Maeda, M., J.Z. Metcalfe, and L. Flores, Genotyping of Mycobacterium tuberculosis: application in epidemiologic studies. Future Microbiol, 2011. 6(2): p. 203-16.
333. Ordway, D.J., et al., Mycobacterium bovis BCG-mediated protection against W-Beijing strains of Mycobacterium tuberculosis is diminished concomitant with the emergence of regulatory T cells. Clin Vaccine Immunol, 2011. 18(9): p. 1527-35.
334. Borrell, S. and S. Gagneux, Strain diversity, epistasis and the evolution of drug resistance in Mycobacterium tuberculosis. Clin Microbiol Infect, 2011. 17(6): p. 815-20.
335. Borrell, S., et al., Epistasis between antibiotic resistance mutations drives the evolution of extensively drug-resistant tuberculosis. Evol Med Public Health, 2013. 2013(1): p. 65-74.
336. Gagneux, S. and P.M. Small, Global phylogeography of Mycobacterium tuberculosis and implications for tuberculosis product development. Lancet Infect Dis, 2007. 7(5): p. 328-37.
337. Muller, B., et al., The heterogeneous evolution of multidrug-resistant Mycobacterium tuberculosis. Trends Genet, 2013. 29(3): p. 160-9.
338. Homolka, S., et al., Functional genetic diversity among Mycobacterium tuberculosis complex clinical isolates: delineation of conserved core and lineage-specific transcriptomes during intracellular survival. PLoS Pathog, 2010. 6(7): p. e1000988.
339. Barczak, A.K., et al., In vivo phenotypic dominance in mouse mixed infections with Mycobacterium tuberculosis clinical isolates. J Infect Dis, 2005. 192(4): p. 600-6.
340. Bifani, P.J., et al., Global dissemination of the Mycobacterium tuberculosis W-Beijing family strains. Trends Microbiol, 2002. 10(1): p. 45-52.
341. Tsolaki, A.G., et al., Genomic deletions classify the Beijing/W strains as a distinct genetic lineage of Mycobacterium tuberculosis. J Clin Microbiol, 2005. 43(7): p. 3185-91.
193

342. Kato-Maeda, M., et al., Differences among sublineages of the East-Asian lineage of Mycobacterium tuberculosis in genotypic clustering. Int J Tuberc Lung Dis, 2010. 14(5): p. 538-44.
343. Sreevatsan, S., et al., Restricted structural gene polymorphism in the Mycobacterium tuberculosis complex indicates evolutionarily recent global dissemination. Proc Natl Acad Sci U S A, 1997. 94(18): p. 9869-74.
344. Manca, C., et al., Hypervirulent M. tuberculosis W/Beijing strains upregulate type I IFNs and increase expression of negative regulators of the Jak-Stat pathway. J Interferon Cytokine Res, 2005. 25(11): p. 694-701.
345. Shang, S., et al., Increased Foxp3 expression in guinea pigs infected with W-Beijing strains of M. tuberculosis. Tuberculosis (Edinb), 2011. 91(5): p. 378-85.
346. Manca, C., et al., Virulence of a Mycobacterium tuberculosis clinical isolate in mice is determined by failure to induce Th1 type immunity and is associated with induction of IFN-alpha /beta. Proc Natl Acad Sci U S A, 2001. 98(10): p. 5752-7.
347. Henao-Tamayo, M.I., et al., Phenotypic definition of effector and memory T-lymphocyte subsets in mice chronically infected with Mycobacterium tuberculosis. Clin Vaccine Immunol, 2010. 17(4): p. 618-25.
348. Palanisamy, G.S., et al., Disseminated disease severity as a measure of virulence of Mycobacterium tuberculosis in the guinea pig model. Tuberculosis (Edinb), 2008. 88(4): p. 295-306.
349. Boon, A.C., et al., Cross-reactive neutralizing antibodies directed against pandemic H1N1 2009 virus are protective in a highly sensitive DBA/2 mouse influenza model. J Virol, 2010. 84(15): p. 7662-7.
350. Soffler, C., et al., Development and characterization of a caprine aerosol infection model of melioidosis. PLoS One, 2012. 7(8): p. e43207.
351. Smith, D.W., V. Balasubramanian, and E. Wiegeshaus, A guinea pig model of experimental airborne tuberculosis for evaluation of the response to chemotherapy: the effect on bacilli in the initial phase of treatment. Tubercle, 1991. 72(3): p. 223-31.
352. Sathekge, M., et al., Use of 18F-FDG PET to predict response to first-line tuberculostatics in HIV-associated tuberculosis. J Nucl Med, 2011. 52(6): p. 880-5.
353. Foss, C.A., et al., Noninvasive molecular imaging of tuberculosis-associated inflammation with radioiodinated DPA-713. J Infect Dis, 2013. 208(12): p. 2067-74.
354. Foster, B., et al., Segmentation of PET Images for Computer-Aided Functional Quantification of Tuberculosis in Small Animal Models. IEEE Trans Biomed Eng, 2013.
355. Watanabe, S., et al., Treatment monitoring with (18)F-FDG PET/CT in a patient with peritoneal tuberculosis. Eur J Nucl Med Mol Imaging, 2014. 41(1): p. 184.
356. Divangahi, M., S.M. Behar, and H. Remold, Dying to live: how the death modality of the infected macrophage affects immunity to tuberculosis. Adv Exp Med Biol, 2013. 783: p. 103-20.
357. Morris, D., et al., An elucidation of neutrophil functions against Mycobacterium tuberculosis infection. Clin Dev Immunol, 2013. 2013: p. 959650.
358. Cunningham, A.F. and C.L. Spreadbury, Mycobacterial stationary phase induced by low oxygen tension: cell wall thickening and localization of the 16-kilodalton alpha-crystallin homolog. J Bacteriol, 1998. 180(4): p. 801-8.
359. Gonzalez-Juarrero, M., Immunity to TB and targets for immunotherapy. Immunotherapy, 2012. 4(2): p. 187-99.
194

360. Rosas-Taraco, A.G., et al., Local pulmonary immunotherapy with siRNA targeting TGFbeta1 enhances antimicrobial capacity in Mycobacterium tuberculosis infected mice. Tuberculosis (Edinb), 2011. 91(1): p. 98-106.
361. Mayanja-Kizza, H., et al., Immunoadjuvant prednisolone therapy for HIV-associated tuberculosis: a phase 2 clinical trial in Uganda. J Infect Dis, 2005. 191(6): p. 856-65.
362. Wyser, C., et al., Corticosteroids in the treatment of tuberculous pleurisy. A double-blind, placebo-controlled, randomized study. Chest, 1996. 110(2): p. 333-8.
363. Vilaplana, C., et al., Ibuprofen therapy resulted in significantly decreased tissue bacillary loads and increased survival in a new murine experimental model of active tuberculosis. J Infect Dis, 2013. 208(2): p. 199-202.
364. Mitchison, D. and G. Davies, The chemotherapy of tuberculosis: past, present and future. Int J Tuberc Lung Dis, 2012. 16(6): p. 724-32.
365. Grosset, J.H., et al., Assessment of clofazimine activity in a second-line regimen for tuberculosis in mice. Am J Respir Crit Care Med, 2013. 188(5): p. 608-12.
366. Inomata, M., et al., Pirfenidone inhibits fibrocyte accumulation in the lungs in bleomycin-induced murine pulmonary fibrosis. Respir Res, 2014. 15(1): p. 16.
367. Jain, R., et al., In vivo correlation of tumor blood volume and permeability with histologic and molecular angiogenic markers in gliomas. AJNR Am J Neuroradiol, 2011. 32(2): p. 388-94.
195

LIST OF ABBREVIATIONS
TB – Tuberculosis
MTB – Mycobacterium tuberculosis
HIV – Human Immunodeficiency Virus
INH, H – Isoniazid
RIF, R – Rifampin
EMB, E – Ethambutol
PZA, Z – Pyrazinamide
BDQ, J – Bedaquiline
MET – Metronidazole
LZD, L – Linezolid
MXF, X – Moxifloxacin
DOTS – Directly Observed Therapy Short Course
MDR-TB – Multidrug Resistant Tuberculosis
XDR-TB – Extensively drug Resistant Tuberculosis
TDR-TB – Totally drug Resistant Tuberculosis
CMI – Cellular Mediated Immunity
DTH – Delayed Type Hypersensitivity
LTBI – Latent Tuberculosis Infection
Th1 – T cell Helper 1
Th2 – T cell Helper 2
Th17 – T cell Helper 17
Treg – T Regulatory cell
196

CD4 – Cluster of Differentiation 4
CD8 – Cluster of Differentiation 8
IFN-γ – Interferon-gamma
TNF-α – Tumor Necrosis Factor-alpha
IL-12 – Interleukin-12
IL-23 – Interleukin-23
IL-10 – Interleukin-10
IL-17 – Interleukin-17
IL-4 – Interleukin-4
IL-5 – Interleukin-5
IL-13 – Interleukin-13
MCP-1 – Monocyte Chemoattractant Protein -1
SCID – Severe Combined Immunodeficiency
iNOS – induced Nitric Oxide Synthase
ROS – Reactive Oxygen Species
RNI – Reactive Nitrogen Intermediates
NO – Nitric Oxide
KatG – Catalase Peroxidase
ICL – Isocitrate Lyase
TCA – Tricarboxylate acid
ACR – Alpha-crystallin
HSP – Heat-shock protein
DosR – Dormancy Survival Regulator
197

NRP – Non-replicating Persister
EHR – Enduring Hypoxic Response
RAD – Rapid Anaerobic Dormancy
Sst1 – Super Susceptibility to Tuberculosis -1
Ipr1 – Intracellular Pathogen Resistance -1
Ifi75 – Interferon Inducible 75 genes
PET – Positron Emission Tomography
MRI – Magnetic Resonance Imaging
TSPO – Translocator Protein
DMSO – Dimethylsulfoxide
CFU – Colony Forming Unit
OADC – Oleic Albumin Dextrose Catalase
AR – Auramine-Rhodamine
DAPI – 4’6-Diamidino-2-Phenylindole
PBS – Phosphate Buffered Saline
SEM – Standard Error of Measurement
ZN – Ziehl-Neelsen
ND – No bacterial colonies detected
PK – Pharmacokinetic
VEGF – Vascular Endothelial Growth Factor
GM-CSF – Granulocyte Macrophage Colony Stimulating Factor
ELISA – Enzyme Linked Immunosorbent Assay
CBA – Cytometric Bead Array
198

GKO – Gamma Interferon Knockout
NHP – Non-human Primate
IHC – Immunohistochemistry
CAF – Cancer-associated Fibroblasts
TAM – Tumor-associated Macrophages
TAN – Tumor-associated Neutrophils
EPR – Enhanced Permeability and Retention
FDA – Federal and Drug Administration
IFP – Interstitial Fluid Pressure
ABC – Accelerated Blood Clearance
MALDI-MRM-MS – Matrix Assisted Laser Desorption/Ionization-Multiple Reaction
Monitoring-Mass Spectrometric
BCG – Bacillus Calmette-Guérin
RD – Region of Difference
LK – Losartan Potassium
siRNA – Small Interfering RNA
HSR – Homogeneously Staining Regions
RT-PCR – Reverse Transcription Polymerase Chain Reaction
PGE2 – Prostaglandin E2
LXA4 – Lipoxin A4
BAX – Bcl-2 Associated X protein
BAK – Bcl-2 Homologous Antagonist Killer
199
![Taylor Feehley NIH Public Access Cathryn R. Nagler Author ... · sensitization with peanut (PN) plus cholera toxin (CT) when compared to TLR4-sufficient, C3H/FeJ mice [4]. TLR4 is](https://static.fdocuments.us/doc/165x107/60f85fe068267214c23891f3/taylor-feehley-nih-public-access-cathryn-r-nagler-author-sensitization-with.jpg)


![Lenze 8400 motec Drives Catalog - ValinOnline.com...K_\ k_i\\ gXikj f] k_\ dfk\Z ZXe Y\ gcl^^\[ `ekf fe\ Xefk_\i Gcl^ Zfee\Zk`fej / jcfkj 8( $ 8+ Xe[ 9( $ 9+ Gfn\i Zfee\Zk`fej Gi\gXi\[](https://static.fdocuments.us/doc/165x107/5fab28d9bed6e351b414c6c9/lenze-8400-motec-drives-catalog-k-ki-gxikj-f-k-dfkz-zxe-y-gcl.jpg)