DISSERTATION - Startseite | ediss.sub.hamburg
197
Elevational Distribution and Taxonomy of Shrews and Rodents in the Mountains of Northern Tanzania DISSERTATION submitted for the degree of Doctor of Science (Dr. rer. nat.) Department of Biology University of Hamburg submitted by William T. Stanley Hamburg, 2015
Transcript of DISSERTATION - Startseite | ediss.sub.hamburg

Elevational Distribution and Taxonomy of Shrews and
Rodents in the Mountains of Northern Tanzania
DISSERTATION
submitted for the degree of
Doctor of Science (Dr. rer. nat.)
Department of Biology
University of Hamburg
submitted by
William T. Stanley
Hamburg, 2015

1
Date of oral defense: 24th
of April 2015
Dissertation reviewers:
Prof. Dr. Jörg Ganzhorn, University of Hamburg
Dr. Rainer Hutterer, Zoologisches Forschungsmuseum Alexander Koenig, Bonn

Abstract
2
Abstract
The ecology of the small mammals living on the mountains of Tanzania is poorly
known. In particular, the distribution of species along elevational gradients on these
massifs requires detailed surveys to adequately understand the relationship between
species diversity and their altitudinal distribution. Two mountains in particular are
notable in the paucity of specimen-based surveys that have been undertaken: Mt.
Kilimanjaro, the highest mountain of Africa, and Mt. Meru, Tanzania’s second
highest mountain. Here I document the distribution of shrews and rodents along an
elevational gradient on the southeastern versant of these mountains. Five sites were
sampled on each mountain, on Kilimanjaro between 2000 and 4000 m and on Meru
between 1950 and 3600 m, using a systematic methodology of standard traps and
pitfall lines, to inventory the shrews and rodents of the slopes. On Kilimanjaro, 16
species of small mammal were recorded, including six shrew and 10 rodent species,
and the greatest diversity for both was found at 3000 m, the elevational midpoint of
the transect. On Meru, 10 species of mammal were recorded, including two shrew
(one of which is a new taxon) and eight rodent species, and the greatest diversity for
both was found at 2300 m. All documented species were previously known from the
two massifs. Two rodent genera that occur in the nearby Eastern Arc Mountains
(Hylomyscus and Beamys), were not recorded on the two massifs. Species that are
endemic to each mountain (Myosorex zinki-Kilimanjaro and Lophuromys verhageni-
Meru) are widespread across the elevational gradient, and only absent from the lowest
site on each gradient. As in other faunal surveys on other mountains of Tanzania
using similar methodologies, rainfall influenced the sample success of shrews, but not
rodents.
Mt. Kilimanjaro is the type locality for Crocidura monax Thomas, a
crocidurine shrew for which the taxonomy and detailed distribution has been debated
since its description. While some workers maintain that it is restricted to Kilimanjaro,
others have suggested it occurs on neighboring montane islands. I assess
morphological variation among isolated montane populations of C. monax from
Tanzania that have been referred to C. monax. The montane sites used in this analysis
are from two geologically distinct archipelagos (Northern Highlands and the Eastern
Arc Mountains) and are a significant component of the Eastern Afromontane
Biodiversity Hotspot. Multivariate analyses of morphometric traits suggest two

Abstract
3
undescribed shrews previously considered C. monax occur on these mountains, one
on Ngorongoro and another shared by four Eastern Arc Mountains (Rubeho, Ukaguru,
Uluguru, and Udzungwa). Similar cranial morphology indicates that C. monax is
restricted to Mt. Kilimanjaro and North Pare, while C. tansaniana is found on the East
and West Usambaras, and C. usambarae occurs on both the South Pares and the West
Usambaras.

Contents
4
Contents
SUMMARY
Introduction……………………………………………………………... 6
Aim of this study………………………………………………………... 9
Materials & Methods………………………………………………….... 12
Results………………………………………………………………..…. 20
Conclusion…………………………………………………………….... 45
Literature………………………………………………………………... 51
Appendix…………………………………………………………..……. 60
PUBLICATIONS & MANUSCRIPT
Stanley, W.T., M.A. Rogers, P.M. Kihaule and M.J. Munissi. 2014. Elevational
distribution and ecology of small mammals on Africa’s highest mountain.
PLOS ONE 9(11): e109904. DOI:
10.1371/journal.pone.0109………………………………………………… 65
Stanley, W.T., R. Hutterer, T.C. Giarla and J.A. Esselstyn. In press. Phylogeny,
phylogeography and geographical variation in the Crocidura monax
(Soricidae) species complex from the montane islands of Tanzania, with
descriptions of three new species. Zoological Journal of the Linnean
Society…………………………………………………………………….....96
Stanley, W.T., P.M. Kihaule and M.J. Munissi. To be submitted. Elevational
distribution and ecology of small mammals Tanzania’s second highest
mountain. …………………….. ……………………………………………166
ACKNOWLEDGEMENTS………………………………………………... ………193

Summary
5
SUMMARY

Summary
6
Introduction
The mountains of Tanzania have fascinated the scientist and romanticist alike for over
a century. Obvious and familiar montane icons include Mt. Kilimanjaro and
Ngorongoro, which have featured prominently in both popular literature and detailed
conservation analyses (Hemingway 1986, Grzimek and Grzimek 1960, Mwasaga
1991, Mduma et al. 1999). Whether a mountain for climbers to conquer, a crater rim
for tourists to appreciate, or the type locality of numerous biota, these isolated massifs
have been justly celebrated for decades.
The origin of these iconic geographic features is the result of multiple geologic
forces over time. The most prominent of these were the vertical movements, resulting
in rift valleys and fault block mountains and volcanic eruptions. The mountains we
see today resulting from these dynamic geological interactions are part of a broad
archipelago of montane islands that stretches from the northeastern to the
southwestern and western sectors of the country. They are categorized into four
major groups, based primarily on specific geologic origins: the Northern Highlands
(including Kilimanjaro, Ngorongoro, and Mt. Meru), which are the result of recent
volcanoes; the Eastern Arc Mountains (EAM), which extend from southern Kenya
(the Taita Hills) to southern Tanzania (Udzungwa Mountains) and are ancient fault
block mountains; the Southern Highlands (including Mt. Rungwe, the Livingstone,
and Poroto Mountains), which are the result of both uplift and volcanism; and the
Mahale Mountains, which are part of the Albertine Rift (Griffiths 1993; Fig. 1).

Summary
7
Figure 1. Map of mountainous regions of Tanzania and surrounding countries
(adapted from Carleton and Stanley 2005). Areas above 1500 m are shaded. See
Methods and Materials for details on specific localities and sample sizes.

Summary
8
The ages of the various fault block mountains that are scattered across
Tanzania are a matter of debate. Quennel et al. (1956) suggest the Ulugurus and
Usambara Mountains originated no earlier than 25 myr bp, whereas others suggest the
Ulugurus may have originated as long as 250 myr bp (Sampson and Wright 1964;
Griffiths 1993). However, there is no argument that the fault block mountains are far
older than the volcanoes that represent some of the country’s most iconic landmarks,
and which are estimated to be no older than 1 my (Downie and Wilkinson 1972).
These mountains have been the focus of biological inquiry since the
late 1800s and many have been surveyed for a variety of biota and/or are the type
locality for numerous plants and animals. Biota investigated include bryophytes (e.g.,
Pócs 1975, 1985), angiosperms (e.g., Lovett et al. 1988, Lovett 1990, Iversen 1991,
Cordeiro and Howe 2003), invertebrates (e.g., Griswold 1991, Hoffman 1993),
reptiles and amphibians (e.g., Loveridge 1935, 1937, Menegon et al. 2008), birds
(e.g., Stuart 1983, Newmark 1991, 2006, Cordeiro 1998, Lens et al. 2002), small
mammals (e.g., Hutterer 1986, Carleton and Stanley 2005, Makundi et al. 2006,
Stanley and Hutterer 2007), and larger mammals such as primates (Davenport et al.
2006, Perkin 2007, Rovero et al. 2009), carnivorans (De Luca and Mpunga 2005), and
duikers (Rovero et al. 2005).
Because of the establishment of Amani in the East Usambara and Lushoto in
the West Usambara Mountains as administrative centers for the German colonial
government of Tanzania, the East and West Usambara Massifs are with the longest
and most in-depth history of biological investigation (Engler 1893, Barbour and
Loveridge 1928, Moreau 1935, Rodgers and Homewood 1982). However, other
mountains have been the focus of significant biological analysis and discovery.
Examples include the Uluguru Mountains (Allen and Loveridge 1927, Barbour and
Loveridge 1928, Jenkins 1984), the Udzungwa Mountains (Homewood and Rodgers
1981, Lovett et al. 1988, Dinesen et al. 1994), and the Southern Highlands (Allen and
Loveridge 1933, Gravlund 2002). Ironically, Kilimanjaro and Meru, while the most
iconic massifs of the country, have received less attention from naturalists historically
than other mountains in Tanzania (but see Heim de Balsac 1957, Demeter and
Hutterer 1986, Grimshaw et al. 1995, Hemp 2006). Intensive studies have been

Summary
9
conducted on Mt. Kilimanjaro recently (Helbig-Bonitz et al. 2013, Zancolli et al.
2014a, b, Rutten et al. 2015), but Mt. Meru has received much less attention.
Past research notwithstanding, small terrestrial mammals (shrews and rodents)
represent one vertebrate group of Tanzanian montane ecosystems that is still poorly
understood. This paucity of insight can be attributed to the secretive and, in many
cases nocturnal behavior of these mammals, but also to the lack of detailed specimen-
based inventories of individual massifs. Understanding the elevational distributions
and taxonomy of the locally occurring mammal species, as well as their ecology and
biogeography, is reliant on the data generated by such surveys. Such inventories have
been conducted on various mountains over the past two decades, but only some of the
results have been published (Stanley et al. 1996, 1998, 2005a,b, 2007, 2011a,b,
Stanley and Hutterer 2007, Stanley and Goodman 2011). Specifically detailed
elevational surveys of shrews and rodents are either sparse or lacking for Kilimanjaro
and Meru, both massifs exhibiting the effects of habitat alteration and climate change
(Lundgren and Lundgren 1972, Thompson et al. 2009). At the same time, the
taxonomy of various mammal species occurring in montane habitats on these and
nearby massifs is unresolved. One such taxon is Crocidura monax, originally
described from specimens collected on Kilimanjaro (Thomas 1910), but purportedly
occurring on neighboring mountains (Stanley et al. 2000, Hutterer 2005).
Aim of this study
Although surveys of the distribution along elevational gradients of birds (i.e. Stuart
1983, Stuart et al. 1987), and frogs (i.e. Poynton 2003, Ngalason and Mkonyi 2011,
Zancolli et al. 2014a, b) have been conducted recently, there have been few detailed
elevational transects sampling shrews and rodents on Tanzanian mountains. Two
such studies include those of Stanley and Hutterer (2007) in the Udzungwa Mountains
and Mulungu et al. (2008) on Mt. Kilimanjaro. There has been no detailed survey of
the mammals of Mt. Meru, Tanzania’s second highest mountain.

Summary
10
The taxonomy and biogeography of Tanzania’s montane mammals have
received increasing attention in the recent past. For example, the taxonomy of, and
relationships among two species of murine rodent genera found in the montane
archipelago of the country, Hylomyscus and Praomys have been the subject of recent
publications (Carleton and Stanley 2005, Carleton and Stanley 2012, Bryja et al.
2014). Montane dwelling soricomorph shrews occurring in Tanzania also have
received attention from taxonomic and biogeographic studies in recent past. The
endemic Sylvisorex howelli was described by Jenkins (1984) and the phylogeography
was analyzed by Stanley and Olson (2005), a new species of Congosorex was
described by Stanley et al. (2005b), and Stanley and Esselstyn (2010) assessed the
biogeographic and taxonomic relationships of Myosorex within Tanzania. The genus
Crocidura occurring in Tanzania has also received attention historically (Dippenaar
1980, Hutterer 1986). In particular, C. monax was first described from specimens
collected on Mt. Kilimanjaro. Subsequently this species has been listed as restricted
to Kilimanjaro (Burgess et al. 2000) or occurring on mountains within the Northern
Highlands and the Eastern Arc (Hutterer 1986, Stanley et al. 2000).
A detailed understanding of the distribution and taxonomy of Crocidura
monax has important implications for our understanding of the biogeography of the
mountains of Tanzania, a significant aspect of the Eastern Afromontane Biodiversity
Hotspot (sensu Mittermeier et al. 2004). The biogeographical relationship of
vertebrates inhabiting the Northern Highlands and Eastern Arc varies depending on
study and particular taxon of focus. For example, Stuart et al. (1993) found faunal
affinities among bird taxa occurring on both the Northern Highlands and the northern
Eastern Arc. Recent studies on the rodent Praomys taitae found affinities among
populations spanning the two montane biogeographic entities (Carleton and Stanley
2012, Bryja et al. 2014). Alternatively, another rodent, Hylomyscus arcimontensis is
broadly distributed along the Eastern Arc (and Southern Highlands) but has yet to be
documented in the Northern Highlands (Carleton and Stanley 2005). Among shrews,
Crocidura monax has been listed as occurring on not only Mt. Kilimanjaro, but also
neighboring mountains, including various mountains within the Eastern Arc

Summary
11
archipelago. However, no detailed studies of the relationships of the populations of
C. monax found on these different mountains have been undertaken.
Kingdon (1971) hypothesized two routes that, during past climatic regimes,
allowed connections between the montane habitats of central Africa and eastern
Africa: one via the mountains of Uganda and Kenya, and the other via the massifs of
southern Tanzania and up through the Eastern Arc. The Northern Highlands and the
mountains of the northern Eastern Arc lie in the intersection of these two purported
avenues.
In this study, I use specimens collected during previous surveys to evaluate the
taxonomy of the “Crocidura monax” group using morphometric comparisons, and
thereby elucidate the biogeographic relationships among populations of this purported
species. Is C. monax restricted to Kilimanjaro alone (as suggested by Burgess et al.
[2000]), or is it more broadly distributed per Hutterer (2005)? If the latter is true, are
populations of this taxonomic complex within the Northern Highlands distinct from
those of the Eastern Arc, or not? In addition, I compare the elevational distributions
of shrews and rodents on various Tanzanian mountains. How do distributional and
diversity patterns vary among different montane systems? The results of these
analyses will elucidate the elevational distributions, community ecology and
biogeographical relationships between the small mammal faunas of two geologically
distinct sets of montane archipelagos and the intersection of two purported influential
biogeographical connections to the montane environments of the Albertine Rift
(Kingdon 1971).
Summary
12
Materials and Methods
Elevational Surveys
Field methodology
Small mammals were sampled using a variety of techniques by WTS, in collaboration
with other biologists. Notable among these scientists are T. Davenport, S. M.
Goodman, K. M. Howell, P. M. Kihaule, M. J. Munissi, W. D. Newmark, and M.
Rogers. Most of the field methods involved traps of some form (which are detailed
below), but the opportune collection of other specimens found dead or collected by
hand, were also added to the analyses.
Pitfall lines
Pitfall lines were installed to capture shrews principally and, in most cases,
were positioned on narrow (< 50 cm) trails cut for this purpose. Each pitfall line were
comprised of 11 buckets, placed 5 m apart, and buried in the ground so that the top of
the bucket was level with the ground. The 15 l buckets measured 26 cm high and
with an upper and lower diameter of 26 cm and 24 cm, respectively. The bottoms of
the buckets were perforated with small holes to allow water drainage. No bait was
placed within the buckets. Each pitfall line had a 50 cm high black vertical plastic
drift fence running over the center of each bucket. The objective of these passive traps
is that mammals moving on the ground encounter the drift fence and follow it (in
either direction of the fence) until they fall into a bucket. The pitfall lines were
generally set along straight trails; however, rocks and logs occasionally forced
deviations. Indeed, locations involving dead rotting logs were sought, to maximize the
potential for shrew captures. This technique has been used with success in other
mammalogical surveys (i.e. Stanley et al. 1996, Voss and Emmons 1996). Pitfall
lines were examined twice per day, in the early morning and late afternoon.
Trap lines
Trap lines utilized three different kinds of traps: Museum Specials, 14 x 7 cm;
Victor Rat Traps (referred to here as Victor Trap), 17.5 x 8.5 cm; and medium-sized

Summary
13
Sherman Traps, 23 x 9.5 x 8 cm. The Museum Specials and Victor Traps were
manufactured by Woodstream Corporation, Lititz, Pennsylvania; the Sherman Traps
by H.B. Sherman Traps Inc., Tallahassee, Florida. Traps were set primarily for
rodents and positioned in terrestrial or arboreal settings, along existing trails, and
generally in a straight line. To maximize capture success, traps were set at sites
considered likely to be frequented by small mammals, rather than at fixed distances or
in a grid system. Consequently, distances between consecutive traps were not
constant. Bait for each trap consisted of freshly fried coconut coated in peanut butter,
and traps were rebaited each late afternoon. Additional details on this type of
trapping technique are presented by Stanley et al. (1998). Trap lines were checked
twice each day, in the early morning and mid-afternoon.
Measures of sampling effort and success
Not all traps or buckets were employed for equal amounts of time (some trap
lines were set the first day of the survey, others were installed on a subsequent day),
so I use the terms “trap night”, “bucket night” and “sample night” to quantify
sampling effort. A “trap-night” refers to one trap in operation for a 24 hr period (0700
to 0700 hrs). A “bucket-night” denotes one pitfall bucket in operation for a 24 hr
period (0700 to 0700 hrs). The term “sample-night” is used in discussion of overall
sampling effort (including the number of trap-nights and bucket-nights). I refer to the
success rate of each method as either “trap success” or “bucket success”, and calculate
these values by dividing the number of individuals captured by the number of trap-nights
or bucket-nights and multiplying by 100. In discussions involving the overall capture
success, the term “sample success” refers to the success rate for pitfall and trap
methodologies combined. This is calculated by dividing the number of individuals
captured by the number of sampling-nights and multiplying by 100.
Systematics
I follow the taxonomy presented for shrews by Hutterer (2005) and for rodents
by Carleton and Stanley (2005, 2012), Holden (2005), and Musser and Carleton
(2005).

Summary
14
Study Sites
Kilimanjaro
Mt. Kilimanjaro, located in the northeastern section of Tanzania, reaches an
elevation of 5895 m. The mountain is the conglomeration of three volcanoes (all
extinct): Kibo (the highest, most prominent and familiar), Mawenzi (the second tallest
peak of the mountain), and Shira (a plateau) (Sampson 1965). There are numerous
paths that originate in the lowlands and run up the side of the mountain, many used by
tourists to ascend the mountain (Hanby 1987). Two such routes that are on the
southeastern (and wettest) slope are “Marangu” and “Mweka”. Between these two is
the “Maua” path, which is currently closed to tourists, and is used by Kilimanjaro
National Park (KINAPA) staff to access and service facilities within the park.
Between 17 July and 31 August 2002, small mammals (shrews and rodents) were
sampled along the Maua route at five different elevations, ranging from roughly 2000
to 4000 m (Fig. 2).

Summary
15
Figure 2. Map of Mt. Kilimanjaro (adapted from Stanley et al. 2014) showing routes,
elevational contours, and study sites.
The specific localities, elevations, habitats (sensu Mwasaga 1991), and dates
of sampling are presented below. The elevations listed for each site are centered at
the associated camp and sampling efforts spanned roughly 100-200 m above and
below the camp. For this reason, I labeled each camp at the closest 500 m interval
(2043 = 2000 m; 2470 = 2500 m, etc.).

Summary
16
Site 1 - 2000 m. 4 km N, 1.5 km W Maua, 3°14.404' S, 37°27.502' E, 2043 m;
lower montane forest; 23-30 August 2002.
Site 2 - 2500 m. 7 km N, 2.5 km W Maua, 3°12.459' S, 37°26.818' E, 2470 m;
upper montane forest; 17-25 July 2002.
Site 3 - 3000 m. 10.5 km N, 3.5 km W Maua, 3°10.627' S, 37°26.413' E, 2897
m; ecotone between montane forest and ericaceous zone; 26 July-03 August 2002.
Site 4 - 3500 m. 13.5 km N, 4 km W Maua, 3°08.941' S, 37°26.133' E, 3477
m; ericaceous zone; 4-12 August 2002.
Site 5 - 4000 m. 16 km N, 4.5 km W Maua, 3°07.566' S, 37°25.600' E, 3995
m; ecotone between ericaceous and alpine zones; 13-21 August 2002.
Meru
Mt. Meru is in northeastern Tanzania and reaches an elevation of 4,566 m, and
ranks ninth among the highest ten mountains of Africa. An active volcano (the
mountain last erupted in 1910), Meru is the centerpiece of Arusha National Park. The
mountain is a popular destination for hikers, and there is one path along the
southeastern side from the lowlands towards the summit.. Between 16 July and 19
August 2009, we sampled small mammals (shrews and rodents) at five different
elevations, ranging from roughly 1950 to 3600 m, along the climbing route on the
southeastern slope of Mt. Meru (Fig. 3).

Summary
17
Figure 3. Map of Mt. Meru showing routes, elevational contours, and study sites.
All sampling sites on Mt. Meru were in Arusha National Park, Arumeru
District, Arusha Region, Tanzania. The specific localities, elevations, habitats (sensu
Demeter and Hutterer 1986), and dates of sampling are listed below. The elevations
given for each site are centered at the associated camp and sampling efforts spanned
roughly 100-200 m above and below the camp.
Site 1 - 1950 m. Fig Tree Arch, 3.24406° S, 36.82845° E, 1950 m; lower
montane forest; 16-23 July 2009.
Site 2 - 2300 m. Site 2, 3.24725° S, 36.80066° E, 2300 m; upper montane
forest; 23-30 July 2009.
Site 3 - 2650 m. Meru Crater, 3.242° S, 36.78736° E, 2650 m; ecotone
between montane forest and ericaceous zone; 13-19 August 2009.

Summary
18
Site 4 - 3000 m. Mgongo wa Tembo, 3.2235° S, 36.78675° E, 3000 m;
ericaceous zone (with some bamboo); 30 July-6 August 2009.
Site 5 - 3600 m. Near Saddle Hut, 3.21609° S, 36.76897° E, 3600 m; ecotone
between ericaceous and alpine zones; 6-13 August 2009.
Morphometric study of Crocidura monax
Specimens used in the morphometric study of the C. monax group were
collected in montane habitats on eleven isolated mountains in Tanzania, including
(from north to south): Ngorongoro, Mt. Meru, Mt. Kilimanjaro, North Pare, South
Pare, West Usambara, East Usambara, Ukaguru, Rubeho, Uluguru, and Udzungwa
(Fig. 1; specific localities listed in Appendix 1; sample sizes given in Tables 10,11).
Animals were handled following the protocol approved by the American Society of
Mammalogists (Sikes et al. 2011). Voucher specimens were prepared as museum study
skins with associated skulls and axial skeletons or embalmed in formalin. Tissues for
molecular analyses were either flash frozen in liquid nitrogen, or stored in buffer
(DMSO).
Standard museum measurements (DeBlase and Martin 1974) were taken by
WTS, with the exception of specimens collected in the East and West Usambara and
South Pare Mountains by S. M. Goodman. These measurements include: total length
(TL; from the tip of the nose to the last caudal vertebrae), head and body length (HB;
from the tip of the nose to the junction of the tail and the body), tail length (TV; from
the junction of the tail and body to the last caudal vertebrae), hind foot length (HF;
from the ankle to the tip of the longest claw; measurements by S. M. Goodman were
from ankle to the tip of the longest digit), ear length (EAR; from the notch at the base
of the ear to the longest point of the ear), and weight (W). All linear measurements
were in millimeters and the weight was measured in grams.
Cranial measurements were taken from adult skulls with hand-held digital
calipers by WTS. Adults are defined as animals with fully erupted upper molars and
the suture between the basioccipital and basisphenoid bones fused. All voucher
specimens are deposited in the Field Museum of Natural History (FMNH), Chicago,

Summary
19
and the University of Dar es Salaam (UDSM), Dar es Salaam. FMNH catalogue
numbers are presented for voucher specimens.
Statistical analyses
I calculated standard descriptive statistics (mean, range, standard deviation,
and coefficient of variation of each character) for each population. I tested for sexual
dimorphism in external and cranial variables within each montane population with
one-way analyses of variances (ANOVA). To test for geographical variation in
morphology, a one-way ANOVA (effect = mountain) was used to identify characters
that differed significantly among populations.
Discriminant function analyses of log-transformed craniodental variables were
conducted to assess multivariate patterns of variation. Variable loadings are presented
as Pearson product-moment correlation coefficients of the derived components with
the original cranial measurements. All statistical analyses were conducted using
Systat (version 11).
Based on molecular analysis performed by J. Esselstyn and T. Giarla (Stanley
et al. in press) that included samples from other Crocidura species, populations that
were sampled in Tanzania form a mitochondrial clade with two monophyletic groups.
Samples from Meru, Kilimanjaro, North Pare, South Pare, and West and East
Usambara are monophyletic (but with little support) and sister to a topotypical sample
of C. montis from Rwenzori. Ngorongoro, Rubeho, Ukaguru, Uluguru, and
Udzungwa populations form a clade and are sister to samples of C. fumosa (but with
little support) from Mt. Kenya (Stanley et al. in press).
Based on these results and the phenotypic dissimilarity of the samples from
Meru, which have multiple bristles on the tail as opposed to the naked nature the tail
of specimens from other mountains, I constrained subsequent discriminant function
analyses of cranial morphometrics to two distinct assemblages: samples from 1)
northern populations including Kilimanjaro, North Pare, South Pare, East Usambara,
and West Usambara and 2) Ngorongoro, Rubeho, Ukaguru, Uluguru, and Udzungwa.

Summary
20
RESULTS
Elevational Distribution of shrews and rodents on Kilimanjaro and Meru
Over the course of the Kilimanjaro survey, 11,562 sample-nights (8361
trap-nights and 3201 bucket-nights) were accumulated and 612 small mammals,
including 319 shrews representing six species, and 293 rodents representing 10
species were trapped (Tables 1, 2, 3). The sum quantity of captures (and overall
sample success) at each elevational site ranged from 54 [2.4%] at 3500 m to 151
[6.8%] at 2000 m (Table 1). For shrews, the lowest values were observed at the 4000
m site (34 [1.5%]) and the highest values at the 3000 m site (88 [3.6%]; Tables 1, 2).
Rodent captures exhibited the lowest (6 [0.3%]) and highest (87 [3.9%]) totals at the
3500 m and 4000 m sites, respectively (Tables 1, 3). The cumulative number of
species trapped reached an asymptote at each site, with the exception of the 2500 m
site (Fig. 4), where Dendromus insignis and Otomys angoniensis were captured on the
last day of trapping.

Summary
21
Figure 4. Species accumulation curves (for both pitfall and trap lines combined) for
each site on Kilimanjaro. The dashed lines represent the number of captures each
day; the solid lines represent the cumulative number of new species for the site
observed each day. The graph at the lower right shows the number of specimens of
shrew, rodent and mammal captured at each site.

Summary
22
Table 1. Trapping totals for rodents and shrews by trap technique on the southeastern slope of
Mt. Kilimanjaro in July-August 2002.
Elevation 2000 m 2500 m 3000 m 3500 m 4000 m Totals
BUCKETS
# bucket-nights 616 649 649 638 649 3201
# individuals 84 75 86 51 33 329
(% bucket success) (13.6) (11.5) (13.2) (8.0) (5.1) (10.3)
# species 10 5 7 3 5 13
# shrews 68 74 79 48 30 299
(% bucket success) (11.0) (11.4) (12.2) (7.5) (4.6) (9.3)
# shrew species 5 4 4 2 3 6
# rodents 16 1 7 3 3 30
(% bucket success) (2.6) (0.1) (1.1) (0.5) (0.5) (0.9)
# rodent species 5 1 3 1 2 7
TRAPS
# trap-nights 1600 1776 1785 1600 1600 8361
# individuals 67 68 57 3 88 283
(% trap success) (4.2) (3.8) (3.2) (0.2) (5.5) (3.4)
# species 5 9 11 2 4 12
# shrews 2 5 9 0 4 20
(% bucket success) (0.1) (0.3) (0.5) (0.2) (0.2)
# shrew species 1 2 3 0 1 4
# rodents 65 63 48 3 84 263
(% trap success) (4.1) (3.5) (2.7) (0.2) (5.2) (3.1)
# rodent species 4 7 8 2 3 8
TOTAL
# sample-nights 2216 2425 2434 2238 2249 11562
# individuals 151 143 143 54 121 612
(% sample success) (6.8) (5.9) (5.9) (2.4) (5.4) (5.3)
# species 11 13 14 4 6 16

Summary
23
Table 2. Elevational distribution of shrew species along the southeastern slope of Mt.
Kilimanjaro in July-August 2002. Only specimens caught in traps or buckets are
included in totals. a presence inferred from occurrence at lower and higher sites.
Elevation 2000 m 2500 m 3000 m 3500 m 4000 m Totals
Species
Crocidura allex 24 19 40 45 30 158
Crocidura hildegardeae 7 0 0 0 0 7
Crocidura monax 21 29 26 0 0 76
Crocidura olivieri 2 2 0 0 0 4
Myosorex zinki 0 3 4 3 3 13
Sylvisorex granti 16 26 18 0 a 1 61
Total # individuals 70 79 88 48 34 319
Total # species 5 5 4 2+1 a 3 6
Total # sample-nights 2216 2425 2434 2238 2249 11562
Sample success (%) 3.1 3.2 3.6 2.1 1.5 2.7
Total # caught in buckets 68 74 79 48 30 299
Total # bucket-nights 616 649 649 638 649 3201
Bucket success (%) for
pitfall lines
11.0 11.4 12.2 7.5 4.6 9.3

Summary
24
Table 3. Elevational distribution of rodent species along the southeastern slope of Mt.
Kilimanjaro in July-August 2002. Only specimens caught in traps or buckets are
included in totals. a presence inferred from occurrence at lower and higher sites.
Elevation 2000 m 2500 m 3000 m 3500 m 4000 m Totals
Species
Otomys angoniensis 0 1 1 0 0 2
Otomys tropicalis 0 4 1 0 a 7 12
Dendromus insignis 4 1 5 5 21 36
Dendromus melanotis 5 1 4 0 0 10
Grammomys
dolichurus
3 6 6 0 0 15
Lophuromys aquilus 23 25 17 0 0 65
Praomys taitae 37 25 3 0 0 65
Rhabdomys dilectus 0 0 11 1 59 71
Graphiurus murinus 9 1 5 0 0 15
Tachyoryctes daemon 0 0 2 0 0 2
Total # individuals 81 64 55 6 87 293
Total # species 6 8 10 2+1 a
3 10
Total # sample-nights 2216 2425 2434 2238 2249 11562
Sample success (%) 3.6 2.6 2.2 0.3 3.9 2.5
Total # caught in traps 65 64 48 3 84 264
Total # trap-nights 1600 1776 1785 1600 1600 8361
Trap success (%) 4.1 3.6 2.7 0.2 5.2 3.1

Summary
25
During the Meru survey, we accumulated 7,111 sample-nights (4592 trap-
nights and 2519 bucket-nights) and captured 751 small mammals, including 276
shrews representing two species, and 475 rodents representing eight species (Tables 4,
5, 6). At each elevational site, captures (and overall sample success) ranged from 49
[3.5%] at 3600 m to 257 [18.0%] at 2300 m (Table 4). For shrews, the lowest values
were recorded at the 3600 m site (20 [1.4%]) and the highest values at the 3000 m site
(87 [6.1%]; Table 5). For rodents, the lowest (29 [2.1%]) and highest (208 [14.6%])
values were observed at the 3600 m and 2300 m sites, respectively (Table 6). The
cumulative number of species trapped at a site reached an asymptote at the 1950,
2650 and 3600 sites, but new species (i.e. not yet recorded at a site) were captured at
the 2300 (where Graphiurus murinus was captured for the first time at that site on the
last day of trapping) and 3000 (where Mus triton and Otomys tropicalis were both
captured on the last day) sites. The species accumulations curves (Fig. 5) illustrate
these results.
In both surveys, sampling success for shrews was significantly greater in
buckets than in traps (X2 = 695.2 (Kilimanjaro) and X
2 = 61.3 (Meru), P < 0.01 in both
cases), and significantly more rodents were caught in traps than in buckets (X2 = 44.8
(Kilimanjaro) and X2 = 232.7 (Meru), P < 0.01), a pattern observed in past studies on
small mammals of Tanzania (Stanley et al. 1996, 1998, Stanley and Hutterer 2007).
Over the course of the two surveys, shrew species caught in traps included Crocidura
allex, C. monax, C. montis, C. olivieri, and Myosorex zinki (weighing between 3.5-
51.0 g). While most of the rodents caught in buckets were relatively small (i.e.
Dendromus insignis; 7-20 g), both specimens of Tachyoryctes daemon (240-290 g)
captured on Kilimanjaro were found in buckets.

Summary
26
Table 4. Trapping totals for rodents and shrews by trap technique on the southeastern slope of
Mt. Meru in July-August 2009.
Elevation 1950 m 2300 m 2650 m 3000 m 3600 m Totals
BUCKETS
# bucket-nights 506 506 506 506 495 2519
# individuals 52 24 18 63 13 170
(% bucket success) (10.3) (4.7) (3.6) (12.3) (2.6) (6.7)
# species 3 3 3 4 3 5
# shrews 51 22 17 58 12 160
(% bucket success) (10.1) (4.3) (3.4) (11.3) (2.4) (6.3)
# shrew species 2 2 2 2 2 2
# rodents 1 2 1 5 1 10
(% bucket success) (0.2) (0.4) (0.2) (1.0) (0.2) (0.4)
# rodent species 1 1 1 2 1 3
TRAPS
# trap-nights 920 920 920 920 912 4592
# individuals 115 233 104 93 36 581
(% trap success) (12.5) (25.5) (11.3) (9.3) (3.9) (12.6)
# species 5 6 8 9 6 9
# shrews 29 27 23 29 8 116
(% bucket success) (3.2) (2.9) (2.5) (2.8) (0.9) (2.5)
# shrew species 2 2 2 2 2 2
# rodents 86 206 81 64 28 465
(% trap success) (9.3) (22.6) (8.8) (6.5) (3.1) (10.1)
# rodent species 3 4 6 7 4 7
TOTAL
# sample-nights 1426 1426 1426 1426 1407 7111
# individuals 167 257 122 156 49 751
(% sample success) (11.7) (18.0) (8.6) (10.9) (3.5) (10.5)
# species 5 6 9 10 6 10

Summary
27
Table 5. Elevational distribution of shrew species along the southeastern slope of Mt.
Meru in July-August 2009. Only specimens caught in traps or buckets are included in
totals.
Elevation 1950 m 2300 m 2650 m 3000 m 3600 m Totals
Species
Crocidura allex 31 31 18 36 16 132
Crocidura n. sp. 49 18 22 51 4 144
Total # individuals 80 49 40 87 20 276
Total # species 2 2 2 2 2 2
Total # sample-nights 1426 1426 1426 1426 1407 7111
Sample success (%) 5.6 3.4 2.8 6.1 1.4 3.9
Total # caught in buckets 51 22 17 58 12 160
Total # bucket-nights 506 506 506 506 495 2519
Bucket success (%) for
pitfall lines
10.1 4.3 3.3 11.5 2.4 6.3

Summary
28
Table 6. Elevational distribution of rodent species along the southeastern slope of
Mt. Meru in July-August 2009. Only specimens caught in traps or buckets are
included in totals.
Elevation 1950 m 2300 m 2650 m 3000 m 3600 m Totals
Species
Otomys tropicalis 0 0 2 1 1 4
Dendromus insignis 0 0 1 7 2 10
Grammomys
dolichurus
3 4 2 4 0 13
Lophuromys
verhageni
0 18 9 30 2 59
Mus triton 0 0 0 1 0 1
Praomys taitae 79 185 38 4 0 306
Rhabdomys dilectus 0 0 24 7 24 55
Graphiurus murinus 5 1 6 15 0 31
Total # individuals 87 208 82 69 29 475
Total # species 3 4 7 8 4 8
Total # sample-nights 1426 1426 1426 1426 1407 7111
Sample success (%) 6.1 14.6 5.7 4.8 2.1 6.7
Total # caught in traps 86 206 81 64 28 465
Total # trap-nights 920 920 920 920 912 4592
Trap success (%) 9.3 22.4 8.8 6.9 3.1 10.1

Summary
29
Figure 5. Species accumulation curves (for both pitfall and trap lines combined) for
each site on Meru. The dashed lines represent the number of captures each day; the
solid lines represent the cumulative number of new species for the site observed each
day. The graph at the lower right shows the number of specimens of shrew, rodent,
and mammal captured at each site.

Summary
30
As in the survey of montane mammals in the Udzungwa Mountains (Stanley
and Hutterer 2007), the relationship between the amount of rainfall and capture of
shrews shows a greater correlation than that between rainfall and rodent captures.
Over the entire Kilimanjaro transect, the capture of individual shrews in both buckets
and traps was significantly correlated with the amount of rainfall each day, but the
capture of individual rodents was not (Table 8). A graphic representation of the
differences between shrew and rodent captures with respect to the amount of rainfall
is presented in Figure 6. During the survey of Mt. Meru, only two sites (1950 and
3000 m) received rain while buckets and traps were in place. The Product-moment
correlation coefficients (r) of amount of daily rainfall with total captures of shrews (for
buckets and traps combined) are 0.60 and 0.55 for the 1950 and 3600 m sites,
respectively. For rodents these values were both negative (-0.53 and -0.30, respectively).
While none of these r values are significant, Figure 7 illustrates the increase in shrew
captures during or shortly after measureable rainfall on Meru, a pattern not exhibited by
rodent captures. However, the overall relationship between rainfall and captures of
shrews was not as strong as in the Udzungwa survey (Stanley and Hutterer 2007).

Summary
31
Table 7. Product-moment correlation coefficients (r) of amount of daily rainfall with
four parameters of shrew and rodent daily captures on Kilimanjaro. Values in
parentheses represent strong but not significant correlations. All captures (both traps
and pitfalls) of each group are included. * = P ≤ 0.05; ** = P ≤ 0.01
Rainfall amount correlated with
(across)
Number of
individuals
Number
of
Species
New
species
added
Cumulative
species
Total, shrews (buckets and traps) 0.385* 0.422** 0.086 (0.277)
Total, rodents (buckets and traps) 0.190 (0.280) (0.230) 0.053
2000 m, shrews (0.523) (0.655) -0.025 0.262
2000 m, rodents -0.108 (0.523) 0.424 -0.008
2500 m, shrews (0.592) (0.502) -0.050 0.283
2500 m, rodents (0.544) 0.201 -0.217 0.096
3000 m, shrews 0.719* 0.199 -0.246 0.187
3000 m, rodents (0.644) (0.487) 0.139 0.122
3500 m, shrews 0.363 0.378 -0.357 0.236
3500 m, rodents -0.267 -0.060 0.286 0.334
4000 m, shrews (0.629) (0.652) 0.950** -0.160
4000 m, rodents -0.411 -0.086 0.927** -0.160

Summary
32
Figure 6. The relationship on Kilimanjaro between numbers of individuals captured
each day at each site during the sampling period and rainfall. Rodentia are on the left
and Soricomorpha are on the right.

Summary
33
Figure 7. The relationship on Meru between numbers of individuals captured each
day at each site during the sampling period and rainfall. Rodentia are on the left and
Soricomorpha are on the right.
On Kilimanjaro, a significant negative relationship exists between elevation
and the total number of shrew species collected (Table 8). Moreover, elevation was
negatively correlated with the total number of individual shrews collected and sample
success for shrews, with r values high, but not significant. Rodents do not show a
similar pattern. The relationship between elevation and total sample success, number
of individual mammals, and number of species collected for shrews and rodents
combined was generally negative, but not statistically significant. The lowest number
of individual mammals and species collected was at the 3500 m site. The greatest
number of individuals noted was at the lowest site (2000 m) and the highest species
diversity was at the 3000 m site. In most cases, the forested sites showed greater
abundance and species diversity than the habitats above tree line (Tables 1,2,3).

Summary
34
The Meru survey exhibited no notable relationship between elevation and
number of individuals or species collected, or sample success, for shrews or rodents.
A low and relatively constant number of shrew species was observed at all elevations,
and the only prominent negative relationship (high but not significant r values) exists
in the associations of the total number of individuals and total trap success with
elevation (Table 9). The highest species diversity was seen at the 3000 m site and the
lowest at the 1950 m site. While the lowest number of individuals collected was at the
3600 m site, the species diversity was higher there (six species) compared to that of
the lowest site (five species) that had the second highest sample success of any of the
sites (Table 4).
Table 8. Product-moment correlation coefficients (r) between elevation and trap success
on Kilimanjaro. Values in parentheses represent strong but not significant
correlations. Significant relationships (P < 0.05) are in bold.
Elevation correlated with (r) P
Total number of individual mammals collected -0.59 > 0.05
Total trap success -0.59 > 0.05
Total number of species collected -0.68 > 0.05
Total number of shrews collected (-0.73) > 0.05
Shrew trap success (-0.79) > 0.05
Total number of shrew species collected -0.95 < 0.05
Total number of rodents collected -0.23 > 0.05
Rodent trap success -0.21 > 0.05
Total number of rodent species collected -0.56 > 0.05

Summary
35
Table 9. Product-moment correlation coefficients (r) between elevation and trap success
on Meru. Values in parentheses represent strong but not significant correlations.
Elevation correlated with (r) P
Total number of individual mammals collected (-0.75) > 0.05
Total trap success (-0.75) > 0.05
Total number of species collected 0.59 > 0.05
Total number of shrews collected -0.53 > 0.05
Shrew trap success -0.52 > 0.05
Total number of shrew species collected - -
Total number of rodents collected -0.62 > 0.05
Rodent trap success -0.61 > 0.05
Total number of rodent species collected 0.33 > 0.05
During both surveys, most buckets and traps did not catch anything, so
captures in any individual trap or bucket were rare events. For example, although
there was a 10.3% bucket success with 329 captures on Kilimanjaro, and a 6.7%
bucket success and 170 captures on Meru for all mammals captured in 385 buckets
(77 buckets installed at each of five sites) in each survey, most buckets captured no
animals. Over the entire surveys, 203 out of 385 buckets (Kilimanjaro) and 287 out
of 385 (Meru) caught nothing. Similarly, on Kilimanjaro, traps resulted in 3.4% trap
success in 1040 individual traps, and 283 captures, with 834 traps not yielding any
animals. On Meru there was 12.6% trap success in 750 traps with 581 captures, with
only 313 traps capturing at least one animal. Both surveys had individual buckets and
traps that caught multiple animals; on Kilimanjaro, a bucket caught 10 animals and a
trap secured four animals, and on Meru, 11 animals were found in one bucket and
seven animals were obtained in one trap.
To test for “trap competition” and to determine if captures were independent
with respect to each other, we compared the observed distribution of captures by
bucket and by trap to the Poisson distribution for each individual survey. Neither
captures by buckets or traps followed the Poisson distribution (G-test for goodness of
fit = 84.0 for buckets, 10.0 for traps-Kilimanjaro; 34.0 for buckets, 63.7 for traps-
Meru; P < 0.01) suggesting a lack of trap or bucket independence. Significantly fewer
traps or buckets caught one individual than would have been expected based on the

Summary
36
assumption that the frequency of captures follows a Poisson distribution, and
significantly more caught 2, or more, than expected (Yu, 1994) .
Morphometrics of Crocidura monax
The shrews collected during the Kilimanjaro survey (see above) and referred
to Crocidura monax, agree with the series used by Thomas (1910) to describe this
species, although some specimens having no long bristles on the tail, and others
having only a few on the base of the tail. The pelage is wooly and thick and hairs
measure approximately 5 mm in length. The color above is blackish-brown, and
slightly paler below. External and cranial measurements of these specimens compared
to the holotype of C. monax (BMNH 10.7.2.58; measured by WTS) and those listed
by Thomas support the identification of the recent series sampled from Mt.
Kilimanjaro as C. monax (Tables 10, 11).
Analyses of external measurements suggested significant sexual dimorphism
in total length for the East Usambara and Kilimanjaro samples, where females were
shorter than males. The male specimens from the East Usambara, Ukaguru, and
Uluguru massifs had longer tails than females, and the East Usambara and South Pare
males exhibited a longer hindfoot than the females. The East Usambara and
Udzungwa males were heavier than females (Table 10). However, when we applied a
Bonferroni correction for multiple tests, no populations show statistically significant
dimorphism, with the exception of hindfoot length in the South Pare Mountains.
However, this one significant result may be due to the small sample size of females
(3) from this population rather than actual dimorphism.
For 17 cranial characters measured, there were significant differences between
males and females in six dimensions in the Kilimanjaro sample, four in the East
Usambara sample, two in the Uluguru series, and one in the South Pare, West
Usambara, and Rubeho samples. These differences were scattered among the
dimensions examined and Bonferroni corrections showed that the differences were
not significant when the multiple comparisons are considered, with one exception
(width of the upper third molar in the South Pare specimens, which included only

Summary
37
three females and six males). We combined sexes in all subsequent analyses in the
absence of conclusive evidence for sexual dimorphism.
Of the cranial characters measured, the width of the mastoid plate exhibited
the highest coefficients of variation within each geographic sample (7-11%; Table
11). We deleted this character in subsequent analyses of geographic variation. F-
values produced by the one-way ANOVA to test the null hypothesis of no significant
geographic variation were all highly significant (P < 0.001). The greatest amount of
morphologic heterogeneity was exhibited by those characters associated with the
length of the skull, including CI, BL, UTRL, M&I, and LTR. Bimaxillary width was
also notably heterogeneous. In general, cranial dimensions were largest in the East
Usambara sample (14 of the 16 characters) and the Meru sample was the smallest of
the 11 geographic samples measured in 12 of the 16 characters (Table 11).
The discriminant function analysis (DFA) constrained to the Ngorongoro,
Rubeho, Ukaguru, Uluguru, and Udzungwa populations correctly classified ≥ 80% of
specimens to their respective localities and resulted in the first two components
having eigenvalues that all exceeded 1. The first two factors explained 76.3 and
13.9% of the variation. The Ngorongoro population was strikingly small and distinct.
The remaining mountain localities all overlapped in canonical variate space, with the
Uluguru samples showing the most differentiation along CV2 (Fig. 8).

Summary
38
Figure 8. Projection of specimen scores on the first two canonical variates extracted
from a discriminant function analysis of 16 log-transformed cranial and dental
variables. Measurements were recorded from adult specimens from five populations
of Crocidura spp. from Ngorongoro (n = 16), Rubeho (n = 10), Udzungwa (n = 31),
Ukaguru (n = 68) and Uluguru mountains (n = 34).
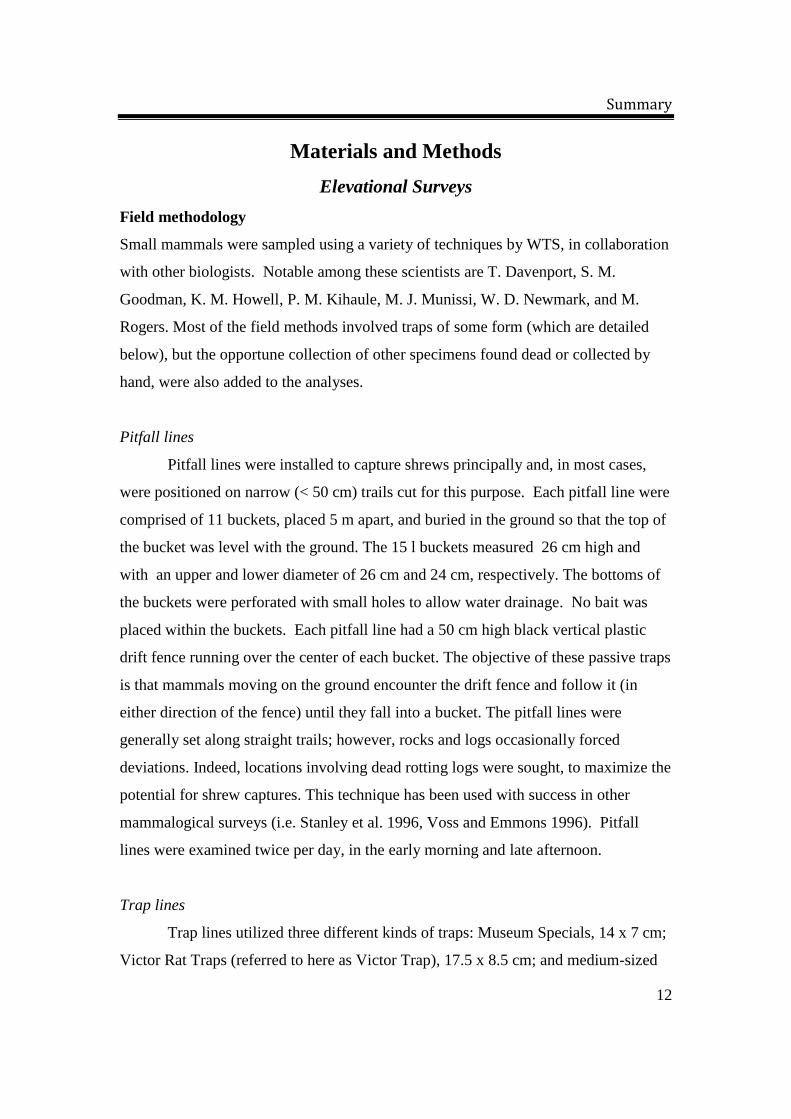
Three sets of two overlapping populations each are reflected in the DFA of the
Kilimanjaro, North Pare, South Pare, East Usambara, and West Usambara samples,
where ≥ 91% of specimens were correctly classified to mountain. The first two factors
explained 73.2 and 16.7% of the variation. Overlap in canonical variate space is
exhibited between the East and West Usambara samples, Mt. Kilimanjaro, and the
North Pare samples, and the South Pare and Magamba samples. The large sizes of
both C. tansaniana in the East Usambaras, first observed by Hutterer (1986), and the
sample from the West Usambaras are reflected in the position of the those two
operational taxonomic units (OTUs) along CV1 and the greater PPL of the
Summary
39
Kilimanjaro and North Pare samples relative to the South Pare and Magamba samples
is reflected by the dispersion of specimen scores along CV2 (Fig. 9).
Figure 9. Projection of specimen scores on the first two canonical variates extracted
from a discriminant function analysis of 16 log-transformed cranial and dental
variables. Measurements were recorded from adult specimens from six populations,
including Kilimanjaro (n=55), North Pare (n=11), South Pare (n=9), West Usambara
(Shume-Magamba; n=3), West Usambara (Ambangulu; n=17), and East Usambara
(n=44). Specimens from Mt. Meru were excluded.

Summary
40
Table 10. External measurements of individuals of Crocidura from 11 mountains in Tanzania and four
holotypes. All measurements were taken by WTS, with the exception of the West Usambara sample,
and those of the holotypes where the measurements were recorded from original skin tags or literature.
Mean ± standard deviation, range, sample size, and CV. See text for character definitions.
TL HB TV HF EAR WT
Meru 130.69 6.03 116.00 – 144.00
N = 115
0.05
77.37 3.95 65.00 – 85.00
N = 115
0.05
53.31 3.37 45.00 – 60.00
N = 115
0.06
15.03 0.61 13.00 – 16.00
N = 115
0.04
9.35 0.58 8.00 – 10.00
N = 115
0.06
8.53 1.09 6.00 – 11.00
N = 115
0.13
Ngorongoro 139.38 3.36
134.00 – 145.00
N = 16 0.02
81.69 3.89
76.00 – 91.00
N = 16 0.05
57.69 3.53
52.00 – 65.00
N = 16 0.06
15.38 0.62
14.00 – 16.00
N = 16 0.04
10.63 0.62
9.00 – 11.00
N = 16 0.06
8.61 0.59
7.30 – 9.60
N = 16 0.07
Kilimanjaro 155.58 6.95
141.00 – 172.00 N = 55
0.04
91.49 4.25
83.00 – 101.00 N = 55
0.05
64.09 3.67
55.00 -71.00 N = 55
0.06
17.00 0.67
16.00 -19.00 N = 55
0.04
10.85 0.56
10.00 – 12.00 N = 55
0.05
13.92 1.44
10.00 – 17.00 N = 53
0.10
North Pare 149.80 4.80
140.00 – 158.00 N = 10
0.03
89.90 3.75
84.00– 96.00 N = 10
0.04
60.09 2.21
56.00 – 63.00 N = 11
0.04
16.73 0.47
16.00 – 17.00 N = 11
0.03
10.18 0.40
10.00 – 11.00 N = 11
0.04
11.79 1.72
9.20 – 15.50 N = 11
0.15
South Pare 140.00 5.39 132.00 – 146.00
N = 7
0.04
81.71 3.68 75.00 – 85.00
N = 7
0.05
58.29 3.04 54.00 – 62.00
N = 7
0.05
15.63 0.52 15.00 – 16.00
N = 8
0.03
9.63 0.52 9.00 – 10.00
N = 8
0.05
9.45 0.65 8.40 – 10.50
N = 8
0.07
West Usambara 159.65 5.69 150.00 – 170.00
N = 17
0.04
93.88 3.98 85.00 – 99.00
N = 17
0.04
65.76 2.84 60.00 – 71.00
N = 17
0.04
16.29 0.69 15.00 – 17.00
N = 17
0.04
10.21 0.47 9.50 – 11.00
N = 17
0.05
13.85 1.23 12.00 – 16.50
N = 17
0.09
East Usambara 163.00 8.22
148.00 – 176.00
N = 21 0.05
94.33 6.46
82.00 – 104.00
N = 21 0.07
68.67 3.07
64.00 – 75.00
N = 21 0.04
17.38 0.74
16.00 – 19.00
N = 21 0.04
10.95 0.59
10.00 – 12.00
N = 21 0.05
15.31 2.27
11.00 – 20.00
N = 21 0.15
Ukaguru 173.57 6.59
159.00 – 191.00
N = 68
0.04
94.09 5.20
77.00 – 106.00
N = 68
0.06
79.49 4.74
66.00 – 95.00
N = 68
0.06
17.40 0.65
16.00 – 19.00
N = 68
0.04
12.37 0.54
11.00 – 13.00
N = 68
0.04
15.93 1.56
12.50 – 19.50
N = 68
0.10
Rubeho 177.36 7.59
166.00 – 190.00 N = 11
0.04
93.73 4.22
87.00 – 101.00 N = 11
0.05
83.64 4.78
77.00 – 93.00 N = 11
0.06
17.18 0.75
16.00– 18.00 N = 11
0.04
10.82 0.75
10.00 – 12.00 N = 11
0.07
13.00 1.30
11.00 – 15.00 N =11
0.10
Uluguru 169.82 7.91
158.00 – 187.00 N = 33
0.05
89.12 4.01
82.00 – 97.00 N = 33
0.05
80.94 5.47
70.00 – 95.00 N = 34
0.07
17.03 0.80
16.00 – 19.00 N = 34
0.05
11.15 0.67
10.00 – 13.00 N = 33
0.06
12.32 1.39
9.50 – 15.50 N = 33
0.11
Udzungwa 167.33 8.97 151.00 – 187.00
N = 30
0.05
86.53 6.44 75.00 – 101.00
N = 30
0.07
80.80 3.51 74.00 – 88.00
N = 30
0.04
17.29 0.86 15.00– 19.00
N = 31
0.05
10.90 0.75 9.00 – 12.00
N = 31
0.07
14.32 2.24 10.00 – 19.50
N =31
0.16
C. monax -
Holotype
88 66 16.2 10
C. montis -
Holotype
77 61 15 11
C. tansaniana -
Holotype
109 65 17 13 15
C. usambarae -
Holotype
80 63 15 8

Summary
41
Table 11. Cranial measurements of individuals of Crocidura from 11 mountains in Tanzania (sexes combined within populations), two
holotypes, and one set of paratypes. Mean ± standard deviation, range, sample size, and CV. See text for character definitions.
CI BL PPL UTRL LIW BW NW GW HBC
Ngorongoro
21.49 0.25
21.09 – 21.95
N = 16 0.02
19.30 0.23 18.88 – 19.68
N = 16
0.01
9.89 0.16 9.59 – 10.12
N = 16
0.02
9.14 0.16 8.83 – 9.40
N = 16
0.02
4.59 0.09 4.43 – 4.73
N = 16
0.02
6.28 0.12 6.06 – 6.50
N = 16
0.02
1.98 0.08 1.83 – 2.12
N = 16
0.04
9.80 0.13 9.53 – 10.03
N = 16
0.01
6.55 0.16 6.26 – 6.80
N = 16
0.02
Meru
20.75 0.47
19.50 – 21.58 N = 67
0.02
18.61 0.42
17.49 – 19.43
N = 67 0.02
9.37 0.24
8.61 – 9.91
N = 67 0.03
9.04 0.23
8.52 – 9.55
N = 67 0.03
4.84 0.11
4.58 – 5.08
N = 67 0.02
6.31 0.15
5.91 – 6.62
N = 67 0.02
1.84 0.08
1.63 – 2.01
N = 66 0.04
9.70 0.23
9.22 – 10.15
N = 67 0.02
6.38 0.23
5.73 – 6.86
N = 67 0.04
Kilimanjaro
23.26 0.48
22.32 – 24.15
N = 55 0.02
21.03 0.44 20.32 – 21.89
N = 55
0.02
10.56 0.24 10.02 – 11.08
N = 55
0.02
10.21 0.21 9.71 – 10.58
N = 55
0.02
5.18 0.14 4.84 – 5.51
N = 55
0.03
7.06 0.13 6.77 – 7.30
N = 55
0.02
1.92 0.10 1.65 – 2.11
N = 55
0.05
10.42 0.25 9.86 – 11.01
N = 55
0.02
7.02 0.32 6.36 – 8.04
N = 55
0.05
North Pare
23.05 0.52
22.31 – 23.95 N = 11
0.02
20.99 0.51
20.24 – 21.85
N = 11 0.02
10.41 0.26
10.06 – 10.93
N = 11 0.03
10.33 0.23
9.94 – 10.77
N = 11 0.02
5.06 0.11
4.83 – 5.18
N = 11 0.02
7.16 0.19
6.80 – 7.39
N = 11 0.03
2.12 0.07
2.02 – 2.21
N = 11 0.03
10.27 0.17
9.88 – 10.51
N = 11 0.02
6.76 0.33
6.44 – 7.64
N = 11 0.05
South Pare
22.16 0.36
21.34 – 22.56
N = 9 0.02
19.96 0.34 19.16 – 20.33
N = 9
0.02
9.83 0.19 9.56 – 10.24
N = 9
0.02
9.78 0.18 9.46 – 9.97
N = 9
0.02
5.05 0.10 4.93 – 5.22
N = 9
0.02
6.81 0.16 6.60 – 7.04
N = 9
0.02
1.93 0.09 1.81 – 32.09
N = 9
0.05
9.92 0.23 9.50 – 10.25
N = 9
0.02
6.38 0.18 6.16 –6.62
N = 9
0.03
West
Usambara
23.71 0.46
22.92 – 24.70 N = 17
0.02
21.40 0.43
20.86 – 22.36
N = 17 0.02
10.62 0.24
10.23 – 11.11
N = 17 0.02
10.50 0.19
10.26 – 11.01
N = 17 0.02
5.17 0.15
4.87 – 5.37
N = 17 0.03
7.37 0.15
7.14 – 7.64
N = 17 0.02
2.19 0.09
2.01 – 2.36
N = 17 0.04
10.63 0.25
10.06 – 11.04
N = 17 0.02
6.94 0.20
6.51 – 7.39
N = 17 0.03
East
Usambara
25.09 0.49
23.82 – 26.12
N = 44 0.02
22.81 0.45
21.85 – 23.95
N = 44
0.02
11.33 0.28
10.85 – 11.94
N = 44
0.02
11.12 0.25
10.75 – 12.05
N = 44
0.02
5.44 0.21
5.00 – 6.04
N = 44
0.04
7.66 0.18
7.25 – 8.04
N = 44
0.02
2.22 0.11
1.99 – 2.54
N =44
0.05
10.88 0.28
10.35 – 11.60
N = 44
0.03
6.97 0.20
6.57 – 7.50
N = 44
0.03

Summary
42
Ukaguru
24.51 0.46
23.38 – 25.76
N = 68 0.02
22.22 0.43 21.11 – 23.32
N = 68
0.02
10.97 0.28 10.08 – 11.4
N = 69
0.03
10.75 0.23 10.15 – 11.29
N = 68
0.02
5.33 0.14 5.05 – 5.75
N = 69
0.03
7.65 0.17 7.23 – 8.06
N = 69
0.02
2.28 0.15 1.99 – 2.56
N = 68
0.07
10.79 0.26 10.10 – 11.47
N = 69
0.02
7.02 0.20 6.63 – 7.70
N = 69
0.03
Rubeho
24.12 0.41 23.49 – 24.63
N = 10
0.02
21.87 0.34
21.27 – 22.27 N = 10
0.02
10.74 0.17
10.46 – 11.05 N = 10
0.02
10.66 0.20
10.32 – 10.93 N = 10
0.02
5.22 0.12
5.02 – 5.40 N = 10
0.02
7.61 0.23
7.21 – 7.89 N = 10
0.03
2.20 0.15
1.97 – 2.38 N = 10
0.07
10.63 0.14
10.30 – 10.78 N = 10
0.01
6.99 0.19
6.68 – 7.32 N = 10
0.03
Uluguru
24.03 0.51
22.70 – 24.89
N = 34 0.02
21.69 0.52 20.21 – 22.60
N = 34
0.02
10.54 0.32 9.65 – 11.15
N =34
0.03
10.65 0.21 10.20 – 11.02
N = 34
0.02
5.30 0.15 4.89 – 5.60
N = 34
0.03
7.30 0.22 6.72 – 7.74
N =34
0.03
2.19 0.10 1.94 – 2.34
N = 34
0.05
10.25 0.22 9.82 – 10.70
N = 33
0.02
6.95 0.23 6.53 – 7.54
N = 33
0.03
Udzungwa
23.78 0.37 23.10 – 24.71
N = 31
0.02
21.45 0.37
20.73 – 22.33 N = 31
0.02
10.60 0.25
10.12 – 11.11 N = 31
0.02
10.52 0.25
10.04 – 10.99 N = 31
0.02
5.28 0.16
4.79 – 5.62 N = 31
0.03
7.54 0.27
6.68 – 8.20 N = 31
0.04
2.24 0.11
2.00 – 2.45 N = 31
0.05
10.55 0.25
9.96 – 11.05 N = 31
0.02
7.24 0.38
6.64 – 8.99 N = 31
0.05
C. usambarae
Paratypes
21.98 0.22
21.74 – 22.18
N = 3
0.01
19.93 0.25
19.65 – 20.08
N = 3 0.01
9.99 0.15
9.77 – 10.11
N = 5 0.02
9.76 0.40
9.59 – 9.88
N = 4 0.01
4.94 0.03
4.91 – 4.97
N = 4 0.01
6.89 0.40
6.66 – 7.00
N = 5 0.02
1.97 0.08
1.87 – 2.09
N = 5 0.04
10.14 0.12
10.00 – 10.29
N = 4 0.01
6.50 0.18
6.31 – 6.67
N = 4 0.03
C. monax
Holotype 23.67 21.30 10.51 10.60 5.12 7.22 2.24 10.30 6.88
C. tansaniana
Holotype 25.36 23.10 11.51 11.20 5.40 7.95 2.32 10.99 6.93

Summary
43
Table 11 (CONTINUED). Cranial measurements of individuals of Crocidura from 11 mountains in Tanzania (sexes combined
within populations), two holotypes, and one set of paratypes. Mean ± standard deviation, range and sample size, and CV. See text
for character definitions.
I3–W C–W M
3–L M
3–W PGW MP M&I LTR
Ngorongoro
0.71 0.03
0.65 – 0.75
N = 16
0.04
0.77 0.03 0.71 – 0.83
N = 16
0.04
1.37 0.05 1.26 – 1.45
N = 16
0.04
0.73 0.03 0.67 – 0.80
N = 16
0.05
6.61 0.12 6.43 – 6.83
N = 16
0.02
1.08 0.14 0.94 – 1.45
N = 16
0.13
13.34 0.17 13.08 – 13.65
N = 16
0.01
8.52 0.14 8.23 – 8.72
N = 16
0.02
Meru
0.69 0.03
0.62 – 0.78 N = 67
0.05
0.73 0.03
0.64 – 0.80
N = 67 0.05
1.45 0.07
1.31 – 1.59
N = 67 0.04
0.77 0.04
0.70 – 0.86
N = 67 0.05
6.55 0.16
5.99 – 6.93
N = 49 0.02
1.04 0.08
0.91 – 1.32
N = 67 0.08
13.05 0.35
12.13 – 13.76
N = 67 0.03
8.35 0.23
7.80 – 8.98
N = 67 0.03
Kilimanjaro
0.80 0.03
0.71 – 0.87
N = 55 0.04
0.90 0.04 0.80 – 0.97
N = 55
0.04
1.57 0.06 1.44 – 1.69
N = 55
0.04
0.84 0.04 0.74 – 0.95
N = 55
0.05
7.06 0.19 6.67 – 7.56
N = 55
0.03
0.99 0.10 0.75 – 1.20
N = 55
0.10
14.80 0.36 14.01 – 15.51
N = 55
0.02
9.51 0.19 9.04 – 9.81
N = 55
0.02
North Pare
0.84 0.04
0.78 – 0.92 N = 11
0.05
0.94 0.04
0.88 – 1.01
N = 11 0.04
1.62 0.06
1.50 – 1.69
N = 11 0.04
0.83 0.04
0.74 – 0.87
N = 11 0.05
6.99 0.15
6.85 – 7.36
N = 11 0.02
1.08 0.08
0.94 – 1.21
N = 11 0.07
14.73 0.34
14.26 – 15.29
N = 11 0.02
9.59 0.20
9.23 – 9.95
N = 11 0.02
South Pare
0.80 0.03
0.76 – 0.84
N = 9 0.04
0.88 0.03 0.82– 0.90
N = 9
0.03
1.49 0.07 1.36 – 1.06
N = 9
0.50
0.77 0.30 0.73 – 0.83
N = 9
0.05
6.81 0.10 6.66 – 6.94
N = 9
0.01
1.14 0.10 0.94 – 1.28
N = 9
0.11
14.04 0.27 13.44 – 14.33
N = 9
0.02
9.07 0.18 8.78 – 9.30
N = 9
0.02
West
Usambara
0.97 0.03
0.91 – 1.02 N = 17
0.03
1.01 0.03
0.95 – 1.05
N = 17 0.03
1.71 0.06
1.59 – 1.79
N = 17 0.04
0.87 0.05
0.81 – 0.98
N = 17 0.06
7.28 0.24
6.93 – 7.71
N = 17 0.03
1.20 0.10
1.06 – 1.41
N = 17 0.08
15.08 0.34
14.49 – 15.69
N = 17 0.02
9.74 0.20
9.47 – 10.26
N = 17 0.02
East
Usambara
0.98 0.04
0.90 – 1.07
N = 44 0.04
1.01 0.40 0.93 – 1.10
N = 44
0.04
1.72 0.07 1.58 – 1.93
N = 44
0.04
0.87 0.05 0.76 – 0.97
N = 44
0.06
7.50 0.22 7.19 – 8.12
N = 43
0.03
1.23 0.13 0.94 – 1.48
N = 44
0.11
16.04 0.33 15.19 – 16.88
N = 44
0.02
10.29 0.22 9.84 – 11.05
N = 44
0.02

Summary
44
Ukaguru
0.88 0.05
0.74 – 1.07
N = 69 0.06
1.01 0.05 0.88 – 1.10
N = 69
0.04
1.67 0.07 1.50 – 1.80
N = 69
0.04
0.82 0.05 0.68 –0.91
N = 69
0.06
7.61 0.23 7.00 – 8.15
N = 69
0.03
1.01 0.11 0.79 – 1.31
N = 69
0.11
15.51 0.35 14.64 – 16.38
N = 67
0.02
9.96 0.20 9.49 – 10.42
N = 67
0.02
Rubeho
0.86 0.04 0.79 – 0.91
N = 10
0.04
0.97 0.03
0.91 – 1.02 N = 10
0.04
1.65 0.06
1.54 – 1.73 N = 10
0.04
0.87 0.03
0.81 – 0.91 N = 10
0.04
7.28 0.15
7.02 – 7.55 N = 10
0.02
1.22 0.15
0.97 – 1.42 N = 10
0.12
15.12 0.28
14.70 – 15.49 N = 10
0.02
9.81 0.17
9.56 – 10.03 N = 10
0.02
Uluguru
0.87 0.04
0.78 – 0.94
N = 34 0.05
0.98 0.05 0.78 – 1.05
N = 34
0.05
1.63 0.07 1.49 – 1.79
N = 34
0.04
0.79 0.04 0.72 – 0.88
N = 34
0.05
7.21 0.22 6.82 – 7.72
N =34
0.03
1.15 0.13 0.87 – 1.41
N = 34
0.11
15.27 0.36 14.49 – 15.84
N = 34
0.02
9.90 0.17 9.54 – 10.21
N = 34
0.02
Udzungwa
0.88 0.06 0.77 – 0.98
N = 31
0.06
0.97 0.04
0.90 – 1.03 N = 31
0.04
1.66 0.08
1.50 – 1.90 N = 31
0.05
0.83 0.04
0.77 – 0.92 N = 31
0.05
7.42 0.23
6.98 – 7.85 N = 31
0.03
1.06 0.14
0.82 – 1.42 N = 31
0.13
14.93 0.28
14.52 – 15.57 N = 31
0.02
9.76 0.23
9.34 – 10.12 N = 31
0.02
C. usambarae
Paratypes
0.90 0.04
0.84 – 0.93
N = 5
0.04
0.91 0.02
0.88 – 0.94
N = 5 0.02
1.64 0.08
1.53 – 1.77
N = 6 0.05
0.82 0.05
0.74 – 0.89
N = 6 0.07
6.82 0.15
6.58 – 6.93
N = 5 0.02
1.05 0.12
0.92 – 1.16
N = 4 0.11
13.87 0.26
13.45 – 14.19
N = 6 0.02
9.03 0.22
8.74 – 9.38
N = 6 0.02
C. monax
Holotype 0.88 0.94 1.69 0.85 7.05 1.13 15.12 9.87
C. tansaniana
Holotype 0.93 0.99 1.76 0.86 7.51 1.08 16.00 10.30

Summary
45
Conclusion
This study demonstrates that populations of purported “C. monax” on discrete
mountains within the Northern Highlands and EAM represent different taxa. Of the
populations studied, the samples from Ngorongoro were the smallest in cranial
characteristics. Based on discriminant function analysis, samples from the following
mountain pairs (neighboring each other geographically) overlapped in morphological
space: Kilimanjaro and North Pare; South Pare and the northwestern segment of the
West Usambaras; and the East Usambaras and the eastern edge of the West
Usambaras. Each of these pairs shows modest morphological differentiation between
mountain localities. For example, the specimens from Kilimanjaro are generally larger
than those from North Pare, shrews from the East Usambaras are larger than in the
eastern section of the West Usambaras, and C. usambarae from South Pares are
subtly larger in some cranial dimensions than the paratypes from the West Usambara
Mountains (Table 11). The middle Eastern Arc Mountains (EAM) (Rubeho, Ukaguru,
Uluguru, and Udzungwa) also show overlap in morphological space, with the sample
from the Uluguru being the most distinct of the four massifs included in the analysis.
Coupled with molecular analyses (Stanley et al. in press), the results indicate
that Crocidura monax is restricted to Kilimanjaro and North Pare, but is a member of
a complex that includes the East and West Usambaras (C. tansaniana), the South
Pares (C. usambarae), Ngorongoro (Crocidura ndumai), Meru (Crocidura newmarki),
and the middle EAM -- Rubeho, Ukaguru, Uluguru, and Udzungwa (Crocidura
munissii). This geographic distribution of members of the C. monax complex is
significant as it spans two geologically distinct mountain groups—the Northern
Highlands and the EAM, but with significant differences exhibited among discrete
populations within both sets of montane archipelagos. For example, three unique
forms occur on Ngorongoro, Meru and Kilimanjaro, respectively, within the Northern
Highlands. The EAM house distinct forms of the monax complex, as well, as
evidenced by the differences between crania of specimens from the middle EAM
compared to those found in the Pare and Usambara massifs.
The C. monax complex as elucidated by this study is another example of
soricine shrews that are restricted to subsets of the montane islands of Tanzania and
that exhibit a mosaic of distributional and biogeographical patterns. For example,
Summary
46
Congosorex phillipsorum was described based on specimens from the West
Kilombero Scarp forests in the Udzungwa Mountains (Stanley et al. 2005b). To date,
no other populations of this species have been discovered and the closest relatives of
this taxon are in the Congo basin (Hutterer 2005), at least 2000 km to the west. Thus,
this unique shrew represents a remnant of an ancient Miocene connection of forests
between central Africa and the EAM (Axelrod and Raven 1978, Stanley et al. 2005b).
Other vertebrate species within the same forest area exhibit ancient connections
including Rungwecebus kipunji (found only in the West Kilimbero forest and the
Southern Highlands; Davenport et al. 2006) and Xenoperdix udzungwensis (with
affinities to taxa in Asia; Dineson et al. 1994,), rendering the Udzungwa Mountains
(and the West Kilombero Scarp area) unique among montane habitats within
Tanzania.
Sylvisorex howelli is endemic to the northern and central EAM, including the
East and West Usambara, Nguru, Nguu, Rubeho, Ukaguru and Uluguru mountains.
Stanley and Olson (2005) described the phylogeography and documented the presence
of this species on all but one of these mountains (the Rubeho population was
discovered subsequent to this analysis). No records exist of this shrew on other
mountains, including the Udzungwa massif, the Northern or Southern Highlands,
even after intensive sampling of shrews on each. Thus, S. howelli is endemic to a
subset of the EAM. Like the C. monax group in this study, phylogeographic
relationships mirrored geographic patterns. For example, based on molecular
evidence, the East and West Usambara populations of S. howelli were sister to each
other, as were the Nguu and Nguru populations. The Ukaguru and Uluguru
populations were the most differentiated (Stanley and Olson 2005). The affinities of
this species within the Soricidae is under investigation.
Myosorex is represented within Tanzania by three different species, including
M. zinki (endemic to Mt. Kilimanjaro), M. geata (found on central EAM including the
Rubeho, Ukaguru and Uluguru mountains) and M. kihaulei found on Udzungwa
Mountains and the Southern Highlands (Stanley and Esselstyn 2010). In contrast to
the present study where a species of the C. monax complex spanned the Ruaha River,
Stanley and Esselstyn (2010) found a taxonomic separation between populations of
Myosorex on either side of the Ruaha River (M. geata on the northeastern side in the
Rubeho, Ukaguru and Uluguru mountains) , and M. kihaulei on the southwestern side

Summary
47
(in the Udzungwa Mountains and Southern Highlands). As with S. howelli, the
origins of these isolated populations are still unknown.
The demonstration of distributional patterns of various species of the C.
monax complex spanning the Northern Highlands and the EAM is concordant with
work by Carleton and Stanley (2005) and Bryja et al. (2014), who grouped samples of
Praomys from Kilimanjaro and the northern EAM, such as the Usambaras and South
Pare, using both morphologic and molecular analyses. These studies argue against a
pervasive influence of the different montane systems on the individual populations
contained within each of them or a significant biogeographical boundary between the
Northern Highlands and the EAM (sensu Kingdon 1971).
However, because of detailed faunal surveys conducted over the past two
decades (Stanley et al. 1996, 1998, 2005a,b, 2007, 2011a,b, Stanley and Hutterer
2007, Stanley and Goodman 2011, W. T. Stanley unpubl. data) there is now multiple
evidence that two rodent genera commonly found on EAM and Southern Highlands,
Beamys and Hylomyscus, do not occur on the Northern Highlands (Carleton and
Stanley 2005, 2012, Stanley and Goodman 2011, Stanley et al. 2014). This is in
contrast to distribution of Praomys, as discussed above. While the distribution of
Beamys is enigmatic because of its presence in lowland coastal forested habitat
(Stanley and Goodman 2011), the comparison between the distributions of
Hylomyscus and Praomys (both restricted to submontane or montane forests) is
intriguing because one species of the former, H. arcimontensis, is distributed along
the entire EAM within Tanzania, and throughout the Southern Highlands. Praomys,
on the other hand, is represented by one species, P. taitae, distributed throughout the
Northern Highlands, and the EAM, and another, P. melanotus, in the Southern
Highlands. As Carleton and Stanley (2012) pointed out, based on data generated by
faunal surveys, Hylomyscus is the more restricted of the two, with regard to elevation.
Praomys has been recorded as low as 230 m in the East Usambara Mountains,
whereas the lowest elevation Hylomyscus has been observed is 900 m. In addition,
trap success of Hylomyscus is much higher than Praomys in arboreal settings (Stanley
and Goodman 2011, Carleton and Stanley 2012). All of this leads to the suggestion
that Praomys would be more likely to disperse between montane habitats along
lowland corridors produced by conditions allowing the lowering of vegetations belts
in the past (Lovett 1993). This might explain the distribution of Praomys spanning
the EAM and the Northern Highlands, and the absence of Hylomyscus on the latter.

Summary
48
However, the reverse situation exists across the gap between the Southern Highlands
and the southern end of the EAM, where Hylomyscus arcimontensis is found on both
montane entities, but Praomys is represented by two unique species on each. Thus,
the absence of Hylomyscus and Beamys within montane habitats of the Northern
Highlands suggests that the distinction between this volcanic island set and the older
EAM has some biogeographic influence.
Elevational transects have now been conducted on three mountains in
Tanzania, including two from the Northern Highlands: Kilimanjaro and Meru, and
one from the EAM: Udzungwa. Because of deforestation, detailed analyses of the
natural elevational distribution of montane mammals are not possible on most of the
other mountains within the country. All surveys in this study were conducted on the
wettest versant of the mountains, which in each case was either the eastern or the
southeastern slope, and carried out during the same time of the year, July and August
(the dry season) using identical trapping regimes and techniques. Thus, I feel
confident making the biogeographic comparisons discussed above, as well as
comparisons among surveys to determine similarities or differences in faunal
abundance and diversity of the shrews and rodents living on these mountains.
Comparisons constrained to these three mountains illustrate a much richer
fauna, but lower abundance, in the Udzungwa Mountains vs. the two massifs of the
Northern Highlands. In terms of species diversity, Udzungwa was the richest (23
species), Meru was the most depauperate (10 species), and Kilimanjaro fell midway
with 16 species. The reverse was observed for the abundance of mammals, based on
sample success. Meru had the greatest abundance (10.5% sample success), followed
by Kilimanjaro (5.3% sample success), and Udzungwa (3.3% sample success). This
same pattern was seen when taxonomic groups are considered. Udzungwa had the
greatest shrew diversity but lowest abundance (three genera, nine species; 1.4%
sample success), followed by Kilimanjaro (three genera, six species; 2.7%), and Meru
(one genus, two species; 3.9%). Udzungwa also had the highest rodent diversity and
lowest abundance (11 genera, 14 species; 2.0%), Kilimanjaro (eight genera, 10
species; 2.5%) and Meru (eight genera, eight species; 6.7%).
A mid-elevational peak in species richness (sensu Heaney and Rickart 1990,
McCain 2005) was observed on both Northern Highlands massifs, at 3000 m. Such a
pattern was not observed during the Udzungwa survey where the greatest taxonomic
diversity was documented at 2000 m (the highest point of the transect). Significantly,

Summary
49
the 3000 m sites on each of the Northern Highland sites were at the ecotone between
forest and alpine habitats, each with species unique to those habitats (for example,
Praomys in the forest, and Rhabdomys in the alpine grassland). The highest point of
the Udzungwa survey was set in montane forest.
The vast majority of the species documented during these surveys are either
endemic or restricted to montane habitats within eastern Africa. Importantly, with
one exception, there were no commensals documented on the Northern Highlands,
and only one specimen of Rattus rattus was observed in the Udzungwa survey
(Stanley and Hutterer 2007). This is in contrast to patterns documented by Goodman
and Carleton (1997) in Madagascar where Rattus was abundant in montane forests far
from human settlements.
The relatively high diversity of small terrestrial mammals on the ancient fault
block mountain (Udzungwa) relative to the more recent volcanoes may be due to the
geologic origin or the age of the mountain. Surveys of the shrews over a three year
period in the East and West Usambara Mountains (of the same geologic category as
Udzungwa) exhibited three genera and 10 species, and three genera and six species,
respectively (Stanley et al. 2011a). While these surveys were in one general
elevational range (roughly 1000 to 1300 m), and included habitat mosaics including
agricultural land as well as disturbed forest, so may not reflect the overall diversity of
small mammals along the extent of the elevational range of the massif, the
comparison is interesting in that the East and West housed shrew diversity that either
exceeded that of the Udzungwas (in the case of the East Usambaras), or equaled that
of Kilimanjaro (West Usambaras). For rodents, both the East and West Usambaras
exhibited greater rodent diversity than the Udzungwas (10 genera and 12 species in
the East and nine genera and 10 species in the West Usambaras; Stanley and
Goodman 2011a). Thus, the small mammal diversity in each of these larger northern
EAM is consistently equal to, or greater than that of the Northern Highlands.
Meru remains enigmatic in the notable low shrew diversity, with only
two species, recovered during the survey of that mountain, compared to six on
Kilimanjaro and nine on Udzungwa. When placed in a broader context, this level of
diversity is lower than any of the 18 individual sites spanning the Afro-Malagasy
region cited by Stanley and Goodman (2011), where the diversity values ranged from
three to 17 species and involved independently evolved taxonomic groups of
insectivorous mammals (tenrecs and soricid shrews). The reasons for such a striking

Summary
50
low diversity on Meru are unknown. Volcanic activity on the mountain has been
recent in comparison to Kilimanjaro (Guest and Leedal 1953), but it seems unlikely
that eruptions and associated destruction of natural habitat would have contributed to
extinction of taxa once existing on Meru.
In conclusion, this study has elucidated the distribution and taxonomy of the
the C. monax group across two distinct montane sets of islands and adds three new
endemic shrews to the montane system of Tanzania. While the distribution of the C.
monax group suggests the biogeographic influence of the boundary between the
Northern Highlands and the EAM is minimal, the absence of rodents such as
Hylomyscus in the Northern Highlands indicates otherwise. Faunal surveys along
elevational transects of mountains of differing geologic compositions indicate greater
diversity on the EAM relative to the Northern Highlands, and highlight Mt. Meru as a
massif with low soricid diversity.

Summary
51
Literature
Allen, G. M., and Loveridge, A. (1927) Mammals from the Uluguru and Usambara
Mountains, Tanganyika Territory. Proceedings of the Boston Society of
Natural History 38: 413-431.
Allen, G. M., and Loveridge, A. (1933) Reports on the scientific results of an
expedition to the southwestern highlands of Tanganyika Territory. Bulletin of
the Museum of Comparative Zoology at Harvard 75: 47-140.
Axelrod, D. I. and Raven, P. H. (1978) Late Cretaceous and Tertiary vegetation
history of Africa. In: Werger, M. J. A. (Ed.) Biogeography and Ecology of
Southern Africa, pp. 77-130. The Hague, Junk.
Barbour, T., and Loveridge, A. (1928) A comparative study of the herpetological
fauna of the Uluguru and Usambara Mountains, Tanganyika. Memoirs of the
Museum of Comparative Zoology of Harvard College 50: 87-265.
Bryja, J., Mikula, O., Patzenhauerová, H., Oguge, N. O., Šumbera, R., and Verheyen,
E. (2014) The role of dispersal and vicariance in the Pleistocene history of an
East African mountain rodent, Praomys delectorum. Journal of Biogeography
41: 196–208.
Burgess, N. D, Kock, D., Cockle, A., FitzGibbon, C., Jenkins, P. and Honess, P.
(2000) Mammals. In: Burgess N. D., and Clarke, G. P. (Eds.) Coastal forests
of eastern Africa, pp. 173-190 and 401-406. I.U.C.N., Gland and Cambridge.
Carleton, M. D., and Stanley, W. T. (2005) Review of the Hylomyscus arcimontensis
complex (Rodentia: Muridae) in Tanzania, with description of a new species.
Proceedings of the Biological Society of Washington 118: 619-646.
Carleton, M. D., and Stanley, W. T. (2012) Species limits within the Praomys
delectorum group (Rodentia: Muridae: Murinae) of East Africa: A
morphometric reassessment and biogeographic implications. Zoological
Journal of the Linnean Society 165: 420-469.
Cordeiro, N. J. (1998) Preliminary analysis of the nestedness patterns of montane
forest birds of the Eastern Arc Mountains. Journal of East African Natural
History 87: 101-118.
Cordeiro, N. J., and Howe, H. F (2003) Forest fragmentation severs mutualism
between seed dispersers and an endemic African tree. Proceedings of the
National Academy of Sciences 100: 14052-14056.

Summary
52
Davenport, T. R. B., Stanley, W. T., Sargis, E. J., De Luca, D. W., Mpunga, N. E.,
Machaga, S. J., and Olson, L. E. (2006) A new genus of African monkey,
Rungwecebus: Morphology, ecology, and molecular phylogenetics. Science
312: 1378-1381.
DeBlase, A. F., and Martin, R. E. (1974) A manual of mammalogy with keys to the
families of the world. Wm. C. Brown Company Publishers, Dubuque, Iowa.
De Luca, D. W., and Mpunga, N. E. (2005) Small carnivores of the Udzungwa
Mountains: Presence, distributions and threats. Small Carnivore Conservation
32: 1-7.
Demeter, A, and Hutterer, R. (1986) Small mammals from Mt. Meru and its environs
(Northern Tanzania). Cimbebasia 8: 199-207.
Dinesen, L., Lehmberg, T.,Svendsen, J. O.,Hansen, L. A., and Fjeldså, J. (1994) A
new genus and species of perdicine bird (Phasianidae, Perdicini) from
Tanzania; a relict form with Indo-Malayan affinities. Ibis 136: 3-11.
Dippenaar N. J. (1980) New species of Crocidura from Ethiopia and northern
Tanzania (Mammalia: Soricidae). Annals of the Transvaal Museum 32:125-
154.
Downie, C. and Wilkinson, P. (1972) The geology of Kilimanjaro. Sheffield:
Geological Survey of Tanzania and Department of Geology, Sheffield
University.
Engler, A. (1893) Über die Flora des Gebirgslandes von Usambara, auf Grund der von
Herrn Carl Hölst das elbst gemachten Sammlungen. Botanische Jahrbücher
für Systematik, Pflanzengeschichte und Pflanzengeographie 17: 156-168.
Goodman, S. M., and Carleton, M. D. (1998) The rodents of the Réserve Spéciale
d'Anjanaharibe-Sud. In Goodman, S. M. (Ed.) A floral and faunal inventory of the
Réserve Spéciale d'Anjanaharibe-Sud, Madagascar: With reference to elevational
variation. Fieldiana: Zoology, n.s., 90: 201-221.
Gravlund, P. (2002) Molecular phylogeny of Tornier’s cat snake (Crotaphopeltis
tornieri), endemic to East African mountain forests: Biogeography, vicariance
events and problematic species boundaries. Journal of Zoological Systematics
and Evolutionary Research 40: 46-56.

Summary
53
Griffiths, C. J. (1993) The geological evolution of East Africa. In: Lovett, J. C., and
Wasser, S. K. (Eds.) Biogeography and Ecology of the Rain Forests of Eastern
Africa, pp. 9-21. Cambridge University Press, Cambridge.
Grimshaw, J., Cordeiro, N., and Foley, C. (1995) The mammals of Kilimanjaro.
Journal of the East African Natural History 84: 105-139.
Griswold, C. E. (1991) Cladistic biogeography of Afromontane spiders. Australian
Systematic Botany 4: 73-89.
Grzimek, B., and Grzimek, M. (1960) Serengeti Shall Not Die. London: Hamish
Hamilton.
Guest, N. J., and Leedal, G. P. (1953) Volcanic activity of Mt. Meru. Records of the
Geological Survey of Tanganyika 3: 40-46.
Hanby, J. (1987) Kilimanjaro National Park. Tanzania National Parks/Africa Wildlife
Foundation.
Heaney, L. R., and Rickart, E. A. (1990) Correlations of clades and clines:
Geographic, elevational, and phylogenetic distribution patterns among
Philippine mammals. In: Peters, G., and Hutterer, R. (Eds.) Vertebrates in the
Tropics, pp. 321-332. Museum Alexander Koenig, Bonn.
Heim de Balsac, H. (1957) Insectivores de la famille des Soricidae de l'Afrique
orientale. Zoologischer Anzeiger 158: 144-153.
Helbig-Bonitz M., Rutten G., Kalko E. K. V. (2013) Fruit bats can disperse figs over
different landuse types on Mount Kilimanjaro, Tanzania. African Journal of
Ecology 52: 122-125.
Hemingway, E. (1986) The snows of Kilimanjaro, and other stories (1st Scribner
classic/Collier ed.). New York: Collier Books.
Hemp, A. (2006) Continuum or zonation? Altitudinal gradients in the forest
vegetation of Mt. Kilimanjaro. Plant Ecology 184: 27-42.
Hoffman, R. L. (1993) Biogeography of east African montane forest millipedes, In:
Lovett, J. C., and Wasser, S. K. (Eds.) Biogeography and Ecology of the Rain
Forests of Eastern Africa, pp. 103-115. Cambridge University Press,
Cambridge.
Holden, M. E. (2005) Family Gliridae. In: Wilson, D. E., and Reeder, D. M. (Eds.)
Mammal Species of the World: A Taxonomic and Geographic Reference, 3rd
edition, pp. 819-841. Johns Hopkins University Press, Baltimore.

Summary
54
Homewood, K. M., and Rodgers, W. A. (1981) A previously undescribed mangabey
from southern Tanzania. International Journal of Primatology 2: 47-55.
Hutterer, R. (1986) Diagnosen neuer Spitzmäuse aus Tansania (Mammalia:
Soricidae). Bonner Zoologische Beiträge 37: 23-33.
Hutterer, R. (2005) Order Soricomorpha. In: Wilson, D. E., and Reeder, D. M. (Eds.)
Mammal Species of the World: A Taxonomic and Geographic Reference, 3rd
edition, pp. 220-311. Johns Hopkins University Press, Baltimore.
Iversen, S. T. (1991) The Usambara Mountains, NE Tanzania: Phytogeography of the
vascular plant flora. Acta Universitatis Upsaliensis Symbolae Botanicae
Upsalienses 29: 1-234.
Jenkins, P. (1984) Description of a new species of Sylvisorex (Insectivora: Soricidae)
from Tanzania. Bulletin of the British Museum (Natural History), Zoology 47:
65-76.
Kingdon, J. (1971) East African mammals: An atlas of evolution in Africa. Academic
Press, London, 1: 1-446.
Lens, L., Dongen, D.V., Norris, K., Githuri, K. M., and Matthysen, E. (2002) Avian
persistence in fragmented rainforest. Science, 298: 1236-1238.
Loveridge, A. (1935) Scientific results of an expedition to rain forest regions in
eastern Africa. I. New reptiles and amphibians from East Africa. Bulletin of
the Museum of Comparative Zoology at Harvard, 79: 3-19.
Loveridge, A. (1937) Scientific results of an expedition to rain forest regions in
eastern Africa. IX. Zoogeography and itinerary. Bulletin of the Museum of
Comparative Zoology at Harvard, 79: 481-541.
Lovett, J. C. (1990) Altitudinal variation in large tree community associations on the
West Usambara Mountains, In: Hedberg, I, and Persson, E. (Eds.) Research
for Conservation of Tanzania Catchment Forests, pp. 48-53. Uppsala
Universitet, Uppsala.
Lovett, J. C. (1993) Climatic history and forest distribution in eastern Africa. In:
Lovett J. C., Wasser S. K. (Eds) Biogeography and ecology of the rain forests
of eastern Africa. pp. 23–32. Cambridge: Cambridge University Press,
Lovett, J. C., Bridson, D. M., and Thomas, D. W. (1988) A preliminary list of the
moist forest angiosperm flora of the Mwanihana forest reserve, Tanzania.
Annals of the Missouri Botanical Garden 75: 874-888.
Summary
55
Lundgren,B., and Lundgren, L. (1972) Comparison of some soil properties in one
forest and two grassland ecosystems on Mount Meru, Tanzania Geografiska
Annaler. Series A, Physical Geography Vol. 54, No. 3/4, Studies of Soil
Erosion and Sedimentation in Tanzania pp. 227-240
Makundi, R. H., Massawe, A. W., and Mulungu, L. S. (2006) Breeding seasonality
and population dynamics of three rodent species in the Magamba Forest
Reserve, Western Usambara Mountains, north-east Tanzania. African Journal
of Ecology, 45: 17-21.
McCain, C. M. (2005) Elevational gradients in diversity of small mammals. Ecology
86: 366-372.
Mduma, S. A. R., Sinclair, A. R. E., and Hilborn, R. (1999) Food regulates the
Serengeti wildebeest: A 40-year record. Journal of Animal Ecology 68: 1101-
1122.
Menegon, M., Doggart, N., and Owen, N. (2008) The Nguru Mountains of Tanzania, an
outstanding hotspot of herpetofaunal diversity. Acta Herpetologica, 3: 107-127.
Mittermeier, R. A., Robles-Gil, P., Hoffmann, M., Pilgrim, J. D., Brooks, T. B.,
Mittermeier, C. G., Lamoreux, J. L. & Fonseca, G. A. B. (2004). Hotspots
revisited: Earth’s biologically richest and most endangered terrestrial ecoregions.
Conservation International, 241–273.
Moreau, R. E. (1935) A synecological study of Usambara, Tanganyika Territory with
particular reference to birds. Journal of Ecology, 23: 1-43.
Mulungu, L.S., Makundi, R.H., Massawe, A.W., Machang’u, R.S., and Mbije, N.E.
(2008) Diversity and distribution of rodent and shrew species associated with
variations in altitude on Mount Kilimanjaro, Tanzania. Mammalia, 72: 178-
185.
Musser, G. G., and Carleton, M. D. (2005) Superfamily Muroidea. In: Wilson, D. E.,
and Reeder, D. M. (Eds.) Mammal Species of the World: A Taxonomic and
Geographic Reference, 3rd
edition, pp. 894-1531. Johns Hopkins University
Press, Baltimore.
Mwasaga, B.C. (1991) The natural forest of Mount Kilimanjaro. In: Newmark, WD,
(Ed.) The Conservation of Mount Kilimanjaro, pp. 111-114. IUCN, Gland,
Switzerland and Cambridge, UK.

Summary
56
Newmark, W. D. (1991) Tropical forest fragmentation and the local extinction of
understory birds in the Eastern Usambara Mountains, Tanzania. Conservation
Biology, 5: 67-78.
Newmark, W. D. (2006) A 16-year study of forest disturbance and understory bird
community structure and composition in Tanzania. Conservation Biology 20:
122-134.
Ngalason, W., and Mkonyi, F. J. (2011) Herpetofauna of montane areas of Tanzania.
3. Altitudinal distribution of amphibians on the Uluguru South Mountains. In:
Stanley, W. T., (Ed) Studies of montane vertebrates of Tanzania. pp. 81-89.
Fieldiana: Life and Earth Sciences Vol. 4.
Perkin, A. W. (2007) Comparative penile morphology of East African galagos of the
genus Galagoides (Family Galagidae): Implications for taxonomy.
International Journal of Primatology, 69: 16-26.
Pócs, T. (1975) Affinities between the bryoflora of East Africa and Madagascar.
Boissiera, 24: 125-128.
Pócs, T. (1985) East African bryophytes, VIII. The Hepaticae of the Usambara rain
forest project expedition, 1982. Acta Botanica Hungarica, 24: 113-133.
Poynton, J. C. (2003) Altitudinal species turnover in southern Tanzania shown by
anurans: Some zoogeographical considerations. Systematics and Biodiversity,
1: 117-126.
Quennel, A. M., McKinlay, A. C. M., and Aitken, W. G. (1956) Summary of the
geology of Tanganyika, Part I. Introduction and stratigraphy. Geological
Survey of Tanganyika Memoir 1. Dar es Salaam: Government Printer.
Rodgers, W. A., and Homewood, K. M. (1982) Species richness and endemism in the
Usambara mountain forests, Tanzania. Biological Journal of the Linnean
Society 18: 197-242.
Rovero, F., Jones, T., and Sanderson, J. (2005) Notes on Abbott’s duiker
(Cephalophus spadix True 1890) and other forest antelopes of Mwanihana
Forest, Udzungwa Mountains, Tanzania, as revealed by camera-trapping and
direct observations. Tropical Zoology, 18: 13-23.
Rovero, F., Marshall, A. R., Jones, T., and Perkin, A. (2009) The primates of the
Udzungwa Mountains: Diversity, ecology and conservation. Journal of
Anthropological Sciences, 87: 93-126.

Summary
57
Rutten G., Ensslin A., Hemp A., Fischer M. (2015) Forest structure and composition
of previously selectively logged and non-logged montane forests at Mt.
Kilimanjaro. Forest Ecology and Management 337: 61-66.
Sampson, D. N. (1965) The geology, volcanology and glaciology of Kilimanjaro.
Tanzanian Notes and Records, 64: 118-124.
Sampson, D. N., and Wright, A. E. (1964) The geology of the Uluguru Mountains.
Geological Survey of Tanzania Bulletin 37. Dar es Salaam: Government
Printer.
Sikes, R. S., Gannon, W. L., and the Animal Care and Use Committee of the
American Society of Mammalogists (2011) Guidelines of the American
Society of Mammalogists for the use of wild mammals in research. Journal of
Mammalogy, 92: 235-253.
Stanley, W.T., and Esselstyn, J.A. (2010) Biogeography and diversity among montane
populations of mouse shrew (Soricidae: Myosorex) in Tanzania. Biological
Journal of the Linnaean Society, 100: 669-680.
Stanley, W. T., and Goodman, S. M. (2011) Small mammal inventories in the East
and West Usambara Mountains, Tanzania. 4. Rodentia. In: Stanley, W. T.,
(Ed) Studies of montane vertebrates of Tanzania. pp. 53-73. Fieldiana: Life
and Earth Sciences Vol. 4.
Stanley, W. T., Goodman, S. M., and Hutterer, R. (1996) Notes on the insectivores
and elephant shrews of the Chome Forest, South Pare Mountains, Tanzania.
(Mammalia: Insectivora et Macroscelidea). Zoologische Abhandlugen
Staatliches Museum für Tierkunde Dresden, 49: 131-147.
Stanley, W. T., Goodman, S. M., and Hutterer, R. (2011a) Small mammal inventories
in the East and West Usambara Mountains, Tanzania. 2. Families Soricidae
(shrews) and Macroscelididae (elephant shrews), In: Stanley, W. T., (Ed)
Studies of montane vertebrates of Tanzania. pp. 18-33. Fieldiana: Life and
Earth Sciences Vol. 4.
Stanley, W. T., Goodman, S. M., and Kihaule, P. M. (1998) Results of two surveys of
rodents in the Chome Forest Reserve, South Pare Mountains, Tanzania
(Mammalia: Rodentia). Zoologische Abhandlugen Staatliches Museum für
Tierkunde Dresden, 50: 145-160.
Stanley, W. T., Goodman, S. M., and Newmark, W. D. (2011b) Small mammal
inventories in the East and West Usambara Mountains, Tanzania. 1. Study

Summary
58
areas, methodologies, and general results, In: Stanley, W. T., (Ed) Studies of
montane vertebrates of Tanzania. pp. 1-17. Fieldiana: Life and Earth Sciences
Vol. 4.
Stanley, W. T., Gunn, J., and Kihaule, P. M. (2005a) Results of a preliminary small
mammal survey of Malundwe Mountain, Mikumi National Park, Tanzania.
Journal of East African Natural History, 94: 213-222.
Stanley, W. T., and Hutterer, R. (2007) Differences in abundance and species richness
between shrews and rodents along an elevational gradient in the Udzungwa
Mountains, Tanzania. Acta Theriologica, 52: 261-275.
Stanley, W. T., Hutterer, R., Giarla, T. C., and Esselstyn, J. A. (In press) Phylogeny,
phylogeography and geographical variation in the Crocidura monax
(Soricidae) species complex from the montane islands of Tanzania, with
descriptions of three new species. Zoological Journal of the Linnean Society
Stanley W. T., Kihaule, P. M., Howell, K. M., and Hutterer, R. (2000) Small
mammals of the Eastern Arc Mountains, Tanzania. Journal of East African
Natural History, 87: 91-100.
Stanley, W. T., Kihaule, P. M., and Munissi, M. J. (2007) Small mammals of two
forest reserves in the North Pare Mountains, Tanzania. Journal of East African
Natural History, 96: 215-226.
Stanley, W. T., and Olson, L. E. (2005) Phylogeny, phylogeography, and geographic
variation of Sylvisorex howelli (Family Soricidae), an endemic shrew of the
Eastern Arc Mountains, Tanzania. Journal of Zoology, 266: 341-354.
Stanley, W. T., Rogers, M. A., and Hutterer, R. (2005b) A new species of Congosorex
from the Eastern Arc Mountains, Tanzania, with significant biogeographical
implications. Journal of Zoology, 265: 269-280.
Stanley, W. T., Rogers, M. A., Kihaule, P. M., Munissi, M. J. (2014) Elevational
distribution and ecology of small mammals on Africa’s highest mountain.
PLOS ONE 9(11): e109904.
Stuart, S. N. (1983) Biogeographical and ecological aspects of forest bird
communities in Eastern Tanzania. Ph.D. dissertation, University of
Cambridge.
Stuart, S.N., Jensen, F. P., and Brøgger-Jensen, S. (1987) Altitudinal zonation of the
avifauna in Mwanihana and Magombera Forests, eastern Tanzania. Gerfaut,
77: 165-186.

Summary
59
Stuart, S. N., Jensen, F. P., Brøgger-Jensen, S, and Miller, R. I. (1993) The
zoogeography of the montane forest avifauna of eastern Tanzania. In: Lovett,
J. C., and Wasser, S. K. (Eds.) Biogeography and Ecology of the Rain Forests
of Eastern Africa, pp. 203–228. Cambridge University Press, Cambridge.
Thomas, O. (1910) List of mammals from Mount Kilimanjaro, obtained by Mr. Robin
Kemp, and presented to the British Museum by Mr. C. D. Rudd. Annals and
Magazine of Natural History, 8(6): 308-316.
Thompson, L. G., Brecher, H. H., Mosley-Thompson, E., Hardy, D. R., and Mark, B.
G. (2009) Glacier loss on Kilimanjaro continues unabated. Proceedings of the
National Academy of Sciences, 106: 19770-19775.
Voss, R., and Emmons, L. H.(1996) Mammalian diversity in Neotropical lowland
rainforest: A preliminary assessment. Bulletin of American Museum of Natural
History, 230: 3-115.
Yu, H. T. (1994) Distribution and abundance of small mammals along a subtropical
elevational gradient in central Taiwan. Journal of Zoology, 234: 577-600.
Zancolli, G., Steffan-Dewenter, I., and Rödel, M. O. (2014a) Amphibian diversity on
the roof of Africa: Unveiling the effects of habitat degradation, altitude and
biogeography. Diversity and Distributions, 20: 297-308.
Zancolli G., Rödel M. O., Steffan-Dewenter I., and Storfer A. (2014b) Comparative
landscape genetics of two river frog species occurring at different elevations
on Mount Kilimanjaro. Molecular Ecology, 23: 4989-5002.

Summary
60
Appendix I – Specimens examined for morphometric analysis of Crocidura
monax complex.
Specimens used in this study are housed at the Field Museum of Natural History
(FMNH).
Ngorongoro
Tanzania, Arusha Region, Ngorongoro District, Ngorongoro Conservation Area,
Ngorongoro Crater rim, near Pongo Ranger Post, 3.24407° S, 35.65040° E, 2064 m:
FMNH 211272, 211314-211315, 211317, 211320, 211322-211323, 211327-211328,
211331-211332.
Tanzania, Arusha Region, Ngorongoro District, Ngorongoro Conservation Area,
Ngorongoro Crater Rim, near Lamala Gate, 3.14255° S, 35.68669° E, 2372 m:
FMNH 211058-211059, 211124, 211131-211132, 211134.
Kilimanjaro
Tanzania, Kilimanjaro Region, Moshi District, 4 km N, 1.5 km W Maua, 3°14.404' S
(or 3.24007° S), 37°27.502' E (or 37.45837° E), 2043 m:
FMNH 173788-173789, 173796, 174103-174110, 174112.
Tanzania, Kilimanjaro Region, Moshi District, 7 km N, 2.5 km W Maua, 3°12.459' S,
37°26.818' E, 2470 m:
FMNH 173770-173771, 173774-173778, 174066-174080.
Tanzania, Kilimanjaro Region, Moshi District, 10.5 km N, 3.5 km W Maua, 3°10.627'
S, 37°26.413' E, 2897 m:
FMNH 173784, 174081-174102.
North Pare
Tanzania, Kilimanjaro Region, Mwanga District, North Pare Mts, Kindoroko Forest
Reserve, 3.76039° S, 37.64726° E, 1688 m:
FMNH 192663-192669
Tanzania, Kilimanjaro Region, Mwanga District, North Pare Mts, Minja Forest
Reserve, 3.58149° S, 37.6773° E, 1572 m:
FMNH 192670-192671, 192673-192674
Udzungwa

Summary
61
Tanzania, Morogoro Region, Kilombero District, Udzungwa Mts, 19.5 km N, 0.5 km
W Chita, 8.3472° S, 35.9389° E, 2000 m:
FMNH 155308-155309, 155312, 155314-155318, 155320, 155322-155329, 155490-
155501.
Tanzania, Morogoro Region, Kilombero District, Udzungwa Mts, 4 km W, 5 km N
Chita, 8.475° S, 35.9069° E, 1460 m:
FMNH 155485-155487.
Ukaguru
Tanzania, Morogoro Region, Kilosa District, Ukaguru Mts, Mamiwa-Kisara Forest
Reserve, 1 km E, 0.75 km S Mount Munyera, 6.3792° S, 36.9361° E, 1900 m:
FMNH 166569, 166690-166691, 166693-166700, 166702-166717, 166720-166721.
Tanzania, Morogoro Region, Kilosa District, Ukaguru Mts, Mamiwa-Kisara Forest
Reserve, 1 km E, 1.5 km S Mt Munyera, 6.3889° S, 36.95° E, 1840 m:
FMNH 166578, 166723, 166725-166741, 166744-166748, 166750-166759, 166761-
166762, 166764-166766.
Rubeho
Tanzania, Dodoma Region, Mpwapwa District, Rubeho Mts, Mwofwomero Forest
Reserve, near Chugu Peak, 6.8337° S, 36.57198° E, 1900 m:
FMNH 197657-197659
Tanzania, Morogoro Region, Kilosa District, Rubeho Mts, Ilole Forest, 7.43774° S,
36.72729° E, 1878 m:
FMNH 197403-197404, 197660-197665
Uluguru
Tanzania, Morogoro Region, Morogoro District, Uluguru Mts, Uluguru North Forest
Reserve, 3 km W, 1.3 km N Tegetero, 6.9292° S, 37.7056° E, 1345 m:
FMNH 158280-158283, 158286.
Tanzania, Morogoro Region, Morogoro District, Uluguru Mts, Uluguru North Forest
Reserve, 5.1 km W, 2.3 km N Tegetero, 6.92° S, 37.6833° E, 1535 m:
FMNH 158287-158291, 158293-158297, 158392-158396,158399-158400, 158402-
158403, 158405-158408, 158572.

Summary
62
Tanzania, Morogoro Region, Morogoro District, Uluguru Mts, Uluguru North Forest
Reserve, 6 km W, 3 km N Tegetero, 6.9167° S, 37.675° E, 1850 m:
FMNH 158409-158413.
Meru
Tanzania, Arusha Region, Arumeru District, Mt. Meru, Arusha National Park, Fig
Tree Arch, 3.24406° S, 36.82845° E, 1950 m:
FMNH 207914, 207978, 207981, 207986, 208384-208388, 208390-208392, 208394-
208395, 208397-208398, 208401-208408, 208410-208411.
Tanzania, Arusha Region, Arumeru District, Mt Meru, Arusha National Park,
3.24725°S, 36.80066°E, 2300 m:
FMNH 208415-208416.
Tanzania, Arusha Region, Arumeru District, Mt. Meru, Arusha National Park, Meru
Crater, 3.24200° S, 36.78736° E, 2652 m:
FMNH 208045-208048, 208050, 208443-208451, 208453, 208456-208457.
Tanzania, Arusha Region, Arumeru District, Mt. Meru, Arusha National Park,
Mgongo wa Tembo, 3.22350° S, 36.78675° E, 3000 m:
FMNH 208012, 208016-208017, 208022-208025, 208027-208028, 208032-208035,
208422-208424, 208426-208433, 208435-208436.
Tanzania, Arusha Region, Arumeru District, Mt. Meru, Arusha National Park, near
Saddle Hut, 3.21609° S, 36.76897° E, 3600 m:
FMNH 208042, 208439, 208440
West Usambara-Ambangulu Forest
Tanzania, Tanga Region, Korogwe District, West Usambara Mts, 12.5 km NW
Korogwe, Ambangulu Tea Estate, 5.07° S, 38.42° E, 1300 m:
FMNH 147203-147209, 147353-147354, 147357-147358, 147376, 149979-149980,
149999-150000, 151099.
Tanzania, Tanga Region, Korogwe District, West Usambara Mts, West Usambara
Mts, 14.5 km NW Korogwe, Ambangulu Tea Estate, 5.05° S, 38.38° E, 1250 m:
FMNH 147210
East Usambara

Summary
63
Tanzania, Tanga Region, Muheza District, East Usambara Mts, 4.5 km ESE Amani,
Monga Tea Estate, 5.1° S, 38.6° E, 1000 m:
FMNH 149973-149975, 149977-149978, 150376, 151112-151118, 151126, 151129-
151134.
Tanzania, Tanga Region, Muheza District, East Usambara Mts, East Usambara Mts,
4.5 km NW Amani, Monga Tea Estate, 5.07° S, 38.62° E, 1100 m:
FMNH 147211, 147360.
Tanzania, Tanga Region, Muheza District, East Usambara Mts, 4.5 km WNW Amani,
Monga Tea Estate, 5.1° S, 38.6° E, 1000 m:
FMNH 149969-149972, 149976, 151106-151107, 151109-151111, 151120-151125,
151376-151381.
South Pare
Tanzania, Kilimanjaro Region, Same District, South Pare Mts, Chome Forest
Reserve, 3 km E, 0.7 km N Mhero, 4.28° S, 37.9278° E, 2000 m:
FMNH 153844, 153918-153922.
Tanzania, Kilimanjaro Region, Same District, South Pare Mts, Chome Forest
Reserve, 7 km S Bombo, 4.33° S, 38° E, 1100 m:
FMNH 151137-151138, 151375.
West Usambara-Shume Magamba
Tanzania, Tanga Region, Lushoto District, West Usambara Mts, Magamba, 4.66667°
S, 38.25° E, 1585 m:
FMNH 27424-27430

Publications and Manuscripts: Kilimanjaro mammals
64
PUBLICATIONS &
MANUSCRIPT

Publications and Manuscripts: Kilimanjaro mammals
65
PUBLISHED IN PLOS ONE
Elevational distribution and ecology of small mammals on Africa’s highest
mountain
WILLIAM T. STANLEY1, MARY ANNE ROGERS
1, PHILIP M. KIHAULE
2, and MAIKO J.
MUNISSI3
1 The Field Museum of Natural History, Department of Science and Education,
Chicago, Illinois, United States of America; email:[email protected]
2 University of Dar es Salaam, Department of Zoology, Dar es Salaam, Tanzania;
3Southern Highlands Conservation Programme, Mbeya, Tanzania

Publications and Manuscripts: Kilimanjaro mammals
66
ABSTRACT
Mt Kilimanjaro is Africa’s highest mountain, and an icon for a country famous for its
mammalian fauna. The distribution and abundance of small mammals on the
mountain are poorly known. Here we document the distribution of shrews and
rodents along an elevational gradient on the southeastern versant of Kilimanjaro. Five
sites were sampled with elevational center points of 2000, 2500, 3000, 3500 and 4000
m, using a systematic methodology of standard traps and pitfall lines, to inventory the
shrews and rodents of the slope. Sixteen species of mammal were recorded, including
6 shrew and 10 rodent species, and the greatest diversity of both was found at 3000 m,
the elevational midpoint of the transect. No species previously unrecorded on
Kilimanjaro were observed. Two genera of rodents that occur in nearby mountains
(Hylomyscus and Beamys) were not recorded. Myosorex zinki, the only mammal
endemic to Mt. Kilimanjaro, which previously was known by only a few specimens
collected in the ericaceous or moorland habitat, was found in all but one (the lowest)
of the sites sampled, and was one of the most widespread species of small mammal
along the gradient. Two shrews (Crocidura allex and Sylvisorex granti) and one
rodent (Dendromus insignis) were found throughout the entire transect, with
Dendromus being observed at our highest trap point (4240 m). As in similar faunal
surveys on other mountains of Tanzania, rainfall influenced the sample success of
shrews, but not rodents. Trap success for rodents at 3500 m was notably low. This
study contributes further justification for the conservation of the forest habitat of Mt.
Kilimanjaro.
ADDITIONAL KEYWORDS: Mt. Kilimanjaro – shrews – rodents – Myosorex –
Tanzania

Publications and Manuscripts: Kilimanjaro mammals
67
INTRODUCTION
Knowing the distribution of organisms along an elevational gradient is critical
to understanding the evolution and ecology of montane biotic systems, and to
designing conservation strategies to maintain them. These reasons have motivated
elevational surveys of small mammals in various areas of the world including Chile
[1], Costa Rica [2], Malaysia [3], Philippines [4], [5], [6], Taiwan [7], and Tanzania
[8]. Goodman, Ganzhorn & Rakotondravony [9] summarize some of the important
biotic inventories along elevational gradients in Madagascar. Each of these studies
elucidate both specific and broadly general patterns that help explain the mechanisms
influencing the distributions of mammals along such gradients with significant
implications for biogeographic analysis and conservation priorities [10]. Indeed, such
surveys have served as vital baselines for comparison to subsequent inventories in
testing the influence of climatic vicissitudes or habitat alteration. For example, range
shifts in various mammalian species were documented in Yosemite Valley,
California, with two similar surveys separated by almost a century [11].
Knowledge of the ecology and behavior of the targeted faunas help frame
considerations of the results of systematic sampling along gradients. For example,
Stanley & Hutterer [8] documented patterns of distribution along an altitudinal
gradient in the Udzungwa Mountains of Tanzania that differed between shrews and
rodents, and suggested that the amount of coincident rainfall influenced shrew, but not
rodent, capture rates. Such observations must be factored into deciphering the results
of systematic sampling along elevational gradients, and surveys using identical
methodologies on other mountains should help to reveal whether such observations
are unique to particular sites or more common across multiple gradients.
Mt. Kilimanjaro is the highest mountain in Africa and an icon for a region
renowned for its unique mammalian fauna. Ironically, the mammals that inhabit the
habitats of this volcano are relatively unknown, with most historical attention focused
on larger species, leading to calls for complete inventories of the fauna of the
mountain [12]. To date, the most comprehensive summary of our overall
understanding of the mammalian fauna of Kilimanjaro remains that presented by
Grimshaw, Cordeiro & Foley [13], who provided a faunal list of the mountain, and
described past studies of Kilimanjaro’s mammalian fauna. Few studies employing
Publications and Manuscripts: Kilimanjaro mammals
68
systematic sampling have taken place on Kilimanjaro [14] and only one [15] used a
systematic survey to document the presence and distribution of small rodents and
shrews along elevational gradients on the mountain. The lack of detailed biotic
vertebrate surveys, such as those of small mammals, hampers efforts to monitor
ecological change over time on the mountain. Thompson et al. [16] suggest that
climate change is affecting the habitat and ecology of Kilimanjaro, and baseline data
for the distribution and abundance of various plants and animals are needed to judge
the effect of such changes, as has been done elsewhere [11].
Using a standardized sampling regime that has been utilized in several other
montane sites of Tanzania over the past two decades [8], [17], [18], [19] we surveyed
the small mammals (shrews and rodents) at five different elevations and habitats
along the southeastern versant of Mt. Kilimanjaro. Our study had three principal
goals: 1) to initiate intensive surveys of the elevational distribution and abundance of
small mammals along the transect sampled; 2) to test for differences between rodents
and shrews in their relationship to elevation and response to different trapping
methodologies; and 3) to compare the generated results to similar studies on
Kilimanjaro and other mountains of Tanzania.
MATERIALS AND METHODS
Study Site
Mt. Kilimanjaro is in northeastern Tanzania and reaches an elevation of 5895
m. An extinct volcano, the mountain is the conglomeration of three volcanoes: Kibo
(the highest, most prominent and familiar), Mawenzi (the second peak of the
mountain), and Shira (a plateau) [20]. Because the mountain is a popular destination
for climbers, there are numerous paths that originate in the lowlands and run up the
side of the mountain [21]. Two such routes that are on the southeastern (and wettest)
versant are “Marangu” and “Mweka”. Between these two is the “Maua” path which
is currently closed to tourists, and is used by Kilimanjaro National Park (KINAPA)
staff to access and maintain facilities within the park. Between 17 July and 31 August
2002, we sampled the small mammals (shrews and rodents) at five different
elevations, ranging from roughly 2000 to 4000 m, along the “Maua” route on the
southeastern slope of Mt. Kilimanjaro (Figure 1).

Publications and Manuscripts: Kilimanjaro mammals
69
The specific localities, elevations, habitats (sensu Mwasaga [22]) and dates of
sampling are listed below. The elevations given for each site are centered at the
associated camp and sampling efforts spanned roughly 100-200 m above and below
the camp. For this reason, we labeled each camp at the closest 500 m interval (2043 =
2000 m; 2470 = 2500 m, etc.). Temperature and rainfall for each site (measured at
camp) are listed in Table 1:
Site 1 - 2000 m). 4 km N, 1.5 km W Maua, 3°14.404' S, 37°27.502' E, 2043
m; lower montane forest; 23-30 August 2002.
Site 2 - 2500 m). 7 km N, 2.5 km W Maua, 3°12.459' S, 37°26.818' E, 2470
m; upper montane forest; 17-25 July 2002.
Site 3 - 3000 m). 10.5 km N, 3.5 km W Maua, 3°10.627' S, 37°26.413' E,
2897 m; ecotone between montane forest and ericaceous zone; 26 July-03 August
2002.
Site 4 - 3500 m). 13.5 km N, 4 km W Maua, 3°08.941' S, 37°26.133' E, 3477
m; ericaceous zone; 4-12 August 2002.
Site 5 - 4000 m). 16 km N, 4.5 km W Maua, 3°07.566' S, 37°25.600' E, 3995
m; ecotone between ericaceous and alpine zones; 13-21 August 2002.
Trapping Procedure
We used identical sampling techniques to those employed in similar small
mammal surveys in other Tanzanian forests [8], [19], [23], [24], [25], [26], [27], [28].
Pitfall and trap lines were set in different microhabitats at each site, to sample shrews
and small rodents (< 200 g). Each pitfall line consisted of 11, 15 l buckets spaced 5 m
apart, and placed so the upper rim was flush with the ground level. A 50 cm high
vertical plastic fence was placed over the buckets, bisecting the openings. Most
shrews and very small rodents were captured with this technique. Trap lines were
installed using three types of traps: Museum Special traps, 14 x 7 cm; Victor rat traps,
17.5 x 8.5 cm (both manufactured by Woodstream Corporation, Lititz, Pennsylvania,
USA); and medium-sized Sherman live traps, 23 x 9.5 x 8 cm (H.B. Sherman Traps
Inc., Tallahassee, Florida, USA). Each line was composed of between 20 to 70 traps,
with the Museum Special and Victor traps making up approximately 85% of each
line. Traps were baited with pieces of freshly fried coconut coated in peanut butter,
which was renewed each afternoon. Further details are outlined in Stanley, Goodman
& Newmark [29].

Publications and Manuscripts: Kilimanjaro mammals
70
All traps and buckets were checked once in the early morning and again in the
late afternoon. Not all traps or buckets were employed for equal amounts of time
(some trap lines were set the first day of the survey, others were installed on the
second), so we use the measures “trap-night” and “bucket-night” (one trap or bucket
in operation for one 24 hr period-0700 to 0700 hrs) to quantify sampling effort. We
refer to the success rate of each method as either “trap success” or “bucket success”, and
calculate these values by dividing the number of individuals captured by the number of
trap-nights or bucket-nights and multiplying by 100. In discussions involving the two
trapping methodologies combined, the term “sampling-night” refers to either one trap-
night or one bucket-night, and “sample success” refers to the success rate for the two
methodologies combined. The latter is calculated by dividing the number of individuals
captured by the number of sampling-nights and multiplying by 100.
Standard external measurements and reproductive status were recorded for
each specimen, which was then either prepared as a study skin and skeleton or
preserved in 10% formalin, and later transferred to 70% EtOH. Specimens are
deposited in the Field Museum of Natural History (FMNH) with a portion to be
returned to Museum of Zoology, University of Dar es Salaam (UDSM). We follow
the taxonomy of Carleton & Stanley [30], Holden [31], Hutterer [32], and Musser &
Carleton [33].
ETHICS STATEMENT
Permits for the collection and export of specimens were provided by the Tanzania
Commission for Science and Technology (Ref# 2002-232-ER-90-172), the Tanzania
Ministry of Natural Resources and Tourism (Wildlife Division; Ref# GD/R.40/1/22), and
the Tanzania National Parks (Ref # TNP A44). Import of specimens into USA was
approved by the US Fish and Wildlife Service (3177-W10214-9/18/02). Shrews and
rodents were euthanized following the protocol approved by the American Society of
Mammalogists [34], and the study was approved by the Field Museum of Natural History.
RESULTS
During the survey, we accumulated 11,562 sample-nights (8361 trap-nights
and 3201 bucket-nights) and trapped 612 small mammals, including 319 shrews
representing 6 species, and 293 rodents representing 10 species (Tables 2, 3, 4).

Publications and Manuscripts: Kilimanjaro mammals
71
Sampling success for shrews was significantly greater in buckets than in traps (X2 =
695.2, P < 0.05), and significantly more rodents were caught in traps than in buckets
(X2 = 44.8, P < 0.05), a pattern observed in past studies on small mammals of
Tanzania [8], [23], [24]. In 8361 trap-nights, 283 mammals were captured for an
overall trap success of 3.4%. Of the mammals caught in traps, 263 were rodents
(3.1% trap success for rodents) and 20 were shrews (0.2% trap success). In the 3201
bucket-nights, 329 mammals were captured for a total bucket success of 10.3%. Of
these, 299 were shrews (9.3% success) and 30 were rodents (0.9% success). This
striking pattern was evident not only across the entire survey, but also at each of the
five sites sampled (Table 2). Shrew species caught in traps included Crocidura allex,
C. monax, C. olivieri, and Myosorex zinki (weighing between 3.6-51.0 g). While most
of the rodents caught in buckets were relatively small (i.e. Dendromus insignis; 7-20
g), both specimens of Tachyoryctes daemon (240-290 g) were captured in buckets.
Other rodent species captured in buckets included Grammomys dolichurus,
Graphiurus murinus, Praomys taitae, and Rhabdomys dilectus.
The number of captures (and overall sample success) at each elevational site
ranged from 54 [2.4%] at 3500 m to 151 [6.8%] at 2000 m (Table 2). For shrews
alone, the lowest values were observed at the 4000 m site (34 [1.5%]) and the highest
values at the 3000 m site (88 [3.6%]; Tables 2, 3). For rodents, the lowest (6 [0.3%])
and highest (87 [3.9%]) values were observed at the 3500 m and 4000 m sites,
respectively (Tables 2, 4). The cumulative number of species trapped reached an
asymptote at all sites except 2500 m site (Figure 2), where Dendromus insignis and
Otomys angoniensis were captured on the last day of trapping.
We examined the relationship of four daily capture parameters (number of
individuals, number of species, number of new species [i.e. previously unsampled at a
given site], and cumulative number of species) with cumulative sample-nights for
both type of trapping methodology (Table 5) and mammalian order (Table 6). We
chose cumulative sample-nights instead of day of sampling period because of the
differences in sampling effort among sites (Table 2). Based on correlation analysis,
there was a significant positive correlation between cumulative sample-nights and
cumulative species across all sites for trap lines, bucket lines and both sampling
methods combined (Table 5). The same pattern was generally evident at each site,
although, in some cases, correlation values were high, but not significant. The
correlation of the cumulative number of shrew species caught in buckets with

Publications and Manuscripts: Kilimanjaro mammals
72
cumulative number of bucket nights was significant at the 2500 m site, and high at all
other sites. For both shrews and rodents, there was generally a negative correlation
between cumulative sampling effort and new species captured. Notable exceptions
include trap lines at the 3000 and 3500 m sites. There was no notable correlation
between the number of species and cumulative sampling effort across the entire
transect or at each site, with the exception of shrew species captured in buckets at the
2000 m site. The correlation between number of individuals and sampling effort
varied among sites. There was a significantly negative pattern exhibited by pitfall
lines and both trap and pitfall lines combined at the 3500 m site, but no such
relationship exhibited at the 3000 and 4000 m sites. Table 6 presents the same
analyses as Table 5, but is focused on the taxonomic groups sampled, and the patterns
are similar.
The effect of rainfall on captures is presented in Table 7. Generally, there was
a stronger and more positive correlation between rainfall and daily captures of shrews,
than there was for rodents. Over the entire transect, the capture of individual shrews
in both buckets and traps was significantly correlated with the amount of rainfall each
day, but the capture of individual rodents was not. A graphic representation of the
differences between shrew and rodent captures with respect to rainfall amount is
presented in Figure 3. The overall relationship between rainfall and captures of
shrews was not as strong as in other elevational surveys of mammals in Tanzania [8].
There was a significantly negative relationship between elevation and the total
number of shrew species collected (Table 8). Additionally, elevation was negatively
correlated with total number of individual shrews collected and sample success for
shrews, with r values high, but not significant. Rodents showed no such notable
pattern. The relationship between elevation and total sample success, number of
individual mammals, and number of species collected for shrews and rodents
combined was generally negative, but not significant. The least number of mammals,
and species collected was at the 3500 m site. The greatest number of individuals
noted was at the lowest site (2000 m), and the highest species diversity was observed
at the 3000 m site. In most cases, the forested sites showed greater abundance and
species diversity than the habitats above tree line (Tables 2, 3, 4).
Captures in any individual trap or bucket were rare events. Although there was
a 10.3% bucket success for all mammals captured, and 329 animals (299 shrews and
30 rodents) were collected in 385 buckets (77 buckets installed at each of five sites),

Publications and Manuscripts: Kilimanjaro mammals
73
most buckets captured no animals. Over the entire survey, 203 buckets caught
nothing, 100 took one animal, 43 trapped two, 26 captured three, 7 caught four
animals, 3 collected five animals, 2 trapped six animals, and ten animals were found
in one bucket. Traps showed a similar pattern with 3.4% trap success in 1040
individual traps, and 283 captures (263 rodents and 20 shrews), but 834 traps caught
nothing, 148 one, 42 two, 13 three and 3 four. To test for “trap competition” and to
determine if captures were independent with respect to each other, we compared the
observed distribution of captures by bucket and by trap to the Poisson distribution.
Neither captures by buckets or traps followed the Poisson distribution (G-test for
goodness of fit = 84.0 for buckets, 10.0 for traps; p< 0.01) suggesting a lack of trap or
bucket independence. Significantly fewer traps or buckets caught one individual than
would have been expected based on the assumption that the frequency of captures
follows a Poisson distribution, and significantly more caught 2, or more, than
expected [7].
DISCUSSION
Sixteen species of mammal (6 shrews and 10 rodents) were recorded along an
elevational transect from roughly 2000 to 4000 m on the southeastern slope of Mt.
Kilimanjaro (images of select taxa are presented in Figure 4). Only one of these
(Myosorex zinki) is endemic to the massif, and none were introduced taxa. The other
species have broader distributions, to varying degrees. For example, among the
soricomorphs, Crocidura monax has been recorded in neighboring mountains within
the Eastern Arc Mountains to the southeast of Kilimanjaro, including the North Pare
and West Usambara Mountains. Crocidura allex is known from other mountains of
the northern highlands of Tanzania (Meru, Ngorongoro) and the highlands of Kenya
(Kenya, Aberdares). Crocidura hildegardeae and Sylvisorex granti are distributed
across Kenya and the montane habitats of the Albertine Rift. Finally, Crocidura
olivieri is broadly distributed across much of the African continent [32]. Among the
ten species of rodents recorded, most are variably distributed across eastern Africa,
and some range over larger regions of Africa. For example, Tachyoryctes daemon is

Publications and Manuscripts: Kilimanjaro mammals
74
restricted to northern Tanzania, but murines such as Grammomys dolichurus and
Rhabdomys dilectus range across much of eastern and southern Africa, as does the
dormouse, Graphiurus murinus [31], [33]. However, many taxonomists have
cautioned that some of these soricomorph and rodent taxa are almost certainly species
complexes, and work in progress may alter our taxonomic understanding of these
groups [31], [32], [33].
We found no species not previously documented on the mountain. There are
several published faunal lists for Kilimanjaro, the most complete being that of
Grimshaw et al. [13], who evaluated the accuracy of previous published records, and
developed a working list of likely residents of the mountain. While this list includes
every species we documented, there are other small mammals listed by Grimshaw et
al. [13] that we did not document. For example, among shrews, we have no record of
Crocidura luna. This species was listed by Grimshaw et al. [13] based on voucher
specimens at the FMNH, collected at 1400 m, an elevation below our lowest sampling
site (2000 m). Similarly, many rodent species listed by Grimshaw et al. [13] occur at
elevations lower than the range of this study. Examples include genera such as
Aethomys, Arvicanthis, Lemniscomys, Mastomys, Pelomys and Tatera. One rodent
historically recorded in our elevation sampling range but absent from animals we
captured is Otomys typus (= O. orestes zinki; [35]). The holotype of O. zinki
Bohmann 1943 was collected at Horombo Hut [36], [37], but the only two species of
Otomys we documented were O. angoniensis and O. tropicalis. Two other rodents
are notably absent from our inventory: Beamys hindei and Hylomyscus arcimontensis.
Both are residents in forests of the Eastern Arc (including the North Pare Mountains
roughly 50 km SE of Kilimanjaro) and Southern Highlands [38], [39], but no voucher
specimen is known for either species from Kilimanjaro, or other northern highland
sites. The type locality of Beamys hindei is Taveta, Kenya [40], and Dieterlen [41]
identified a skull collected by C.G. Schillings in 1903 at Moshi as Beamys. Both
localities are at, or near the base of Mt. Kilimanjaro. While this is not the most
common species recorded in recent surveys of montane habitats of Tanzania across
the elevational range from 600 to 2000 m [8], [19], given the number of trap nights
expended during this survey, we anticipate the capture of Beamys if it occurs in the
forests of southeastern Kilimanjaro. Records of Hylomyscus on Meru [42] and
Ngorongoro [43] are now attributed to Praomys taitae [30], [38]. Recent surveys of
both Meru and Ngorongoro using techniques identical to this study did not record

Publications and Manuscripts: Kilimanjaro mammals
75
either Beamys or Hylomyscus (Stanley, unpubl. data). All of this leads us to the
conclusion that neither Beamys nor Hylomyscus currently occur in the forests of Mt.
Kilimanjaro.
The trap success for rodents was highest at 4000 m and lowest at the 3500 m
site (Table 4). The very low number of rodent captures at 3500 m (three in 1600 trap
nights; Table 2) was striking, and is the lowest trap success recorded in similar
surveys in montane habitats of Tanzania [8], [19], [24], [39]. Shore & Garbett [14]
trapped at 3500 m, roughly the same elevation as our fourth site, but on the Shira
Plateau on the western slopes of Kilimanjaro. The species they documented
(Crocidura allex, Myosorex blarina zinki [= M. zinki], Dendromus mesomelas
kilimandjari [= D. insignis] and Rhabdomys pumilio diminutus [= R. dilectus] were
the same as in our study at the 3500 m site. One species (Otomys tropicalis) recorded
by Shore & Garbett at 3500 m was not trapped by us at that elevation, but was
collected at sites both lower and higher than 3500 m. Notably, their trap success for
small mammals (2.7%; 81 captures in 2995 trap nights) was much higher that of the
3500 m site in this study (0.2%; 3 captures in 1600 trap nights), although the period of
the surveys (mid-July to early August) was similar in both studies and trapping
extended over several days at each site. The bait used by Shore & Garbett [14]
included fried coconut and peanut butter (as in our procedure) but also fish, nuts and
oats. However, the 3500 m site in our study was in stark contrast to lower and higher
sites along the same transect, leading us to hypothesize that different bait is not the
explanation for the lower rodent trap success at 3500 m in this study compared to the
patterns documented by Shore & Garbett [14]. One potential explanation might be
the proximity of Horombo Hut (3°8'20"S, 37°26'18"E) which was approximately 600
m from our trap lines (no other sites in this study were close to human habitation).
The buildings and discarded flour and other foodstuffs generated by people occupying
this touristic camp provide shelter and food for rodents. Indeed, while visiting
Horombo on 8 and 10 August, we saw many Rhabdomys moving between buildings.
Both repeating our sampling methodology at our site, and sampling with the same
techniques at, and at increasing distances from Horombo would be illustrative of the
influence of human habitation on the abundance of native rodents in the environs of
Kilimanjaro.
Mulungu et al. [15] published the results of two elevational transects of
Kilimanjaro (along the Shira and Marangu routes) that focused on shrews and rodents.

Publications and Manuscripts: Kilimanjaro mammals
76
While total trapping effort was less than half of the current study (3600 vs 8361 trap
nights), the recorded trap success was much higher (up to 36%). We attribute the
higher success of Mulungu et al. [15] to the fact that traps were in place for only two
nights at each site, and thus a reduction in capture rates typical of longer periods of
time was not observed. The soricomorph and rodent species documented by Mulungu
et al. [15] were identical to this study, with the exception of Mus triton, which they
recorded at 2300 and 3270 m. Lophuromys aquilus was recorded at 3200 and 3590 m
by Mulungu et al. [15] but our study did not record this rodent above 3000 m.
However, one Lophuromys was brought to us by a Tanzanian National Parks
employee who captured it at Horombo Hut (3760 m). The presence of other species
at various elevations documented by Mulungu et al. [15] mirrored patterns observed
during this study.
As in past studies within Tanzania, the combination of traps and pitfall lines
were effective in sampling non-volant small mammal communities at different
elevations on Mt. Kilimanjaro [8]. In general, species accumulation curves reached a
plateau at each site, with the exception of the 2500 site where we captured
Dendromus insignis and Otomys angoniensis for the first time during the last 24-hours
of trapping. Notwithstanding the 2500 m pattern, we are confident that we
documented almost all of the species of shrews and small rodents occurring at each
site, and thus feel justified in comparing results among different elevational sites of
this transect, as well as to results of similar surveys within Tanzania [8].
There was a significantly negative correlation between elevation and shrew
species diversity at each site, and while not significant, there was generally lower
abundance (as measured by sample success) for shrews as elevation increased (Table
8). However, rodents showed no notable correlation with elevation, either in diversity
or abundance. This is in contrast to the patterns observed in the Udzungwa
Mountains [8], where diversity and abundance of rodents were positively and
significantly correlated with elevation. The same trends were not observed for shrews
in the Udzungwas. Another difference between the Udzungwa and Kilimanjaro
studies was seen in the overall measures of sample success in relation to elevation.
Stanley & Hutterer [8] found either significant or high positive correlations between
elevation and total sample success, number of individual mammals, and number of
species collected for shrews and rodents combined. Such a relationship on Mt.
Kilimanjaro was negative but not statistically significant. Whereas there was no mid-

Publications and Manuscripts: Kilimanjaro mammals
77
elevational peak (sensu McCain [10]) in the Udzungwa study, the greatest diversity of
shrews and rodents on Kilimanjaro was at 3000 m, in the middle of our transect.
Indeed, this site was situated at the ecotone between forest and heathland, and species
typical of both habitats were present. For example, this was the highest, and lowest
site where Praomys taitae and Rhabdomys dilectus, respectively, were documented
and the only site where the two species were found together. In general, there was
more species diversity for both shrews and rodents in forest habitats than above
treeline (Tables 2,3,4).
Rainfall generally influenced the capture of shrews, but not rodents as was
observed in the faunal inventories in the Udzungwa Mountains [8]. Thus, rainfall
amounts while sampling shrew diversity or abundance should be considered. In
addition, there was a lack of capture independence among traps and buckets across the
entire transect and at each site. Stanley & Hutterer [8] documented similar results in
the Udzungwa Mountains, and hypothesized that multiple captures are influenced by
the placement of individual traps and buckets. More specifically, while traps cannot
catch more than one animal, generally, buckets can capture more than one on a given
bucket-night. The possibility exists that the presence of a captured animal in a bucket
may attract other animals into that bucket.
The only endemic mammal, as currently understood, on Mt. Kilimanjaro is
Myosorex zinki [44]. Until this survey, and that of Mulungu et al. [15], M. zinki was
only known from a few specimens captured in the moorland habitats above tree line
[14]. This species was documented across the elevational range of 2500 to 4000 m in
this survey [45] and between 2500 to 2600 m by Mulungu et al. [15]. Thus, this
endemic shrew extends across several different habitats on the mountain. Myosorex
zinki was not observed at our lowest sampling site (2000 m). Stanley et al. [45]
suggest that human impact on the forests at 2000 m on the Maua route may be
responsible for the absence of this endemic mammal, but this hypothesis has not been
adequately tested.
Three species (2 shrews and 1 rodent) were found at all sites sampled and
occur across the range from roughly 2000 to 4000 m: Crocidura allex, Sylvisorex
granti, and Dendromus insignis. The latter was found in the highest trap set in the
survey (3° 6.481’ S, 37° 25.312’ E, 4240 m, on the ridge leading to West Lava Hill),
and four individuals of this species were collected in this single trap (a Museum
Special). How high small mammals extend on Kilimanjaro remains unanswered.

Publications and Manuscripts: Kilimanjaro mammals
78
Wild dog (Lycaon pictus) is the only mammal (other than Homo sapiens) recorded at
the summit (5895 m; [46]). However no small mammal surveys have been conducted
above 4000 m, and such efforts would help elucidate the upper ranges of shrews and
rodents on this unique and iconic mountain, and would further our understanding of
its faunistic dynamics.

Publications and Manuscripts: Kilimanjaro mammals
79
ACKNOWLEDGMENTS
We are grateful to the Wildlife Conservation Society (Tanzania) for logistical support
and to the Tanzania Commission for Science and Technology, Ministry of Natural
Resources and Tanzanian National Parks for permission to conduct this research. E.
Gereta, Mr. Lejora, N. Mafuru, and L. M. Ole Moirana, were particularly supportive.
O. Mathayo and S. Temu all aided in fieldwork. R. Banasiak provided important
assistance with the figures. S. Goodman and K. Helgen offered valuable editorial
advice.

Publications and Manuscripts: Kilimanjaro mammals
80
REFERENCES
1. Patterson BD, Meserve PL, Lang BK (1989) Distribution and abundance of
small mammals along an elevational transect in temperate rainforests of Chile.
J Mammal 70: 67-78.
2. McCain CM (2004) The mid-domain effect applied to elevational gradients:
species richness of small mammals in Costa Rica. J Biogeogr 31: 19-31.
3. Md Nor S (2001) Elevational diversity patterns of small mammals on Mount
Kinabalu, Malaysia. Glob Ecol Biogeogr 10: 41-62.
4. Heideman PD, Heaney LR, Thomas RL, Erickson KR (1987) Patterns of
faunal diversity and abundance of non-volant small mammals on Negros
Island, Philippines. J Mammal 68: 884-888.
5. Heaney LR, Heideman PD, Rickart EA, Utzurrum RB, Klompen JSH (1989)
Elevational zonation of mammals in the central Philippines. J Trop Ecol 5:
259-280.
6. Rickart EA, Heaney LR, Utzurrum RB (1991) Distribution and ecology of
small mammals along an elevational transect in southeastern Luzon,
Philippines. J Mammal 72: 458-469.
7. Yu HT (1994) Distribution and abundance of small mammals along a
subtropical elevational gradient in central Taiwan. J Zool 234: 577-600.
8. Stanley WT, Hutterer R (2007) Differences in abundance and species richness
between shrews and rodents along an elevational gradient in the Udzungwa
Mountains, Tanzania. Acta Theriol 52: 261–275.
9. Goodman SM, Ganzhorn JU, Rakotondravony D (2003) Introduction to the
Mammals. In: Goodman, SM, Benstead, JP, editors. The Natural History of
Madagascar. Chicago: The University of Chicago Press. Pp. 1159-1186.
10. McCain CM (2005) Elevational gradients in diversity of small mammals.
Ecology 86: 366-372.
11. Moritz C, Patton JL, Conroy CJ, Parra JL, White GC, Beissinger SR (2008)
Impact of a Century of Climate Change on Small-Mammal Communities in
Yosemite National Park, USA. Science 322: 261-264.
12. Newmark, WD (1991) Priorities for the conservation of Mount Kilimanjaro.
In: Newmark, WD, editor. The Conservation of Mount Kilimanjaro. IUCN,

Publications and Manuscripts: Kilimanjaro mammals
81
Gland, Switzerland and Cambridge, UK. pp. 111-114.
13. Grimshaw J, Cordeiro N, Foley C (1995) The mammals of Kilimanjaro.
J East Afr Nat Hist 84: 105–139.
14. Shore RF, Garbett SD (1991) Notes on the small mammals of the Shira
Plateau, Mt. Kilimanjaro. Mammalia 55: 601-607.
15. Mulungu LS, Makundi RH, Massawe AW, Machang’u, RS, Mbije, NE (2008)
Diversity and distribution of rodent and shrew species associated with
variations in altitude on Mount Kilimanjaro, Tanzania. Mammalia 72: 178-
185.
16. Thompson LG, Brecher HH, Mosley-Thompson E, Hardy DR, Mark BG
(2009) Glacier loss on Kilimanjaro continues unabated. Proc Natl Acad Sci
USA 106: 19770-19775.
17. Goodman SM, Newmark WD, Stanley WT, Howell KM (1995) The
Ambangulu Forest, West Usambara Mountains, Tanzania: a threatened
Eastern Arc forest. Oryx 29: 212–214.
18. Stanley WT, Kihaule PM, Howell KM, Hutterer R (1998) Small mammals of
the Eastern Arc Mountains, Tanzania. J East Afr Nat Hist 87: 91–100.
19. Stanley WT, Goodman SM (2011) Small mammal inventories in the East and
West Usambara Mountains, Tanzania. 4. Rodentia. In: Stanley WT, editor.
Studies of Montane Vertebrates of Tanzania. Fieldiana Life Earth Sci 4: 53–
73.
20. Sampson, DN (1965) The geology, volcanology and glaciology of
Kilimanjaro. Tanzan Notes Rec 64: 118-124.
21. Hanby, J (1987) Kilimanjaro National Park. Tanzania National Parks/Africa
Wildlife Foundation.
22. Mwasaga, BC (1991) The natural forest of Mount Kilimanjaro. In: Newmark,
WD, editor. The Conservation of Mount Kilimanjaro. IUCN, Gland,
Switzerland and Cambridge, UK. pp. 111-114.
23. Stanley WT, Goodman SM, Hutterer R (1996) Notes on the insectivores and
elephant shrews of the Chome Forest, South Pare Mountains, Tanzania
(Mammalia: Insectivora and Macroscelidea). Zool Abh 49: 131–148.
24. Stanley WT, Goodman SM, Kihaule PM (1998) Results of two surveys of
rodents in the Chome Forest Reserve, South Pare Mountains, Tanzania
(Mammalia: Rodentia). Zool Abh 50: 145–160.

Publications and Manuscripts: Kilimanjaro mammals
82
25. Stanley WT, Goodman SM, Kihaule PM, Howell KM (2000) A survey of the
small mammals of the Gonja Forest Reserve, Tanzania. J East Afr Nat Hist 89:
73–83.
26. Stanley WT, Nikundiwe AM, Mturi FA, Kihaule PM, Moehlman PD (2005)
Small mammals collected in the Udzungwa Mountains National Park,
Tanzania. J East Afr Nat Hist 94: 203–212.
27. Stanley WT, Rogers MA, Howell KM, Msuya CA (2005) Results of a survey
of small mammals in the Kwamgumi Forest Reserve, East Usambara
Mountains, Tanzania. J East Afr Nat Hist 94: 223–230.
28. Stanley WT, Goodman SM, Hutterer R (2011) Small mammal inventories in
the East and West Usambara Mountains, Tanzania. 2. Families Soricidae
(Shrews) and Macroscelididae (Elephant Shrews). In: Stanley WT, editor.
Studies of Montane Vertebrates of Tanzania. Fieldiana Life Earth Sci 4: 18–
33.
29. Stanley WT, Goodman SM, Newmark WD 2011) Small mammal inventories
in the East and West Usambara Mountains, Tanzania. 1. Study areas,
methodologies, and general results. In: Stanley WT, ed. Studies of Montane
Vertebrates of Tanzania. Fieldiana Life Earth Sci 4: 1–17.
30. Carleton MD, Stanley WT (2012) Species limits within the Praomys
delectorum group (Rodentia: Muridae: Murinae) of East Africa: A
morphometric reassessment and biogeographic implications. Zool J Linn Soc
165: 420-469.
31. Holden ME (2005) Family Gliridae. In: Wilson DE, Reeder DM, editors.
Mammal species of the world: A taxonomic and geographic reference, Third
Edition. Baltimore: Johns Hopkins University Press, pp. 819–841.
32. Hutterer R (2005) Order Soricomorpha. In: Wilson DE, Reeder DM, editors.
Mammal species of the world: A taxonomic and geographic reference, Third
Edition. Baltimore: Johns Hopkins University Press, pp. 220–299.
33. Musser GG, Carleton MD (2005) Superfamily Muroidea. In: Wilson DE,
Reeder DM, editors. Mammal species of the world: A taxonomic and
geographic reference, Third Edition. Baltimore: Johns Hopkins University
Press, pp. 894–1531.
34. Sikes RS, Gannon WL and the Animal Care and Use Committee of the
American Society of Mammalogists. (2011) Guidelines of the American

Publications and Manuscripts: Kilimanjaro mammals
83
Society of Mammalogists for the use of wild mammals in research. J Mammal
92: 235-253.
35. Carleton MD, Schaefer Byrne E (2006) The status of Otomys orestes dollmani
Heller, 1912 (Muridae: Otomyinae), a rodent described from the Mathews
Range, central Kenya. Proc Biol Soc Wash 119: 477–515.
36. Swynnerton GH, Hayman RW (1951) A checklist of the land mammals of the
Tanganyika Territory and Zanzibar Protectorate. J East Afr Nat Hist 20: 274–
392.
37. Child GS (1965) Some notes on the mammals of Kilimanjaro.
Tanzan Notes Rec 64: 77-89.
38. Carleton MD, Stanley WT (2005) Review of the Hylomyscus denniae complex
in Tanzania, with description of a new species. Proc Biol Soc Wash 118: 619–
646.
39. Stanley WT, Kihaule PM, Munissi MJ (2007) Small mammals of two forest
reserves in the North Pare Mountains, Tanzania. J East Afr Nat Hist 96: 215–
226.
40. Thomas, O (1909) New African small Mammals in the British Museum
Collection. Ann Mag Nat Hist 8: 98-112.
41. Dieterlen, F. (1979) Der früheste Fund der afrikanischen Kleinen Hamsterratte
(Beamys hindei) (Cricetomyinae; Cricetidae; Rodentia) Stuttgarter Beitr zur
Naturk ser. A 330: 1-3.
42. Demeter A, Hutterer R (1986) Small mammals from Mt. Meru and its
environs (Northern Tanzania). Cimbebasia 8: 199–207.
43. Bishop IR (1979) Notes on Praomys (Hylomyscus) in eastern Africa.
Mammalia 43: 521–530.
44. Stanley WT, Rogers MA, Hutterer R (2005) A morphological assessment of
Myosorex zinki, an endemic shrew on Mount Kilimanjaro. Belg J Zool 135
Supplement: 141–144.
45. Stanley WT, Kihaule PM, Rogers MA, Makwetta AJ (2003) Elevational
distribution and ecology of the endemic Myosorex zinki (Insectivora:
Soricidae) along the southeastern slope of Mount Kilimanjaro, Tanzania.
Tanzania Wildlife Research Institute: Proceedings of the third annual
scientific conference, Arusha, Dec 3-5, 2002.

Publications and Manuscripts: Kilimanjaro mammals
84
46. Thesiger, W (1970) Wild Dog at 5894 metres. E Afr Wildl J 8: 202.

Publications and Manuscripts: Kilimanjaro mammals
85
FIGURE LEGENDS
Figure 1. Map of Mt. Kilimanjaro showing routes, elevational contours and study
sites.

Publications and Manuscripts: Kilimanjaro mammals
86
Figure 2. Species accumulation curves (for both pitfall and trap lines combined) for
each site. The dashed lines represent the number of captures each day; the solid lines
represent the cumulative number of new species for the site observed each day. The
graph at the lower right shows the number of specimens of shrew, rodent and
mammal captured at each site.

Publications and Manuscripts: Kilimanjaro mammals
87
Figure 3. The relationship between numbers of individuals captured each day of the
sampling period, and rainfall, at each site. Rodentia are on the left and Soricomorpha
are on the right.

Publications and Manuscripts: Kilimanjaro mammals
88
Table 1. Climatic data for each of the sites sampled on Mt. Kilimanjaro in July-August,
2002. Totals given as mean ± standard deviation, range and sample size (number of
days measured). Sample size for rainfall is given as number of days monitored and
(number of days with rain).
Elevation (m) Daily Minimum
Temperature (º C)
Daily Maximum
Temperature (º C)
Daily rainfall (mm)
2000 8.5° ± 1.7 14.1° ± 2.1 4.2 ± 3.0
5 – 10º 12 – 18° 0 – 9
N = 9 N = 8 N = 9 (8)
2500 3.6° ± 2.2 11.6° ± 1.9 1.6 ± 0.3
1 – 6.5º 9 – 15° 0 – 1.8
N = 9 N = 9 N = 8 (2)
3000 2.2° ± 2.5 9.3° ± 2.5 1.5 ± 3.1
-2 – 5º 6 – 12° 0 – 9.5
N = 9 N = 8 N = 9 (6)
3500 -0.9° ± 1.2 12.3° ± 3.5 0.1 ± 0.1
-3 – 1º 7.5 – 17° 0 – 0.2
N = 9 N = 8 N = 8 (3)
4000 -6.8° ± 3.6 20.5° ± 5.9 1.5 ± 3.4
-12 – -1º 11 – 25.5° 0 – 10.2
N = 9 N = 8 N = 9 (3)

Publications and Manuscripts: Kilimanjaro mammals
89
Table 2. Trapping totals for rodents and shrews by trap technique on the southeastern slope of
Mt. Kilimanjaro in July-August, 2002.
Elevation 2000 m 2500 m 3000 m 3500 m 4000 m Totals
BUCKETS
# bucket-nights 616 649 649 638 649 3201
# individuals 84 75 86 51 33 329
(% bucket success) (13.6) (11.5) (13.2) (8.0) (5.1) (10.3)
# species 10 5 7 3 5 13
# shrews 68 74 79 48 30 299
(% bucket success) (11.0) (11.4) (12.2) (7.5) (4.6) (9.3)
# shrew species 5 4 4 2 3 6
# rodents 16 1 7 3 3 30
(% bucket success) (2.6) (0.1) (1.1) (0.5) (0.5) (0.9)
# rodent species 5 1 3 1 2 7
TRAPS
# trap-nights 1600 1776 1785 1600 1600 8361
# individuals 67 68 57 3 88 283
(% trap success) (4.2) (3.8) (3.2) (0.2) (5.5) (3.4)
# species 5 9 11 2 4 12
# rodents 65 63 48 3 84 263
(% trap success) (4.1) (3.5) (2.7) (0.2) (5.2) (3.1)
# rodent species 4 7 8 2 3 8
# shrews 2 5 9 0 4 20
(% bucket success) (0.1) (0.3) (0.5) (0.2) (0.2)
# shrew species 1 2 3 0 1 4
TOTAL
# sample-nights 2216 2425 2434 2238 2249 11562
# individuals 151 143 143 54 121 612
(% sample success) (6.8) (5.9) (5.9) (2.4) (5.4) (5.3)
# species 11 13 14 4 6 16

Publications and Manuscripts: Kilimanjaro mammals
90
Table 3. Elevational distribution of Soricomorpha species along the southeastern
slope of Mt. Kilimanjaro in July-August, 2002. Only specimens caught in traps or
buckets are included in totals. a presence inferred from occurrence at lower and higher
sites.
Elevation 2000 m 2500 m 3000 m 3500 m 4000 m Totals
Species
Crocidura allex 24 19 40 45 30 158
Crocidura hildegardeae 7 0 0 0 0 7
Crocidura monax 21 29 26 0 0 76
Crocidura olivieri 2 2 0 0 0 4
Myosorex zinki 0 3 4 3 3 13
Sylvisorex granti 16 26 18 0 a 1 61
Total # individuals 70 79 88 48 34 319
Total # species 5 5 4 2+1 a 3 6
Total # sample-nights 2216 2425 2434 2238 2249 11562
Sample success (%) 3.1 3.2 3.6 2.1 1.5 2.7
Total # caught in buckets 68 74 79 48 30 299
Total # bucket-nights 616 649 649 638 649 3201
Bucket success (%) for
pitfall lines
11.0 11.4 12.2 7.5 4.6 9.3

Publications and Manuscripts: Kilimanjaro mammals
91
Table 4. Elevational distribution of rodent species along the southeastern slope of Mt.
Kilimanjaro in July-August, 2002. Only specimens caught in traps or buckets are
included in totals. a presence inferred from occurrence at lower and higher sites.
Elevation 2000 m 2500 m 3000 m 3500 m 4000 m Totals
Species
Otomys angoniensis 0 1 1 0 0 2
Otomys tropicalis 0 4 1 0 a 7 12
Dendromus insignis 4 1 5 5 21 36
Dendromus melanotis 5 1 4 0 0 10
Grammomys
dolichurus
3 6 6 0 0 15
Lophuromys aquilus 23 25 17 0 0 65
Praomys taitae 37 25 3 0 0 65
Rhabdomys dilectus 0 0 11 1 59 71
Graphiurus murinus 9 1 5 0 0 15
Tachyoryctes daemon 0 0 2 0 0 2
Total # individuals 81 64 55 6 87 293
Total # species 6 8 10 2+1 a
3 10
Total # sample-nights 2216 2425 2434 2238 2249 11562
Sample success (%) 3.6 2.6 2.2 0.3 3.9 2.5
Total # caught in traps 65 64 48 3 84 264
Total # trap-nights 1600 1776 1785 1600 1600 8361
Trap success (%) 4.1 3.6 2.7 0.2 5.2 3.1

Publications and Manuscripts: Kilimanjaro mammals
92
Table 5. Product-moment correlation coefficients (r) of cumulative sample-nights with four
parameters of trap/bucket captures. Results are given for each sampling method for both targeted
groups and everything captured. Values in parentheses represent strong but not significant
correlations. * = P ≤ 0.05; ** = P ≤ 0.01
Daily cumulative sample-nights correlated
with (across)
Number of
individuals
Number of
Species
New Species
added
Cumulative
species
Total
traps (rodents only) 0.099 -0.131 -0.428** 0.713**
traps (all captures) 0.068 -0.168 -0.491** 0.778**
buckets (shrews only) (-0.249) -0.085 -0.161 0.673**
buckets (all captures) -0.149 0.168 (-0.217) 0.875**
traps and buckets combined (all captures) -0.049 -0.100 -0.404** 0.798**
2000 m
traps (rodents only) (-0.698) 0.231 (-0.540) 0.865**
traps (all captures) -0.746* -0.066 (-0.605) (0.577)
buckets (shrews only) -0.800* (-0.668) (-0.684) (0.577)
buckets (all captures) -0.698 0.126 -0.882** 0.900**
traps and buckets combined (all captures) -0.786* -0.425 -0.752* 0.883**
2500 m
traps (rodents only) (-0.541) -0.353 -0.376 0.727*
traps (all captures) -0.455 -0.262 (-0.515) 0.776*
buckets (shrews only) (-0.660) -0.374 (-0.542) 1.000**
buckets (all captures) (-0.657) -0.429 (-0.611) 0.722*
traps and buckets combined (all captures) (-0.604) -0.442 (-0.591) 0.819**
3000 m
traps (rodents only) -0.424 -0.287 -0.452 0.809**
traps (all captures) -0.342 -0.177 -0.401 0.826**
buckets (shrews only) -0.020 0.164 (-0.585) (0.548)
buckets (all captures) 0.060 -0.137 -0.666* 0.730*
traps and buckets combined (all captures) -0.213 -0.220 (-0.539) 0.747*
3500 m
traps (rodents only) 0.169 0.169 -0.126 0.907**
traps (all captures) 0.169 0.169 0.247 0.907**
buckets (shrews only) 0.809** -0.365 -0.725* (0.548)
buckets (all captures) -0.760* 0.000 (-0.645) (0.548)
traps and buckets combined (all captures) -0.776* -0.274 -0.754* 0.675*
4000 m
traps (rodents only) -0.310 -0.252 (-0.577) 1.000**
traps (all captures) -0.309 -0.314 (-0.577) 1.000**
buckets (shrews only) -0.465 -0.438 (-0.645) (0.548)
buckets (all captures) -0.439 -0.259 (-0.628) 0.903**
traps and buckets combined (all captures) -0.108 -0.030 (-0.523) (0.548)
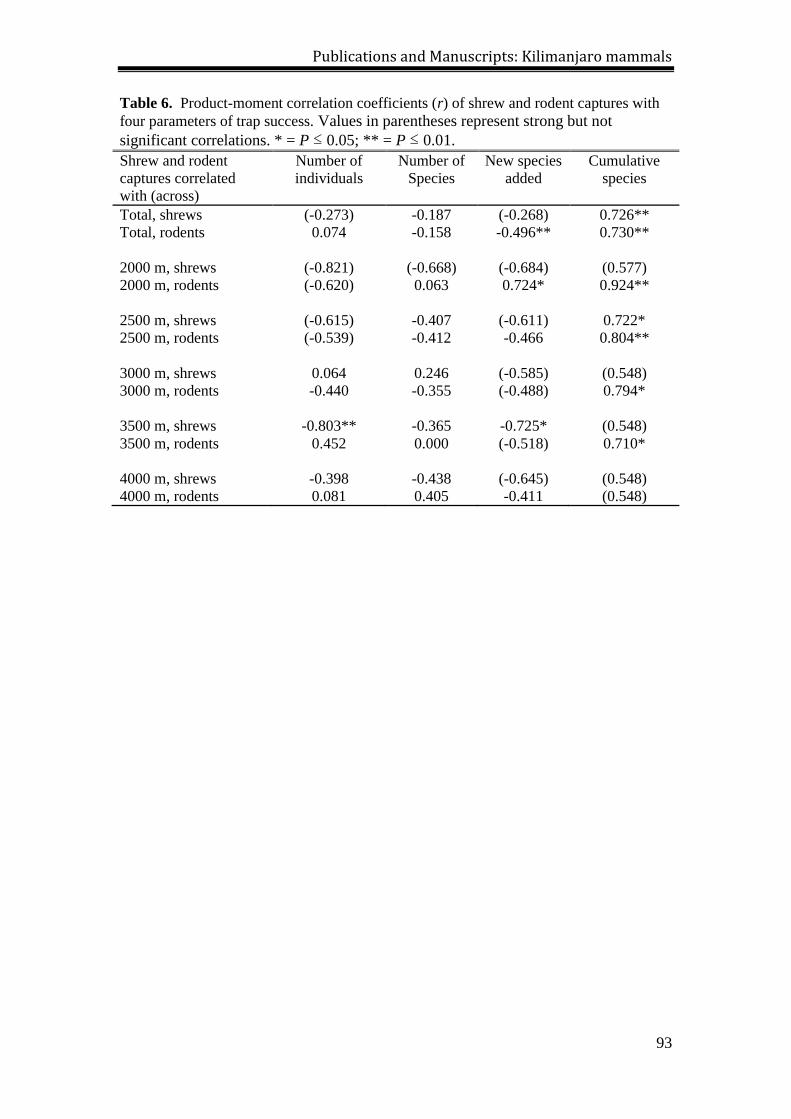
Publications and Manuscripts: Kilimanjaro mammals
93
Table 6. Product-moment correlation coefficients (r) of shrew and rodent captures with
four parameters of trap success. Values in parentheses represent strong but not
significant correlations. * = P ≤ 0.05; ** = P ≤ 0.01.
Shrew and rodent
captures correlated
with (across)
Number of
individuals
Number of
Species
New species
added
Cumulative
species
Total, shrews (-0.273) -0.187 (-0.268) 0.726**
Total, rodents 0.074 -0.158 -0.496** 0.730**
2000 m, shrews (-0.821) (-0.668) (-0.684) (0.577)
2000 m, rodents (-0.620) 0.063 0.724* 0.924**
2500 m, shrews (-0.615) -0.407 (-0.611) 0.722*
2500 m, rodents (-0.539) -0.412 -0.466 0.804**
3000 m, shrews 0.064 0.246 (-0.585) (0.548)
3000 m, rodents -0.440 -0.355 (-0.488) 0.794*
3500 m, shrews -0.803** -0.365 -0.725* (0.548)
3500 m, rodents 0.452 0.000 (-0.518) 0.710*
4000 m, shrews -0.398 -0.438 (-0.645) (0.548)
4000 m, rodents 0.081 0.405 -0.411 (0.548)

Publications and Manuscripts: Kilimanjaro mammals
94
Table 7. Product-moment correlation coefficients (r) of amount of daily rainfall with
four parameters of shrew and rodent daily captures. All captures (both traps and
pitfalls) of each group are included. * = P ≤ 0.05; ** = P ≤ 0.01
Rainfall amount correlated with
(across)
Number of
individuals
Number
of
Species
New
species
added
Cumulative
species
Total, shrews (buckets and traps) 0.385* 0.422** 0.086 (0.277)
Total, rodents (buckets and traps) 0.190 (0.280) (0.230) 0.053
2000 m, shrews (0.523) (0.655) -0.025 0.262
2000 m, rodents -0.108 (0.523) 0.424 -0.008
2500 m, shrews (0.592) (0.502) -0.050 0.283
2500 m, rodents (0.544) 0.201 -0.217 0.096
3000 m, shrews 0.719* 0.199 -0.246 0.187
3000 m, rodents (0.644) (0.487) 0.139 0.122
3500 m, shrews 0.363 0.378 -0.357 0.236
3500 m, rodents -0.267 -0.060 0.286 0.334
4000 m, shrews (0.629) (0.652) 0.950** -0.160
4000 m, rodents -0.411 -0.086 0.927** -0.160

Publications and Manuscripts: Kilimanjaro mammals
95
Table 8. Product-moment correlation coefficients (r) between elevation and trap success.
Values in parentheses represent strong but not significant correlations. Significant
relationships (P < 0.05) are in bold.
Elevation correlated with (r) P
Total number of individual mammals collected -0.59 > 0.05
Total trap success -0.59 > 0.05
Total number of species collected -0.68 > 0.05
Total number of shrews collected (-0.73) > 0.05
Shrew trap success (-0.79) > 0.05
Total number of shrew species collected -0.95 < 0.05
Total number of rodents collected -0.23 > 0.05
Rodent trap success -0.21 > 0.05
Total number of rodent species collected -0.56 > 0.05

Publications and Manuscripts: Crocidura monax
96
Phylogeny, phylogeography, and geographic variation in the Crocidura
monax (Soricidae) species complex from the montane islands of Tanzania, with
descriptions of three new species
IN PRESS IN ZOOLOGICAL JOURNAL OF LINNEAN SOCIETY
WILLIAM T. STANLEY1*, RAINER HUTTERER
2, THOMAS C. GIARLA
3, and
JACOB A. ESSELSTYN3
1 Science and Education, Field Museum of Natural History, 1400 South Lake Shore
Drive, Chicago, IL 60605 USA
2 Zoologisches Forschungsmuseum Alexander Koenig, Adenauerallee 160, 53113
Bonn, Germany.
3 Museum of Natural Science and Department of Biological Sciences, Louisiana State
University, 119 Foster Hall, Baton Rouge, LA 70803 USA
*Corresponding author. William T. Stanley, Science and Education, Field Museum of
Natural History, 1400 South Lake Shore Drive, Chicago, Illinois 60605 USA. E–mail:
Running head: Systematics of Crocidura monax

Publications and Manuscripts: Crocidura monax
97
ABSTRACT
We assess morphological and multilocus genetic variation among eleven isolated
montane populations of white-toothed shrews from Tanzania that have been referred
to either Crocidura monax Thomas or C. montis Thomas. The montane sites we
sampled represent “sky-islands” from two geologically distinct archipelagos
(Northern Highlands and the Eastern Arc Mountains) and are a significant component
of the Eastern Afromontane Biodiversity Hotspot. We used multivariate analyses of
morphometric traits and phylogenetic and species-delimitation analyses of multilocus
DNA sequence data to assess species-level diversity. Our species delimitation
analyses included a novel, pairwise validation approach that avoids potential biases
associated with specifying a guide tree. These analyses reveal several distinct
lineages, which we treat as six allopatric species. Each species is restricted to one, two
or four mountains. We use available names to recognize C. monax, C. tansaniana
Hutterer, and C. usambarae Dippenaar, while naming and describing three new
species. Our results demonstrate the effectiveness of combining morphological and
genetic data to uncover and describe hidden diversity in a cryptic mammalian system.
ADDITIONAL KEYWORDS: Crocidura – Eastern Arc Mountains – Northern
Highlands – Soricomorpha – species delimitation – taxonomy – morphometrics
INTRODUCTION
Integrative systematic studies of small mammals continue to document the
common failure of taxonomic hypotheses to reflect evolutionary history, especially
among the small mammal faunas of montane tropical regions (Carleton & Goodman,
1998; Taylor et al., 2009; Heaney et al., 2011). The diversity of some groups, such as
shrews (order Soricomorpha), has proven especially difficult to untangle because of
an apparently conservative morphology at broad taxonomic scales. Taxonomic

Publications and Manuscripts: Crocidura monax
98
resolution in groups such as these can often be greatly enhanced by combining
morphological and genetic data to infer relationships and delimit species.
The montane vertebrates of Tanzania have been the focus of biological study
for over a century, gaining increased attention in the past three decades (Moreau,
1966; Bowie et al., 2004; Davenport et al., 2006; Lawson, 2010; Menegon et al.,
2011). Nevertheless, the fauna is only coarsely documented, as evidenced by
discoveries of new species, including large, charismatic mammals (e.g. Davenport et
al. 2006). Shrews inhabit montane and submontane environments (sensu Lovett,
1993) in Tanzania and show the highest level of endemism and the most restricted
distributions among mammals of these habitats. Examples include Myosorex zinki
Heim de Balsac & Lamotte (Mt. Kilimanjaro only), Congosorex phillipsorum Stanley,
Rogers & Hutterer (Udzungwa Mountains only), Crocidura telfordi Hutterer (Uluguru
and Udzungwa Mountains only) and Sylvisorex howelli Jenkins (Eastern Arc
Mountains [EAM] only; Hutterer, 2005; Stanley & Olson, 2005; Stanley et al., 2005).
Several other shrew species in the region are considered more widespread (e.g.
Crocidura hildegardeae Thomas, C. luna Dollman, and C. monax Thomas), but it is
not clear whether these broad distributions are real or reflect a lack of taxonomic
resolution.
Crocidura monax was described from a series of 8 specimens collected near
the German mission at Rombo (6000’; 1829 m), on the eastern slope of Mt.
Kilimanjaro. The description emphasized the “almost bristleless tail” with only a “few
scattered ones [bristles] on the basal third” (Thomas, 1910). The author compared the
new species to C. turba Dollman (stating that C. turba had many more bristles on the
tail), C. fumosa Thomas (C. fumosa is smaller and has more bristles on the tail) and C.
maurisca Thomas (C. maurisca is smaller). Subsequently, C. monax has been
considered part of the C. littoralis Heller species complex (Heller, 1910; Heim de
Balsac & Meester, 1977; Dieterlen & Heim de Balsac, 1979; Hutterer, 2005), together
with C. oritis Hollister and C. ultima Dollman. Dieterlen and Heim de Balsac (1979)
differentiated C. monax from C. littoralis based on the larger upper molars and
premolars of the former. Hutterer (2005) included C. oritis within C. littoralis.
Dollman (1915) differentiated C. monax, with its similarly sized second and third
upper unicuspids from C. ultima, which has a second unicuspid much smaller than its
third unicuspid.

Publications and Manuscripts: Crocidura monax
99
Dippenaar (1980) defined the “C. monax-dolichura complex” as having low
pilosity on the tail, with hairs restricted to the basal section. He included C. monax, C.
ultima, C. maurisca, C. littoralis, C. lanosa Heim de Balsac, C. kivuana Heim de
Balsac, C. niobe Thomas, C. dolichura Peters and C. latona Hollister in his study.
However, the tail of C. dolichura is longer than the head and body, a condition not
seen in the other species listed above (including C. monax). Moreover select cranial
measurements of C. kivuana, C. niobe, and C. latona fall well below those of C.
monax (Thomas, 1906; Hollister, 1916; Heim de Balsac, 1968). In addition, C. lanosa
has a thicker pelage and larger skull than C. monax according to Heim de Balsac
(1968), suggesting that Dippenaar’s grouping was overly inclusive.
As part of his work on the monax-dolichura group, Dippenaar (1980) also
described C. usambarae Dippenaar from the Lushoto (Shume and Magamba) area of
the West Usambara Mountains. Crocidura monax and C. usambarae, as defined by
Dippenaar, are allopatric, with C. monax on Kilimanjaro and C. usambarae in the
West Usambaras. The two forms are not distinguishable in external proportions, but
the cranium of C. usambarae is smaller (Dippenaar, 1980). Dippenaar (1980) also
distinguished usambarae from C. littoralis, C. maurisca and C. ultima based on
differences in various cranial dimensions.
Subsequently, Hutterer (1986) described C. tansaniana Hutterer from the East
Usambara Mountains, showing that it was larger in cranial characteristics (especially
the third upper molar) than C. monax. He described the C. monax group as containing
C. monax, C. tansaniana, and C. usambarae and suggested that C. monax was found
on mountains other than Kilimanjaro, a hypothesis repeated later when he stated that
the distribution of C. monax is “montane forests in Northern Tanzania” (Hutterer,
2005). He also described C. telfordi Hutterer as endemic to the Eastern Arc
Mountains, but, based on morphological characters, stated that this species is more
closely related to C. lanosa than to C. monax.
Hutterer’s (1986) suggestion that Crocidura monax is distributed more widely
is consistent with some, but not all taxonomic delineations. Heim de Balsac and
Meester (1977) regarded C. ultima as a subspecies of C. monax and thus included
western Kenya in its range, but Jenkins (in Burgess et al., 2000) restricted C. monax
to the type locality. Stanley et al. (2000b), in agreement with Hutterer (1986), stated

Publications and Manuscripts: Crocidura monax
100
that it occurred on a number of mountains within the Eastern Arc “archipelago” in
Tanzania, including the East and West Usambara, Nguru, Uluguru and Udzungwa
Mountains (Fig. 1).
Although Crocidura monax has never been explicitly recorded from Mt. Meru,
which neighbors Mt. Kilimanjaro (Fig. 1), Hutterer (2005) stated that it might occur
there. Demeter and Hutterer (1986) listed the small mammals of Mt. Meru and
identified the larger shrews of the fauna as Crocidura montis Thomas. This form
exhibits extensive pilosity on the tail, in stark contrast to the nearly naked tail of C.
monax. However, the phylogenetic relationship of the Meru population to topotypical
C. montis (Rwenzori Mountains) has never been assessed. Given the proximity of
Meru to Kilimanjaro and other ranges that have records of C. monax, the relationship
of the Meru shrews to those identified tentatively as C. monax deserves attention.
Over the past two decades, numerous inventories of wild mammals in montane
habitats of Tanzania have produced series of specimens that now allow investigation
of the phylogeny, phylogeography, and geographic variation of populations either
identified as Crocidura monax or occurring on mountains neighboring the type
locality. Details of many of these surveys have been published elsewhere (Stanley et
al., 1996; Stanley et al., 1998; Stanley et al, 2003; Stanley et al., 2007; Stanley &
Hutterer, 2007; Stanley & Esselstyn, 2010; Stanley et al., 2011b; Stanley, Rogers,
Kihaule, & Munissi, 2014). In this paper, we analyze new molecular and
morphological data from voucher specimens collected during these surveys to a) test
existing hypotheses of the relationships among the geographically isolated
populations of the C. monax group (sensu Hutterer, 1986); b) test the specific status of
C. tansaniana; c) resolve the identity of the larger shrews on Mt. Meru most recently
attributed to C. montis; and d) characterize the distribution, geographic variation, and
biogeographic history of the C. monax group.
METHODS AND MATERIALS
Fieldwork
Specimens were collected during faunal surveys of the mountains of Tanzania
by the first author (WTS) and biologists from the University of Dar es Salaam. We

Publications and Manuscripts: Crocidura monax
101
collected shrews in montane habitats on eleven isolated mountains in Tanzania,
including (from north to south): Ngorongoro, Mt. Meru, Mt. Kilimanjaro, North Pare,
South Pare, West Usambara, East Usambara, Ukaguru, Rubeho, Uluguru and
Udzungwa (Fig. 1). Shrews were collected using pitfall lines consisting of eleven 15-
liter buckets buried in the ground such that the top of the bucket was flush with the soil
surface. Details are presented in Stanley et al. (2011). All specimens were handled in
accordance with American Society of Mammalogists guidelines (Sikes et al., 2011).
Voucher material was prepared as skins, skulls and skeletons or in fluid and was
deposited in the Field Museum of Natural History, Chicago. Heart, kidney, and liver
tissues were frozen in liquid nitrogen or buffered in dimethyl sulfoxide (DMSO).
WTS took external measurements from each specimen at the time of collection, which
include total length (TL, tip of nose to last caudal vertebra), head and body (HB, tip of
nose to where tail inserts on body), tail vertebrae length (TV, from where tail inserts
on body to last caudal vertebra), hind foot (HF, from heel to tip of claw), ear (EAR,
notch to tip of ear) and weight (WT; DeBlase & Martin, 1974). The only exceptions
were some specimens from the West Usambara sample that were measured in the
same manner by S. M. Goodman. All linear measurements are in millimeters (mm)
and weight is in grams (g).
We obtained tissues of taxa referenced in previous taxonomic treatments of C.
monax from the FMNH collection of tissues; most were collected as part of the long-
term program of Julian Kerbis Peterhans (Kerbis Peterhans et al., 2008; 2009; 2010)
in montane habitats of the Albertine Rift.
Morphology
We studied external morphology on fluid specimens and dry skins under
magnification. Details of skulls and teeth were examined with the aid of a dissecting
microscope and drawings were made with a camera lucida attached to a microscope.
The terminology follows Brown and Yalden (1973) for external features and Meester
(1963) for cranial and dental characters.
Morphometrics
Skulls from adults (with complete fusion between the basioccipital and
basisphenoid bones) collected by WTS were included in morphometric analyses.

Publications and Manuscripts: Crocidura monax
102
Specimens were assigned to one of four ontogenetic categories of toothwear
following the definitions of Dippenaar (1997), with a focus on the wear of the first
upper molar. FMNH 151118, 151125, 151109, and 147205 exemplified categories I
(youngest), II, III, and IV (oldest), respectively, and we used these as a reference
series.
WTS used digital calipers (to the nearest 0.01 mm) to record the following
craniodental measurements: condylo-incisive length (CI), basal length (BL), post-
palatal length (PPL), length of entire upper toothrow (UTRL), least interorbital width
(LIW), bimaxillary width (BW), nasal width (NW), greatest width of the braincase
(GW), height of the braincase (PMH; measured by placing the skull on a microscope
slide, measuring from the ventral surface of the slide to the highest point of the
cranium and then subtracting the thickness of the slide from that measurement; J.
Patton, pers. comm.), post-glenoid width (PGW), width of third upper incisor (I3-W),
width of upper canine (C-W), length of third upper molar (M3-L), width of third upper
molar (M3-W), least distance across the maxillary plate parallel to the alveolar line
(MP), length of mandible including the first incisor (M&I) and length of mandibular
toothrow including first incisor (LTR). These variables follow Dippenaar (1977), van
Zyll de Jong and Kirkland (1989), and Carraway (1990) and are illustrated in Stanley
& Olson (2005).
WTS measured the variables detailed above in specimens of putative
Crocidura monax from across Tanzania, putative C. montis from Mt. Meru, as well as
type material of various taxa held in the FMNH, British Museum (Natural History),
London (BMNH) and the Alexander Koenig Museum, Bonn (ZFMK). Additional
specimens, collected during Tanzanian-Belgian rodent projects, were studied in the
museum collections of Royal Museum for Central Africa, Tervuren (RMCA) and
ZFMK. We calculated standard descriptive statistics (mean, range, standard deviation
and coefficient of variation of each character) for each population. We tested for
sexual dimorphism in external and cranial variables within each montane population
with one-way analyses of variances (ANOVA). To test for geographical variation in
morphology, a one-way ANOVA (effect = mountain) was used to identify characters
that differed significantly among populations. Discriminant function analyses of log-
transformed craniodental variables were conducted to assess multivariate patterns of
variation. Variable loadings are presented as Pearson product-moment correlation

Publications and Manuscripts: Crocidura monax
103
coefficients of the derived components with the original cranial measurements. All
statistical analyses were conducted using Systat (version 11).
DNA sequencing and analysis
We extracted, amplified, and sequenced various fragments of DNA from
montane populations of the Crocidura monax species complex and several potentially
related taxa. Laboratory protocols followed those of Esselstyn et al. (2009, 2013). We
first sequenced 684 bp from the 3′ end of cytochrome b (CytB) in 267 specimens
(APPENDIX I.). Initial phylogenetic analyses of these data indicated that C. monax is
not a close relative of C. dolichura, C. turba, C. telfordi, C. maurisca, C. latona, C.
littoralis, C. oritis, C. kivuana, or C. niobe. We therefore focused subsequent
sequencing of nuclear DNA on C. fumosa, C. monax, C. montis, C. tansaniana and C.
usambarae. We sequenced the nuclear exons breast cancer susceptibility 1 (BRCA),
growth hormone receptor 10 (GHR) and von Willebrand factor 28 (vWF) in 84
specimens drawn from each montane population of these putative species. The three
exons were subsequently used in species delimitation analyses (see below). We also
sequenced fragments of apolipoprotein B (ApoB), brain derived neurotrophic factor
(BDNF), mast cell growth factor (MCGF), prostaglandin E4 receptor (PTGER) and
recombination activating gene 1 (RAG) from a subset of 17 individuals to provide
independent estimates of the population-scaled mutation rate () to guide prior
probability selection in species delimitation analyses. A table of GenBank accession
numbers (KP061859-KP062422) for all individuals sequenced is provided in online
supporting information.
We estimated mitochondrial gene tree relationships with our CytB alignment,
which contained sequences from 267 individuals. Sixteen sequences were incomplete
at one or both ends of the alignment, but the matrix was 99.0% complete. We
analyzed these data as a single partition. An appropriate model of sequence evolution
was chosen among 88 candidates using the Bayesian information criterion and a fixed
BIONJC tree in jModeltest 2.1.4 (Guindon & Gascuel 2003; Darriba et al. 2012). We
estimated phylogenetic relationships and branch lengths in a Bayesian context using
BEAST v. 2.1.3 (Bouckaert et al. 2014). We ran four independent Markov chain
Monte Carlo analyses of 2 × 10⁷ generations, with parameters sampled every 2000
generations. We applied a log-normal relaxed clock (mean = 1.0) model to account

Publications and Manuscripts: Crocidura monax
104
for rate heterogeneity among branches (Drummond et al. 2006). We applied a
constant population size coalescent model to the topological inference. We examined
convergence diagnostics, including the trends, distributions, and effective sample
sizes of parameters, including the likelihood, in Tracer v1.5. We chose an appropriate
burn-in based on this analysis.
We resolved nuclear DNA sequences to their constituent haplotypes with the
PHASE software package (Stephens et al. 2001) and set the probability threshold to
70%, following Garrick et al. (2010). PHASE files were constructed and interpreted
using SeqPhase (Flot 2010). We used the program BP&P (Yang and Rannala 2010) to
test possible species limits among 12 geographically isolated populations within C.
fumosa, C. monax, C. montis, C. tansaniana, and C. usambarae. BP&P can be
thought of as testing species limits under the framework of the biological species
concept because regular gene flow between two populations would lead to the
analytical conclusion that they are the same species. Because we formulated our
initial hypotheses based on geography and mitochondrial sequence variation, we used
only nuclear exon sequences (BRCA, GHR, and vWF) to test the extent to which
geographically isolated populations represent independently evolving lineages. BP&P
requires that users define three priors: (mutation-rate-scaled effective population
sizes), (the root divergence time), and a guide tree that the BP&P algorithm
collapses and resolves in proportion to the posterior probability that a node in the
guide tree represents a speciation event. In BP&P, gamma distributions (,) are
used to model priors for and , where the mean = / and variance = /2. We
chose the most appropriate prior by calculating Watterson’s estimator, W, in DnaSP
v5 (Librado and Rozas 2009) from five nuclear loci not otherwise included in the
BP&P analyses (four exons: ApoB, BDNF, PTGER, and RAG1; one intron: MCGF).
These loci were sampled from a subset of 17 individuals included in the BP&P
analyses.
Use of inappropriate priors or an incorrect guide tree in BP&P can bias
posterior probabilities of species delimitation, potentially yielding false positives
(Leaché and Fujita 2010; Yang and Rannala 2010). In order to assess how prior
choice affects our results, we tested six sets of priors previously used by Giarla et al.
(2014) that represent a range of effective population sizes and divergence times
(Table 1). First, we conducted a series of replicated analyses using a guide tree based

Publications and Manuscripts: Crocidura monax
105
on the topology from the CytB phylogeny. For each of the six prior schemes, we
conducted the analysis twice: once each with Yang and Rannala’s (2010) algorithms 0
and 1. Next, to minimize the extent to which use of an incorrect guide tree might
impact results, we conducted a series of BP&P analyses on subsets of the three-exon
dataset. We constructed 66 pair-wise datasets, one for each potential population-pair
of the 12 populations in the guide tree. For each pair-wise dataset, we conducted six
analyses to explore each of the six prior schemes. For all of our BP&P analyses, we
ran the MCMC chain for 550,000 generations, sampling every 5 generations and
discarding the first 50,000 as burn-in.
RESULTS
Analysis of mitochondrial sequences
Our phylogenetic analyses of mitochondrial DNA appeared to converge within
the first 2 × 10⁶ generations and we discarded these as burn-in. Remaining samples
were combined in LogCombiner (part of the BEAST package) from all four runs to
generate the posterior distribution. Effective sample sizes for the posterior were >400
for all parameters. The resulting topology clearly separated populations within the
Crocidura monax species complex from C. dolichura, C. kivuana, C. lanosa, C.
latona, C. littoralis, C. maurisca, C. niobe, C. oritis, C. stenocephala, C. telfordi and
C. turba (Fig. 2). Populations that comprise the C. monax complex form a
mitochondrial clade with C. fumosa, C. montis, C. tansaniana, and C. usambarae.
Within this clade, we found two monophyletic groups. Samples from Meru, (those
currently referred to C. montis), Kilimanjaro, North Pare, South Pare (C. usambarae)
and West and East Usambara (C. tansaniana) are monophyletic (but with little
support) and sister to a topotypical sample of Crocidura montis from Rwenzori.
Ngorongoro, Rubeho, Ukaguru, Uluguru and Udzungwa populations form a clade and
are sister to samples of Crocidura fumosa (but with little support) from Mt. Kenya.
Species delimitation in BP&P
Sequence characteristics for the nuclear loci included in BP&P are reported in
Table 2. Our guide-tree-based and pairwise BP&P results (Figs. 3 and 4, respectively)
largely agree, but the two suites of analyses differ in notable areas. Those that rely on

Publications and Manuscripts: Crocidura monax
106
the guide tree (Fig. 3) support the recognition of 10 distinct groups, with only two
pairs of populations receiving inconsistent or low support for distinctiveness across a
range of prior schemes (West Usambara + East Usambara and Udzungwa + Uluguru).
In the pairwise BP&P analyses (Fig. 4), three of the pairs receive low support across
all prior schemes (Rubeho vs. Uluguru, Rubeho vs. Udzungwa, and Udzungwa vs.
Uluguru), whereas 55 comparisons receive strong support for species distinctiveness
(PP > 0.90) across all prior schemes. Eight pairwise comparisons show inconsistent
results that apparently depend on the prior scheme used (i.e., a mixture of PPs above
and below 0.90).
Our W estimates (derived from an independent sample of five distinct nuclear
loci not included in the BP&P analyses; Table 2) suggest that the prior schemes that
assume large population sizes (Schemes 1–3) are not biologically realistic. Estimates
for W ranged from 0.0034 to 0.0052 (Table 2), values on the same order of
magnitude as the mean of θ for the “small” population size priors (Schemes 4–6; θ
prior with a mean equal to 0.001) and two orders of magnitude smaller than the mean
of the “large” population size gamma distribution (Schemes 1–3; θ prior with a mean
equal to 0.1). If we only consider Schemes 4–6, the South Pare, Meru, and
Ngorongoro populations receive strong support as distinct species across all pairwise
combinations (Fig. 4), and we ultimately assign each of those populations to their own
species (see below). Crocidura fumosa is found to be distinct from all other
populations across biologically realistic prior schemes 4, 5 and 6 in all comparisons
but one. For the pairwise test between C. fumosa and the West Usambara population,
application of Prior Scheme 6 (relatively shallow divergence and small population
sizes) does not support each population as distinct. This result is surprising, because
no previous assessment has suggested that these populations are closely related; we
posit that this result may be an artifact of the small number of individuals we
sequenced for C. fumosa and the West Usambara population (4 and 1, respectively).
Given the morphological distinctiveness of C. fumosa and its divergent position in the
CytB tree (Fig. 2), we do not consider this one BP&P result as compelling evidence
for grouping C. fumosa with West Usambara.
Integrating morphological and molecular results

Publications and Manuscripts: Crocidura monax
107
As we pointed out previously, certain phenotypic characters (e.g., pilosity of
the tail, tail length relative to the length of the head and body, length of hairs in
pelage, and cranial characters) argue against hypotheses of close relationships among
some of the taxa historically associated with C. monax (Tables 3 and 4). For example,
in contrast to the specimens representing the C. monax group of this study, C. fumosa
and C. turba exhibit extreme pilosity over most of the tail and C. dolichura has a tail
that is much longer than the length of the head and body. Crocidura lanosa has a
longer hind foot (mean = 19.3 mm) and much denser, woolier pelage than the C.
monax populations considered here (Dieterlen, 2013). Crocidura latona and C. niobe
are both smaller in cranial measurements than C. monax (Table 4; Bober & Kerbis
Peterhans, 2013; Churchfield et al., 2013). The combination of CI, UTRL and BW
render C. kivuana smaller than any C. monax population considered here (Heim de
Balsac, 1968). Crocidura ultima has a relatively large second upper unicuspid
(Dollman, 1915), which overlaps with the third upper unicuspid (in position along the
antero-posterior axis); these phenotypic characters lead us to exclude C. ultima from
further comparison to C. monax. Crocidura gracilipes Peters was described based on
a specimen taken somewhere between the coast and Mt. Kilimanjaro and is only
known from the type (Zoologisches Museum Berlin 3905; Turni et al., 2007). Based
on the measurements of the upper toothrow (8.7 mm given in the type description),
this is a smaller specimen than any of the forms discussed herein, and we exclude it
from further consideration. The combination of CI, UTRL and BW render C.
maurisca as smaller than any OTU’s except Ngorongoro (Bober and Kerbis
Peterhans, 2013), but our phylogenetic analyses of mitochondrial sequences show it to
be a distant relative to C. monax (Fig. 2). Other East African montane species that fall
within the range of external and cranial measurements of C. monax are C. littoralis
(including oritis) and C. stenocephala, but again our phylogenetic analyses of mtDNA
sequences suggest these are not close relatives of C. monax.
Shrews from Mt. Meru have previously been identified as C. montis (Demeter
& Hutterer, 1986), and exhibit phenotypic characters such as extensive pilosity of the
tail and a cranial profile reminiscent of topotypical C. montis from the Rwenzoris.
However, the samples from Mt. Meru formed a clade of closely related haplotypes
with the Kilimanjaro/North Pare populations (maximum uncorrected mitochondrial p-
distance = 0.025) as mentioned above. To evaluate the inferred mitochondrial
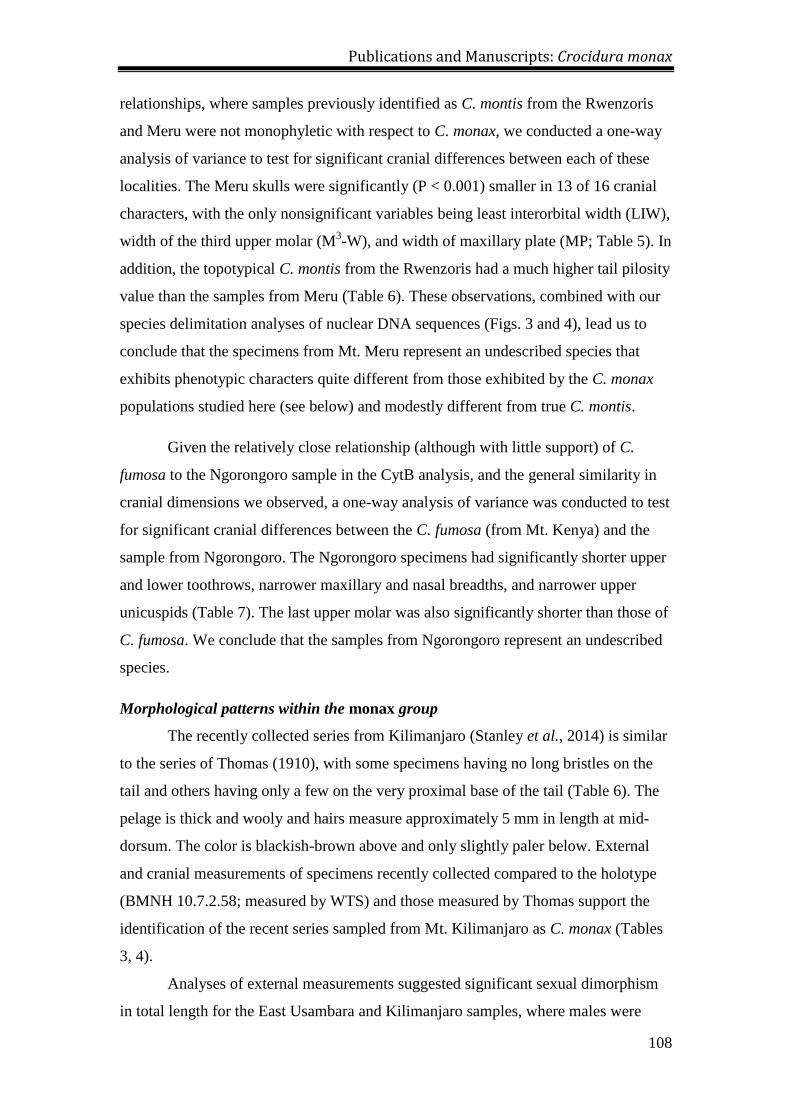
Publications and Manuscripts: Crocidura monax
108
relationships, where samples previously identified as C. montis from the Rwenzoris
and Meru were not monophyletic with respect to C. monax, we conducted a one-way
analysis of variance to test for significant cranial differences between each of these
localities. The Meru skulls were significantly (P < 0.001) smaller in 13 of 16 cranial
characters, with the only nonsignificant variables being least interorbital width (LIW),
width of the third upper molar (M3-W), and width of maxillary plate (MP; Table 5). In
addition, the topotypical C. montis from the Rwenzoris had a much higher tail pilosity
value than the samples from Meru (Table 6). These observations, combined with our
species delimitation analyses of nuclear DNA sequences (Figs. 3 and 4), lead us to
conclude that the specimens from Mt. Meru represent an undescribed species that
exhibits phenotypic characters quite different from those exhibited by the C. monax
populations studied here (see below) and modestly different from true C. montis.
Given the relatively close relationship (although with little support) of C.
fumosa to the Ngorongoro sample in the CytB analysis, and the general similarity in
cranial dimensions we observed, a one-way analysis of variance was conducted to test
for significant cranial differences between the C. fumosa (from Mt. Kenya) and the
sample from Ngorongoro. The Ngorongoro specimens had significantly shorter upper
and lower toothrows, narrower maxillary and nasal breadths, and narrower upper
unicuspids (Table 7). The last upper molar was also significantly shorter than those of
C. fumosa. We conclude that the samples from Ngorongoro represent an undescribed
species.
Morphological patterns within the monax group
The recently collected series from Kilimanjaro (Stanley et al., 2014) is similar
to the series of Thomas (1910), with some specimens having no long bristles on the
tail and others having only a few on the very proximal base of the tail (Table 6). The
pelage is thick and wooly and hairs measure approximately 5 mm in length at mid-
dorsum. The color is blackish-brown above and only slightly paler below. External
and cranial measurements of specimens recently collected compared to the holotype
(BMNH 10.7.2.58; measured by WTS) and those measured by Thomas support the
identification of the recent series sampled from Mt. Kilimanjaro as C. monax (Tables
3, 4).
Analyses of external measurements suggested significant sexual dimorphism
in total length for the East Usambara and Kilimanjaro samples, where males were

Publications and Manuscripts: Crocidura monax
109
longer than females. The male specimens from the East Usambara, Ukaguru and
Uluguru localities had longer tails than females, and the East Usambara and South
Pare males exhibited a longer hindfoot than the females. The East Usambara and
Udzungwa males were heavier than females. However, when we applied a Bonferroni
correction for multiple tests, no populations show statistically significant dimorphism,
with the exception of hindfoot length in the South Pare Mountains. This one
significant result may reflect the small sample size of females (3) from this population
rather than actual dimorphism. For 17 cranial characters measured, there were
significant differences between males and females in six dimensions in the
Kilimanjaro sample, four in the East Usambara sample, two in the Uluguru sample,
and one in the South Pare, West Usambara, and Rubeho samples. These differences
were scattered among the dimensions examined, and Bonferroni corrections relegated
all results as non-significant, with one exception (width of the upper third molar in the
South Pare specimens, which included only three females and six males). We regard
these results as an absence of conclusive evidence for sexual dimorphism, and we
therefore combined sexes in all subsequent analyses.
Of the cranial characters measured, the width of the maxillary plate exhibited
the highest coefficients of variation within each geographic sample (7–11%; Table 4),
so we deleted this character in subsequent analyses of geographic variation. F-values
produced by the one-way ANOVAs to test the null hypothesis of no significant
geographic variation were all highly significant (P < 0.001). The greatest amount of
morphological heterogeneity was exhibited by those characters associated with the
length of the skull, including CI, BL, UTRL, M&I, and LTR. Bimaxillary width was
also notably heterogeneous. In general, cranial dimensions were largest in the East
Usambara sample (14 of the 16 characters) and the Meru sample was the smallest of
the 11 geographic samples measured in 12 of the 16 characters (Table 4).
Based on both the results of the molecular analyses and the general
morphological patterns that emerged from the morphological assessment, including
the phenotypic distinction of the Meru sample, we constrained subsequent analyses of
cranial morphometrics to two distinct assemblages: samples from 1) northern
populations including Kilimanjaro, North Pare, South Pare, East Usambara, and West
Usambara and 2) Ngorongoro, Rubeho, Ukaguru, Uluguru and Udzungwa.
The discriminant function analysis (DFA) constrained to the Ngorongoro,
Rubeho, Ukaguru, Uluguru and Udzungwa populations correctly classified ≥ 80% of

Publications and Manuscripts: Crocidura monax
110
specimens to their respective localities and resulted in the first two components
having eigenvalues that all exceeded 1. The first two factors explained 76.3 and
13.9% of the variation. The Ngorongoro population was strikingly small and distinct.
The remaining mountain localities all overlapped in canonical variate space, with the
Uluguru samples showing the most differentiation along CV2 (Fig. 5).
Three sets of two overlapping populations each are reflected in the DFA of the
Kilimanjaro, North Pare, South Pare, East Usambara, and West Usambara samples,
where ≥ 91% of specimens were correctly classified to mountain. The first two factors
explained 73.2 and 16.7% of the variation. Overlap in canonical variate space is
exhibited between the East and West Usambara samples, Mt. Kilimanjaro and the
North Pare samples, and the South Pare and Magamba samples. The large sizes of
both C. tansaniana in the East Usambaras, first observed by Hutterer (1986), and the
sample from the West Usambaras are reflected in the position of the those two
operational taxonomic units (OTUs) along CV1 and the greater PPL of the
Kilimanjaro and North Pare samples relative to the South Pare and Magamba samples
is reflected by the dispersion of specimen scores along CV2 (Fig. 6).
Based on mitochondrial gene tree relationships, nuclear species delimitation
analyses, and morphological characters, we conclude that C. monax is restricted to
Mt. Kilimanjaro and North Pare Mountains, C. tansaniana is found on both the East
and West Usambaras, and C. usambarae, originally described from the Shume-
Magamba forests in the northwestern segment of the West Usambaras, is also found
in the montane forests of the South Pare Mountains. Populations on Ngorongoro,
Meru, and the middle Eastern Arc Mountains (Rubeho, Ukaguru, Uluguru and
Udzungwa) each represent undescribed species.
DESCRIPTIONS OF EXISTING AND NEW SPECIES
Crocidura monax Thomas, 1910 (Figs 7–9; Tables 3,4,6)
Holotype. – BMNH10.7.2.58, an adult female preserved as a skin and skull (field
number 1161) collected on 11 June 1910.
Paratypes. – Thomas (1910) mentioned seven additional specimens, six of which are
deposited in the British Museum (4 males: BMNH 1910.7.2.54–1910.7.2.57; and 2
females: BMNH 1910.7.2.59–1910.7.2.60). Field number 1164 mentioned by Thomas

Publications and Manuscripts: Crocidura monax
111
(1910) was not located at the BMNH. Additional specimens studied are listed in
Appendix 1.
Type locality. – “Rombo”, 6000 ft., Mt. Kilimanjaro, Tanzania.
Measurements of holotype. – External measurements presented as listed by Thomas
(1910); cranial measurements taken by WTS. See Methods and Materials for
character definitions. HB: 88; TV: 66; HF (without claws): 16.2; E: 10; WT:
unknown; CI: 23.67; BL: 21.30; PPL: 10.51; PGW: 7.05; UTRL: 10.60; LIW: 5.12;
BW: 7.22; NW: 2.24; GW: 10.30; HBC: 6.88; I3-W: 0.88; CW: 0.94; M
3-L: 1.69; M
3-
W: 0.85; MP: 1.13; MI: 15.12; LTR: 9.87.
Diagnosis. – “Size large, colour dark, tail nearly without bristles. Size about as in C.
turba, or rather larger. Fur thick, close and wooly; hairs on back 4.5-5.0 mm in length.
General colour dark slaty, very much as in turba and fumosa, scarcely lighter below.
Ears, hands, feet, and tail uniform dark brown. Tail longer than usual, slender,
practically without longer bristles, a few scattered ones present on the basal third – in
this respect like C. maurisca. Skull rather broader and flatter than in C. turba.”
(Thomas, 1910).
Emended diagnosis and description. – Large shrew with a head and body length of
83–101 mm, tail of 55–71 mm, and mass of 10.0 –17.0 g (Table 3). The ear pinnae are
short but prominent. The longest mystacial vibrissae are 20 mm in length. Typically
there are a few short bristles (4 mm) on the basal 9–32% of the tail (which is 67–70%
of the length of head and body), but occasionally long bristles are completely absent.
The dorsum and venter are both a rich brown color, hairs of the back are 4 mm in
length at mid-dorsum. The hairs of the dorsum are steel gray with brown tips. The tail
is equally brown. Front and hind feet are slightly paler than the body, and covered by
short brown hairs. The hindfoot is rather long and wide; digit 5 is slightly longer than
digit 1. The inner plantar surface is largely glandular, covered by numerous small
wart-like structures (Fig. 7), while the surface behind the thenar and hypothenar pads
is smooth.
The cranium is wedge-shaped, with a narrow rostrum, a short, broad
interorbital region and a wide, somewhat angular braincase (Fig. 8). The dorsal profile
of the skull is curved, with a slightly domed braincase. The maxillary plate is rather
wide and bears a large lachrymal foramen. The lambdoid crest is relatively prominent.
The first upper incisor is of medium size (Figs. 8, 9) and extends beyond the tip of the

Publications and Manuscripts: Crocidura monax
112
short second upper incisor. The upper incisors are wide and have narrow cingula (Fig
9).
Comparisons. – C. monax is larger than C. usambarae, C. mdumai (a new species
described below) and C. newmarki (a new species described below), but smaller than
C. tansaniana and C. munissii (a new species described below) in external
measurements (Table 3). The length of the tail is 67–70% of the head and body
length, as in the other species on neighboring mountains in northern Tanzania. The
proportional length of the tail pilosity (c. 15%) is greater than that in C. usambarae,
C. tansaniana and C. munissii, but shorter than in the remaining species (Table 6).
The CI, UTRL and BW are all absolutely larger than in C. usambarae, C. mdumai and
C. newmarki, but smaller (with some overlap) than C. tansaniana and the southern
Eastern Arc Mountain samples (Table 4). The first upper incisors are almost equal in
length to those of C. usambarae, but the second incisor of C. monax is shorter. The
upper unicuspids and complex cheekteeth are similar to those of C. usambarae, but
wider and more robust than in C. mdumai and C. newmarki.
Distribution. – Known from forest habitats of Mt Kilimanjaro and North Pare. Child
(1965) mentioned a specimen of C. maurisca from Kilimanjaro, which may represent
C. monax, but we were unable to examine this specimen.
Etymology. – Not given by Thomas (1910) but most likely derived from Latin mons
(mountain), monax thus meaning ‘from the mountain’.
Ecological notes. – Crocidura monax was recorded between 2000 to 3000 m on the
Maua route along the southeastern slope of Mt. Kilimanjaro in July and August, 2002,
where it made up 30–40% of the shrews observed at each elevational site (Stanley et
al., 2014). Crocidura monax is syntopic with C. allex, C. hildegardeae, C. olivieri
(Lesson), Myosorex zinki and Sylvisorex granti Thomas. Crocidura monax was not
found in moorland habitats above treeline on Kilimanjaro, and we know of no records
of this species below 2000 m. During a survey along the Maua route of Mt.
Kilimanjaro females and males made up 29 and 71% of the total (76), respectively.
Twelve females were examined for reproductive status, and four (33%) were pregnant
with the largest embryo measuring 20 mm crown to rump. While C. monax is
sympatric with two other soricid genera on Mt. Kilimanjaro, Crocidura is the only
genus of shrew in the North Pare Mountains, and C. monax made up 51% of the
shrews recorded by Stanley et al. (2007), where it was found with C. hildegardeae

Publications and Manuscripts: Crocidura monax
113
and C. olivieri. In the North Pare Mountains, females made up 32% of the total (28).
Only two females were examined for reproductive status, and neither was pregnant.
Crocidura usambarae Dippenaar, 1980 (Figs 7,9,10; Tables 3,4,6)
Holotype. – Transvaal Museum TM 16810. Skin and skull of male in good condition.
Collected 24 May 1965 by C.A. Hubbard (Field no. 2458).
Type locality. – “Shume, 16 m n Lushoto, Tanzania” on original label (Dippenaar
1980: 128), = Tanzania, Tanga Region, Lushoto District, West Usambara Mts,
Magamba, 4.67° S, 38.25° E, 1585 m.
Paratypes. – FMNH 27424–27430 (3 females, 4 males, skins and skulls); WTS
measured the paratypes with complete crania (FMNH 27425, 27429 and 27430); other
paratypes not examined in this study include TM 14986 and 16130. See Appendix 1
for additional specimens examined.
Measurements of holotype. – Measurements are presented as listed by Dippenaar
(1980), who listed only a subset of the measurements used in this study. TL: 143; HB:
80; TV: 63; tail pilosity: 23%; HF: 15; EAR: 8; CI: 22.4; UTRL: 9.9; LIW: 5.1; BW:
6.8; NW: 3.2; GW: 10.4; HBC: 5.6; I3-W: 0.95; CW: 0.93; M
3-L: 1.67; M
3-W: 0.82;
MI: 14.3; LTR: 9.1.
Diagnosis. – (modified from Dippenaar 1980), dark slate grey to dark brownish-grey
above, slightly paler ventrally. Feet brown to dark reddish brown. Tail long, on
average 73% of head and body length, proximal 20–30% covered in long bristle hairs.
Medium sized (CI: mean 22.1, range 21.8–22.4), with wide interorbital region,
moderately robust rostrum, wide braincase, very robust unicuspids and robust M3.
Emended diagnosis and description. – Medium sized shrew with a head and body
length of 75–93 mm, tail of 54–62 mm, and mass of 8.4–10.5 g (Table 3). The ear
pinnae are short but protrude beyond the pelage. The longest mystacial vibrissae are
17 mm in length. There are sparse short bristles (3 mm) on the basal 10–25% of the
tail (which is 70% of the length of head and body); one specimen from South Pare
(FMNH 151138) has fewer than ten bristles at the very base of the tail. The dorsum
and venter are both a rich brown color and the hairs of the back are 4 mm in length at
mid-dorsum. The hairs of the dorsum are steel gray with brown tips. Both the front
and back feet are slightly paler than the body, and cloaked in short hairs, some of
which are brown and others translucent.

Publications and Manuscripts: Crocidura monax
114
The cranium is relatively short and dorso-ventrally compressed. There is a
short broad interorbital region and a stout, globose braincase with angular superior
articular facets (Fig. 10). The maxillary plate is narrow and bears a large lachrymal
foramen. The lambdoidal crest is relatively prominent. The first upper incisor is short
and stout (Fig. 9, 10), barely longer than the second upper incisor. The upper incisors
are wide in occlusal view, with narrow cingula (Fig. 9).
Comparisons.- Crocidura usambarae is larger than C. mdumai and C. newmarki, but
smaller in external measurements than all other Tanzanian members of the C. monax
group (Table 3). As with other northern Tanzanian populations, the length of the tail
is ≤ 75% of the head and body length, compared to ≥ 80% in the southern EAM
populations. The greatest length of the skull, length of the upper toothrow and
maxillary width are all absolutely larger than in C. mdumai and C. newmarki, but
smaller than the southern EAM samples and the East and West Usambaras (Table 4).
The first upper incisors, while stout, barely extend below the occlusal surface of the
second upper incisor, in contrast to those of C. monax, which are larger in general.
There is only slight overlap between C. usambarae and C. monax in both CI and
UTRL (Table 4). The upper unicuspids and complex cheekteeth are narrower and less
robust than those of C. monax.
Crocidura usambarae from South Pare has a narrower third upper incisor
(Table 4), and a more elongate skull generally than C. usambarae from Magamba,
particularly with regard to the region of the skull bearing the upper unicuspids. The
tail of C. usambarae from South Pare also has fewer bristle hairs than the Magamba
population (Table 6).
Distribution. – The typical form of C. usambarae is only known from the type series
from Magamba and Shume collected between 1580 and 1830 m a.s.l. (Dippenaar
1980), and from two additional specimens from Shume/Magamba and Mazumbai
(both in Lushoto District) subsequently reported by Howell & Jenkins (1984). We
also refer the population from the Chome Forest Reserve of the South Pare Mountains
above 1100 m to this species (Stanley et al. 1996).
Etymology. – Name derived from the Usambara Mountains.
Ecological notes. – This species was the most common shrew observed in the Chome
Forest Reserve, South Pare Mountains in montane forests (sensu Lovett & Pocs,
1993) at 2000 m (Stanley et al., 1996), where it made up 70% of the shrews captured.
The only other shrew recorded at this elevation was C. hildegardeae. At lower (and

Publications and Manuscripts: Crocidura monax
115
drier) habitats (1100 m), C. usambarae was much less common and made up only 8%
of the shrew species recorded, which included C. hildegardeae, C. hirta and C.
olivieri. One female found dead at 1100 m had five embryos, the largest of which has
a crown-rump length of 6 mm (Stanley et al., 1996).
Crocidura tansaniana Hutterer, 1986 (Figs 7,9,11; Tables 3,4,6)
Holotype. – Zoologisches Forschungsmuseum Alexander Koenig, ZFMK 85.194,
adult male, skin and skull, collected by S.R. Telford on 17 June 1984: field number
SRT-TZ-12078. Skin and skull in good condition.
Type locality. – Tanzania, Tanga Region, East Usambara Mts., Amani (05.06S,
38.38E).
Measurements of holotype. – Measurements are listed as presented by Hutterer
(1986), who listed only a subset of the measurements used in this study. TL: 174; HB:
109; TV: 65; tail pilosity: 35%; HF: 17; EAR: 13; WT: 15 g; CI: 25.5; UTRL: 11.3;
LIW: 5.5; BW: 8.1; GW: 11.1; HBC: 6.4; M3-L: 1.80; M
3-W: 0.96; LTR: 10.2.
Diagnosis. – “Large species of the Crocidura monax group, comparable to C. monax
Thomas, 1910 and C. littoralis Heller, 1910, however skull considerably larger and
more robust; teeth more robust, particularly the upper M3.” (Hutterer, 1986).
Emended diagnosis and description. – Large sized shrew with a head and body
length of 82–108 mm, tail of 60–76 mm, and mass of 11–20 g (Table 3). Ear pinnae
short but prominent. The longest mystacial vibrissae are 20 mm in length. The tail is
equipped with numerous long bristles (6 mm) along the basal 24–48% of its length.
The tail length is 70–71% of the length of head and body. Dorsal and ventral pelage is
rich brown; hairs of the back are 6 mm in length at mid-dorsum. The hairs of the
dorsum are brownish-gray with reddish-brown tips. The tail is equally brown. Front
and hind feet are only slightly paler on the dorsal surface than the color of the body,
and covered by short brown hairs.
The cranium is long and stout, with a wide maxillary, a broad interorbital and
a wide, angular braincase (Fig. 11). The dorsal profile of the skull is rather flat with
only a slight angle between braincase and rostrum. The maxillary plate is massive and
bears a lachrymal foramen near the anterior rim. The lambdoidal crest is well
developed. The first upper incisor forms a long hook (Figs. 9, 11) and extends far
lower than the tip of the second upper incisor, and even the tip of P4. The upper
unicuspids are wide and have broad cingula (Fig. 9).

Publications and Manuscripts: Crocidura monax
116
Comparisons. – C. tansaniana is larger than all other Tanzanian species, except for C.
munissii, in external measurements (Table 3). Relative length of the tail (70–71%) is
similar to the other species, except for C. munissii, which has a tail that is above 85%
the length of the head and body (Table 6). The pilosity of the tail (30–35%) is greater
than in all other species, except for C. mdumai (43%) and C. newmarki (67%; Table
6). The large values for greatest length of the skull, length of the upper toothrow and
maxillary width are only met by C. munissii (Table 4), which differs by its longer tail
and lesser pilosity. The large first upper incisors are similar only to those of C.
munissii; all other species have smaller incisors. Wide upper unicuspids and
cheekteeth are also shared with C. munissii. Crocidura tansaniana has the longest M3
of all species examined (Table 4).
Distribution. – East and West Usambara Mountains. In the West Usambara
Mountains, known only from the Ambangulu Forest above 1100 m in elevation.
Although not yet recorded, we suspect that it occurs in other forested habitats of the
West Usambara Mountains.
Etymology. – Named for the country of Tanzania.
Ecological notes. – Other shrews recorded in sympatry with C. tansaniana include C.
elgonius Osgood, C. fuscomurina, C. hildegardeae, C. hirta, C. olivieri, Suncus
megalura, and Sylvisorex howelli. Although both C. tansaniana and C. usambarae
have been recorded from the West Usambara Mountains, there are no records of the
two species occurring in sympatry. Stanley et al. (2013) documented the distribution
of C. tansaniana in forest fragments in the East and West Usambaras (reported as C.
monax in the West) where this shrew was found predominantly in the largest
fragments of (> 500 ha) relatively undisturbed montane forest, and only 3 individuals
(4% of total captures) were observed in fragments of disturbed forest that were
smaller than 40 ha.
Crocidura newmarki sp. nov. (Figs 7,9,12; Tables 3,4,6)
Holotype.- FMNH 208439, an adult male, with slightly worn molars (age class II; see
methods and materials), prepared as a round skin, skull, skeleton, and frozen tissue
(liver); collected by M. J. Munissi (original field number WTS 9955) on 9 August
2009. The condition of the skin, skull and skeleton are good.
Paratypes. – We designate as paratypes five females and four males: FMNH 208440,
collected at the type locality (see below) at 3600 m elevation; FMNH 208444 and

Publications and Manuscripts: Crocidura monax
117
208447 collected at Mt Meru, Arusha National Park, Meru Crater, 3.24200° S,
36.78736° E, 2652 m. FMNH 208435 and 208436 collected at Mt Meru, Arusha
National Park, Mgongo wa Tembo, 3.22350° S, 36.78675° E, 3000 m. FMNH 208415
and 208416 collected at Mt Meru, Arusha National Park, 3.24725° S, 36.80066° E,
2300 m. FMNH 208406 and 208411 collected at Mt Meru, Arusha National Park, Fig
Tree Arch, 3.24406° S, 36.82845° E, 1950 m. All type materials are preserved as
skins, skulls and either fluid preserved post-cranial bodies, or cleaned post-cranial
skeletons.
Type locality. – Tanzania, Arusha Region, Arumeru District, Mt Meru, Arusha
National Park, near Saddle Hut, 3.21609° S, 36.76897° E, 3600 m.
Measurements of holotype. – Measurements were all recorded by WTS and are in
millimeters and weight in grams: TL: 131; HB: 81; TV: 50; tail pilosity: 67%; HF: 16;
EAR: 9; WT: 8.5 g; CI: 20.59; BL: 18.44; PPL: 9.20; PGW: 6.53; UTRL: 8.98; LIW:
4.95; BW: 6.34; NW: 1.79; GW: 9.67; HBC: 6.63; I3-W: 0.68; CW: 0.68; M
3-L: 1.53;
M3-W: 0.79; MP: 0.92; MI: 13.06; LTR: 8.34.
Diagnosis. – Crocidura newmarki is a medium-sized, dark shrew similar to
Crocidura montis Thomas, 1906 from Rwenzori Mountains, but with a less hairy tail
(pilosity 67% versus 81% in C. montis; Table 6); head and body length 65–85 mm,
tail 45–60 mm, and mass 6 –11 g (Table 3). It is smaller than any of the other shrews
allied to C. monax in Tanzania, except C. mdumai. The proximal two-thirds of the tail
bears numerous long, translucent bristles (up to 7 mm in length); the rest of the tail is
covered in short, dark brown applied hairs. The pelage is dark brown on the dorsum
and is only slightly more grayish brown on the venter; hairs of the back are 6–7 mm
in length at mid-dorsum. The dorsal surfaces of both the front and back feet are
slightly paler than the rest of the body. The longest vibrissae emanating from the
snout are 15 mm in length.
The skull of C. newmarki is small and wedge-shaped with a rounded
braincase, smaller than any of the other OTUs considered in this study, except for C.
mdumai, which is even smaller (Fig. 12; Table 4). The lateral profile of the skull is
straight and slightly rounded towards the braincase. The first upper incisor is short
and slender (Figs. 9, 12), barely reaching as low as the tip in I2. The upper unicuspids
are narrow, with small cingula (Fig. 9).
Description and comparisons. – Crocidura newmarki is a medium sized shrew with
long wooly fur. The head and body length range is 65–85 mm, tail length, 45–60 mm,

Publications and Manuscripts: Crocidura monax
118
the length of the hindfoot 13–16 mm, and mass 6 –11 g. Fifty eight to ninety five
percent (mean 67.2%) of the tail is covered by long bristle hairs. However, bristles are
scattered and less numerous than in C. montis (Table 6). Vibrissae extend up to 15
mm in length. The ear conch is stout. The hairs of the dorsal and ventral pelage,
which are 6–7 mm long, are grey but the tips are a rich brown. The dorsal aspects of
the feet are paler than the body and there are nearly translucent hairs sparsely
distributed along the length of each foot. The hindfoot is smaller and narrower than in
C. monax; digit 5 is only slightly longer than digit 1. The inner plantar surface is
covered by numerous small tubercles (Fig. 7), as in C. monax.
The skull of C. newmarki is small (Table 4) and wedge-shaped with a rounded
braincase and a moderate lambdoidal crest. It is smaller than any of the other OTUs
considered in this study, except for C. mdumai. It is also considerably smaller than
true C. montis from Rwenzori Mountains (Table 5). The lateral profile of the skull is
straight and slightly rounded towards the braincase. The first upper incisor is short
and slender, barely reaching as low as the tip in I2. The upper unicuspids are narrow
and have small cingula. The last upper molar (M3) is robust, but smaller than in C.
montis (Table 5).
Distribution.- Known only from Mt. Meru, Tanzania (Demeter & Hutterer, 1986,
Dippenaar & Meester, 1989), at elevations between 1800 and 3600 m. Dippenaar &
Meester (1989) and Hutterer and Dieterlen (1981) listed specimens from Kilimanjaro
(West) and various places in Kenya and Sudan as C. montis, but these have to be
restudied. The distribution maps of C. montis in Dippenaar & Meester (1989) and
Hutterer (2013) apparently include more than one species.
Etymology.-The species is named in honour of Dr. William D. Newmark in
recognition of his tireless conservation efforts and long term study of the Tanzanian
biota, with an emphasis on the East and West Usambara Mountains. We suggest the
common name Newmark’s Shrew.
Ecological notes. – Crocidura newmarki is syntopic with C. allex and C.
hildegardeae in the montane habitats of the eastern slopes of Mt. Meru. Interestingly,
the soricid species diversity appears to be much lower on Mt. Meru than similar
habitats in neighboring Mt. Kilimanjaro (Stanley, unpubl. data), where at least five
different species, and three different genera occur (see C. monax account). In a faunal
survey in 2009 (Stanley, unpubl. data), Crocidura newmarki was found between 1950
to 3600 m in habitats ranging from submontane forest to ericaceous zone above

Publications and Manuscripts: Crocidura monax
119
treeline. Females made up 38% of the total number of C. newmarki sampled in 2009
along the southeastern slope of Mt. Meru.
Crocidura mdumai sp. nov. (Figs 7,9,13; Tables 3,4,6)
Holotype. – FMNH 211323, an adult male with slightly worn molars (age class II; see
methods and materials), prepared as a round skin, skull and body embalmed in
formalin and now in 70% ethanol, and frozen tissue (liver); collected by M. J. Munissi
(original field number WTS 10842). The condition of the skin, skull and preserved
post-cranial body are good.
Paratypes. – We designate as paratypes three females and four males, FMNH 211131,
211132, 211134, 211322, 211327, 211328, and 211332, all collected at two localities
on the Ngorongoro Crater rim in 2010 (see Type locality). All paratypes are preserved
as skins, skulls and fluid-preserved post-cranial bodies, with the exception of FMNH
211134, which is preserved as a skin, skull and post-cranial skeleton. See Appendix 1
for additional specimens examined.
Type locality. – Tanzania, Arusha Region, Ngorongoro District, Ngorongoro
Conservation Area, Ngorongoro Crater rim, near Pongo Ranger Post, 3.24407° S,
35.64040° E, 2064 m asl. Paratypes were collected at this locality (FMNH 211322,
211327, 211328, 211332) and: Tanzania, Arusha Region, Ngorongoro District,
Ngorongoro Conservation Area, Ngorongoro Crater rim, near Lamala Gate, 3.14255°
S, 35.68669° E, 2372 m asl (FMNH 211131, 211132, 211134).
Measurements of holotype. –TL: 140; HB: 81; TL: 59; tail pilosity: 29%; HF: 15;
EAR: 11; WT: 8.3 g; CI: 21.64; BL: 19.27; PPL: 9.98; PGW: 6.53; UTRL: 9.04;
LIW: 4.60; BW: 6.25; NW: 2.00; GW: 9.75; HBC: 6.46; I3-W: 0.70; CW: 0.76; M
3-L:
1.39; M3-W: 0.67; MP: 0.94; MI: 13.26; LTR: 8.42.
Diagnosis. – Crocidura mdumai is a medium-sized, but robust shrew with a head and
body length of 76–91 mm, tail of 52–65 mm, and mass of 7.3–9.6 g (Table 3). It is
smaller than any of the other species of this study, except for C. newmarki. It is the
smallest of any of the specimens with low levels of pilosity on the tail (Table 6).
There is low pilosity on the proximal 43% of the tail (which is 70% of the length of
head and body and slightly bicolored). The long bristles (4 mm) at the base of the tail
are translucent; the rest of the tail is covered in short, dark brown applied hairs. The
dark brown pelage of the dorsum contrasts slightly with the dark gray of the venter.

Publications and Manuscripts: Crocidura monax
120
The hairs of the back are 5 mm in length. The dorsal surfaces of both the front and
back feet are paler than the rest of the body. The longest vibrissae emanating from the
snout are 19 mm in length.
The skull is smaller and rounder with less angular anterior corners of the
braincase than in those of any of the other species considered in this study (Fig. 13;
Table 4). The lateral profile of the skull exhibits a depression between the braincase
and the rostrum, which has a slightly rounded lateral profile. The first upper incisor is
short and slender (Figs. 9, 13), and the upper canine is longer and broader than the
third upper incisor.
Description and comparisons. – Crocidura mdumai is a medium sized, but robust
shrew with the pilosity of the tail restricted to the proximal third, and the slightly
bicolored (dorso-ventrally) tail is roughly 70% the length of the head and body (Table
3, 6). Mystacial vibrissae range from 15 to 19 mm long (mean = 17.3 mm, n = 10).
The ear conch is stout. The proximal 3/4 of the hairs of the dorsal pelage, which are
4–5 mm long, is grey but the tips are a rich brown. The hairs of the ventral pelage are
the same length, but the color is a more uniform grey-brown from base to tip. The
claws on the back feet are slightly longer than those of the front. The dorsal aspects of
the feet are lighter in color than the body and there are almost translucent hairs
sparsely distributed along the length of each foot. The hindfoot is small and narrow
and similar to that of C. newmarki.
The cranium is medium-sized (Table 4), with a moderate lambdoidal crest.
The lateral profile of the cranium reveals a depression between the rostrum and
braincase (Fig. 13). The first upper incisors are short and slender, exceeding the
length of the second upper incisor, which is large. The canine is larger than the third
upper incisor and rectangular in shape (Fig. 13), and the last upper molar is robust.
Among the OTUs defined for this study, C. mdumai is the smallest in external
dimensions (Table 3). While there is some overlap in various measures of the cranium
between C. mdumai and C. usambarae, the UTRL, LIW, and BW for C. mdumai all
exhibit a range below that of C. usambarae, including specimens from South Pare
(Table 4). The upper unicuspids and complex cheekteeth are also more slender and
less robust (Fig. 13). The phylogenetically closer (according to our mitochondrial
gene tree) Crocidura fumosa Thomas, 1904 from Mt. Kenya has greater tail pilosity
(c. 80%) and is larger in skull measurements; in 7 out of 17 cranial measurements the

Publications and Manuscripts: Crocidura monax
121
new species significantly differs from C. fumosa, which also has a much narrower
infraorbital bridge than the new species (Tables 7).
Distribution. – Crocidura mdumai is known only from the forests of Ngorongoro
Crater above 2000 m.
Etymology. – The species is named in honour of Dr. Simon Mduma in recognition of
his contributions to conservation efforts and long-term study of the biota of the
Serengeti ecosystem. We suggest the common name Mduma’s Shrew.
Ecological notes. – Other soricid species in the Ngorongoro crater forest are
Crocidura allex, C. hildegardeae and Suncus megalura [Jentink] (Howell & Jenkins,
1984; W. T. Stanley, unpubl. data). Habitat includes montane forest on the rim of the
Ngorongoro caldera (2370 m), and slightly drier forests at 2000 m on the southeastern
slope. Females made up 37% of the total C. mdumai observed in 2010 during a faunal
survey of the montane forests of Ngorongoro (n = 16).
Crocidura munissii sp. nov. (Figs 7,9,14; Tables 3,4,6)
Holotype. – FMNH 158290, an adult male with slightly worn molars (age class II; see
methods and materials), prepared as a round skin, skull and skeleton, and frozen tissue
(liver, heart, and kidney) collected by W. T. Stanley (original field number WTS
2651) on 11 August 1996. The condition of the skin, skull and post-cranial skeleton
are good.
Paratypes. – We designate nine specimens from Tanzania as paratypes: Morogoro
Region, Morogoro District, Uluguru Mts, Uluguru North Forest Reserve, 3 km W, 1.3
km N Tegetero, 6.9292° S, 37.7056° E, 1345 m (FMNH 158280-158281, 158283);
Uluguru Mts, Uluguru North Forest Reserve, 5.1 km W, 2.3 km N Tegetero, 6.92° S,
37.6833° E, 1535 m (FMNH 158287-158289); Uluguru Mts, Uluguru North Forest
Reserve, 6 km W, 3 km N Tegetero, 6.9167° S, 37.675° E, 1850 m (FMNH 158410-
158412). See Appendix 1 for additional specimens examined.
Type locality. – Tanzania, Morogoro Region, Morogoro District, Uluguru Mts.,
Uluguru North Forest Reserve, 5.1 km W, 2.3 km N Tegetero, 6.92° S, 37.6833° E,
1535 m.
Measurements of holotype. – TL: 166; HB: 86; TV: 80; tail pilosity: 11%; HF: 17;
EAR: 10; WT: 11.5 g; CI: 24.69; BL: 22.37; PPL: 10.91; PGW: 7.24; UTRL: 10.91;

Publications and Manuscripts: Crocidura monax
122
LIW: 5.14; BW: 7.21; NW: 2.19; GW: 10.25; HBC: 6.88; I3-W: 0.88; CW: 0.98; M
3-
L: 1.58; M3-W: 0.83; MP: 1.15; MI: 15.62; LTR: 10.06.
Diagnosis. – Large Crocidura with a long tail (91% of HB in the Uluguru population)
covered by only a few bristle hairs over 8–15% of its basal length (Table 6); hindfoot
long and narrow (17–19 mm), distance between thenar and interdigital pad 1
relatively larger (Fig 7) than in C. monax, C. usambarae and C. tansaniana; skull
large (CI 22.7–25.8), braincase long with pronounced anterior facets; first upper
incisor long and hook-like.
Description. – Large shrews with a head and body length of 75–106 mm, a long tail
of 66–95 mm, and mass of 9.5–19.5 g (Table 3). Ear pinnae are short, as in other
species of this study. The longest mystacial vibrissae are about 24 mm in length.
There are very few short bristles (3 mm) on the basal 8–15% of the tail (which is 85–
93% of the length of head and body; Table 6). Dorsal and ventral pelage is rich brown
in color and hairs of the back are 6–7 mm in length. The hairs of the dorsum are steel
gray with brown tips (with the exception of FMNH 166739 from Ukaguru which
represents a light gray color variant). The tail is equally brown. Front and hind feet
are slightly paler, and covered by short brown to whitish hairs. The hindfoot of C.
munissii differs from all other taxa treated here by its slenderness; it is rather long but
narrow; digit 5 is longer than digit 1. The medial plantar surface is only glandular in
its anterior part; there is more space between the thenar and the interdigital pad 1, and
the interdigital pads 1–4 are situated more closely together than in C. monax and the
other species (Fig. 7).
The cranium is long (CI 22.70–25.76) as in C. tansaniana, but slightly smaller
and narrower, with a narrow maxillary, a short broad interorbital region and a
squarish braincase with prominent superior articular facets (Fig. 14). The dorsal
profile of the skull is flat from the rostrum to the interorbital region, but slightly
domed over the braincase. The maxillary plate is large and bears a large foramen at its
anterior rim. The lambdoidal crest is well developed. The first upper incisor is a long
hook (Figs. 9, 14) and extends beyond the tip of the second upper incisor and the
fourth upper premolar. The upper unicuspids are wide, with broad cingula (Fig. 14).
Comparisons. – C. munissii is best distinguished from all other Tanzanian species of
the C. monax group by its relatively long tail (84–94% of HB), in combination with a
low pilosity (means of 7–15% in all four populations; Table 6). The few scattered
bristles are short. In overall size C. munissii equals C. tansaniana; both species are

Publications and Manuscripts: Crocidura monax
123
larger than all other taxa of this study (Table 1). The hindfoot measurements of all
four populations average larger than all other species, but there is overlap with C.
monax and C. tansaniana (Table 3). The hindfoot of C. munissii differs by the close
arrangement of the plantar pads (Fig. 7).
In skull size, C. munissii resembles C. tansaniana, although East Usambara
populations of the latter species tend to be larger (Table 4). The length of the third
upper molar is also larger in C. tansaniana. The first upper incisors are very long in
all four populations of C. munissii, but are similar to those of C. tansaniana. The
upper unicuspids are wide with broad cingula.
Distribution. – The species occurs on four southern mountains of the Eastern Arc:
Rubeho, Udzungwa, Ukaguru, and Uluguru Mountains.
Etymology. – The species is named in honour of Maiko J. Munissi in recognition of
his contribution to our understanding of the natural history of montane mammals in
Tanzania. This study, and many others, could not have happened without Munissi’s
tireless efforts during faunal inventories of each of the mountains covered here. We
suggest the common name Munissi’s Shrew.
Ecological notes. – Crocidura munissii is found in submontane and montane habitats
(sensu Lovett & Pocs, 1993) of the Rubeho, Udzungwa, Ukaguru and Uluguru
Mountains. Syntopic soricids include Crocidura hildegardeae, C. desperata, C.
elgonius, C. olivieri, C. telfordi, Myosorex geata and M. kihaulei, Suncus lixus, S.
megalura and Sylvisorex howelli. Stanley & Hutterer (2007) documented C. munissii
(reported as C. monax) in habitats above 1450 m in the Udzungwa Scarp forests, but
not below in drier forests.
DISCUSSION
Although the larger and more visible biota of Tanzania has been the focus of
taxonomic study for over a century, the smaller mammals remain poorly known. This
is particularly true of the montane faunas spread across the country in the Northern
and Southern Highlands and the Eastern Arc Mountains. However, recent studies
have begun to shed light on the taxonomy and biogeography of various montane
vertebrate groups, including frogs (Lawson, 2010; Loader et al. 2010), snakes
(Gravlund, 2002; Menegon, Davenport & Howell, 2011), and birds (Dinesen et al.,
1994; Bowie et al., 2004). Among mammals, diversity has been investigated within

Publications and Manuscripts: Crocidura monax
124
various groups of rodents, including Hylomyscus (Carleton & Stanley, 2005) and
Praomys (Carleton & Stanley 2012; Bryja et al., 2014). The shrews of Tanzanian
mountains, including Sylvisorex howelli (Stanley & Olson, 2005) and various species
in the genus Myosorex (Stanley & Esselstyn 2010), also have received some attention.
The genus Crocidura is far more species-rich, but nevertheless has received relatively
scant attention, with most studies relying exclusively on morphological variation (e.g.,
Hutterer, 1986). Here we used initial inferences of mitochondrial gene tree
relationships to formulate plausible taxonomic hypotheses, which we subsequently
tested with multi- and uni-variate analyses of continuous morphological characters,
qualitative examination of discrete morphological characters, and coalescent-based
species validation approaches. Remarkably, the results we obtained from these
approaches were largely congruent and we recognized species where a majority of our
approaches suggested the same conclusion.
In our species validation analyses, we were concerned that an incorrect guide
tree would bias our results (Leaché and Fujita, 2010) and conclusions. We therefore
completed 66 pairwise analyses in an attempt to eliminate the potential for guide-tree
misspecification bias. Presumably, these pairwise analyses are biased toward
recognizing distinct species when we compare non-sister populations, but they should
be unbiased when comparing sister populations. Although we cannot be certain of
which populations are necessarily sister to one another, several pairwise comparisons
showed little or inconsistent support for recognizing two species (Fig. 4). Consistent
support or rejection across all prior schemes implies that a strong signal underlies the
data and prior assumptions are not affecting species delimitation conclusions. In
situations where the support for species recognition was inconsistent across different
prior assumptions, justification for choosing the results based on one set of priors over
another must be based on some external source of information (Yang and Rannala,
2010). In this case, we used �W estimates from unlinked loci not included in species
validation approaches, and these suggest that our prior schemes 1–3, which assumed
large � values, were not realistic. Nevertheless, many of the pairwise comparisons
yielded consistent results across all prior schemes, with most analyses giving a
posterior probability of 1.0 that the two populations represent different species.
Results varied in the comparisons between populations we treat as conspecific within
C. munissii, C. monax, and C. tansaniana, as well as the comparison between C.
fumosa and the West Usambara population of C. tansaniana. With the exception of

Publications and Manuscripts: Crocidura monax
125
this latter comparison, these results were consistent with patterns of overlap in
multivariate morphometric space (Figs. 5, 6), where we observed broad overlap
between the four populations of C. munissii, and modest overlap between the
populations of C. monax and C. tansaniana.
As a whole, our pairwise comparisons offer a conservative approach to testing
species limits with BP&P. The guide-tree-based results could be interpreted to support
the recognition of nearly all of the sky island populations as distinct species, but this
was inconsistent with our pairwise comparisons and morphometric variation, which
suggests that the guide tree approach may be artificially inflating posterior
probabilities by placing distantly related populations close together in the guide tree.
Other authors have discussed this bias (Yang and Rannala, 2010; Leaché and Fijita,
2010), but our study is the first we are aware of to introduce a systematic means by
which to eliminate it.
This study reveals three new species within Crocidura that are endemic to
Tanzanian mountains. Two of the taxa named here are restricted to individual
mountains (C. mdumai on Ngorongoro and C. newmarki on Mt. Meru), similar to
Myozorex zinki and Congosorex phillipsorum, which are restricted to Mt. Kilimanjaro
and the Udzungwa Mountains, respectively. Three taxa included in this study are
found on only two mountains (C. monax on Kilimanjaro and North Pare; C.
usambarae on South Pare and West Usambara; and C. tansaniana on West and East
Usambara). Each of these pairs shows modest morphological differentiation between
mountain localities. For example, the specimens of C. monax from Kilimanjaro are
generally larger than those from North Pare, C. tansaniana is bigger on the East
Usambaras than in the West Usambaras, and C. usambarae from South Pares are
subtly larger in some cranial dimensions than the paratypes from the West Usambara
Mountains (Table 4). However, neither molecular nor morphological analyses show
clear distinction between members of these populations (Fig. 6) and we therefore treat
each pair as a single species. Crocidura munissii is found on four mountains within
the Eastern Arc, and also shows modest differentiation among the isolated
populations. For example, the population from the Udzungwa Mountains is generally
smaller than the other three (Fig. 5; Table 4), but again, the overlap among all four
populations is too great to distinguish among them at a species level (Fig. 5).
The geographic distribution of C. monax s.s. is interesting as it spans two
geologically distinct mountain groups—the Northern Highlands and the Eastern Arc

Publications and Manuscripts: Crocidura monax
126
Mountains (Griffiths, 1993). Carleton and Stanley (2005) and Bryja et al. (2014)
grouped samples of Praomys from Kilimanjaro and the northern Eastern Arc
Mountains, such as the Usambaras and South Pare, using both morphologic and
molecular analyses. In contrast, Hylomyscus arcimontensis is distributed throughout
the Southern Highlands and the Eastern Arc all the way up to the North Pares, but it
has never been found in the Northern Highlands. The distributional difference
between Hylomyscus on one hand and C. monax and Praomys on the other is striking
and suggests that ancient geological events have not had a fixed effect on diversity
patterns in various groups of organisms.
The West Usambara range has two species of closely related shrew living
within its montane habitats: Crocidura usambarae, originally described from
specimens collected in the Shume-Magamba forests in the north-western corner of the
West Usambara and subsequently recorded in Mazumbai near Lushoto, and
Crocidura tansaniana, known from the Ambangulu forest at the south-eastern corner
of the range facing the East Usambara across the Lwengera Valley. Determining the
entire distribution of these two species across the West Usambara is important, as it is
currently unknown whether these two species occur in sympatry, or, if not, where the
boundary between the two species is situated.
Stanley et al. (1998) stated that C. monax occurs on the Nguru and Nguu
Mountains in the middle of the Eastern Arc archipelago, but these specimens were not
closely related to C. monax in preliminary analyses of mitochondrial diversity
(Esselstyn, Hutterer, and Stanley, unpubl. data). Rather, they have historically been
identified as C. luna (Dippenaar & Meester, 1989). Further study is needed to confirm
this identification and the biogeography of the shrews in these mountains.
Crocidura monax was included in the “dolichura group” by Dollman (1916),
in the “naked-tailed” group by Heim de Balsac (1968), and in the “monax-dolichura”
complex by Dippenaar (1980), together with several other taxa, because of the
relatively low pilosity on the tail. Whether or not this phenotypic character state
provides phylogenetic signal has not been critically analyzed, but our results suggest
it is highly plastic within Crocidura. Closely related species often differ in the
relative amounts of bristles on the tail. For example C. newmarki, C. monax, C.
usambarae and C. tansaniana especially, but also C. mdumai and C. munissii differ
widely in the extent of tail bristles, but are phylogenetically closely related.
Determination of the function (if any) of these bristles may help explain how this
Publications and Manuscripts: Crocidura monax
127
variation arises. Possible adaptive functions for these bristles include that they provide
tactile sensory instruments or disseminate scent from glands near the anus.
In combination, these new species limits reveal a finer geographic scale of
endemism than has been previously considered for many Tanzanian mammals. While
rodents such as Otomys and Lophuromys have been recently shown to contain
microendemics (Verheyen et al., 2002; Taylor et al. 2009, 2011), the restricted
distribution of many of these shrew taxa contrast with murine rodent taxa that share
the same habitats. The montane murine rodents of Tanzania that have been critically
examined morphologically exhibit distributional patterns spanning several massifs
throughout the country. For example Hylomyscus arcimontensis ranges from the
North Pare Mountains to the Southern Highlands (Carleton & Stanley, 2005).
Praomys taitae is distributed from the Taita Hills of Kenya, across the northern
Highlands, south to the Udzungwa Mountains (Carleton & Stanley, 2012); Bryja et al.
(2014) published molecular evidence showing only modest divergence in
mitochondrial DNA sequences between the middle-southern Eastern Arc and the
Northern Highlands-Northern Eastern Arc populations.
Why shrews exhibit greater species diversity and more restricted ranges than
murine rodents has yet to be addressed adequately. Future studies, including
systematic analysis of other soricid taxa and comparisons to paleobotanical datasets,
should significantly augment efforts to understand the biogeographic history of these
unique montane archipelagos.
Acknowledgements
The authors thank Maiko Munisi and Philip Kihaule for valuable help in the
field and J. C. Kerbis Peterhans for collecting many of the samples we used as
outgroups. S. M. Goodman, K. M. Howell, W. D. Newmark, D. C. Moyer, and C. A.
Msuya all supplied logistical support and advice. Permission to conduct research in
Tanzania was granted by the Tanzanian Commission of Science and Technology, the
Division of Wildlife and TAWIRI. Funding for fieldwork and DNA sequencing was
provided by the National Geographic Society (Grants 5053-93, 5244-94 and 5711-
96), the Barbara Brown, Ellen Thorne Smith and Marshall Field Funds of the Field
Museum of Natural History, and the National Science Foundation (DEB-1145251,

Publications and Manuscripts: Crocidura monax
128
DEB-1343517). A portion of the laboratory work was performed in the Field
Museum’s Pritzker Laboratory for Molecular Systematics and Evolution, operated
with support from the Pritzker Foundation. Ara Monadjem advised on the type of
Crocidura usambarae and T. Kearney provided access. Rebecca Banasiak helped
with photography and figures. Paula Jenkins, Louise Tomsett, and Roberto Portela
Miguez provided access in London at the Natural History Museum (BMNH) as did
Wim Wendelen and the late Walter Verheyen in Tervuren (RMCA), Hans Baagoe in
Copenhagen (ZMUC), and Renate Angermann in Berlin (ZMB).

Publications and Manuscripts: Crocidura monax
129
Bober SO, Kerbis-Peterhans JC. 2013. Crocidura niobe Niobe’s Shrew ; pp 116-
117 in Happold, M. & Happold, D.C.D. (eds) 2013. Mammals of Africa:
Volume IV. Bloomsbury Publishing, London.
Bouckaert, R, Heled, J, Kühnert, D, Vaughan, TG, Wu, C-H, Xie, D, Suchard,
MA, Rambaut, A, Drummond, A. 2014. A software platform for Bayesian
evolutionary analysis. PLoS Computational Biology 10:e1003537.
Bowie RCK, Fjeldså J, Hackett SJ, Crowe TM. 2004. Systematics and
biogeography of the double–collared sunbirds of the Eastern Arc Mountains,
Tanzania. Auk 121: 660–681.
Brown, JC, Yalden, DW. 1973. The description of mammals-2 Limbs and
locomotion of terrestrial mammals. Mammal Review 3: 107-134.
Bryja, J, Mikula, O, Patzenhauerová, H, Oguge, NO, Šumbera, R, Verheyen, E.
2014. The role of dispersal and vicariance in the Pleistocene history of an East
African mountain rodent, Praomys delectorum. Journal of Biogeography 41:
196-208.
Burgess ND, Kock D, Cockle A, FitzGibbon C, Jenkins P, Honess P. 2000.
Mammals. Pp. 173-190 and 401-406, in Coastal forests of eastern Africa. (N.
D. Burgess and G. P. Clarke, eds.). I.U.C.N., Gland and Cambridge, 443 pp.
Carleton MD, Goodman SM. 1998. New taxa of nesomyine rodents (Muroidea:
Muridae) from Madagascar's northern highlands, with taxonomic comments
on previously described forms, pp. 163-200 (M. D. Carleton & SMG) in in "A
floral and faunal inventory of the Réserve Spéciale d'Anjanaharibe-Sud,
Madagascar, with reference to elevational variation. Fieldiana: Zoology, new
series, no. 90: 1-246.
Carleton, MD, Stanley, WT. 2005. Review of the Hylomyscus denniae complex
(Rodentia: Muridae) in Tanzania, with description of a new species.
Proceedings of the Biological Society of Washington 118: 619-646.
Carraway LN. 1990. A morphologic and morphometric analysis of the “Sorex
vagrans species complex” in the Pacific coast region. Special Publications of
the Museum of Texas Tech University 32: 1–76.
Child GS. 1965. Some notes on mammals of Kilimanjaro. Tanganyika Notes and
Records, 64: 77-89.

Publications and Manuscripts: Crocidura monax
130
Churchfield S, Hutterer R, Dudu A. 2013. Crocidura latona Latona Shrew ; p 95 in
Happold, M. & Happold, D.C.D. (eds) 2013. Mammals of Africa: Volume IV.
Bloomsbury Publishing, London.
Darriba, D, Taboada GL, Doallo R, Posada D. 2012. jModelTest 2: more models,
new heuristics and parallel computing. Nature Methods 9: 772.
Davenport TRB, Stanley WT, Sargis EJ, De Luca DW, Mpunga NE, Machaga
SJ, Olson LE. 2006. A new genus of African monkey, Rungwecebus:
morphology, ecology, and molecular phylogenetics. Science 312: 1378–1381.
DeBlase AF, Martin RE. 1974. A manual of mammalogy with keys to the families of
the world. Dubuque: W. C. Brown.
Demeter A, Hutterer R. 1986. Small mammals from Mt. Meru and its environs
(Northern Tanzania). Cimbebasia 8: 199–207.
Dieterlen F, Heim de Balsac H. 1979. Zur Ökologie und Taxonomie der Spitzmäuse
(Soricidae) des Kivu-Gebietes. Säugetierkundliche Mitteilungen 27: 241-287.
Dinesen L, Lehmberg T, Svendsen TO, Hansen LA, Fjeldså J. 1994. A new genus
and species of perdicine bird (Phasianidae, Perdicini) from Tanzania ; a relict
form with Indo-Malayan affinites. Ibis 136: 2-11.
Dippenaar NJ. 1977. Variation in Crocidura mariquensis (A. Smith, 1844) in
southern Africa, Part 1 (Mammalia: Soricidae). Annals of the Transvaal
Museum 30: 163–206.
Dippenaar NJ. 1980. New species of Crocidura from Ethiopia and northern
Tanzania (Mammalia: Soricidae). Annals of the Transvaal Museum 32:125-
154.
Dippenaar NJ, Meester JAJ. 1989. Revision of the luna-fumosa complex of
Afrotropical Crocidura Wagler, 1832 (Mammalia: Soricidae). Annals of the
Transvaal Museum, 35: 1-47.
Dollman, G. 1915. On the African shrews belonging to the genus Crocidura. – V.
Annals and Magazine of Natural History 8 (16): 507-527.
Dollman, G. 1916. On the African shrews belonging to the genus Crocidura. – VII.
Annals and Magazine of Natural History 8 (17): 188-209.
Drummond AJ, Ho SYW, Phillips MJ, Rambaut A. 2006. Relaxed phylogenetics
and dating with confidence. PLoS Biology 4:e88.
Drummond, AJ, Rambaut A. 2007. BEAST: Bayesian evolutionary analysis by
sampling trees. BMC Evolutionary Biology, 7(1): 214.

Publications and Manuscripts: Crocidura monax
131
Esselstyn JA, Maharadatunkamsi, Achmadi AS, Siler CD, Evans BJ. 2013.
Carving out turf in a biodiversity hotspot: multiple, previously unrecognized
shrew species co-occur on Java Island, Indonesia. Molecular Ecology 22:
4972–4987.
Esselstyn JA, Timm RM, Brown RM. 2009. Do geological or climatic processes
drive speciation in dynamic archipelagos? The tempo and mode of
diversification in Southeast Asian shrews. Evolution 63: 2595–2610.
Flot J-F. 2010. Seqphase: A web tool for interconverting phase input/output files and
fasta sequence alignments. Molecular Ecology Resources 10: 162–166.
Garrick RC, Sunnucks P, Dyer RJ. 2010. Nuclear gene phylogeography using
PHASE: dealing with unresolved genotypes, lost alleles, and systematic bias
in parameter estimation. BMC Evolutionary Biology 10: 118.
Giarla TC, Voss RS, Jansa SA. 2014. Hidden diversity in the Andes: Comparison of
species delimitation methods in montane marsupials. Molecular Phylogenetics
and Evolution 70: 137–151.
Gotch AF. 1979. Mammals - Their Latin Names Explained: A guide to animal
classification. Blandford.
Gravlund P. 2002. Molecular phylogeny of Tornier’s cat snake (Crotaphopeltis
tornieri), endemic to East African mountain forests: biogeography, vicariance
events and problematic species boundaries. Journal of Zoological Systematics
and Evolutionary Research 40: 46–56.
Griffiths CJ. 1993. The geological evolution of East Africa. In: Lovett JC, Wasser
SK, eds. Biogeography and ecology of the rain forests of eastern Africa.
Cambridge: Cambridge University Press, 9–21.
Guindon S., Gascuel O. 2003. A simple, fast and accurate method to estimate large
phylogenies by maximum-likelihood. Systematic Biology 52: 696–704.
Heaney LR, Rickart EA, Balete DS, Duya MV, Duya MR, Steppan S. 2011. Seven new
species and a new subgenus of forest mice (Rodentia: Muridae: Apomys) from Luzon
Island. Fieldiana Life and Earth Sciences, 2: 1-60.
Heim de Balsac H. 1968. Considérations préliminaires sur le peuplement des
montages Africaines par les Soricidae. Biologia Gabonica, 4: 299-323.
Heim de Balsac H, Meester J. 1977. Order Insectivora. Part 1. In: Meester J, Setzer
HW, eds. The mammals of Africa: An identification manual.Smithsonian
Institution Press, Washington, D.C., [not continuously paginated], 1-29.

Publications and Manuscripts: Crocidura monax
132
Heller E. 1910. New species of insectivores from British East Africa, Uganda and
Sudan. Smithsonian Miscellaneous Collections 56: 1-5.
Hollister N. 1916. Shrews collected by the Congo expedition of the American
Museum. Bulletin of the American Museum of Natural History 35: 663-667.
Howell KM Jenkins PD. 1984. Records of shrews from Tanzania. African Journal of
Ecology 22: 67-68.
Hutterer R. 1986. Diagnosen neuer Spitzmäuse aus Tansania (Mammalia: Soricidae).
Bonner Zoologische Beiträge 37: 23–33.
Hutterer R. 2005. Order Soricomorpha. In: Wilson DE, Reeder DM, eds. Mammal
Species of the World: a Taxonomic and Geographic Reference, third ed.
Baltimore: Johns Hopkins University Press, 220–311.
Hutterer R. 2013. Crocidura montis Montane Shrew (Montane White-toothed
Shrew); pp. 108-109 in Happold, M. & Happold, D. C. D. (eds) 2013.
Mammals of Africa: Volume IV. Bloomsbury Publishing, London.
Hutterer, R. & Dieterlen, F. 1981. Weitere Erstnachweise von Kleinsaeugerarten
fuer den Sudan. African Small Mammal Newsletter 6: 1-3.
Kerbis Peterhans JC, Hutterer R, Kaliba P, Mazibuko L. 2008. The first record of
Myosorex (Mammalia: Soricidae) from Malawi with description as a new
species, Myosorex gnoskei. Journal of East African Natural History 97: 19-32.
Kerbis Peterhans JC, Stanley WT, Hutterer R, Demos TC, Agwanda B. 2009. A
new species of Surdisorex Thomas, 1906 (Mammalia, Soricidae) from western
Kenya. Bonner Zoologische Beiträge 56: 175-183.
Kerbis Peterhans JC, Hutterer R, Mwanga J, Ndara B, Davenport L,
Karhagomba IB, Udelhoven J. 2010. African shrews endemic to the
Albertine Rift: two new species of Myosorex (Mammalia, Soricidae) from
Burundi and the Democratic Republic of Congo. Journal of East African
Natural History 99: 103-128.
Lawson LP. 2010. The discordance of diversification: evolution in the tropical-
montane frogs of the Eastern Arc Mountains of Tanzania. Molecular Ecology
19: 4046-4060.
Leaché AD, Fujita MK. 2010. Bayesian species delimitation in West African forest
geckos (Hemidactylus fasciatus). Proceedings of the Royal Society B:
Biological Sciences 277: 3071–3077.
Librado P, Rozas J. 2009. DnaSP v5: A software for comprehensive analysis of

Publications and Manuscripts: Crocidura monax
133
DNA polymorphism data. Bioinformatics 25: 1451–1452.
Loader SP, Gower DJ, Ngalason W, Menegon M. 2010. Three new species of
Callulina (Amphibia: Anura: Brevicipitidae) highlight local endemism and
conservation plight of Africa’s Eastern Arc forests. Zoological Journal of the
Linnean Society 160: 496-514.
Lovett JC. 1993. Eastern Arc moist forest flora. In: Lovett JC, Wasser SK, eds.
Biogeography and ecology of the rain forests of eastern Africa. Cambridge:
Cambridge University Press, 33–55.
Lovett JC, Pocs T. 1993. Assessment of the condition of the Catchment Forest
Reserves, a botanical appraisal. Catchment Forestry Report 93.3. Dar es
Salaam.
Meester, J. 1963. A systematic revision of the shrew genus Crocidura in Southern
Arica. Transvaal Museum Memoir 13: 1-127.
Menegon M, Davenport TRB, Howell KM. 2011. Description of a new and
critically endangered species of Atheris (Serpentes: Viperidae) from the
Southern Highlands of Tanzania, with an overview of the country’s tree viper
fauna. Zootaxa 3120: 43-54.
Moreau RE. 1966. The Bird Faunas of Africa and its Islands. London: Academic
Press.
Sikes RS, Gannon WL and the Animal Care and Use Committee of the American
Society of Mammalogists. 2011. Guidelines of the American Society of
Mammalogists for the use of wild mammals in research. Journal of
Mammalogy 92: 235-253.
Stanley WT. 2013. Crocidura monax Kilimanjaro Shrew (Rombo Shrew); pp. 107-
108 in Happold, M. & Happold, D. C. D. (eds) 2013. Mammals of Africa:
Volume IV. Bloomsbury Publishing, London.
Stanley WT., Kihaule PM, Howel KM, Hutterer R. 2000. Small mammals of the
Eastern Arc Mountains, Tanzania. Journal of East African Natural History, 87:
91-100.
Stanley WT, Esselstyn JA. 2010. Biogeography and diversity among montane
populations of mouse shrew (Soricidae: Myosorex) in Tanzania. Biological
Journal of the Linnaean Society 100: 669-680.
Stanley WT, Goodman SM, Hutterer R. 1996. Notes on the insectivores and
elephant shrews of the Chome Forest, South Pare Mountains, Tanzania.

Publications and Manuscripts: Crocidura monax
134
(Mammalia: Insectivora et Macroscelidea). Zoologische Abhandlugen
Staatliches Museum für Tierkunde Dresden 49: 131-147.
Stanley WT, Goodman SM, Newmark WD. 2011. Small mammal inventories in the
East and West Usambara Mountains, Tanzania. 1. Study areas, methodologies,
and general results, pp. 1-17. In Stanley WT, ed. Studies of Montane
Vertebrates of Tanzania. Fieldiana: Life and Earth Sciences, vol. 4. Field
Museum of Natural History, Chicago.
Stanley, WT, Hutterer, R. 2007. Differences in abundance and species richness
between shrews and rodents along an elevational gradient in the Udzungwe
Mountains, Tanzania. Acta Theriologica 52: 259-273.
Stanley WT, Kihaule PM, Hutterer R, Howell KM. 1998. Small mammals of the
Eastern Arc Mountains, Tanzania. Journal of East African Natural History 87:
91–100.
Stanley WT, Kihaule PM, Munissi MJ. 2007. Small mammals of two forest
reserves in the North Pare Mountains, Tanzania. Journal of East African
Natural History 96: 215-226.
Stanley WT, Kihaule PM, Rogers MA, Makwetta AJ. 2003. Elevational
distribution and ecology of the endemic Myosorex zinki (Insectivora:
Soricidae) along the southeastern slope of Mount Kilimanjaro, Tanzania.
Tanzania Wildlife Research Institute: Proceedings of the third annual
scientific conference, Arusha, Dec 3–5, 2002.
Stanley WT, Olson LE. 2005. Phylogeny, phylogeography, and geographic variation
of Sylvisorex howelli (Family Soricidae), an endemic shrew of the Eastern Arc
Mountains, Tanzania. Journal of Zoology 266: 341-354.
Stanley WT, Rogers MA, Hutterer R. 2005. A new species of Congosorex from the
Eastern Arc Mountains (Tanzania), with significant biogeographical
implications. Journal of Zoology 265: 269-280.
Stanley WT, Rogers MA, Kihaule PM, Munissi MJ. 2014. Elevational
distribution and ecology of small mammals on Africa’s highest mountain.
PloS One 9(11): e109904.
Stephens M, Smith NJ, Donnelly P. 2001. A new statistical method for haplotype
reconstruction from population data. American Journal of Human Genetics 68:
978–989.

Publications and Manuscripts: Crocidura monax
135
Taylor PJ, Lavrenchenko LA, Carleton MD, Verheyen E, Bennett NC,
Oosthuizen CJ, Maree S. 2011. Specific limits and emerging diversity
patterns in East African populations of laminate-toothed rats,
genus Otomys (Muridae: Murinae: Otomyini): Revision of the Otomys
typus complex. Zootaxa 3024: 1-66.
Taylor PJ, Maree S, van Sandwyk J, Kerbis Peterhans JC, Stanley WT,
Verheyen E, Kaliba P, Verheyen W, Kaleme P, Bennett NC. 2009.
Speciation mirrors geomorphology and palaeoclimatic history in African
laminate-toothed rats (Muridae: Otomyini) of the Otomys denti and Otomys
lacustris species-complexes in the “Montane Circle” of East Africa. Biological
Journal of the Linnean Society 96: 913–941.
Thomas, O. 1906. Descriptions of new mammals from Mount Ruwenzori. Annals
and Magazine of Natural History, 7 (18): 136-147.
Thomas O. 1910. List of mammals from Mount Kilimanjaro, obtained by Mr. Robin
Kemp, and presented to the British Museum by Mr. C. D. Rudd. Annals and
Magazine of Natural History, 8 (6): 308-316.
Turni H, Hutterer R, Asher R. 2007. Type specimens of “insectivoran” mammals at
the Museum für Naturkunde, Berlin. Zootaxa 1470: 1 – 33.
van Zyll de Jong CG, Kirkland Jr. GL. 1989. A morphometric analysis of the Sorex
cinereus group in central and eastern North America. Journal of Mammalogy
70: 110–122.
Verheyen WN, Hulselmans JLJ, Dierckx T, Verheyen E. 2002. The Lophuromys
flavopunctatus Thomas 1888 species complex: A craniometric study, with the
description and genetic characterization of two new species (Rodentia-
Muridae-Africa). Bulletin de L’Institut Royal des Sciences Naturelles de
Belgique, Biologie 73: 27-71.
Yang Z, Rannala B. 2010. Bayesian species delimitation using multilocus sequence
data. Proceedings of the National Academy of Sciences 107: 9264-9269

Publications and Manuscripts: Crocidura monax
136
Figure 1. Map of mountainous regions of Tanzania and surrounding countries. Areas
above 1500 m are shaded. Populations sampled for this study are indicated with
sample sizes for cranial measurements in parentheses. See Methods and Materials for
details on specific localities and sample sizes.

Publications and Manuscripts: Crocidura monax
137
Figure 2. Phylogenetic tree estimated from Bayesian analysis of 267 cytochrome b
sequences. Populations/species at tips have been collapsed into triangles where the
apex represents the deepest split within the group. Diamonds along branches indicate
clades with posterior probabilities greater than 0.95, and values in parentheses after
names indicate the number of individuals sequenced.

Publications and Manuscripts: Crocidura monax
138
Figure 3. Results from guide-tree-based BP&P analysis for 12 putative species. The
guide tree is based on the Cytb topology (Fig. 2), but excludes Crocidura montis from
the Rwenzoris, for which no nuclear sequences were obtained. The posterior
probability that a given split represents a speciation event is given at each node,
averaged across all six prior schemes (Table 1). For the three nodes that exhibited
variation across different prior schemes, the full results are illustrated in grids.
Populations are grouped in gray boxes according to our taxonomic conclusions.

Publications and Manuscripts: Crocidura monax
139
Figure 4. BP&P results from 66 pairwise comparisons between all twelve populations
considered in this study. Each pairwise comparison was made with six different prior
schemes (Table 1). Strong support for species delimitation (PP > 0.9) is coded in
yellow and low support (PP < 0.9) is coded in red. Three sets of populations are
ultimately grouped into three distinct species (Crocidura monax, C. munissii, and C.
tansaniana) based on these results and our morphological analyses; comparisons
involving only those populations are grouped together in gray boxes.

Publications and Manuscripts: Crocidura monax
140
Figure 5. Projection of specimen scores on the first two canonical variates extracted
from a discriminant function analysis of 16 log-transformed cranial and dental
variables. Measurements were recorded from adult specimens from 5 populations of
Crocidura from Ngorongoro, Rubeho, Udzungwa, Ukaguru and Uluguru Mountains.

Publications and Manuscripts: Crocidura monax
141
Figure 6. Projection of specimen scores on the first two canonical variates extracted
from a discriminant function analysis of 16 log-transformed cranial and dental
variables. Measurements were recorded from adult specimens from 6 populations,
including Kilimanjaro, North Pare, South Pare, West Usambara (Shume-Magamba),
West Usambara (Ambangulu) and East Usambara (specimens from Mt. Meru [C.
newmarki] were excluded).

Publications and Manuscripts: Crocidura monax
142
Figure 7. Plantar view of the right hindfoot of (a) Crocidura monax (FMNH 173789),
(b) C. newmarki sp. nov. (FMNH 208012), and (c) C. munissii sp. nov. (FMNH
158407); scale is 5 mm. Note differences in the relative distance between thenar (T),
hypothenar (H), and interdigital pads (I1-4).

Publications and Manuscripts: Crocidura monax
143
Figure 8. Dorsal, ventral and lateral views of adult cranium and mandible of
Crocidura monax (FMNH 174110; CI = 23.04 mm), a male from 4 km N, 1.5 km W
Maua on Mt. Kilimanjaro (2000 m).

Publications and Manuscripts: Crocidura monax
144
Figure 9. Lateral views of the first upper incisor of populations of the C. monax
species group; scale is 1 mm: (a) Ngorongoro FMNH 211332 (= C. mdumai sp. nov.),
(b) Uluguru FMNH 158280 (= C. munissii sp. nov.), (c) Udzungwa FMNH 155501 (=
C. munissii sp. nov.), (d) Ruhebo FMNH 197660 (= C. munissii sp. nov.), (e)
Ukaguru FMNH 166705 (= C. munissii sp. nov.), (f) Meru FMNH 208424 (= C.
newmarki sp. nov.), (g) Kilimanjaro FMNH 174109, (h) North Pare FMNH 192665
(= C. monax), (i) South Pare FMNH 153918, (j) Magamba FMNH 27429 (= C.
usambarae), (k) West Usambara FMNH 151099, and (l) East Usambara FMNH
149970 (= C. tansaniana).

Publications and Manuscripts: Crocidura monax
145
Figure 10. Dorsal, ventral and lateral views of adult cranium and mandible of
Crocidura usambarae [FMNH 27429; (paratype); CI = 22.02 mm], a male from
Magamba, West Usambara Mountains.

Publications and Manuscripts: Crocidura monax
146
Figure 11. Dorsal, ventral and lateral views of adult cranium and mandible of
Crocidura tansaniana (FMNH 149970; CI = 25.24 mm), a male from 4.5 km WNW
Amani, Monga Tea Estate in the East Usambara Mountains.

Publications and Manuscripts: Crocidura monax
147
Figure 12. Dorsal, ventral and lateral views of adult cranium and mandible of
Crocidura newmarki [FMNH 208439 (holotype); CI = 20.59 mm], a male from Mt
Meru, Arusha National Park, near Saddle Hut (3600 m).

Publications and Manuscripts: Crocidura monax
148
Figure 13. Dorsal, ventral and lateral views of adult cranium and mandible of
Crocidura mdumai [FMNH 211323 (holotype); CI = 21.64 mm], a male from
Ngorongoro Conservation Area, Ngorongoro Crater rim, near Pongo Ranger Post
(2064 m).

Publications and Manuscripts: Crocidura monax
149
Figure 14. Dorsal, ventral and lateral views of adult cranium and mandible of
Crocidura munissii [FMNH 158290 (holotype); CI = 24.69 mm], a male from 5.1 km
W, 2.3 km N Tegetero in the Uluguru Mountains (1535 m).

Publications and Manuscripts: Crocidura monax
150
Table 1. Prior schemes used in guide-tree-based and pairwise BP&P analyses. Prior
distributions on τ represent three relative divergence depths (deep, moderate, and
shallow) and on θ represent two relative mutation-rate-scaled effective population
sizes (large and small).
Prior scheme Divergence depth Effective pop. size Gamma distribution for prior
1 Deep Large θ ~ Γ(1, 10) & τ ~ Γ (1, 10)
2 Moderate Large θ ~ Γ (1, 10) & τ ~ Γ (2,
2000)
3 Shallow Large θ ~ Γ (1, 10) & τ ~ Γ (2,
20000)
4 Deep Small θ ~ Γ (2, 2000) & τ ~ Γ (1,
10)
5 Moderate Small θ ~ Γ (2, 2000) & τ ~ Γ (2,
2000)
6 Shallow Small θ ~ Γ (2, 2000) & τ ~ Γ (2,
20000)

Publications and Manuscripts: Crocidura monax
151
Table 2. Alignment characteristics for all nuclear genes included in this study. The
first three loci listed were included in BP&P analyses. The other five loci were not
included in BP&P analyses but rather were used to make independent estimates of the
population-scaled mutation parameter θ across a subset of individuals, allowing an
evaluation of the validity of our chosen � priors.
Locus Individuals
Sampled
Locus
Length
θW
BRCA 77 588 0.0059
GHR 74 531 0.0042
VWF 68 627 0.0108
APOB 15 559 0.0035
BDNF 16 403 0.0034
MCGF 15 594 0.0052
PTGER 16 482 0.0033
RAG1 16 563 0.0047

Publications and Manuscripts: Crocidura monax
152
Table 3. External measurements of individuals of Crocidura from 11 mountains in Tanzania (listed in
geographic order from north to south). and three holotypes. Sexes are combined within populations. All
measurements were taken by WTS, with the exception of the West Usambara sample, and those of the
holotypes where the measurements were recorded from original skin tags or literature. Mean ± standard
deviation, range, sample size and CV. See text for character definitions.
TL HB TV HF EAR WT
Meru 130.69 6.03
116.00 – 144.00
N = 115 0.05
77.37 3.95
65.00 – 85.00
N = 115 0.05
53.31 3.37
45.00 – 60.00
N = 115 0.06
15.03 0.61
13.00 – 16.00
N = 115 0.04
9.35 0.58
8.00 – 10.00
N = 115 0.06
8.53 1.09
6.00 – 11.00
N = 115 0.13
Ngorongoro 139.38 3.36
134.00 – 145.00
N = 16 0.02
81.69 3.89
76.00 – 91.00
N = 16 0.05
57.69 3.53
52.00 – 65.00
N = 16 0.06
15.38 0.62
14.00 – 16.00
N = 16 0.04
10.63 0.62
9.00 – 11.00
N = 16 0.06
8.61 0.59
7.30 – 9.60
N = 16 0.07
Kilimanjaro
155.58 6.95
141.00 – 172.00 N = 55
0.04
91.49 4.25
83.00 – 101.00 N = 55
0.05
64.09 3.67
55.00 -71.00 N = 55
0.06
17.00 0.67
16.00 -19.00 N = 55
0.04
10.85 0.56
10.00 – 12.00 N = 55
0.05
13.92 1.44
10.00 – 17.00 N = 53
0.10
North Pare 149.80 4.80
140.00 – 158.00 N = 10
0.03
89.90 3.75
84.00– 96.00 N = 10
0.04
60.09 2.21
56.00 – 63.00 N = 11
0.04
16.73 0.47
16.00 – 17.00 N = 11
0.03
10.18 0.40
10.00 – 11.00 N = 11
0.04
11.79 1.72
9.20 – 15.50 N = 11
0.15
South Pare 140.00 5.39 132.00 – 146.00
N = 7
0.04
81.71 3.68 75.00 – 85.00
N = 7
0.05
58.29 3.04 54.00 – 62.00
N = 7
0.05
15.63 0.52 15.00 – 16.00
N = 8
0.03
9.63 0.52 9.00 – 10.00
N = 8
0.05
9.45 0.65 8.40 – 10.50
N = 8
0.07
West Usambara 159.65 5.69 150.00 – 170.00
N = 17
0.04
93.88 3.98 85.00 – 99.00
N = 17
0.04
65.76 2.84 60.00 – 71.00
N = 17
0.04
16.29 0.69 15.00 – 17.00
N = 17
0.04
10.21 0.47 9.50 – 11.00
N = 17
0.05
13.85 1.23 12.00 – 16.50
N = 17
0.09
East Usambara 163.00 8.22
148.00 – 176.00
N = 21 0.05
94.33 6.46
82.00 – 104.00
N = 21 0.07
68.67 3.07
64.00 – 75.00
N = 21 0.04
17.38 0.74
16.00 – 19.00
N = 21 0.04
10.95 0.59
10.00 – 12.00
N = 21 0.05
15.31 2.27
11.00 – 20.00
N = 21 0.15
Ukaguru 173.57 6.59
159.00 – 191.00
N = 68 0.04
94.09 5.20
77.00 – 106.00
N = 68 0.06
79.49 4.74
66.00 – 95.00
N = 68 0.06
17.40 0.65
16.00 – 19.00
N = 68 0.04
12.37 0.54
11.00 – 13.00
N = 68 0.04
15.93 1.56
12.50 – 19.50
N = 68 0.10
Rubeho 177.36 7.59
166.00 – 190.00 N = 11
0.04
93.73 4.22
87.00 – 101.00 N = 11
0.05
83.64 4.78
77.00 – 93.00 N = 11
0.06
17.18 0.75
16.00– 18.00 N = 11
0.04
10.82 0.75
10.00 – 12.00 N = 11
0.07
13.00 1.30
11.00 – 15.00 N =11
0.10
Uluguru 169.82 7.91 158.00 – 187.00
N = 33
0.05
89.12 4.01 82.00 – 97.00
N = 33
0.05
80.94 5.47 70.00 – 95.00
N = 34
0.07
17.03 0.80 16.00 – 19.00
N = 34
0.05
11.15 0.67 10.00 – 13.00
N = 33
0.06
12.32 1.39 9.50 – 15.50
N = 33
0.11
Udzungwa 167.33 8.97 151.00 – 187.00
N = 30
0.05
86.53 6.44 75.00 – 101.00
N = 30
0.07
80.80 3.51 74.00 – 88.00
N = 30
0.04
17.29 0.86 15.00– 19.00
N = 31
0.05
10.90 0.75 9.00 – 12.00
N = 31
0.07
14.32 2.24 10.00 – 19.50
N =31
0.16
C. monax
Type
88 66 16.2 10
C. montis
Type
77 61 15 11
C. tansaniana
Type
109 65 17 13 15
C. usambarae
Type
80 63 15 8

Publications and Manuscripts: Crocidura monax
153
Table 4. Cranial measurements of individuals of Crocidura from 11 mountains in Tanzania (sexes combined within populations), two holotypes,
and one set of paratypes. Mean ± standard deviation, range, sample size and CV. See text for character definitions.
CI BL PPL UTRL LIW BW NW GW HBC
Ngorongoro
21.49 0.25
21.09 – 21.95
N = 16 0.02
19.30 0.23
18.88 – 19.68
N = 16 0.01
9.89 0.16
9.59 – 10.12
N = 16 0.02
9.14 0.16
8.83 – 9.40
N = 16 0.02
4.59 0.09
4.43 – 4.73
N = 16 0.02
6.28 0.12
6.06 – 6.50
N = 16 0.02
1.98 0.08
1.83 – 2.12
N = 16 0.04
9.80 0.13
9.53 – 10.03
N = 16 0.01
6.55 0.16
6.26 – 6.80
N = 16 0.02
Meru
20.75 0.47
19.50 – 21.58
N = 67 0.02
18.61 0.42
17.49 – 19.43
N = 67 0.02
9.37 0.24
8.61 – 9.91
N = 67 0.03
9.04 0.23
8.52 – 9.55
N = 67 0.03
4.84 0.11
4.58 – 5.08
N = 67 0.02
6.31 0.15
5.91 – 6.62
N = 67 0.02
1.84 0.08
1.63 – 2.01
N = 66 0.04
9.70 0.23
9.22 – 10.15
N = 67 0.02
6.38 0.23
5.73 – 6.86
N = 67 0.04
Kilimanjaro
23.26 0.48
22.32 – 24.15 N = 55
0.02
21.03 0.44
20.32 – 21.89 N = 55
0.02
10.56 0.24
10.02 – 11.08 N = 55
0.02
10.21 0.21
9.71 – 10.58 N = 55
0.02
5.18 0.14
4.84 – 5.51 N = 55
0.03
7.06 0.13
6.77 – 7.30 N = 55
0.02
1.92 0.10
1.65 – 2.11 N = 55
0.05
10.42 0.25
9.86 – 11.01 N = 55
0.02
7.02 0.32
6.36 – 8.04 N = 55
0.05
North Pare
23.05 0.52
22.31 – 23.95 N = 11
0.02
20.99 0.51
20.24 – 21.85 N = 11
0.02
10.41 0.26
10.06 – 10.93 N = 11
0.03
10.33 0.23
9.94 – 10.77 N = 11
0.02
5.06 0.11
4.83 – 5.18 N = 11
0.02
7.16 0.19
6.80 – 7.39 N = 11
0.03
2.12 0.07
2.02 – 2.21 N = 11
0.03
10.27 0.17
9.88 – 10.51 N = 11
0.02
6.76 0.33
6.44 – 7.64 N = 11
0.05
South Pare
22.16 0.36 21.34 – 22.56
N = 9
0.02
19.96 0.34 19.16 – 20.33
N = 9
0.02
9.83 0.19 9.56 – 10.24
N = 9
0.02
9.78 0.18 9.46 – 9.97
N = 9
0.02
5.05 0.10 4.93 – 5.22
N = 9
0.02
6.81 0.16 6.60 – 7.04
N = 9
0.02
1.93 0.09 1.81 – 32.09
N = 9
0.05
9.92 0.23 9.50 – 10.25
N = 9
0.02
6.38 0.18 6.16 –6.62
N = 9
0.03
West
Usambara
23.71 0.46
22.92 – 24.70
N = 17 0.02
21.40 0.43
20.86 – 22.36
N = 17 0.02
10.62 0.24
10.23 – 11.11
N = 17 0.02
10.50 0.19
10.26 – 11.01
N = 17 0.02
5.17 0.15
4.87 – 5.37
N = 17 0.03
7.37 0.15
7.14 – 7.64
N = 17 0.02
2.19 0.09
2.01 – 2.36
N = 17 0.04
10.63 0.25
10.06 – 11.04
N = 17 0.02
6.94 0.20
6.51 – 7.39
N = 17 0.03
East
Usambara
25.09 0.49
23.82 – 26.12
N = 44 0.02
22.81 0.45
21.85 – 23.95
N = 44 0.02
11.33 0.28
10.85 – 11.94
N = 44 0.02
11.12 0.25
10.75 – 12.05
N = 44 0.02
5.44 0.21
5.00 – 6.04
N = 44 0.04
7.66 0.18
7.25 – 8.04
N = 44 0.02
2.22 0.11
1.99 – 2.54
N =44 0.05
10.88 0.28
10.35 – 11.60
N = 44 0.03
6.97 0.20
6.57 – 7.50
N = 44 0.03
Ukaguru
24.51 0.46
23.38 – 25.76 N = 68
0.02
22.22 0.43
21.11 – 23.32 N = 68
0.02
10.97 0.28
10.08 – 11.4 N = 69
0.03
10.75 0.23
10.15 – 11.29 N = 68
0.02
5.33 0.14
5.05 – 5.75 N = 69
0.03
7.65 0.17
7.23 – 8.06 N = 69
0.02
2.28 0.15
1.99 – 2.56 N = 68
0.07
10.79 0.26
10.10 – 11.47 N = 69
0.02
7.02 0.20
6.63 – 7.70 N = 69
0.03
Rubeho
24.12 0.41
23.49 – 24.63 N = 10
0.02
21.87 0.34
21.27 – 22.27 N = 10
0.02
10.74 0.17
10.46 – 11.05 N = 10
0.02
10.66 0.20
10.32 – 10.93 N = 10
0.02
5.22 0.12
5.02 – 5.40 N = 10
0.02
7.61 0.23
7.21 – 7.89 N = 10
0.03
2.20 0.15
1.97 – 2.38 N = 10
0.07
10.63 0.14
10.30 – 10.78 N = 10
0.01
6.99 0.19
6.68 – 7.32 N = 10
0.03
Uluguru 24.03 0.51 22.70 – 24.89
N = 34
21.69 0.52 20.21 – 22.60
N = 34
10.54 0.32 9.65 – 11.15
N =34
10.65 0.21 10.20 – 11.02
N = 34
5.30 0.15 4.89 – 5.60
N = 34
7.30 0.22 6.72 – 7.74
N =34
2.19 0.10 1.94 – 2.34
N = 34
10.25 0.22 9.82 – 10.70
N = 33
6.95 0.23 6.53 – 7.54
N = 33

Publications and Manuscripts: Crocidura monax
154
0.02 0.02 0.03 0.02 0.03 0.03 0.05 0.02 0.03
Udzungwa
23.78 0.37
23.10 – 24.71 N = 31
0.02
21.45 0.37
20.73 – 22.33 N = 31
0.02
10.60 0.25
10.12 – 11.11 N = 31
0.02
10.52 0.25
10.04 – 10.99 N = 31
0.02
5.28 0.16
4.79 – 5.62 N = 31
0.03
7.54 0.27
6.68 – 8.20 N = 31
0.04
2.24 0.11
2.00 – 2.45 N = 31
0.05
10.55 0.25
9.96 – 11.05 N = 31
0.02
7.24 0.38
6.64 – 8.99 N = 31
0.05
C. usambarae
Paratypes
21.98 0.22 21.74 – 22.18
N = 3
0.01
19.93 0.25 19.65 – 20.08
N = 3
0.01
9.99 0.15 9.77 – 10.11
N = 5
0.02
9.76 0.40 9.59 – 9.88
N = 4
0.01
4.94 0.03 4.91 – 4.97
N = 4
0.01
6.89 0.40 6.66 – 7.00
N = 5
0.02
1.97 0.08 1.87 – 2.09
N = 5
0.04
10.14 0.12 10.00 – 10.29
N = 4
0.01
6.50 0.18 6.31 – 6.67
N = 4
0.03
C. monax
Holotype 23.67 21.30 10.51 10.60 5.12 7.22 2.24 10.30 6.88
C. tansaniana
Holotype 25.36 23.10 11.51 11.20 5.40 7.95 2.32 10.99 6.93

Publications and Manuscripts: Crocidura monax
155
Table 4 (CONTINUED). Cranial measurements of individuals of Crocidura from 11 mountains in Tanzania (sexes combined
within populations), two holotypes, and one set of paratypes. Mean ± standard deviation, range and sample size and CV. See text
for character definitions.
I3–W C–W M
3–L M
3–W PGW MP M&I LTR
Ngorongoro
0.71 0.03
0.65 – 0.75
N = 16 0.04
0.77 0.03
0.71 – 0.83
N = 16 0.04
1.37 0.05
1.26 – 1.45
N = 16 0.04
0.73 0.03
0.67 – 0.80
N = 16 0.05
6.61 0.12
6.43 – 6.83
N = 16 0.02
1.08 0.14
0.94 – 1.45
N = 16 0.13
13.34 0.17
13.08 – 13.65
N = 16 0.01
8.52 0.14
8.23 – 8.72
N = 16 0.02
Meru
0.69 0.03
0.62 – 0.78
N = 67 0.05
0.73 0.03
0.64 – 0.80
N = 67 0.05
1.45 0.07
1.31 – 1.59
N = 67 0.04
0.77 0.04
0.70 – 0.86
N = 67 0.05
6.55 0.16
5.99 – 6.93
N = 49 0.02
1.04 0.08
0.91 – 1.32
N = 67 0.08
13.05 0.35
12.13 – 13.76
N = 67 0.03
8.35 0.23
7.80 – 8.98
N = 67 0.03
Kilimanjaro
0.80 0.03
0.71 – 0.87 N = 55
0.04
0.90 0.04
0.80 – 0.97 N = 55
0.04
1.57 0.06
1.44 – 1.69 N = 55
0.04
0.84 0.04
0.74 – 0.95 N = 55
0.05
7.06 0.19
6.67 – 7.56 N = 55
0.03
0.99 0.10
0.75 – 1.20 N = 55
0.10
14.80 0.36
14.01 – 15.51 N = 55
0.02
9.51 0.19
9.04 – 9.81 N = 55
0.02
North Pare
0.84 0.04
0.78 – 0.92 N = 11
0.05
0.94 0.04
0.88 – 1.01 N = 11
0.04
1.62 0.06
1.50 – 1.69 N = 11
0.04
0.83 0.04
0.74 – 0.87 N = 11
0.05
6.99 0.15
6.85 – 7.36 N = 11
0.02
1.08 0.08
0.94 – 1.21 N = 11
0.07
14.73 0.34
14.26 – 15.29 N = 11
0.02
9.59 0.20
9.23 – 9.95 N = 11
0.02
South Pare
0.80 0.03 0.76 – 0.84
N = 9
0.04
0.88 0.03 0.82– 0.90
N = 9
0.03
1.49 0.07 1.36 – 1.06
N = 9
0.50
0.77 0.30 0.73 – 0.83
N = 9
0.05
6.81 0.10 6.66 – 6.94
N = 9
0.01
1.14 0.10 0.94 – 1.28
N = 9
0.11
14.04 0.27 13.44 – 14.33
N = 9
0.02
9.07 0.18 8.78 – 9.30
N = 9
0.02
West
Usambara
0.97 0.03
0.91 – 1.02
N = 17 0.03
1.01 0.03
0.95 – 1.05
N = 17 0.03
1.71 0.06
1.59 – 1.79
N = 17 0.04
0.87 0.05
0.81 – 0.98
N = 17 0.06
7.28 0.24
6.93 – 7.71
N = 17 0.03
1.20 0.10
1.06 – 1.41
N = 17 0.08
15.08 0.34
14.49 – 15.69
N = 17 0.02
9.74 0.20
9.47 – 10.26
N = 17 0.02
East
Usambara
0.98 0.04
0.90 – 1.07
N = 44 0.04
1.01 0.40
0.93 – 1.10
N = 44 0.04
1.72 0.07
1.58 – 1.93
N = 44 0.04
0.87 0.05
0.76 – 0.97
N = 44 0.06
7.50 0.22
7.19 – 8.12
N = 43 0.03
1.23 0.13
0.94 – 1.48
N = 44 0.11
16.04 0.33
15.19 – 16.88
N = 44 0.02
10.29 0.22
9.84 – 11.05
N = 44 0.02
Ukaguru
0.88 0.05
0.74 – 1.07 N = 69
0.06
1.01 0.05
0.88 – 1.10 N = 69
0.04
1.67 0.07
1.50 – 1.80 N = 69
0.04
0.82 0.05
0.68 –0.91 N = 69
0.06
7.61 0.23
7.00 – 8.15 N = 69
0.03
1.01 0.11
0.79 – 1.31 N = 69
0.11
15.51 0.35
14.64 – 16.38 N = 67
0.02
9.96 0.20
9.49 – 10.42 N = 67
0.02
Rubeho
0.86 0.04
0.79 – 0.91 N = 10
0.04
0.97 0.03
0.91 – 1.02 N = 10
0.04
1.65 0.06
1.54 – 1.73 N = 10
0.04
0.87 0.03
0.81 – 0.91 N = 10
0.04
7.28 0.15
7.02 – 7.55 N = 10
0.02
1.22 0.15
0.97 – 1.42 N = 10
0.12
15.12 0.28
14.70 – 15.49 N = 10
0.02
9.81 0.17
9.56 – 10.03 N = 10
0.02
Uluguru 0.87 0.04 0.98 0.05 1.63 0.07 0.79 0.04 7.21 0.22 1.15 0.13 15.27 0.36 9.90 0.17

Publications and Manuscripts: Crocidura monax
156
0.78 – 0.94
N = 34 0.05
0.78 – 1.05
N = 34 0.05
1.49 – 1.79
N = 34 0.04
0.72 – 0.88
N = 34 0.05
6.82 – 7.72
N =34 0.03
0.87 – 1.41
N = 34 0.11
14.49 – 15.84
N = 34 0.02
9.54 – 10.21
N = 34 0.02
Udzungwa
0.88 0.06
0.77 – 0.98
N = 31 0.06
0.97 0.04
0.90 – 1.03
N = 31 0.04
1.66 0.08
1.50 – 1.90
N = 31 0.05
0.83 0.04
0.77 – 0.92
N = 31 0.05
7.42 0.23
6.98 – 7.85
N = 31 0.03
1.06 0.14
0.82 – 1.42
N = 31 0.13
14.93 0.28
14.52 – 15.57
N = 31 0.02
9.76 0.23
9.34 – 10.12
N = 31 0.02
C. usambarae
Paratypes
0.90 0.04
0.84 – 0.93 N = 5
0.04
0.91 0.02
0.88 – 0.94 N = 5
0.02
1.64 0.08
1.53 – 1.77 N = 6
0.05
0.82 0.05
0.74 – 0.89 N = 6
0.07
6.82 0.15
6.58 – 6.93 N = 5
0.02
1.05 0.12
0.92 – 1.16 N = 4
0.11
13.87 0.26
13.45 – 14.19 N = 6
0.02
9.03 0.22
8.74 – 9.38 N = 6
0.02
C. monax
Holotype 0.88 0.94 1.69 0.85 7.05 1.13 15.12 9.87
C. tansaniana
Holotype 0.93 0.99 1.76 0.86 7.51 1.08 16.00 10.30

Publications and Manuscripts: Crocidura monax
157
Table 5. Comparison of cranial measurements (mm) for Crocidura montis from
Rwenzori Mountains and Crocidura newmarki from Mt. Meru, given as mean,
standard deviation, sample size and range. F values result from a one-way
analysis of variance on the populations from Meru and Rwenzori (Holotype not
included). ** = P ≤ 0.01. See text for character definitions.
Character Crocidura
Meru
(n =67)
C. montis
Rwenzori (n = 8)
C. montis
Holotype
(n = 1)
F
CI 20.75 0.47
19.50 – 21.58
22.20 0.55
21.31 – 22.97 21.57 65.5**
BL 18.61 0.42
17.49 – 19.43
19.86 0.54
18.94 – 20.62 19.31 58.8**
PPL 9.37 0.24
8.61 - 9.91
9.98 0.32
9.36 - 10.34 9.58 42.7**
UTRL 9.04 0.23
8.52 - 9.55
9.77 0.30
9.44 - 10.25 9.49 67.2**
LIW 4.84 0.11
4.58 - 5.08
4.88 0.09
4.78 - 5.05 5.11 1.0
BW 6.31 0.15
5.91 - 6.62
6.92 0.23
6.63 - 7.23 6.58 100.7**
NW 1.84 0.08
1.63 - 2.01
2.08 0.12
1.85 - 2.20 2.10 56.8**
GW 9.70 0.23
9.22 - 10.15
10.16 0.30
9.66 - 10.66 9.90 27.4**
PMH 6.38 0.23
5.73 - 6.86
6.93 0.09
6.80 - 7.10 6.86 44.0**
I3-W 0.69 0.03
0.62 - 0.78
0.83 0.04
0.77 - 0.88 0.73 112.0**
C-W 0.73 0.03
0.64 - 0.80
0.84 0.03
0.79 - 0.90 0.74 69.8**
M3-L 1.45 0.07
1.31 - 1.59
1.60 0.06
1.53 - 1.68 1.42 34.7**
M3-W 0.77 0.04
0.70 - 0.86
0.79 0.04
0.72 - 0.84 0.72 2.6
MP 1.04 0.08
0.91 - 1.32
1.04 0.16
0.81 - 1.21 1.14 0.01
M&I 13.05 0.35
12.13 – 13.76
13.93 0.42
13.48 – 14.54 13.54 42.7**
LTR 8.35 0.23
7.80 - 8.98
9.02 0.26
8.73 - 9.43 8.64 59.8**

Publications and Manuscripts: Crocidura monax
158
Table 6. Pilosity (%) and tail length relative to head and body length (Rel TL) in the
populations studied, based on FMNH specimens.
Population N Pilosity
mean
Range Bristles Rel
TL
Taxon name
Kilimanjaro 40 15.9 0–32 few, long 70.0 C. monax
North Pare 10 15.3 9–26 few, short 66.8 C. monax
South Pare 7 10.1 7–21 few, short 70.7 C. usambarae
Magamba 7 24.5 22–28 few, short 73.2 C. usambarae
West Usambara 11 35.4 29–48 many, long 70.0 C. tansaniana
East Usambara 35 29.5 24–41 many, long 71.2 C. tansaniana
Ngorongoro 11 42.7 29–46 many, long 70.6 C. mdumai nov.
Uluguru 12 14.6 9–20 few, short 90.8 C. munissii nov.
Ukaguru 43 8.1 4–27 very few,
short
84.5 C. munissii nov.
Rubeho 5 7.5 6–8 very few,
short
89.2 C. munissii nov.
Udzungwa 15 12.1 7–18 few, short 93.4 C. munissii nov.
Meru 10 67.2 58–95 many, long 68.9 C. newmarki
nov.
Rwenzori 11 81.3 70–86 many, long 75.7 C. montis
Mt Kenya 10 79.8 51–86 many, long 72.3 C. fumosa

Publications and Manuscripts: Crocidura monax
159
Table 7. Comparison of cranial measurements (mm) for Crocidura fumosa from Mt.
Kenya and Crocidura from Ngorongoro, given as mean, standard deviation, sample
size and range. F values result from one-way analysis of variance. ** = P ≤ 0.01. See
text for character definitions.
Character Crocidura
Ngorongoro
(n =16)
C. fumosa
Mt. Kenya
(n = 10)
F
CI 21.49 0.25
21.09 – 21.95
21.56 0.58
20.25 – 22.24 0.2
BL 19.30 0.23
18.88 – 19.68
19.34 0.57
18.10 – 20.05 0.1
PPL 9.89 0.16
9.59 – 10.12
9.68 0.35
9.96 – 10.08 4.2
UTRL 9.14 0.16
8.83 – 9.40
9.44 0.25
8.89 – 9.73 13.9**
LIW 4.59 0.09
4.43 – 4.73
4.62 0.13
4.43 – 4.77 0.5
BW 6.28 0.12
6.06 – 6.50
6.43 0.16
6.19 – 6.66 6.0*
NW 1.98 0.08
1.83 – 2.12
2.06 0.09
1.92 – 2.19 4.9*
GW 9.80 0.13
9.53 – 10.03
9.88 0.24
9.48 – 10.20 1.2
PMH 6.55 0.16
6.26 – 6.80
6.66 0.13
6.40 – 6.79 3.1
I3-W 0.71 0.03
0.65 – 0.75
0.78 0.03
0.74 – 0.82 34.9**
C-W 0.77 0.03
0.71 – 0.83
0.83 0.05
0.75 – 0.89 15.0**
M3-L 1.37 0.05
1.26 – 1.45
1.42 0.05
1.35 – 1.52 6.9*
M3-W 0.73 0.03
0.67 – 0.80
0.72 0.03
0.69 – 0.76 1.5
MP 1.08 0.14
0.94 – 1.45
1.00 0.13
0.81 – 1.24 1.7
PGW 6.61 0.12
6.43 – 6.83
6.59 0.14
6.27 – 6.78 0.1
M&I 13.34 0.17
13.08 – 13.65
13.51 0.40
12.65 – 14.05 2.3
LTR 8.52 0.14
8.23 – 8.72
8.80 0.14
8.63 – 9.07 23.2**

Publications and Manuscripts: Crocidura monax
160
Appendix I – Specimens Examined.
Most specimens used in this study are housed at the Field Museum of Natural History;
numbers below are FMNH catalogue numbers. Other specimens are from museums in
Bonn (ZFMK), Tervuren (RMCA) and Copenhagen (ZMUC).
Crocidura fumosa
Mt. Kenya
Kenya, Eastern Province, Meru South District, Mt. Kenya National Reserve, near
Meru Bandas, 0.16263° S, 37.44621° E, 2980 m:
FMNH 216870-216874, 216876, 216878, 216881.
Kenya, Eastern Province, Meru South District, Mt. Kenya National Reserve, 0.20677°
S, 37.49867° E, 2410 m:
FMNH 216892.
Crocidura mdumai
Ngorongoro
Tanzania, Arusha Region, Ngorongoro District, Ngorongoro Conservation Area,
Ngorongoro Crater rim, near Pongo Ranger Post, 3.24407° S, 35.65040° E, 2064 m:
FMNH 211272, 211314-211315, 211317, 211320, 211322-211323, 211327-211328,
211331-211332.
Tanzania, Arusha Region, Ngorongoro District, Ngorongoro Conservation Area,
Ngorongoro Crater rim, near Lamala Gate, 3.14255° S, 35.68669° E, 2372 m:
FMNH 211058-211059, 211124, 211131-211132, 211134.
Crocidura monax
Kilimanjaro
Tanzania, Kilimanjaro Region, Moshi District, 4 km N, 1.5 km W Maua, 3°14.404' S
(or 3.24007° S), 37°27.502' E (or 37.45837° E), 2043 m:
FMNH 173788-173789, 173796, 174103-174110, 174112.
Tanzania, Kilimanjaro Region, Moshi District, 7 km N, 2.5 km W Maua, 3°12.459' S,
37°26.818' E, 2470 m:

Publications and Manuscripts: Crocidura monax
161
FMNH 173770-173771, 173774-173778, 174066-174080.
Tanzania, Kilimanjaro Region, Moshi District, 10.5 km N, 3.5 km W Maua, 3°10.627'
S, 37°26.413' E, 2897 m:
FMNH 173784, 174081-174102.
Tanzania, Kilimanjaro Region, Moshi District, Sothern slope, Mweka trail, Rombo,
3°08' S, 37°20' E, 3200 m:
RMCA 96.037-M-5797 - 96.037-M-5801, 96.037-M-7123 – 96.037-M-7127, ZFMK
2014.500.
North Pare
Tanzania, Kilimanjaro Region, Mwanga District, North Pare Mts, Kindoroko Forest
Reserve, 3.76039° S, 37.64726° E, 1688 m
FMNH 192663-192669
Tanzania, Kilimanjaro Region, Mwanga District, North Pare Mts, Minja Forest
Reserve, 3.58149° S, 37.6773° E, 1572 m
FMNH 192670-192671,192673-192674
Crocidura montis
Rwenzori
Democratic Republic of the Congo, Kivu, Ituri, Rwenzori Mts., SW slope, Butagu
drainage, Bugongo Ridge, 2743 m:
FMNH 26244
Democratic Republic of the Congo, Kivu, Ituri, Rwenzori Mts, Butagu River Valley,
Katahuleko Creek, W of Kalonge, 2134 m:
FMNH 26247, 26261, 26265, 26267, 26269
Democratic Republic of the Congo, Kivu, Ituri, Rwenzori Mts, Ibale, 2286 m:
FMNH 26270, 26272
Crocidura munissii
Udzungwa
Tanzania, Morogoro Region, Kilombero District, Udzungwa Mts, 19.5 km N, 0.5 km
W Chita, 8.3472° S, 35.9389° E, 2000 m:

Publications and Manuscripts: Crocidura monax
162
FMNH 155308-155309, 155312, 155314-155318, 155320, 155322-155329, 155490-
155501.
Tanzania, Morogoro Region, Kilombero District, Udzungwa Mts, 4 km W, 5 km N
Chita, 8.475° S, 35.9069° E, 1460 m:
FMNH 155485-155487.
Tanzania, Morogoro Region, Iringa Region, Kilombero District, Udzungwa Mts,
Mufindi, 8.38° S, 35.22° E, 1940 m:
ZFMK 2014.0481.
Ukaguru
Tanzania, Morogoro Region, Kilosa District, Ukaguru Mts, Mamiwa-Kisara Forest
Reserve, 1 km E, 0.75 km S Mount Munyera, 6.3792° S, 36.9361° E, 1900 m:
FMNH 166569, 166690-166691, 166693-166700, 166702-166717, 166720-166721.
Tanzania, Morogoro Region, Kilosa District, Ukaguru Mts, Mamiwa-Kisara Forest
Reserve, 1 km E, 1.5 km S Mt Munyera, 6.3889° S, 36.95° E, 1840 m:
FMNH 166578, 166723, 166725-166741, 166744-166748, 166750-166759, 166761-
166762, 166764-166766.
Rubeho
Tanzania, Dodoma Region, Mpwapwa District, Rubeho Mts, Mwofwomero Forest
Reserve, near Chugu Peak, 6.8337° S, 36.57198° E, 1900 m:
FMNH 197657-197659
Tanzania, Morogoro Region, Kilosa District, Rubeho Mts, Ilole Forest, 7.43774° S,
36.72729° E, 1878 m:
FMNH 197403-197404,197660-197665
Uluguru
Tanzania, Morogoro Region, Morogoro District, Uluguru Mts, Uluguru North Forest
Reserve, 3 km W, 1.3 km N Tegetero, 6.9292° S, 37.7056° E, 1345 m:
FMNH 158280-158283, 158286.
Tanzania, Morogoro Region, Morogoro District, Uluguru Mts, Uluguru North Forest
Reserve, 5.1 km W, 2.3 km N Tegetero, 6.92° S, 37.6833° E, 1535 m:

Publications and Manuscripts: Crocidura monax
163
FMNH 158287-158291, 158293-158297, 158392-158396,158399-158400, 158402-
158403, 158405-158408, 158572.
Tanzania, Morogoro Region, Morogoro District, Uluguru Mts, Uluguru North Forest
Reserve, 6 km W, 3 km N Tegetero, 6.9167° S, 37.675° E, 1850 m:
FMNH 158409-158413.
Tanzania, Morogoro Region, Morogoro District, Uluguru, Bondwa Peak, 6.54 S,,
37.40 E.
ZFMK 2014.0482; RMCA 96.037-M-6787, 96.037-M-7136, 96.037-M-7137.
Tanzania, Morogoro Region, Morogoro District, Uluguru N Forest Reserve,
Morningside,6.53 S, 37.40 E.
RMCA 96.037-M-7121, 96.037-M-7122; ZFMK 2014.499.
Tanzania, Morogoro Region, Morogoro District, Uluguru, Mbete, 6.53 S, 37.41 E.
RMCA 96.037-M-7120
Tanzania, Morogoro Region, Morogoro District, Uluguru East, Lupanga, 1300 m.
ZMUC 1747.
Crocidura newmarki
Meru
Tanzania, Arusha Region, Arumeru District, Mt. Meru, Arusha National Park, Fig
Tree Arch, 3.24406° S, 36.82845° E, 1950 m:
FMNH 207914, 207978, 207981, 207986, 208384-208388, 208390-208392, 208394-
208395, 208397-208398, 208401-208408, 208410-208411.
Tanzania, Arusha Region, Arumeru District, Mt Meru, Arusha National Park,
3.24725°S, 36.80066°E, 2300 m:
FMNH 208415-208416.
Tanzania, Arusha Region, Arumeru District, Mt. Meru, Arusha National Park, Meru
Crater, 3.24200° S, 36.78736° E, 2652 m:
FMNH 208045-208048, 208050, 208443-208451, 208453, 208456-208457.
Tanzania, Arusha Region, Arumeru District, Mt. Meru, Arusha National Park,
Mgongo wa Tembo, 3.22350° S, 36.78675° E, 3000 m:

Publications and Manuscripts: Crocidura monax
164
FMNH 208012, 208016-208017, 208022-208025, 208027-208028, 208032-208035,
208422-208424, 208426-208433, 208435-208436.
Tanzania, Arusha Region, Arumeru District, Mt. Meru, Arusha National Park, near
Saddle Hut, 3.21609° S, 36.76897° E, 3600 m:
FMNH 208042, 208439, 208440
Tanzania, Kilimanjaro Region, Moshi District, Mount Meru, 6000 ft.
FMNH 86059-86068
Tanzania, Kilimanjaro Region, Moshi District, Mount Meru; Meru East and Meru
West (Olkokola), 2550-2750 m.
ZFMK 60.018 – 60.025; 63.015 - 63.032
Crocidura tansaniana
West Usambara-Ambangulu Forest
Tanzania, Tanga Region, Korogwe District, West Usambara Mts, 12.5 km NW
Korogwe, Ambangulu Tea Estate, 5.07° S, 38.42° E, 1300 m:
FMNH 147203-147209, 147353-147354, 147357-147358, 147376, 149979-149980,
149999-150000, 151099.
Tanzania, Tanga Region, Korogwe District, West Usambara Mts, West Usambara
Mts, 14.5 km NW Korogwe, Ambangulu Tea Estate, 5.05° S, 38.38° E, 1250 m:
FMNH 147210
East Usambara
Tanzania, Tanga Region, Muheza District, East Usambara Mts, 4.5 km ESE Amani,
Monga Tea Estate, 5.1° S, 38.6° E, 1000 m
FMNH 149973-149975, 149977-149978, 150376, 151112-151118, 151126, 151129-
151134.
Tanzania, Tanga Region, Muheza District, East Usambara Mts, East Usambara Mts,
4.5 km NW Amani, Monga Tea Estate, 5.07° S, 38.62° E, 1100 m:
FMNH 147211, 147360
Tanzania, Tanga Region, Muheza District, East Usambara Mts, 4.5 km WNW Amani,
Monga Tea Estate, 5.1° S, 38.6° E, 1000 m

Publications and Manuscripts: Crocidura monax
165
FMNH 149969-149972, 149976, 151106-151107, 151109-151111, 151120-151125,
151376-151381.
Tanzania, Tanga Region, Muheza District, East Usambara Mts, Amani, primary forest
ZFMK 85.194 (holotype)
Crocidura usambarae
South Pare
Tanzania, Kilimanjaro Region, Same District, South Pare Mts, Chome Forest
Reserve, 3 km E, 0.7 km N Mhero, 4.28° S, 37.9278° E, 2000 m
FMNH 153844, 153918-153922
Tanzania, Kilimanjaro Region, Same District, South Pare Mts, Chome Forest
Reserve, 7 km S Bombo, 4.33° S, 38° E, 1100 m
FMNH 151137-151138, 151375.
West Usambara-Shume Magamba
Tanzania, Tanga Region, Lushoto District, West Usambara Mts, Magamba, 4.66667°
S, 38.25° E, 1585 m
FMNH 27424-27430

Publications and Manuscripts: Mt Meru mammals
166
Elevational distribution and ecology of small mammals Tanzania’s second
highest mountain
WILLIAM T. STANLEY1, PHILIP M. KIHAULE
2
1 The Field Museum of Natural History, Department of Science and Education,
Chicago, Illinois, United States of America; email:[email protected]
2 University of Dar es Salaam, Department of Zoology, Dar es Salaam, Tanzania

Publications and Manuscripts: Mt Meru mammals
167
ABSTRACT
Mt Meru is Tanzania’s second highest mountain, and the ninth highest in Africa. The
distribution and abundance of small mammals on the mountain are poorly known.
Here we document the distribution of shrews and rodents along an elevational
gradient on the southeastern versant of Meru. Five sites were sampled with
elevational center points of 1950, 2300, 2650, 3000 and 3600 m, using a systematic
methodology of standard traps and pitfall lines, to inventory the shrews and rodents of
the slope. 10 species of mammal were recorded, including 2 shrew and 8 rodent
species, and the greatest diversity of both was found at 2300 m. No species
previously unrecorded on Meru were observed. Two genera of rodents that occur in
nearby Eastern Arc Mountains (Hylomyscus and Beamys) were not recorded.
Lophuromys verhageni and a new species of Crocidura are the only endemic
mammals on Mt. Meru, and were widespread across the elevational gradient. As in
similar faunal surveys on other mountains of Tanzania, rainfall influenced the sample
success of shrews, but not rodents. This study contributes further justification for the
conservation of the forest habitat of Mt. Meru. Comparisons are made to similar
surveys of other mountains in Tanzania.
ADDITIONAL KEYWORDS: Mt. Meru – shrews – rodents – Crocidura – Tanzania

Publications and Manuscripts: Mt Meru mammals
168
INTRODUCTION
Mammalian distribution along elevational gradients is of increasing interest
and, as a result, the efforts to document the montane faunas of various massifs around
the world have intensified over the past few decades. Climate change has recently
increased this curiosity and the need for detailed investigations. Documenting the
present elevational distribution of organisms will facilitate the monitoring of that
biota during times of climatic perturbation or habitat alteration. Biogeographic,
ecological and evolutionary studies are also informed by comprehension of montane
biotic systems. Examples of elevational surveys of small mammals in montane
localities on various continents using systematic sampling protocols include Chile [1],
Costa Rica [2], Madagascar [3], Malaysia [4], Philippines [5], Taiwan [6] and U.S.A.
[7]. Each of these studies produces a more complete understanding of both specific
and broadly general patterns of mammalian elevational distribution, and the
mechanisms that led to such an array [8]. The utility of these studies in monitoring
impacts of environmental changes cannot be overstated. For example, in Yosemite
Valley, California, a survey along an elevational transect documented significant
range shifts in various mammalian species since an identical survey was conducted
along the same transect a century earlier [7].
The montane mammals of sub-Saharan Africa have been studied for over a
century, and studies of the elevational distributions of mammals on some massifs of
the continent are documented [9], [10]. Published results from detailed systematic
inventories of mammals on mountains of eastern Africa include, Kerbis Peterhans et
al. [11] for Rwenzori Mountains, Stanley and Hutterer [12] for Udzungwa Mountains,
Mulungu et al. [13] and Stanley et al. [14] for Kilimanjaro. Various other massifs,
although significant geologic entities, remain enigmatic with regard to the mammals
occurring on them.
Mt. Meru, Tanzania’s second highest mountain, and the ninth highest in
Africa, is a case in point. While its neighbor, Kilimanjaro, has been the subject of
mammalian study [13], [14], [15], [16], Meru has been understudied. While some
aspects of the ecology of the mountain have been documented [17], small mammals
of the mountain have not been systematically studied. The most complete analysis of
the fauna of Meru is that of Demeter and Hutterer [18]. The need for detailed

Publications and Manuscripts: Mt Meru mammals
169
knowledge of this mountain has been emphasized by the results of other studies such
as Thompson et al. [19] who implied that climate change is affecting the ecology and
habitat of neighboring Kilimanjaro. Baseline data for small mammals of Meru will
allow future analyses of the impact of climate change on the ecology of this volcano.
We used a standardized methodology that has been recently employed in
myriad other montane sites of Tanzania [12], [20], [21], [22] to survey the small
mammals (shrews and rodents) at five different elevations and habitats along the
southeastern slope of Mt. Meru. Our study had three principal goals: 1) to conduct
the first intensive survey of the presence and abundance of small mammals along an
elevational gradient on the mountain; 2) to test for differences between rodents and
shrews in their relationship to elevation, response to different trapping methodologies
and relationship of captures to rainfall; and 3) to compare the generated results to
similar studies other mountains of Tanzania.
MATERIALS AND METHODS
Study Site
Mt. Meru is in northeastern Tanzania and reaches an elevation of 4,566 m
(14,977 ft) m, and ranks ninth among the highest ten mountains of Africa. An active
volcano (the mountain last erupted in 1910), Meru is the centerpiece of Arusha
National Park. The mountain is a popular destination for climbers, and there is one
path that originates in the lowlands and runs up the southeastern side of the mountain
[18]. Between 16 July and 19 August 2009, we sampled the small mammals (shrews
and rodents) at five different elevations, ranging from roughly 1950 to 3600 m, along
the climbing route on the southeastern slope of Mt. Meru (Figure 1).
All sampling sites were on Mt. Meru in Arusha National Park, Arumeru
District, Arusha Region, Tanzania. The specific localities, elevations, habitats (sensu
Demeter and Hutterer, [18]) and dates of sampling are listed below. The elevations
given for each site are centered at the associated camp and sampling efforts spanned
roughly 100-200 m above and below the camp. Temperature and rainfall for each
site (measured at camp) are listed in Table 1:
Site 1 - 1950 m). Fig Tree Arch, 3.24406° S, 36.82845° E, 1950 m; lower
montane forest; 16-23 July 2009.

Publications and Manuscripts: Mt Meru mammals
170
Site 2 - 2300 m). Site 2, 3.24725° S, 36.80066° E, 2300 m; upper montane
forest; 23-30 July 2009.
Site 3 - 2650 m). Meru Crater, 3.242° S, 36.78736° E, 2650 m; ecotone
between montane forest and ericaceous zone; 13-19 August 2009.
Site 4 - 3000 m). Mgongo wa Tembo, 3.2235° S, 36.78675° E, 3000 m; mix
of forest, ericaceous plants and some bamboo); 30 July-6 August 2009.
Site 5 - 3600 m). near Saddle Hut, 3.21609° S, 36.76897° E, 3600 m; ecotone
between ericaceous and alpine zones; 6-13 August 2009.
Field methodology
Pitfall lines and traplines were installed to capture principally shrews and
rodents, respectively. Each pitfall line were comprised of 11 buckets, placed 5 m
apart, and buried in the ground so that the top of the bucket was level with the ground.
Each of these 15 l buckets was 26 cm high and had an upper and lower diameter of 26
cm and 24 cm, respectively. Each pitfall line had a 50 cm high black plastic drift
fence running over the center of each bucket. This technique has been used with
success in other mammalogical surveys.
Trap lines utilized three different kinds of traps: Museum Specials, 14 x 7 cm;
Victor Rat Traps (referred to here as Victor Trap), 17.5 x 8.5 cm; and medium-sized
Sherman Traps, 23 x 9.5 x 8 cm. To maximize capture success, traps were set at sites
considered likely to be frequented by small mammals, rather than at fixed distances or
in a grid. Consequently, distances between consecutive traps were not constant. Bait
for each trap consisted of freshly fried coconut coated in peanut butter, and traps were
rebaited each late afternoon. Additional details on this type of trapping technique are
presented by Stanley et al. [22]. Both pitfall and trap lines were checked twice each
day, in the early morning and mid-afternoon.
Not all traps or buckets were employed for equal amounts of time (some trap
lines were set the first day of the survey, others were installed on a subsequent day),
so we use the terms “trap night”, “bucket night” and “sample night” to quantify
sampling effort. A “trap-night” refers to one trap in operation for a 24 hr period (0700
to 0700 hrs). A “bucket-night” denotes one bucket in operation for a 24 hr period
(0700 to 0700 hrs). The term “sample-night” is used in discussion of overall
sampling effort (including the number of trap-nights and bucket-nights). We refer to
the success rate of each method as either “trap success” or “bucket success”, and calculate

Publications and Manuscripts: Mt Meru mammals
171
these values by dividing the number of individuals captured by the number of trap-nights
or bucket-nights and multiplying by 100. In discussions involving the overall capture
success, the term “sample success” refers to the success rate for pitfall and trap
methodologies combined. This is calculated by dividing the number of individuals
captured by the number of sampling-nights and multiplying by 100.
Animals were handled following the protocol approved by the American Society
of Mammalogists [23]. Voucher specimens were prepared as either museum study
skins with associated skulls and axial skeletons or embalmed in formalin. Standard
museum measurements [24] were taken by WTS, and tissues including heart, liver,
kidney and/or muscle were extracted from select specimens and frozen in liquid
nitrogen, or saved in dimethyl sulfoxide buffer (DMSO) at ambient temperature. All
voucher specimens are deposited in the Field Museum of Natural History (FMNH),
Chicago, and the University of Dar es Salaam (UDSM), Dar es Salaam, and all tissue
samples are in liquid nitrogen storage in the FMNH. We follow the taxonomy
presented for shrews by Hutterer [25]; rodents by Carleton and Stanley [26],[27],
Holden [28], Musser and Carleton [29].
RESULTS
Over the course of the survey, we accumulated 7,111 sample-nights (4592
trap-nights and 2519 bucket-nights) and captured 751 small mammals, including 276
shrews representing 2 species, and 475 rodents representing 8 species (Tables 2, 3, 4).
Significantly more shrews were captured in buckets than in traps (X2 = 61.3, P <
0.05), and significantly more rodents were caught in traps than in buckets (X2 = 232.7,
P < 0.05), a pattern observed in past studies within Tanzania [12], [14], [30]. In 4592
trap-nights, 581 mammals were captured for an overall trap success of 12.6%. Of the
mammals caught in traps, 465 were rodents (10.1% trap success for rodents) and 116
were shrews (2.5% trap success). In the 2519 bucket-nights, 170 mammals were
captured for a total bucket success of 6.7%. Of these, 160 were shrews (6.3% success)
and 10 were rodents (0.4% success). This conspicuous pattern was evident both
across the entire survey, and at each of the five sites sampled (Table 2). Both shrew
species found during the survey were caught in traps (weighing between 3.5-11 g).
Ten rodents representing 3 species (Dendromus insignis, Mus triton, and Praomys
taitae) were caught in buckets and ranged in weight (10-27 g). Interestingly, of the

Publications and Manuscripts: Mt Meru mammals
172
total ten Dendromus captured, the lightest (10-13 g; n = 6) were captured in buckets,
and the heaviest 4 (14-22.5 g) were captured in traps. The animals caught in buckets
were adults based on the presence of fused cranial sutures.
At each elevational site, captures (and overall sample success) ranged from 49
[3.5%] at 3600 m to 257 [18.0%] at 2300 m (Table 2). For shrews, the lowest values
were recorded at the 3600 m site (20 [1.4%]) and the highest values at the 3000 m site
(87 [6.1%]; Table 3). For rodents, the lowest (29 [2.1%]) and highest (208 [14.6%])
values were observed at the 3600 m and 2300 m sites, respectively (Tables 4). The
cumulative number of species trapped at a site reached an asymptote at the 1950,
2650 and 3600 sites, but new species (i.e. not yet recorded at a site) were captured at
the 2300 (where Graphiurus murinus was captured for the first time at that site on the
last day of trapping) and 3000 (where Mus triton and Otomys tropicalis were both
captured on the last day) sites. The species accumulations curves (Figure 2) illustrate
these results.
As in past surveys of montane mammals in Tanzania [12], [14], the
relationship between the amount of rainfall and capture of shrews is more positive
than that between rainfall and rodent captures. During the survey of Mt. Meru, only
two sites (1950 and 3000 m) received rain while buckets and traps were in place. The
Product-moment correlation coefficients (r) of amount of daily rainfall with total captures
of shrews (for buckets and traps combined) are 0.60 and 0.55 for the 1950 and 3600 m
sites, respectively. For rodents these values were both negative (-0.53 and -0.30,
respectively). While none of these r values are significant, Figure 3 illustrates the
increase in shrew captures during or shortly after measureable rainfall, a pattern not
exhibited by rodent captures.
The correlation of four daily capture parameters (number of individuals,
number of species, number of new species [i.e. previously unsampled at a given site],
and cumulative number of species) with cumulative sample-nights was analyzed for
both type of trapping methodology (Table 5) and mammalian order (Table 6).
Because only two species of shrews were recorded during the entire survey (Table 2,
3), and these both were caught on either the first, or every day, correlation analysis
between cumulative sampling effort and some parameters is not applicable. For
example, the cumulative number of shrew species captured by buckets was two the
first day of the survey and remained the same throughout the entire survey. Other
comparisons revealed differing patterns. The correlation between sampling effort and

Publications and Manuscripts: Mt Meru mammals
173
number of individuals fluctuated among elevations and the number of species
captured each day was not correlated with cumulative sampling effort. For all taxa, a
negative correlation existed between new species captured and cumulative sampling
effort, but the correlation was significant in only five cases across the transect and not
consistently with one parameter. Correlation analysis revealed a significant positive
correlation between cumulative sample-nights and cumulative species across all sites
for trap lines, bucket lines (for captures of both shrews and rodents) and both
sampling methods combined. Each site exhibited the same general pattern, although
not in all parameters examined. For example, there was no strong relationship
between cumulative sample nights and cumulative shrew species captured in buckets
at the 2650 and 3600 m sites (Table 5). Table 6 illustrates the same general pattern
when the analysis is focused on mammalian order. Again the low number of shrew
species influences the analysis, and the strongest relationship is that of cumulative
species of rodents with cumulative sampling effort.
The relationship between elevation and number of individuals or
species collected, or sample success was not notable. The low and relatively constant
number of shrew species was observed at all elevations, and the only prominent
negative relationship (high but not significant r values) exists in the associations of
the total number of individuals and total trap success with elevation (Table 7). The
highest species diversity was seen at the 3000 m site, and the lowest at the 1950 m
site. While the lowest number of individuals collected was at the 3600 m site, the
species diversity was higher there (6 species) compared to that of the lowest site (5
species) that had the second highest sample success of any of the sites (Table 2).
There was a 6.7% bucket success for all animals captured, and 170 mammals
(160 shrews and 10 rodents) were collected in 385 buckets (77 buckets installed at
each of five sites), but most buckets captured no animals. Over the entire survey, 287
buckets caught nothing, and only 98 buckets (25% of total installed) captured animals.
Of the buckets that captured animals, 61 caught one animal, 20 collected two, 10
captured three, 3 caught four animals, 3 collected five animals, and eleven animals
were found in one bucket. A similar pattern was exhibited by traps; although there
was 12.6% trap success in 750 traps with 581 captures, only 313 traps (42% of total
employed) caught at least one animal. A total of 166 traps caught only one animal, 74
trapped two, 43 three, 18 four, 8 five, 2 six, and one trap caught seven animals while
in place. Neither of these values followed the Poisson distribution (G-test for

Publications and Manuscripts: Mt Meru mammals
174
goodness of fit = 34.0 for buckets, 63.7 for traps; p< 0.01) indicating a lack of trap
independence.
DISCUSSION
Ten mammal species (2 shrews and 8 rodents) were documented along an
elevational transect from roughly 1950 to 3600 m on the eastern slope of Mt. Meru,
none of which are introduced taxa. With the exception of Crocidura newmarki and
Lophuromys verhageni, which are endemic to Mt. Meru [31], [32], all species have
broad distributions, to different extents. One shrew is found on other mountains
within eastern Africa: Crocidura allex on Kilimanjaro, Ngorongoro, Kenya and
Aberdares [25]. Among the rodents, the species with the broadest distribution are
Grammomys dolichurus, Rhabdomys dilectus and Graphiurus murinus, all of which
are distributed in eastern and southern Africa [28], [29]. The rodent species with the
most restricted distribution (other than Lophuromys verhageni) was Praomys taitae
which occurs from southeastern Kenya through eastern Tanzania [27].
The faunal list of Demeter and Hutterer [18] represents the heretofore most
complete list of shrews and rodents known to occur on Meru, and their list contained
species not observed during this survey. Some of these taxa are larger and not the
subjects of the methodology employed during this study (i.e. Paraxerus, Thryonomys,
and Tachyoryctes) and are not considered further here. The elevational range of the
study of Demeter and Hutterer [18] was 1200 m to 2750 m and included towns and
villages such as Arusha and Tengeru, and habitats other than forest such as savanna.
Some of the taxa listed include taxa typically found at elevations and habitats below
forest on Meru, including Mastomys natalensis and Pelomys fallax. However, some
taxa listed from forest localities that we did not observe are worthy of discussion here,
including Crocidura hildegardeae, C. luna, Aethomys kaiseri, Hylomyscus denniae,
Lemniscomys striatus, Mus gratus, Rattus rattus, and Otomys irroratus, The two
species of Crocidura were collected at elevations of 1700 m, or lower, below the
elevational range of the current study. Crocidura hildegardeae has been recorded at
2000 m, and C. luna at 1400 m on Mt. Kilimanjaro [14], [15]. Thus, we conclude that
these two species were not present in the sites we sampled. The specimens of
Aethomys kaiseri Lemniscomys striatus, and Rattus rattus cited by Demeter and
Hutterer [18] came from habitats below 2000 m, with the exception of specimens

Publications and Manuscripts: Mt Meru mammals
175
from ”House Mgondah” at 2000 m. The authors suggest Aethomys and Rattus may
have occurred at this locality because of human influence. Certainly, Rattus is a
known commensal [29]. While the vast majority of our efforts were in primary
habitat, we did place traps around the dwellings of Saddle Hut (not included in
analysis above) to collect rodents living under the buildings. As a result we collected
Crocidura allex, Lophuromys verhageni, Rhabdomys dilectus but no Aethomys,
Lemniscomys or Rattus. We saw no evidence of these species in forested habitats of
the mountain, and hypothesize that all three genera were found at this locality either
having been introduced by human activities, or supported by habitat alteration
associated with the dwelling. Demeter and Hutterer [18] list Mus gratus among the
taxa occurring on Meru. While one locality (“Forest House”; 1700 m) was below the
range of our study area, another (Meru East: 1550-2750 m) does overlap with our
elevational range. Given there was no specific elevation of the collection sites of
these specimens of M. gratus, we cannot definitely determine that they were collected
in forest. We saw no evidence of this species, and only one specimen of M. bufo.
The records of Otomys irroratus listed by Demeter and Hutterer [18] (now O.
angoniensis [29]) are interesting to us because there are also specimens in the Field
Museum collected by B. Cooper in 1938 from the crater of Mt. Meru at roughly 2900
m (FMNH 48610-48619). We recorded O. tropicalis from the same crater and at
elevations ranging from 2650 – 3600 m, but saw no evidence of O. angoniensis.
Temporal differences (1938 vs. 2009) or seasonal differences (January vs.
July/August) may explain the difference, but additional surveys of the mountain are
needed to determine the current presence and distributional extent of both species.
Finally, the records of Hylomyscus on Meru [18] (and Ngorongoro [33]) are now
referred to Praomys taitae [26], [27]. Another rodent that is found on northern
Eastern Arc Mountains and the Southern Highlands [29], and has been recorded from
Moshi (Dieterlen [34]), is Beamys hindei, and this taxon was not recorded on Meru by
us, or past work. In addition to the survey of Meru, similar detailed faunal surveys
have been conducted on Kilimanjaro [14] and Ngorongoro (WT Stanley, unpubl.
data) and neither Hylomyscus nor Beamys have been recorded on any of these
Northern Highland Mountains during these transects, suggesting they do not occur in
these locals. Assuming this to be correct, this supports the hypothesis that the
establishment of these two rodent taxa on the mountains where they are found was via
a southern route. We suspect establishment via a northern route from Kenya would

Publications and Manuscripts: Mt Meru mammals
176
have resulted in populations of both of these rodents on some, if not all of the
Northern Highlands.
The combination of traps and pitfall lines were effective in sampling non-
volant small mammal communities at different elevations on Mt. Meru, as in past
studies in Tanzania [12], [14], [22], [30], [35]. However, species accumulation curves
failed to reach a plateau at every site: the 2300 and 3000 m site had one and two
species, respectively, captured on the last 24-hour period of trapping at the site.
While we are confident that we documented almost all of the species of shrews and
small rodents occurring at each site, and thus feel justified in comparing results
among different elevational sites of this transect, as well as to results of similar
surveys within Tanzania [12], [14], we suggest additional surveys are needed to be
determine with certainty the complete list of small mammals in different elevation
zones of Mt. Meru.
The results of this survey differ in several ways when compared to surveys of
other mountains in Tanzania using identical techniques [12], [14]. The most striking
difference is the low diversity of shrews on Meru. Restricting comparisons to only
lists generated by our surveys of the other mountains, Meru had one genus
(Crocidura) and two species (C. allex, C. newmarki); Kilimanjaro had three genera
(Crocidura, Myosorex, and Sylvisorex) and six species (C. allex, C. hildegardeae, C.
monax, C. olivieri, M. zinki and S. granti); and Udzungwa had three genera
(Crocidura, Myosorex, and Sylvisorex) and nine species (C. hildegardeae, C.
desperata, C. elgonius, C. munissii, C. olivieri, C. telfordi, M. kihaulei, S. lixus, and S.
megalura). The Udzungwa survey included dry forest near the base of the scarp at
600 m. If species recorded there, and no higher in the Udzungwas are removed from
consideration, the Udzungwa list shrinks from nine to seven species. Even after this,
the Meru list stands in stark contrast to the list of a nearby mountain of similar origins
and a range of different geologic composition. The reasons for such a striking low
diversity on Meru are unknown. Volcanic activity on the mountain has been recent in
comparison to Kilimanjaro [36], but it seems unlikely that eruptions would have
contributed to extinction of taxa once existing on Meru.
Unlike Kilimanjaro and Udzungwa elevation was not significantly correlated
with captures or diversity of either shrews or rodents. In the Udzungwas rodent
diversity and abundance increased with elevation [12], and on Kilimanjaro shrew
abundance and diversity decreased with elevation [14]. Similar patterns, or any

Publications and Manuscripts: Mt Meru mammals
177
influence of elevation on abundance or diversity were not seen on Meru. As in
Kilimanjaro [14], the greatest diversity of shrews and rodents on Meru was at 3000 m,
and not at the top of the transect as in Udzungwa [12], and the greatest diversity was
documented within forested habitats and not above treeline (Tables 2,3,4).
Similarities among the three transects were observed in the effect rainfall had
on the capture of shrews, but not rodents. The Meru survey adds additional support to
the idea that the amount of rainfall during a sampling period should be considered
while sampling shrew diversity or abundance. Also, there was a lack of capture
independence among traps and buckets across the entire transect and at each site on
Meru, as in surveys of Kilimanjaro and Udzungwas [12], [14]. As in those studies,
we hypothesize that the presence of a captured animal in a bucket may attract other
animals into that bucket and placement of traps influences the chances of multiple
captures over time by one trap.
Although this may change with future taxonomic studies, the only endemic
mammal on Mt. Meru is Lophuromys verhageni [31]. This species was found at all
sites but the lowest (1950 m), which was unexpected, as Lophuromys aquilus is found
in moist habitats on Mt. Kilimanjaro at 2000 m [14]. While the habitat at the 1950 m
site on Meru appeared suitable for Lophuromys based on our experience of trapping
this mammal on different mountains in Tanzania [12], [14], [37] there may be some
element that prohibits Lophoromys from occurring at this elevation on the mountain.
No rodent species were recorded at all sites during the Meru survey, but both species
of shrew were. Also, as in the Kilimanjaro survey [14], the highest elevation that
mammals natural extend to (other than Homo sapiens) remains unknown. Additional
surveys are needed to determine this and to further elucidate the natural history of the
mammals of Meru.
ACKNOWLEDGMENTS
We thank the Tanzania Commission for Science and Technology, the Tanzania
Wildlife Research Institute, the Ministry of Natural Resources and Tanzanian
National Parks for permission to conduct this research. We are grateful to Unique
Safaris, the Wildlife Conservation Society (Tanzania), and Ms. Gladys Ng’umbi

Publications and Manuscripts: Mt Meru mammals
178
(Arusha National Park ecologist) for logistical support. R. Banasiak provided
important assistance with the figures.

Publications and Manuscripts: Mt Meru mammals
179
REFERENCES
1. Patterson BD, Meserve PL, Lang BK (1989) Distribution and abundance of
small mammals along an elevational transect in temperate rainforests of Chile.
J Mammal 70: 67-78.
2. McCain CM (2004) The mid-domain effect applied to elevational gradients:
species richness of small mammals in Costa Rica. J Biogeogr 31: 19-31.
3. Goodman SM, Ganzhorn JU, Rakotondravony D (2003) Introduction to the
Mammals. In: Goodman, SM, Benstead, JP, editors. The Natural History of
Madagascar. Chicago: The University of Chicago Press. Pp. 1159-1186.
4. Md Nor S (2001) Elevational diversity patterns of small mammals on Mount
Kinabalu, Malaysia. Glob Ecol Biogeogr 10: 41-62.
5. Rickart EA, Heaney LR, Utzurrum RB (1991) Distribution and ecology of
small mammals along an elevational transect in southeastern Luzon,
Philippines. J Mammal 72: 458-469.
6. Yu HT (1994) Distribution and abundance of small mammals along a
subtropical elevational gradient in central Taiwan. J Zool 234: 577-600.
7. Moritz C, Patton JL, Conroy CJ, Parra JL, White GC, Beissinger SR (2008)
Impact of a Century of Climate Change on Small-Mammal Communities in
Yosemite National Park, USA. Science 322: 261-264.
8. McCain CM (2005) Elevational gradients in diversity of small mammals.
Ecology 86: 366-372.
9. Happold DCD, Happold M (1989) Biogeography of small montane mammals
in Malawi, Central Africa. J. Biogeogr 16: 353-367.
10. Yalden DW (1988) Small mammals of the Bale mountains, Ethiopia. Afr J
Ecol 26: 281-294.
11. Kerbis Peterhans JC, Kityo RM, Stanley WT, Austin PK (1998) Small
mammals along an elevational gradient in Rwenzori Mountains National Park,
Uganda. Pp. 149-171 In: Osmaston H, Tukahirwa J, Basalirwa C, Nyakaana J,
editors. The Rwenzori Mountains National Park, Uganda. Exploration,
environment and biology. Conservation, management and community.
Makerere University, Kampala.
12. Stanley WT, Hutterer R (2007) Differences in abundance and species richness

Publications and Manuscripts: Mt Meru mammals
180
between shrews and rodents along an elevational gradient in the Udzungwa
Mountains, Tanzania. Acta Theriol 52: 261–275.
13. Mulungu LS, Makundi RH, Massawe AW, Machang’u, RS, Mbije, NE (2008)
Diversity and distribution of rodent and shrew species associated with
variations in altitude on Mount Kilimanjaro, Tanzania. Mammalia 72: 178-
185.
14. Stanley WT, Rogers MA, Kihaule PM, Munissi MJ. 2014. Elevational
distribution and ecology of small mammals on Africa’s highest mountain.
PLOS ONE 9(11): e109904. DOI: 10.1371/journal.pone.0109904
15. Grimshaw J, Cordeiro N, Foley C (1995) The mammals of Kilimanjaro.
J East Afr Nat Hist 84: 105–139.
16. Shore RF, Garbett SD (1991) Notes on the small mammals of the Shira
Plateau, Mt. Kilimanjaro. Mammalia 55: 601-607.
17. Lundgren B, Lundgren L (1972) Comparison of Some Soil Properties in One
Forest and Two Grassland Ecosystems on Mount Meru, Tanzania Geografiska
Annaler. Series A, Physical Geography Vol. 54, No. 3/4, Studies of Soil
Erosion and Sedimentation in Tanzania pp. 227-240
18. Demeter A, Hutterer R (1986) Small mammals from Mt. Meru and its
environs (Northern Tanzania). Cimbebasia 8: 199–207.
19. Thompson LG, Brecher HH, Mosley-Thompson E, Hardy DR, Mark BG
(2009) Glacier loss on Kilimanjaro continues unabated. Proc Natl Acad Sci
USA 106: 19770-19775.
20. Goodman SM, Newmark WD, Stanley WT, Howell KM (1995) The
Ambangulu Forest, West Usambara Mountains, Tanzania: a threatened
Eastern Arc forest. Oryx 29: 212–214.
21. Stanley WT, Kihaule PM, Howell KM, Hutterer R (1998) Small mammals of
the Eastern Arc Mountains, Tanzania. J East Afr Nat Hist 87: 91–100.
22. Stanley WT, Goodman SM, Newmark WD (2011) Small mammal inventories
in the East and West Usambara Mountains, Tanzania. 1. Study areas,
methodologies, and general results. In: Stanley WT, ed. Studies of Montane
Vertebrates of Tanzania. Fieldiana Life Earth Sci 4: 1–17.
23. Sikes RS, Gannon WL and the Animal Care and Use Committee of the
American Society of Mammalogists. (2011) Guidelines of the American

Publications and Manuscripts: Mt Meru mammals
181
Society of Mammalogists for the use of wild mammals in research. J Mammal
92: 235-253.
24. DeBlase AF, Martin RE (1974) A Manual of Mammalogy with Keys to the
Families of the World. Wm. C. Brown Company Publishers, Dubuque, Iowa.
25. Hutterer R (2005) Order Soricomorpha. In: Wilson DE, Reeder DM, editors.
Mammal species of the world: A taxonomic and geographic reference, Third
Edition. Baltimore: Johns Hopkins University Press, pp. 220–299.
26. Carleton MD, Stanley WT (2005) Review of the Hylomyscus denniae complex
in Tanzania, with description of a new species. Proc Biol Soc Wash 118: 619–
646.
27. Carleton MD, Stanley WT (2012) Species limits within the Praomys
delectorum group (Rodentia: Muridae: Murinae) of East Africa: A
morphometric reassessment and biogeographic implications. Zool J Linn Soc
165: 420-469.
28. Holden ME (2005) Family Gliridae. In: Wilson DE, Reeder DM, editors.
Mammal species of the world: A taxonomic and geographic reference, Third
Edition. Baltimore: Johns Hopkins University Press, pp. 819–841.
29. Musser GG, Carleton MD (2005) Superfamily Muroidea. In: Wilson DE,
Reeder DM, editors. Mammal species of the world: A taxonomic and
geographic reference, Third Edition. Baltimore: Johns Hopkins University
Press, pp. 894–1531.
30. Stanley WT, Goodman SM, Hutterer R (2011) Small mammal inventories in
the East and West Usambara Mountains, Tanzania. 2. Families Soricidae
(Shrews) and Macroscelididae (Elephant Shrews). In: Stanley WT, editor.
Studies of Montane Vertebrates of Tanzania. Fieldiana Life Earth Sci 4: 18–
33.
31. Verheyen W, Hulselmans JLJ, Dierckx T, Verheyen E (2002) The
Lophuromys flavopunctatus Thomas 1888 species complex: A craniometric
study, with the description and genetic characterization of two new species
(Rodentia-Muridae-Africa). Bulletin de L’Institut Royal des Sciences
Naturelles de Belgique, Biologie 72:141-182.
32. Stanley, W. T., Hutterer, R., Giarla, T. C., and Esselstyn, J. A. (In press)
Phylogeny, phylogeography and geographical variation in the Crocidura
monax (Soricidae) species complex from the montane islands of Tanzania,

Publications and Manuscripts: Mt Meru mammals
182
with descriptions of three new species. Zoological Journal of the Linnean
Society
33. Bishop IR (1979) Notes on Praomys (Hylomyscus) in eastern Africa.
Mammalia 43: 521–530.
34. Dieterlen, F. (1979) Der früheste Fund der afrikanischen Kleinen Hamsterratte
(Beamys hindei) (Cricetomyinae; Cricetidae; Rodentia) Stuttgarter Beitr zur
Naturk ser. A 330: 1-3.
35. Stanley WT, Kihaule PM, Munissi MJ (2007) Small mammals of two forest
reserves in the North Pare Mountains, Tanzania. J East Afr Nat Hist 96: 215–
226.
36. Guest NJ, Leedal GP (1953) Volcanic activity of Mt. Meru. Records of the
Geological Survey of Tanganyika 3: 40-46.
37. Stanley WT, Goodman SM (2011) Small mammal inventories in the East and
West Usambara Mountains, Tanzania. 4. Rodentia. In: Stanley WT, editor.
Studies of Montane Vertebrates of Tanzania. Fieldiana Life Earth Sci 4: 53–
73.

Publications and Manuscripts: Mt Meru mammals
183
FIGURE LEGENDS
Figure 1. Map of Mt. Meru showing routes, elevational contours and study sites.

Publications and Manuscripts: Mt Meru mammals
184
Figure 2. Species accumulation curves (for both pitfall and trap lines combined) for
each site. The dashed lines represent the number of captures each day; the solid lines
represent the cumulative number of new species for the site observed each day. The
graph at the lower right shows the number of specimens of shrew, rodent and
mammal captured at each site.

Publications and Manuscripts: Mt Meru mammals
185
Figure 3. The relationship between numbers of individuals captured each day of the
sampling period, and rainfall, at each site. Rodentia are on the left and Soricomorpha
are on the right.

Publications and Manuscripts: Mt Meru mammals
186
Table 1. Climatic data for each of the sites sampled on Mt. Meru in July-August, 2009.
Totals given as mean ± standard deviation, range and sample size (number of days
measured). Sample size for rainfall is given as number of days monitored and (number
of days with rain).
Elevation (m) Daily Minimum
Temperature (º C)
Daily Maximum
Temperature (º C)
Daily rainfall (mm)
1950 10.2° ± 0.4 16.7° ± 1.0 0.7 ± 1.2
10 – 11º 16 – 18° 0 – 3
N = 7 N = 6 N = 7 (2)
2300 7.9° ± 0.9 14.2° ± 1.8 0
6.5 – 9.0º 11.5 – 16°
N = 7 N = 6 N = 6
2650 6.2° ± 0.7 13.1° ± 2.7 0
5.5 – 7.5º 10 – 18°
N = 6 N = 6 N = 6
3000 4.3° ± 0.9 13.8° ± 3.4 3.0 ± 3.3
3 – 5º 9.0 – 16.5° 0 – 6.2
N = 7 N = 6 N = 6 (3)
3600 2.1° ± 1.4 16.3° ± 1.6 0
0 – 4º 14.5 – 18.0°
N = 7 N = 6 N = 6

Publications and Manuscripts: Mt Meru mammals
187
Table 2. Trapping totals for rodents and shrews by trap technique on the southeastern
slope of Mt. Meru in July-August, 2009.
Elevation 1950 m 2300 m 2650 m 3000 m 3600 m Totals
BUCKETS
# bucket-nights 506 506 506 506 495 2519
# individuals 52 24 18 63 13 170
(% bucket success) (10.3) (4.7) (3.6) (12.3) (2.6) (6.7)
# species 3 3 3 4 3 5
# shrews 51 22 17 58 12 160
(% bucket success) (10.1) (4.3) (3.4) (11.3) (2.4) (6.3)
# shrew species 2 2 2 2 2 2
# rodents 1 2 1 5 1 10
(% bucket success) (0.2) (0.4) (0.2) (1.0) (0.2) (0.4)
# rodent species 1 1 1 2 1 3
TRAPS
# trap-nights 920 920 920 920 912 4592
# individuals 115 233 104 93 36 581
(% trap success) (12.5) (25.5) (11.3) (9.3) (3.9) (12.6)
# species 5 6 8 9 6 9
# rodents 86 206 81 64 28 465
(% trap success) (9.3) (22.6) (8.8) (6.5) (3.1) (10.1)
# rodent species 3 4 6 7 4 7
# shrews 29 27 23 29 8 116
(% bucket success) (3.2) (2.9) (2.5) (2.8) (0.9) (2.5)
# shrew species 2 2 2 2 2 2
TOTAL
# sample-nights 1426 1426 1426 1426 1407 7111
# individuals 167 257 122 156 49 751
(% sample success) (11.7) (18.0) (8.6) (10.9) (3.5) (10.5)
# species 5 6 9 10 6 10

Publications and Manuscripts: Mt Meru mammals
188
Table 3. Elevational distribution of shrew species along the southeastern slope of Mt.
Meru in July-August, 2009. Only specimens caught in traps or buckets are included
in totals.
Elevation 1950 m 2300 m 2650 m 3000 m 3600 m Totals
Species
Crocidura allex 31 31 18 36 16 132
Crocidura newmarki 49 18 22 51 4 144
Total # individuals 80 49 40 87 20 276
Total # species 2 2 2 2 2 2
Total # sample-nights 1426 1426 1426 1426 1407 7111
Sample success (%) 5.6 3.4 2.8 6.1 1.4 3.9
Total # caught in buckets 51 22 17 58 12 160
Total # bucket-nights 506 506 506 506 495 2519
Bucket success (%) for
pitfall lines
10.1 4.3 3.3 11.5 2.4 6.3

Publications and Manuscripts: Mt Meru mammals
189
Table 4. Elevational distribution of rodent species along the southeastern slope of
Mt. Meru in July-August, 2009. Only specimens caught in traps or buckets are
included in totals.
Elevation 1950 m 2300 m 2650 m 3000 m 3600 m Totals
Species
Otomys tropicalis 0 0 2 1 1 4
Dendromus insignis 0 0 1 7 2 10
Grammomys
dolichurus
3 4 2 4 0 13
Lophuromys
verhageni
0 18 9 30 2 59
Mus triton 0 0 0 1 0 1
Praomys taitae 79 185 38 4 0 306
Rhabdomys dilectus 0 0 24 7 24 55
Graphiurus murinus 5 1 6 15 0 31
Total # individuals 87 208 82 69 29 475
Total # species 3 4 7 8 4 8
Total # sample-nights 1426 1426 1426 1426 1407 7111
Sample success (%) 6.1 14.6 5.7 4.8 2.1 6.7
Total # caught in traps 86 206 81 64 28 465
Total # trap-nights 920 920 920 920 912 4592
Trap success (%) 9.3 22.4 8.8 6.9 3.1 10.1
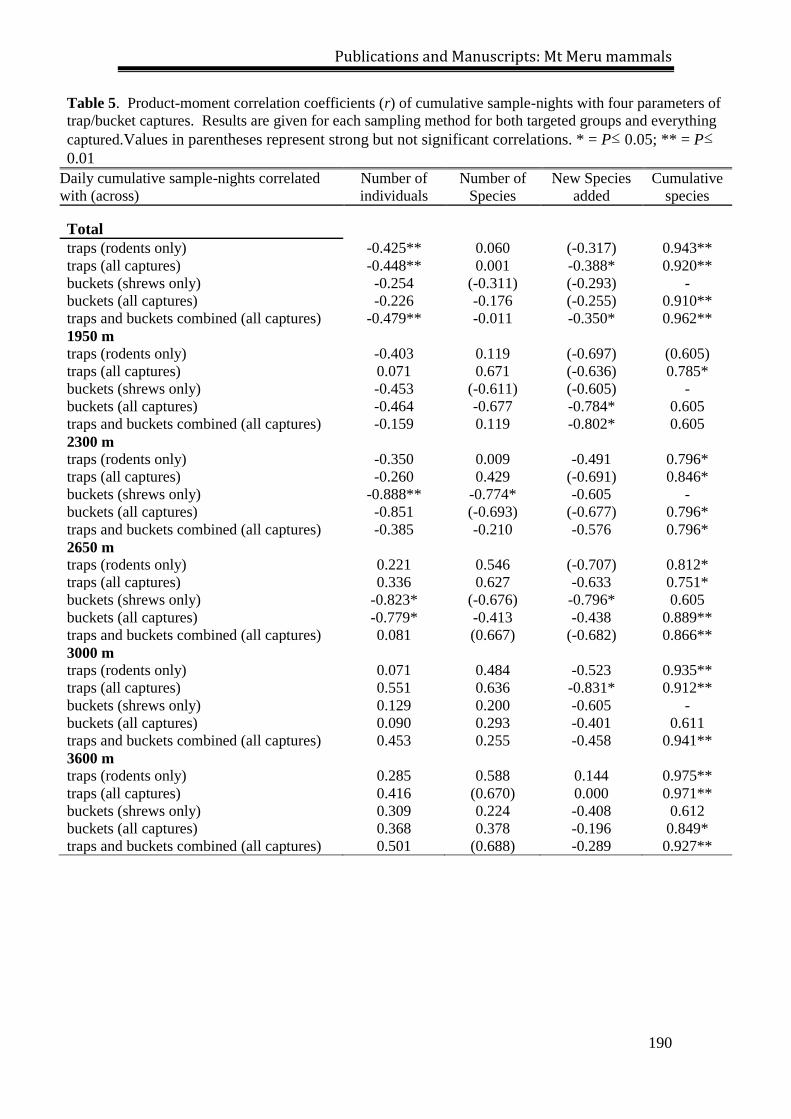
Publications and Manuscripts: Mt Meru mammals
190
Table 5. Product-moment correlation coefficients (r) of cumulative sample-nights with four parameters of
trap/bucket captures. Results are given for each sampling method for both targeted groups and everything
captured.Values in parentheses represent strong but not significant correlations. * = P≤ 0.05; ** = P≤
0.01
Daily cumulative sample-nights correlated
with (across)
Number of
individuals
Number of
Species
New Species
added
Cumulative
species
Total
traps (rodents only) -0.425** 0.060 (-0.317) 0.943**
traps (all captures) -0.448** 0.001 -0.388* 0.920**
buckets (shrews only) -0.254 (-0.311) (-0.293) -
buckets (all captures) -0.226 -0.176 (-0.255) 0.910**
traps and buckets combined (all captures) -0.479** -0.011 -0.350* 0.962**
1950 m
traps (rodents only) -0.403 0.119 (-0.697) (0.605)
traps (all captures) 0.071 0.671 (-0.636) 0.785*
buckets (shrews only) -0.453 (-0.611) (-0.605) -
buckets (all captures) -0.464 -0.677 -0.784* 0.605
traps and buckets combined (all captures) -0.159 0.119 -0.802* 0.605
2300 m
traps (rodents only) -0.350 0.009 -0.491 0.796*
traps (all captures) -0.260 0.429 (-0.691) 0.846*
buckets (shrews only) -0.888** -0.774* -0.605 -
buckets (all captures) -0.851 (-0.693) (-0.677) 0.796*
traps and buckets combined (all captures) -0.385 -0.210 -0.576 0.796*
2650 m
traps (rodents only) 0.221 0.546 (-0.707) 0.812*
traps (all captures) 0.336 0.627 -0.633 0.751*
buckets (shrews only) -0.823* (-0.676) -0.796* 0.605
buckets (all captures) -0.779* -0.413 -0.438 0.889**
traps and buckets combined (all captures) 0.081 (0.667) (-0.682) 0.866**
3000 m
traps (rodents only) 0.071 0.484 -0.523 0.935**
traps (all captures) 0.551 0.636 -0.831* 0.912**
buckets (shrews only) 0.129 0.200 -0.605 -
buckets (all captures) 0.090 0.293 -0.401 0.611
traps and buckets combined (all captures) 0.453 0.255 -0.458 0.941**
3600 m
traps (rodents only) 0.285 0.588 0.144 0.975**
traps (all captures) 0.416 (0.670) 0.000 0.971**
buckets (shrews only) 0.309 0.224 -0.408 0.612
buckets (all captures) 0.368 0.378 -0.196 0.849*
traps and buckets combined (all captures) 0.501 (0.688) -0.289 0.927**

Publications and Manuscripts: Mt Meru mammals
191
Table 6. Product-moment correlation coefficients (r) of cumulative sample-nights with
four parameters of trap success shrew and rodent captures. Values in parentheses
represent strong but not significant correlations. * = P≤ 0.05; ** = P≤ 0.01.
Shrew and rodent
captures correlated
with (across)
Number of
individuals
Number of
Species
New
species
added
Cumulative
species
Total, shrews (-0.290) -0.346* (-0.293) -
Total, rodents -0.421** 0.141 -0.252 0.969**
1950 m, shrews 0.141 - -0.605 -
1950 m, rodents -0.414 0.119 (-0.697) (0.605)*
2300 m, shrews -0.769* -0.408 -0.605 -
2300 m, rodents -0.341 -0.009 -0.491 0.796*
2650 m, shrews -0.275 0.605 -0.796* 0.605
2650 m, rodents -0.203 0.628 -0.611 0.900**
3000 m, shrews 0.351 - -0.725* -
3000 m, rodents 0.011 0.629 -0.605 0.941**
3600 m, shrews 0.644 0.408 -0. 408 0.612
3600 m, rodents 0.339 0.784* 0.000 0.980**

Publications and Manuscripts: Mt Meru mammals
192
Table 7. Product-moment correlation coefficients (r) between elevation and trap success.
Values in parentheses represent strong but not significant correlations.
Elevation correlated with (r) P
Total number of individual mammals collected (-0.75) > 0.05
Total trap success (-0.75) > 0.05
Total number of species collected 0.59 > 0.05
Total number of shrews collected -0.53 > 0.05
Shrew trap success -0.52 > 0.05
Total number of shrew species collected - -
Total number of rodents collected -0.62 > 0.05
Rodent trap success -0.61 > 0.05
Total number of rodent species collected 0.33 > 0.05

193
ACKNOWLEDGMENTS
I am grateful to the Wildlife Conservation Society (Tanzania) and Unique Safaris for
logistical support and to the Tanzania Commission for Science and Technology,
Ministry of Natural Resources and Tanzanian National Parks for permission to
conduct this research. Funding for fieldwork and DNA sequencing was provided by
the National Geographic Society (Grants 5053-93, 5244-94 and 5711-96), the Barbara
Brown, Ellen Thorne Smith and Marshall Field Funds of the Field Museum of Natural
History, and the National Science Foundation (DEB-1145251, DEB-1343517). E.
Gereta, I. Lejora, N. Mafuru, and L. M. Ole Moirana, were particularly supportive.
O. Mathayo, S. Temu and G. Ng’umbi all aided in fieldwork. R. Banasiak provided
important assistance with the figures. J. Esselstyn, S. Goodman, K. Helgen, K.
Howell and R. Hutterer offered valuable editorial advice. S. Goodman has been a
wealth of advice over the years of this work. This work would not have been possible
without the untiring efforts and friendship of M. Munisi and P. Kihaule. Finally,
Mary Anne Rogers stood (and stands) by me through thick and thin.

194
Hiermit erkläre ich an Eides statt, dass ich die vorliegende Arbeit selbstständig und
ohne fremde Hilfe nur unter Verwendung der angeführten Literatur angefertigt habe.
Signature
________________________
William Stanley
195
Erklärung zum Promotionsvorhaben Hiermit erkläre ich, dass ich zuvor noch keiner
Promotionsprüfung unterzogen wurde, sowie ich mich noch um keine Zulassung an
der Universität Hamburg bzw. einer anderen Universität beworben habe.
Weiterhin habe ich noch keiner Universität oder ähnlichen Einrichtung eine
Dissertation vorgelegt.
________________________
William Stanley

196
WAIVER
The manuscripts included as part of this thesis include taxonomic descriptions that are
part of a manuscript currently in press with the Zoological Journal of the Linnean
Society. Any names proposed in this thesis should not be considered official and will
be formally presented in the forthcoming publication in the Zoological Journal of the
Linnean Society.
William T. Stanley
19 February 2015