Necessity and Opportunity Entrepreneurs and their - DIW Berlin

Deutsches Institut für Wirtschaftsforschung
www.diw.de
Alena Bicakova • Eva Sierminska
Berlin, April 2008
Mortgage Market Maturity and Homeownership Inequality among Young Households: A Five-Country Perspective
778
Discussion Papers

Opinions expressed in this paper are those of the author and do not necessarily reflect views of the institute. IMPRESSUM © DIW Berlin, 2008 DIW Berlin German Institute for Economic Research Mohrenstr. 58 10117 Berlin Tel. +49 (30) 897 89-0 Fax +49 (30) 897 89-200 http://www.diw.de ISSN print edition 1433-0210 ISSN electronic edition 1619-4535 Available for free downloading from the DIW Berlin website. Discussion Papers of DIW Berlin are indexed in RePEc and SSRN. Papers can be downloaded free of charge from the following websites: http://www.diw.de/english/products/publications/discussion_papers/27539.html http://ideas.repec.org/s/diw/diwwpp.html http://papers.ssrn.com/sol3/JELJOUR_Results.cfm?form_name=journalbrowse&journal_id=1079991
Mortgage Market Maturity and Homeownership Inequality among Young Households: A Five-Country Perspective
Alena Bičáková1 and Eva Sierminska2
Abstract: This paper uses the newly constructed Luxembourg Wealth Study data to document cross-country variation in homeownership rates and the homeownership-income inequality among young households in Finland, Germany, Italy, the UK and the US, and relate it to cross-country differences in mortgage market maturity. We find that aside from Italy, homeownership rates and inequality in the four countries correspond to their mortgage take up rates and its distribution across income, reflecting the different degree of development of their respective mortgage markets. In Italy, alternative ways of financing, such as family transfers, substitute the limited mortgage availability and explains the second highest homeownership rate in our sample, despite the lowest mortgage take up. The mortgage market in the UK is the most open and the most equal, which leads to the highest and most equally distributed homeownership in this country as well. The mortgage market in Germany is on the other side of the spectrum with very low mortgage take-up rates and strong dependence of homeownership and mortgage take up on household income. Finland and the US are in-between. Counterfactual predictions suggest that although household characteristics play some role in explaining the variation in home ownership rates across the five countries, it is mostly the country specific effects of these characteristics determined by the institutional environment as well as the functioning of the housing and mortgage markets that drive the main result. JEL: D14, D31, G21, R21
Keywords: Homeownership, credit constraints, mortgage market
1 CERGE-EI, Prague, Czech Republic, email: [email protected]. 2 CEPS/INSTEAD and DIW Berlin; C/I, BP 48, L-4501 Differdange, Luxembourg,
email: [email protected].

2
1. Introduction
One of the more important decisions individuals make during the life-cycle is the
amount they wish to spend on housing services and whether or not to combine it with
ownership. Housing is a major component of both consumption and investment. It
absorbs a large portion of the household budget and in many countries it is the largest
item of households’ wealth portfolios.
This paper uses the newly constructed Luxembourg Wealth Study database to
document cross-country variation in homeownership rates and the homeownership-income
inequality in Finland, Germany, Italy, the UK and the US, and relate it to cross-country
differences in mortgage take-up rates and their distribution across income. As we explore
the role of mortgage availability in determining the observed variation in homeownership
rates, we focus our analysis on young households (18 to 40 years of age), who are the most
likely to depend on access to the mortgage market for financing their home purchases.
Homeownership among young households in these five countries exhibits wide variation.
It ranges from 21.4 % of homeowners in Germany to 63.9 % in the UK, with Finland (43.3
%), the US (47.9 %) and Italy (50.9 %) in between. In terms of mortgage financing, the
UK has the highest mortgage rate (62 %), followed by the US (43 %) and Finland (39 %).
Germany (19 %) and Italy (16 %) have much lower mortgage incidence than the other
countries under analysis, and are similar in this respect, which sharply contrasts with the
low homeownership rate in the first and high homeownership rate in the latter.
Based on our analysis, we find that the mortgage market in the UK is the most open
(in terms of mortgage take up) and the most equal (in terms of the distribution of both
homeownership and mortgage take-up across household income deciles). The mortgage
market in Germany is on the other side of the spectrum, with very low mortgage take-up
rates and strong dependence of homeownership and mortgage take up on household
income (high homeownership/mortgage income inequality). Finland and the US are in
between - both in terms of homeownership and mortgage take up inequality - with the
Finnish mortgage market and homeownership distribution somewhat more equal than in
the US. While it is possible that it is the high financial development of the mortgage
market that ensures high homeownership rates and wide mortgage availability in the US, it
is also the relatively small housing prices that lead to a similar result for Finland. The
ranking of the four countries according to homeownership rates and inequality more or less
3
correspond to their mortgage take up rates and its distribution across income, reflecting the
different degrees of development of the markets for housing debt.
The only country that does not fit the rankings is Italy. While it has a low use of
mortgages, similar to Germany, homeownership there is almost as high and equal across
income as in the UK. The data and qualitative evidence suggest that it is the alternative
sources of home ownership funding, namely transfers (and possibly loans) from family
(and friends) that substitute the highly underdeveloped mortgage market in Italy.
Our paper is organized as follows. First, we discuss the economic background of
our analysis and survey related previous research. We then describe the data, sample
characteristics and our methodology. This is followed by a comparison of housing and
mortgage market characteristics and institutions. The results section first documents
country-specific homeownership and mortgage take up rates and their distribution across
income, using simple summary measures and a full probability model of home owning
and having a mortgage. We then decompose the cross-country variation in
homeownership rates and mortgage take up rates driven by the differences in household
characteristics and by the differences in country specific housing and mortgage market
regimes (coefficients). A section discussing possible policy implications of our main
results follows the conclusions.
2. Economics of Homeownership
The standard economic theory suggests that what really matters for the current well
being (consumption or leisure) of the forward-looking utility maximizing household, is the
present value of the sum of the current household wealth and the expected lifetime income.
With perfect financial markets, where individuals can borrow against their future earnings,
the distribution of the current consumption (and asset holdings) reflects the “overall”
economic inequality in a population, as given by the present value of lifetime resources.
This is not the case when there are liquidity constraints: two households that are at the
beginning of their career and have the same expected lifetime resources - one with higher
initial assets but a flatter labor income profile, the other with lower initial assets but higher
expected future earnings - are no longer economically equal when measured by current
consumption or asset holdings. In this paper, we explore to what extent access to credit
markets helps explain homeownership inequality among young households.
In many countries, homeownership is identified as the preferred form of living
arrangement and receives preferential treatment over renting, for example, in the tax code.

4
However, homeownership does not necessarily have to be preferable to renting. Individuals
may prefer not to carry the risks and costs related to owning their homes. Owning one’s
home may also decrease mobility and migration, and limit employment opportunities. On
the other hand, homeownership is the principal means by which households accumulate
wealth, at the same time providing a flow of services. As a major private asset, housing
may also serve as source of financial security and income during retirement. When
compared to other forms of housing, homeownership seems to bring higher housing
satisfaction across individuals in several European countries (Diaz-Serrano 2006). It is also
considered an important signal of social status and economic success (Constant, Roberts
and Zimmermann, 2007). Unless households have accumulated enough savings or have
access to informal loans, the ability to purchase homes is determined by access to formal
credit, in this case, mortgage availability.
The cross-country variation in homeownership may reflect country-specific
personal preferences (possibly affected by cultural and historic traditions) for owning a
house, for investment in equity or for mobility. The decision whether to own a home and
when, is often related to the decision about marriage and child bearing. As the
characteristics of the young differ across countries - in terms of demographic and human
capital characteristics (such as family structure and schooling) – the household formation
and therefore the need for one’s own home vary as well. There are also cross-country
differences in economic characteristics of the young households (such as distribution of
income and wealth). Relative cost of home-owning and renting also varies substantially
across countries, which is another factor that affects the decision to own one’s home.
Finally, the observed variation may be driven by the differences in access to funds, namely,
the access to credit: other things being equal, we would expect in countries with less
developed credit markets and lower mortgage availability, lower homeownership rates,
strong homeownership dependence on income and high homeownership-income inequality
among the young.
Our analysis does not make any explicit assumptions about which of the factors
dominate. From the most conservative point of view, we document the homeownership
and mortgage take up rates and their distribution across income, regardless whether the
observed patterns reflect preferences or constraints. Although we proxy some of the
factors mentioned above, which drive the demand for home ownership, with observable
household characteristics, and carry the estimation separately by each country, we are not
able to control for any unobserved attitudes towards homeownership that vary with
5
income. We also survey the cross-country differences in institutions affecting housing
and mortgage markets and discuss them in the light of our findings in a separate section.
When interpreting our results we treat homeownership as the preferred housing
arrangement, and consider the non-home-owning households as credit constrained. This
assumption allows us to interpret the cross-country differences in homeownership-
income inequality as driven by the cross-country differences in the access to funds,
namely mortgage finance. We discuss the validity of this assumption when surveying the
country-specific housing market characteristics and institutions, in particular the existing
alternatives to home-owning.
3. Previous Research
Past literature on the demographics of homeownership has conventionally identified three
main factors affecting tenure choice: permanent income, the cost of owning relative to
renting, and household characteristics. In recent literature credit access has been brought
to the forefront as one of the key determinants of homeownership. Chiuri and Jappelli
(2003) is one of the first attempts to account for age differences in homeownership across
countries as a result of cross-country variation in access to credit. The paper concludes
that the availability of mortgage finance, as measured by down payment ratios, mortgage
equity withdrawal or reverse mortgages, affects the distribution of owner occupancy rates
across age groups including the young. Unlike our study, their analysis lacks micro-data
on mortgage take-up rates, and therefore, down payment ratios are used as indicators of
mortgage availability. The paper finds that in countries with developed mortgage markets
the home ownership profile is significantly tilted towards the young. In single country
studies, such as Ortalo-Magne and Rady 1999, access to mortgage credit is also found to
be crucial to increase in homeownership in the UK in the 1980s. Equally, when Chiuri
and Jappelli (2007) study homeownership trajectories for old age groups, they find that
across countries these are highly correlated with the degree of mortgage market
regulation.
A number of studies have also examined homeownership by race and by family
types. Here again, the main barriers that stand out in purchasing a home are wealth,
income and credit constraints (Bostic, Calem and Wachter 2004). Quercia, McCarthy
and Wachter (2003) identify that in the US populations associated with such constraints
are those with lower incomes, city residents and the young. Sedo and Kossoudji (2004)
examine homeownership by family types in the US and find that increases in income are
6
more important to homeownership at lower income levels than at high income levels for
each family type. Age, like income also exhibits a concave shape in all family types.
Overall, they find that the impact of householder’s characteristics on the probability of
owning a home is similar for all the householders, regardless of gender and family type.
When doing counterfactual predictions they find that each householder regardless of race
and sex have the highest predicted probabilities of home ownership if they were to have
coefficients form a married couple household. Marriage appears to be powerful enough to
stimulate demand for housing and alter mortgage lenders decisions, or change behavior in
a way that is more compatible with home ownership.
This also indicates that the most important aspect of the homeownership gap that
exists across gender and family type is family type itself. It is not clear whether behavior
on the part of the household or behavior on the part of mortgage lenders (or both) is the
culprit. Combine this with limited credit availability and credit market development
across countries and we find that the highest homeownership among young couples is the
most prevalent in countries where there is the highest rate of married couples among the
young or credit markets are very well developed.
Bostic and Surette (2001) find that in the 1990s differences in homeownership
between minority and non-minority families and between middle-income and lower-
income families declined significantly. Additionally, changes in family-related
characteristics explain homeownership trends only among the top two income quintiles.
Their results suggest that favorable changes in mortgage and housing markets and
changes in the regulations that govern those markets and have facilitated credit access
help explain the increase in homeownership among lower-income families.
Di and Liu (2005), on the other hand, examine the importance of wealth and income on
homeownership over time in the US and their effect on different racial groups. Their
findings suggest that the proliferation of mortgage products that allowed for low down
payments in the late 1990s may have contributed to a reduction in the importance of
wealth for achieving homeownership and they do not find a reduction in the importance
of income, despite the fact that allowable ratios of debt-to-income have increased. Other
studies have consistently found that wealth and to a lesser extent credit constraints are
more important than income constraints in limiting access to homeownership (eg.
Barakova, Bostic, Calem, and Wachter 2003); others also point to the cost of owning
relative to renting as a significant determinant (Haurin, Hendershott and Wachter 1997).
7
Another issue encountered in the literature on homeownership is the fact that
there exists differential household formation across countries. Chiuri and Jappelli (2003)
outline the problem of the Italian and Spanish young adults that tend to live with their
parents well beyond the age of 25, due to higher unemployment and greater difficulty of
having independent living arrangements. Martins and Villanueva (2006) examine
whether differences in household structure can be traced back to restricted credit access
for the young and find that access to a mortgage loan increases the probability that a
young adult creates her/his household by between 31 and 54 percentage points in
Portugal. A similar argument may also possibly explain the relatively older age of young
households in Italy. Combining their estimates with cross-country data, they establish
that differences in the availability of credit can explain up to 20% of the cross-European
variance of nest leaving.
4. Data and Descriptive Characteristics
To analyze the impact of credit market development and mortgage availability on
the differences between the distributions of homeownership across income we use the
Luxembourg Wealth Study (LWS). This is a new project within the Luxembourg Income
Study (LIS).3 The LWS database contains harmonized wealth and income data from ten
industrialized countries. The primary goal of the project has been to assemble and to
organize existing micro-data on household wealth into a coherent database, in order to
provide a sounder basis for comparative studies on household net worth, portfolio
composition, and wealth distributions. It is the first cross-country comparable dataset,
which includes information about households’ assets and liabilities, necessary to identify
homeownership and mortgage take-up, as well as expenditures and income and a range of
other demographic and economic characteristics of the households. For more details see
Sierminska, Brandolini and Smeeding (2006a, 2006b) and consult the LIS website.
Detailed information about different types of debt (home-secured, non-home-secured,
informal debt) also allows us to identify the cross-country differences in the role of
informal credit, and to what extent this provides a substitute to the official credit, when
credit markets are underdeveloped.
3 LIS is a cross-national archive of harmonized datasets from the industrialized countries, which include income data at the household- and person-level, as well as extensive demographic and labor market data. Currently, the LIS database includes over 160 datasets from approximately thirty countries, covering the period 1967 to 2004. More information is available on the LIS website (http://www.lisproject.org).
8
In this paper, we include five countries from the period of 1998-2002. These
countries include two Anglophone countries, the United States (US) and the United
Kingdom (UK); two continental European countries, Italy and Germany; and one Nordic
country Finland. These countries have diverse economic outcomes and varying housing
and mortgage systems.4 In all countries considered the data period of analysis falls
during a time of positive house price growth, particularly in Finland, Italy, the UK and
the US (Consult Appendix Figures A.2-A.6 for details). In Germany the change in house
prices has been more moderate and not as strikingly positive.
Sample and Sample Selection
We select households, where the head and spouse are between 18 and 40 years
old and are not students. We exclude extremely rich individuals that are defined as
having financial assets greater then the 95th percentile of the distribution of financial
assets.
The sample data for the US and Germany has undergone multiple imputation
and consists of 5 replicates of the original data. Consequently, since the five implicates
would be treated as independent observations and correspondingly inflate the reported
significance of results5 we have corrected the standard errors for multiple imputation.
Sample Descriptives
Table 1 shows the differences in homeownership in our sample of young
households, ranging from 21.4 % of homeowners in Germany to 63.9 % of homeowners in
the UK, with Finland (43.3 %), the US (47.9 %) and Italy (50.9 %) in between. In terms of
mortgage financing, the UK has the highest mortgage rate (62 %), followed by the US (43
%) and Finland (39 %). Germany (19 %) and Italy (16 %) have much lower mortgage
incidence than the other countries under analysis, and are similar in this respect, which
sharply contrasts with the low homeownership rate in the first and high homeownership
rate in the latter. Comparing the homeownership and mortgage take-up rates, we see that
homeownership in four of the countries is mostly driven by housing loans. In Italy, home
purchases by young households are much less mortgage dependent, which suggests that
there exist alternative ways of obtaining homes other than mortgage and these compensate
4 The original datasets that the LWS project harmonized, and that are included in this study, are: for the United States, the 2001 Survey of Consumer Finances (SCF); for the United Kingdom, the 2000 British Household Panel Study (BHPS); for Italy, the 2002 Survey of Household Income and Wealth (SHIW); for Germany, the 2002 Socio-Economic Panel Study (German SOEP); and for Finland, the 1998 Wealth Survey. 5 The imputation procedure is described in Kennickell (1998).
9
for the low mortgage availability. Past studies, have indicated that strong, intergenerational
transfers (homes passed down from generation to generation or new homes bought for the
young by their parents) provide a substitute for the limited supply of housing loans, with
the result of homeownership rate among young households being comparable to those in
countries with highly developed mortgage markets. 6 (We also find this relationship for the
whole population. See Appendix Table A.1)
Table 2 compares the country-specific datasets of young heads of household in
terms of the key variables used in the analysis. The first set of factors that we assume to
have an effect on homeownership, are demographic characteristics of the household.
Young household heads are substantially older in Italy, and also somewhat older in the
UK and Germany, when compared to the US and Finland. Besides the different
demographic structure of the various populations, this may also reflect the propensity and
timing of young individuals to leave home and form their own household. Such a
decision is likely to be influenced by the situation on the labor market, housing market
and also access to credit (Martins and Villaneuva 2006). In Appendix Figure A.1 we find
the distribution of households across ages. The probability of forming a household varies
a great deal across countries for the young and then for the older individuals.
In Italy individuals form households at a similar level as their counterparts in
other countries in their thirties. The highest share of young households can be found in
Finland followed by the US, Germany and the UK. We do not address the potential
selection of the individuals to the samples of young heads, but we survey the typical
country specific characteristics of young households in their respective populations in
section 6.1.
The cross-country differences in the distribution of young household heads across
the three education groups capture both the varying achievements of the national
educational systems but may also suggest the limited comparability of the educational
systems across countries. It suggests that there is substantially higher proportion of low-
educated and substantially lower proportion of high-educated in Italy and in the UK,
when compared to the rest of the countries. Household heads in Italy are more likely,
while the ones in Germany are less likely to form couples compared to the other three
countries.
6 In Italy, for instance, Guiso and Jappelli (2002) find that inter vivos transfers and bequests play a considerable role in home purchases, particularly in the case where there are credit market imperfections. Haliassos et al (2006) also find this strong cultural effect for Cyprus.
10
Similar to headship, both marital status and children may be endogenous to the
factors we are focusing on, in particular, to the situation in the housing market and
mortgage availability. We discuss this issue later in the text. Young heads in Germany
and Finland have fewer children younger than 15, compared to the US, the UK and
Italian heads. The former two countries thus also form smaller households compared to
the rest.
Self-employment and entrepreneurship and home ownership are also interlinked,
although the effect may go in both directions. The self-employed, who typically have
less certain and more volatile income may either prefer renting to homeownership, or
may be denied mortgages for that reason, and therefore credit constrained – excluded
from the market. On the other hand, entrepreneurial activities may often be own-home
dependent and positively related to housing tenure. In our sample, 30 % of the young
households in Italy7 are self-employed, 12% and 11 % in the UK and Finland, and less
than 10 % in Germany and the US.
Having other (unsecured / consumer) debt may reflect both the willingness to take
on the risks of borrowing on the one hand (demand) and the development of credit
markets in general (supply) on the other. At the same time, it may capture the economic
condition and the degree of credit constraints. Finally, individuals with mortgages may be
less willing to add other forms of debt to their housing debt. Consistent with the credit
market development story, the proportions of young households with other debt is much
lower in Italy and Germany than elsewhere, with the highest proportion in the US. We do
not find any striking differences among homeowners and non-homeowners holding other
debt, except for the Italian renters and US homeowners. About 10 percentage more of the
Italian renters and US homeowners, hold other debt then their home-owning and renting
counterparts, respectively.
When we compare the key characteristics of young home owners and non-owners,
we find, consistently with our expectations, the first group of heads to be older, more
educated, married, have more children and a bigger household size than the heads who do
not own their homes. Homeowners also have higher disposable household income, and
wealth in terms of the financial assets. Considering that typical mortgage down payments
are in the range of 20-30% of home values we could expect homeowners to have less
7 The definition of self-employed household indicator is that either the head and/or spouse is self-employed.
11
liquid assets compared to those that have not purchased their homes (yet), ceteris paribus.
In addition, in all countries, young homeowners are more likely to be self-employed,
compared to renters. (Results are available from the authors upon request.)
5. Methodology
We start our analysis by documenting the cross-country variation in
homeownership rates and homeownership-income inequality among the young, and then
we link it to mortgage take-up, mortgage availability, alternative sources of
homeownership financing, and credit constraints of the young across the five countries
under analysis. We first focus on cross-country differences in homeownership rates. We
then analyze the relationship between home ownership and income, looking at the
distribution of home owners across household income deciles. We develop several
measures of homeownership-income inequality, such as homeownership in the lowest
decile, various ratios of homeownership rates across deciles (the ninth to the fifth, the ninth
to the first, the fifth to the first), and the rank of the first decile in which the home
ownership rate exceeds half, and the cross country average, then we compare these
measures across countries.
Next, we take into account the observed heterogeneity across different
households, and estimate for each country separately a probability model of
homeownership as a function of income, while controlling for other factors, such as age,
education, family structure, presence of children, self-employment status and so on. We
follow two specifications regarding the household income variable: first, the logarithmic
function of household income, second (more flexible), the ten binary indicators reflecting
the household income decile. The coefficient of the logarithm of income and the
coefficients of the ten (nine with a constant) binary variables provide us with further and
improved measures of homeownership-income inequality. We present the cross-country
differences in the marginal effects of income variables on homeownership of the country-
specific representative households, as well as the differences in the marginal effects of
income variables for the same representative household across different countries, to
document what drives the observed cross country variation in these effects: either it is
due to the underlying distribution of endowments (income) and other factors, or due to
the differences in the relationships between income and homeownership.
We further explore this issue as follows: we predict cross-country counterfactual
homeownership rates using the population (sample) of one country and the estimated

12
coefficients from the other. The pair-wise cross-country comparisons allow us to identify
whether it is the differences in the characteristics of the country-specific populations or
the differences in the country-specific effects of these characteristics on homeownership,
that drive the cross-country variation in homeownership rates. This procedure is similar
in nature to the Oaxaca-Blinder decomposition, when applied to binary outcome models.
As it is the case for the Oaxaca-Blinder decomposition, while the procedure is useful for
identification of the two components of homeownership rates, it fully ignores any
causality between them, i.e. the fact that the distribution of the characteristics may reflect
their impact and vice versa. However, the question of causality cannot be addressed with
data available for each country only for one point in time.
After providing a thorough cross-country comparison of homeownership-income
inequality, we explore to what extent the observed variation in this inequality may be a
result of cross-country differences in credit market development and mortgage availability.
First, we look at cross-country differences in mortgage take-up rates among the young (18
to 40 years of age) and explore what percentage of owned homes is funded through
mortgages. Next, we document the distribution of mortgage take-up rates across household
income deciles and estimate a probability model of mortgage take-up. We control for
financial wealth as well as for the risk aversion concerning the willingness to borrow by an
indicator of whether a household has any other debt except for mortgage.8 The marginal
effects of income on having a mortgage and the predicted counterfactual homeownership
rates complement our previous findings and indicate to what extent mortgage take up
explains the documented cross-country variation in homeownership among young.
6. Housing market characteristics
6.1. Home ownership, mortgage, home value, home equity and housing affordability
across the population
Next we look in more detail at the housing market and examine homeownership,
mortgage, home value and home equity for the whole population and our sample of
young households. We compare a cross-section of age profiles of these variables across
countries. We use a smoothing technique, which regresses homeownership on a third-
order age polynomial.
8 As discussed later, this coefficient may also reflect other factors than just risk aversion towards debt.
13
First, we discuss differences in homeownership for the young and across countries
found in Figure 19. We find similar results to our descriptive statistics in section 4.
Among the young in our sample homeownership in Germany is the lowest in relation to
the other countries. The highest homeownership among the young is in the UK.
Next, we examine the role of mortgage funding in homeownership (Figure 2). As
previously indicated homeownership among young households in Italy does not depend
on mortgage availability to a great extent and this is true at different ages. The highest
mortgage take-up is in the UK and the US. Mortgages are also the biggest source of
financing in these two countries (Figure 3). They provide about 80% of the funding for
young homeowners in most countries and about 20% in Italy. This country is quite
unique in having low debt and low mortgage take-up.
Next, we look at home values. In Table 3a we find them to be the highest on
average and at the median in Germany, the UK, Italy, the US and Finland for the whole
population. For the younger population the ranking is similar, with Italy moving to
second place indicating that young homeowners in Italy own relatively more expensive
homes across countries compared to the whole population.10 One must not forget that
even though Germany exhibits high home values, homeownership is only 20% versus
51% among the young in Italy. It may be the case that low home ownership in Germany
is the result of high housing prices or due to selection – across income - only the very rich
own their homes – and they purchase expensive homes.
Home value is interesting in its own right as it can be used as a measure of long-
run potential wealth. Home equity on the other hand is a good indicator of current wealth
as housing is the main wealth portfolio component. In the whole population, the highest
home equity is observed in countries with the lowest debt, in Germany and Italy, then in
the UK, the US and Finland measured both by the mean and median. Among the young
population we find a re-ranking among countries with the highest value of home equity.
Italy has the highest home equity for the young followed by Germany, the UK, the US
and Finland. Big gaps between home values and home equity are present in the UK and
the US particularly for the young due to high loan take-up. In most countries we note the
9 A detailed discussion of differences by age can be found in Bicakova and Sierminska (2007) and for the elderly in Chiuri and Jappelli (2007) 10 This fact is confirmed in Guiso and Jappelli (2002) whose estimates indicate that young adults stay longer with their parents and as a result shorten the saving period before home ownership and increase the value of the house purchased.
14
existence of negative home equity values indicating either a decline in home values since
the purchase date (less likely since data is based on a self-assessed current value and
collected during periods of home values appreciation), or the ability to take additional
loans using home as collateral (this could be the case in Finland and the UK, where
mortgage information is combined with other housing debt).
Home debt for the whole population is the highest in the US, UK, Germany,
Finland and Italy. Among the young it is a very important component of home equity in
Germany, the UK, the US, Finland, and Italy.
Home affordability is also an important characteristic of a countries housing
market. We proxy for this, by examining home value-income ratios. We divide the
income distribution into quantiles and within these quantiles calculate mean and median
home values and incomes for homeowners. The ratios of these values are presented in
Table 4. First, we find that the housing wealth/income ratios diminish for all countries as
we move up the income distribution. Second, the rankings across countries in terms of the
highest home value to income ratios are quite consistent across the quantiles with
Germany and Italy exhibiting the highest ratios (being the least affordable), followed by
the UK, the US and Finland. The highest ratios are in countries with the highest home
values and lower incomes, the lowest where there are lower incomes and low home
values. The wealth-income ratios are quite similar in all countries for the top quantile.
6.2. Institutions
Homeownership is substantially affected by the country-specific institutions and
various market regulations. We next discuss the main institutions that affect housing and
mortgage markets in the countries under analysis and discuss the implications they are
likely to have in explaining the documented homeownership and mortgage take-up
differences.
The tax system has a substantial impact on the incentives to purchase a home, to
finance the purchase through a mortgage, as well as an impact on transaction costs related
to housing turnover, i.e. the conditions of buying and selling one’s home. In addition to
the general wealth and property taxes, there are taxes and implicit tax treatments that
directly affect homeownership. Compared to other forms of housing, homeowners benefit
from not paying rent and from increases in the value of their homes. The neutral tax
treatment implies that imputed rent be taxed as additional income and capital gains (i.e.
home value appreciation) be subject to capital gains tax. This is, however, rarely the case,
15
suggesting that most of the tax system implicitly favor homeownership over renting. In
addition, in some cases mortgage interest payments are fully deductible.11
As reported in Table 5, in general imputed rents are not taxed in the countries
under analysis with the exception of Italy, for the case for principal owner-occupied
dwellings. Capital gains on housing assets are taxable in all five countries, but most of
the principal homes of long term homeowners are exempt from this tax. The only
exception once again is Italy, where while the owner-occupied homes are not exempted,
they are subject to 50 % of the value. There are differences across countries in the
definition of the long term occupancy, ranging from more than 2 years ownership in
Finland and the US12 to 10 years in Germany. In the UK, all owner-occupied homes are
exempt from the capital gain tax. Mortgage interest payments are tax deductible in
Finland, Italy and the US but there is no tax relief on the interest payments in Germany
and the UK.
In this paper, we focus on the degree of development of the mortgage market as a
crucial determinant of homeownership. Mortgage market maturity depends on the general
legal environment (such as the contract enforcement, judicial efficiency, collateral and
bankruptcy laws), and on credit information availability and information sharing on one
hand, and on the direct mortgage market regulations on the other. More specifically, the
first three rows of Table 5 referring to enforcing contracts, report the number of
procedures from the moment the plaintiff files a lawsuit in court until the moment of
payment, the time in calendar days required to resolve a dispute, and the cost of court
fees and attorney fees expressed as a percentage of debt. According to all three criteria, in
Italy, contract enforcement is by far the most difficult among the five countries. Germany
follows, in terms of the number of procedures, time and then the direct cost. The rest of
the countries fare similarly well, with Finland having more procedures but the lowest
cost, while the UK and the US exhibit the opposite.
In the next section of Table 5 on getting credit, the legal rights index measures the
degree to which collateral and bankruptcy laws protect the rights of borrowers and
lenders and thus facilitate lending. The index includes 7 aspects related to legal rights in
collateral law and 3 aspects in bankruptcy law. The index ranges from 0 to 10, with
higher scores indicating that collateral and bankruptcy laws are better designed to expand
11 In our case, this applies to landlords in Finland and in the US. 12 This was the case in the US until 2002.

16
access to credit.13 The legal environment is the most favourable to lending in the UK,
then Germany, the US, Finland and finally, again the least favourable in Italy.
The next three rows indicate the coverage, scope, quality and accessibility of
credit information available through public and private credit registries. Credit
Information Index ranges from 0 to 6, with higher values indicating the availability of
more credit information.14 Credit information is somewhat less available in Italy and
Finland than in the other countries, in terms of both the index and the coverage. The
index of mortgage market regulations in a straightforward manner ranks the countries
from Italy with the most regulated mortgage market, followed by Germany and Finland,
to the US and the UK with the most deregulated mortgage market.
The mortgage market characteristics are consistent with the analyzed institutional
and regulatory environments. Mortgage market development, as measured by overall
mortgage take-up, and the dependence of mortgage on household income, closely
corresponds to the degree of mortgage market regulation in the five countries: countries
with the most regulated mortgage markets such as Italy and Germany have the least
developed mortgage markets.
In the five countries we analyze, one clear pattern emerges from the institutional
information that we survey: the legal as well as regulatory environment in Italy are by far
the least favorable for the development of the mortgage market, while those in the UK are
the most supportive. While the legal institutions and information sharing possibly
facilitates lending in Germany, the strong mortgage market regulations work in the
opposite direction.
Less regulated markets are likely to be more competitive and offer greater variety
and flexibility. As regards to collateral requirements and the mortgage length, reported in
Table 5, the typical loan to value ratio and the duration ranges from 78 % and 30 years in
the US, to 55 % and 15 years in Italy. The mortgage market completeness index describes
the supply side of the mortgage markets both in terms of the range of products offered,
the choice of the alternative repayment schemes and the period over which interest rates
are fixed. It also contains information on the typical age, income and economic status of
the borrowers that are granted mortgage. The much lower value of the index for Italy and
13 See Appendix for details. 14 See Appendix for details.

17
Germany (57 and 58 respectively) suggest a rather limited supply of mortgages when
compared to the UK (value 86).15
The aggregate housing and mortgage market characteristics reported in the last
two rows seem to be consistent with the institutional environments described. The
aggregate homeownership rates follow the same ranking as the share of residential
mortgage debt in GDP and also correspond to the legal and regulatory conditions in the
five countries. The UK with the most favorable and the least regulated conditions has the
highest homeownership rate of 69 % and the 64.4 share of debt in GDP, whereas
Germany with one of the most regulated and least developed mortgage markets has the
lowest homeownership rate of 42 %. The only country for which the homeownership
rate does not correspond to its mortgage take up ranking is Italy. While Italy, with the
most regulated mortgage market and least favorable conditions has indeed the lowest
share of debt in GDP of 11.4 %, it has the highest occupancy rate of 80 %. This finding is
consistent with our aggregate figures for the young households. It confirms that in Italy
housing is fairly independent of the mortgage market, due to other means of home
acquisition such as family transfers and passing of the property from generation to
generation.
In the policy section of the paper we also discuss to what extent other institutions,
such as labor market regulation and housing subsidies can be related to the observed
cross-country differences in homeownership. For example, employment protection and
the variation in the length of the employment contracts of the young individuals are likely
to affect the decisions of credit institutions to grant a mortgage.
7. Results
7.1. Distribution of Homeownership across Household Income Deciles
Next, we look at the variation of homeownership across the income distribution. In Table
6a we find a wide variation of rates within countries. The biggest range is in Finland
(from 9% in the lowest decile to 90% in the highest) and the lowest in Italy (from 40% in
the lowest decile to 74% in the highest). In all countries—although within a 30
percentage point difference -- we find the highest homeownership in the top decile. The
highest rate is in the UK (92%) followed by Finland (90%), the US (87%), Italy (74%)
and Germany (60%).
15 Unfortunately, comparable index is not available for Finland and the US.
18
In the same Table, we next identify at which stage in the income distribution the
probability of becoming a homeowner exceeds 50%. This is highlighted with the light
shading. As expected this occurs fairly early in the income distribution in a country with
high ownership rates (the UK) and fairly late in the distribution in a country with low
ownership rates (Germany). For the other countries this occurs in the 6th decile. We also
determine when the probability of ownership exceeds the country average. This happens
in the 4th decile in Finland and Italy and in the 6th decile in the other countries.
Next, we examine whether the mortgage take-up among homeowners is evenly
distributed across the income distribution. An even mortgage distribution would suggest
that credit constraints are not binding, as access to credit is not limited by the current
income. In Table 6b, this is found to be the case in the UK, where mortgage take-up is
nearly 90% throughout the income distribution. In the other countries there is more
variation in the mortgage take-up, but in all countries except Italy it exceeds 80% past the
3rd and 4th decile. In all countries mortgage take-up increases as we move up the income
distribution. Italy is the only country where this is not the case and there is a lot more
variation.
To examine homeownership profiles across the income distribution for the whole
population (Figure 4), we use a smoothing technique, which regresses homeownership on
a third-order indicator for income percentiles Finland has the steepest profile and Italy is
at the other extreme with the flattest profile throughout the income distribution. In terms
of homeownership rates the highest are in the UK and the lowest in Germany at nearly all
percentiles. This closely resembles the results for the younger population only.
7.2. Homeownership-income inequality measures
In order to pin point the differences in the distribution of homeownership across income we
reach for a few summary inequality measures. First, we look at decile ratios for
homeownership. As can be seen in Table 7a, the highest differences between the 90th and
10th percentile are in Germany, Finland and the US. In Finland and the US more of the
differences are taking place between the bottom decile and the median then between the top
decile and the median. In Germany and the other countries it is more or less evenly
distributed between the top and the bottom of the distribution. The inequality rankings in
mortgage holdings follow those in homeownership. The only difference is that a majority
of the inequality is taking place at the bottom of the distribution, where there is bigger
homeownership variation across the income deciles compared to the top half of the income

19
distribution. For homeowners the inequality in mortgage holding is more or less evenly
distributed across the top and bottom of the distribution in all countries except Italy. Here
we find more variation among homeowners in the bottom half of the income distribution.
Next, we estimate several probit probability models of homeownership, mortgage
and mortgage financed homeownership as a function of log of income to find out in which
country the effect of income is the strongest. The results in Table 7b indicate that the effect
of income on homeownership and mortgage is the strongest in Finland, Germany and the
US. The strongest effect of income on mortgage for homeowners is in the US, followed by
Germany, Finland, the UK and Italy. The low coefficient in Italy supports the fact that
homeownership in this country relies on other means of financing besides mortgages.
7.3. Conditioning on other factors - Marginal effects
In the previous sections, we have focused on the homeownership and mortgage rates and
how they are related to household income. We next take into account other household
characteristics to control for other aspects of the probability of home ownership, namely
household preferences. We estimate a full probit model of the probability of home
ownership and mortgage respectively, as a function of several demographic and economic
characteristics of the household, as well as a set of binary indicators for household income
deciles. Once again, we are primarily interested in the differences in homeownership and
mortgage rates across the income deciles.16
Most of the effects of the demographic characteristics are similar across countries
and in line with our expectations. Couple, households with children below 15 years of age,
as well as larger households have a larger probability of being homeowners (with only a
few exceptions in which case the effect is negative but always not significant). The
probability of homeownership increases with age but in a decreasing way and the effect is
often not significant. The insignificance of some of the demographic variables may also be
caused by the substantial homogeneity of our sample of the young.
Education increases the probability of owning ones home. The self-employed are more
likely to own their homes, particularly in Finland, and except for Germany where the effect
is not significant. Having financial assets greater than 3000 EUR is associated with a higher
probability of homeownership in all countries. Interestingly, having other (unsecured)
consumer debt decreases the probability of homeownership everywhere except in the US.
16 Both probit regression output and marginal effects are available from the authors upon request.
20
The key effect of interest – the marginal effects of being in income decile n rather
than in the first income decile - are presented in Figure 5 (and Appendix Table A.2a). The
magnitudes of the coefficients signify the increase in homeownership probability relative to
the first income decile. The slopes of the lines reveal the inter-decile differences in home
ownership.
Controlling for individual specific characteristic reveals that homeownership is
distributed most unequally in the US and Germany, although other deciles are closer to the
first income decile in Germany compared to the US. Finland comes next; while Italy and
the UK have homeownership most evenly distributed across income. When we perform a
similar exercise for the probability of having a mortgage, the results are fairly similar (See
Figure 6 and Appendix Table A.2b). As expected, the differences between all deciles (but
in particular between the first decile and the rest) increase for most of the countries, as
home-ownership sponsored by other funds (such as private transfers) less dependent on
income than mortgages are ruled out. In addition, in two countries, Italy and Finland,
although homeownership probability is highest in the very top decile, the mortgage
probability is smaller than in the ninth decile, possibly suggesting that individuals with
very high income have also greater access to other resources (wealth, private transfers)
when becoming home owners.
7.4. Decomposition of the Key Determinants -Counterfactual Predictions
Finally, we try to identify the cross-country differences in household
characteristics (right hand side variables) from the cross-country differences in the effect
of these characteristics (coefficients and marginal effects), in order to reveal how the two
of them contribute to explaining the cross-country variation in home ownership and
mortgage rates. We simulate counterfactual predictions of the home ownership rates and
mortgage rates, using household characteristics from one country and combining them
with coefficients - estimated in the full probit model – from another country. The results
are found in Table 8a and 8b. The rows correspond to the household characteristics from
the country specified in the first column and the columns correspond to the respective
sets of country-specific coefficients, with the exception of the first column that gives the
actual homeownership rate in each of the countries for comparison. The fit of our models
can be read from the table by comparing the true value with the corresponding cell where
household characteristics and estimated coefficients from the same country are combined,
yielding the prediction of the model.

21
First, we observe, that although the UK has the highest actual home ownership
rates, it is the household characteristics in Italy that lead to the highest predicted
counterfactual rates when combined with coefficients from other countries. In other
words, Italian household have the highest predicted home ownership regardless in which
countries (environments, institutions, mortgage markets and housing markets) they are.
US households come next (except in Germany), while the ranking of the UK and the
Finish households alternate. German households, on the other hand, have the lowest
predicted home ownership rate everywhere except for Germany.
In terms of the effect household characteristics have in different countries, as
reflected by the estimated coefficients, we find that the predicted homeownership rates
are the highest in the UK for households from all five countries. It is interesting to
observe, that it is Finland that follows. It is the “unfavorable” ranking of the
homeownership-enhancing household characteristics in Finland (compared to other
countries) that is responsible for the observed Finish home ownership rate ranking only
fourth. In terms of the environments and institutions, Finland ranks as second. The
opposite holds for the US, where household characteristics are more favorable, while
regime ranks as third or fourth. Germany is at the other end of the spectrum: no matter
what the household characteristics are (irrespective of the country), any of the five
samples reaches the lowest homeownership rate in Germany.
In addition, it is interesting to notice that in the case of Germany, favorable
household characteristics do relatively better in unfavorable regime, as German
households rank second in Germany after Italy.
To summarize, we find that while it is the Italian households that are –in terms of
their characteristics - most likely to own their homes, it is in the UK where the regime is
the most favorable. In Germany, both household characteristics and the regime is the
least favorable. While household’s characteristics in Finland are relatively less favorable
than in the US, Finish regime fares better than the one in the US, so the ranking of the
two countries vary in these two respects. The regime in Italy on the other hand is
comparable to that of the US, and fares better for Finish and German households but
worse for the US and the UK.
We conclude that although household characteristics play some role in explaining
the observed (and predicted) variation in home ownership rates across the five countries,
it is mostly the country specific effects (market evaluations) of these characteristics
determined by the institutional environment as well as the functioning of the housing and
22
mortgage markets that drive the main result (i.e. the observed ranking of the five
countries).
Next, in Table 8b, we look at the respective roles of household characteristics and
country specific regimes in the variation in the mortgage rates. Interestingly,
characteristics of the Italian households again yield the highest mortgage rates despite the
fact that Italy has the lowest actual mortgage rate among the five countries. The ranking
of the other countries in terms of the effect of different household characteristics is also
the same as for the home ownership rate. In terms of the regimes, the UK coefficients are
again the most favorable. The second most favorable regime is again in Finland, but the
unfavorable household characteristics bring the country in the ranking of the actual
mortgage rate behind the US, where the regime and the characteristics rank again in the
opposite way than in Finland. The Italian regime however is now the least favorable to
the mortgage take up, followed by the German one. To summarize, with the exception of
the Italian regime, the results in the last two tables give similar answers.
8. Conclusion
This paper uses the newly constructed Luxembourg Wealth Study Database to
bring detailed evidence on homeownership and homeownership-income inequality
among young households in Finland, Germany, Italy, the UK, and the US. We explore
the role of mortgage finance in the cross-country variation in homeownership among
young households and in the distribution of homeownership across their income. We find
that, with the exception of Italy, where family transfers substitute the limited access to
credit, the observed patterns of homeownership among young are mostly driven by
mortgage take-up as the primary source of finance for a home purchase. Our results show
that countries with mature mortgage markets, such as the UK, have higher
homeownership rates and lower homeownership-income inequality among young
households than countries with less developed mortgage markets such as Germany. Even
in countries with highly developed mortgage markets, like in the US, homeownership and
mortgage availability among the lower income deciles are limited (homeownership rate is
distributed more unequally), compared to the UK or Finland. Policies supporting home
ownership among young households may then need to target specifically the low-income
groups.
Our findings suggest that in four out of the five countries, mortgage is the key
financial tool used by young households to purchase their homes. In these countries the

23
observed homeownership rates, as well as, the distribution of homeownership across
household income levels are determined by the degree of the mortgage market
development. Mortgage market development, as measured by overall mortgage take-up,
and the dependence of mortgage on household income, closely corresponds to the degree
of mortgage market regulation in the five countries: countries with the most regulated
mortgage markets such as Italy and Germany have the least developed mortgage markets.
The legal environment, such as contract enforcement and judicial efficiency, and
information sharing are also crucial for the development of the mortgage market.
Although the small number of countries does not allow us to show any
quantitative evidence on the effect of institutions and policies on the homeownership
among the young, the observed variation in homeownership rates, mortgage market
maturity, and size of the rental market, which the five countries represent, enables us to
draw the following qualitative conclusions: Mortgage market regulation hinders
mortgage market development, decreases homeownership rates among the young and
increases the homeownership-income inequality. As the discussed integration of the
European mortgage markets would also involve mortgage market deregulation in
countries with limited mortgage availability, it is likely that it will enhance the
homeownership rates among the young households there, and therefore lead to further
convergence of the homeownership patterns in Europe. The impact of the integration
will, however, depend on the housing alternatives available to the young in these
countries, namely the size and the terms of the rental market. The discussion about the
mortgage market integration and deregulation should therefore also consider these
alternatives, and in particular, the current country-specific rental market regulations. If
low transaction costs at the housing and mortgage market are assured by the regulatory
environment, mortgage market integration may also enhance labor market efficiency
through increased within-country and cross-border mobility.
9. Possible Policy Implications
Integration of the European mortgage markets, one of the topics widely discussed
at the European Commission (see for example European Commission 2006), presupposes
harmonization of the mortgage market regulation across its member countries. Such
harmonization would require substantial mortgage market deregulation in countries like
Italy or Germany, when compared to their current regulatory environment.

24
In the section below we will discuss possible policy implications of our findings
in light of further deregulation and integration of the mortgage market on
homeownership, geographical labor mobility and labor contracts.
Homeownership rates and homeownership-income inequality
It is likely that deregulation and opening up of the mortgage markets will increase
the overall access across income levels of young households to mortgage loans. Based on
our findings, we expect further mortgage market development in countries with less
developed mortgage markets to increase homeownership rates and reduce
homeownership income inequality among young households. Our results suggest that
mortgage market integration will enhance convergence of homeownership rates and
homeownership income inequality across countries. However, as our findings point out, it
is not only mortgage market regulation and legal environment that affect mortgage
market development. Demand for homeownership and therefore the need for mortgages
also depends on other aspects of the housing market such as alternative forms of housing
and how their costs compare with the price of homeownership. The analysis of the five
substantially different countries undergone in this paper enables us to lay down, discuss
and assess the likely impact of these additional factors as well.
The effect of mortgage market development resulting from mortgage market
integration is likely to differ across countries. While in Germany, a fairly developed (and
regulated) rental market offers renting as an attractive alternative to homeownership
(Ditch et al 2001), this is not the case in Italy, where the major housing alternative of the
young individuals is to postpone marriage and household formation and stay with parents
until they accumulate necessary savings or until they acquire homes from parents in the
form of transfers. As a result, as suggested by Martins and Villanueva (2006), the effect
of increased mortgage availability on nest leaving is expected to be particularly high in
the Southern European countries. Besides the relative cost of homeownership and renting
within the considered countries, cross-country differences in housing prices relative to
average income (house affordability) will be both affected by but also will itself alter the
impact of the integration of mortgage markets on homeownership rates and their
distribution across income particularly at the bottom of the income distribution where
these differences are the greatest (see Table 4 on housing affordability and Table 6a on
homeownership across income deciles).
Geographical mobility and labor market
25
It is not straightforward what effect would mortgage market deregulation,
increased mortgage availability and a subsequent increase in homeownership have on
geographical labor mobility. While a developed mortgage market and a well-functioning
housing market is expected to enhance geographical mobility, as is the case in the US,
there are microeconomic studies ( such as Henley 1998), that find in the case of the
unemployed, that homeownership may reduce mobility and therefore preserve regional
variation in unemployment. The conditions of housing market turnover also determine
the relationship between homeownership and geographical mobility. High transaction
costs in the housing market, for example, reduce home turnover and consequently may
reduce geographical mobility.
In our five country study, we see a positive relationship between mortgage
financed homeownership and geographic mobility (Table 9). Among the five countries
we consider, Italy is clearly the one with the lowest across-region geographical mobility
(10 %), while Finland is the highest (36 %). Germany has the second lowest mobility
after Italy (19 %). The UK follows with about 25 %. These patterns are confirmed when
within EU and outside EU mobility is considered. For comparison, over 40% of the US
population has been defined as movers (Schachter, Franklin and Perry 2003, Table 1).
This shows that in countries with high homeownership rates financed through mortgages
we observe high geographical mobility.
The most frequent reason for geographical mobility among prime age individuals
is moving to a new job. Geographical mobility therefore also reflects labor mobility
which is crucial for efficient matching of job searchers to vacancies. As a result, a well-
functioning housing market, i.e. market with low transaction cost and high turnover
(where it is easy to buy and sell one’s home) is a key prerequisites of labor mobility.
Increased access to housing and less frictions to geographical mobility could therefore
also result in higher labor market efficiency. When we look at labor mobility across the
five countries, they rank exactly the same as when compared to geographical mobility:
over 30 % of Italians have never changed their employer after the age of 35, around 20 %
of Germans, 14 % of Finns and less than 10 % of British people (see European
Foundation for the Improvement of Living and Working Conditions, 2006, Figure 18 and
23). It has been well documented that US has much higher geographical and labor
mobility compared to the rest of the countries in our analysis. The important finding is
that it is not the homeownership per se that is positively correlated with high
geographical and labor mobility but mortgage financed homeownership, which does not
26
restrict the location of one’s home to a large extent. This has been shown to be the case in
Italy-- the least mobile country, with the smallest mortgage take-up and the second
highest homeownership rate in our sample. The effect of mortgage market deregulation
on labor mobility and labor market efficiency is once again likely to vary across
countries, depending on other housing alternatives. In the presence of high transaction
cost of buying and selling one’s home, a substantial rental market (and rent subsidies
(Ditch et al 2001)) in Germany may imply that renting enhances higher labor mobility
than housing tenure. On the other hand, mortgage market development in Italy that
enables homeownership among young individuals, is likely to be crucial for the increase
in geographical and labor mobility there.
Cross-border mobility and integrated labor market
While mortgage market development is likely to increase regional mobility within
countries, the integration of the mortgage markets is likely to enhance cross-border
mobility as well. Immigrants are typically in a worse situation compared to natives when
applying for mortgages due to, for example, the lack of credit history information or
shorter labor contracts than natives. The latter has also been an issue for young
individuals entering the job market, where temporary instead of regular contracts have
been offered (see for example Blau and Kahn (2002)). As most of the cross-border
mobility within EU takes place among young households, the increase in mortgage
access to the young across countries is likely to enhance the integrated European labor
market as well.

27
Acknowledgment:
This project has been supported by the European Commission under the contract
163/2007/SI2.469639. The authors would like to thank the participants of the LWS Final
“Beta Phase” Conference, the 2nd ECINEQ meeting, the CEPS/INSTEAD seminar series
and the 2007 DG ECFIN Annual Research Conference for helpful suggestions and
comments. All remaining errors are ours.
28
Bibliography:
Bacchetta, Philippe & Gerlach, Stefan, 1997. "Consumption and credit constraints: International evidence," Journal of Monetary Economics,Elsevier, vol. 40(2), pages 207-238, 10. Barakova, Irina, Raphael W. Bostic, Paul S. Calem,and Susan M. Wachter, “Does credit quality matter for homeownership?” Journal of Housing Economics, 12 (2003) 318–336. Bertola, Giuseppe & Koeniger, Winfried, 2004. "Consumption Smoothing and the Structure of Labor and Credit Markets," IZA Discussion Papers1052, Institute for the Study of Labor. Bicakova, Alena and Eva Sierminska: Homeownership inequality and the access to credit markets: Can credit availability explain cross-country differences in the inequality of homeownership across income of young households? LWS Working Paper Series No. 5 (2007) Blau, Francine and Lawrence Kahn, 2002. At Home and Abroad: U.S. Labor Market Performance in International Perspective, Russell Sage Foundation, New York. Bostic, Raphael W & Surette, Brian J, 2001. "Have the Doors Opened Wider? Trends in Homeownership Rates by Race and Income," The Journal of Real Estate Finance and Economics, Kluwer Academic Publishers, vol. 23(3), pages 411-34, November. Bostic, Raphael W., Paul S. Calem & Susan M. Wachter, 2004. "Hitting the Wall: Credit as an Impediment to Homeownership," Joint Center for Housing Studies Working Paper Series, BABC 04-05, (February 2004). Bourguignon, François & Ferreira , Francisco H.G. & Leite, Phillippe G., 2002. "Beyond Oaxaca-Blinder: Accounting for Differences in Household Income Distributions Across Countries," William Davidson Institute Working Papers Series 478, William Davidson Institute at the University of Michigan Stephen M. Ross Business School. Catte, Pietro & Girouard, Nathalie & Price, Robert & André, Christophe, 2004. “Housing Markets, Wealth And The Business Cycle,” OECD Economics Department Working Papers No. 394 Chambers, Mathew, Carlos Garriga, and Don E. Schlagenhauf, 2007. “Accounting for Changes in the Homeownership Rate,” Federal Reserve Bank of Atlanta Working Paper 2007-21. Chiuri, Maria Concetta & Jappelli, Tullio, 2003. "Financial market imperfections and home ownership: A comparative study," European Economic Review, Elsevier, vol. 47(5), pages 857-875, 10.
29
Chiuri, Maria Concetta & Jappelli, Tullio, 2007. “Do the elderly reduce housing equity? An international comparison” (updated version of LIS WP. 436), July 2nd,2007 Constant, Amelie, Rowan Roberts and Klaus F. Zimmermann, 2007."Ethnic Identity and Immigrant Homeownership," IZA Discussion Papers 3050, Institute for the Study of Labor (IZA). Di, Zhu Xiao and Xiaodong Liu, 2005. “The Importance of Wealth and Income in the Transition to Homeownership,” Joint Center for Housing Studies, Harvard University, Working Papers W05-6, July 2005 Diaz-Serrano, Luis, 2006. “Housing Satisfaction, Homeownership and Housing Mobility: A Panel Data Analysis for Twelve EU Countries,” IZA Discussion Paper No. 2318, Institute for the Study of Labor (IZA). Ditch, John, Alan Lewis and Steve Wilcox, 2001. “Social Housing, Tenure and Housing Allowance: An International Review,” A study carried out by the Department for Work and Pensions. European Foundation for the Improvement of Living and Working Conditions, 2006. Mobility in Europe: Analysis of the 2005 Euro barometer survey on geographical and labour market mobility, Luxembourg. European Commission, 2006. Report of the Mortgage Funding Expert Group, Internal Market and Services DG FINANCIAL INSTITUTIONS, Brussels. http://ec.europa.eu/internal_market/finservices-retail/docs/home-loans/mfeg/final_report-en.pdf Grant, Charles & Mario Padula, 2006. "Informal Credit Markets, Judicial Costs and Consumer Credit: Evidence from Firm Level Data," CSEF Working Papers 155, Centre for Studies in Economics and Finance (CSEF), University of Salerno, Italy. Guiso, Luigi & Jappelli, Tullio, 2002. "Private Transfers, Borrowing Constraints and the Timing of Homeownership," Journal of Money, Credit and Banking, Ohio State University Press, vol. 34(2), pages 315-39. Haliassos, M., P. Karamanou, C. Ktoris and G.Syrichas, 2006. “Mortgage Debt, Social Customs and Financial Innovation,” unpublished manuscript. Haurin, Donald, Patric Hendershott and Susan Wachter (1997) “Borrowing Constraints and the Tenure Choice of Young Households” Journal of Housing Research, vol. 8(2), pages 137-154. Henley, Andrew, 1998. "Residential Mobility, Housing Equity and the Labour Market," Economic Journal, Royal Economic Society, vol. 108(447), pages 414-27. Jappelli, Tullio & Pistaferri, Luigi, 2000. "The dynamics of household wealth accumulation in Italy," Fiscal Studies, Institute for Fiscal Studies, vol. 21(2), pages 269-295.

30
Kennickell, Arthur B. "Multiple Imputation in the Survey of Consumer Finances," September 1998, (http://www.federalreserve.gov/pubs/oss/oss2/method.html). Martins, Nuno and Ernesto Villanueva (2006) “Does Limited access to Mortgage Debt Explain Why Young Adults Live with Their Parents?” Documentos de Trabajo, No 0628, Banco de Espana. The Luxembourg Wealth Study (LWS) Database of Institutions that Build Economic Security and Asset Holdings." Version 1 (15 January 2008). Ortalo-Magne, Francois and Sven Rady, 1999. “Boom in, bust out: Young households and the housing price cycle,” European Economic Review 43, pages 755-766. Quercia, Roberto, George McCarthy and Susan Wachter (2003) “The Impacts of Affordable Lending Efforts on Homeownerrship Rates,” Journal of Housing Economics 12, pages 29-59. Schachter, Jason, Rachel S. Franklin, and Marc J. Perry, 2003. “Migration and Geographic Mobility in Metropolitan and Non-metropolitan America: 1995 to 2000,” Census 2000 Special Reports, Washington, DC. Sedo, Stanley and Sherrie Kossoudji (2004) “Rooms of One’s Own: Gender, Race and Home Ownership as Wealth Accumulation in the United States” IZA Discussion Paper No. 1397. Sierminska, Eva, Andrea Brandolini and Timothy M. Smeeding, 2006a “Comparing wealth distribution across rich countries: First results from the Luxembourg Wealth Study” Luxembourg Wealth Study Working Paper No.1, (2006) Sierminska, Eva, Andrea Brandolini and Timothy M. Smeeding, 2006b. “The Luxembourg Wealth Study – A Cross-Country Comparable Database for Household Wealth Research,” Journal of Economic Inequality vol. 4 no. 3, December 2006.
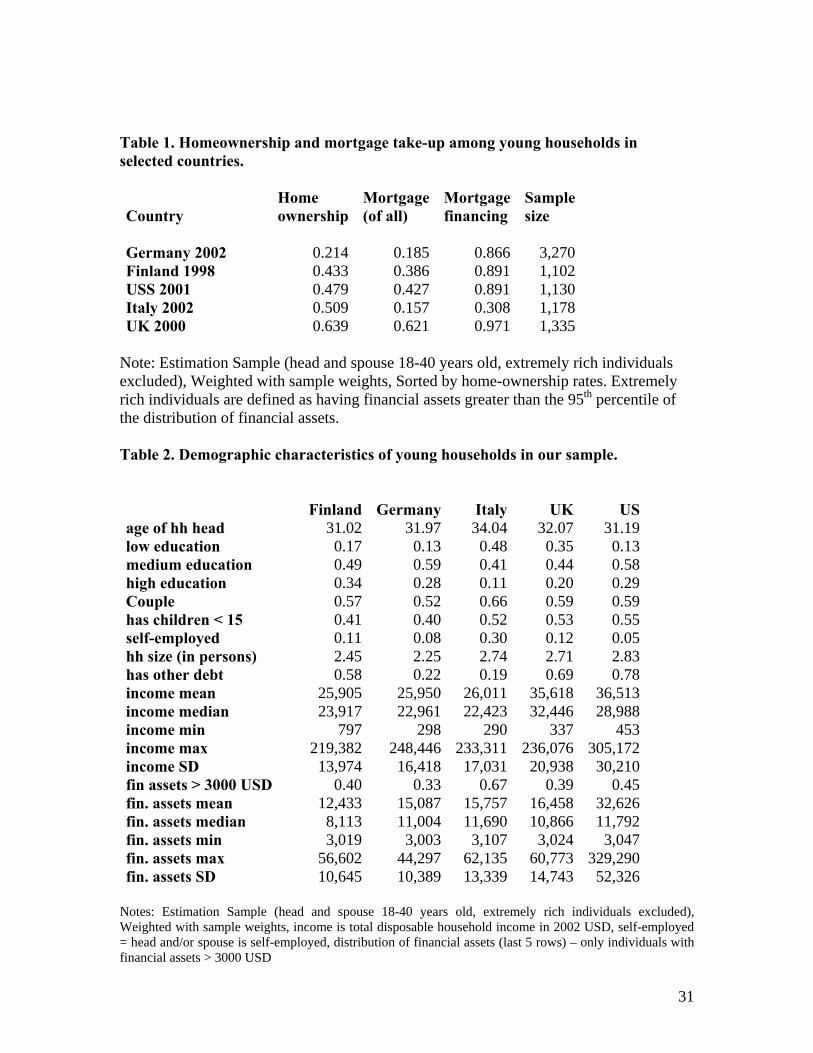
31
Table 1. Homeownership and mortgage take-up among young households in selected countries.
Country Home ownership
Mortgage(of all)
Mortgage financing
Sample size
Germany 2002 0.214 0.185 0.866 3,270 Finland 1998 0.433 0.386 0.891 1,102 USS 2001 0.479 0.427 0.891 1,130 Italy 2002 0.509 0.157 0.308 1,178 UK 2000 0.639 0.621 0.971 1,335
Note: Estimation Sample (head and spouse 18-40 years old, extremely rich individuals excluded), Weighted with sample weights, Sorted by home-ownership rates. Extremely rich individuals are defined as having financial assets greater than the 95th percentile of the distribution of financial assets. Table 2. Demographic characteristics of young households in our sample.
Finland Germany Italy UK US age of hh head 31.02 31.97 34.04 32.07 31.19 low education 0.17 0.13 0.48 0.35 0.13 medium education 0.49 0.59 0.41 0.44 0.58 high education 0.34 0.28 0.11 0.20 0.29 Couple 0.57 0.52 0.66 0.59 0.59 has children < 15 0.41 0.40 0.52 0.53 0.55 self-employed 0.11 0.08 0.30 0.12 0.05 hh size (in persons) 2.45 2.25 2.74 2.71 2.83 has other debt 0.58 0.22 0.19 0.69 0.78 income mean 25,905 25,950 26,011 35,618 36,513 income median 23,917 22,961 22,423 32,446 28,988 income min 797 298 290 337 453 income max 219,382 248,446 233,311 236,076 305,172 income SD 13,974 16,418 17,031 20,938 30,210 fin assets > 3000 USD 0.40 0.33 0.67 0.39 0.45 fin. assets mean 12,433 15,087 15,757 16,458 32,626 fin. assets median 8,113 11,004 11,690 10,866 11,792 fin. assets min 3,019 3,003 3,107 3,024 3,047 fin. assets max 56,602 44,297 62,135 60,773 329,290 fin. assets SD 10,645 10,389 13,339 14,743 52,326
Notes: Estimation Sample (head and spouse 18-40 years old, extremely rich individuals excluded), Weighted with sample weights, income is total disposable household income in 2002 USD, self-employed = head and/or spouse is self-employed, distribution of financial assets (last 5 rows) – only individuals with financial assets > 3000 USD
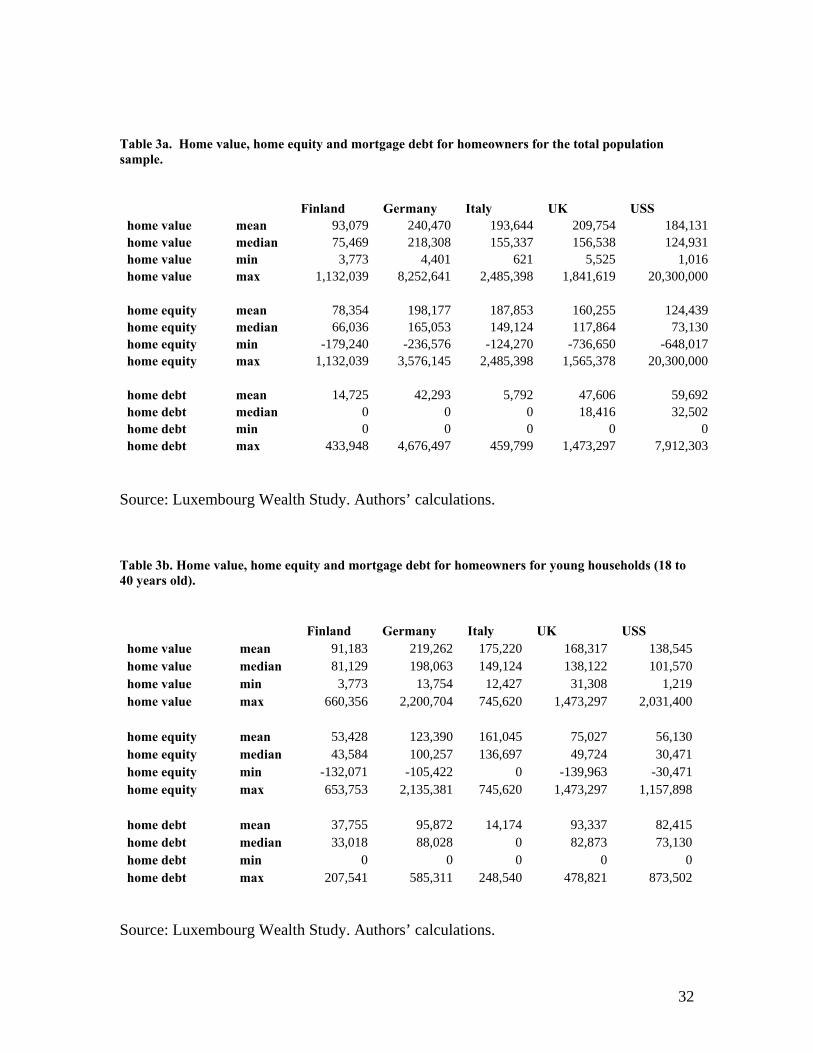
32
Table 3a. Home value, home equity and mortgage debt for homeowners for the total population sample.
Finland Germany Italy UK USS home value mean 93,079 240,470 193,644 209,754 184,131 home value median 75,469 218,308 155,337 156,538 124,931 home value min 3,773 4,401 621 5,525 1,016 home value max 1,132,039 8,252,641 2,485,398 1,841,619 20,300,000 home equity mean 78,354 198,177 187,853 160,255 124,439 home equity median 66,036 165,053 149,124 117,864 73,130 home equity min -179,240 -236,576 -124,270 -736,650 -648,017 home equity max 1,132,039 3,576,145 2,485,398 1,565,378 20,300,000 home debt mean 14,725 42,293 5,792 47,606 59,692 home debt median 0 0 0 18,416 32,502 home debt min 0 0 0 0 0 home debt max 433,948 4,676,497 459,799 1,473,297 7,912,303
Source: Luxembourg Wealth Study. Authors’ calculations.
Table 3b. Home value, home equity and mortgage debt for homeowners for young households (18 to 40 years old).
Finland Germany Italy UK USS home value mean 91,183 219,262 175,220 168,317 138,545 home value median 81,129 198,063 149,124 138,122 101,570 home value min 3,773 13,754 12,427 31,308 1,219 home value max 660,356 2,200,704 745,620 1,473,297 2,031,400 home equity mean 53,428 123,390 161,045 75,027 56,130 home equity median 43,584 100,257 136,697 49,724 30,471 home equity min -132,071 -105,422 0 -139,963 -30,471 home equity max 653,753 2,135,381 745,620 1,473,297 1,157,898 home debt mean 37,755 95,872 14,174 93,337 82,415 home debt median 33,018 88,028 0 82,873 73,130 home debt min 0 0 0 0 0 home debt max 207,541 585,311 248,540 478,821 873,502
Source: Luxembourg Wealth Study. Authors’ calculations.

33
Table 4. Home value and income ratios by income quantiles for homeowners in the selected sample.
Income Finland Germany Italy UK US quantiles
1 Mean 4.06 15.26 15.44 12.15 8.11 Median 3.54 12.46 13.11 7.87 6.00 ranking 5 2 1 3 4
2 Mean 3.05 8.46 7.95 5.14 3.57 Median 2.80 8.15 7.61 4.27 2.98 ranking 5 1 2 3 4
3 Mean 2.61 6.91 7.25 3.92 3.07 Median 2.39 6.44 5.64 3.44 2.89 ranking 5 1 2 3 4
4 Mean 2.65 5.64 5.62 3.88 2.66 Median 2.49 5.22 4.68 3.33 2.26 ranking 4 1 2 3 5
5 Mean 2.43 4.73 3.89 3.33 2.65 Median 2.42 4.45 3.98 2.99 2.35 ranking 4 1 2 3 5
Source: Luxembourg Wealth Study. Authors’ calculations.
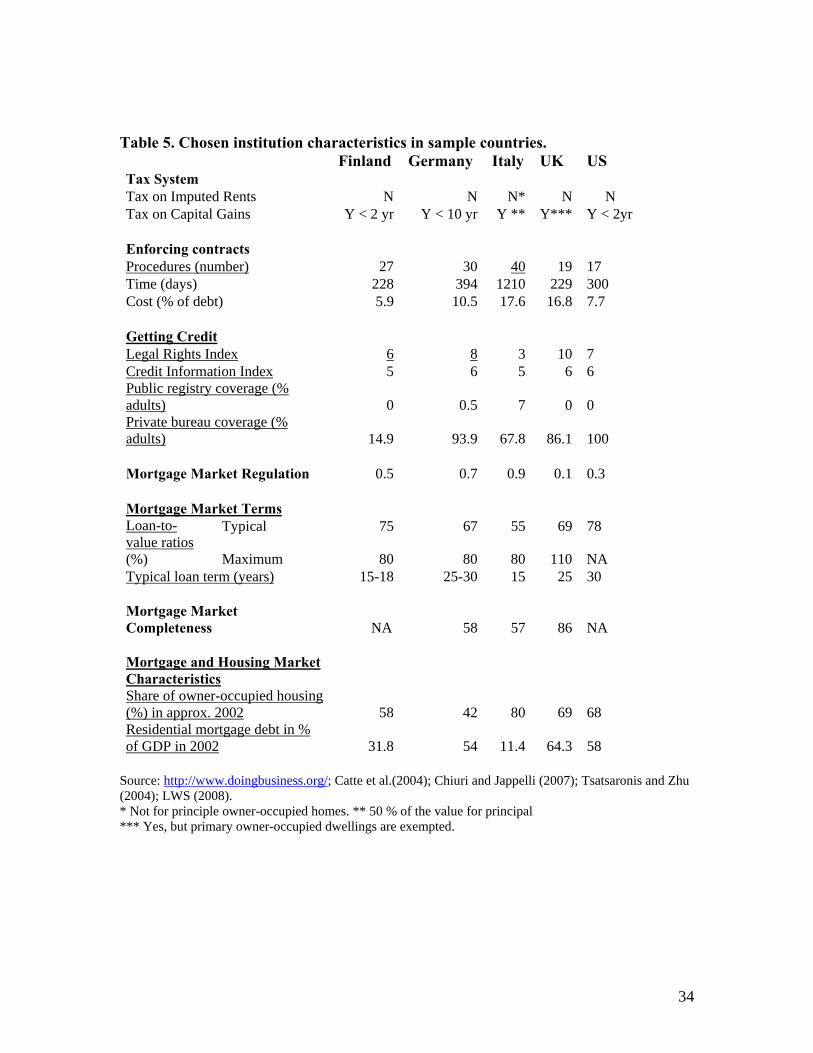
34
Table 5. Chosen institution characteristics in sample countries. Finland Germany Italy UK US Tax System Tax on Imputed Rents N N N* N N Tax on Capital Gains Y < 2 yr Y < 10 yr Y ** Y*** Y < 2yr Enforcing contracts Procedures (number) 27 30 40 19 17 Time (days) 228 394 1210 229 300 Cost (% of debt) 5.9 10.5 17.6 16.8 7.7 Getting Credit Legal Rights Index 6 8 3 10 7 Credit Information Index 5 6 5 6 6 Public registry coverage (% adults) 0 0.5 7 0 0 Private bureau coverage (% adults) 14.9 93.9 67.8 86.1 100 Mortgage Market Regulation 0.5 0.7 0.9 0.1 0.3
Mortgage Market Terms
Typical 75 67 55 69 78 Loan-to-value ratios (%) Maximum 80 80 80 110 NA Typical loan term (years) 15-18 25-30 15 25 30 Mortgage Market Completeness NA 58 57 86 NA Mortgage and Housing Market Characteristics Share of owner-occupied housing (%) in approx. 2002 58 42 80 69 68 Residential mortgage debt in % of GDP in 2002 31.8 54 11.4 64.3 58
Source: http://www.doingbusiness.org/; Catte et al.(2004); Chiuri and Jappelli (2007); Tsatsaronis and Zhu (2004); LWS (2008). * Not for principle owner-occupied homes. ** 50 % of the value for principal *** Yes, but primary owner-occupied dwellings are exempted.

35
Table 6a. Homeownership by income deciles. Income Finland Germany Italy UK US Total Deciles
1 0.092 0.053 0.404 0.338 0.133 0.132 2 0.278 0.075 0.397 0.365 0.200 0.184 3 0.314 0.100 0.405 0.500 0.284 0.249 4 0.472 0.112 0.511 0.602 0.295 0.270 5 0.472 0.160 0.410 0.597 0.414 0.361 6 0.612 0.297 0.590 0.784 0.516 0.481 7 0.692 0.337 0.597 0.810 0.705 0.636 8 0.779 0.389 0.593 0.797 0.686 0.631 9 0.788 0.520 0.541 0.851 0.878 0.790
10 0.898 0.593 0.736 0.919 0.871 0.788 Total 0.433 0.214 0.509 0.639 0.479 0.424
P(H=1)>50%
P(H=1)>mean(country)
Table 6b. Mortgage among homeowners by income deciles Income Finland Germany Italy UK US Total Deciles
1 0.545 0.447 0.061 0.897 0.465 0.366 2 0.749 0.768 0.155 0.893 0.714 0.624 3 0.834 0.731 0.407 0.894 0.679 0.657 4 0.741 0.786 0.2 0.932 0.802 0.707 5 0.836 0.814 0.251 0.943 0.823 0.767 6 0.806 0.762 0.316 0.988 0.971 0.88 7 0.892 0.893 0.234 0.947 0.936 0.881 8 0.903 0.903 0.378 0.995 0.916 0.876 9 0.845 0.924 0.43 0.95 0.971 0.935
10 0.858 0.929 0.418 0.962 0.989 0.911 Total 0.82 0.845 0.288 0.947 0.889 0.825
P(M=1/H=1)>50% P(M=1/H=1)>mean(country)
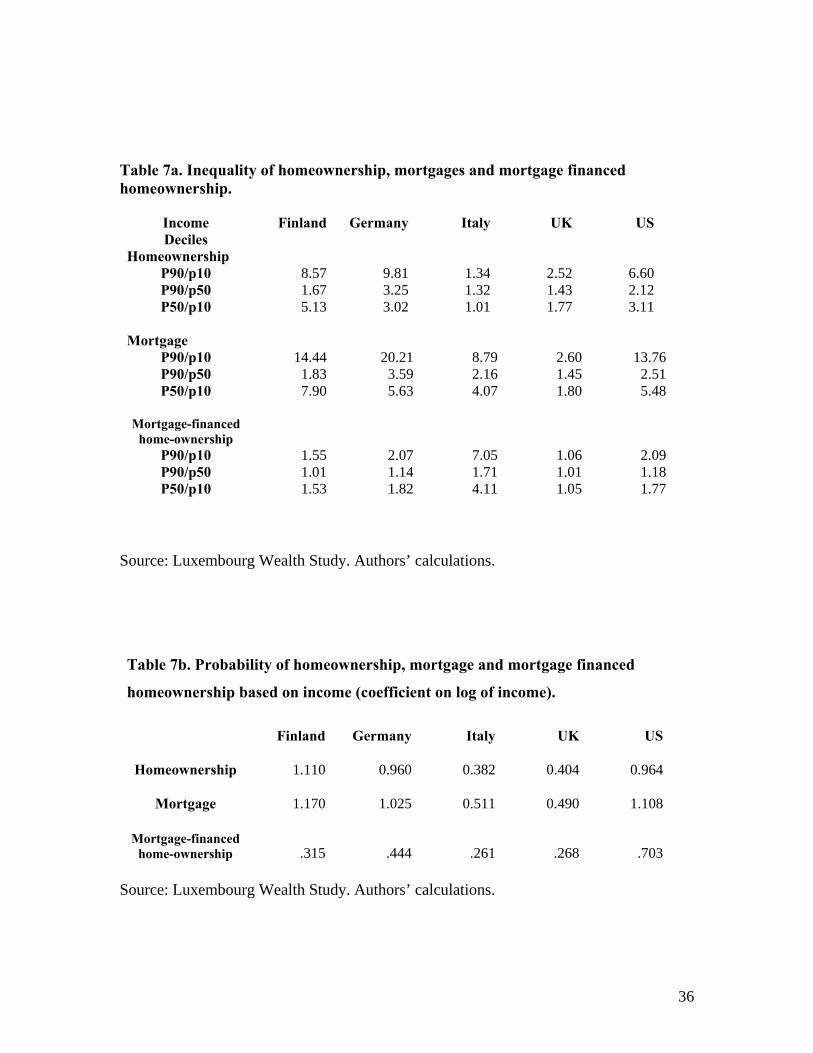
36
Table 7a. Inequality of homeownership, mortgages and mortgage financed homeownership.
Income Finland Germany Italy UK USDeciles
Homeownership P90/p10 8.57 9.81 1.34 2.52 6.60P90/p50 1.67 3.25 1.32 1.43 2.12P50/p10 5.13 3.02 1.01 1.77 3.11
Mortgage
P90/p10 14.44 20.21 8.79 2.60 13.76P90/p50 1.83 3.59 2.16 1.45 2.51P50/p10 7.90 5.63 4.07 1.80 5.48
Mortgage-financed
home-ownership P90/p10 1.55 2.07 7.05 1.06 2.09P90/p50 1.01 1.14 1.71 1.01 1.18P50/p10 1.53 1.82 4.11 1.05 1.77
Source: Luxembourg Wealth Study. Authors’ calculations.
Table 7b. Probability of homeownership, mortgage and mortgage financed
homeownership based on income (coefficient on log of income).
Finland Germany Italy UK US
Homeownership 1.110 0.960 0.382 0.404 0.964
Mortgage 1.170 1.025 0.511 0.490 1.108
Mortgage-financed home-ownership .315 .444 .261 .268 .703
Source: Luxembourg Wealth Study. Authors’ calculations.
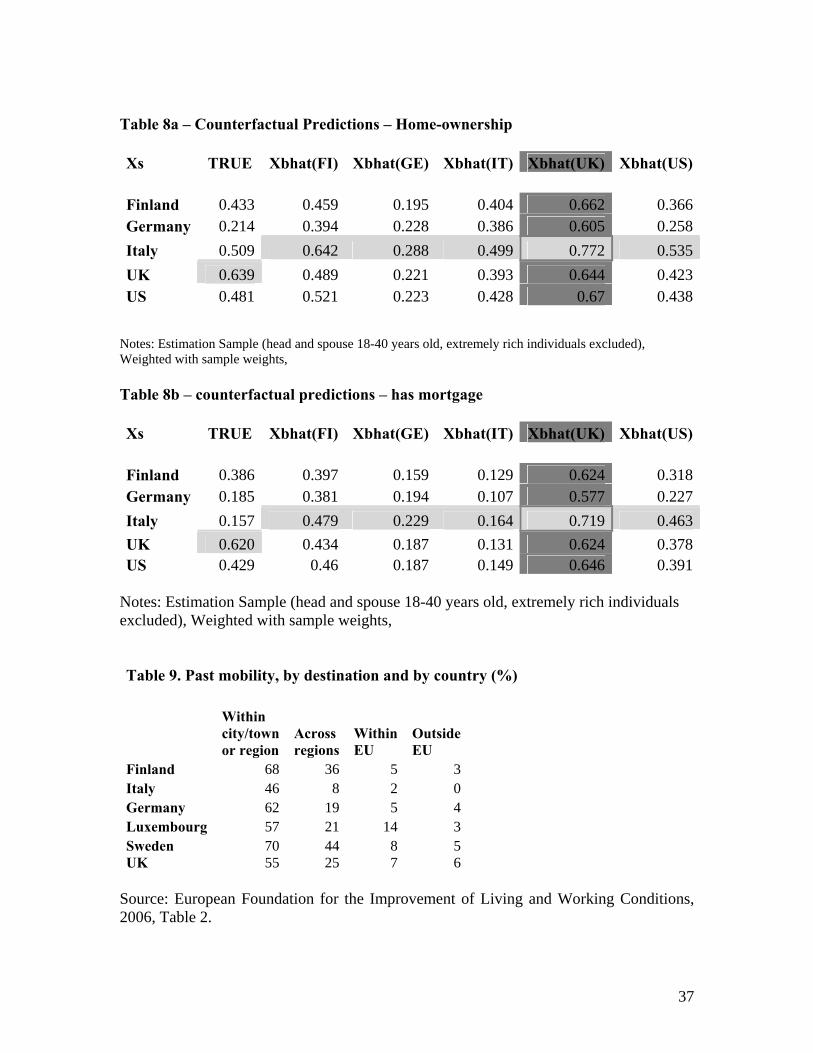
37
Table 8a – Counterfactual Predictions – Home-ownership Xs TRUE Xbhat(FI) Xbhat(GE) Xbhat(IT) Xbhat(UK) Xbhat(US) Finland 0.433 0.459 0.195 0.404 0.662 0.366Germany 0.214 0.394 0.228 0.386 0.605 0.258Italy 0.509 0.642 0.288 0.499 0.772 0.535UK 0.639 0.489 0.221 0.393 0.644 0.423US 0.481 0.521 0.223 0.428 0.67 0.438
Notes: Estimation Sample (head and spouse 18-40 years old, extremely rich individuals excluded), Weighted with sample weights, Table 8b – counterfactual predictions – has mortgage Xs TRUE Xbhat(FI) Xbhat(GE) Xbhat(IT) Xbhat(UK) Xbhat(US) Finland 0.386 0.397 0.159 0.129 0.624 0.318Germany 0.185 0.381 0.194 0.107 0.577 0.227Italy 0.157 0.479 0.229 0.164 0.719 0.463UK 0.620 0.434 0.187 0.131 0.624 0.378US 0.429 0.46 0.187 0.149 0.646 0.391
Notes: Estimation Sample (head and spouse 18-40 years old, extremely rich individuals excluded), Weighted with sample weights, Table 9. Past mobility, by destination and by country (%)
Within city/town or region
Across regions
Within EU
Outside EU
Finland 68 36 5 3Italy 46 8 2 0Germany 62 19 5 4Luxembourg 57 21 14 3Sweden 70 44 8 5UK 55 25 7 6
Source: European Foundation for the Improvement of Living and Working Conditions, 2006, Table 2.
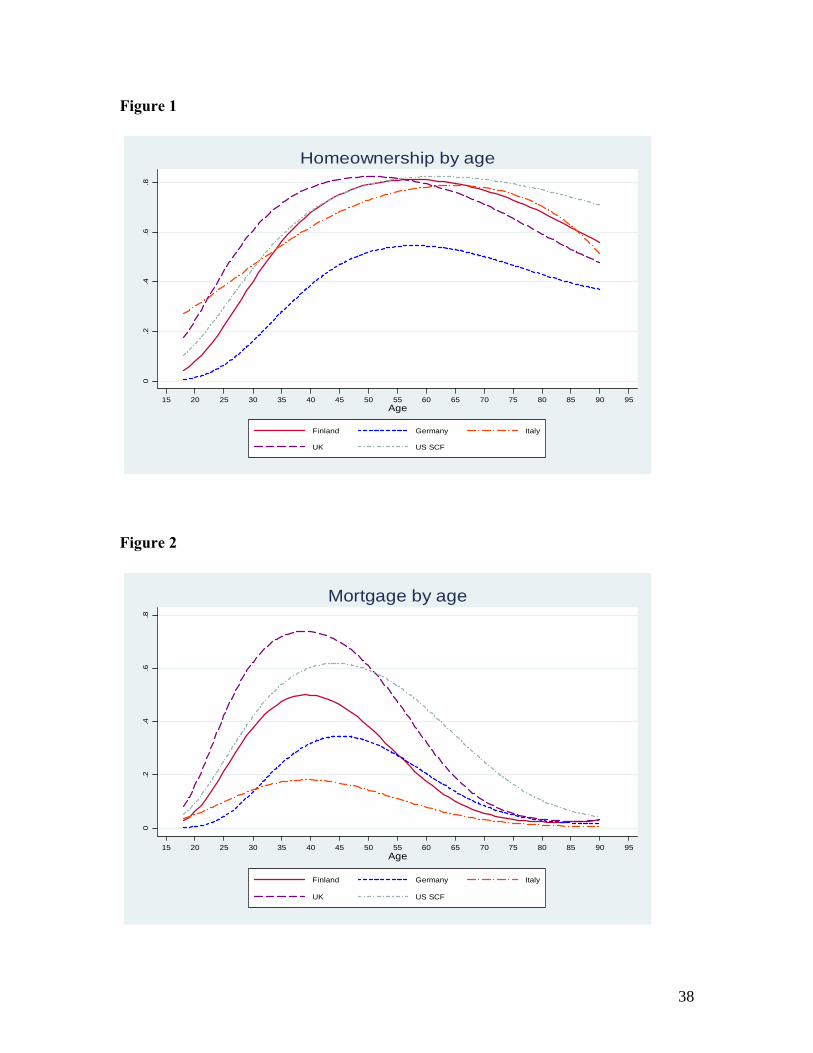
Figure 1
0.2
.4.6
.8
15 20 25 30 35 40 45 50 55 60 65 70 75 80 85 90 95Age
Finland Germany Italy
UK US SCF
Homeownership by age
Figure 2
0.2
.4.6
.8
15 20 25 30 35 40 45 50 55 60 65 70 75 80 85 90 95Age
Finland Germany Italy
UK US SCF
Mortgage by age
38
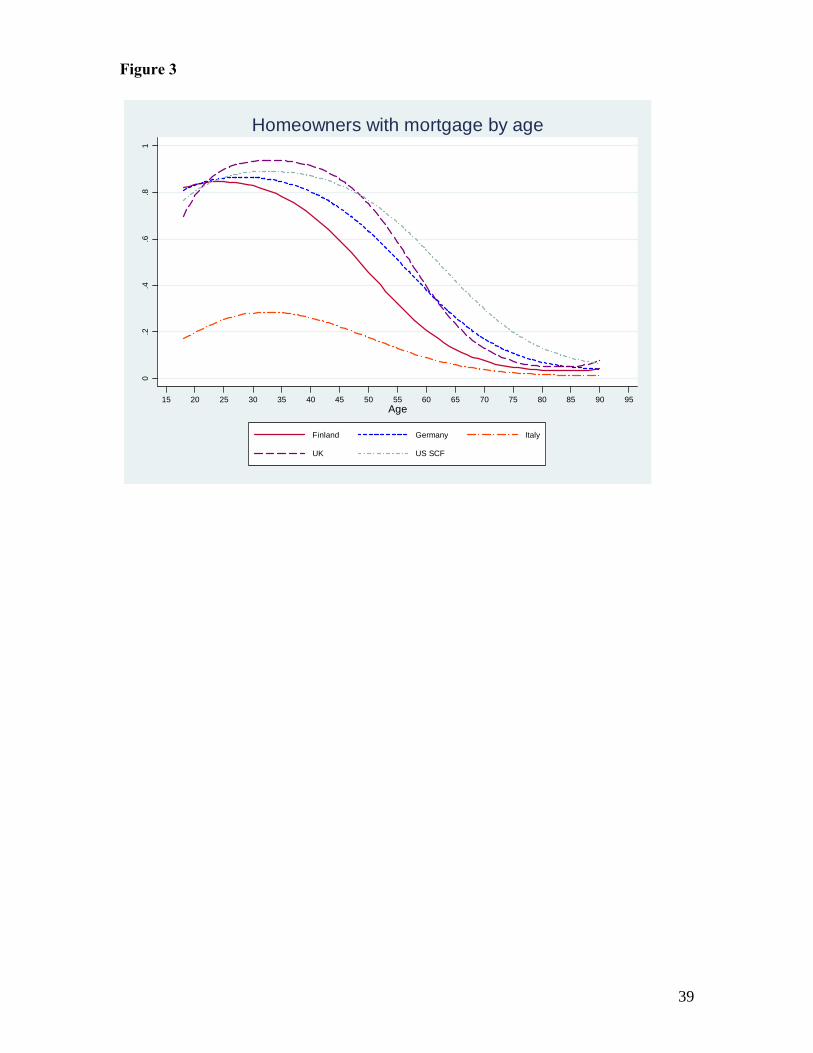
Figure 3
0.2
.4.6
.81
15 20 25 30 35 40 45 50 55 60 65 70 75 80 85 90 95Age
Finland Germany Italy
UK US SCF
Homeowners with mortgage by age
39
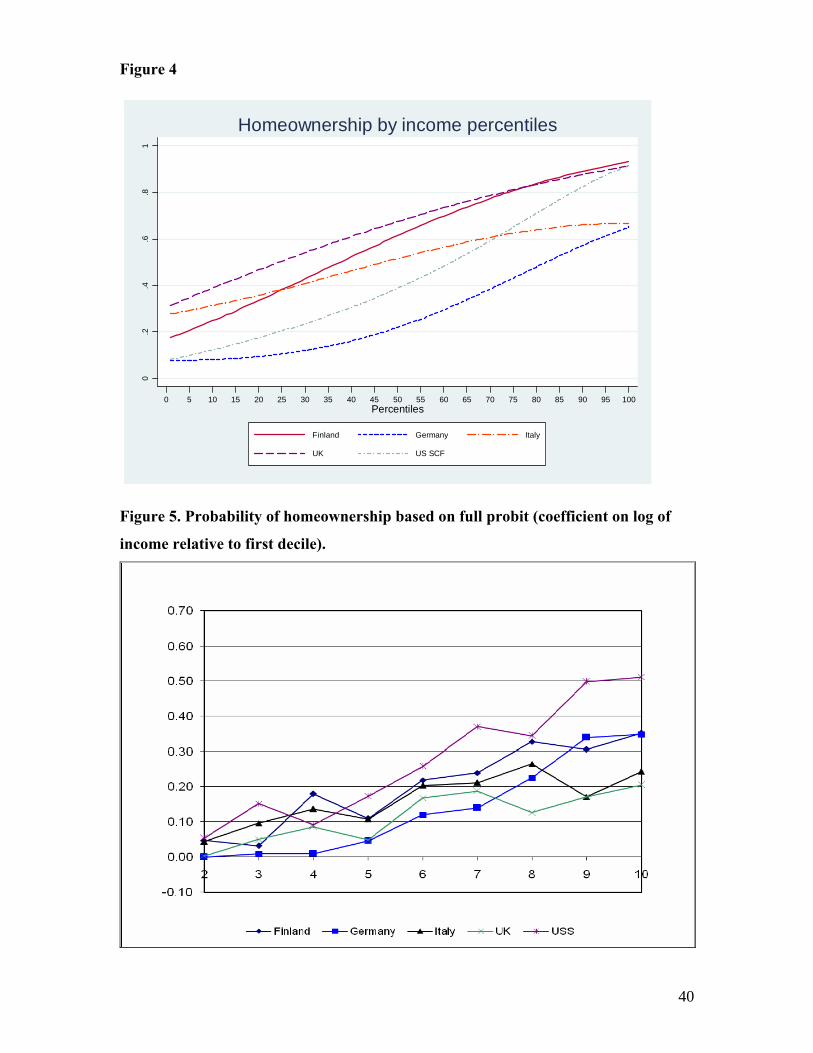
Figure 4
0.2
.4.6
.81
0 5 10 15 20 25 30 35 40 45 50 55 60 65 70 75 80 85 90 95 100Percentiles
Finland Germany Italy
UK US SCF
Homeownership by income percentiles
Figure 5. Probability of homeownership based on full probit (coefficient on log of
income relative to first decile).
40
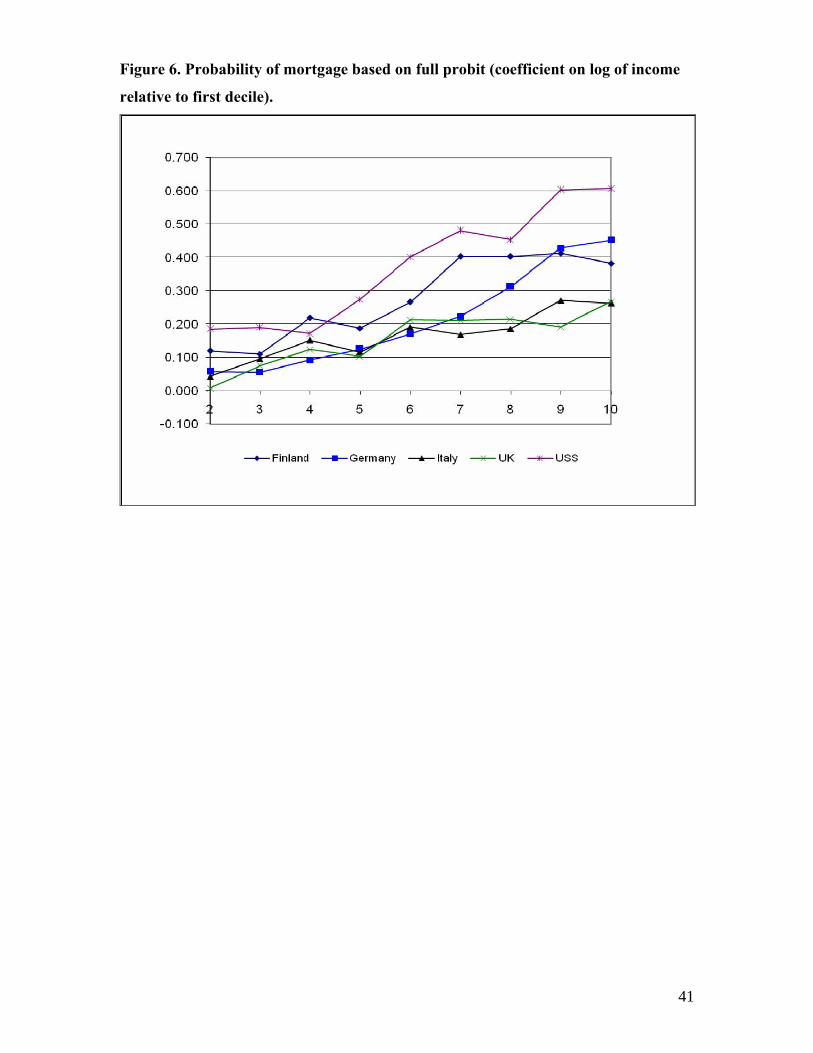
Figure 6. Probability of mortgage based on full probit (coefficient on log of income
relative to first decile).
41
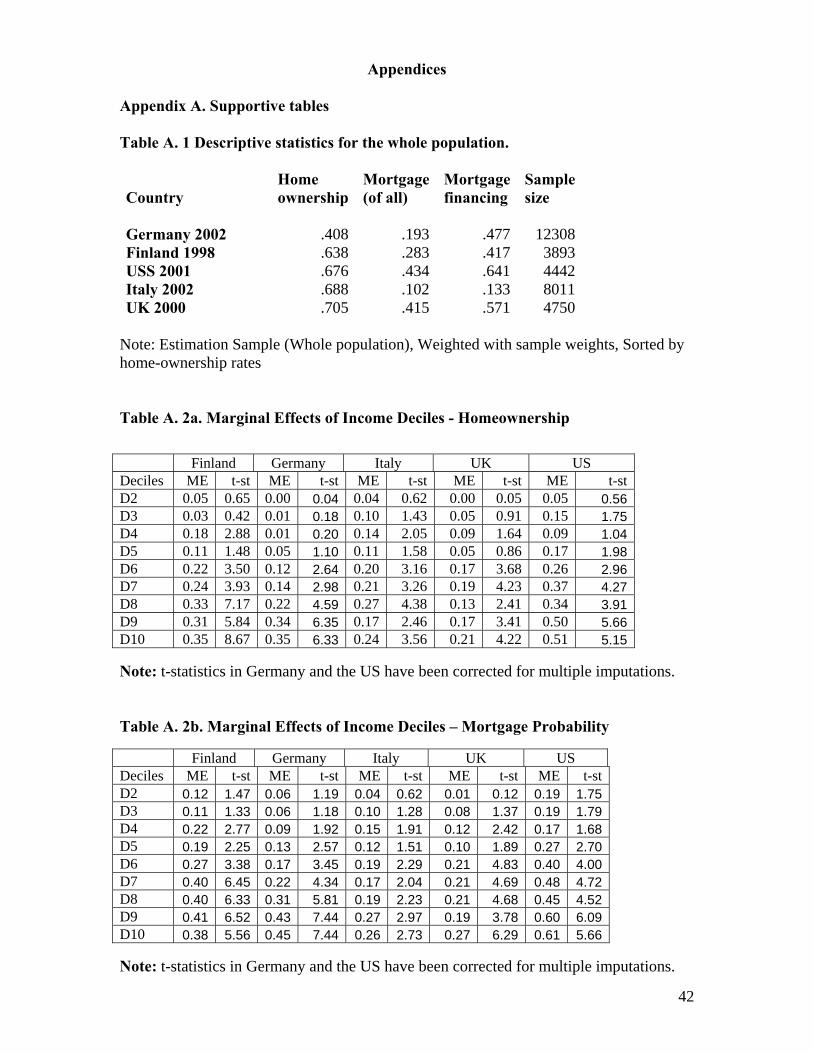
42
Appendices
Appendix A. Supportive tables
Table A. 1 Descriptive statistics for the whole population.
Country Home ownership
Mortgage(of all)
Mortgage financing
Sample size
Germany 2002 .408 .193 .477 12308 Finland 1998 .638 .283 .417 3893 USS 2001 .676 .434 .641 4442 Italy 2002 .688 .102 .133 8011 UK 2000 .705 .415 .571 4750
Note: Estimation Sample (Whole population), Weighted with sample weights, Sorted by home-ownership rates
Table A. 2a. Marginal Effects of Income Deciles - Homeownership
Finland Germany Italy UK US Deciles ME t-st ME t-st ME t-st ME t-st ME t-st D2 0.05 0.65 0.00 0.04 0.04 0.62 0.00 0.05 0.05 0.56 D3 0.03 0.42 0.01 0.18 0.10 1.43 0.05 0.91 0.15 1.75 D4 0.18 2.88 0.01 0.20 0.14 2.05 0.09 1.64 0.09 1.04 D5 0.11 1.48 0.05 1.10 0.11 1.58 0.05 0.86 0.17 1.98 D6 0.22 3.50 0.12 2.64 0.20 3.16 0.17 3.68 0.26 2.96 D7 0.24 3.93 0.14 2.98 0.21 3.26 0.19 4.23 0.37 4.27 D8 0.33 7.17 0.22 4.59 0.27 4.38 0.13 2.41 0.34 3.91 D9 0.31 5.84 0.34 6.35 0.17 2.46 0.17 3.41 0.50 5.66 D10 0.35 8.67 0.35 6.33 0.24 3.56 0.21 4.22 0.51 5.15
Note: t-statistics in Germany and the US have been corrected for multiple imputations. Table A. 2b. Marginal Effects of Income Deciles – Mortgage Probability
Finland Germany Italy UK US Deciles ME t-st ME t-st ME t-st ME t-st ME t-st D2 0.12 1.47 0.06 1.19 0.04 0.62 0.01 0.12 0.19 1.75 D3 0.11 1.33 0.06 1.18 0.10 1.28 0.08 1.37 0.19 1.79 D4 0.22 2.77 0.09 1.92 0.15 1.91 0.12 2.42 0.17 1.68 D5 0.19 2.25 0.13 2.57 0.12 1.51 0.10 1.89 0.27 2.70 D6 0.27 3.38 0.17 3.45 0.19 2.29 0.21 4.83 0.40 4.00 D7 0.40 6.45 0.22 4.34 0.17 2.04 0.21 4.69 0.48 4.72 D8 0.40 6.33 0.31 5.81 0.19 2.23 0.21 4.68 0.45 4.52 D9 0.41 6.52 0.43 7.44 0.27 2.97 0.19 3.78 0.60 6.09 D10 0.38 5.56 0.45 7.44 0.26 2.73 0.27 6.29 0.61 5.66
Note: t-statistics in Germany and the US have been corrected for multiple imputations.
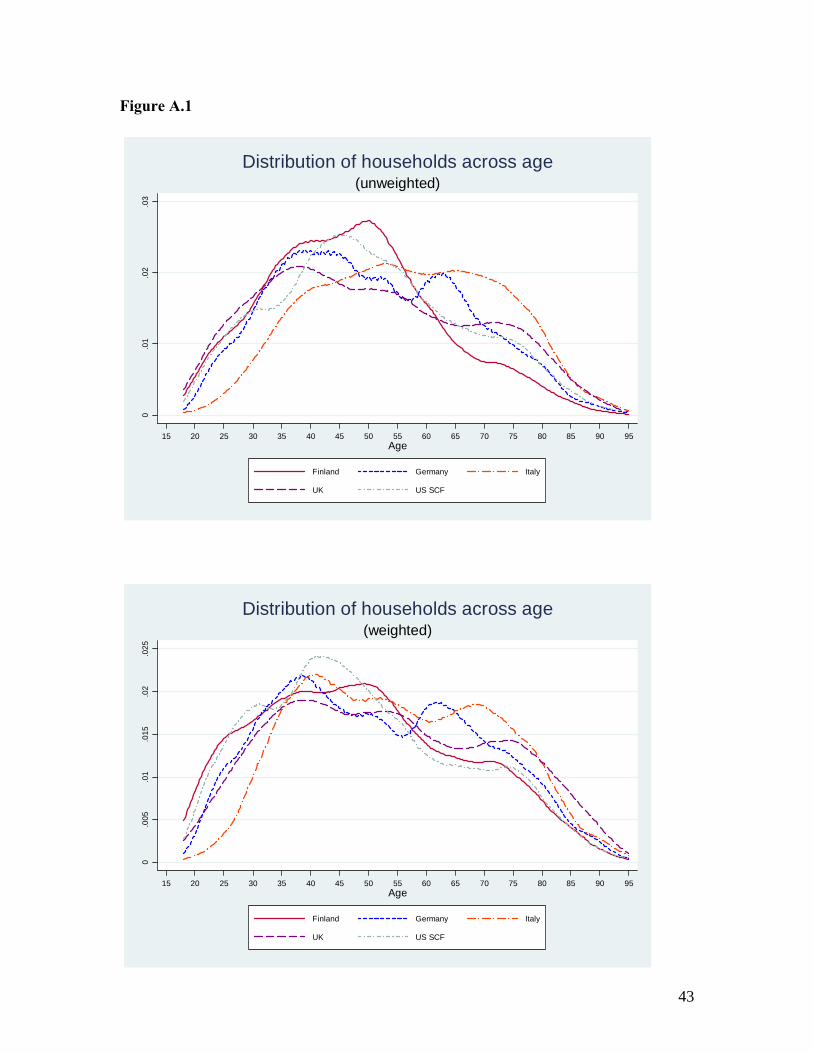
Figure A.1
0.0
1.0
2.0
3
15 20 25 30 35 40 45 50 55 60 65 70 75 80 85 90 95Age
Finland Germany Italy
UK US SCF
(unweighted)Distribution of households across age
0.0
05.0
1.0
15.0
2.0
25
15 20 25 30 35 40 45 50 55 60 65 70 75 80 85 90 95Age
Finland Germany Italy
UK US SCF
(weighted)Distribution of households across age
43

Figure A.2 Real price index of dwellings in old blocks of flats by quarter I/1970-
III/2007, 1970=100 (according to the Cost-of-living index) in Finland.
Source: Statistics Finland (http://www.stat.fi/til/ashi/2007/03/ashi_2007_03_2007-10-30_tie_001_en.html)
44

House price change and average price of dwellings in Finland.
Source: Global Property Guide (http://www.globalpropertyguide.com/real-estate-house-prices/F) Figure A.3 House price change and average price of residential properties in 13
urban areas in Italy.
Source: Global Property Guide (http://www.globalpropertyguide.com/real-estate-house-prices/I)
45
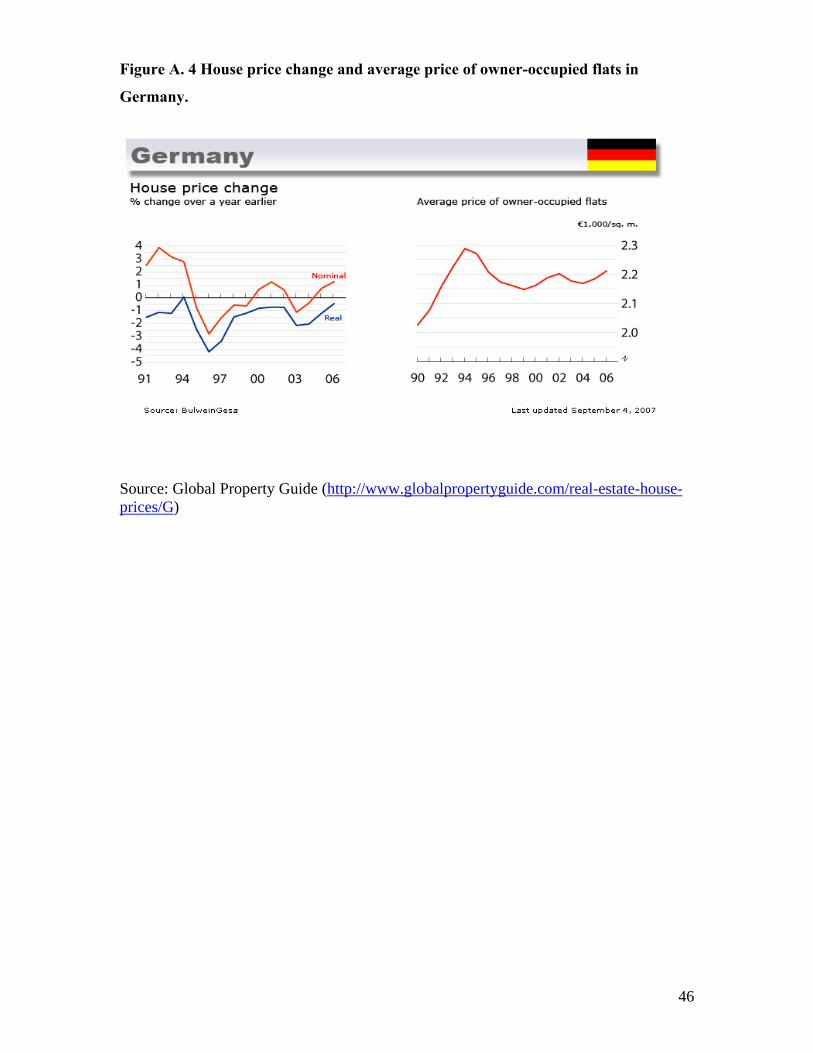
Figure A. 4 House price change and average price of owner-occupied flats in
Germany.
Source: Global Property Guide (http://www.globalpropertyguide.com/real-estate-house-prices/G)
46
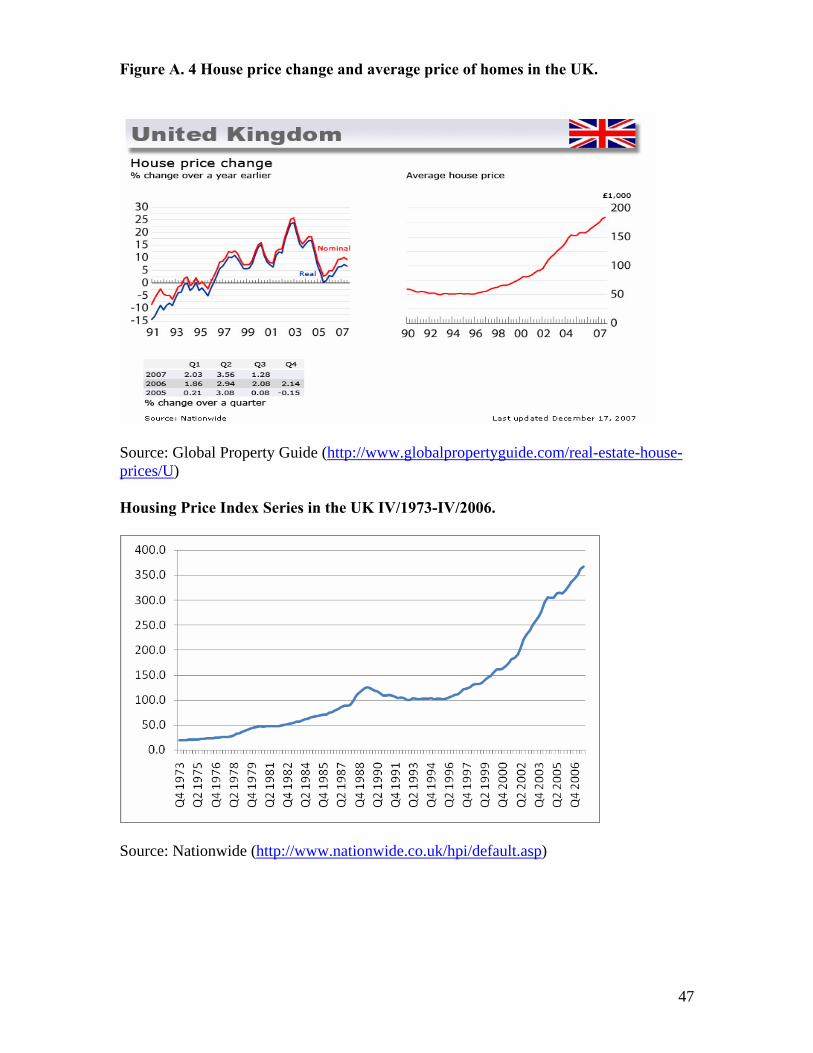
Figure A. 4 House price change and average price of homes in the UK.
Source: Global Property Guide (http://www.globalpropertyguide.com/real-estate-house-prices/U) Housing Price Index Series in the UK IV/1973-IV/2006.
Source: Nationwide (http://www.nationwide.co.uk/hpi/default.asp)
47

Figure A.6 House price change and average purchase price of homes in the United
States.
Source: Global Property Guide (http://www.globalpropertyguide.com/real-estate-house-prices/U) Housing Price Index Series in the US 1987-2007.
Source: S&P/Case-Shiller® Home Price Indices (http://www2.standardandpoors.com/portal/site/sp/en/us/page.topic/indices_csmahp/2,3,4,0,0,0,0,0,0,0,0,0,0,0,0,0.html)
48

49
Appendix B. Details of Table 5:
Legal Rights Index
measures the degree to which collateral and bankruptcy laws protect the rights of
borrowers and lenders and thus facilitate lending. The index includes 7 aspects related to
legal rights in collateral law and 3 aspects in bankruptcy law. A score of 1 is assigned for
each of the following features of the laws:
• General rather than specific description of assets is permitted in collateral agreements.
• General rather than specific description of debt is permitted in collateral agreements.
• Any legal or natural person may grant or take security in the property.
• A unified registry operates that includes charges over movable property.
• Secured creditors have priority outside of bankruptcy.
• Secured creditors, rather than other parties such as government or workers, are paid first
out of the proceeds from liquidating a bankrupt firm.
• Secured creditors are able to seize their collateral when a debtor enters reorganization;
there is no “automatic stay” or “asset freeze” imposed by the court.
• Management does not stay during reorganization. An administrator is responsible for
managing the business during reorganization.
• Parties may agree on enforcement procedures by contract.
• Creditors may both seize and sell collateral out of court without restriction.
The index ranges from 0 to 10, with higher scores indicating that collateral and
bankruptcy laws are better designed to expand access to credit.

50
Credit Information Index
measures rules affecting the scope, accessibility and quality of credit information
available through either public or private credit registries. A score of 1 is assigned for
each of the following 6 features of the credit information system:
• Both positive (for example, amount of loan and on-time repayment pattern) and
negative (for instance, number and amount of defaults, late payments, bankruptcies)
credit information is distributed.
• Data on both firms and individuals are distributed.
• Data from retailers, trade creditors or utilities as well as financial institutions are
distributed.
• More than 2 years of historical data are distributed.
• Data on loans above 1% of income per capita are distributed.
• By law, borrowers have the right to access their data.
The index ranges from 0 to 6, with higher values indicating the availability of more credit
information, from either a public registry or a private bureau, to facilitate lending
decisions.
Index of Mortgage Market Regulation
The index score adds one point for fulfilling each of the following five criteria:
• Mortgage rate arrangements are primarily extended on the basis of fixed rate
contracts.
• Mortgage equity withdrawal is absent or limited.

51
• LTV ratio does not exceed 75 %.
• Valuation methods of property is based on historical values, rather than based on
market values.
• Mortgage backed securitization is absent or limited.
The index is then normalized to one.