
Disruptive Demographics: Implications for K-12 Education in South Carolina
Disruptive Challenges:Financial Implications and Strategic Responses to a Changing Retail Electric Business
Prepared by: Peter Kind Energy Infrastructure Advocates
Prepared for: Edison Electric Institute
January 2013

Disruptive Challenges: Financial Implications and Strategic Responses to a Changing Retail Electric Business Prepared by: Peter Kind Energy Infrastructure Advocates Prepared for: Edison Electric Institute January 2013

© 2013 by the Edison Electric Institute (EEI). All rights reserved. Published 2013. Printed in the United States of America. No part of this publication may be reproduced or transmitted in any form or by any means, electronic or mechanical, including photocopying, recording, or any information storage or retrieval system or method, now known or hereinafter invented or adopted, without the express prior written permission of the Edison Electric Institute.
Attribution Notice and Disclaimer This work was prepared by Peter Kind, Energy Infrastructure Advocates for the Edison Electric Institute (EEI). When used as a reference, attribution to EEI is requested. EEI, any member of EEI, and any person acting on its behalf (a) does not make any warranty, express or implied, with respect to the accuracy, completeness or usefulness of the information, advice or recommendations contained in this work, and (b) does not assume and expressly disclaims any liability with respect to the use of, or for damages resulting from the use of any information, advice or recommendations contained in this work. The views and opinions expressed in this work do not necessarily reflect those of EEI or any member of EEI. This material and its production, reproduction and distribution by EEI does not imply endorsement of the material. Published by: Edison Electric Institute 701 Pennsylvania Avenue, N.W. Washington, D.C. 20004-2696 Phone: 202-508-5000 Web site: www.eei.org
Disruptive Challenges: Financial Implications and Strategic Responses to a Changing Retail Electric Business
Edison Electric Institute iii
Table of Contents
Executive Summary ............................................................................................................................. 1
Background .................................................................................................................................................. 3
Disruptive Threats—Strategic Considerations ............................................................................................ 6
Finance 101 - Introduction to Corporate Finance ........................................................................................ 7
Finance 201 - Financial Market Realities .................................................................................................... 8
Finance 501 - Financial Implications of Disruptive Forces ...................................................................... 11
Telephone Industry Parallels ..................................................................................................................... 14
Strategic Implications of Distribution 2020 Disruptive Forces ................................................................. 17
Summary .................................................................................................................................................... 19

Disruptive Challenges: Financial Implications and Strategic Responses to a Changing Retail Electric Business
Edison Electric Institute 1
Executive Summary
Recent technological and economic changes are expected to challenge and transform the electric utility industry. These changes (or “disruptive challenges”) arise due to a convergence of factors, including: falling costs of distributed generation and other distributed energy resources (DER); an enhanced focus on development of new DER technologies; increasing customer, regulatory, and political interest in demand-side management technologies (DSM); government programs to incentivize selected technologies; the declining price of natural gas; slowing economic growth trends; and rising electricity prices in certain areas of the country. Taken together, these factors are potential “game changers” to the U.S. electric utility industry, and are likely to dramatically impact customers, employees, investors, and the availability of capital to fund future investment. The timing of such transformative changes is unclear, but with the potential for technological innovation (e.g., solar photovoltaic or PV) becoming economically viable due to this confluence of forces, the industry and its stakeholders must proactively assess the impacts and alternatives available to address disruptive challenges in a timely manner. This paper considers the financial risks and investor implications related to disruptive challenges, the potential strategic responses to these challenges, and the likely investor expectations to utility plans going forward. There are valuable lessons to be learned from other industries, as well as prior utility sector paradigm shifts, that can assist us in exploring risks and potential strategic responses. The financial risks created by disruptive challenges include declining utility revenues, increasing costs, and lower profitability potential, particularly over the long-term. As DER and DSM programs continue to capture “market share,” for example, utility revenues will be reduced. Adding the higher costs to integrate DER, increasing subsidies for DSM and direct metering of DER will result in the potential for a squeeze on profitability and, thus, credit metrics. While the regulatory process is expected to allow for recovery of lost revenues in future rate cases, tariff structures in most states call for non-DER customers to pay for (or absorb) lost revenues. As DER penetration increases, this is a cost-recovery structure that will lead to political pressure to undo these cross subsidies and may result in utility stranded cost exposure. While the various disruptive challenges facing the electric utility industry may have different implications, they all create adverse impacts on revenues, as well as on investor returns, and require individual solutions as part of a comprehensive program to address these disruptive trends. Left unaddressed, these financial pressures could have a major impact on realized equity returns, required investor returns, and credit quality. As a result, the future cost and availability of capital for the electric utility industry would be adversely impacted. This would lead to increasing customer rate pressures. The regulatory paradigm that has supported recovery of utility investment has been in place since the electric utility industry reached a mature state in the first half of the 20th century. Until there is a significant, clear, and present threat to this recovery paradigm, it is likely that the financial markets will not focus on these disruptive challenges, despite the fact that electric utility capital investment is recovered over a period of 30 or more years (i.e., which exposes the industry to stranded cost risks). However, with the current level of lost load nationwide from DER being less than 1 percent, investors are not taking notice of this phenomenon, despite the fact that the pace of change is increasing and will likely increase further as costs of disruptive technologies benefit further from scale efficiencies. Investors, particularly equity investors, have developed confidence throughout time in a durable industry financial recovery model and, thus, tend to focus on earnings growth potential over a 12- to 24-month period.
Disruptive Challenges: Financial Implications and Strategic Responses to a Changing Retail Electric Business
2 Edison Electric Institute
So, despite the risks that a rapidly growing level of DER penetration and other disruptive challenges may impose, they are not currently being discussed by the investment community and factored into the valuation calculus reflected in the capital markets. In fact, electric utility valuations and access to capital today are as strong as we have seen in decades, reflecting the relative safety of utilities in this uncertain economic environment. In the late 1970s, deregulation started to take hold in two industries that share similar characteristics with the electric utility industry—the airline industry and the telecommunications industry (or “the telephone utility business”). Both industries were price- and franchise-regulated, with large barriers to entry due to regulation and the capital-intensive nature of these businesses. Airline industry changes were driven by regulatory actions (a move to competition), and the telecommunications industry experienced technology changes that encouraged regulators to allow competition. Both industries have experienced significant shifts in the landscape of industry players as a result. In the airline sector, each of the major U.S. carriers that were in existence prior to deregulation in 1978 faced bankruptcy. The telecommunication businesses of 1978, meanwhile, are not recognizable today, nor are the names of many of the players and the service they once provided (“the plain old telephone service”). Both industries experienced poor financial market results by many of the former incumbent players for their investors (equity and fixed-income) and have sought mergers of necessity to achieve scale economies to respond to competitive dynamics. The combination of new technologies, increasing costs, and changing customer-usage trends allow us to consider alternative scenarios for how the future of the electric sector may develop. Without fundamental changes to regulatory rules and recovery paradigms, one can speculate as to the adverse impact of disruptive challenges on electric utilities, investors, and access to capital, as well as the resulting impact on customers from a price and service perspective. We have the benefit of lessons learned from other industries to shift the story and move the industry in a direction that will allow for customers, investors, and the U.S. economy to benefit and prosper. Revising utility tariff structures, particularly in states with potential for high DER adoption, to mitigate (or eliminate) cross subsidies and provide proper customer price signals will support economic implementation of DER while limiting stress on non-DER participants and utility finances. This is a near-term, must-consider action by all policy setting industry stakeholders. The electric utility sector will benefit from proactive assessment and planning to address disruptive challenges. Thirty year investments need to be made on the basis that they will be recoverable in the future in a timely manner. To the extent that increased risk is incurred, capital deployment and recovery mechanisms need to be adapted accordingly. The paper addresses possible strategic responses to competitive threats in order to protect investors and capital availability. While the paper does not propose new business models for the industry to pursue to address disruptive challenges in order to protect investors and retain access to capital, it does highlight several of the expectations and objectives of investors, which may lead to business model transformation alternatives.
Disruptive Challenges: Financial Implications and Strategic Responses to a Changing Retail Electric Business
Edison Electric Institute 3
Background
As a result of a confluence of factors (i.e., technological innovation, public policy support for sustainability and efficiency, declining trends in electricity demand growth, rising price pressures to maintain and upgrade the U.S. distribution grid, and enhancement of the generation fleet), the threat of disruptive forces (i.e., new products/markets that replace existing products/markets) impacting the utility industry is increasing and is adding to the effects of other types of disruptive forces like declining sales and end-use efficiency. While we cannot lay out an exact roadmap or timeline for the impact of potential disruptive forces, given the current shift in competitive dynamics, the utility industry and its stakeholders must be prepared to address these challenges in a way that will benefit customers, long-term economic growth, and investors. Recent business history has provided many examples of companies and whole industries that either failed or were slow to respond to disruptive forces and suffered as a result. Today, a variety of disruptive technologies are emerging that may compete with utility-provided services. Such technologies include solar photovoltaics (PV), battery storage, fuel cells, geothermal energy systems, wind, micro turbines, and electric vehicle (EV) enhanced storage. As the cost curve for these technologies improves, they could directly threaten the centralized utility model. To promote the growth of these technologies in the near-term, policymakers have sought to encourage disruptive competing energy sources through various subsidy programs, such as tax incentives, renewable portfolio standards, and net metering where the pricing structure of utility services allows customers to engage in the use of new technologies, while shifting costs/lost revenues to remaining non-participating customers. In addition, energy efficiency and DSM programs also promote reduced utility revenues while causing the utility to incur implementation costs. While decoupling recovery mechanisms, for example, may support recovery of lost revenues and costs, under/over recovery charges are typically imposed based on energy usage and, therefore, adversely impact non-participants of these programs. While the financial community is generally quite supportive of decoupling to capture lost revenues, investors have not delved into the long-term business and financial impact of cross subsidization on future customer rates inherent in most decoupling models and the effective recovery thereof. In other words, will non–DER participants continue to subsidize participants or will there be political pressure to not allow cost pass thru over time? The threat to the centralized utility service model is likely to come from new technologies or customer behavioral changes that reduce load. Any recovery paradigms that force cost of service to be spread over fewer units of sales (i.e., kilowatt-hours or kWh) enhance the ongoing competitive threat of disruptive alternatives. While the cost--recovery challenges of lost load can be partially addressed by revising tariff structures (such as a fixed charge or demand charge service component), there is often significant opposition to these recovery structures in order to encourage the utilization of new technologies and to promote customer behavior change. But, even if cross-subsidies are removed from rate structures, customers are not precluded from leaving the system entirely if a more cost-competitive alternative is available (e.g., a scenario where efficient energy storage combined with distributed generation could create the ultimate risk to grid viability). While tariff restructuring can be used to mitigate lost revenues, the longer-term threat of fully exiting from the grid (or customers solely using the electric grid for backup purposes) raises the potential for irreparable damages to revenues and growth prospects. This suggests that an old-line industry with 30-year cost recovery of investment is vulnerable to cost-recovery threats from disruptive forces.

Disruptive Challenges: Financial Implications and Strategic Responses to a Changing Retail Electric Business
4 Edison Electric Institute
Generators in organized, competitive markets are more directly exposed to threats from new technologies and enhanced efficiency programs, both of which reduce electricity use and demand. Reduced energy use and demand translate into lower prices for wholesale power and reduced profitability. With reduced profitability comes less cash flow to invest and to support the needs of generation customers. While every market-driven business is subject to competitive forces, public policy programs that provide for subsidized growth of competing technologies and/or participant economic incentives do not provide a level playing field upon which generators can compete fairly against new entrants. As an example, subsidized demand response programs or state contracted generation additions create threats to the generation owner (who competes based upon free market supply and demand forces). According to the Solar Electric Power Association (SEPA), there were 200,000 distributed solar customers (aggregating 2,400 megawatts or MW) in the United States as of 2011. Thus, the largest near-term threat to the utility model represents less than 1 percent of the U.S. retail electricity market. Therefore, the current level of activity can be “covered over” without noticeable impact on utilities or their customers. However, at the present time, 70 percent of the distributed activity is concentrated within 10 utilities, which obviously speaks to the increased risk allocated to a small set of companies. As previously stated, due to a confluence of recent factors, the threat to the utility model from disruptive forces is now increasingly viable. One prominent example is in the area of distributed solar PV, where the threats to the centralized utility business model have accelerated due to:
§ The decline in the price of PV panels from $3.80/watt in 2008 to $0.86/watt in mid-20121. While some will question the sustainability of cost-curve trends experienced, it is expected that PV panel costs will not increase (or not increase meaningfully) even as the current supply glut is resolved. As a result, the all-in cost of PV solar installation approximates $5/watt, with expectations of the cost declining further as scale is realized;
§ An increase in utility rates such that the competitive price opportunity for PV solar is now “in the market” for approximately 16 percent of the U.S. retail electricity market where rates are at or above $0.15/kWh2. In addition, projections by PV industry participants suggest that the “in the money” market size will double the share of contestable revenue by 2017 (to 33 percent, or $170 billion of annual utility revenue);
§ Tax incentives that promote specific renewable resources, including the 30-percent Investment Tax Credit (ITC) that is effective through 2016 and five-year accelerated depreciation recovery of net asset costs;
§ Public policies to encourage renewable resource development through Renewable Portfolio Standards (RPS), which are in place in 29 states and the District of Columbia and which call for renewable generation goals within a state’s energy mix;
§ Public policies to encourage net metering, which are in effect in 43 states and the District of Columbia (3 additional states have utilities with voluntary net metering programs) and which typically allow customers to sell excess energy generated back to the utility at a price greater than the avoided variable cost3;
§ Time-of-use rates, structured for higher electric rates during daylight hours, that create incentives for installing distributed solar PV, thereby taking advantage of solar benefit (vs. time-of-use peak rates) and net metering subsidies; and
1 Source: Bloomberg New Energy Finance, Solar Module Price Index 2 Source: Energy Information Agency, Electricity Data Overview 3 Source: Database for State Incentives for Renewables and Efficiency, www.dsireusa.org

Disruptive Challenges: Financial Implications and Strategic Responses to a Changing Retail Electric Business
Edison Electric Institute 5
§ The evolution of capital markets’ access to businesses that leverage the dynamics outlined above to support a for-profit business model. Examples include tax equity financing, project finance lending, residential PV leasing models (i.e., “no money down” for customers), and public equity markets for pure play renewable resource providers and owners. As an illustration, U.S. tax equity investment is running at $7.5 billion annualized for 2012.4 Add other sources of capital, including traditional equity, and this suggests the potential to fund a large and growing industry.
Bloomberg New Energy Finance (BNEF) projects that distributed solar capacity will grow rapidly as a result of the competitive dynamics highlighted. BNEF projects 22-percent compound annual growth in PV installations through 2020, resulting in 30 gigawatts (GW) of capacity overall (and approximately 4.5 GW coming from distributed PV). This would account for 10 percent of capacity in key markets coming from distributed resources and even a larger share of year-round energy generated. Assuming a decline in load, and possibly customers served, of 10 percent due to DER with full subsidization of DER participants, the average impact on base electricity prices for non-DER participants will be a 20 percent or more increase in rates, and the ongoing rate of growth in electricity prices will double for non-DER participants (before accounting for the impact of the increased cost of serving distributed resources). The fundamental drivers previously highlighted could suggest even further erosion of utility market share if public policy is not addressed to normalize this competitive threat. While the immediate threat from solar PV is location dependent, if the cost curve of PV continues to bend and electricity rates continue to increase, it will open up the opportunity for PV to viably expand into more regions of the country. According to ThinkEquity, a boutique investment bank, as the installed cost of PV declines from $5/watt to $3.5/watt (a 30-percent decline), the targeted addressable market increases by 500 percent, including 18 states and 20 million homes, and customer demand for PV increases by 14 times. If PV system costs decline even further, the market opportunity grows exponentially. In addition, other DER technologies being developed may also pose additional viable alternatives to the centralized utility model. Due to the variable nature of renewable DER, there is a perception that customers will always need to remain on the grid. While we would expect customers to remain on the grid until a fully viable and economic distributed non-variable resource is available, one can imagine a day when battery storage technology or micro turbines could allow customers to be electric grid independent. To put this into perspective, who would have believed 10 years ago that traditional wire line telephone customers could economically “cut the cord?” The cost of providing interconnection and back-up supply for variable resources will add to the utility cost burden. If not properly addressed in the tariff structure, the provision of these services will create additional lost revenues and will further challenge non-DER participants in terms of being allocated costs incurred to serve others. Another outcome of the trend of rising electricity prices is the potential growth in the market for energy efficiency solutions. Combining electricity price trends, customer sustainability objectives, and ratemaking incentives via cross-subsidies, it is estimated that spending on energy efficiency programs will increase by as much as 300 percent from 2010 to 2025, within a projected range of $6 to $16 billion per year5. This level of
4 Source: Bloomberg New Energy Finance, Renewable Energy-Research Note, July 18, 2012 5 Source: Lawrence Berkeley National Laboratory, The Future of Utility Funded Energy Efficiency Programs in the United
States: Projected Spending and Savings 2010 to 2025, January 2013
Disruptive Challenges: Financial Implications and Strategic Responses to a Changing Retail Electric Business
6 Edison Electric Institute
spending on energy efficiency services will have a meaningful impact on utility load and, thus, will create significant additional lost revenue exposure. The financial implications of these threats are fairly evident. Start with the increased cost of supporting a network capable of managing and integrating distributed generation sources. Next, under most rate structures, add the decline in revenues attributed to revenues lost from sales foregone. These forces lead to increased revenues required from remaining customers (unless fixed costs are recovered through a service charge tariff structure) and sought through rate increases. The result of higher electricity prices and competitive threats will encourage a higher rate of DER additions, or will promote greater use of efficiency or demand-side solutions. Increased uncertainty and risk will not be welcomed by investors, who will seek a higher return on investment and force defensive-minded investors to reduce exposure to the sector. These competitive and financial risks would likely erode credit quality. The decline in credit quality will lead to a higher cost of capital, putting further pressure on customer rates. Ultimately, capital availability will be reduced, and this will affect future investment plans. The cycle of decline has been previously witnessed in technology-disrupted sectors (such as telecommunications) and other deregulated industries (airlines).
Disruptive Threats—Strategic Considerations
A disruptive innovation is defined as “an innovation that helps create a new market and value network, and eventually goes on to disrupt an existing market and value network (over a few years or decades), displacing an earlier technology. The term is used in business and technology literature to describe innovations that improve a product or service in ways that the market does not expect, typically first by designing for a different set of consumers in the new market and later by lowering prices in the existing market.” Disruptive forces, if not actively addressed, threaten the viability of old-line exposed industries. Examples of once-dominant, blue chip companies/entities being threatened or succumbing to new entrants due to innovation include Kodak and the U.S. Postal Service (USPS). For years, Kodak owned the film and related supplies market. The company watched as the photo business was transformed by digital technology and finally filed for bankruptcy in 2012. Meanwhile, the USPS is a monopoly, government-run agency with a mission of delivering mail and providing an essential service to keep the economy moving. The USPS has been threatened for decades by private package delivery services (e.g., UPS and FedEx) that compete to offer more efficient and flexible service. Today, the primary threat to USPS’ viability is the delivery of information by email, including commercial correspondence such as bills and bill payments, bank and brokerage statements, etc. Many experts believe that the USPS must dramatically restructure its operations and costs to have a chance to protect its viability as an independent agency. Participants in all industries must prepare for and develop plans to address disruptive threats, including plans to replace their own technology with more innovative, more valuable customer services offered at competitive prices. The traditional wire line telephone players, including AT&T and Verizon, for example, became leaders in U.S. wireless telephone services, which over time could make the old line telephone product extinct. But these innovative, former old-line telephone providers had the vision to get in front of the trend to wireless and lead the development of non-regulated infrastructure networks and consumer marketing skills. As a result, they now hold large domestic market shares. In fact, they have now further leveraged technology innovation to create new products that expand their customer offerings.

Disruptive Challenges: Financial Implications and Strategic Responses to a Changing Retail Electric Business
Edison Electric Institute 7
The electric utility sector has not previously experienced a viable disruptive threat to its service offering due customer reliance and the solid economic value of its product. However, a combination of technological innovation, public/regulatory policy, and changes in consumer objectives and preferences has resulted in distributed generation and other DER being on a path to becoming a viable alternative to the electric utility model. While investors are eager to support innovation and economic progress, they do not support the use of subsidies to attack the financial viability of their invested capital. Utility investors may not be opposed to DER technologies, but, in order for utilities to maintain their access to capital, it is essential that the financial implications of DER technologies be addressed so that non-DER participants and investors are not left to pay for revenues lost (and costs unrecovered) from DER participants.
Finance 101 - Introduction to Corporate Finance
Investors allocate investment capital to achieve their financial objectives consistent with their tolerance for risk and time horizon. Fixed-income (i.e., bond) investors seek certainty as to (investment) returns through a guarantee by the debt issuer of timely payment of principal and interest. Equity investors seek a higher expected return than debt investors and, accordingly, must accept increased risk. “Expected” return refers to the distinction that equity investor returns are not guaranteed; therefore, equity investors bear a higher level of risk than bondholders. The expected return on equity investment is realized through a combination of dividends received and expected growth in value per share (which is achieved through a combination of growth in earnings and dividends and/or a rerating of return expectations as a result of investment market forces). Corporate financial objectives focus on enhancing shareholder value through achieving long-term growth consistent with the preservation of the corporate entity. Corporations develop financial policies to support the access to capital to achieve their business plans. For utilities, these financial policies are consistent with investment-grade credit ratings. Since practically all utilities have an ongoing need for capital to fund their capital expenditure programs, the industry has developed financial policies intended to support the access to relatively low-cost capital in (practically) all market environments. Under traditional cost-of-service ratemaking, customers benefit through lower cost of service and, therefore, lower rates. In order to retain the financial flexibility required to maintain investment-grade credit ratings, the rating agencies prefer policies that promote the retention of corporate cash flow and provide a liquidity cushion to support fixed obligations. Prudent corporate financial management disdains significant fixed commitments to investors—since such commitments limit management flexibility and increase capital-access dependency and risk. While paying dividends to equity investors is not a legal obligation, the rating agencies and investors view dividends as a moral (or intended) obligation that management will not reduce unless it has no viable alternative to preserve long-term corporate value. The corporate financial objective of retaining cash from operations to support credit quality limits the potential to pay dividends to investors. Thus, growth of investment value is required by equity investors (as discussed above) to achieve return expectations warranted by the increased risk taken and investment return expectations relative to fixed income investors. It is important to highlight that the rating agencies’ rating criteria and associated target corporate credit metrics reflect the credit risk of the industry environment of the corporation being rated. Thus, due to the benefits of a stable regulatory environment, utilities are able to maintain (for a given rating category) significantly more debt relative to cash flow than competitive industries. However, if business risks were to increase for utilities in the future, as we will discuss in the next sections, it would be likely that utility debt leverage (i.e., debt relative to cash flow) would need to be reduced in order to retain credit ratings.

Disruptive Challenges: Financial Implications and Strategic Responses to a Changing Retail Electric Business
8 Edison Electric Institute
Stable, mature industries—those that have a proven product, stable product demand, and low volatility related to their revenues and cash flow (the “defensive industries”)—are attractive to investors as they offer more certainty and fewer business and financial risks. As a result, investors in these stable, defensive industries (such as utilities) will require a lower expected return compared to investors in less mature and more volatile industries. We describe this lower expected return requirement as a lower cost of capital. This lower cost of capital associated with defensive industries is manifested in lower borrowing costs and higher relative share values. In addition, in difficult financial market environments (such as we experienced in October 2008 through March 2009), these stable businesses typically experience less adverse stock price impact due to investors fleeing in order to reduce risk. Thus, in difficult markets, mature companies have demonstrated ongoing financial market access (investor demand) when those in other industries have not. This is the benefit (or the “insurance policy”) of an investment-grade credit rating—lower capital costs and more stable access to capital despite market conditions. The benefit to customers of cost-of-service rate-regulated utilities is that a lower cost of capital contributes to lower utility rates. Also of importance, but often taken for granted, is the comfort that comes with knowing that utilities will have capital access to support the reliability and growth needs of their service territories and, thus, will not adversely expose customer service needs, including customer growth plans.
Finance 201 - Financial Market Realities
With the exception of a very few periods over the past century, utilities have experienced unfettered access to relatively low-cost capital. Even during challenging financial market environments when many industries have been effectively frozen from capital access, utilities have been able to raise capital to support their business plans. The primary reason for the markets’ willingness to provide capital to the utility sector is the confidence that investors place in the regulatory model, particularly the premise that utilities will be awarded the opportunity to earn a fair return on investor capital investment. However, at times of regulatory model uncertainty, we have seen the financial markets punish utility securities. Examples of periods of investor uncertainty would include the timeframe post the 1973 oil embargo, which was prior to the enactment of fuel adjustment clauses for purchased power; the nuclear power plant abandonments and cost disallowances of the 1980s that led to multiple bankruptcies and financial distress for quite a few utilities; the PURPA cost fallout of the 1990s; and the post-Enron bankruptcy collapse of the merchant power sector in the early 2000s, which challenged merchant energy providers and heavily exposed utility counterparties. These events led to bankruptcies, longstanding financial distress for impacted utilities, and ongoing erosion in credit quality and investor confidence. These examples highlight that regulated businesses are vulnerable to risks related to business model changes, economic trends and regulatory policy changes. When investors focus on these issues as being material risks, the impact on investors and capital formation can be significant.
Disruptive Challenges: Financial Implications and Strategic Responses to a Changing Retail Electric Business
Edison Electric Institute 9
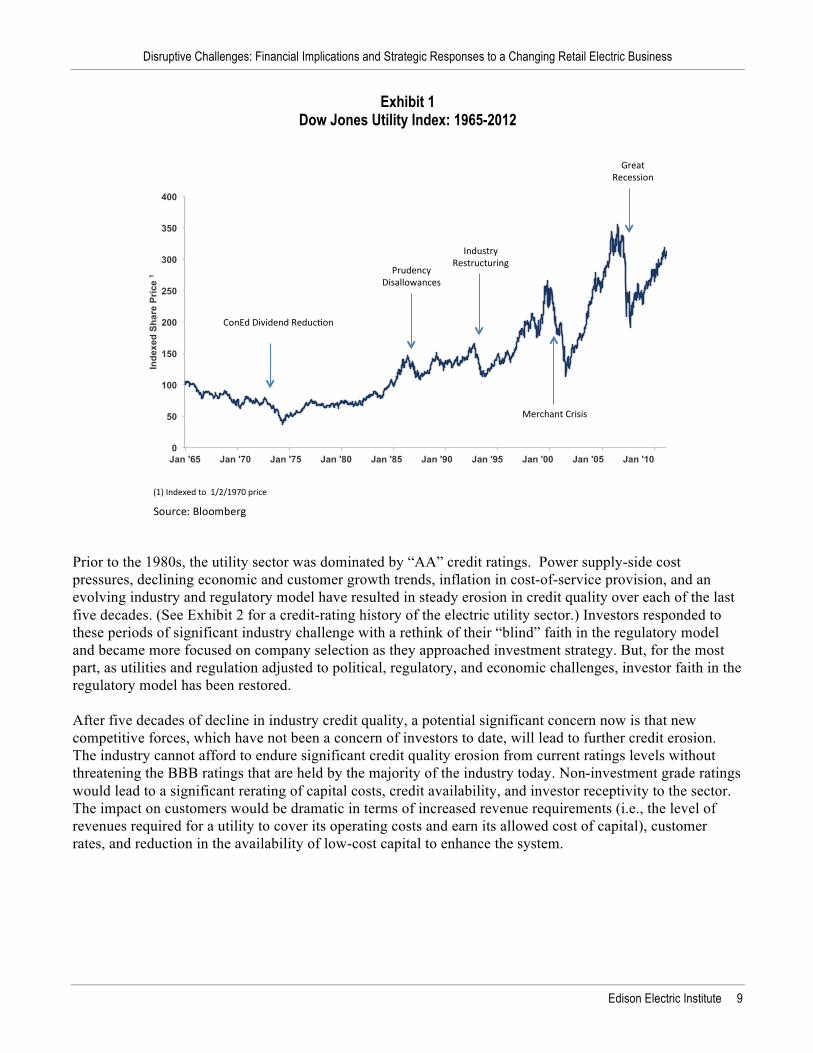
Exhibit 1 Dow Jones Utility Index: 1965-2012
Prior to the 1980s, the utility sector was dominated by “AA” credit ratings. Power supply-side cost pressures, declining economic and customer growth trends, inflation in cost-of-service provision, and an evolving industry and regulatory model have resulted in steady erosion in credit quality over each of the last five decades. (See Exhibit 2 for a credit-rating history of the electric utility sector.) Investors responded to these periods of significant industry challenge with a rethink of their “blind” faith in the regulatory model and became more focused on company selection as they approached investment strategy. But, for the most part, as utilities and regulation adjusted to political, regulatory, and economic challenges, investor faith in the regulatory model has been restored. After five decades of decline in industry credit quality, a potential significant concern now is that new competitive forces, which have not been a concern of investors to date, will lead to further credit erosion. The industry cannot afford to endure significant credit quality erosion from current ratings levels without threatening the BBB ratings that are held by the majority of the industry today. Non-investment grade ratings would lead to a significant rerating of capital costs, credit availability, and investor receptivity to the sector. The impact on customers would be dramatic in terms of increased revenue requirements (i.e., the level of revenues required for a utility to cover its operating costs and earn its allowed cost of capital), customer rates, and reduction in the availability of low-cost capital to enhance the system.
0
50
100
150
200
250
300
350
400
Jan '65 Jan '70 Jan '75 Jan '80 Jan '85 Jan '90 Jan '95 Jan '00 Jan '05 Jan '10
Inde
xed
Sha
re P
rice
1
(1)$Indexed$to$$1/2/1970$price$$
Prudency$Disallowances$
Industry$Restructuring$
Merchant$Crisis$
Great$Recession$
ConEd$Dividend$ReducEon$
Source: Bloomberg

Disruptive Challenges: Financial Implications and Strategic Responses to a Changing Retail Electric Business
10 Edison Electric Institute
Exhibit 2 Electric utility industry credit ratings distribution evolution (S&P Credit Ratings Distribution, U.S. Shareholder-Owned Electric Utilities)
As we look at the electric utility sector today, investors, for the most part, remain confident that the regulatory model will be applied fairly to provide them with the opportunity to earn a reasonable and fair return on their investment. Those states that have experienced prior upheavals in their regulatory model (e.g., California) have had to tighten their approach to regulatory cost recovery to convince investors that past problems have been addressed. If a state has not been as receptive to addressing its approach to past problems, then investors will be highly reticent to deploy capital in those jurisdictions. In reviewing recent sector research reports, the majority of security analysts continue to project future earnings levels based on assumed capital-investment levels and projected costs of capital (a bottoms-up approach). While analysts acknowledge that each rate case carries some degree of uncertainty, there appears to be limited focus in their analysis on service area quality, competitiveness of customer pricing, and the drivers for future service territory growth. No other significant industry is analyzed by Wall Street on a bottoms-up basis; the basis for analysis of non-utility industries is competitive position, sales prospects, and sales margins. In addition, the threat of disruptive forces is given no (or almost no) printed lines in utility sector research. This approach to investment analysis is based upon confidence in utilities’ ability to earn a fair return on prudent investment. But, it may expose investors to the future economic risks posed by rapid growth in DER. What will happen as technological advancement in the utility sector provides customers with viable competitive alternatives?
0%
20%
40%
60%
80%
100%
1970 1980 1990 2000 2011
AAA AA+, AA, AA- A+, A, A-
BBB+, BBB BBB- BB+, BB, BB-, B+, B, B-, CCC+
Source: Standard & Poor’s, Macquarie CapitalSource: Standard & Poor’s, Macquarie Capital
Disruptive Challenges: Financial Implications and Strategic Responses to a Changing Retail Electric Business
Edison Electric Institute 11
Finance 501 - Financial Implications of Disruptive Forces
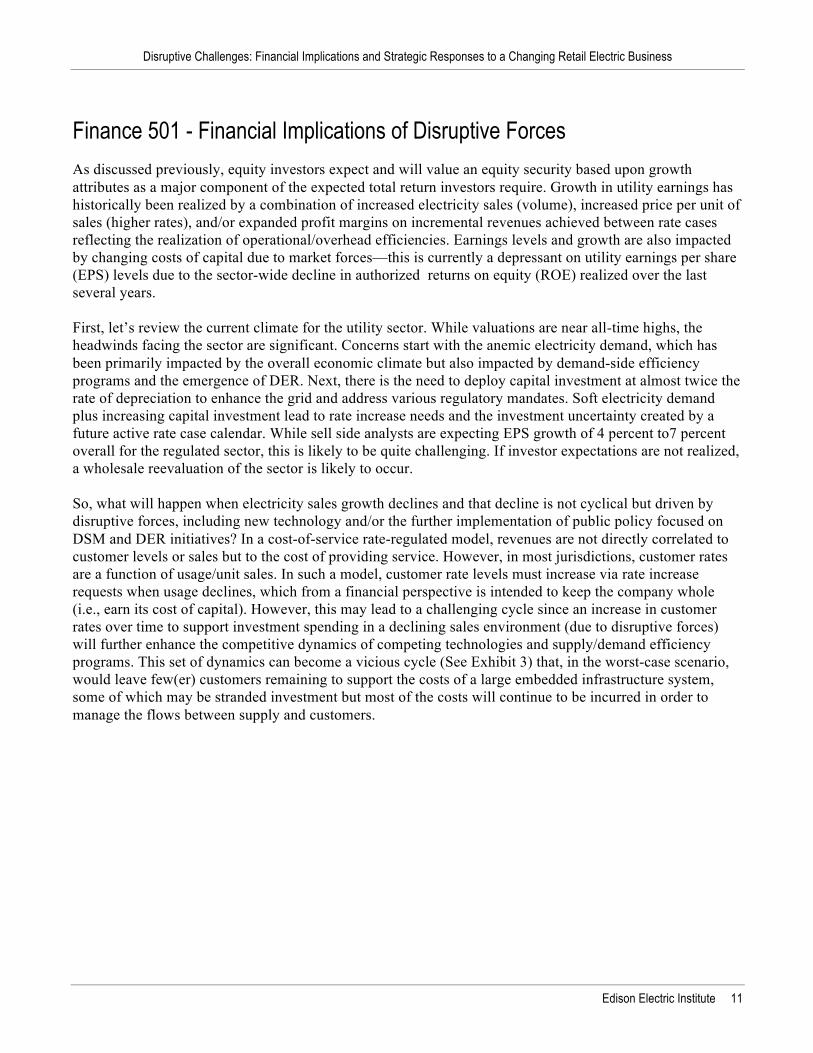
As discussed previously, equity investors expect and will value an equity security based upon growth attributes as a major component of the expected total return investors require. Growth in utility earnings has historically been realized by a combination of increased electricity sales (volume), increased price per unit of sales (higher rates), and/or expanded profit margins on incremental revenues achieved between rate cases reflecting the realization of operational/overhead efficiencies. Earnings levels and growth are also impacted by changing costs of capital due to market forces—this is currently a depressant on utility earnings per share (EPS) levels due to the sector-wide decline in authorized returns on equity (ROE) realized over the last several years. First, let’s review the current climate for the utility sector. While valuations are near all-time highs, the headwinds facing the sector are significant. Concerns start with the anemic electricity demand, which has been primarily impacted by the overall economic climate but also impacted by demand-side efficiency programs and the emergence of DER. Next, there is the need to deploy capital investment at almost twice the rate of depreciation to enhance the grid and address various regulatory mandates. Soft electricity demand plus increasing capital investment lead to rate increase needs and the investment uncertainty created by a future active rate case calendar. While sell side analysts are expecting EPS growth of 4 percent to7 percent overall for the regulated sector, this is likely to be quite challenging. If investor expectations are not realized, a wholesale reevaluation of the sector is likely to occur. So, what will happen when electricity sales growth declines and that decline is not cyclical but driven by disruptive forces, including new technology and/or the further implementation of public policy focused on DSM and DER initiatives? In a cost-of-service rate-regulated model, revenues are not directly correlated to customer levels or sales but to the cost of providing service. However, in most jurisdictions, customer rates are a function of usage/unit sales. In such a model, customer rate levels must increase via rate increase requests when usage declines, which from a financial perspective is intended to keep the company whole (i.e., earn its cost of capital). However, this may lead to a challenging cycle since an increase in customer rates over time to support investment spending in a declining sales environment (due to disruptive forces) will further enhance the competitive dynamics of competing technologies and supply/demand efficiency programs. This set of dynamics can become a vicious cycle (See Exhibit 3) that, in the worst-case scenario, would leave few(er) customers remaining to support the costs of a large embedded infrastructure system, some of which may be stranded investment but most of the costs will continue to be incurred in order to manage the flows between supply and customers.
Disruptive Challenges: Financial Implications and Strategic Responses to a Changing Retail Electric Business
12 Edison Electric Institute
Exhibit 3 Vicious Cycle from Disruptive Forces
When investors realize that a business model has been stung by systemic disruptive forces, they likely will retreat. When is the typical tipping point when investors realize that the merits of the investment they are evaluating or monitoring has been forever changed? Despite all the talk about investors assessing the future in their investment evaluations, it is often not until revenue declines are reported that investors realize that the viability of the business is in question. An interesting example is the story of RIM, the manufacturer of the Blackberry handheld information management tool. From its public start in the 1990s thru 2008, RIM was a Wall Street darling. Its share price was less than $3 in 1999 and peaked at $150 in 2008. The company started to show a stall in sales in 2011, and, now, despite a large cash position and 90 million subscribers, the market is questioning RIM’s ability to survive and RIM’s stock has plummeted from its high. What happened to this powerful growth company that had dominant market shares in a growth market? The answer is the evolution of the iPhone, which transformed the handheld from an email machine to a dynamic Internet tool with seemingly unlimited applications/functionality. When the iPhone was first released in 2007, it was viewed as a threat to RIM, but RIM continued to grow its position until the introduction of the iPhone 4 in June 2010. The iPhone 4, which offered significant improvements from prior versions, led to a retreat in RIM’s business and caused a significant drop in its stock price. It seems that investors have proven to be reasonably optimistic on selected industries even though the competitive threat is staring them head-on. However, if we can identify actionable disruptive forces to a business or industry, then history tells us that management and investors need to take these threats seriously
Technology Innovation
(DER)
Energy Efficiency (EE/DR)
Lost Revenues
Rate Increase Required
Customer Assessment
Behavior Change
DER

Disruptive Challenges: Financial Implications and Strategic Responses to a Changing Retail Electric Business
Edison Electric Institute 13
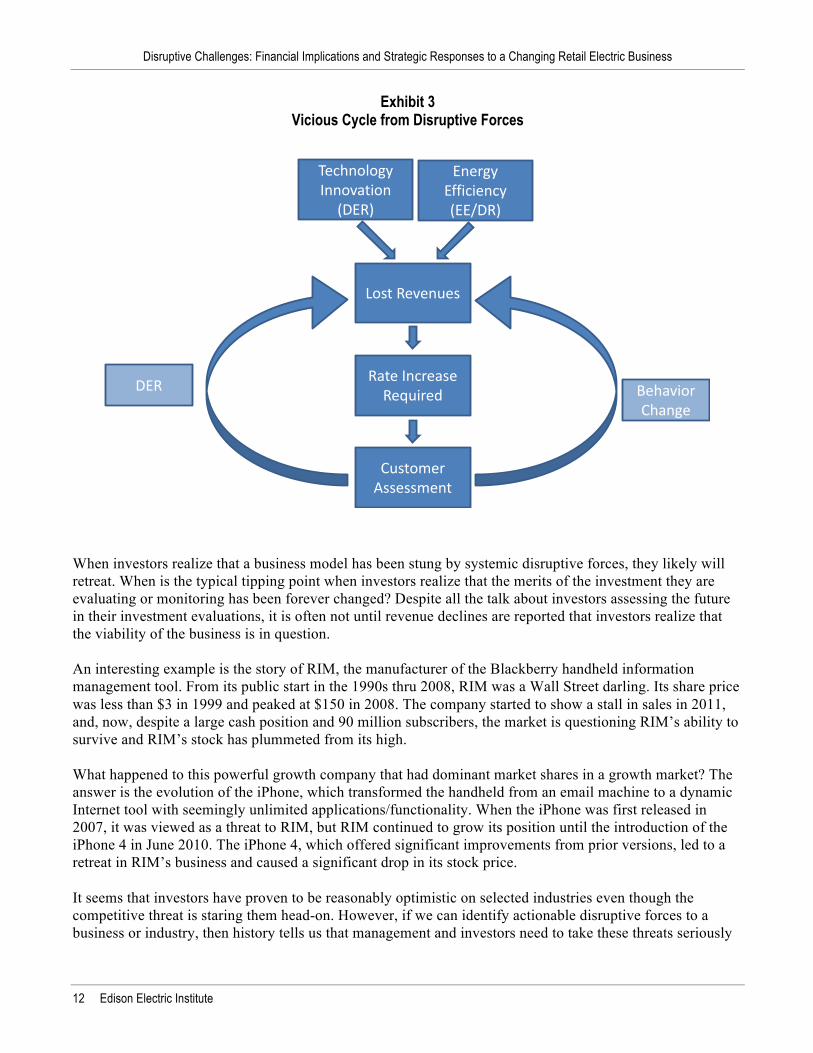
and not wait until the decline in sales and revenues has commenced to develop a new strategy or, in the case of investors, realize their loss. As discussed above, investors in the utility sector seek increased certainty (or less risk) than in other industries and have confidence in the consistent application of ratemaking recovery models to provide a lower degree of investment risk. As a result of this confidence, when instances have occurred in the past that have not provided consistent application of expected cost recovery models, investors have responded and have caused significant adverse impact on entities’ ability to raise incremental capital. But, with the exception of the California energy crisis in the early 2000s, these events reflected embedded cost issues that had defined exposures and time frames. Disruptive changes are a new type of threat to the electric utility industry. Disruptive changes lead to declining customer and usage per customer levels that cannot be easily quantified as to the potential threat posed to corporate profitability. This type of problem has not been faced before by the electric industry and, thus, must be understood as to the strategic issues and alternatives that are raised. The new potential risk to utility investors from disruptive forces is the impact on future earnings growth expectations. Lost revenues within a net metering paradigm, for instance, are able to be recovered in future rate cases. However, without a shift in tariff structures, there is only so much of an increase that can be placed on remaining non-DER customers before political pressure is brought to bear on recovery mechanisms. Once the sustainability of the utility earnings model is questioned, investors will look at the industry through a new lens, and the view from this lens will be adverse to all stakeholders, including investors and customers. While we do not know the degree to which customer participation in DER and behavior change will impact utility earnings growth, the potential impact, based upon DER trends, is considerable (as stated earlier, industry projections propose that 33 percent of the market will be in the money for DER by 2017, assuming current tax and regulatory policies). Today, regulated utilities have seen allowed returns on equity decline to around 10 percent, a multi-decade low point, as a result of declining interest rates (See Exhibit 4). The cost of equity has also been growing. However, the risks in the business have never been higher, due to increasing customer rate pressures from capital expenditures required to upgrade the grid and address environmental mandates, inflation, low/negative demand growth from active customers, and the threat of load lost due to the rapid development of DER and disruptive forces. The impact of declining allowed returns and increasing business risk will place pressure on the quality and value of utility investments. How large of an impact on investment value will be a function of the impact of disruptive forces described herein. But, lower stock prices will likely translate into lower levels of capital spend, lower domestic economic growth, and fewer grid enhancements.
Disruptive Challenges: Financial Implications and Strategic Responses to a Changing Retail Electric Business
14 Edison Electric Institute
Exhibit 4 History of Allowed ROE’s (U.S. Shareholder-Owned Electric Utilities)
(Based on regulatory cases settled each quarter)
Telephone Industry Parallels
There are other examples in other industries that can provide lessons as to the risks of disruptive change confronting the U.S. electric utility industry. The once fully regulated, monopoly telephone industry provides one clear example. The telephone industry experienced significant technological changes that led to deregulation—initially in the long-distance sector and then followed by the local exchange market. Beginning in the 1970s, the impact of an array of new technologies (e.g., satellite, microwave, and fiber optic technologies) led to increased telephone system capacity and a reduction in the cost of providing telephone service. These technological changes provided the opportunity for competition by new entrants using newer technologies, while the monopoly service provided by AT&T used older analog technology. In 1974, MCI, a new entrant, filed an anti-trust case challenging AT&T’s monopoly powers in long-distance telephone service. The U.S. government ruled against AT&T in 1982, which led to a negotiated plan to break up the Bell system, which was completed in 1984. As a result, long-distance telephone service and the Bell Labs’ research arms were housed in AT&T. The local provision of phone service (i.e., intrastate regional calls) was to remain regulated and was to be provided by seven Bell Operating Companies (“the Baby Bells”). By 1996, the Telecommunications Act opened the local telephone market to competition and allowed for Internet providers to acquire spectrum services. Dramatic technological change has evolved over the past 35 years, which has led to the development of a new infrastructure system; new services that are providing abundant transfer of information; and the convergence of voice, data, and entertainment into one combined service from what had previously been
9
10
11
12
13
14
Q11990
Q11992
Q11994
Q11996
Q11998
Q12000
Q12002
Q12004
Q12006
Q12008
Q12010
Q12012
ROE(
%)
Source: SNL Financial/Regulatory Research Associates (RRA), EEI Rate Department

Disruptive Challenges: Financial Implications and Strategic Responses to a Changing Retail Electric Business
Edison Electric Institute 15
viewed as separate and distinct services and industries. Today, the number of customers who utilize the previously exclusive “copper wire “telephone system represents a rapidly declining percentage of the market for telephone services. (Verizon Communications, for example, has lost approximately 45 percent of its wire line customers over the past five years.) Today, many customers access voice services exclusively through mobile cellular (wireless) phones, a technology that became commercially viable in the mid- to late-1980s. In addition, the advent of cable-based phone service has sped the decline in copper-based services. This transformation in the telephone sector of pre-1982 to today has not been smooth or easy. Significant capital investment has been made to develop new technologies and related infrastructure—it is estimated of that more than $300 billion has been deployed to build out new telephone infrastructure. New entrants have experienced booms and busts as the supply of capacity outstripped demand, leading to bankruptcies and mergers. The original AT&T, the seven Baby Bells, and several large independent monopolies (e.g., GTE, Citizens, United Telephone and Alltel) have merged into four independent companies. The sector today is dominated by wireless and cable-based technologies.
Exhibit 5 Verizon Stock Price vs. S&P500 from 2000 to 2012
There are important lessons to be learned from the history of the telephone industry. First, at the onset of the restructuring of the Bell System, there was no vision that the changes to come would be so radical in terms of the services to be provided and the technologies to be deployed. Second, the telephone players acted boldly to consolidate to gain scale and then take action to utilize their market position to expand into new services on a national scale. Finally, and most important, if telephone providers had not pursued new technologies and the transformation of their business model, they would not have been able to survive as viable businesses today. So, while the sector has underperformed the overall market since 2000, and as shown in Exhibit 5, even a leading industry participant like Verizon Communications has not been able to perform in-line with
0
20
40
60
80
100
120
Dec '99 Dec '01 Dec '03 Dec '05 Dec '07 Dec '09 Dec '11
Inde
xed
Sha
re P
rice
1
Verizon S&P 500 (1)$Indexed$to$12/31/1999$price$$
— Verizon$loses$~45%$of$wireless$customers$+ Verizon$experienced$leading$US$wireless$share$+ Verizon$experiences$rapid$growth$in$fiber$“He”$bundle$
Source: FactSet
Disruptive Challenges: Financial Implications and Strategic Responses to a Changing Retail Electric Business
16 Edison Electric Institute
the overall market despite its growth, market share and solid profitability outlook due to the competitive uncertainties inherent in the business. However, those telecom providers that have embraced new technologies and addressed the competitive threats they faced have managed to survive and to protect investors from a “Kodak moment.”
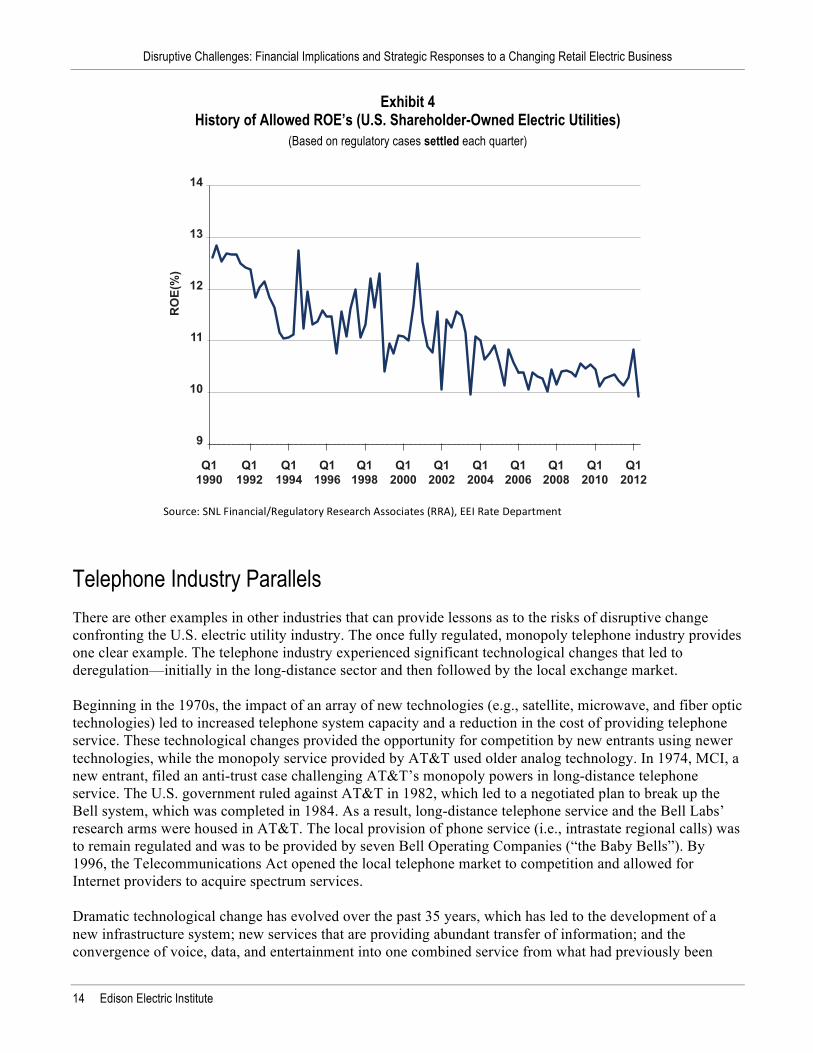
Exhibit 6 Credit Capacity of Regulated vs. Competitive Industries
(1) “DDM COE” is dividend discount model cost of equity
From being led by a “AAA” rated company with monopoly powers (AT&T), the telecommunications industry looks very different today. Services today are often comprised of a bundle of telephone, Internet, and entertainment options provided on an unlimited basis by a monthly fee (relative to usage-based pricing prior to 1982). The market has seen significant new entrants, capital investment, and boom and bust periods leading to bankruptcies and/or mergers to enhance scale. Due to the increased competitive business risk, the credit-rating agencies have downgraded the credit rating of AT&T from “AAA” in 1981 to “A “today. In addition, due to competitive business dynamics, the credit rating agencies expect to see significantly lower debt leverage (thereby, raising the overall cost of capital) in order to support the credit ratings assigned. To compare with the electric sector, a comparable rating in telecom would bear approximately 50 percent of the leverage level of a regulated electric utility—resulting in an approximately 35 percent higher pre-tax weighted cost of capital for the telephone sector based on credit-ratings metrics (See Exhibit 6). While customers have benefitted from a proliferation of new services provided at a lower cost, investors have not done as well in financing a transition to a competitive industry. These lessons should be fully
Sector/Segment Enterprise Value ($bn) Credit Ratings Credit Quality Metrics
Moody’s S&P FFO/Debt Debt/EBITDA
Regulated Utilities
Southern Company $63 Baa1 A 25% 3.5x
ConEd 27 Baa1 A-‐ 25% 3.3x
Xcel Energy 24 Baa1 A-‐ 23% 3.8x
Hybrid Utilities
Exelon Corp 48 Baa2 BBB 55% 3.1xPSEG Resources 23 Baa2 BBB 38% 2.3x
Telephone
AT&T 266 A2 A-‐ 54% 2.1xVerizon Communications 222 A3 A-‐ 63% 1.9x
DDM COE (1) Debt / EBITDA Implied Debt / Capital Pre-‐Tax WACC
Regulated Entity 10% 3.5 50% 10.20%
Competitive Telco 12% 2 34% 13.80%
Competitive Sector Cost Premium 3.60%
% Change in WACC 35.00%
Disruptive Challenges: Financial Implications and Strategic Responses to a Changing Retail Electric Business
Edison Electric Institute 17
considered as stakeholders shape the approach electric utilities pursue in participating in an environment where disruptive technologies may transform the provision of services and the providers of these new services. One significant difference between the electric sector and the telecom restructuring example is the value of the respective infrastructure following the disruptive threat. In the telecom situation, the original copper wire phone network is of no/low value in a wireless, Internet protocol, landline world. However, the value of the electric grid to the customer is retained in a distributed generation environment as the grid provides the highway to sell power generated by the DER and the back-up resource infrastructure to deliver power required when the DER is not meeting the load obligation of its provider. In essence, while a wireless user does not need a landline, an electric consumer-generator will not be able to and will not necessarily want to achieve full independence from the “wired” utility grid. So, while the telecom example is a tale of responding to the threat of obsolescence, the near-term challenge to the electric sector is providing the proper tariff design to allow for equitable recovery of revenue requirements to address the pace of non-economic sector disruption.
Strategic Implications of Distribution 2020 Disruptive Forces
The threats posed to the electric utility industry from disruptive forces, particularly distributed resources, have serious long-term implications for the traditional electric utility business model and investor opportunities. While the potential for significant immediate business impact is currently low (due to low DER participation to date), the industry and its stakeholders must begin to seriously address these challenges in order to mitigate the potential impact of disruptive forces, given the prospects for significant DER participation in the future. One example of a significant potential adverse impact to utility investors stems from net metering. Utilities have witnessed the implementation of net metering rules in all but a handful of states. Lost revenues from DER are being recovered from non-DER customers in order to encourage distributed generation implementation. This type of lost revenue recovery drives up the prices of those non-participating customers and creates the environment for ongoing loss of additional customers as the system cost is transferred to a smaller and smaller base of remaining customers. Utility investors are not being compensated for the risks associated with customer losses resulting from increasing DER. It is difficult to identify a rate case in which the cost-of-capital implications of net metering were considered. At the point when utility investors become focused on these new risks and start to witness significant customer and earnings erosion trends, they will respond to these challenges. But, by then, it may be too late to repair the utility business model. DER is not the only disruptive risk the industry faces. Energy efficiency and DSM programs that promote lower electricity sales pressure earnings required to support capital investment. Without a tariff structure that properly allocates fixed vs. variable costs, any structure for lost revenues would come at a cost to non-participating customers, who will then be more motivated to find alternatives to reduce their consumption. While it is not the objective of this paper to outline new business model alternatives to address disruptive challenges, there are a number of actions that utilities and stakeholders should consider on a timely basis to align the interests of all stakeholders, while avoiding additional subsidies for non-participating customers.

Disruptive Challenges: Financial Implications and Strategic Responses to a Changing Retail Electric Business
18 Edison Electric Institute
These actions include: Immediate Actions:
§ Institute a monthly customer service charge to all tariffs in all states in order to recover fixed costs and eliminate the cross-subsidy biases that are created by distributed resources and net metering, energy efficiency, and demand-side resources;
§ Develop a tariff structure to reflect the cost of service and value provided to DER customers, being off-peak service, back-up interruptible service, and the pathway to sell DER resources to the utility or other energy supply providers; and
§ Analyze revision of net metering programs in all states so that self-generated DER sales to utilities are treated as supply-side purchases at a market-derived price. From a load provider’s perspective, this would support the adoption of distributed resources on economically driven bases, as opposed to being incentivized by cross subsidies.
Longer-term Actions:
§ Assess appropriateness of depreciation recovery lives based on the economic useful life of the investment, factoring the potential for disruptive loss of customers;
§ Consider a stranded cost charge in all states to be paid by DER and fully departing customers to recognize the portion of investment deemed stranded as customers depart;
§ Consider a customer advance in aid of construction in all states to recover upfront the cost of adding new customers and, thus, mitigate future stranded cost risk;
§ Apply more stringent capital expenditure evaluation tools to factor-in potential investment that may be subject to stranded cost risk, including the potential to recover such investment through a customer hook-up charge or over a shorter depreciable life;
§ Identify new business models and services that can be provided by electric utilities in all states to customers in order to recover lost margin while providing a valuable customer service—this was a key factor in the survival of the incumbent telephone players post deregulation; and
§ Factor the threat of disruptive forces in the requested cost of capital being sought. Investors have no desire to sit by and watch as disruptive forces slice away at the value and financial prospects of their investment. While the utility sector provides an important public good for customers, utilities and financial managers of investments have a fiduciary responsibility to protect the value of invested capital. Prompt action to mitigate lost revenue, while protecting customers from cross-subsidization better aligns the interests of customers and investors. As growth in earnings and value is a major component of equity investment returns, what will investors expect to see as a strategic response from the industry to disruptive forces? The way to realize growth in earnings is to develop profit streams to counterbalance the impact of disruptive forces. Examples of new profit sources would include ownership of distributed resources with the receipt of an ongoing service fee or rate basing the investment and financial incentives for utilities to encourage demand side/energy efficiency benefits for customers. From an investor perspective, this may be easier said than done because the history of the electric utility industry in achieving non-regulated profits/value creation streams has not been a pleasant experience. So, investors will want to see very clear cut programs to capture value that are consistent with the core strengths of utilities: ability to execute construction projects, to provide dependable service with high reliability, and to access relatively low-cost capital.
Disruptive Challenges: Financial Implications and Strategic Responses to a Changing Retail Electric Business
Edison Electric Institute 19
Summary
While the threat of disruptive forces on the utility industry has been limited to date, economic fundamentals and public policies in place are likely to encourage significant future disruption to the utility business model. Technology innovation and rate structures that encourage cross subsidization of DER and/or behavioral modification by customers must be addressed quickly to mitigate further damage to the utility franchise and to better align interests of all stakeholders. Utility investors seek a return on investment that depends on the increase in the value of their investment through growth in earnings and dividends. When customers have the opportunity to reduce their use of a product or find another provider of such service, utility earnings growth is threatened. As this threat to growth becomes more evident, investors will become less attracted to investments in the utility sector. This will be manifested via a higher cost of capital and less capital available to be allocated to the sector. Investors today appear confident in the utility regulatory model since the threat of disruptive forces has been modest to date. However, the competitive economics of distributed energy resources, such as PV solar, have improved significantly based on technology innovation and government incentives and subsidies, including tax and tariff-shifting incentives. But with policies in place that encourage cross subsidization of proactive customers, those not able or willing to respond to change will not be able to bear the responsibility left behind by proactive DER participating customers. It should not be left to the utility investor to bear the cost of these subsidies and the threat to their investment value. This paper encourages an immediate focus on revising state and federal policies that do not align the interests of customers and investors, particularly revising utility tariff structures in order to eliminate cross subsidies (by non-DER participants) and utility investor cost-recovery uncertainties. In addition, utilities and stakeholders must develop policies and strategies to reduce the risk of ongoing customer disruption, including assessing business models where utilities can add value to customers and investors by providing new services. While the pace of disruption cannot be predicted, the mere fact that we are seeing the beginning of customer disruption and that there is a large universe of companies pursuing this opportunity highlight the importance of proactive and timely planning to address these challenges early on so that uneconomic disruption does not proceed further. Ultimately, all stakeholders must embrace change in technology and business models in order to maintain a viable utility industry.
The Edison Electric Institute (EEI) is the association of U.S. shareholder-owned electric companies. Our members serve 95% of the ultimate customers in the shareholder-owned seg-ment of the industry, and represent approximately 70% of the U.S. electric power industry. We also have as Affiliate mem-bers more than 80 International electric companies, and as Associate members more than 200 industry suppliers and related organizations.
Organized in 1933, EEI works closely with all of its mem-bers, representing their interests and advocating equitable policies in legislative and regulatory arenas.
EEI provides public policy leadership, critical industry data, strategic business intelligence, one-of-a-kind conferences and forums, and top-notch products and services.
For more information on EEI programs and activities, products and services, or membership, visit our Web site at www.eei.org.
Congrès annuel 2006 de l’ACB CDA 2006 Annual Conference Québec, Quebec city, Canada CANADIAN DAM ASSOCIATION 30 Septembre – 5 Octobre, 2006 ASSOCIATION CANADIENNE DES BARRAGES September 30 – October 6, 2006 INTERRELATIONS BETWEEN FAILURE MECHANISMS Marc Smith, Hydro Québec Claude Marche, École Polytechnique de Montréal Benoît Robert, École Polytechnique de Montréal ABSTRACT Existing risk analysis methodologies have some limitations in representing the interrelations between failure mechanisms which must be considered to assess the overall risk of the dam system since they may be more the rule than the exception in dam safety. The multiple failure mechanisms related to existing hydraulic structures have been assessed using bayesian networks. The proposed global and multidisciplinary approach allowed the comparison, according to the probability of failure being used as a common denominator, of the geotechnical, hydrological and structural risks. The numerous interrelations between failure mechanisms and the uncertainties that are always present in the analyses were taken into account. The factors contributing the most to the overall risk have been identified as well as the interventions to be realized in priority. RÉSUMÉ Les méthodes actuelles d'analyse du risque présentent certaines limitations en ce qui a trait à la représentation des interrelations entre les mécanismes de rupture. Ces interrelations doivent être considérées car elles sont plus souvent la règle que l'exception en sécurité des barrages. Les risques multiples posés par un aménagement hydraulique existant ont été étudiés à l'aide des réseaux bayésiens. L'approche globale et multidisciplinaire proposée a permis de comparer, selon le dénominateur commun qu'est la probabilité de rupture, les risques géotechniques, hydrologiques et structuraux. Les nombreuses interrelations entre les mécanismes de rupture et les incertitudes toujours présentes dans les analyses ont été prises en compte. Les facteurs contribuant le plus au risque ont ainsi été identifiés de même que les travaux de réfection à réaliser en priorité. 1. INTRODUCTION No one can predict risk with certainty because two of its main characteristics are complexity and uncertainty (Denis 1998). Even when a dam is judged to be safe, there still exists a residual risk that is always present if population or property are located in the flood zone. Dam failures are not common but they always have important human, material and environmental consequences. The establishment of risk-reduction measures is therefore an important part of the responsibilities of a dam owner. Risk analysis includes the disaggregation of a complex dam system into more fundamental components and the determination of potential failure mechanisms where the physical processes that could lead to dam failure are described. The analyzes are often realized using event trees or fault trees which allow the decomposition of the potential failure mechanisms and provide qualitative insight to how a chain of events leading to dam failure might unfold. They can also be used quantitatively with the help of probabilities to assess the reliability of the system under consideration. However, these methodologies present some limitations related to the representation of dam risk in absolute terms and also in taking into account the interactions between the failure mechanisms. The failure mechanisms are usually assumed to be independent although they are most of the time strongly interrelated. For example, a single initiator can trigger many failure mechanisms and the occurrence of one mechanism can promote another. These interactions must be considered to assess the overall risk of the dam system since the risks related to each of its components are not simply additive. Also, a more global approach is required to identify the factors contributing the most to the overall risk and to justify rehabilitation measures according to their risk-reduction potential. The use of bayesian networks is proposed to overcome some weaknesses of the existing tools and to capitalize on their merits. This paper discusses how bayesian networks were used for the global analysis of the geotechnical and hydrological risks related to an embankment dam in Asia and the risk related to the reliability of the electrical/mechanical components of the adjoining spillway.
1
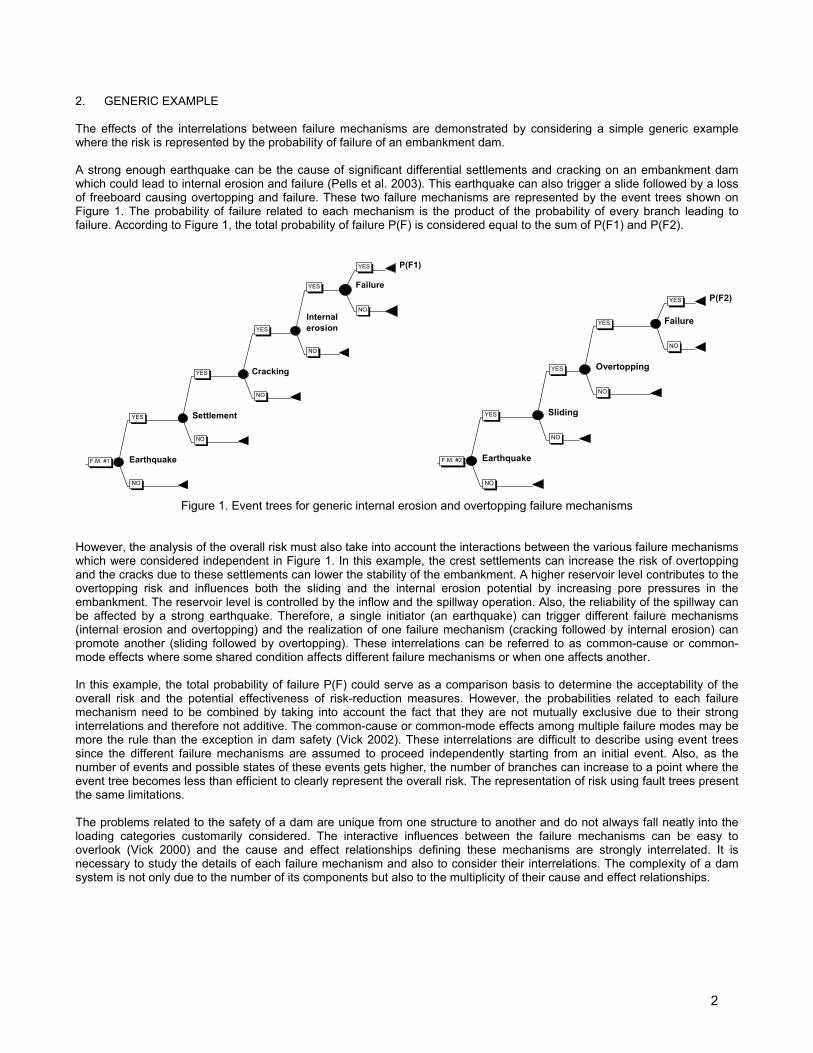
2. GENERIC EXAMPLE The effects of the interrelations between failure mechanisms are demonstrated by considering a simple generic example where the risk is represented by the probability of failure of an embankment dam. A strong enough earthquake can be the cause of significant differential settlements and cracking on an embankment dam which could lead to internal erosion and failure (Pells et al. 2003). This earthquake can also trigger a slide followed by a loss of freeboard causing overtopping and failure. These two failure mechanisms are represented by the event trees shown on Figure 1. The probability of failure related to each mechanism is the product of the probability of every branch leading to failure. According to Figure 1, the total probability of failure P(F) is considered equal to the sum of P(F1) and P(F2).
P(F1)
Failure
Internalerosion
Cracking
Settlement
EarthquakeF.M. #1
YES
NO
YES
NO
YES
NO
YES
NO
YES
NO
P(F2)
Failure
Overtopping
Sliding
EarthquakeF.M. #2
YES
NO
YES
NO
YES
NO
YES
NO
Figure 1. Event trees for generic internal erosion and overtopping failure mechanisms
However, the analysis of the overall risk must also take into account the interactions between the various failure mechanisms which were considered independent in Figure 1. In this example, the crest settlements can increase the risk of overtopping and the cracks due to these settlements can lower the stability of the embankment. A higher reservoir level contributes to the overtopping risk and influences both the sliding and the internal erosion potential by increasing pore pressures in the embankment. The reservoir level is controlled by the inflow and the spillway operation. Also, the reliability of the spillway can be affected by a strong earthquake. Therefore, a single initiator (an earthquake) can trigger different failure mechanisms (internal erosion and overtopping) and the realization of one failure mechanism (cracking followed by internal erosion) can promote another (sliding followed by overtopping). These interrelations can be referred to as common-cause or common-mode effects where some shared condition affects different failure mechanisms or when one affects another. In this example, the total probability of failure P(F) could serve as a comparison basis to determine the acceptability of the overall risk and the potential effectiveness of risk-reduction measures. However, the probabilities related to each failure mechanism need to be combined by taking into account the fact that they are not mutually exclusive due to their strong interrelations and therefore not additive. The common-cause or common-mode effects among multiple failure modes may be more the rule than the exception in dam safety (Vick 2002). These interrelations are difficult to describe using event trees since the different failure mechanisms are assumed to proceed independently starting from an initial event. Also, as the number of events and possible states of these events gets higher, the number of branches can increase to a point where the event tree becomes less than efficient to clearly represent the overall risk. The representation of risk using fault trees present the same limitations. The problems related to the safety of a dam are unique from one structure to another and do not always fall neatly into the loading categories customarily considered. The interactive influences between the failure mechanisms can be easy to overlook (Vick 2000) and the cause and effect relationships defining these mechanisms are strongly interrelated. It is necessary to study the details of each failure mechanism and also to consider their interrelations. The complexity of a dam system is not only due to the number of its components but also to the multiplicity of their cause and effect relationships.
2
Bayesian networks can be used to analyze dam risk in a global manner by describing the interrelations between the failure mechanisms and by taking into account the uncertainties and expert judgements always present in risk analyses. The use of bayesian networks will help provide answers to the following questions:
1. What are the most significant factors contributing to the overall risk? 2. What are the rehabilitation works to be realized in priority?
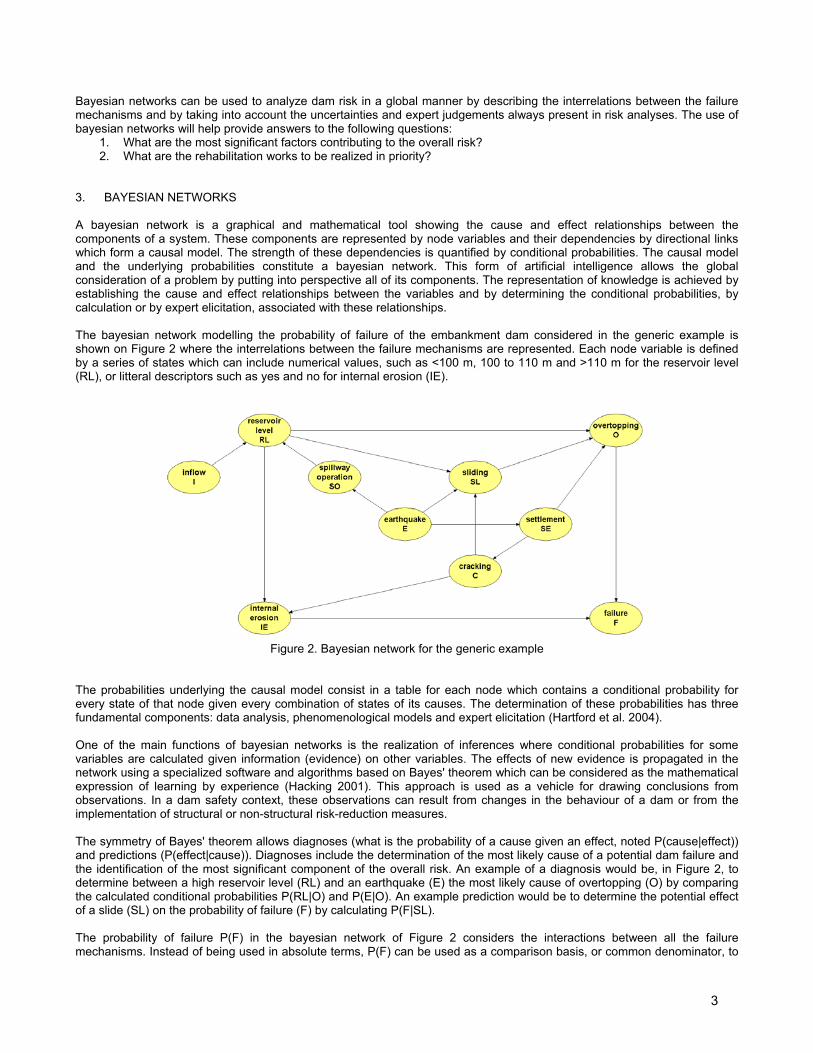
3. BAYESIAN NETWORKS A bayesian network is a graphical and mathematical tool showing the cause and effect relationships between the components of a system. These components are represented by node variables and their dependencies by directional links which form a causal model. The strength of these dependencies is quantified by conditional probabilities. The causal model and the underlying probabilities constitute a bayesian network. This form of artificial intelligence allows the global consideration of a problem by putting into perspective all of its components. The representation of knowledge is achieved by establishing the cause and effect relationships between the variables and by determining the conditional probabilities, by calculation or by expert elicitation, associated with these relationships. The bayesian network modelling the probability of failure of the embankment dam considered in the generic example is shown on Figure 2 where the interrelations between the failure mechanisms are represented. Each node variable is defined by a series of states which can include numerical values, such as <100 m, 100 to 110 m and >110 m for the reservoir level (RL), or litteral descriptors such as yes and no for internal erosion (IE).
Figure 2. Bayesian network for the generic example
The probabilities underlying the causal model consist in a table for each node which contains a conditional probability for every state of that node given every combination of states of its causes. The determination of these probabilities has three fundamental components: data analysis, phenomenological models and expert elicitation (Hartford et al. 2004). One of the main functions of bayesian networks is the realization of inferences where conditional probabilities for some variables are calculated given information (evidence) on other variables. The effects of new evidence is propagated in the network using a specialized software and algorithms based on Bayes' theorem which can be considered as the mathematical expression of learning by experience (Hacking 2001). This approach is used as a vehicle for drawing conclusions from observations. In a dam safety context, these observations can result from changes in the behaviour of a dam or from the implementation of structural or non-structural risk-reduction measures. The symmetry of Bayes' theorem allows diagnoses (what is the probability of a cause given an effect, noted P(cause|effect)) and predictions (P(effect|cause)). Diagnoses include the determination of the most likely cause of a potential dam failure and the identification of the most significant component of the overall risk. An example of a diagnosis would be, in Figure 2, to determine between a high reservoir level (RL) and an earthquake (E) the most likely cause of overtopping (O) by comparing the calculated conditional probabilities P(RL|O) and P(E|O). An example prediction would be to determine the potential effect of a slide (SL) on the probability of failure (F) by calculating P(F|SL). The probability of failure P(F) in the bayesian network of Figure 2 considers the interactions between all the failure mechanisms. Instead of being used in absolute terms, P(F) can be used as a comparison basis, or common denominator, to
3

assess the relative effectiveness of potential risk-reduction measures (Smith 2005). Inferences can help prioritize these measures by the comparison of P(F|risk-reduction measure) with P(F). For example, possible risk-reduction measures could include the construction of a filtering berm and the upgrade of the spillway. The effect of the first option would be to cancel the risk of internal erosion (IE = no) and the effect of the second to keep the spillway operational after an earthquake (SO = yes). Prioritization is realized by assessing the effects of these measures on P(F) by comparing P(F|IE = no) and P(F|SO = yes). The concepts presented in this simple generic example have contributed to solve an actual risk analysis problem for a project involving irrigation and flood protection works in Asia. 4. PROBLEM DESCRIPTION The analyzed project is comprised of a dam and a spillway. The dam is a 25 m high and 860 m long clay embankment without internal drainage and founded on untreated soil foundation. The construction went on sporadically over a period of ten years according to the limited material and human resources available at that time. The fill placement was realized without the use of heavy machinery and quality control procedures. The spillway, located near the left abutment of the dam, is equipped with three gates lifted manually using a winch installed on a mobile gantry crane (see Figure 3 on right). A electrical motor is available to facilitate gate lifting.
Figure 3. Internal erosion and lifting mechanism
A dam safety assessment showed that the internal erosion process has initiated (see Figure 3 on left) and is still progressing due to the absence of filters in the dam and its foundation. The reservoir level has been lowered to somewhat control the progression of internal erosion. However, these restrictions greatly reduced the volume of water available for irrigation which in turn affected negatively the local farmers and the economy of the region. An insufficient spillway capacity and a lack of adequate freeboard represent a significant overtopping risk for the dam during typhoons due to the heavy precipitations and waves caused by strong winds. Moreover, the mechanical/electrical components of the spillway are unreliable. Also, during periods of strong winds, the gantry crane becomes unstable and cannot be operated. The risk of overtopping is significant even during less severe flooding events. Rehabilitation works are needed to increase the safety of the civil works and to reduce the risks imposed to the population living downstream. These measures will also restore irrigation and flood control capabilities. Four options are considered:
1. Rehabilitation of the existing gates and lifting mechanism. 2. Addition of a fourth gate to increase spilling capacity. 3. Construction of a filtering berm to control the ongoing internal erosion. 4. Construction of a parapet wall on the dam crest to increase storage volume and flood routing capabilities.
4
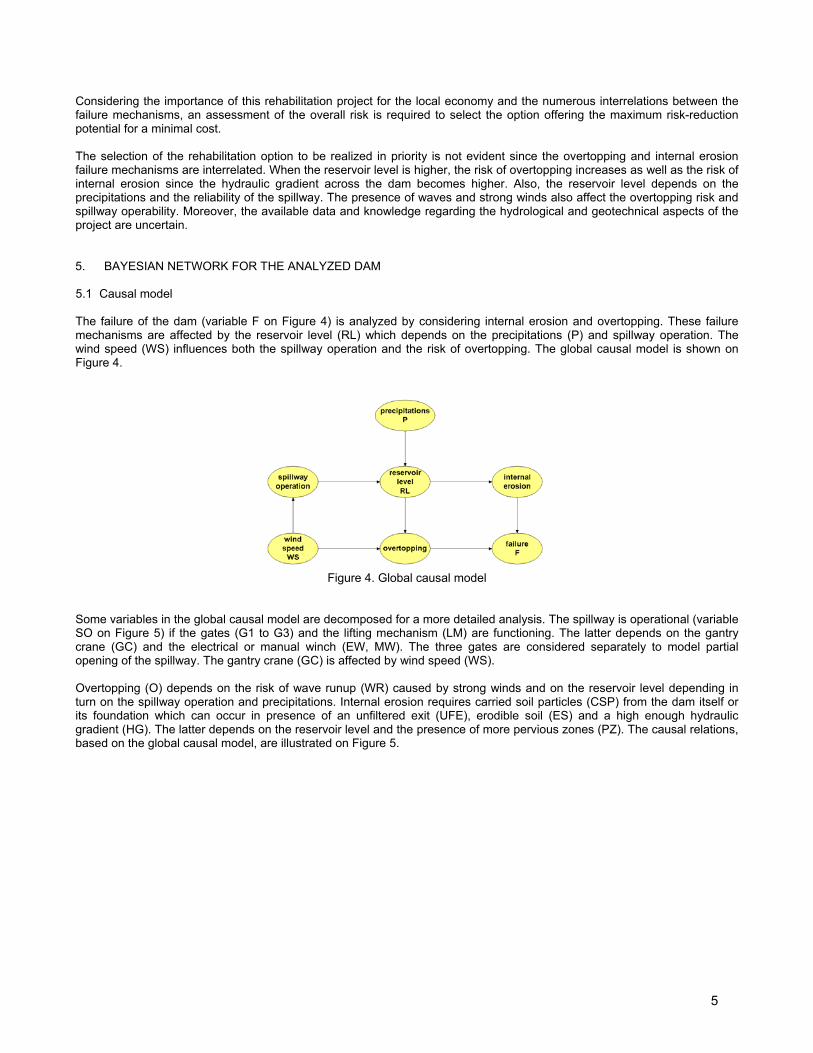
Considering the importance of this rehabilitation project for the local economy and the numerous interrelations between the failure mechanisms, an assessment of the overall risk is required to select the option offering the maximum risk-reduction potential for a minimal cost. The selection of the rehabilitation option to be realized in priority is not evident since the overtopping and internal erosion failure mechanisms are interrelated. When the reservoir level is higher, the risk of overtopping increases as well as the risk of internal erosion since the hydraulic gradient across the dam becomes higher. Also, the reservoir level depends on the precipitations and the reliability of the spillway. The presence of waves and strong winds also affect the overtopping risk and spillway operability. Moreover, the available data and knowledge regarding the hydrological and geotechnical aspects of the project are uncertain. 5. BAYESIAN NETWORK FOR THE ANALYZED DAM 5.1 Causal model The failure of the dam (variable F on Figure 4) is analyzed by considering internal erosion and overtopping. These failure mechanisms are affected by the reservoir level (RL) which depends on the precipitations (P) and spillway operation. The wind speed (WS) influences both the spillway operation and the risk of overtopping. The global causal model is shown on Figure 4.
Figure 4. Global causal model
Some variables in the global causal model are decomposed for a more detailed analysis. The spillway is operational (variable SO on Figure 5) if the gates (G1 to G3) and the lifting mechanism (LM) are functioning. The latter depends on the gantry crane (GC) and the electrical or manual winch (EW, MW). The three gates are considered separately to model partial opening of the spillway. The gantry crane (GC) is affected by wind speed (WS). Overtopping (O) depends on the risk of wave runup (WR) caused by strong winds and on the reservoir level depending in turn on the spillway operation and precipitations. Internal erosion requires carried soil particles (CSP) from the dam itself or its foundation which can occur in presence of an unfiltered exit (UFE), erodible soil (ES) and a high enough hydraulic gradient (HG). The latter depends on the reservoir level and the presence of more pervious zones (PZ). The causal relations, based on the global causal model, are illustrated on Figure 5.
5
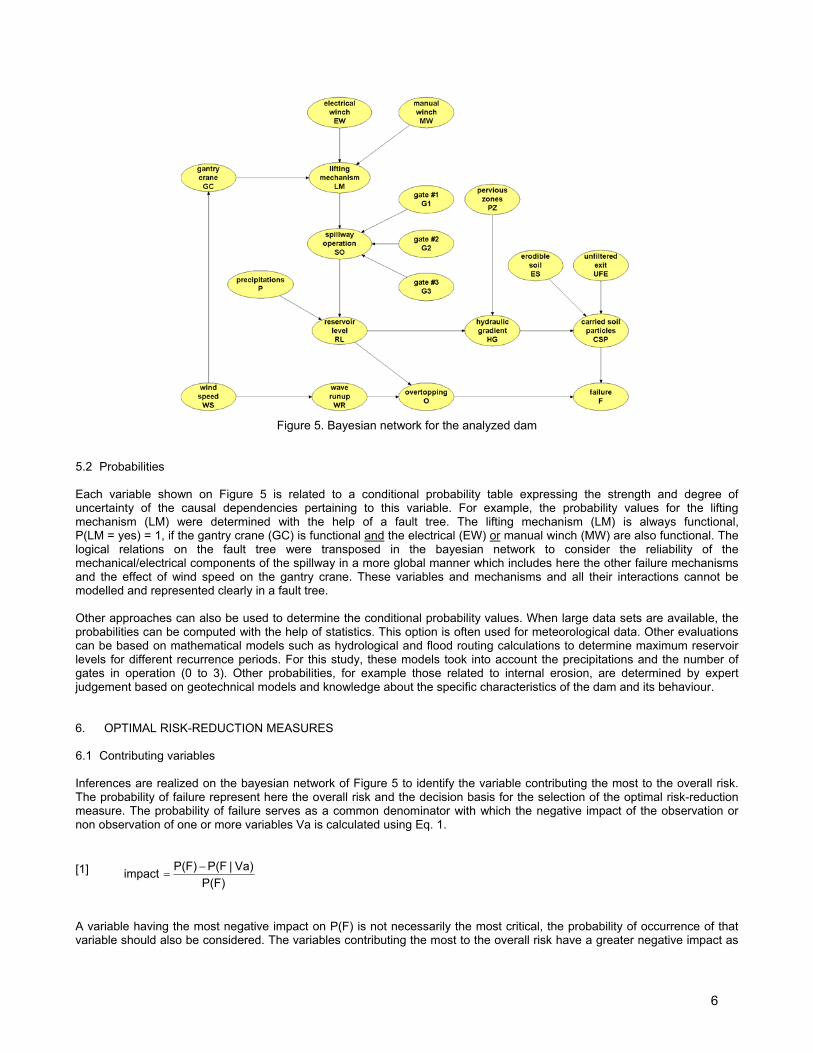
Figure 5. Bayesian network for the analyzed dam
5.2 Probabilities Each variable shown on Figure 5 is related to a conditional probability table expressing the strength and degree of uncertainty of the causal dependencies pertaining to this variable. For example, the probability values for the lifting mechanism (LM) were determined with the help of a fault tree. The lifting mechanism (LM) is always functional, P(LM = yes) = 1, if the gantry crane (GC) is functional and the electrical (EW) or manual winch (MW) are also functional. The logical relations on the fault tree were transposed in the bayesian network to consider the reliability of the mechanical/electrical components of the spillway in a more global manner which includes here the other failure mechanisms and the effect of wind speed on the gantry crane. These variables and mechanisms and all their interactions cannot be modelled and represented clearly in a fault tree. Other approaches can also be used to determine the conditional probability values. When large data sets are available, the probabilities can be computed with the help of statistics. This option is often used for meteorological data. Other evaluations can be based on mathematical models such as hydrological and flood routing calculations to determine maximum reservoir levels for different recurrence periods. For this study, these models took into account the precipitations and the number of gates in operation (0 to 3). Other probabilities, for example those related to internal erosion, are determined by expert judgement based on geotechnical models and knowledge about the specific characteristics of the dam and its behaviour. 6. OPTIMAL RISK-REDUCTION MEASURES 6.1 Contributing variables Inferences are realized on the bayesian network of Figure 5 to identify the variable contributing the most to the overall risk. The probability of failure represent here the overall risk and the decision basis for the selection of the optimal risk-reduction measure. The probability of failure serves as a common denominator with which the negative impact of the observation or non observation of one or more variables Va is calculated using Eq. 1. [1]
P(F)Va)|P(FP(F)impact −
=
A variable having the most negative impact on P(F) is not necessarily the most critical, the probability of occurrence of that variable should also be considered. The variables contributing the most to the overall risk have a greater negative impact as
6
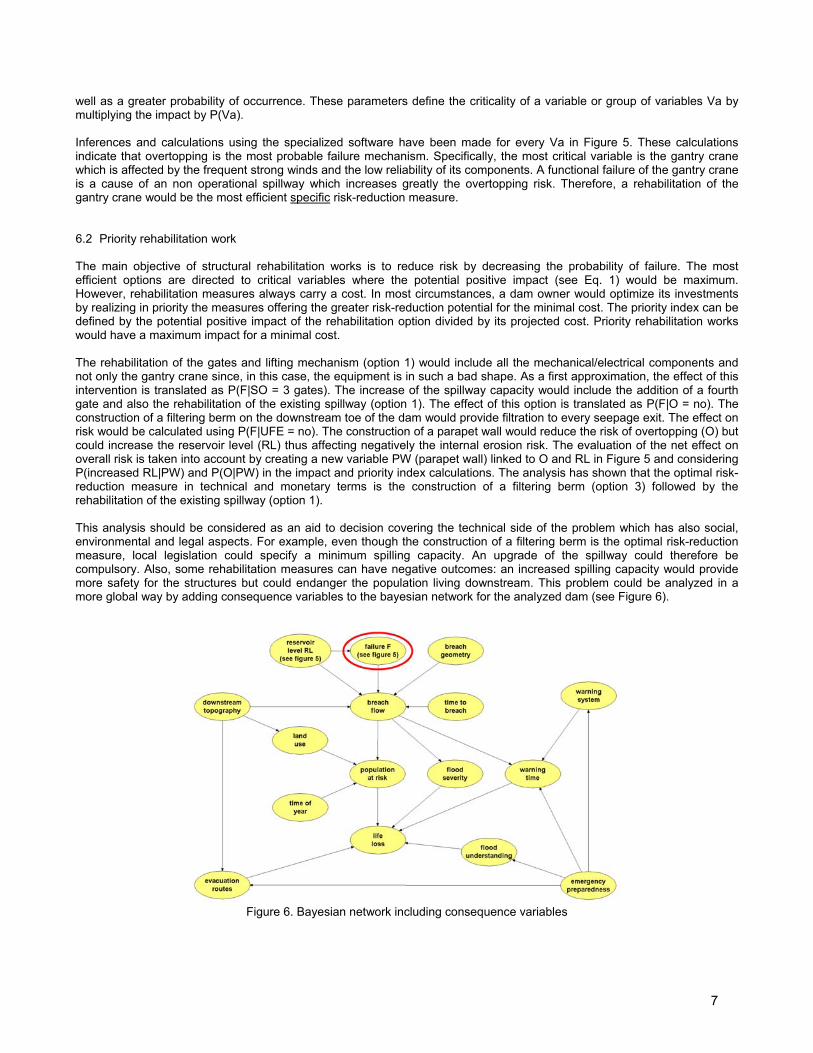
well as a greater probability of occurrence. These parameters define the criticality of a variable or group of variables Va by multiplying the impact by P(Va). Inferences and calculations using the specialized software have been made for every Va in Figure 5. These calculations indicate that overtopping is the most probable failure mechanism. Specifically, the most critical variable is the gantry crane which is affected by the frequent strong winds and the low reliability of its components. A functional failure of the gantry crane is a cause of an non operational spillway which increases greatly the overtopping risk. Therefore, a rehabilitation of the gantry crane would be the most efficient specific risk-reduction measure. 6.2 Priority rehabilitation work The main objective of structural rehabilitation works is to reduce risk by decreasing the probability of failure. The most efficient options are directed to critical variables where the potential positive impact (see Eq. 1) would be maximum. However, rehabilitation measures always carry a cost. In most circumstances, a dam owner would optimize its investments by realizing in priority the measures offering the greater risk-reduction potential for the minimal cost. The priority index can be defined by the potential positive impact of the rehabilitation option divided by its projected cost. Priority rehabilitation works would have a maximum impact for a minimal cost. The rehabilitation of the gates and lifting mechanism (option 1) would include all the mechanical/electrical components and not only the gantry crane since, in this case, the equipment is in such a bad shape. As a first approximation, the effect of this intervention is translated as P(F|SO = 3 gates). The increase of the spillway capacity would include the addition of a fourth gate and also the rehabilitation of the existing spillway (option 1). The effect of this option is translated as P(F|O = no). The construction of a filtering berm on the downstream toe of the dam would provide filtration to every seepage exit. The effect on risk would be calculated using P(F|UFE = no). The construction of a parapet wall would reduce the risk of overtopping (O) but could increase the reservoir level (RL) thus affecting negatively the internal erosion risk. The evaluation of the net effect on overall risk is taken into account by creating a new variable PW (parapet wall) linked to O and RL in Figure 5 and considering P(increased RL|PW) and P(O|PW) in the impact and priority index calculations. The analysis has shown that the optimal risk-reduction measure in technical and monetary terms is the construction of a filtering berm (option 3) followed by the rehabilitation of the existing spillway (option 1). This analysis should be considered as an aid to decision covering the technical side of the problem which has also social, environmental and legal aspects. For example, even though the construction of a filtering berm is the optimal risk-reduction measure, local legislation could specify a minimum spilling capacity. An upgrade of the spillway could therefore be compulsory. Also, some rehabilitation measures can have negative outcomes: an increased spilling capacity would provide more safety for the structures but could endanger the population living downstream. This problem could be analyzed in a more global way by adding consequence variables to the bayesian network for the analyzed dam (see Figure 6).
Figure 6. Bayesian network including consequence variables
7

In Figure 6, some factors influencing the potential number of lives lost (see also USBR 1999) are shown as well as their interactions. The variable F is an object representing a collapsed version of the bayesian network of Figure 5. An object-oriented network allows to think in terms of hierarchies when all the details of a complex system cannot be considered simultaneously. Inferences can be made using Figure 6 to compare the risk-reduction potential of structural measures (for example the construction of a berm) and non-structural measures such as the implementation of a warning system. The comparison basis or common denominator to be used is then chosen in relation with the type of decision to be made. The same concepts could be applied to multiple structures on a given project and to multiple projects located in the same basin. 7. CONCLUSIONS The presented concepts allowed the determination of the overall dam risk which took into account the numerous interrelations between failure mechanisms as well as the uncertainties that are always present in the analyses. Risk was characterized without reference to an absolute interpretation of the probability of failure which can cause problems related to its use. The probability of failure was rather considered as a comparison basis, or a common denominator, used for the determination of the relative importance of each uncertain element that could cause failure and to judge the potential effectiveness of structural or non structural risk-reduction measures. The use of bayesian networks has contributed to solve an actual risk analysis problem for a project involving irrigation and flood protection works. It was possible to compare, according to the probability of failure being used as a common denominator, the geotechnical and hydrological risks related to the embankment dam as well as the risk related to the reliability of the electrical/mechanical components of the spillway. The analysis has allowed the identification of the factors contributing the most to the overall risk and the interventions to be realized in priority. The proposed multidisciplinary approach has contributed to the analysis of risks related to essential infrastructures by concepts which consider risk in a more global and holistic way.
8. ACKNOWLEDGEMENTS The authors acknowledge Hydro Québec for its support during the realization of this research. 9. REFERENCES Denis, H. 1998. Comprendre et gérer les risques sociotechnologiques majeurs. Éditions de l'École Polytechnique de
Montréal, Montréal, 342 p. Hacking, I. 2001. Probability and inductive logic. Cambridge University Press, Cambridge, 302 p. Hartford, D.N.D. and Baecher, G.B. 2004. Risk and uncertainty in dam safety. Thomas Telford, London, 391 p. Pells, S. and Fell, R. 2003. “Damage and cracking of embankment dams by earthquake and the implications for internal
erosion and piping.” Proc. of the 21st International Congress on Large Dams, Montréal, pp. 259-274. Smith, M. 2005. Réduction du risque barrage par l'utilisation des réseaux bayésiens. Ph.D. thesis, École Polytechnique de
Montréal, 288 p. United States Bureau of Reclamation (USBR). 1999. A procedure for estimating loss of life caused by dam failure. Technical
report DSO-99-06, Dam Safety Office, Denver, 43 p . Vick, S.G. 2000. “Engineering application of dam safety risk analysis.” Proc. of the 20th International Congress on Large
Dams, Beijing, pp. 325-335. Vick, S.G. 2002. Degrees of belief. ASCE Press, Reston, 455 p.
8