Disposal on pasture of Christchurch sewage sludge
97
Disposal on Pasture of Christchurch Sewage Sludge ·L. G. Livingstone
Transcript of Disposal on pasture of Christchurch sewage sludge

Disposal on Pastureof ChristchurchSewage Sludge
·L.G. Livingstone
DISPOSAL ON PASTURE OF CHRISTCHURCH
SEWAGE SLUDGE
A research report
prepared for the
Christchurch Drainage Board
by
L.G. Livingstone
Soil Science DepartmentLincoln College
University College of AgricultureCanterbury
New Zealand1980

( i )
PREFACE
This report presents the findings of a research programme intothe disposal of sludge on Christchurch Drainage Board pasture. Thestudy was formulated by staff of the Drainage Board and the Soil ScienceDepartment of Lincoln College.
The original objectives of the research proposal were to useglasshouse and field trials to establish sludge application rates andthe effect of sludge on pasture production and quality. As investigations proceeded, some aspects were found to be unnecessary in thelight of other published reports, while other aspects needed greaterattention. The investigation of chromium in particular was notenvisaged initially,
The overall conclusions and recommendations are summarised inthe first chapter. Details of the study on which they are basedconstitute the remainder of this report. Specific conclusions anddetailed discussions are given at the end of each section.
The programme commenced mid 1976 and was designed to run forthree years. The "Report of Chief Engineer to the Construction andTreatment Works Committee on Bromley Sewage Sludge", May 1975, containedmuch initial information outlining the reasons why such a study wasnecessary.

3.0
4.0
PREFACE
CHAPTER
1.0
2.0
( i i )
CONTENTS
GENERAL SU~,1MARY
DISPOSAL OF SLUDGE2.1 General Introduction2.2 Description of soil and sludge2.3 Survey of soilsSLUDGE INFLUENCE ON PASTURE3.1 Sludge on soils3.2 Heavy metals in sludge3.3 Materials and methods for sludge pot trial3.4 Results and discussion
3.4.1 Herbage yields3.4.2 Cation uptake3.4.3 Heavy metals
3.5 Sludge trial conclusionsSLUDGE CHROMIU~1
4.1 Toxicity of Chromium4.2 Availability of soil chromium4.3 Plant uptake of chromium4.4 Chromium in sludge4.5 Material and methods for the Cr-amended
sludge trial4.6 Results and discussion
4.6.1 Herbage yields4.6.2 Cation and metal uptake4.6.3 Chromium from tanning
4.7 Conclusions from the Cr-amended sludgetrial
5.0 FIELD TRIAL5.1 Objectives5.2 Materials and methods5.3 Results and Discussion
5.4 Field trial conclusionsACKNOWLEDGEMENTSREFERENCESAPPENDICES
pAGE
1
33
48
11
11
14
18
19
19
21
253233
3336
38
41
44
46465359
61
636363
65
70
72
73
80

TABLE
2-1
2-2
2-3
3-1
3-2
4-1
4-24-3
5-1
( iii)
LIST OF TABLES
Some properties of Kairaki sand and Christchurch
sludge
Major metal concentrations in Kairaki sand and
Christchurch sludge
Mean and range of metal contents for typical
sludges
Exchangeable bases in sludge pot trial soils
Ratio of uptake of cations in ryegrass tops to
initial exchangeable plus soluble cations in the
pot
Published values for chromium content of lucerne
Chromium concentrations in reported sludge trials
Effect of additional chromium on soil CEC and
extractable cations
Maximum possible depression of yield for pasture
species from chromium calculated from field trial
results using Christchurch sludge
PAGE
5
7
7
23
24
39
43
56
69
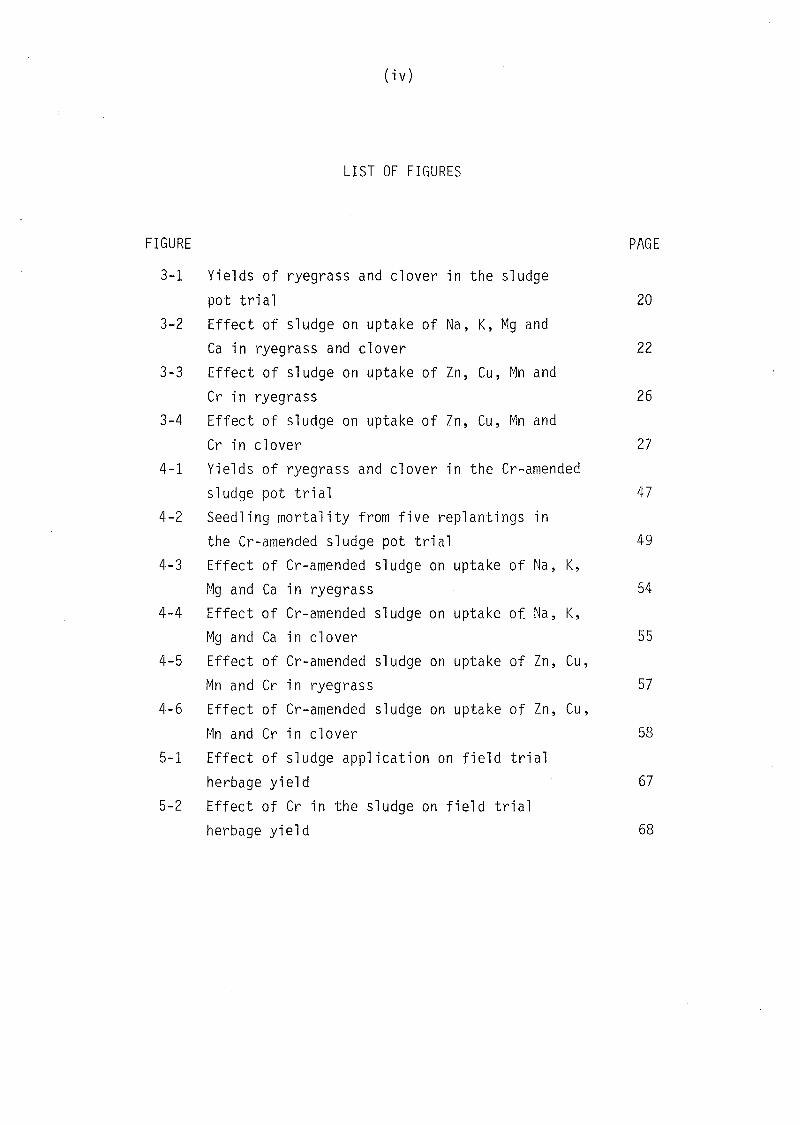
(iv)
LIST OF FIGURES
FIGURE PAGE
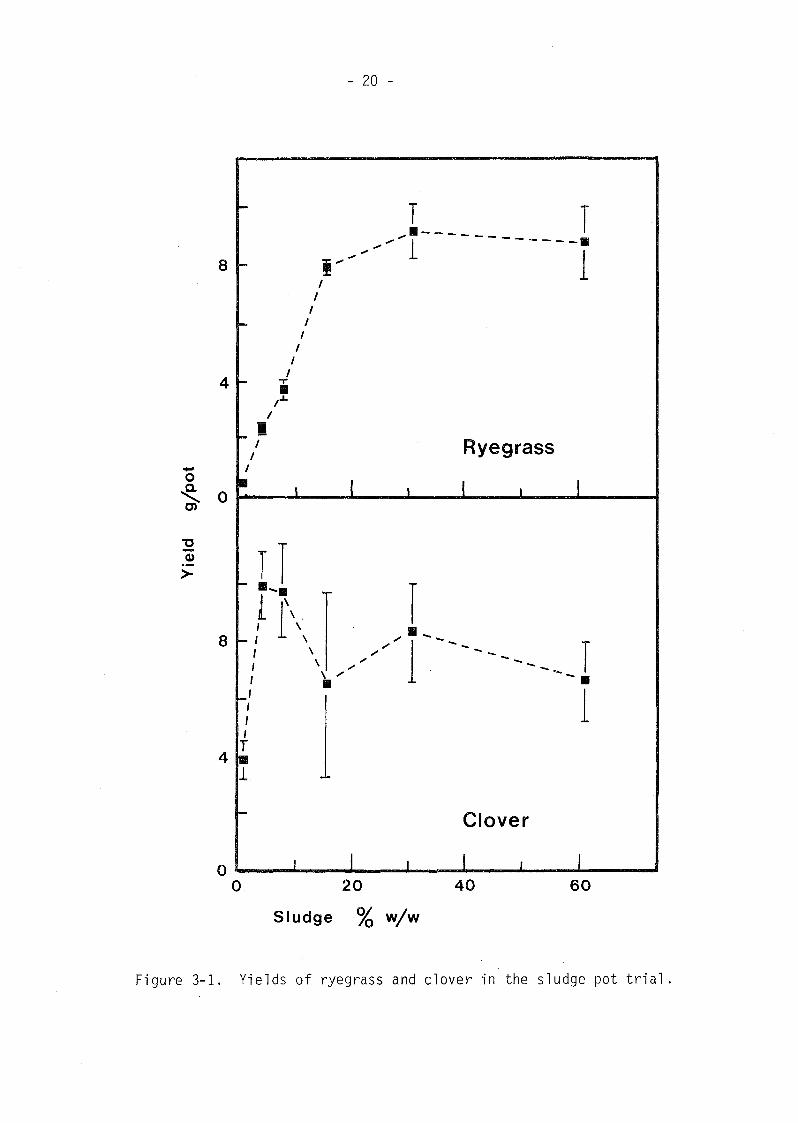
3-1 Yields of ryegrass and clover in the sludge
pot trial 20
3-2 Effect of sludge on uptake of Na, K, Mg andCa in ryegrass and clover 22
3-3 Effect of sludge on uptake of In, Cu, Mn andCr in ryegrass 26
3-4 Effect of sludge on uptake of In, Cu, Mn and
Cr in clover 274-1 Yields of ryegrass and clover in the Cr-amended
sludge pot trial 47
4-2 Seedling mortality from five replantings in
the Cr-amended sludge pot trial 494-3 Effect of Cr-amended sludge on uptake of Na, K,
Mg and Ca in ryegrass 544-4 Effect of Cr-amended sludge on uptake of Na, K,
Mg and Ca in clover 554-5 Effect of Cr-amended sludge on uptake of In, Cu,
Mn and Cr in ryegrass 57
4-6 Effect of Cr-amended sludge on uptake of In, Cu,
Mn and Cr in clover 58
5-1 Effect of sludge application on field trialherbage yield 67
5-2 Effect of Cr in the sludge on field trialherbage yield 68
- 1 -
CHAPTER 1
GENERAL SUMMARY
Although Christchurch sludge contains useful amounts of plantand animal nutrients, metal content is too high to permit its indiscriminate use as a soil additive. The metal concentrations are nothigh enough however to prohibit the judicious utilisation of thesludge within prescribed limits.
The maximum amount recommended for application to Kairaki sand,assuming the composition of sludge remains constant, is 250 tjha.This recommendation is a compromise between the U.S. EnvironmentalProtection Agency guidelines and experimental results obtained fromthe present field and pot trials. Once the above maximum quantityhas been applied, no further sludge should be added for at least 30years. A period of this duration is required to establish long-termlosses from the soil-sludge system.
The above recommended level applies only when soil pH is maintained above 6.5. A programme for monitoring soil pH and of limingwhen required is essential to reduce the availability to plants oftoxic metals applied.
Zinc was found to be the limiting contaminant in herbage. Anyfuture increase in the sludge zinc concentration will decrease themaximum amount of sludge which may be applied. Although, within safelimits at present herbage copper concentration may also become alimiting factor if sludge copper were to increase.
Application of potassium fertiliser is necessary to improvepasture quality and may also increase production. Potassium deficiencyis probably a greater pastoral constraint at present than is metaltoxicity. Much potassium is lost from sludge in supernatent taken

- 2 -
from the holding lagoons.
Highly significant results from both glasshouse and field trialsshowed that chromium contamination of sludge could decrease pastureproduction. It appears that chromium may block plant uptake ofnutrient cations. With the present sludge chromium concentration ofabout 0.5%, and total sludge application at the recommended level of250 t/ha, no deleterious effects are likely, provided a good supply ofnutrient cations is maintained in the soil. Should sludge chromiumconcentration increase then pasture production would fall unlessadditional nutrient cations were also supplied.
No other elements in herbage were found in concentrations likelyto be injurious to animal health, or restrictive to plant yield.
- 3 -
CHAPTER 2
DISPOSAL OF SLUDGE
2.1 GENERAL INTRODUCTION
Disposal of sewage sludge on agricultural land is basically aproblem of balance between the cumulative effects of sludge-borneheavy metals and plant nutrient supply from organic material. Inthe last decade, the ever increasing attention focused on environmental issues has produced a flood of literature devoted to sewagesludge disposal. Some reports have more of an emotive than scientific impact while others do not distinguish clearly between the twoopposing aspects of sludge disposal.
Many early studies were tentative investigations which havebeen subsequently reviewed and quoted many times. Consequently therehas been a tendency for tentative suggestions to become accepted asfact, with cautions in interpretation being overlooked. In theprinting rush, information has sometimes been published which is notscientifically complete. As some of these reports are liable to bequoted to a particular end, care must be exercised not to give weightto information which is inconclusive.
Excellent research publications and reviews on the use of sewagesludge and the effects of heavy metals on land are available. Aspectsof particular interest to the question of disposal of ChristchurchDrainage Board sludge are referenced as fully as possible. In generalall pUblications referenced have been examined and are held or areavailable on file. No attempt is made here to review the whole generalfield of metalliferous sewage sludge disposal. The review by Leeper(1978), an authority in this area of study, has condensed the literature and previous reviews to basics and presented all the general aspectsimportant to agriculture.

- 4 -
2.2 DESCRIPTION OF SOIL AND SLUDGE
The majority of the Drainage Board soils which are suitable forsludge disposal are classified as Kairaki sand (N.Z. Soil Bureau, 1967,1974). This sand dune soil is freely to rapidly draining and onlyrecently stabilised. The soil is weakly developed with little or notopsoil. Motukarara loam, mostly sandy, is found in a few slowdraining interdune hollows and Motukarara silt loam occurs along theestuarine edges. Conversion of the dune soils into flat pasture hasburied most of the interdune hollows and left paddocks of flattenedfreely draining material. Over the years variable quantities of bothdried and liquid sludge have been deposited on the surface of thesepaddocks or worked in, to form a stable topsoil. For the young,weakly-developed Motukarara silt loam, permanent lowering of the watertable by draining and elimination of estuarine-induced salinity, hasprovided a reasonable soil suitable for grazing, particularly insummer. Sludge disposal on the flat, slowly-draining silt loam hasbeen and still is, limited to small amounts of liquid sludge in summer.
Samples of the sandy dune material and sludge from the dryingbeds were analysed to provide data for comparison with other reportsand to characterise the materials used in subsequent trials. Theresults given in the following tables are for, (i) four sand sampleseach comprising about ten Il gra bll subsamples bulked from a particulartruckload of sand, and (ii) six dried sludge samples each bulked froma particular drying bed. The sand samples were chosen to representthe range of visual variation between truckloads. Differences wereconfined to slight colouration due to moisture content and minor amountsof organic products from the dune surface. Variation between thesludge samples was probably due to settling and decomposition withinthe holding lagoons. Each lagoon collected sludge for many weeksbefore it was emptied, either directly onto pasture or into a dryingbed comprising a shallow pit moulded in sand.
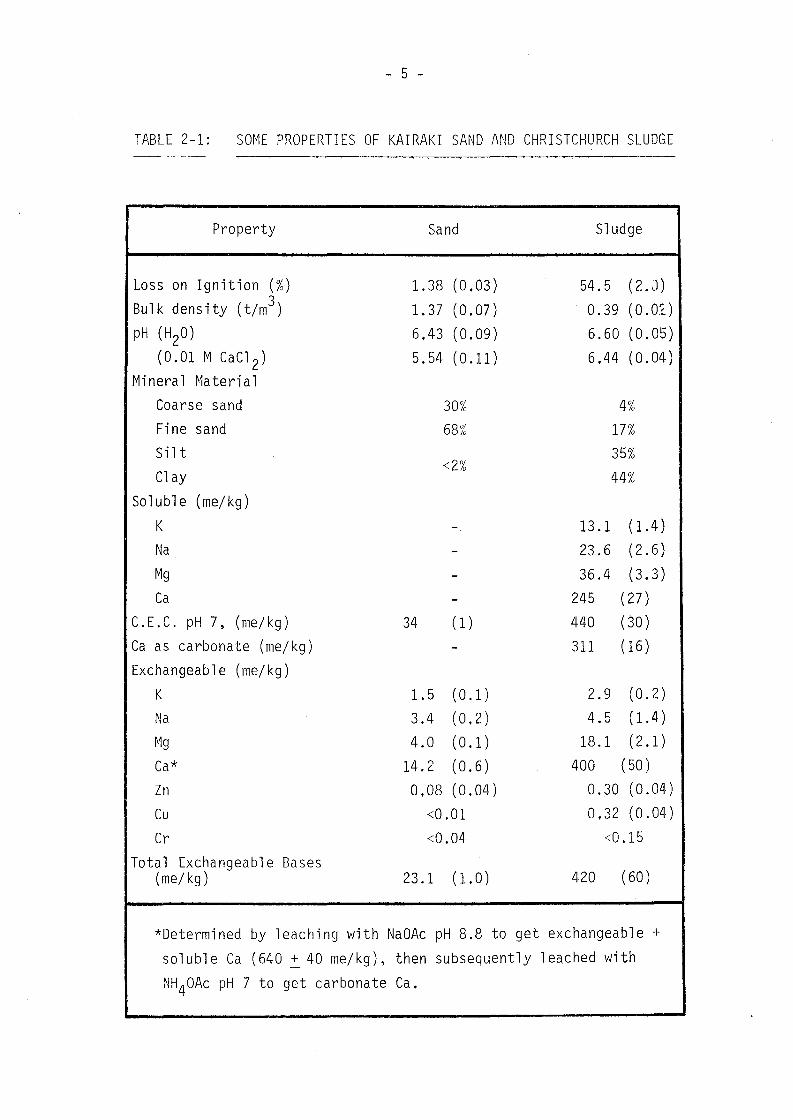
Table 2-1 lists properties of the sand and sludge, determinedusing the methods described in Section 3.3. Standard errors for themeasurement replicates are given in brackets. In the case of derivedquantities, the standard errors are combined using the appropriate
- 5 -
TABLE 2-1: SOME PROPERTIES OF KAIRAKI SAND AND CHRISTCHURCH SLUDGE
Property Sand Sludge
Loss on Ignition (%) 1.38 (0.03) 54.5 (2.l))Bulk density (t/m3) 1.37 (0.07) 0.39 (O.O~)
pH (H2O) 6.43 (0. 09) 6.60 (0.05)(0.01 MCaC1 2) 5.54 (0.11) 6.44 (0.04)
Mineral MaterialCoarse sand 30% 4%Fine sand 68~~ 17%Silt 35%Clay
<2%44%
Soluble (me/kg)
K - 13.1 (1. 4)Na - 23.6 (2.6)Mg - 36.4 (3.3)Ca - 245 (27)
C.E.C. pH7, (me/kg) 34 (1) 440 (30)Ca as carbonate (me/kg) - 311 (16)Exchangeable (me/kg)
K 1.5 (0.1) 2.9 (0.2)
Na 3.4 (0.2) 4.5 (1.4 )
~1g 4.0 (0.1 ) 18.1 (2.1)
Ca* 14.2 (0.6) 400 (50)
Zn 0.08 (0.04) 0.30 (0.04)
Cu <0.01 0.32 (0.04)
Cr <0.04 <0.15
Total Exchangeable Bases(me/ kg) 23.1 (1. 0) 420 (60)
*Determined by leaching with NaOAc pH 8.8 to get exchangeable +
soluble Ca (640 ~ 40 me/kg), then subsequently leached with
NH40Ac pH 7 to get carbonate Ca.
- 6 -
formula.
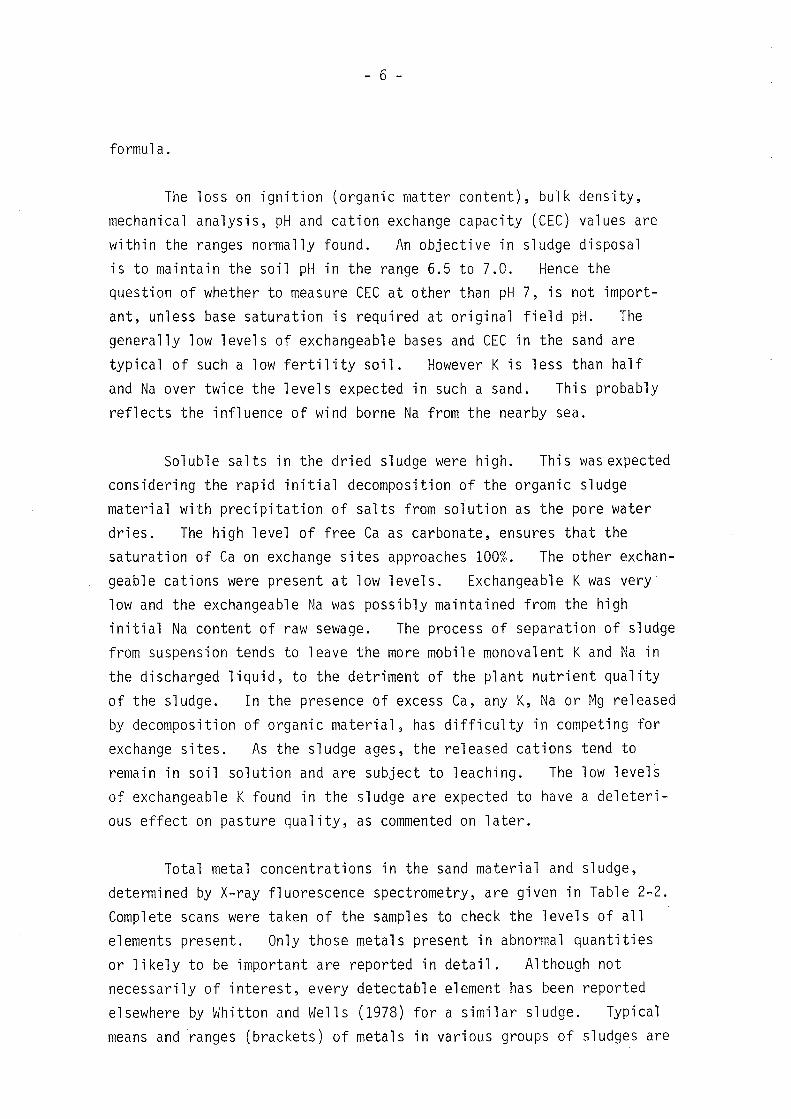
The loss on ignition (organic matter content), bulk density,mechanical analysis, pH and cation exchange capacity (CEC) values arewithin the ranges normally found. An objective in sludge disposalis to maintain the soil pH in the range 6.5 to 7.0. Hence thequestion of whether to measure CEC at other than pH 7, is not important, unless base saturation is required at original field pH. Thegenerally low levels of exchangeable bases and CEC in the sand aretypical of such a low fertility soil. However K is less than halfand Na over twice the levels expected in such a sand. This probablyreflects the influence of wind borne Na from the nearby sea.
Soluble salts in the dried sludge were high. This was expectedconsidering the rapid initial decomposition of the organic sludgematerial with precipitation of salts from solution as the pore waterdries. The high level of free Ca as carbonate, ensures that thesaturation of Ca on exchange sites approaches 100%. The other exchan-geable cations were present at low levels. Exchangeable K was verylow and the exchangeable Na was possibly maintained from the highinitial Na content of raw sewage. The process of separation of sludgefrom suspension tends to leave the more mobile monovalent K and Na inthe discharged liquid, to the detriment of the plant nutrient qualityof the sludge. In the presence of excess Ca, any K, Na or Mg releasedby decomposition of organic material, has difficulty in competing forexchange sites. As the sludge ages, the released cations tend toremain in soil solution and are subject to leaching. The low levelsof exchangeable K found in the sludge are expected to have a deleterious effect on pasture quality, as commented on later.
Total metal concentrations in the sand material and sludge,determined by X-ray fluorescence spectrometry, are given in Table 2-2.Complete scans were taken of the samples to check the levels of allelements present. Only those metals present in abnormal quantitiesor likely to be important are reported in detail. Although notnecessarily of interest, every detectable element has been reportedelsewhere by vJhitton and Wells (1978) for a similar sludge. Typicalmeans and ranges (brackets) of metals in various groups of sludges are

- 7 -
TABLE 2-2: MAJOR METAL CONCENTRATIONS IN KAIRAKI SAND AND
CHRISTCHURCH SLUDGE
Sand Sludge
mgjkgNi 29 (4) 142 (4)Cu 53 (5) 595 (5)Zn 62 (6) 2080 (40)Cr 20 (4 ) 4780 (160)Pb 17 (4 ) 359 (9)Cd <2 2 - 4
TABLE 2-3: MEAN AND RANGE OF METAL CONTENTS FOR TYPICAL SLUDGES
N.Z.* U.K.** U.S.A.***
mgjkgNi 130 510 371
(12-350 ) (20-5300) (12-2800)Cu 460 970 1024
(310-720) (200-8000) (84-10400)Zn 1000 4100 3315
(700-1200) (700-49000) (72-16400)
Cr 340 980 2013
(66-850) (40-880) (22-30000)
Pb 300 820 1380
(95-610) (120-3000 ) (80-26000)
Cd 4 <200 74
(2.5-4.5) «60-1500) (2-1100)
*Mean of 3 from Quin and Syers (1978)
Whitton and Wells (1978)Wells and Whitton (1976)
**Mean of 42 from Berrow and Webber (1972)
***Mean of 57 from Page (1974)
- 8 -
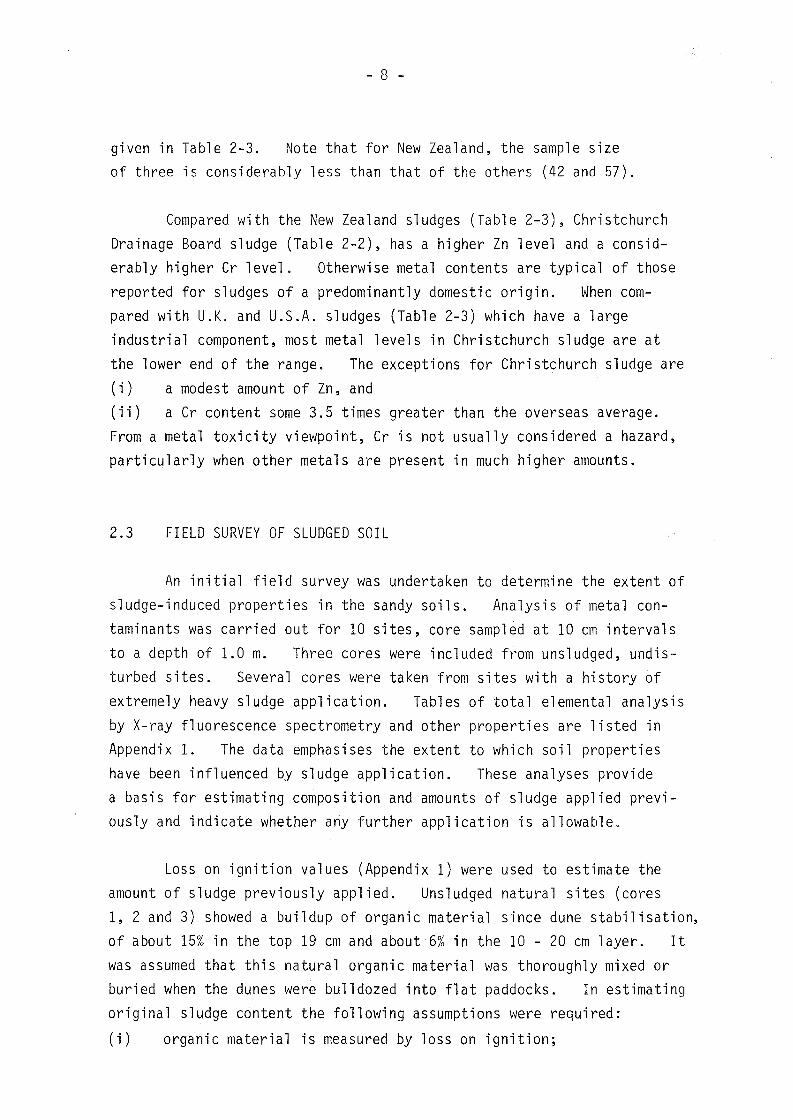
given in Table 2-3. Note that for New Zealand, the sample sizeof three is considerably less than that of the others (42 and 57).
Compared with the New Zealand sludges (Table 2-3), ChristchurchDrainage Board sludge (Table 2-2), has a higher Zn level and a considerably higher Cr level. Otherwise metal contents are typical of thosereported for sludges of a predominantly domestic origin. When compared with U.K. and U.S.A. sludges (Table 2-3) which have a largeindustrial component, most metal levels in Christchurch sludge are atthe lower end of the range. The exceptions for Christchurch sludge are(i) a modest amount of Zn, and(ii) a Cr content some 3.5 times greater than the overseas average.From a metal toxicity viewpoint, Cr is not usually considered a hazard,particularly when other metals are present in much higher amounts.
2.3 FIELD SURVEY OF SLUDGED SOIL
An initial field survey was undertaken to determine the extent ofsludge-induced properties in the sandy soils. Analysis of metal contaminants was carried out for 10 sites, core sampled at 10 cm intervalsto a depth of 1.0 m. Three cores were included from unsludged, undisturbed sites. Several cores were taken from sites with a history ofextremely heavy sludge application. Tables of total elemental analysisby X-ray fluorescence spectrometry and other properties are listed inAppendix 1. The data emphasises the extent to which soil propertieshave been influenced by sludge application. These analyses providea basis for estimating composition and amounts of sludge applied previously and indicate whether any further application is allowable.
Loss on ignition values (Appendix 1) were used to estimate theamount of sludge previously applied. Uns1udged natural sites (cores1, 2 and 3) showed a buildup of organic material since dune stabilisation,of about 15% in the top 19 cm and about 6% in the 10 - 20 cm layer. It
was assumed that this natural organic material was thoroughly mixed orburied when the dunes were bulldozed into flat paddocks. In estimatingoriginal sludge content the following assumptions were required:
(i) organic material is measured by loss on ignition;
- 9 -
(ii) organic to mineral ratio of deposited sludges has remainedconstant;
(iii) organic to mineral ratio of sludge does not alter afterdeposition;
(iv) buildup of new organic material in the topsoil since originalsludging is negligible.
Factors (iii) and (iv) may counteract each other as significant amountsof organic material must have decomposed, and built up particularly insurface layers. Natural topsoil organic material decomposes at about1.5% p.a. Using the above assumptions and a present sludge organicconcentration of 45%, the approximation was derived that; "originalsludge content" = 1.8 x "loss on ignition".
Qualitative observations from data in Appendix 1, using the aboverelationship, included the following.
1. Very high levels of sludge application have occurred in thepast. Some deeper layers, where decomposition is less likely, gaveestimates of over 50% (30 - 50 cm core 4 and 40 - 50 cm core 5).Application rates varied widely down profiles with organic rich zonessometimes separated by a sandy layer (20 - 30 cm layers in cores 5 and8 and the 50 - 60 cm layer in core 4). Each core was sampled down topure sand material.
2. Zinc has moved down the profile resulting in enhanced zincconcentrations in more sandy layers underlying highly sludged layers
(20 - 39 cm layer in core 6 and layers 20 - 30 and 50 - 60 in core 8).Zinc mobility appears to be limited to the layer below the high sludge
layer. Williams et~. (1980) found that, where a sludge with a highmetal content was applied to soil, increased metal availibility and
metal movement in the soil were predominately limited to a depth of 10cm below the area of sludge incorporation. They used a soil with loamtexture but it appears that a similar trend occurs in sandy material.
3. Mobility of Cu, Ni, Pb and Cr can be estimated in a similarmanner. Chromium appears to be the least mobile with the other metalsfalling between Cr and Zn. This order is similar to that reported by
Dijkshoorn et~. (1979) and Williams et~. (1980).4. Estimated Zn concentrations in the original sludge, calcu
lated for deeper layers, were mostly between 2,300 and 3,000 mg/kg plus
any losses from the system. It would therefore appear that previous Zn

- 10 -
levels were a little higher than the present 2,000 mg/kg.
5. Estimated Cr concentrations in the original sludge had a. maximum of about 0.5% in top layers (cores 6, 7 and 8) where maximum
decomposition, and hence concentrating effect, was most likely. Otherdeeper concentrations were often about 0.3% Cr. As present Cr concentration in sludge is around 0.5%, recent sludge may have a slightlyincreased Cr content.
6. Metal concentrations and the relative proportions of metals,vary widely between layers. Original Cu estimates for several layersexceeded 1,000 mg/kg, compared with a present concentration of about600 mg/kg. Previous Ni and Pb concentrations agreed with recent sludge(140 mg/kg and 600 mg/kg respectively), but with occasional estimatesreaching 2 - 3 times present values.
7. The pH values for all cores were below 6.5, the minimumrequired for safe disposal of metalliferous sludge. Ameliorativeaction is necessary, as outlined in the recommendations of Chapter 1.
8. Cation exchange capacities (CEC) reflect the low natural CECfor sand material. CEC does not increase with estimated sludge contentto the extent expected from the use of fresh sludge. This trendpossibly results from the increased residual nature of organic materialas sludge matures.
Quantitative relationships describing the above qualitative observations can be evaluated statistically but, at this stage, the workloadis not justified by immediate benefits.

- 11 -
CHAPTER 3
INFLUENCE ON PASTURE
3.1 SLUDGE ON SOIL
Sewage sludge can be an excellent fertiliser on crops or pasture.However most reports concerning the beneficial use of large amounts ofsewage sludge involve sludges with low metal content. Early reports oftrials such as those by Vlamis and Williams (1961) or Coker (1966)emphasised the value of nutrients contained in sludge. Yield increaseswere usually attributed to Nand P in the sludge.
In the past decade, no report on the use of sewage sludge has beencomplete without an adequate appraisal of the potential metal contamination (Purves, 1972). Many reports have concentrated solely on theavailability and uptake of sludge-borne metals used on agricultural land(Haan, 1975; Dowdy and Larson, 1975b; Kelling et ~. 1977a, 1977b,1977c). Guidelines for the permissible levels of toxic metals in sewagesludge were suggested by Chumley (1971) and Chaney (1973). The fate andeffects of various elements was reviewed by Page (1974). Adverse effectsof sludge-borne metals on a variety of crops were reported by Dowdy andLarson (1975a, 1975b), Williams (1975) and Cunningham et~. (1975a).Tarbox and Outram (1975) gave some similar data for pasture.
Reports such as those by Patterson (1971) and Spotswood and Raymer(1973) emphasised the cumulative effects of metals when the same area ofland was used continually for sludge disposal. The eventual decay oforganic material complexed with metals, increased their availability inthe soil. More recently, Wollan and Beckett (1979), Williams, et ~.(1980) and Schauer et~. (1980), investigated the interactions of sludgeborne heavy metals with soil and the distribution of metals through thesoil profile. Their results showed that extractability and movementwere predominantly limited to the zone of sludge application.

- 12 -
Reports by Wells and Whitton (1970), and Quin and Syers (1978)on the use of sewage effluent on pasture in New Zealand showed onlybeneficial effects from the use of sludge containing very low levels
of sludge-borne metals. Using New Zealand sludge of low to modestmetal content, lucerne yields in pot trials were substantially increased (Wells and Whitton, 1976; Whitton and Wells, 1978). Noexcessive accumulation of metals in herbage was observed.
A main objective of the present study was to evaluate the acceptable level of sludge-borne metals applied to the soil. Relationshipsbetween yield, metal composition of the herbage and food chain effectswere considered. The nutrient status of sludge was not a prime consideration because in a disposal situation, nutrient status does notrepresent a major constraint. It is of interest to note that elements,such as Cu and Zn, that are called IItrace elements ll or IImicro-nutrients 'l
or IIfertil isers l' in soil, are referred to as IIheavy metals ll or II contaminants ll or IItoxic ll in sewage sludge applied to the soil.
Examination of cause and effect can result in ambiguity in useof the words IItoxic l' and IItoxicity ll. The toxicity of a particularelement, to say a plant is defined as some injurious or deleteriouseffect. This toxic effect, often a decrease in plant growth, is causedby an excess amount of the element. However the cause of the stuntedgrowth may be considered as either a build up of the element in theplant tissue itself or a high concentration in the source of supply tothe plant, or maybe both. On the other hand, the injurious effect ortoxicity, may also include a build up of the element in the tissue.A typical toxic metal pathway sludge-soil-solution-root-tops-animal,contains some transitions which involve deleterious effects and otherwhich do not. When processes are grouped together, care must be takenwhen referring to accumulation of a toxic element to ensure separationof cause and effect.
apparent ambiguity when referring to say lI a toxic levelSuch a statement can mean either, the grass itself isoversupply of Zn, or that the grass is quite healthyeating the grass may be affected by the excess Zn.
Hence theof Zn in grass ll
•
stunted through anbut that an animal
- 13 -
According to Chaney (1973) the elements in sludge that are apotential hazard to the food chain by plant accumulation; are Zn, Cu
and Cd. Entry into the food chain depends on translocation of the
absorbed metal from the root to the edible portions above the soil.Zn, Ni and Cd are easily translocated to plant tops, particularly in
acid soils. Dijkshoorn et~. (1968) in reviewing,
(i) removal from the soil by plant uptake (Kelling et ~. 1977c),(ii) plant and soil concentration ratios (Hara and Sonoda, 1979), and
(iii) relative translocations (Pettersson, 1976); concluded that ingeneral the relative uptakes by the shoots of plants declined in theorder; Zn > Ni > Cd > Pb > Cu > Cr. The uptakes declined because ofa parallel decrease in the rate at which the metals were translocatedfrom the roots to the tops.
Cadmium is one of several metals that have come under suspicionin recent years as possible environmental contaminants that might be
harmful to human health.· Chaney (1973) suggested a formula that ensured Cd, in a food crop grown on a sludge treated soil, was not a
potential food-chain hazard. He recommended that the Cd content ofsludge be reduced to 0.5% or less than that of the Zn content. Cadmiumlevels in Christchurch Drainage Board sludge are less than 4 mg/kg andwith a Zn level of over 2,000 mg/kg Cd content is certainly well belowthe consequent maximum recommendation of 10 mg/kg. Residues of Cd fromphosphatic fertilisers or roadside accumulation from attrition of rubbertyres are greater potential hazards than the small amount of Cd at
present in Christchurch sludge.
Lead is well recognised as having deleterious effects on animal
life and hence is an environmental hazard. Lead has little effect onplant growth and is especially excluded from some parts of the plant
(Dijkshoorn et ~. 1979). The lack of Pb accumulation from sludgeappears to be related to the presence of high amounts of phosphate in
sludge (Chaney, 1973).
Christchurch sludge has a present Pb concentration of about 350mg/kg and even with massive application rates, this source would notcontribute significantly to environmental totals. Formulae for limit
ing the use of metalliferous sewage sludge do not encorporate Pb and

- 14 -
maximum herbage levels of Pb in sludge trials are generally only a fewmg/kg (Dowdy and Larsen, 1975b; Whitton and Wells, 1978; Dijkshoornet~. 1979). Such levels are insignificant compared with pollutionfrom automative exhausts and Pb concentrations in pasture species of500 to 1,000 mgjkg, found for example adjacent to the Auckland Motorway(Ward et ~. 1978; Brooks, 1979).
Mercury does not appear to be the food-chain accumulator inagriculture, that it is in the oceans (Chaney, 1973; Rogers, 1976;Bloom, 1979). In addition, Hg was not detectable « 1 mg/kg) inChristchurch sludge. Nickel presents no threat to the food chain,because being readily translocatable, the plant is severely injuredfirst (Chaney, 1973).
Copper may be translocated in quantities high enough to be toxicto animals, but usually harms the plant in the process (Chaney, 1973).
A more detailed discussion, particularly for elements In, Cu andCr, can be found with the results of the various trials.
3.2 HEAVY METALS IN SLUDGE
The first formula for limiting the use of metalliferous sludgewas outlined by Chumbley (1971). His recommendation, in a U.K.Agricultural Department Advisory Service (A.D.A.S.) report, was based onthe work subsequently published by Webber (1972).
From experience gained in advisory work and from the results ofpot experiments, they suggested that in a soil, Cu was twice as toxicand Ni was eight times as toxic as the same amount of In. 'The maximumpermitted level of metal application to topsoil, was given as the addition of 250 mg/kg "zinc equivalent l
! (i.e. mg/kg In + 2 mgjkg Cu + 8 mg/.kg Ni). The pH of the soil had to be at least 6.5.
This recommendation did not take into account any other importantsoil property. Williams (1975), who was also involved in the work,subsequently noted, that the formula weightings were tentatively based

- 15 -
on soluble metal content of the soils in which the crops were grown.
There is general agreement (Cunningham et~. 1975a) that sincethe mobility of nearly all toxic metals is greatest in acid soils,
liming to at least pH 6.5 is necessary to reduce the possibility ofmetal toxicity in plants.
The well known recommendation of Chaney (1973) was to limitmetal additions on agricultural soils to the same "zinc equivalent"
levels not exceeding 5% of the CEC of the untreated soil (at pH greaterthan 6.5).
The translation of 250 mg/kg equivalent into degrees of satur
ation of CEC results in a soil with a CEC of about 160 me/kg having 5%saturation of heavy metals without damage (at pH 6.5).
As noted by Keeney et~. (1975) and Leeper (1978), it is easyto find examples where the 5% CEC formula for maximum application rateis far too cautious. Indeed the Environmental Protection Agency (E.P.A.) suggested a limit of 10% of the CEC, (Keeney et~. 1975; Cunninghamet ~' 1975a; Leeper, 1978), although the actual recommendation did notappear in any of the well known references examined, (EPA 625/1-75-006,EPA 670/2-74-005). The EPA guidel ine altered the definition of "zinc
equivalent" to (mg/kg Zn + 2 mg/kg Cu + 4 mg/kg Ni), (Keeney et ~' 1975;
Cunningham et~. 1975a).
The validity of these simple criteria has been criticised (Leeper,
1978; Whitton and Wells, 1978). Keeney et~. (1975) noted that thisinterim guide was based on the hypothesis that CEC was related to soil
factors which control metal availability. No experimental evidence wasthen available to support or refute the empirical equation. Many otherfactors were involved and the guideline must remain subject to revision.
For instance Cunningham et~. (1975a) noted that Cu, Zn and Ni interactto enhance their toxic effects, but also indicated that with the cropsstudied, the relative toxicities of Zn:Cu:Ni were 1:2:1.
A sludge application rate based on limiting the heavy metal addi
tions to 10% of the soil CEC can be calculated as follows.
~ 16 ~
Metal concentration = EW.CEC.10~1 (mg/kg)
where EW(Zn) = 32and CEC has units of (me./kg).
Amount metalwhere d
y
= 32.y.d.CEC (kg/ha)= soil depth (m)= soil bulk density (t/m 3
)
Amount of sludge = 32.y.d.CEC.10 3 /S (t/ha)where S is the weighted sum of the sludgeconcentrations of Ni, Cu, and Zn in (mg/kg).
Example: Christchurch sludge, where
S = 3840 mg/kgCEC = 34 me/kg (Kairaki sand)
y = 1.37 t/m 3 "d = 0.20 m
has an application rate of 77 t/ha.
This application rate of 77 t/ha corresponds to a 3% w/w addition ofsludge (oven dry) mixed to 20 cm.
The 1'10% CEC" guidel ine was basically formulated for highlymetalliferous sludges and soils with a high CEC. However when considering application of sludge on sandy soils with a very low naturalCEC, then the CEC of the mix depends primarily on the usually muchhigher CEC of the added sludge. Both the organic material and clayfraction of the mineral material (approximately 50% and 20% respectively for Christchurch sludge) contribute to sludge CEC. If, as inthe case of the local sludge, the metal content is modest, then thesludge by itself constitutes a "soil" whose metal content is notgreatly in excess of the recommended levels.
Relating the guideline to CEC, allows for the "soaking Upll ofthe metal cations as they are released on decay of organic materialcomplexed with the metals (Spotswood and Raymer, 1973). However, thebuild up of additional organic material in a sandy soil, from plant
growth induced by the sludge nutrients must be balanced against this

- 17 -
process. The clay content of sludge also contributes to the sludgeCEC and is not subject to breakdown as is the organic material. TheCEC of the added clay persists and supplements the original soil CEC.However, the residual nature of sludge clay and organic material doesnot contribute the usual quota of exchangeable sites expected of suchcomponents in a normal soil material. Christchurch sludge has a CECof 440 me/kg whereas if the usual rule-of-thumb formula for normalsoil is applied (Helling et~. 1964), where,
CEC (me/kg) = 5 (% clay) + 20 (% OM)
then this sludge should have a CEC of over 1,000 me/kg.
From the preceeding discussion it would seem reasonable torecalculate the application rate using a combined CEC of sand andsludge. Assuming that the combined CEC is linear with the relativeweight fractions of the components and by letting the sludge application rate x, be a function of 10% of the CEC, then, as before,
x (t/ha) =
where k =
k.CEC(32.y.d.10 3 )/S
If the cation exchange capacities of sludge and sand are CEC' and CECilrespectively, then
x/k = ( 104.y.d --).CEC" + ( x ).CEC
10 4.y.d + x 104.y.d + x
and x2 + x(l04. y.d - k.CEC') - k.10 4.y.d.CEC" = O.
Solving this quadratic equation for Christchurch sludge, withvalues as before and including,
CEC, (sludge) = 440 me/kgresults in an ammended application rate of 115 t/ha. This is a 50%increase over the previously "recommended" rate.
Consideration of the following points;(i) the uncertainty in relating loadings to CEC alone,(ii) the tentative nature of the original 10% limit,

(v)
( i v)
(iii)
~ 18 -
that the guideline was formulated for soils used for
food crops and not for more resistant pasture species,the uncertainty in calculating the CEC in unusualcases such as low metal content, low soil CEC, andhigh clay content in the sludge,the uncertainty in the definition of "linc equivalent ll
,
and(vi) reports where heavier applications appear non-detri
mental,shows there is no simple method of testing whether a particularlyheavy application rate is safe other than by direct experiment.
3.3 SLUDGE POT TRIAL, MATERIALS AND METHODS
A glasshouse pot trial was set up to evaulate application ratesof Christchurch Drainage Board sludge when mixed with the sandy dunesoil from the Board's farm. The properties of the sludge and sandbase used were described in section 2.2.
Sludge/sand mixtures weighing about 1.3 kg in 12 cm x 12 cmplastic pots were leached to eliminate soluble salts (conductivityof 1:5 v/v suspension was generally reduced to below 0.008 S/m).Following pH and titration curve measurements the mixtures were treatedwith Ca(OH)2 to bring the pH within the range 6.6 to 6.9. No fertiliser was added. After eight weeks each pot (with drip tray) wasplanted with either five perennial ryegrass (Lolium perenneJ or fivewhite clover (Trifolium repens L.J seedlings. The few seedlingswhich died were replaced a week later. The levels of sludge usedwere 0%,4%, 7.7%, 15%,31% and 62% w/w (oven dry), with each treatment having four replicates. Plants were harvested above 1 cm at 14weeks and again at 20 weeks by which stage some pots were becomingroot bound. The pots were then shifted from the glasshouse to anexterior area with a gravel surface. Some of the pots with highgrowth, particularly clover became waterlogged and others expendedtheir roots out the bottom of the pots so yields from a third cut weredisregarded in the final analysis. The pots were emptied and soilssieved and retained for analyses.

Measurements of 'pH, CEC and exchangeable cations were taken
(i) at planting,
(ii) just prior to second harvest (pH only) and
(iii) when pots were emptied.Methods for measurement of pH, titration curves, CEC and exchangeablecations followed the general methods described by N.Z. Soil Bureaustaff (1972). Herbage cations (K, Na, Mg and Ca) were determined by
Atomic Absorption following ignition of a 0.1 g sample of oven drymaterial, digestion with 5 ml 2M HC1, and dilution to 100 ml. Tracemetal determinations followed a similiar proceedure using 5 g plantmaterial, 10 ml 2M HCl and diluting to 50 ml. Duplicate determin
ations were preformed on bulked treatment replicates.
Differences commented on in this report were lIsignificant" atp<0.05 or "highly significant" at p<O.Ol, unless otherwise indicated.
3.4 RESULTS AND DISCUSSION
3.4.1. Herbage Yields
Total herbage yields (two harvests) for ryegrass and cloverare shown in Figure 3-1 with pH and yield data in Appendix 3. Thevertical bars show the standard errors of the four replicates. In
general, yields increased spectacularly with sludge treatment with noadverse effects apparent visually. Simple analysis of varianceshowed significant increases in yield of ryegrass up to the additionof 15% sludge. Clover replicates were prone to large variationsand beyond the 4% sludge treatment differences were not significant.A possible exception was the decrease in yield at the highest treatment level of 60% sludge.
The increases in yield for both ryegrass and white cloveremphasise the beneficial fertiliser aspects of sewage sludge appli-
cation on the low fertility sand material. Coker (1966a, 1966b),compared pasture responses from sewage sludge nutrients with equivalent
inorganic fertilisers, and showed there was little difference in yieldor nutrient content of the pasture. He found that distribution of
- 20 -
Ryegrass
-
8 I-
l--_ T,~~~~~~l ---------r
II
II
II
II
TIII
r-I•-,
I
- Io III I I I~ 0 ....__1......_-.&. ..1.-1 _--11..-_--"1__........ ......
c:n
I- Clover
0 I I 1 I 1 I0 20 40 60
Sludge % w/w
Figure 3-1. Yields of ryegrass and clover in the sludge pot trial.

- 21 -
pasture species with sludge application was much the same as that
expected from literature reports on fertiliser response.
3.4.2. Cation Upta,ke
Herbage concentrations of Na, K, Ca and Mg are shown in Figure3-2. Potassium levels are below those generally accepted (M.A.F.,1978) as sufficient for healthy growth (dotted lines). Other reportshave shown (Coker, 1966b; vJilliams,1975; Kelling et~. 1977a) that
the amount of K in dried sludge is not sufficient to provide for the
full requirements of grass and can limit yields.
McNaught (1970) defined a "critical level" as the minimumconcentration of nutrient in plant tissue for maximum yield. The
values of K for New Zealand conditions are given as 2.0% to 2.5% for
ryegrass and 1.8% to 2.3% for white clover. Herbage K levels in thistrial are below these levels. The usual relationship between cationsin pasture plants, is that a decreased K concentration leads to increasesin the Na, Mg and Ca contents. This inverse relationship between Naand K is particularly evident in the ryegrass results and to a lesser
extent in clover. Since K is invariably present in amounts well inexcess of animal needs (Smith and Middleton, 1978), dietary deficiency
of K in ruminants is most unlikely although plant tissue K levels may
be sufficiently low to reduce yield.
The associated levels of Na and Mg in ryegrass and clover when
K levels are deficient are listed by M.A.F. (1979). Trial levels ofassociated Na, for K in the deficient range (0.3% to 1.7% K), were
found to be within the specified ranges of 0.3% to 0.6% Na (clover)and 0.3% to 1.0% Na (ryegrass). Such elevated levels for Na are anindication of K deficiency. Similarly the elevated trial levels forassociated Mg, when K is deficient were within the ranges 0.25% to
0.30% Mg (clover) and 0.23% to 0.35% Mg (ryegrass). Calcium contents are quite high but such values are to be expected considering
the high amounts of Ca originally present in the sludge and the Ca(OH)2applied to raise pH.
The CECls and exchangeable (including soluble) bases for the

- 22 -
6
0·2 -
N
c:0
+""CO 0~
+"" Mgc:G> 0·60c:0U
K
Ca
...11........................ .......
1 \' ................
~3/
//
//
//
/
"tI- - - -rI'
Na0·6
,.04 I'j
0·2
------------.4~/'iIIJ "-
1L. -- ....... ------- .. .. ... --- .. ----r - __ ....
o ..... .....__---' --I._....L. ....L. ...I.- .l-1 - ....
o 20 40 60 0 20 40 60
%Sludge wjw
Figure 3-2. Effect of sludge on uptake of Na, K, Mg and Ca in ryegrass(e-.) and clover (II-II). Tconcentrations below dotted
2% line are deficient (M.A.F., 1978).

- 23 -
TABLE 3-1: EXCHANGEABLE BASES IN SLUDGE POT TRIAL SOILS
Sludge CEC Na K Ca ~1g
% (w/w) me/kg
Initial Values at Planting
0 24- 0.2 1.7 11 3.7
4 44 3.0 3.6 45 7.8
8 60 1.7 2.7 48 7.8
15 94 5.0 4.4 120 9.3
31 160 10 7.6 220 16
62 280 19 12.5 370 24
After Harvests0 29 0.8 0.7 19 1.1
4 42 0.7 1.2 28 1.5
8 62 0.8 1.0 5:5 1.1
15 96 1.0 1.0 88 1.1
31 180 2.5 1.4 181 1.8
62 300 3.8 2.0 29L1 3.2
Values are the means for ryegrass and clover, each with duplicatedeterminations of four replicates bUlked.
- 24 -
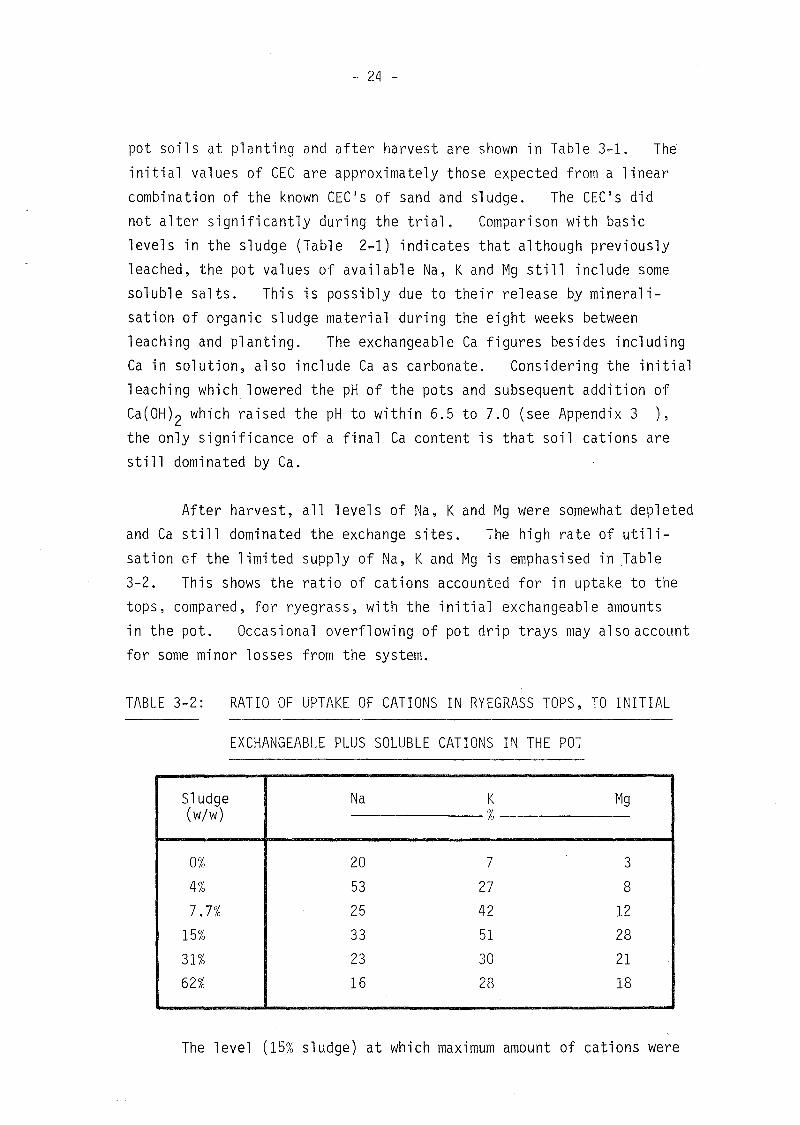
pot soils at planting and after harvest are shown in Table 3-1. The
initial values of CEC are approximately those expected from a linear
combination of the known CECls of sand and sludge. The CECls did
not alter significantly during the trial. Comparison with basic
levels in the sludge (Table 2-1) indicates that although previouslyleached, the pot values of available Na, K and Mg still include some
soluble salts. This is possibly due to their release by minerali-
sation of organic sludge material during the eight weeks between
leaching and planting. The exchangeable Ca figures besides including
Ca in solution, also include Ca as carbonate. Considering the initial
leaching which lowered the pH of the pots and subsequent addition of
Ca(OH)2 which raised the pH to within 6.5 to 7.0 (see Appendix 3 ),
the only significance of a final Ca content is that soil cations are
still dominated by Ca.
After harvest, all levels of Na, K and Mg were somewhat depleted
and Ca still dominated the exchange sites. The high rate of utili-
sation of the limited supply of Na, K and Mg is emphasised in Table
3-2. This shows the ratio of cations accounted for in uptake to the
tops, compared, for ryegrass, with the initial exchangeable amounts
in the pot. Occasional overflowing of pot drip trays may also account
for some minor losses from the system.
TABLE 3-2: RATIO OF UPTAKE OF CATIONS IN RYEGRASS TOPS, TO INITIAL
EXCHANGEABLE PLUS SOLUBLE CATIONS IN THE POT
Sludge Na K Mg(wjw) %
0% 20 7 3
4% 53 27 8
7.7% 25 42 12
15% 33 51 28
31% 23 30 21
62% 16 28 18
The level (15% sludge) at which maximum amount of cations were
- 25 ~
taken up, corresponds to the maximum yield (Figure 3-1). As the
utilization rate is not constant, other factors must also be involved.Before the yield maximum, the limiting factor is possibly Nand P
(Kelling et~. 1977a), with metal toxicity effects after.
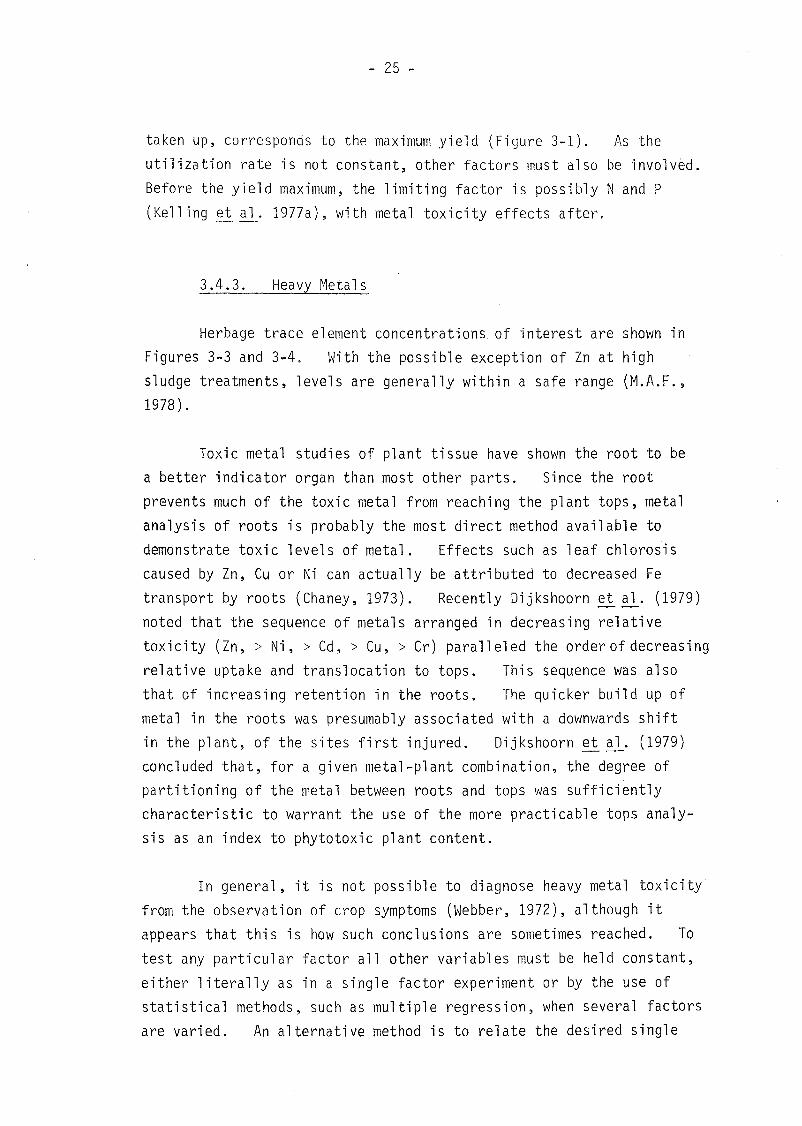
3.4.3. Heavy Metals
Herbage trace element concentrations of interest are shown inFigures 3-3 and 3-4. With the possible exception of In at highsludge treatments, levels are generally within a safe range (M.A.F.,1978).
Toxic metal studies of plant tissue have shown the root to bea better indicator organ than most other parts. Since the root
prevents much of the toxic metal from reaching the plant tops, metalanalysis of roots is probably the most direct method available to
demonstrate toxic levels of metal. Effects such as leaf chlorosiscaused by In, Cu or Ni can actually be attributed to decreased Fe
transport by roots (Chaney, 1973). Recently Dijkshoorn et~. (1979)noted that the sequence of metals arranged in decreasing relative
toxicity (In, > Ni, > Cd, > Cu, > Cr) paralleled the order of decreasingrelative uptake and translocation to tops. This sequence was also
that of increasing retention in the roots. The quicker build up ofmetal in the roots was presumably associated with a downwards shiftin the plant, of the sites first injured. Dijkshoorn et~. (1979)concluded that, for a given metal-plant combination, the degree ofpartitioning of the metal between roots and tops was sufficientlycharacteristic to warrant the use of the more practicable tops analy
sis as an index to phytotoxic plant content.
In general, it is not possible to diagnose heavy metal toxicity
from the observation of crop symptoms (Webber, 1972), although it
appears that this is how such conclusions are sometimes reached. To
test any particular factor all other variables must be held constant,
either literally as in a single factor experiment or by the use ofstatistical methods, such as multiple regression, when several factors
are varied. An alternative method is to relate the desired single

- 26 -
200
Zn
2
Cu
------------~--
Cr
1
2 -
.....---------------
Mn
1000)~
............OlE
t::o«; 0t- J.-__.....-I. ...L.._+- ...L.... .l--__--J_-4I-...c:CI>(J
s:::: 400oU
--------------~--
200
60402060 04020o ......__.......I -J., .J.-........I~____J~__...L.. .L_--1
o
Sludge % w/w
Figure 3-3. Effect of sludge on uptake of Zn, Cu, Mn and Cr in ryegras~
Tconcentrations above the dotted lines are potentially
toxic (M.A.F .. 1978).

- 27 -
Zn Cu
200 2 'Y-- ...... _------------
•
1000')~
.........0')
Ev-----------------
10
r::o
Ol--_....I-__~_____L_+_----I.---.l...---.....L---I.....ctI".....t:(J)(.)
~400U
Mn
20
Cr
200
.-------------------
\.-....'-----.-----...
60402060 04020O -'--__-I-__-!..._I-__...!.-__...L-__-L.---J
o
Sludge % w/wFigure 3-4. Effect of sludge on uptake of Zn, Cu, Mn and Cr in clover .
• concentrations above the dotted lines are potentially
toxic (M.A.F., 1978).

.' .
- 28 -
factor to some other property of the system via a separate experiment.
Arelationship between plant symptom and for example, metal concen
tration in roots or tops, or extraction from soil solution, is derived
for a particular metal in a single variable experiment. The related
factor is then measured in the sludge trial.
As an example, Dijkshoorn et~. (1975) concluded that theupper limit of Zn in ryegrass tissue, as set by toxicity, is of the
order of 700 - 1000 mgjkg. Ryegrass is a relatively tolerant species
(Dijkshoorn et~. 1979). However, Wells and Whitton (1976) haveclaimed that, I'high levels (up to 880 mgjkg) of zinc .... did notreduce yield, indicating that these levels were not toxic for lucerne ll
•
In their trial, Waitarere coastal yellow-brown dune sand was mixed
with up to 100% sludge (Zinc equivalent 1950 mgjkg). However, the
trial method of Wells and Whitton (1976) gave the only treatment
variable as rate of sludge application. As sludge has a large number
of active components, both nutrients and metals, an unaffected yield
cannot be related to Zn levels, nor can it be concluded without
additional information that Zn was not toxic because yield was notreduced.
Williams (1975) gives the results of a trial involving a highcopper-contaminated sludge in which the rate of application was varied.
He concluded that I'A concentration of 80 mgjkg Cu in soil appl ied
in sludge form resulted in a very large reduction in yield of leaves
and roots ll• This conclusion may well be true but the reported experi
ment is not necessarily a demonstration of cause and effect of Cu.
Similarly, Sykes (1974), and Tarbox and Outram (1974) do not differ
entiate clearly between application of a chromium-contaminated sludge
and the individual effect of Cr. Webber (1972), in his original
testing of metal toxicities of individual highly-contaminated sludges,
was careful to note tha~~hen interpretating the results, allowances
must be made for the other factors.
3.2.3.1. Zinc
Zinc concentrations in the trial, of up to 135 mgjkg for rye
grass and 120 mgjkg for white clover were within the range of possible

- 29 -
toxicity (M.A.F., 1978). The M.A.F. recommendation for pastureherbage «60 mg/kg Zn) appears conservative compared with a wide
variety of food crops: <200 mg/kg Zn (Alloway, 1968), <400 mg/kg
Zn (Jones, 1972), and <300 mg/kg Zn (Cunningham et~. 1975a).Whitton and Wells (1978) considered their levels of <200 mg/kg Zn inlucerne and other food crops as generally not excessive. The sludge
application rates on pasture of Quin and Syers (1978) were insuffi
cient to produce appreciable increases in Zn concentration. The
report of Tarbox and Outram (1974) involving the use of sludge on
pasture is not easily understood because of their use of mg/l as Zn
concentration units for solids.
Recent data on Zn levels in pasture species (Dijkshoorn §~~.)
showed yields of white clover and ryegrass were reduced by 50% at
shoot concentrations of 500 mg/kg and 1000 mg/kg respectively. Yield
reductions were less than 10% for approximately 150 mg/kg and 300
mg/kg for clover and ryegrass respectively. Soil pH which affects
availability of Zn to the plant, did not alter the limiting shoot
concentrations. Often surviving plants remained healthy in appearance with no symptoms other than a decrease in size. These concen
trations were derived from special "uptake-yield" curves using extensive
results from single-metal solutions, added to soil. As the amount of
Zn taken up increased, with rising Zn concentration in the soil, the
yield remained unchanged until the amount taken up reached a maximum.
With further increase in soil Zn concentration, the amount taken up
decreased slightly while the yield declined rapidly thereby concen
trating the absorbed metal to still higher tissue concentrations until
no plants remained. Such behaviour is not immediately obvious from
"concentrat ion-yi el dII curves. Ryegrass was s1i ghtl Y more tolerant to
tissue Zn than white clover (and also plantain) but was distinctly more
tolerant to soil Zn because relatively less soil Zn was translocated tothe shoots in grass.
Zinc toxicity in animals is low, the more sensitive suffering if
the diet contains more than 500 to 1000 mg/kg Zn (Underwood, 1971).Although the increasing use of Zn salts is becoming an accepted veter
inary practice for grazing ruminant, Smith (1977, 1979) makes it clear

- 30 -
that the difference between prophylactic and toxic dose rates is not
great. Household Zn use is widespread in cosmetics and pharmaceuticals.
Food crop plants that contain 1000 mg/kg Zn are usually severely injured.
As yield is much reduced at Zn levels lower than those that injure the
consumer, other factors tend to protect the food chain.
Assuming the most conservative recommendation of less than 60
mg/kg Zn in the herbage (M.A.F., 1978), then the sludge rate of 15%
used in the pot trial for ryegrass and 5% for clover would appear to
provide excessive amounts of Zn. As clover is not an important source
of N in the presence of sludge and suffers in competition with ryegrassin such a situation (Coker, 1966a), an excess Zn level in clover couldpossibly be ignored when clover forms such a minor component (if any)
of the sward. If soil pH is within the recommended range, as in
this pot trial, then it can be concluded that a sludge application
rate of 12% does not raise overall Zn values beyond a tolerable level.
Although not strictly comparable, translation of a 12% w/w
sludge treatment in a pot trial to a field application rate, corres
ponds to an equivalent dose of about 250 t/ha or about four times the
maximum E.P.A. recommendation. Keeney et ~. (1975, quoting Hinesley,
1974) notes that evaluation of long term disposal sites in Europe and
Australia and work at the University of Illinois, documented no toxicity
in crops in which soils were overloaded by 4.5 to 6.4 times their
calculated II zinc equivalent ll values.
3.4.3.2. Copper
There is reasonably good agreement (Allaway, 1968; Jones, 1972;
Chaney, 1973: Cunningham et~. 1975a; Kelling ~~. 1977c) that Cuin herbage is potentially toxic to both plants and animals when con
centrations are above the M.A.F. (1978) recommended maximum of 20 mg/kg.
Inhibitive shoot Cu concentrations for 50% yield depression for clover
and ryegrass, as given by Dijkshoorn et~. (1979), are 38 mg/kg and
18 mg/kg respectively. Although trial herbage levels for Cu were
approaching these limits at the higher sludge application rates,analyses were generally IIJithin the M.A.F. (1978), l' sa fe excess ll range

~ 31 -
of 8 - 20 mgjkg. Underwood (1971) concluded that sheep were the mostsusceptable of all domestic livestock to Cu toxicosis and that cattleappeared to be less susceptable although experimental evidence wassometimes conflicting.
Complimentary or antagonistic interactions between elementsmay be more important in animal toxicity than a permissible intakelevel of a single potentially toxic element. This factor is particularly important in the case of Cu toxicity which can also depend onZn, MO, Ca and Fe dietary components (Underwood, 1971). Animals ofhigh Cu status are less at risk from Cd or Zn poisoning than those ona barely adequate copper intake, because both Cd and Zn exert a directantagonistic effect on Cu metabolism (Bremner, 1977; Underwood, 1979).It was concluded by Underwood (1979) that when a potentially toxicelement interacts metabolically with others, there is no single safe,tolerable or permissible level of intake. A range of dietary levelsis possible depending upon the chemical form and the ratio of thatelement to other elements. Bearing in mind the complexities of Cuinteractions, the higher than normal Cu status of herbage found in thetrial is probably not detrimental to animal health. However anyincrease in herbage Cu concentration must be avoided as the rangebetween adequate nutrition and Cu toxicity is narrow.
3.4.3.3. Other Elements
Manganese results were included because of the mobility of thiselement into plant tops, particularly in acid soils. However thetrial results were all in the safe range. This result contrastswith the usual agricultural concern over Mn and Cu deficiency, particularly at soil pH values exceeding 6.5. Chromium analyses areprobably influenced by soil contamination, a problem considered later,and are of interest to the second pot trial. Nickel values in theherbage are not reported because of analytical variability in theresults obtained. Considering the low sludge level of Ni when compared with the corresponding results for Zn and Cu, there is nolikelihood of any deleterious effect from Ni (Page, 1974; Underwood,1971). As discussed in Section 3.1, Cd, Hg and Pb, present no problem.

- 32 -
3.5 SLUDGE TRIAL CONCLUSIONS
The most important points to be noted from this sludge trial
are as follows.
1. Yields increased by up to three fold for white clover
and twenty fold for ryegrass on application of sludge.
The increases were due to the higher nutrient status of
the sludge as compared with the dune sand material.
2. Using the E.P.A. maximum sludge application rate of 3%w/w as a reference base, yield increases of up to three
times the rate for clover and five times for ryegrass
were observed. No subsequent decrease in yield was
evident at 10 times the rate for clover and at least 20
times the rate for ryegrass.
3. These results were obtained with, and are conditional
upon, the pH being adjusted to an acceptable level of
6.5 to 7.0.
4. Herbage analysis gave depressed K levels which ~ndicated
the high possibility that beneficial effects would result
from supplementary additions.
5. Zinc was the only metal present in potentially toxic
amounts in the herbage. Toxicity would occur only at
very high rates of sludge application.
6. Provided pH is maintained correctly, the use of a sludge
rate of 12% w/w should not raise Zn values beyond a
tolerable level.
7. As Cu concentrations were nearing the region of possible
toxicity, care must be taken not to further increase Cu
content of sludge or herbage.

~ 33 ~
CHAPTER 4
SLUDGE CHROMIUM
4.1 TOXICITY OF CHROMIUM
Chromium which is widely distributed in nature, is not one ofthe metals usually considered as a hazard in sewage wastes. In the
establishment of sludge application guidelines as described by Webber
(1972) and recommended by Chumbley (1971), Cr was regarded as not
toxic to plants unless present in very large amounts (over 500 mg/kgin the soil). Subsequent recommendations such as those of Chaney
(1973), Baker and Chesnin (1975) and Keeney et~. (1975), considered
Cr to be of low toxicity, and non-essential for plants. The concentration of Cr found in typical domestic sludge is such that very highsludge applications are required to produce Cr concentrations in soils
that exceed those sometimes found naturally. Approximations ofsludge enrichment of soils made by Page (1974) indicate that othertrace elements such as Cd, Zn and Cu become limiting, relative topotentially hazardous concentrations, before Cr (and Ni) can presentproblems. However with Cr levels exceeding several thousand mg/kgin industrial sludges it was noted by Page (1974) that Cr may becomea controlling factor in limiting the amount of sludge applied to soil.
The limited literature on the role of Cr in soils and in plantand animal nutrition has been well discussed by several authors.The distinction between trivalent Cr (cationic) and hexavalent Cr(anionic) has lost much of the importance attributed to it in earlierresults, and attention is now focused on availability. As explainedlater it has now been found that trivalent Cr may oxidise readily to
the hexavalent form under conditions prevalent in many field soils
(Bartlett and James, 1979).
Some minor stimulatory effects of Cr salts on plant growth were

- 34 -
collated by Mertz, (1969). On the basis of evidence then and possible
indirect effects, Pratt (1966) concluded that reported stimulatory
effects were generally small, erratic, and largely unverified.
Extensive tests by Huffman and Allaway (1973a) established that Cr
was not essential for higher plant growth, at a level of at least
two orders of magnitude less than molybdenum, which is required inthe smallest quantities of any known essential element. It has been
shown however, that Cr is an essential nutrient for normal metabolismin man and some animals. Its primary effect appears to be involve-ment in the initial steps of glucose utilisation with Cr activity
being closely tied to that of insulin (Mertz, 1969; Scott, 1972).
No damage concerning humans and animals induced by excessive levels
of Cr in soils or plant tissue have been reported so far (de Haan andZwerman, 1976).
Chromium in its hexavalent form was particularly toxic to plants
(Hunter and Vergnano,1953; Pratt, 1966; Turner and Rust, 1971;
Mortvedt and Giordano, 1975; Dijkshoorn et~. 1979), but only at
very high levels to humans in direct contact with such chemicals(Sykes, 1975)~ Trivalent Cr has been considered the predominate
form in the presence of organic material and at the pH values and
redox potentials prevailing in most soils (Bartlett and Kimble, 1976a;
de Haan and Zwerman, 1976; Cary et ~. 1977b; Leeper, 1978).Nutrient solution studies by Huffman and Allaway (1973b) and Pettersson
(1976) showed that for a variety of plants uptake and translocation
of Cr and plant yield differed only slightly between trivalent andhexavalent Cr sources.
Using culture solutions of hexavalent Cr, Turner and Rust (1971)
showed severe Cr toxicity in soybeans with solution concentrationsas low as 0.5 mg/kg with the primary toxic effect at the root.
Similar results were obtained by Hunter andVergnano (1957) in oats,
with low leaf concentrations of Cr and leaf symptoms being subsequentto root damage. Studies by Soane and Saunders (1959) using hexavalent
Cr as an additive to sand caused severe stunting in corn at 10 mg/kg,
but produced no specific symptoms. At 25 mg/kg they observed a
particularly severe effect on the roots which were blackened and
withered at the tips with a lack of root hairs. Using soils treated

- 35 -
with hexavalent Cr, Mordvedt and Giordano (1975) found that very littlecorn growth resulted after application of Cr to the soil at a rate of
80 mg/kg. The narrow range of Cr concentrations found in the corntops, of normal and retarded plants suggested that Cr was toxic toplant roots and that its translocation to plant top was very limited.
Using trivalent Cr mixed with soil in the same way, Mordvedtand Giordano (1975) found that although yields were not significantlyaffected at 80 mg/kg, they were reduced by 55% at 320 mg/kg. Theysuggested that trivalent Cr may have been fixed by the soil in formswhich were less available than chromate to plants. Using sewagesludges with similar concentrations of Cr, mixed with soil, theyfound that neither plant growth nor Cr uptake was affected. Theyconcluded that the availability of Cr to plants, when these wasteswere applied to soil was quite low. Data taken from Dijkshoorn et ~.
(1979), who used trivalent Cr in soil in a study on metal uptake inpasture species (plantain, clover and ryegrass), showed that cropyields were decreased by about 50% at soil levels around 250 mg/kgCr. Studies in toxicity of naturally occurring "serpentine" soilswith high Cr levels indicate that their infertility may result fromseveral factors and it is by no means certain that Cr is the onlypotentially toxic element involved (Soane and Saunder, 1959; Pratt,1966; Anderson et ~. 1973).
The concentrations of metals in sewage sludge are generallylow unless there is specific industrial pollution. However, anymetal must eventually prove toxic if available in high enough concentrations. Most reports involving the use of either domestic sludgeswith a relatively small quantity of metals or sludges with a highindustrial component, have focused their attention on the problemsof Zn, Cd, Cu and Ni. In comparison, any effects from Cr arenegligible. Investigations of toxicity specific to Cr in soil-plant-animal interactions must therefore be limited to situationswhere Cr is available in large quantities in the soil, while otherpollutants are present in only small quantities. The possible toxiceffect of Cr is the limiting of optimum growth of the plant. Ascommented by Allaway (1968), Cr is one of the few essential elements
for which no accumulation against a concentration gradient is evident

- 36 -
at any point in the biological cycle from soil to plant to animal.
4.2 AVAILABILITY OF SOIL CHROMIUM
Concentration of Cr in soil solution and hence its availability
to plants is extremely low. Anderson et~. (1973) found that even
near the centre of a highly toxic area of serpentine soils containing
634 to 2100 mg/kg Cr, its concentration in solution was 0.02 Wg/m1
and that less than 5 mg/kg could be extracted by 2.5% acetic acid.
Low Cr extractabilities from serpentine soils were found by Birrell
and Wright (1945), while Lyon et~. (1968) separated less than 0.1%
of the total soil Cr in 2.5% acetic acid. Leaching of 15 soils withhigh Cr contents (3% to 4% Cr203), with 1.0M ammonium acetate usually
extracted less than 0.2 me/kg (Robinson et ~. 1935). Any Cr thatis released into soil solution would normally be sorbed very strongly
by soil colloids (Lisk, 1972; Leeper, 1978). Mordvedt and Giordano(1975), although not giving the actual data, commented on the very low
Cr extracted from their metal-amended sludges by 0.5 and O.lM HC1 and
DPTA. The insolubility of Cr can be gauged by its average abundance
in the lithosphere of 200mg/kg (Baker and Chesnin, 1975) compared with
its concentration in river water 0.00018 Wg/ml and in sea water of0.00005 Wg/ml (Bowen, 1966).
While attemtping to increase Cr concentrations in food plants,
Cary et ~. (1977b) found the most consistent feature of their experi
ments was the pronounced tendency of soluble Cr added to soils to
revert to forms that were unavailable to plants. In reviewing the
soil chemistry of Cr, they concluded that the pH range of most arable
soils favoured the formation of trivalent rather than hexavalent Cr.
At pH 7 in a well-aerated soil the theoretical concentration of cr042
is found to be about equal to the concentration of Cr(OH)2+ (Bartlett
and Kimble, 1976a, 1976b; Cary et ~. 1977b). Although the concen
tration of hexavalent chromium was still extremely low, Cary et ~.
(1977b) concluded it may well have been this anion that was taken up
by the plant. Other reports have noted (Patterson, 1971; Webber, 1972;Bloomfield and Pruden, 1975) that unlike most other metals, Cr was more
toxic in soils with high pH values.

- 37 -
Insoluble Cr in soils appears to be in the form of hydratedoxides or hydroxides of trivalent Cr mixed with or isomorphicallyprecipitated in iron oxides. Chromium readily forms chelates,some of which are extremely stable (Stevenson and Ardakani, 1972;Leeper, 1978). It was found by Bartlett and Kimble (1976a) thatsoil organic complexes of trivalent Cr were formed at low pH andappeared to remain stable and soluble even when soil pH was raisedto levels where the Cr would be expected to precipitate out. Inthis context it has been noted that trivalent Cr is unique amongmany cations in that it is held so tenaciously by certain syntheticcation exchange resins that it can be removed only by ashing theresin (Lisk, 1972). Such behaviour would contribute to the lowavailability of soil Cr.
Recently Bartlett and James (1979) found that trivalent Croxidises readily to the hexavalent form under conditions prevalentin many field soils. In previous reports Bartlett and Kimble (1976a,1976b) were unable to demonstrate oxidation at all, even underconditions of maximum aeration and high pH. When hexavalent Cr was addedto soil, the presence of soil organic material brought about spontaneous reduction to trivalent Cr, even at pH above neutrality.Oxidation of Cr by soils was not discovered earlier because theimportance ot studying fresh field soils rather than crushed, driedand stored samples, was not appreciated. Bartlett and James (1979)considered the explanation of the oxidation to be the presence in thesoil of highly oxidised Mn which served as an electron acceptor inthe reaction. They found plants were severely damaged by hexavalentCr formed from trivalent Cr added to virtually any fresh moist soilsample. The hexavalent Cr had persisted for the five months up topublication date.
Liming a soil to lower the solubility of other metals such asCd or Zn may increase the likelihood of Cr oxidation by allowing Mnto become oxidised. Such an effect of pH has been observed, asnoted before. At high pH however, solubility of trivalent Cr mayalso be a factor limiting its oxidation rather than just the presenceof oxidised Mn. Such findings may help to explain the variabilityof results in soil Cr studies and may also raise questions as to the

- 38 -
availability of Cr in sewage sludge and the soil conditions favourablefor its oxidation.
4.3 PLANT UPTAKE OF CHROMIUM
From a toxicity viewpoint, high levels of Cr in plant tissues
are not injurious to animals consuming that plant, as Cr appears tobe an essential animal nutrient. Studies on levels of Cr in planttissues have focused on;
(i) its mobility within the plant,
(ii) the form in which it is available, and
(iii) the ratio of Cr to other elements.No relationships have yet been found between Cr levels in plants andthe soils upon which they are grown (Baker and Chesnin, 1975).
Reported levels of Cr in plant tissues vary widely. Andersonet~. (1973), concluded it was likely, that the Cr thus found inanalysis of plant tops, in concentrations which could have beenconsidered toxic was actually from soil material which their aciddetergent washing procedure failed to remove. Although the plant
material selected was free from obvious contamination and theirwashing procedure well described, microscopic examination showed the
plant surfaces were still not completely free from adhering soil
particles and that the problem of splash/dust contamination was asserious for Cr as it was known to be for Al. The values reported
from two pot trials illustrate this point. Table 4-1A from Wellsand Whitton (1976) is a regrouping of data showing total Cr valuesobtained from lucerne roots and tops in a trial on sludge/soilmixtures, where the roots were separated by water washing. Theaverage tops/root concentration ratio was 0.04.
There were no obvious patterns between successive crops orwith sludge/soil ratio but the results for roots tended to parallel
those for Al and ash content. Table 4-1B of data, also for lucerne,from Whitton and Wells (1978), shows a reversed trend. The Cr tops/
root concentration ratio was 3.4. In their discussion of soilcontamination, Whitton and Wells (1978) derived average contamination

- 39 -
TABLE 4-1: PUBLISHED VALUES FOR CHROMIUM CONTENT OF LUCERNE
(A) Wells and Whitton, (1976).
Cr (mg/kg)Sludge Soil Tops Roots
100 15 0.1 - 9.2 9.4 - 110100 30 0.1 - 4.7 9.8 - 37
Average (n = 84) 1.44
(n = 12) 33
(B) Whitton and Wells, (1978)
Cr (mg/kg)Sludge Soil Tops Roots
850 220 9 - 26 2.7 - 4.5
850 20 11 - 42 2.3 - 19
850 130 7.8 - 32 0.46- 4.8
850 24 12 - 28 1.9 - 16
Average (n = 20) 18 5.3
values of 0.48% for the roots and 2.0% for the tops. Unless extreme
care is taken in sample preparation, conclusions drawn from reputedCr concentrations in plant tissue should be regarded as tentative.
Uptake of Cr by plant tissue and mobility of Cr within plant
tissue is extremely low. Experiments with nutrient solutions as wellas soil tests have shown that Cr is accumulated in the roots rather
than in the shoots. Huffman and Allaway (1973b), Cary et ~. (1977a)
and Dijkshoorn et~. (1979) have reported shoot/root concentration
ratios of from 0.1 to 0.004. Cary et~. (1977a) could not increasethe translocation from roots to tops in a variety of plant species.
They used 51Cr in the form or organic acid complexes, trivalent cation

~ 40 -
and hexavalent anions added to soil, and increased trivalent concen-tration in nutrient solutions. From studies of translocation and
uptake of Cr042
- in barley seedlings, Shewry and Peterson (1974)suggested that most of the Cr retained in the roots was present insoluble form in the vacuoles of root cells. Huffman and Allaway(1973b) found that, in fresh bean leaves, most of the supplied 51Cr
was present as a soluble, low-molecular~weight anionic complex notassociated with any subcellular organelle. Plants that tended toaccumulate Fe also accumulated Cr.
Dijkshoorn et~. (1979) endeavoured to relate toxicity withthe shoot concentration of various metals (Zn, Ni, Cd, Pb, Cu, Cr),for the pasture species, plantain, white clover and ryegrass. Usingchromium sulphate on a sandy soil it was found that of all the metalsexamined, Cr was the least tolerated in tissue with the lowest shootconcentrations. Chromium was tolerated at much higher levels in thesoil because uptake by the shoot was disproportionally less. Theinhibitive shoot concentrations of Cr for 50% yield depression were4, 9 and 2.5 mg/kg respectively for plantain, clover and ryegrass.Chromium was more toxic in the shoots of grass than in clover, butless readily absorbed by grass, so that clover and grass were aboutequally sensitive to Cr in the soil. Corresponding Cr concentrationsin the rather acid sandy soil were around 500 mg/kg. Although yieldwas reduced, the plants remained healthy in appearance with nosymptoms other than reduced growth. Such low tissue levels, however,make diagnosis of Cr toxicity in herbage from field experimentsdifficult because of the possibility of dust contamination.
A study by Cunningham et ~. (1975c), compared crop growth andmetal uptake on soil treated with inorganic metal salts, with resultsobtained when a sewage sludge was amended with the metals beforeaddition to the soil. Trivalent chromium acetate was used as theadditive. Although this experiment was not designed to evaluateinteractions between metals or the effects of individual metals, thehigher Cr treatment produced the lowest yields. The inorganic metaltreatment gave lower yields in all cases than the metal-amended sludgetreatments which indicated that the metals were more available, andtherefore more toxic, if present, in inorganic form. The Cr concen~

~ 41 -
tration in plant tissue was higher by a factor of four in the inorganicmetal treatment than in the metal-amended sludge. In another trial
with chromium acetate amended sludge, Cunningham ~t~. (1975b) foundthat increasing the concentration of Cr in the sludge (from 400 mg/kgto 1,400 mg/kg on a soil basis) approximately doubled the Cr concen~
tration in plant tissue. More important however, it was noted that,by increasing the concentration of sludge Cr, plant tissue concentrationsof Cu, Zn, Ni, Cd and Mn were significantly decreased. This reductionwas possibly due to a blockage of absorption sites, interference withtranslocation of metals in the plant and/or a complexation of Cr andthe other metals.
In the trials reported so far, herbage response to Cr has beenrelated to its form and availability, with degree of toxicity decreasingin the order,
(i) hexavalent/trivalent in culture solution(ii) hexavalent mixed with soil(iii) trivalent mixed with soil(iv) trivalent with sludge(v) naturally present in sludge.
Chromium proves highly toxic to plant growth when it is available, butthe uptake of Cr is very limited. The presence of Cr in the growingmedium may also have a depressing effect on plant uptake of othercations. Excessive concentrations of Cr in plant tissue are bothdifficult to determine and inconsequential from the viewpoint of animalnutrition.
4.4 CHROMIUM IN SLUDGE
Levels of Cr in British sewage sludges (Berrow and Webber,1972) ranged from 40 to 8,800 mg/kg. The highest concentrations wererelated to the use of Cr compounds in leather manufacture. Incomparing trace element concentrations in sludges from several countries
Page (1974) observed that most sludges had Cr contents ranging from50 to 500 mg/kg, (median of 200 mg/kg). A few sludges had valuesgreater than 1% with the extreme maximum being 3% to 4%.

(1975b)considerably
All metal
- 42 -
Cationic Cr was presumed by Chumbley (1971), in his BritishAgricultural Department Advisory Service Recommendation, to be nontoxic to plants unless present in very large amounts. The recommendation, which was based on the work reported by Webber (1972),defined a 1I1 arge amount!! of Cr as one exceeding 500 mg/kg Cr in the
soil. Chaney (1973) does not list Cr in the table of limits formetal content of sludge, appropriate for land application. In mostreports of sewage sludge trials this level has not been exceededbefore the toxic effects of other metals become apparent. Table4-2 sets out sludge Cr levels in some reported trials together withthe zinc equivalent (as defined by the E.P.A.) of the other heavymetals.
Sludge application rates of Dowdy and Larson (1975) in trial1 (Table 4-2) were so low that yields increased up to the maximumapplication rate of 30 t/ha. Tarbox and 00tram (1975) in trial 2used a high Cr sludge, firstly with a peat in which grass would notgrow and secondly with a IItopsoil!!. Grass yields increased withapplication of up to 100% sludge. Although the sludges in trials1 and 2 both contained high levels of Cr and were similar toChristchurch sludge, there was no way one could observe any effectspecific to Cr from such studies as the sludge application rate wasvaried, not the Cr content of the sludge.
The herbage yields found by Cunningham, Keeney and Ryan (1975a)using 4 sludges in trial 3, at first increased for low applicationrates (125 to 250 t/ha) but decreased thereafter for higher rates orsubsequent crops. Yield decreases did not give any significant linearor partial regression coefficients with Cr. Sludge 3(b) was appliedat a maximum rate of 5,300 mg/kg, which together with the lower Crrates of the other sludges in the study and the high levels of othermetals, would make statistical detection of Cr effects difficult inthe presence of the other larger magnitude responses.
A further trial (4) by Cunningham, Ryan and Keeneyusing metal-amended sludge to evaluate yield responses tohigher metal levels but used a low Cr sludge as a base.

~ 43 -
TABLE 4~2: CHROMIUM CONCENTRATIONS IN REPORTED SLUDGE TRIALS
Trial Sludge Sludge zinc ~1aximum
Reference Cr equivalent** soil CrCrop
mg/kg
1 4,600 2,100 200 barley
2 4,800 1,300 4,800 grass
3(a) 2,100 10,700 400 corn/rye(b) 29,000 5,900 5,300 II
(c) 4,300 10,300 780 II
(d) 1,600 16,800 290 JI
4 14,800 29,000 400 corn
to 53,000 to 85,000 to 1,400
5( a) 13,600 >14 ,000* 1,360 II
( b) 500 >2,100* 50 II
6 100 1,900 100 lucerne
7 850 3,500 850 lucerne &
vegetables
8 66 1,800 - pasture
9 4,800 3,800 200 pasture
to 27,000 to 5,000
* Zn only, no Cu or Ni values given
** (Zn + 2.Cu + 4.Ni)
References:
1. Dowdy and Larson (1975a)
2. Tarbox and Outram (1975)3. Cunningham, Keeney and Ryan (1975a)4. Cunningham, Ryan and Keeney (1975b)
5. Mordvedt and Giordano (1975)6. Wells and Whitton (1976) (Levin sludge)
7. Whitton and Wells (1978) (Auckland sludge)
8. Quin and Syers (1978) (Templeton sludge)
9. Christchurch sludge (this study)
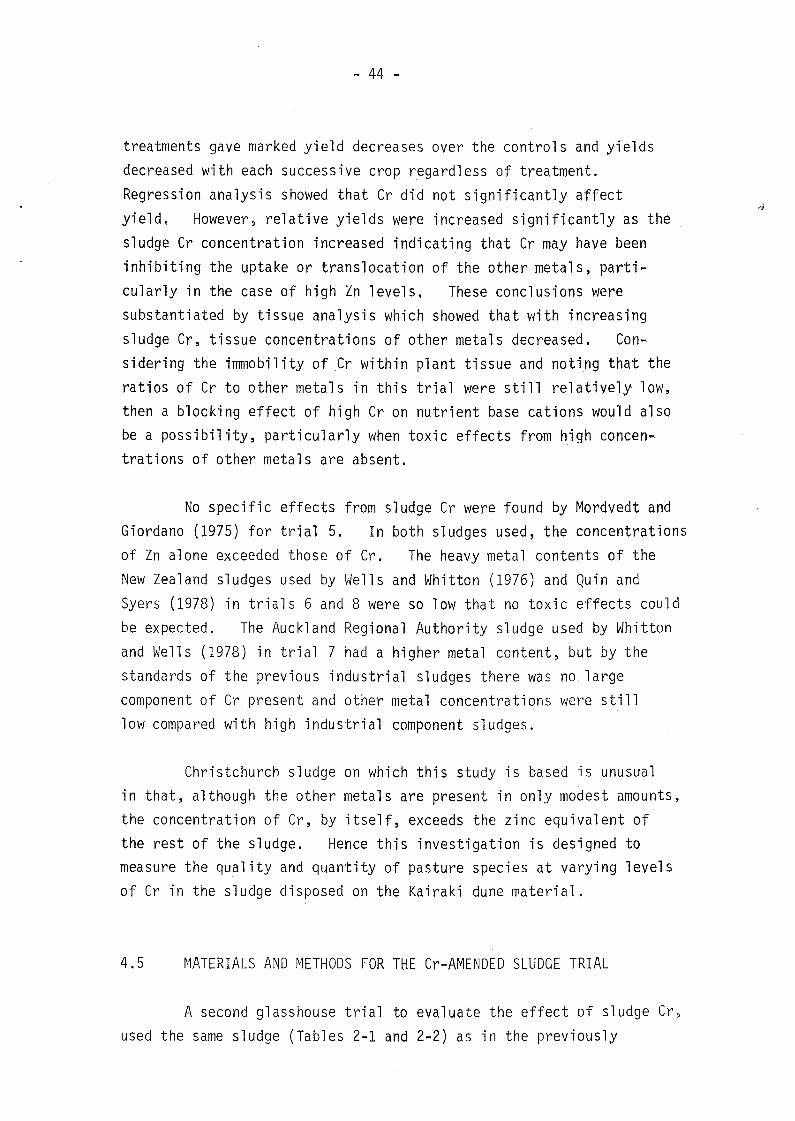
~ 44 -
treatments gave marked yield decreases over the controls and yieldsdecreased with each successive crop regardless of treatment.Regression analysis showed that Cr did not significantly affectyield. However, relative yields were increased significantly as thesludge Cr concentration increased indicating that Cr may have beeninhibiting the uptake or translocation of the other metals, particularly in the case of high Zn levels. These conclusions weresubstantiated by tissue analysis which showed that with increasingsludge Cr, tissue concentrations of other metals decreased. Considering the immobil ity of Cr within plant tissue and noting that theratios of Cr to other metals in this trial were still relatively low,then a blocking effect of high Cr on nutrient base cations would alsobe a possibility, particularly when toxic effects from high concentrations of other metals are absent.
No specific effects from sludge Cr were found by Mordvedt andGiordano (1975) for trial 5. In both sludges used, the concentrationsof Zn alone exceeded those of Cr. The heavy metal contents of theNew Zealand sludges used by Wells and Whitton (1976) and Quin andSyers (1978) in trials 6 and 8 were so low that no toxic effects couldbe expected. The Auckland Regional Authority sludge used by Whittonand Wells (1978) in trial 7 had a higher metal content, but by thestandards of the previous industrial sludges there was no largecomponent of Cr present and other metal concentrations were stilllow compared with high industrial component sludges.
Christchurch sludge on which this study is based is unusualin that, although the other metals are present in only modest amounts,the concentration of Cr, by itself, exceeds the zinc equivalent ofthe rest of the sludge. Hence this investigation is designed tomeasure the quality and quantity of pasture species at varying levelsof Cr in the sludge disposed on the Kairaki dune material.
4.5 MATERIALS AND METHODS FOR THE Cr~AMENDED SLUDGE TRIAL
A second glasshouse trial to evaluate the effect of sludge Cr,used the same sludge (Tables 2-1 and 2-2) as in the previously

~ 45 -
described pot trial, amended by the addition of CrC1 36H 20. An
aqueous solution of the trivalent Cr salt was mixed with sludge to
form a slurry which was then allowed to dry with occasional stirring
over a period of several weeks. This redried sludge was mixed withsufficient unamended sludge to fill 64 plastic pots (with drip trays),each with 1.3 kg of a 4% w/w (oven dry) sludge/sand mixture. Thiswas equivalent to a field application rate of 110 t/ha. The sludgeCr levels were increased by 0.33%, 0.97% and 2.23% (oven dry),These levels were substantially greater than would normally beencountered. This sludge/sand ratio had a zinc equivalent of about17% of the sand CEC, or about 12% of the amended CEC as defined in
Chapter 3.2. Each pot was leached over a period of four weeks to
eliminate soluble salts (Cunningham et ~., 1975a). Mixture pH
values were then measured and titration curves against Ca(OH)2determined. Half the pots were then treated with Ca(OH)2 to bringthe pH within the range 6.5 to 6.9. Pots received no fertiliser
treatment.
Planting of either five white clover or five ryegrass seedlings
per pot was carried out eight weeks after mixing. Seedlings which
died were replaced at weekly intervals for five weeks. Pots wereharvested after 14 weeks and againat20 weeks and then shifted outof the glasshouse as in the previous sludge trial. Measurements ofpH were taken,
(i) on planting,(ii) just prior to the second harvest and
(iii) when the pots were finally emptied.
Methods of analysis for herbage cations and trace metals werethe same as for the previous sludge trial (Charter 3.3) except that,with the poor yield for some treatments, there was insufficient plantsample for duplicate determinations and the consequent data as noted
in tables of results should be treated with caution.
The glasshouse chromium trial consisted of three Cr levelsplus an untreated control, treated and untreated pH, ryegrass and
clover, each with four replicates (i.e. 64 pots). This method of
using metal-amended sludge was similar to that used by Cunningham ~!

- 46 -
al. (1975b), in establishing the effects of high rates of Cu, Cr, Ni
and Zn in sludge. This was also the method used by Cunningham, et
al. (1975c) for comparing the results of soil treated with inorganic
salts with results obtained when sewage sludge was amended withmetals before addition to the soil. As yields were higher for the
sludge treatments than for the inorganic treatments they concludedthat caution shoulrl be used when attempting to use results of applyinginorganic salt treatment to soils when evaluating phytotoxicity and
toxic metal uptake from soils amended with sewage sludge. Thedesign of the pot trial reported here complies with these requirements.No other report to date has used chromium-amended sludge. The otherreport involving variation in Cr levels (Mortvedt and Giordano, 1975),compared inorganic salts on soils with sewage sludge.
4.6 RESULTS AND DISCUSSION
4.6.1 Herbage Yields
Total yields of ryegrass and clover after 20 weeks, are shown
in Figure 4-1. Yield, pH and statistical data are listed in
Appendix 4. The vertical bars shown in Figure 4-1 are the standarderrors of the four replicates.
Yield decreased with increasing Cr treatment, the effect forryegrass being somewhat less than for clover. Application of oneway analysis of variance between Cr treatments and Duncan1s multiplerange test between mean differences, resulted in significant or highlysignificant differences in yield between all treatments except thefirst and second for ryegrass. Stepwise multilinear regressionalanalysis for the individual effects of pH and Cr gave highlysignificant multiple correlation coefficients (R = 0.91 and 0.66respectively) for yield of clover and ryegrass.
Although the yield axis intercepts (14.3 ~ 1.8 for clover and3.1 + 0.4 for ryegrass) are readily calculated, the temptation to
assume a linear extrapolation to calculate yield depression from zero
must be resisted. Absolute conclusions are limited to the range of

- 47 -
Ryegrass
T r =0·87**3·0 ,...
,eT1.... •
I ... .L..i ....... .. ...
·"f·.,2'0 -.. .. ... ... ...., .. •1·0 ... .. ..... ... .... .. ..... ....
- 0 I I i I0
~en
Clover"0 \
C1) \JT r=0·91 .....> ~
9 f- 11\\
\ T\ .Ue\
61 \,... \
\\
\\
\\
3 - \\
1I11\
I\
I I0 •0 1 2 3
Cr in Sludge %
Figure 4-1. Yields of ryegrass and clover in the Cr-amended sludge pot
trial at approximate pH 5.7 (e-e) and 6.8 (_-_).

- 48 -
values tested and without the availability of identical sludgecontaining no Cr there is no easy experimental method of provingenhancement of yield \hlith Cr absent. Chromium is a non-essentialelement in plants and a threshold tolerance level mayor may notexist. Because of the very low uptake of Cr such a threshold wouldbe very hard to determine with any degree of certainty.
Seedling mortality increased dramatically with Cr treatmentas shown in Figure 4-2. However a slight possibility exists thatin the early stages of the trial the initial leaching to reducesalinity may have been incomplete and thus any subsequent overwatering could have enabled seedlings to survive better. Subsequent soilconductivity measurements (1:5 v/v suspension) were mostly below0.008 Sjm and salt accumulation toxicity is not expected until atleast 0.02 Sjm (for clover). Analysis of variance of percentageincrease between harvests with Cr treatment (and hence possiblyconductivity) was not significant, indicating that any effect dueto decreasing conductivity was absent by harvest time. As initialconductivity measurements were not carried out implications thatthe mortality of the seedlings was due entirely to Cr toxicity mustbe treated with caution.
There was no significant improvement in fit for the pH variablefor either ryegrass or clover. Patterson (1971) observed that Crappeared to differ from other elements in that toxic effects wereenhanced by raising the pH of the soil, and that in a field trialinhibition of growth was greatest at pH above 6.5. As noted in thereview of soil chemistry of Cr in section 4.2, it is possible forboth trivalent and hexavalent Cr to be present in soil.
The mechanism and chemical form in which extremely low concentrations of chromium become available to plants are not welldefined.
Comparisons of the deleterious result of this trial, withother attempts to estimate the individual effect of Cr as the singlevariable in sludge, are limited to
(i) the original trial of Webber (1972),

- 49 -
Ryegrass Clover80
::-::~~~:::.:.'.':.:
40::::::'.'
~~~:: ~~~.'
jj.'
mN .':::
.'.'.' .:....~j
:: :::'.''.' .'::: .' :::
tn 0::
.c.... Ryegrass ClovercaG)
80c
40
c %r in Sludge
o 1 2
Figure 4-2. Seedling mortality from five replantings in the Cr-amendec
sludge pot trial at approximate pH 5.7 (I:~~~~~) and 6.8
(m)·

- 50 -
(ii) Mortvedt and Giordano (1975), and(iii) Cunningham ~~. (1975a, 1975b, 1975c),
Webber reported a field trial involving sludge adjusted to 4,400
and 8J 800 mg/kg Cr. No data was given for the cropping soil used~
and although it was noted that appropriate fertiliser dressings wereapplied, no further details were given. In the trial, the Cr/(Zincequivalent) concentration ratio was about 3.2 in a ll chromium-contarninated ll sludge mixed with lIuncontaminatedll sludge of variable Zn
content. The application rate used by Webber (1972) was 125 t/ha(which is about 5% by weight for a 20 cm depth of normal soil), suchloadings are not sufficiently heavy to determine any detrimentaleffects from Cr with accuracy. Webber records that Cr gave eitherno response or at most a slight, but non-significant reduction incrop yields.
In a pot trial, Mortvedt and Giordano (1975) varied theapplication rate (maximum 10%) of a sludge containing 1.36% Cr whichalso contained 1.40% Zn, but they gave no data for other metalspresent. They compared the results with a non-contaminated sludgeand with compost and showed that I!concentrations of chromium in allthree corn crops were not affected by waste application l!. Theyalso noted that lithe high chromium level in Sludge A resulted in avery high application rate (1,360 mg/kg Cr), yet neither plant growthnor chromium uptake was affected by application of this product",(avoiding the trap of attributing plant growth variation to application of high Cr). Although they correctly concluded "pl an tavailability of chromium contained in these wastes applied to soilis quite low", this gave no information on the effect of the Cr 'inthe wastes on plant yields. Details were given of considerableadditional amounts of ~'lg, Ca, K, P, S and ~1n fertiliser applied inthe trial but none on the natural levels in the soil itself. Furtherexperiments using solutions of trivalent and hexavalent Cr added tosoil resulted in severe toxicity which indicated the much greaterplant availability of inorganic Cr. Examination of their data shows
that in situations where yields were reduced by inorganic Cr~ tissueCr levels were not significantly different from those in the sludgeexperiments, except at extreme toxicity where a breakthrough to thetops occurred.

- 51 -
The two sludges used by Mortvedt and Giordano (1975) oathhad Zn concentrations in excess of their Cr content. for soils atthe same pH, they concluded that, although Zn contained in municipalwastes was available to crops, the plant uptake of Zn from the wasteswas much lower than from equivalent rates of Zn applied as ZnS04.Using plant uptake and soil extraction data they found that the lowerplant uptake of Zn was not accounted for entirely by any raising ofpH by these wastes.
Cunningham et~. (1975b) found that relative crop yieldswere increased significantly in a highly metalliferous sludge as theCr concentration increased, which indicated the Cr could be inhibitingthe uptake or translocation of the other more toxic metals. Theyfound significant decreases in plant tissue concentration of Cu, Zn,Ni, Cd and Mn with increasing sludge Cr concentration. Although itwas not suggested by Mortvedt and Giordano (1975), such a blockingeffect by Cr would explain the decreased Zn uptake that was observed.It would also explain why no plant growth variation was obtained byapplication of a sludge which, in addition to Cr, also containedvery high levels of Zn. Cunningham et~. (1975c), used a techniqueof amending sludge with metal cations before treating the soil. Theyreported (Cunningham et ~. 1975b), the trial that has involved thehighest Cr content of sludge (1.48 to 5.30%). The sandy soil usedhad a CEC of 13 me/100 g and an exchangeable K level of 2.5 me/kg.No fertiliser was added although a fertilised control was included.The levels of the other metals applied were also extremely high (zincequivalents of 29.000 to 85,000 mg/kg) but the sludge application ratewas low (2.8% w/w or approximately 63 t/ha). All treatments initially gave marked yield decreases over the controls. Nutrient stresswith continued cropping was indicated by subsequent yields decreasingfurther. From the relative increases in yield with increasing levelof Cr. which was most pronounced in the case of the high Zn treatment.Cunningham et~. (1975b) suggested Cr was either blocking the uptakeof Zn or affecting the translocation of Zn within the plant. This
could have been either a physiological or a soil chemical process.These results are consistent with Zn being the most mobile and Cr theleast mobile of all the metal cations within plant and soil (Dijkshoornet~. 1979). Turner and Rust (1971) also reported that Cr in

- 52 -
solution appeared to interfere with the plant uptake of a broad rangeof elements.
The results of the present trial using very high levels ofCr amendment but no other metals, show a marked decrease in yield withincreasing Cr content, a result not documented elsewhere for sluJge
borne Cr. This trial used unfertilised soil of very low naturalfertility compared with the highly fertile soils used by Mordvedt and
Giordano (1975) and probably by Webber (1972), Fertility levels inthe present trial were also several times lower than those used by
Cunni ngham ~~. (1975b). The concentrati ons of other metals presentin Christchurch sludge were very low compared with the trials listed
above. The Christchurch metal-amended sludge had a Cr/(Zincequivalent) concentration ratio of over 7 compared with about 0.5(Cunningham et ~. 1975b) and less than 1,0 considering Zn only(Mordvedt and Giordano, 1975).
From the foregoing results and discussion it may be concludedthat Cr in sludge causes a blockage of the absorption mechanism in
plants and/or interference with translocation of all cations involved
in plant physiology. Nutrient cations such as Ca, Mg and Kmay beincluded and not just the toxic metals. Chromium is a non-essential
element in plants and it is the secondary nature of any Cr effect,combined with varying degrees of Cr availability, that has producedso many widely varying results. These may be grouped as follows.
(1) As levels of available Cr increase, plant growthdecreases, with no other symptoms, including nontranslocation of Cr to the tops (Hunter and Vergano,1953; Soane and Saunders, 1959; Patterson, 1971;Turner and Rust, 1971; Mordvedt and Giordano, 1975;
Oi j kshoorn et~. 1979).(2) At high levels of available Cr, sufficient to cause
severe injury to the plant, mobility of Cr suddenly
increases with a breakthrough into the tops (Hunter
and Vergano, 1953; Mordvedt and Giordano, 1975;
Cary et~., 1977a; Oi j kshoorn_~t~l ., 1979).(3) If a plant is not under nutrient stress and has a
surplus of nutrient cations available, there is no

- 53 -
depression of yield in the presence of moderate amountsof Cr (Webber, 1972; Pettersson, 1976; Cunninghamet ~., 1975a) • In some ca ses, i nd i rect effects ha veresulted in yield increases (Pratt, 1966; Huffman andAllaway, 1973a; Cary et al., 1977b),
. ~~
(4) When other toxic elements are present in large a~ounts
blockage of them by Cr reduces toxic effects and evenresul ts in enhanced yields in some cases (Turner ~:nd
Rust, 1971; Mordvedt and Giordano, 1975; Cunningham
~t ~" 1975b).
In a situation in which no toxic metals are present but wherethere is considerable nutrient stress, it is possible to conclude thatthe effect of a high Cr content in sludge should be to decrease plantyield. Such an effect was observed in this study. One is thusfaced with the opposing viewpoints that Cr is beneficial in sludge, ifone wishes to suppress very high levels of toxic heavy metals fromentering the plant, but is otherwise detrimental to optimum plantgrowth where supply of nutrient cations is limited.
4.6.2. Cations and Metal Uptake
Herbage concentrations of Na, K, Ca and Mg are illustrated inFigures 4-3 and 4-4. The data is listed in Appendix 4. Using thesame general guidelines as before (M.A.F., 1978), K values were barelyadequate (2% dotted line) for healthy growth. Elevated levels ofassociated Na, Ca and in particular Mg tended to support the expectedresponse to K discussed in the previous sludge trial. The upwardtrend in K concentration in clover was probably a K depletion effectwithin the pot as at the higher Cr levels, herbage yields were verylow.
Addition of Cr had an effect on CEC's and extractable (exchangeable at pH 7 plus soluble) cations of the pot soils after mixing, asshown in Table 4-3. As more trivalent Cr was added to the sludge,the CEC of the pot mixture decreased, indicating that some of the Crbecame fixed on exchange sites in a non-exchangeable form. CEClsmeasured at the end of the trial averaged 4 me/kg lower than those

0·6
0·4
0·2
Na
- 54 -
--- --.
K3
T2 --,--------------,.,y_---A1
~
0r::
Mg Ca0-0·6 6<tJ...-r::Q)
0r::0()
0'4 4
'11\ •\ ...
\ ...\
......\ ...
--------.......
0·2 2 .... .............~ I•
II
0 I I I 1_,.....10 1 2 3 0 1 2 3
Cr in Sludge %
Figure 4-3. Effect of Cr-amended sludge on uptake of Na, K, r~g and ea
in ryegrass at pH 5.7 (e-e) and 6.8 (.-11).
Tconcentrations below dotted 2,£ line are deficient (M/-\I -'
1978) .

- 55 -
Na K~ 3 ~
- • • • 2 T-----------------~-
.-~\
\
~\\ I• I
II
I- 1~~,
r'
I I I I I I
Mg Ca- 6 -
~ 4 l-
• • • ,.-- -.- - ... ....
~I- 2-
I I I I I I
o
0·6
0·4
0·2
co....ca...C 0'6Q)(,,)
coU
0·4
oo 1 2 3 0 1 2 3
%Cr in Sludge
Figure 4-4. Effect of Cr-amended sludge on uptake of Na, K, Mg and Cain clover at pH 5.5 (.-.) and 6.6 (.-.).Tconcentrations below dotted 2% line are deficient (M.A.F.,1978) .

TABLE 4-3.
- 56 -
EFFECT OF ADDITIONAL CHROMIUM ON SOIL CEC AND EXTRACTABLE------- -~-----------
CATIONS
Cradded per pot CEC Mg Ca K Na B.S.
mg/kg me/kg %
0 44 6.3 36 3.1 2.1 108
130 42 6.6 60 2.3 1.6 169
390 36 6.9 55 2.8 0.8 182
890 36 9.6 80 3.1 1.4 263
given in Table 4-3. The loss of CEC is probably due to mineralisation
of organic material but also indicates a non-reversibility of the
fixing. The extractability of the monovalent cations, Na and K, did
not alter significantly but that of the divalent cations Mg and Ca
increased. The number of cations displaced was also greater than thE
number accounted for by decrease in CEC, shown by the increase in total
extractable cations as a percentage of the CEC. This indicated that
Cr also replaced fixed cations normally not exchangeable at pH 7 which
were released into the soil solution.
The initial "release"ofnutrient cat-ions by Cr may account for
some of the transitory, and often puzzling beneficial results of early
trials, particularly those of field experiments rather than nutrient
cultures (Huffman and Allaway, 1973a). Patterson (1971), for example,
while applying Cr salt at 50 mg/kg 100 mg/kg and SOD mg/kg on a peat
mixed with soil, noted that the effect of a single application of Cr
at each rate was stimulatory to the crops, but after each annual
application toxic effects became more marked.
Trace element concentrations of Zn, Cu, Mn and Crare shown
in Figures 4-5 and 4-6. The data is listed in Appendix 4. For
both clover and ryegrass increasing the pH to approximately 6.8, was
highly significant in reducing the Zn concentration to safer levels,
again emphasising the importance of maintaining pH in the 6.5 to 7.0

- 57 -
---------~_._----..---'-----Zn Cu
200 20 T-----------------
100 10
.... T--------------~----....................-- --~....-
Cr ------... -I
II
II
I•,,,,,,--'-,,,,,
I
10
20
Mn }J/
//
//
//
//
/
" T- - - - - _..../- - - - - - - - ---/
/
rII
II
II
I•
200
c:o
32121o_________....... ....... ....... 1.- 1.--'"
o
c %r in Sludge
Figure 4-5. Effect of Cr-amended sludge on uptake of Zn, Cu, Mn and Cr
in ryegrass at pH 5.7 (e-e) and 6.8 (.-.).Tconcentrations above the dotted lines are potentially
toxic (M.A.F., 1978).

- 58 -
Zn Cu
200 20 ------~------~--
,,,,I,,,
I\I
~--~-.---------~--
...........", .......
200 10
Bt100 \ 10
\\\ ..
0) \ ;' .......lIl:: ----~~-----------
......... •0)
E
c::0 0- Mn CrCtI...-c::Q)
(,)400 20c::0
(,)
3211 2 3 0
c %0r in Sludge
O .L--__-...L .....L- ..J-- I--.__
o
Figure 4-6. Effect of Cr-amended sludge on uptake of Zn, Cu, Mn and Crin clover at pH 5.5 (e-e) and 6.6 (.-.) .
..... concentrations above the dotted lines are potentiallytoxic (M.A.F., 1978).

- 59 -
range. A similar result was obtained for Mn in ryegrass. Thelevels of the other elements were generally in the safe range, asdiscussed in the previous sludge trial. Chromium values tended to
fluctuate, probably illustrating the contamination problems associ
ated with its detection in plant tissue, rather than accurate trends
in plant uptake. Most of the herbage Cr concentrations in this
trial and in the previous sludge trial were above the 2.5 mg/kg
(ryegrass) and 9 mg/kg (clover) values given by Dijkshoorn et ~.
(1979) for 50% yield reduction. As little Cr was added in the lo~
sludge treatments significant dust/splash contamination is indicated.
Although the data must be treated with caution, the generally increlsing herbage concentration of Cr, with Cr treatment and with pH, areresults consistent with preceding discussion. Whether this Cr is
from contamination or uptake makes no difference to possible animalingestion but simply provides more Cr for animal nutritional purposes.
4.6.3. Chromium from Tan~
As indicated by Berrow and Webber (1972), Page (1974) and
Keeney et ~. (1975), one of the main sources of Cr in sewage sludgeis the tanning industry. The disposal of Cr in tanning wastes is
not to be confused with the dereliction of land contaminated by waste
from manufacture ofCr chemicals. Compared with the major smelterpollutions described by Breeze (1973) and Gemmell (1973), disposalof tannery wastes is a relatively minor problem.
The early report by Hamance and Taylor (1948) was designedto show that tannery chrome material was harmless, by simply growinga variety of plants in a high dosage plot and noting that no unusualsymptoms were observed. With the release of the A.D.A.S. recommendations (Chumbley, 1971) naming a 500 mg/kg soil limit for toxicityfor Cr, the British Leather Manufacturers Research Association (B.L.M.R.A.) reviewed the disposal of Cr wastes (Sykes, 1972) and reputed
toxicity of Cr (Sykes, 1973). A similar study was carried out in
New Zealand (Mason, 1976).
The Cr used in tanning is mostly in a trivalent form, and
tanning industry reports place much emphasis on the lesser toxicity

- 60 -
of trivalent as compared with hexavalent Cr. This apparent
difference however~ was related to the short term availability of
Cr in the soil solution. Recent soil chemical and plant physi-
ological studies have not been able to differentiate clearlybetween the two forms (Cary et ~., 1977a, 1977b; Bartlett andJames, 1979). Understandably, much emphasis was placed by Sykes(1972, 1973) on earlier reports citing beneficial results from Crand he concluded that "chromium is unlikely to be harmful and maybe beneficial when applied to agricultural land ll
• Chromium isnot an essential plant nutrient and any beneficial effects onplant growth have been shown by others to be either indirect orunverified (Pratt, 1966; Huffman and Allaway, 1973a).
Sykes (1972) states that Ilpubl i shed reports tend to beconflicting and the ones suggesting that chromium is highly toxicare based on work carried out under very artificial conditions".However such single variable experiments using "artificiaP con-;ditions are very necessary to avoid the type of experiment reportedby Sykes (1974) which was desiged to "determine whether chromiumderived from tannery wastes has any effect on crop yield". Byvarying sludge application rates, he concluded that "even at 1000mg/kg chromium, ... the sewage sludge gave spectacular increasesin yield." Such experiments, along with those of Tarbox andOutram (1975), who used a similar sludge with a high Cr content,cannot give any information as to the individual effect of Cr, whenother components of the sludge are being incremented at the sametime. The scale of the field experiment of Tarbox and Outram offour 0.84 m2 plots would appear to be too small for them to be ableto draw significant conclusions.
It is well known that Cr content of crops grown on Crcontaminated soil does not increase appreciably. It is also wellknown that ingested Cr is non-injurious to higher animals, and thatCr is very insoluble in soil. However reiteration of these factsdoes not indicate the effects of Cr on plant growth. Lack ofappreciation as to the significance or otherwise of data, leads toreports such as that of the N.Z. Leather and Shoe Research Association (1976) in which herbage analyses were given for sludge disposal

- 61 -
sites, to support the view that, "tannery sludges can be safelyapplied to land, and vegetation can survive there, and that uptake
of chromium by such plants is very low ll• Actually their levels
of Cr (e.g. bulked grass and weeds, 20 - 33 mg/kg; "grass Jl, 4.3
6.5 mg/kg) and those of Sykes (1974) (grass, 25 mg/kg wet weight),were very high compared with the critical value of 2.5 mg/kg for50% yield reduction in ryegrass, given by Dijkshoorn et~, (1979),
Corning (1975), although rather critical of restraints onCr sludges, did conclude that B.L.M.R.A. greenhouse tests agreedwith the A.D.A.S. report (Chumbley, 1971), which gave a limit of500 mg/kg in the soil, before deleterious effects on crop yieldswere evident. The literature reviewed in this report and theresults of the Cr trial show that maximum supply of nutrient cationsin the soil is also important in the neutralisation of Cr toxicity.
4.7 CONCLUSIONS FROM THE Cr-AMENDED SLUDGE TRIAL
The important points to be noted from the glasshouse trialusing Cr-amended sludge and the previous discussion are as follows.
1. The glasshouse pot trial which used a low fertility sandysoil and Christchurch sludge amended with additional Cr,gave decreasing herbage yields of (81 ! 16)% for clover and(30 ! 16)% for ryegrass, per 1.0% Cr added to the sludge.These results were consistent with the interpretation thatan effect of Cr on plants was a blocking of absorptionand/or translocation both of nutrients and of toxic ele-ments. In the present trial, where considerable nutrientstress was involved, a marked decrease in growth from Crtreatment was manifest.
2. Variations in pH from 5.5.to 6.9 did not have any signifi-cant effect on yield, but adjusting the pH to 6.9 wasbeneficial in that it significantly decreased the levelsof Zn in plant tissue.

- 62 -
3. Addition of Cr decreased effective soil CEC and previouslyexchangeable and fixed cations were displaced into thesoil solution.
4. The only effects detected from the use of Cr were decreasedplant growth and lowered soil CEC. The disposal of wastecontaining Cr onto soils without causing deleteriouseffects on plant growth, involves the maintenance of soilfertility at levels sufficient to negate any adverse Creffects.

- 63 -
CHAPTER 5
FI ELD TRIAL
5.1 OBJECTIVES
The objectives of the field experiment were to establish
relationships between;
(i) sludge application rate and pasture growth,
(ii) chromium content of the sludge and pasture growth, and
(iii) field responses compared with glasshouse results.
The requirements of such a study were;
(i) sufficient replication to reduce random variation,
(ii) large plot size,
(iii) several levels of each variable in the range where
responses may be expected, and
(iv) all other trial factors invariant and as close aspossible to naturally occuring conditions.
No reports of other field experiments using high chromium metal-amended
slud~e were found in the literature.
The limits of practicability for such a trial were three sludge
levels (plus control), each with three metal-amended sludge Cr levels,
each treatment having four (4.0 m2) replicates.
5.2 MATERIALS AND METHODS
Dried sludge was metal amended using Cr2(OH)2(S04)2.Na2S04.H20.The method used to ensure complete metal amendment was to construct a
box (3.0 m x 4.0 m x 0.5 m) with the bottom boards spaced 1 cm apart
and completely lined with a single sheet of heavy duty (0.25 mm) blackpolythene to form a watertight container. This box was constructed
inside another (3.5 m x 5.0 m x 0.1 m) shallow enclosure, similarly
lined with polythene to form a watertight "drip tray". The chromium

- 64 -
salt (75 kg) was mixed with dried sludge (2.5 m3) while being passed
through a soil shredder into the box which was then floOded wtth water.The amount of Cr salt to sludge used for this initial concentrate was
determined from a prior laboratory test. It represented the maximumamount of Cr salt that could be added to an amount of sludge withoutbecoming subject to subsequent leaching,
The concentrate in the box was allowed to air dry while beingturned over several times during a period of several weeks. Thepolythene lining of the box was then removed and the contents leachedthree times with 2 - 3 m3 water with drainage through the bottom cracksinto the tray. The sludge was dried to field capacity and turnedbetween each wetting. No colouration due to Cr salt was evident inthe leachate and the conductivity of the final metal-amended sludge was0.05 to 0.06 S/m. After final air drying, the metal-amended sludgeconcentrate was bagged and taken to the field site for further mixingwith unamended sludge.
The field site was flattened Kairaki sand dunes as described inChapter 2.2 and was close to a supply of water. Scant vegetationconsisted of run-out lucerne pasture and weeds. It was assumed thatthe meagre soil development (mainly accumulation of organic material)would not significantly affect the properties of the new topsoil aboutto be placed over it. The site was divided into 48 of 2 m x 2 mplots, each permanently separated by a grid of (20 cm x 2.5 cm) untreated boards standing on edge. The plots were filled to the top ofthe boards with mixtures of fresh sand-dune material, shredded sludgeand metal-amended sludge.
The new IItopsoils" of known sludge, sandwere randomly distributed throughout the area.given in Appendix 2.
and chromium compositionA plan of the plots is
The levels of the trial variables (oven dry basis) were asfollows.
(i) Sludge rates: 195, 389, 584 t/ha,(corresponding approximately to 9%, 22%, 46% wlw to adepth of 20 cm). (100% sl udge = 780 t/ha to 20 cm).

- 65 -
(ii) Chromium in sludge; 0.48%, 0.79%, 1.09%.
The sludge rates used corresponded to shredded sludge applied
at thicknesses of 5 cm, 10 cm and 15 cm. Allowance was made forapproximately 15% sand incorporated upon removal from the drying bed.The control plots required a thin surface layer (0.5 cm) to stop winddrift of the sandy soil. The trial sludge rates which all correspondto the "plateau" region of the yield response curve gained from theprevious glasshouse trial, would normally be considered IIheavy toextreme",
The plots were autumn-sown with a ryegrass/clover mixture andwere mown several times (clippings retained) to establish a sward.At no stage was natural rainfall not sufficient to provide adequatemoisture. Conductivities measured for each plot on three bulkedcores varied from 0.003 to 0.19 S/m. There was a slight tendency forthe higher sludge treatments to have higher values but no consistentpattern for Cr treatment was observed. Conductivities in this rangeshould not influence plant yield. Plots were close-mown, with theclippings removed and then harvested nine weeks later. A 1.0 m x 1.0 m
x 20 cm frame was arbitrarily dropped somewhere near the centre ofeach plot and all herbage above 2.5 cm within the frame was cut withguarded handshears. The material removed was weighed, a 200 g subsample being retained for drying and analysis, and the remainderreturned to the plot.
The trial area has been securely netting-fenced with the barbwires electrified, ensuring that the trial may be continued in futureyears.
5.3 RESULTS AND DISCUSSION
Variations between plots, particularly in pasture quality couldbe distinguished by visual examination. Clover survival to harvestwas very poor. Weeds, particularly twitch, were more prominent in thehigher chromium treatments and, to a lesser extent, in the high sludgetreatments. The source of the twitch was either shredded sludge from

~ 66 ~
around the edge of the drying beds, or more likely, from the original,now-buried surface, Assuming the latter, with roots extended belowthe new soil, then this surviving twitch increased the relative yieldsfrom those plots. If the work is to continue, spraying to eliminatetwitch and re~establishment of a sward is desirable.
Field trial herbage yields are shown in Figure 5~1 with thedata found in Appendix 5. Semi-quantitative results are included forryegrass alone. Trends for Cr content of the sludge are shown inFigure 5-2. In the figures, the average value for each treatment isshown because diagramatic representation of trends is difficult whentwo variables are involved.
Stepwise multilinear regressional analysis for total herbageyield showed a significant decrease with soil Cr concentration (R ~
0.47, P ~ 0.02) and with Cr and sludge concentrations together (R ~
0.55, P ~ 0.01). The regression equation wasYield (t/ha) = 2.25 + (0.0015 ~ 0.0016).Sludge (t/ha) ~
- (2.9 ~ 1.7).Cr (%)
From the equation it is seen that herbage yields increasedslightly with increased Cr~free sludge application. Yields weresignificantly greater for all sludge rates than for the control. Theincrease in goodness of fit when sludge rate is included as a secondvariable is barely significant (p = 0.06); with less than 6% of thetrial variation being explained by sludge application rate, Thiscompared with 22% for Cr alone. These results were obtained in spiteof the possible masking interference from twitch.
Results from pot and field trials were compared by reprocessingthe field yield data using Cr content of the sludge and sludge appli~
cation rate as the variables. Herbage yields showed a highly significant decrease with sludge Cr concentration (R ~ 0.61) with 37% of thetrial variation being explained by Cr in the sludge. Total herbageyield in the field trial decreased at the rate of (41 + 17)% per 1.0%Cr amended into the sludge. This compares with (81 ~ 16)% for cloverand (30 +16)% for ryegrass in the pot trial, indicating reasonableagreement between the trials.

- 67 -
1 I:':":'
~~~~~~ ~2 ::::::~I......
::::::.:.:.: :::=:::::::
C'il t mm ~~~~~J:: ::::::.......... ...... :::::-~i~i~ ~I~
::::::::::.....
'0
~i~~~:::::: Ii
t~::::::
Q)
:11
11
~~~~~:; 1:~:~:
IIQ)
1I11 III!
C'lC'il
·1
~
Q)
~
~~~~~ li~:.:.::::::~~~~~.
0 ......0 200 400 600
40
Q)C'lCtI~
(i)>«
oo 200 400 600
Sludge t/ha
Figure 5-1. Effect of sludge application on field trial herbage yield.
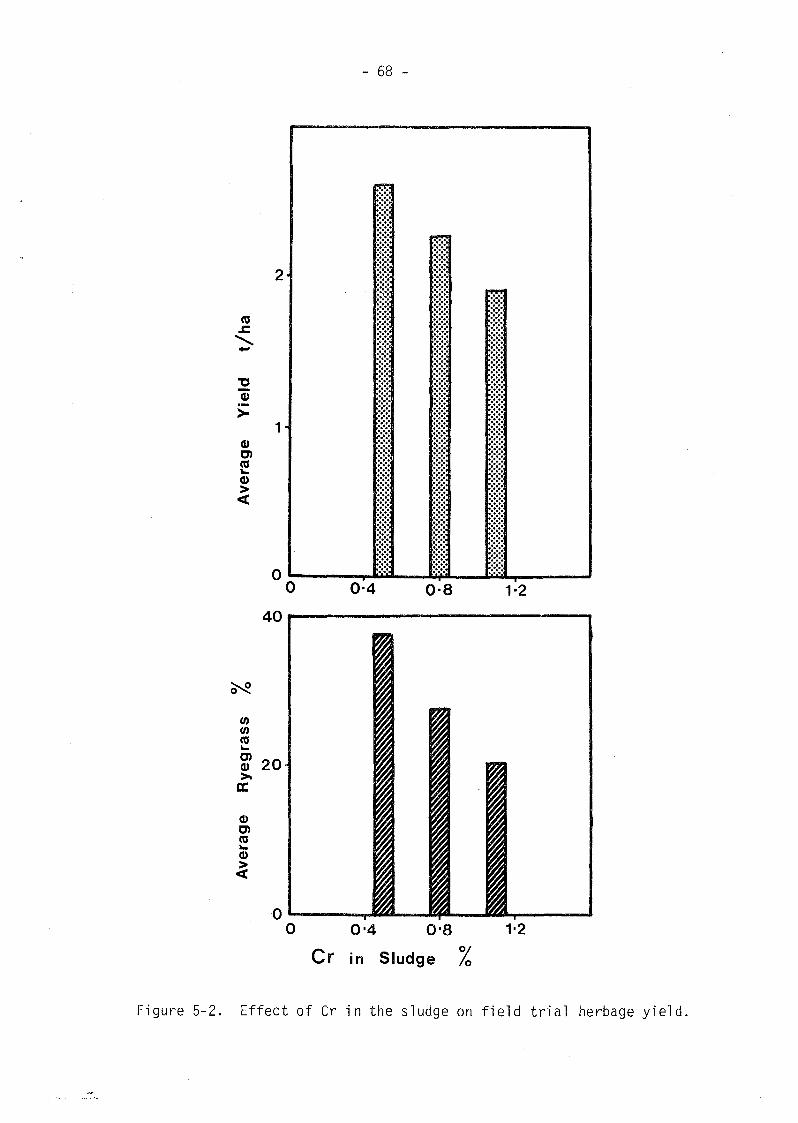
- 68 -
0'4 0'8 1'2
%in Sludge
i;.·.·0~~~~;~~~~~ ~.....,''.0. ............... .....
2 ~j~j~:::::::::::::::. m
II~;~~~: ;tCI:l ::::::
.c :::::: =::::
"::::::::::. :::::- :::::. .:.:.
:::::..t~.... .....
'0 ~~~~......i~~~j
:;:~:(1) .....> ::::: :::::•.... ;t1
..... :::::.....~:::: :::::
(1)..... :::::::::: .....
0) ::::: .~:~:~CI:l
~~~~~::::: ......
~..... .:.:.
(1) ::::: .:::::> .....
::::::..... :::::< ::::: ..... ::::::
"~~~~~ ............::::: ":::::.....
.Ij..........:::::.....
0 :.:.:0 0'4 0·8 1·2
40
N
InInCI:l~
0)20(1)
>-a:
(1)0)CI:l~
(1)
><
00
Cr
Figure 5-2. Effect of Cr in the sludge on field trial herbage yield.

- 69 -
The results shown in Figure 5-2 and Figure 4-1 for the effectof Cr on yield, show a definite trend which can be quantified withreasonable certainty. However, in order to measure these effects,the Cr application rates had to be enormous compared with thosenaturally present in Christchurch sludge. Table 5-1. gives maximumdepression of yield, calculated on the basis of the field trialregression equation, that may be expected from varying applicationrates of typical Cr contaminated sludge.
Caution must be used in interpretation of extrapolated resultsbelow the limit of a trial treatment range. Although not normally
acceptable, in this case toxicity from a non-essential element isconsidered. If a threshold tolerance concentration exists, then theactual effect will be less than that estimated. There is thus reasonable justification for concluding that values given for lower concen-trations are the maximum possible effects. By making an assumptionof linearity, the worst possible case has been allowed for. This isthe only practical solution to the problem which arises when an identical sludge containing no Cr is not available.
TABLE 5-1: MAXIMUM POSSIBLE DEPRESSION OF YIELD FOR PASTURE SPECIES
FROM CHROMIUM, CALCULATED FROM FIELD TRIAL RESULTS USING
CHRISTCHURCH SLUDGE.
Maximum Yield Depression
Sludge Rate %Cr in Sludget/ha 0.05 0.5 2.5
60 (2%) 0.12% 1.2% 6.2%
250 (12%) 0.7% 7% 36%
420 (25%) 1.3% 13% 63%
800 (100%) 4.3% 43% (>100%)?
See text for note on extrapolation beyond trial data levels.

~ 70 ~
Inspection of the magnitude of yield depressions shows why a
relatively small chromium toxicity has been difficult to detect inother trials. Webber (1972) used sludge containing 0.4% and 0,8% Cr
at application rates of 125 t/ha with little response. For pasturespecies, a similar application rate (Table 5~1) gives a maximum yielddepression of less than 5%. For the trial of Mortvedt and Giordano(1975), the maximum effect from the table corresponding to theirapplication rate of about 200 t/ha of 1.36% Cr sludge, would be lessthan 15% depression. In their case, with greater amounts of zincpresent, other effects also became important. In the trial byCunningham et~. (1975b), application rates were 63 t/ha, which wouldhave had equivalent maximum effects (Table 5-1) of less than 6% to 18%.However they showed that chromium was in fact beneficial in theirsituation, since extremely high levels of other metals completelydominated the yield depressions.
The maximum expected depression of pasture yield from 100%Christchurch sludge, containing about 0.5% Cr, is less than 43%. Whenthis sludge is used at say 250 t/ha (the maximum rate recommended fromzinc toxicity considerations), the maximum possible effect of Cr onyield is less than 7%. At 0.5% Cr in sludge at 250 t/ha, the soilconcentration of Cr is about 600 mg/kg, which is near to the figure of500 mg/kg below whic~ no Cr toxicity is to be expected, according tothe field observations by Chumbley (1971).
5.4 FIELD TRIAL CONCLUSIONS
1. Field trial yields showed an increase in herbage yield withsludge applications, supporting the trends evident in the glasshouse trials. A slight increase was still evident at extremelyhigh sludge application rates.
2. Field trial results, using varying rates of sludge and Cr treatments on low fertility soil, showed decreased herbage yield atthe rate of (41 ~ 17)% per 1.0% Cr amended into the sludge.Although caution regarding linear extrapolation below triallevel still applies, it appear that 0.5% Cr in sludge applied

- 71 .,.
at 250 t/ha on Kairaki sand should, at worst, decrease pastureyield by less than 7%. At higher levels of applied Cr, therapidly increasing detrimental effects on yield were ascertained
with much greater rel iabil ity.
3. The field trial is designed to provide continuing informationon long term effects of sludge on pasture yields and composition.Future results will show whether the existing trends are transient or persistent.

- 72 -
ACKNOWLEDGEMENTS
I wish to thank fellow Soil Science Department staff members
for their comments and encouragement. Special thanks are due to
Kay McKenzie (nee Ombler) and Linda Kilday for technical assistance
in analytical and trial work.
The financial assistance provided by the Christchurch Drainage
Board is gratefully acknowledged. The enthusiastic co-operation of
Drainage Board staff, particularly from the treatment works and
farm was much appreciated.
My thanks are due to Mrs Bond for typing the script. I also
wish to acknowledge the part of the New Zealand Lottery Distribution
Committee in supplying funds to purchase X-ray equipment.

- 73 ~
REFERENCES
ALLAWAY, W.H. 1968. Agronomic controls over the environmentalcycling of trace elements. Advances in Agronomy 20:235-274.
ANDERSON, A.J.; MEYER, D.R. and MAYER, F.K. 1973. Heavy metaltoxicities in oat crops. Australian Journal of Agricul~
tural Research 24: 557~571.
BAKER, D.E. and CHESNIN, L. 1975. Chemical monitoring of soils.Advances in Agronomy 27: 305-374.
BARTLETT, R.J. and KIMBLE, J.M. 1976a. Behaviour of chromium insoils: I Trivalent forms. Journal of EnvironmentalQuality 5: 379-383.
BARTLETT, R.J. and KIMBLE, J.M. 1976b.soils: II Hexavalent forms.Quality 5: 383-386.
Behavi our of chrond um inJournal of Environmental
BARTLETT, R.J. and JAMES, B. 1979. Behaviour of chromium in soils:III Oxidation. Journal of Environmental Quality 8: 31-35.
BERROW, M.L. and WEBBER, J. 1972. Trace elements in sewage sludges.Journal Science Food and Agriculture 23: 93-100.
BIRRELL, K.S. and ~JRIGHT, A.C.S. 1945. Serpentine soil in NewCaledonia. N.Z. Journal of Science and Technology 27:72-76.
BLOOM, H. 1979. Mercury, cadmium and other toxic trace elements inthe marine environment and their transfer into food.Proceedings of the second New Zealand Seminar on TraceElements and Health, pI84-191, University of Auckland, 242p.
BLOOMFIELD, C. and PRUDEN, G. 1975.anaerobic incubation on thein digested sewage sludge.217-232.
The effects of aerobic andextractability of heavy metals
Environmental Pollution 8:
BOWEN, H.J.M. 1966. "Trace elements in biochemistry".Press, New York.
Academic
BREEZE, V.G. 1973. Land reclamation and river pollution problemsin the Croal Valley caused by waste from chromate manufacture.Journal of Applied Ecology 10: 513-525.
BREMNER, I. 1977, Measurement and toxicity of metallic and organicspecies. Proceedings Analytical Division Chemical Society,August, 1977. p218-219.

- 74 ..
BROOKS, R.R. 1979. The effect of lead pollution upon New Zealandagriculture. Proceedings of the second New ZealandSeminar on Trace Elements on Health, p82-89, University ofAuckland, 242p.
CARY~ E.E.; ALLAWAY~ W.H. and OLSON, O.E. 1977a. Control ofchromium concentrations in food plants: I Absorption andtranslocation of chromium by plants. Journal AgriculturalFood Chemistry. 25: 300-304.
CARY, E.E.; ALLAWAY, W.H. and OLSON, O.E. 1977b. Control ofchromium in soils and its availability to plants. JournalAgricultural Food Chemistry. 25: 305-309.
CHANEY, R.L. 1973. Crop and food chain effects of toxic elementsin sludges and effluents. In Proceedings of the SoilConferences on Recycling Municipal Sludges and Effluentson Land. E.P.A. and U.D.A. University Workshops, Campaign~
Illinois, pI29-141. Library Congress No 73-88570.
CHUMBLEY~ C.G. 1971. Permissible levels of toxic metals insewage used on agricultural land. A.D.A.S. Advisory PaperNo 10.
COKER, E.G. 1966a. The value of liquid digested sewage sludge:I Effect on growth and composition of grass-clover swards.Journal Agricultural Science~ Cambridge, 67: 91-97.
COKER, E.G. 1966b. The value of liquid digested sewage sludge:II Experiments on ryegrass in South East England comparingsludge with fertilizers supplying equivalent, N~ P, K andwater. Journal Agricultural Science Cambridge, 67: 99-103.
CORNING, D.R. 1975. Chromium in tannery effluents.B.L.M.R.A. 18: 301-306.
Journal of
CUNNINGHAM, J.D.; KEENEY, D.R. and RYAN, J.A. 1975a. Yield andmetal composition of corn and rye grown on sewage sludgeamended soil. Journal Environmental Quality 4: 448-454.
CUNNINGHAM, J.D.; RYAN, J.A. and KEENEY, D.R. 1975b. Phytotoxicityin the metal uptake from soil treated with metal-amendedsewage sludge. Journal Environmental Quality 4: 455-460.
CUNNINGHAM, J.D.; KEENEY, D.R. and RYAN~ J.A. 1975c. Phytotoxicityand uptake of metals added to soils as inorganic salts orin sewage sludge. Journal of Environmental Quality 4:460-462.
de HAAN~ F.A.M. and ZWERMAN, P.J. 1976. Pollution of soil, INIISoil Chemistry, (A) Basic Elements ll (Bolt and Bruggenwert,ed.), I.S.B.N. 0-444-41435-5.
de HAAN, S. 1975. Land application of municipal waste watersludges. Journal Water Pollution Control Federation 47:2707-2710.

'" 75 '"
DIJKSHOORN~ W.; LAMPE, J.E.M. and KOWSOLEEA, A.R. 1975. Uptakeof cadmium and zinc by ryegrass at high solution culturelevels. Netherlands Journal Agricultural Science 23:285-290.
DIJKSHOORN, W.; van BROEKHOVEN, L.W. and LAMPE, J.E.M. 1979.Phototoxicity of zinc, nickel, cadmium, lead, copper andchromium on three pasture species supplied with graduatedamounts from soil. Netherlands Journal AgriculturalScience 27: 241-253.
DOWDY, R.H. and LARSON, W.E. 1975a. Metal uptake by barleyseedlings grown on soils amended with sewage sludge.Journal Environmental Quality 4: 229-233.
DOWDY, R.H. and LARSON, W.E. 1975b. The availability of sludgeborne metals to various vegetable crops. JournalEnvironmental Quality 4: 278-282.
GEMMELL, R.P. 1973. Reveaetation of derelict land polluted by achromate smelter. - Environmental Pollution 5: 181-197.
HAMENCE, J.H. and TAYLOR, G. 1948. Experiments on the toxicityof a chrome-bearing fertilizer. The Fertilizer andFeeding Stuffs Journal 1948, 449-453.
HARA, T. and SONODA, Y. 1979. Comparison of the toxicity of heavymetals to cabbage growth. Plant and Soil 51: 127-133.
HELLING, C.S.; CHESTERS, G. and COREY, R.B. 1964. Contributionof organic matter and clay to soil cation exchange capacityas affected by pH of the saturating solution. Soil ScienceSociety of America Proceedings 28: 517-520.
HUFFMAN, E.W.D. and ALLAWAY, W.H. 1973a. Growth of plants insolution culture containing low levels of chromium. PlantPhysiology 52: 72-75.
HUFFMAN, E.W.D. and ALLAWAY, W.H. 1973b. Chromium in plants:distribution in tissues, organelles and extracts andavailability of bean leaf Cr to animals. JournalAgricultural Food Chemistry 21: 982-986.
HUNTER, J.G. and VERGNANO, O. 1953. Trace element toxicities inoat plants. Annals of Applied Biology 40: 761-777.
JONES, J.B. 1972. Plant tissue analysis for micronutrients, In"Mi cronutri ents in Agri culture II, ed. t,10rtvedt et ~.
Library Congress No 72-75328 p319-346.
KEENEY, D.R.; LEE, K.W. and WALSH, L.M. 1975. Guidelines forthe application of wastewater sludge to agricultural landin Wisconsin. Technical Bulletin No 88, Department ofNatural Resources, Madison, Wisconsin.

- 76 -
KELLING, K.A.; PETERSON, A.E.; WALSH, LJ1.; RYP,N, J.A. andKEENEY, D.R. 1977a. A field study of the agriculturaluse of sewage sludge: I Effect on crop yield and uptakeof Nand P. Journal of Environmental Quality 6: 339-345.
KELLING, K.A.; WALSH, L.M.; KEENEr, D.R.; RYAN, J.A. andPETERSON, A.E. 1977b. A field study of the agriculturaluse of sewage sludge: II Effect on soil Nand P. Journalof Environmental Quality 6: 345-352.
KELLING, K.A.; KEENEY, D.R.; WALSH, L.M. and RYAN, J.A. 1977c.A field study of the agricultural use of sewage sludge:III Effect on uptake and extractability of sludge-bornemetals. Journal of Environmental Quality 6: 352-358.
LEEPER, G.W. 1978. IIf1anaging the heavy metals on the land ll•
Marcel Dekker Inc., I.S.B.N. 0-8247-6661-X. 121p.
LISK, D.J. 1972. Trace metals in soils, plants and animals.Advances in Agronomy 24: 267-325.
LYON, G.L.; BROOKS, R.R.; PETERSON, P.J. and BUTLER, G.W. 1968.Trace elements in New Zealand serpentine flora. Plantand Soil 29: 225-240.
M.A.F., 1978. N.Z. Ministry of Agriculture and FisheriesAgricultural Science and Technology Information Services.IISoils and fertilizers, plant analyses, methods andinterpretation ll
• AST9/Tech Bk 2/6.
MASON, I. 1976. Toxicity of chromium used in tanning. ALiterature Review. N.Z. Leather and Shoe ResearchAssociation. 12p.
McNAUGHT, K.J. 1970. IIDiagnosis of mineral deficiencies in grass-legume pasture by plant analysis ll
, from Proceedings XIInternational Grassland Congress. p335-338.
MERTZ, W. 1969.sys tems .
Chromium occurrence and function in biologicalPhysiological Reviews 49: 163-239.
MORTVEDT, J.J. and GIORDANO, P.M. 1975. Response of corn to zincand chromium in municipal wastes applied to soil. Journalof Environmental Quality 4: 170-174.
N.Z. LEATHER and SHOE RESEARCH ASSOCIATION, 1976.Report No 39.
Progress
N.Z. SOIL BUREAU, 1967.and North Otago.
Soil s of the downs and plants., CanterburyN.Z. Soil Bureau Bulletin No 14.
N.Z. SOIL BUREAU, 1972. Laboratory methods.Scientific Report No 10.
N.Z. Soil Bureau
N.Z. SOIL BUREAU, 1974. Soils of the Christchurch region. N.Z.Soil Bureau Report No 16.

- 77 -
PAGE~ A.L. 1974, Fate and effects of trace elements in SewageSludge when applied to agricultural lands. A LiteratureReview Study. Environmental Protestion Agency SeriesE.P.A. 670/2-74-005.
PATTERSON, J.B.E. 1971. Metal toxicities arising from industry.Great Britain, Ministry of Agriculture, Fisheries and FoodTechnical Bulletin No 21: 193-207.
PETTERSSON, O. 1976. Heavy metal ion uptake by plants fromnutrient solution with metal ion, plant species, and growthperiod variations. Plant and Soil 45: 445-460.
PRATT~ P.F. 1966. Chromium. In IIDiagnostic Criteria for Plantsand Soils ll (H.D. Chapman, ed.), University of California,Berkley.
PURVES, D. 1972. Consequences of trace element contamination ofsoils. Environmental Pollution 3: 17-24.
QUIN, B.F. and SYERS, J.K. 1978. Surface irrigation of pasturewith treated sewage effluent. N.Z. Journal AgriculturalResearch 31: 435-442.
ROBINSON, W.O.; EDGINGTON, G. and BYERS, H.G. 1935. Chemicalstudies of infertile soils. Technical Bulletin, U.S.Department of Agriculture No 471: 1-28.
ROGERS, R.D. 1976. ~1ethylation of mercury in agricultural soils.Journal of Environmental Quality 5: 454-458.
SCHAUER, P.S.; WRIGHT, W.R. and PELCHAT, J. 1980. Sludge borneheavy metal availability and uptake by vegetable cropsunder field conditions. Journal Environmental Quality9: 69-73.
SCOTT, M.L. 1972. Trace elements in animal nutrition. InI'Micronutrients in Agricul ture 'l Soil Science Society ofAmerica Inc., Library Congress No 72-75328.
SHEWRY, P.R. and PETERSON, P.J. 1974. The uptake and transportof chromium by barley seedlings. Journal of ExperimentalBotany 25: 785-797.
SMITH, B.L. 1977. Toxicity of zinc in relation to faecial eczema.New Zealand Veterinary Journal 25: 310-312.
SMITH, B.L. 1979. Aspects of zinc toxicitity in grazing ruminants.Proceedings of the Second New Zealand Seminar on TraceElements and Health, p82-89, University of Auckland, 242p.
SMITH, G.S. and MIDDLETON, K.R. 1978. Sodium and potassium contentof topdressed pastures in New Zealand in relation to plantand animal nutrition. N.Z. Journal of ExperimentalAgriculture 6: 217-225.
- 78 -
SOANE, B.D. and SAUNDER, D.H. 1959. Nickel and chromium toxicityof serpentine soils in Southern Rhodesia. Soil Science88~ 322~330.
SPOTSWOOD, A. and RAYMER, M. 1973. Some aspects of sludge disposalon agricultural land. Journal Institute Water PollutionControl 72: 71~77.
STEVENSON, F.J. and ARDAKANI, M.S. 1972. Organic matter reactionsinvolving micronutrients in soils. In "Micronutrients inAgriculture", Soil Science Society of America Inc., LibraryCongress No 72-75328.
SYKES, R.L. 1972. Disposal of wastes containing chromium.of B.L.M.R.A. 15: 254-257.
Journal
SYKES, R.L. 1973. A review concerning the reputed toxicity ofchromium III. Journal of B.L.M.R.A. 16: 61-65.
SYKES, R.L. 1974. Effects of chromium on plant growth.of B.L.M.R.A. 17: 31-33.
Journal
SYKES, R.L. 1975. In reviewing IlChromium ll Published; Committee onbiological effects of atmospheric pollutants, 1974.National Academy of Sciences, t~ash·ington. In B.L.M.R.A.Journal 18: 250-251.
TARBOX, M.J. and OUTRAM, D.R. 1975. Micronutrients, trace elementsof toxic metals in soils and sludges. Journal of PublicHealth Engineer 16: 105-114.
TURNER, M.A. and RUST, R.H. 1971. Effects of chromium on growthand mineral nutrition of soybeans. Soil Science Societyof America Proceedings 35: 755-758.
U.S. ENVIRONMENTAL PROTECTION AGENCY. 1974.for sl udge treatment and di sposa111
•
IlProcess design manualE.P.A. 625/1-74-006.
UNDERWOOD, E.J. 1971. IlTrace elements in human and animal nutrition l'.
Academic Press, 543p.
UNDERWOOD, E.J. 1979. Trace elements and health - technologicaland epidemiological aspects. Proceedings of the secondNew Zealand Seminar on Trace Elements and Health, pl07-122,University of Auckland, 242p.
VLAMIS, J. and WILLIAMS, D.E. 1961. Test of sewage sludge forfertility and toxicity in soils. Compost Science 1961:26-30.
WARD, N.I.; BROOKS, R.R. and ROBERTS, E. 1978. Lead levels insheep organs resulting from pollution from automotiveexhuasts. Environmental Pollution 12: 7-12.
WEBBER, J. 1972. Effects of toxic metals in sewage on crops.Journal Institute Water Pollution Control 71: 404-413.

- 79 -
WELLS, N. and WHITTON, J.S. 1970. The influence of meatworkseffluents on soil and plant composition. N.l. Journalof Agricultural Research 13: 494~502.
WELLS, N. and WHITTON, J.S. 1976. Influence of dried digestedsewage sludge on yield and element composition of lucerne.N.l. Journal Agricultural Research 19: 331-341.
WHITTON, J.S. and WELLS, N. 1978. Analysis of 27 elements inplants grown in a pot trial on soils mixed with Aucklandsewage sludge. N.l. Soil Bureau Scientific Report 33.
WILLIAMS, D.E.; VLAMIS, J.; PUKITE, A.H. and COREY, J.E. 1980.Trace element accumulation, movement and distribution inthe soil profile from massive applications of sewagesludge. Netherlands Journal Agricultural Science 28;
WILLIAMS, J.H. 1975. Use of sewage sludge on agricultural landand the effects of metals on crops. Journal InstituteWater Pollution Control 74: 635-644.
WOLLAN, E. and BECKETT, P.H.T. 1979. Changes in the extractabilityof heavy metals on the interaction of sewage sludge withsoil. Environmental Pollution 13: 215~230.
"" 80
LIST OF APPENDICES
APPENDIX PAGE
l. Soil survey data. 81
2. Field trial site pl an • 86
3. Sludge pot trial data. 87
4. Data for pot trial using Cr-amended sludge. 89
5. Field trial data. 91

- 81 -
0;
CORE 1: PADDOCK 26, KAIRAKI SAND, UNDISTURBED TOESLOPE, UNSLUDGED
Depth % Ig pH Ni Cu Zn Cr Pb Zr S P CECem Loss -- mg/kg me/kg
0-10 17.7 5.5 13 35 160 19 55 114 1040 890 96
10-20 7.1 4.9 12 35 151 25 87 136 680 1050 5120-30 4.0 5.1 14 36 132 20 66 143 420 980 39
30-40 2.4 5.2 13 23 101 21 42 139 210 620 2640-50 1.3 5.4 12 38 83 17 19 122 150 540 15
50-60 1.6 5.7 12 31 86 23 27 129 160 490 14
60-70 1.7 5.8 12 35 80 26 18 119 200 430 14
70-80 1.3 6.4 14 34 85 21 11 118 200 430 13
80-90 1.2 6.9 13 34 70 23 19 118 140 350 11
CORE 2: PADDOCK 26, KAIRAKI SAND, UNDISTURBED, MIDSLOPE, UNSLUDGED
Depth % Ig pH Ni Cu Zn Cr Pb Zr S Pem Loss ----- mg/kg
0-10 15.0 5.3 13 35 76 21 33 134 1080 720
10-20 6.0 4.6 10 26 68 12 15 142 410 490
20-30 3.5 4.5 12 21 59 12 9 154 330 460
30-40 4.1 4.6 8 22 58 18 32 154 270 430
40-50 2.1 4.8 9 24 64 18 9 149 140 310
50-60 1.6 5.4 15 41 72 24 9 122 90 280
60-70 3.2 5.3 20 33 66 13 17 123 90 320
70-80 1.1 5.0 15 50 66 16 37 118 150 310
80-90 1.4 4.6 16 22 70 16 29 154 220 290

- 82 -
CORE 3: PADDOCK 26, KAIRAKI SAND, UNDISTURBED TOPSLOPE, UNSLUDGED
Depth % Ig pH Ni Cu Zn Cr Pb Zr S Pem Loss mgjkg -
0-10 15.0 6.1 14 22 75 27 44 135 920 580
10-20 5.4 5.8 16 19 75 23 42 143 370 480
20-30 4.1 5.6 14 30 60 19 19 130 180 400
30-40 1.9 6.0 10 27 70 26 20 124 100 370
40-50 1.5 5.9 15 34 73 21 30 126 100 370
50-60 1.5 6.3 16 33 72 14 39 135 90 340
60-70 1.3 6.4 11 39 66 14 22 120 70 270
70-80 1.2 6.0 14 33 64 16 22 126 50 290
80-90 1.3 5.9 12 23 70 22 30 134 60 250
CORE 4: PADDOCK 4, DUNE MATERIAL, SLIGHT HOLLOW, HEAVY DUMPINGS OF
DRIED SLUDGE LEVELLED OVER
Depth % Ig pH Ni Cu Zn Cr Pb Zr S P CECem Loss mg/kg - me/kg
0-10 20.7 6.0 44 170 620 610 165 122 1500 2800 78
10-20 10.0 6.0 54 193 730 710 188 137 2200 4400 55
20-30 17.3 5.9 83 350 980 240 310 118 2400 4500 126
30-40 31.8 5.8 124 560 1100 550 440 107 6700 5800 160
40-50 26.0 6.0 96 310 900 240 220 126 5000 3800 105
50-60 6.3 6.4 30 102 330 54 66 154· 1200 1100 31
60-70 16.6 6.7 65 260 850 189 230 119 3400 3100 85
70-80 17.7 6.5 43 169 640 165 155 113 3500 2700 74
80-90 7.5 6.9 17 38 88 24 25 127 1600 570 44
90-100 1.5 7.0 12 35 61 27 12 130 250 340 14
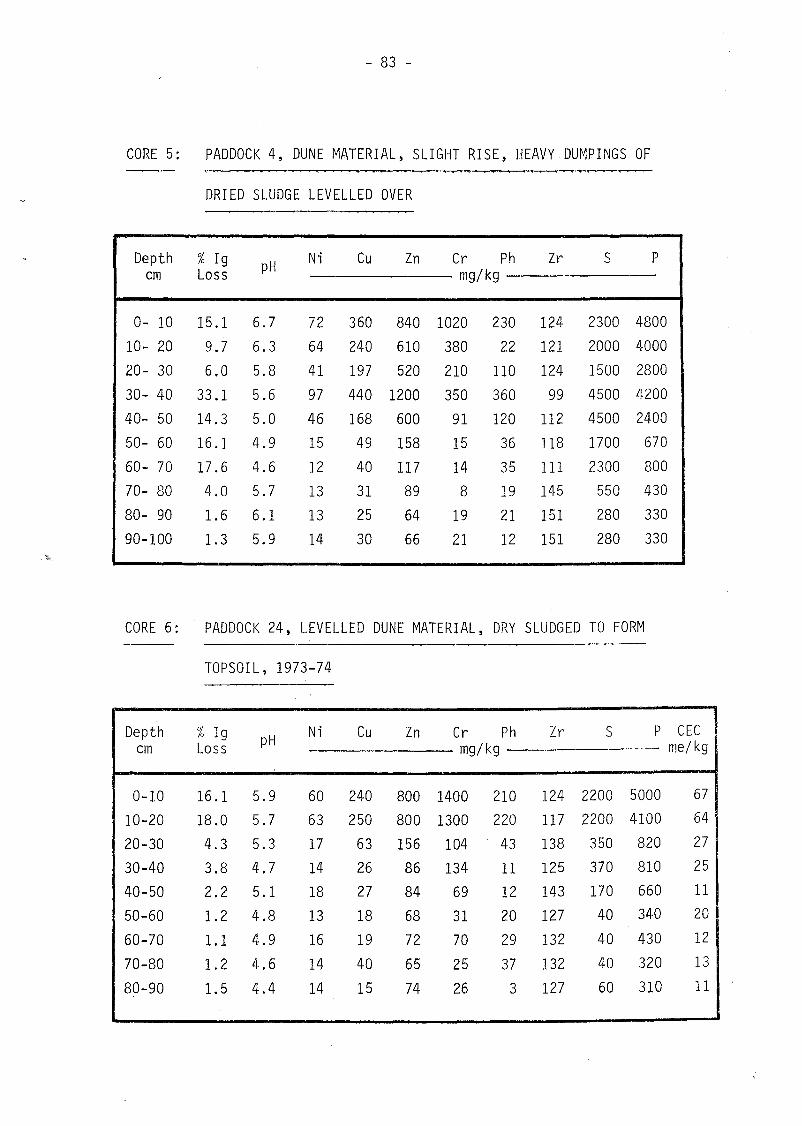
- 83 -
CORE 5: PADDOCK 4, DUNE MATERIAL, SLIGHT RISE, HEAVY DUMPINGS OF
DRIED SLUDGE LEVELLED OVER
Depth % Ig pH Ni Cu Zn Cr Ph Zr S Pem Loss mg/kg
0- 10 15.1 6.7 72 360 840 1020 230 124- 2300 4800
10- 20 9.7 6.3 64 240 610 380 22 121 2000 4000
20- 30 6.0 5.8 41 197 520 210 110 124 1500 2800
30- 40 33.1 5.6 97 440 1200 350 360 99 4500 4200
40- 50 14.3 5.0 46 168 600 91 120 112 4500 2400
50- 60 16.1 4.9 15 49 158 15 36 118 1700 670
60- 70 17.6 4.6 12 40 117 14 35 111 2300 800
70- 80 4.0 5.7 13 31 89 8 19 145 550 430
80- 90 1.6 6.1 13 25 64 19 21 151 280 330
90-100 1.3 5.9 14 30 66 21 12 151 280 330
CORE 6: PADDOCK 24, LEVELLED DUNE MATERIAL, DRY SLUDGED TO FORM
TOPSOIL, 1973-74
Depth % Ig pH Ni Cu Zn Cr Ph Zr S P CECem Loss mg/kg me/kg
0-10 16.1 5.9 60 240 800 1400 210 124 2200 5000 67
10-20 18.0 5.7 63 250 800 1300 220 117 2200 4100 64
20-30 4.3 5.3 17 63 156 104 43 138 350 820 27
30-40 3.8 4.7 14 26 86 134 11 125 370 810 25
40-50 2.2 5.1 18 27 84 69 12 143 170 660 11
50-60 1.2 4.8 13 18 68 31 20 127 40 340 20
60-70 1.1 4.9 16 19 72 70 29 132 40 430 12
70-80 1.2 4.6 14 40 65 25 37 132 40 320 13
80-90 1.5 4.4 14 15 74 26 3 127 60 310 11
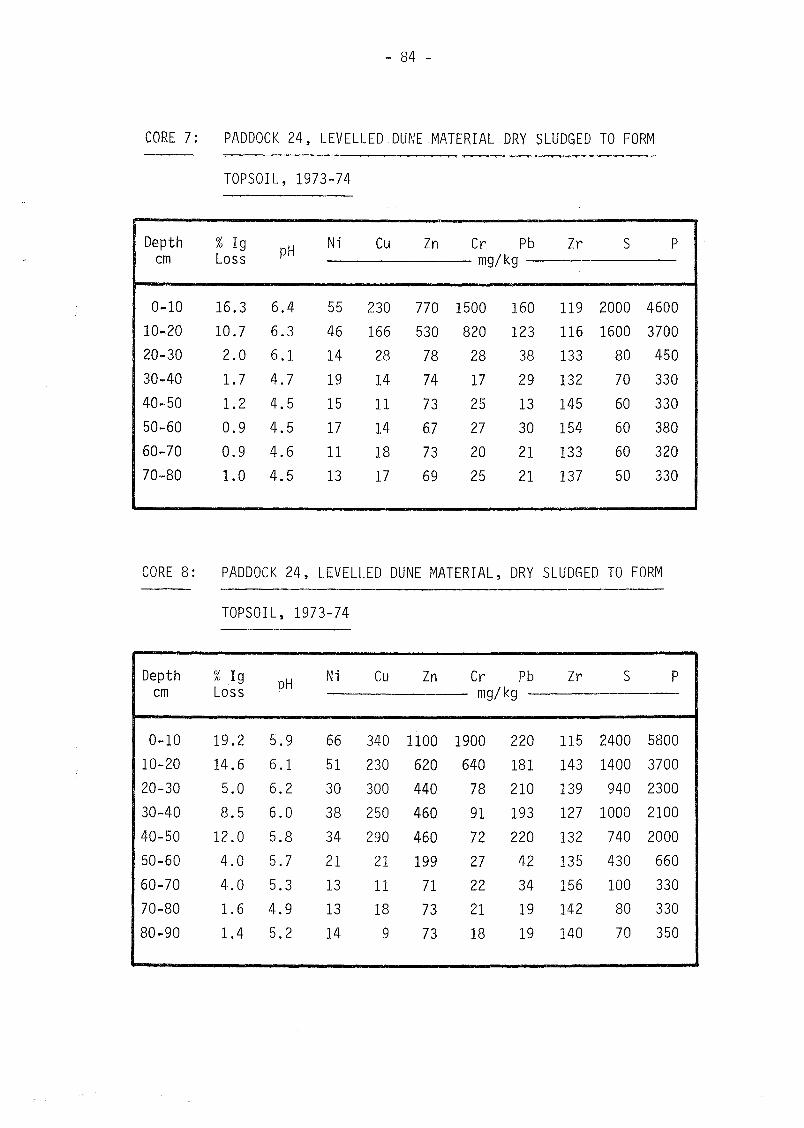
- 84 -
CORE 7: PADDOCK 24, LEVELLED DUNE MATERIAL DRY SLUDGED TO FORM
TOPSOIL, 1973-74
Depth % Ig pH Ni Cu Zn Cr Pb Zr S Pem Loss mg/kg
0-10 16.3 6.4 55 230 770 1500 160 119 2000 4600
10-20 10.7 6.3 46 166 530 820 123 116 1600 370020-30 2.0 6.1 14 28 78 28 38 133 80 450
30-40 1.7 4.7 19 14 74 17 29 132 70 330
40-50 1.2 4.5 15 11 73 25 13 145 60 330
50-60 0.9 4.5 17 14 67 27 30 154 60 380
60-70 0.9 4.6 11 18 73 20 21 133 60 320
70-80 1.0 4.5 13 17 69 25 21 137 50 330
CORE 8: PADDOCK 24, LEVELLED DUNE MATERIAL, DRY SLUDGED TO FORM
TOPSOIL, 1973-74
Depth %19 pH Ni Cu Zn Cr Pb Zr S Pem Loss mg/kg
0-10 19.2 5.9 66 340 1100 1900 220 115 2400 5800
10-20 14.6 6.1 51 230 620 640 181 143 1400 3700
20-30 5.0 6.2 30 300 440 78 210 139 940 2300
30-40 8.5 6.0 38 250 460 91 193 127 1000 2100
40-50 12.0 5.8 34 290 460 72 220 132 740 2000
50-60 4.0 5.7 21 21 199 27 42 135 430 660
60-70 4.0 5.3 13 11 71 22 34 156 100 330
70-80 1.6 4.9 13 18 73 21 19 142 80 330
80-90 1.4 5.2 14 9 73 18 19 140 70 350

- 85 -
CORE 9: PADDOCK 20, LEVELLED DUNE MATERIAL, DRESSED WITH DRY
SLUDGE, PRE 1970
Depth % Ig pH Ni Cu Zn Cr Pb Zr S Pem Loss mg/kg
0- 10 14.5 6.4 60 220 590 230 310 137 1700 2600
10- 20 6.5 6.2 24 40 220 150 72 176 440 890
20- 30 1.2 5.9 16 a 124 41 19 220 50 430
30- 40 1.5 6.0 15 2 117 36 19 220 40 390
40- 50 1.2 5.5 15 4 111 41 34 220 100 400
50- 60 1.7 5.3 14 0 78 27 11 210 80 370
60- 70 1.6 5.6 13 2 81 29 20 165 60 340
70- 80 2.0 5.7 13 3 76 32 20 168 100 400
80- 90 1.6 5.4 12 14 73 26 20 171 60 310
90-100 1.3 5.5 13 0 68 25 45 155 40 340
CORE 10: PADDOCK 20, LEVELLED DUNE MATERIAL DRESSED WITH DRY
SLUDGE, PRE 1970
Depth % Ig pH Ni Cu Zn Cr Pb Zr S P CEeem Loss mg/kg me/kg
0- 10 19.1 5.4 65 300 500 270 280 127 1700 2900 136
10- 20 8.9 5.1 37 113 310 115 108 146 1000 1900 61
20- 30 1.7 5.6 17 10 141 30 19 159 70 430 13
30- 40 1.4 5.6 13 3 122 23 11 177 30 400 13
40- 50 1.4 5.6 15 11 124 23 11 164 30 350
50- 60 1.5 5.5 15 4 125 26 27 153 70 330 12
60- 70 1.4 5.4 13 7 114 19 21 148 40 340 13
70- 80 1.5 5.1 16 12 113 29 29 145 60 380 10
80- 90 1.6 5.2 19 9 123 27 12 165 80 410 14
90-100 1.7 5.1 17 3 123 22 21 145 90 370 12

- 86 -
Appendix 2 Field Trial Site Plan
51 udge (t/ha)
Cr in sludge (%)
Sludge
4
1
2
3
4
2
4
3
1
2
1
3
2
4
3
1
b a c
a c b
b c a
a b c
c b a
c a b
b c a
b a c
a b c
c a b
b c a
b a c
a b c
a c b
c b a
b c a
1
2
3
4
a
b
c
15
200
390
590
0.5
0.8
1.1
Road
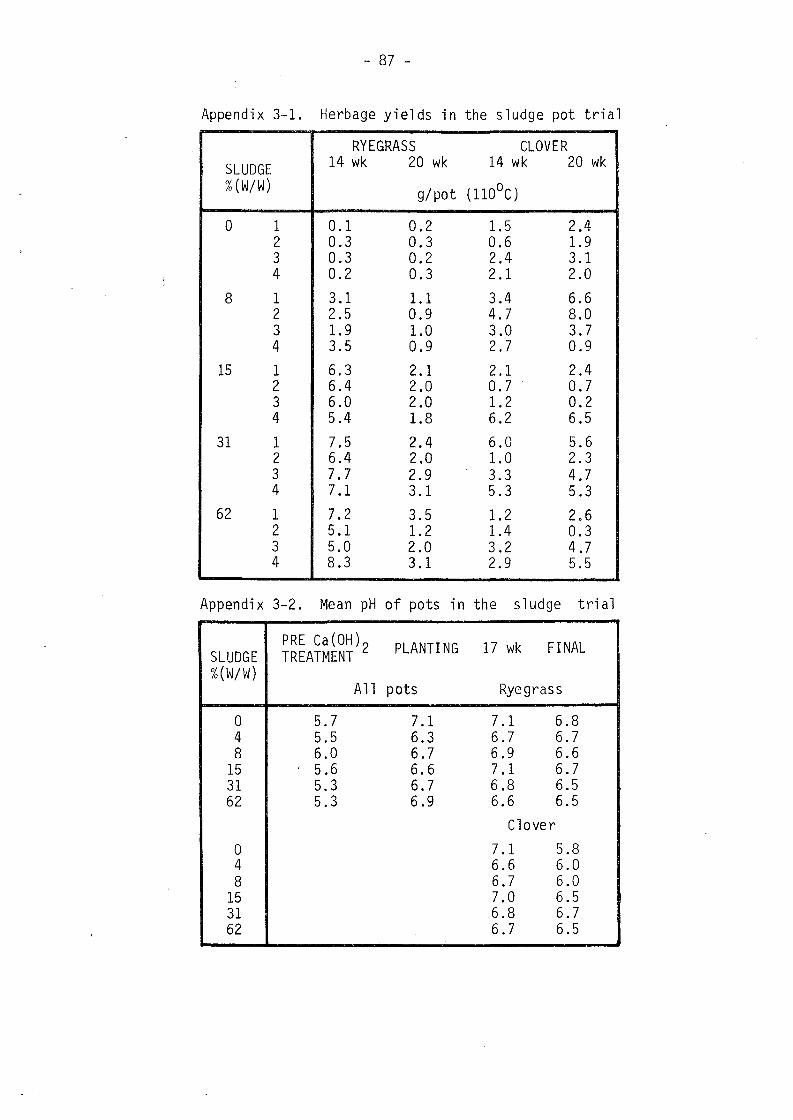
- 87 -
Appendix 3-1. Herbage yields in the sludge pot trial
RYEGRASS CLOVERSLUDGE 14 wk 20 wk 14 wk 20 wk%(W/W) g/pot (llOoC)
a 1 0.1 0.2 1.5 2.42 0.3 0.3 0.6 1.93 0.3 0.2 2.4 3.14 0.2 0.3 2.1 2.0
8 1 3.1 1.1 3.4 6.62 2.5 0.9 4.7 8.03 1.9 1.0 3.0 3.74 3.5 0.9 2.7 0.9
15 1 6.3 2.1 2.1 2.42 6.4 2.0 0.7 0.73 6.0 2.0 1.2 0.24 5.4 1.8 6.2 6.5
31 1 7.5 2.4 6.0 5.62 6.4 2.0 1.0 2.33 7.7 2.9 3.3 4.74 7.1 3.1 5.3 5.3
62 1 7.2 3.5 1.2 2.62 5.1 1.2 1.4 0.33 5.0 2.0 3.2 4.74 8.3 3.1 2.9 5.5
Appendix 3-2. Mean pH of pots in the sludge trial
SLUDGEPRE Ca(OH)2 PLANTING 17 wk FINALTREATMENT
%(~~/W)
All pots Ryegrass
a 5.7 7.1 7.1 6.84 5.5 6.3 6.7 6.78 6.0 6.7 6.9 6.6
15 , 5.6 6.6 7.1 6.731 5.3 6.7 6.8 6.562 5.3 6.9 6.6 6.5
Clover
a 7.1 5.84 6.6 6.08 6.7 6.0
15 7.0 6.531 6.8 6.762 6.7 6.5

- 88 -
Appendix 3-3. Herbage concentrations of Na, K, Mg, Ca, Zn, Mn,Cu, Fe and Cr in the sludge pot trial
SLUDGE Na K Mg Ca%(WjW)
Ryegrass %(llOoC)
0 0.29 1.6 0.36 1.14 * 0.22 2.0 0.39 1.38 0.34 1.4 0.37 1.6
15 0.54 1.2 0.44 1.731 0.62 1.0 0.43 1.562 0.57 1.1 0.39 1.6
Clover0 0.35 1.0 0.35 2.34 * 0.38 0.8 0.31 2.48 0.44 0.9 0.33 2.8
15 0.41 1.1 0.29 2.831 0.40 1.0 0.26 2.862 0.59 1.4 0.28 2.6
Zn Mn Cu Fe Cr
Ryegrass mg/kg(110oC)
0 - - - - -4 * 32 97 7 60 48 52 92 2 170 6
15 130 62 ' 14 150 431 130 104 12 170 1262 110 133 8 160 12
Clover
0 38 99 12 300 104 * 120 66 15 210 128 110 68 16 210 10
15 94 74 17 170 831 110 68 17 290 1262 110 71 17 360 13
Values are the means of duplicate determinationsof four replicates bulked.
* Values from the control of the Cr-amendedsludge trial.

- 89 -
Appendix 4-1. Herbage yields for Cr-amended sludge pot trials
Cr RYEGRASS CLOVER% 14 wk 20 wk 14 wk 20 wk
0.48 1 1.7 0.5 4.2 7.72 2.5 0.5 4.2 6.43 2.1 0.4 2.7 4.24 3.0 0.7 5.4 5.45 1.7 0.5 2.1 5.86 1.6 0.9 5.0 6.27 1.8 0.7 2.8 5.38 1.9 0.6 6.1 6.8
0.81 1 1.8 0.7 1.0 3.52 1.5 0.5 2.7 5.93 1.6 0.8 1.8 5.54 1.8 0.5 2.6 4.95 1.9 0.8 3.4 4.66 1.6 0.7 2.4 3.47 2.0 0.8 3.3 5.98 1.3 0.6 3.3 5.3
1.45 1 1.5 0.6 0.1 0.62 1.2 0.5 0.5 3.23 0.7 0.4 0.1 1.54 1.7 0.7 0.1 0.15 0.9 0.6 0.1 0.36 1.7 0.7 1.1 2.67 1.3 0.7 0.7 1.08 1.4 0.6 0.4 1.2
2.71 1 0.0 0.0 0.0 0.02 0.0 0.0 0.0 0.03 0.0 0.0 0.0 0.04 0.0 0.1 0.0 0.05 0.8 0.4 0.1 0.26 1.0 0.2 0.0 0.07 0.5 0.4 0.0 0.28 0.9 0.4 0.1 0.1
Appendix 4-2. Mean pH of pots in Cr-amended sludge trial
Cr ALL POTS PLANTI NG RYEGRASS CLOVER% MIXING 14 wk Final 14 wk Final
0.48 6.3 6.7 6.7 6.6 6.00.81 Ca(OH)2 7.1 6.9 6.8 6.9 6.01. 45 treated 6.8 7.1 7.1 6.9 6.32.71 6.4 6.3 7.0 6.7 7.1
0.48 5.5 6.7 6.5 6.5 5.60.81 5.3 not 6.8 6.6 7.0 5.71.45 4.4 treated 6.5 6.4 6.9 5.12.71 3.5 5.1 5.3 5.0 5.4

"
- 90 -
Appendix 4-3. Herbage concentrations of Na, K, Mg, Ca, Zn, Mn,Cu, Fe and Cr in the Cr-amended sludge trial
Cr % Na K Mg Ca
Ryegrass %(llOoC)
0.48 0.26 1.3 0.40 1.30.81 0.16 1.3 0.24 1.31.45 0.13 1.6 0.19 1.52.71 0.25* 2.0* 0.33* 3.7*
0.48 0.22 2.0 0.39 1.20.81 0.21 1.7 0.36 1.81.45 0.16 1.4 0.23 2.12.71 0.13 1.5 0.20 3.2
Clover0.48 0.40 0.9 0.32 2.40.81 0.39 1.2 0.32 2.61.45 0.39 1.8 0.31 2.52.71 - - - -0.48 0.38 0.8 0.31 2.40.81 0.39 1.0 0.30 2.71.45 0.27 1.6 0.29 3.12.71 0.39* 1.1* 0.42* 5.2*
Zn Mn Cu Fe Cr
Ryegrass mg/kg(l10oC)
0.48 107 310 10 370 30.81 68 350 6 (25) 111.45 79* 460* 6* 140* 11*2.71 - - - - -0.48 32 97 7 (55) 40.81 28 200 7 190 161. 45 37 270 7 150 222.71 62* 460* 7* 160* 24*
Clover0.48 220 78 13 390 20.81 220 120 10 210 101.45 190* 100* 17* 280* 20*2.71 - - - - -0.48 120 66 15 210 120.81 55 95 12 210 51.45 75* 81 17* 220* 22*2.71 - - - - -
The second set of four values in each group were CaOH2treated.Values are the means of duplicate determination of fourre~licates bulked.* ery low yield (or insufficient forduplicate determination)

- 91 -
Appendix 5.
Field trial Herbage Yield
Sludge Yield%Cr in Sludge
0.5 0.8 1.1
t/ha t/ha (1100 )
200 2.48 3.15 2.28 2.63 2.13 1.532.90 2.94 2.67 1.59 1. 73 2.33
390 2.06 2.29 2.67 2.28 1.72 1. 94
2.51 2.82 2.40 2.17 2.28 2.48
580 3.02 2.50 2.52 2.06 1. 29 1.842.13 2.03 2.55 1.60 1.45 2.17
0 1.11 , 1.48, 1. 55, 2.30 (Control)
Field Estimation of Growth and Vigour of Ryegrass
Sl udge Fraction of Ground Cover%Cr in Sludge
0.5 0.8 1.1
t/ha %(±5)
200 50, 45 35, 30 35, 25
50, 25 30, 40 25, 30
390 35, 30 25, 20 15, 10
40, 40 30, 30 20, 25
580 25, 40 20, 25 10, 15
40, 20 20, 20 25, 10
0 30, 35, 15, 25 (Control