Discussion pap government assessments health education goals undp 2013
86
Discussion Paper Assessing Governance to achieve Health and Education Goals October 2013
-
Upload
werner-schneider -
Category
Documents
-
view
213 -
download
0
description
http://www.gaportal.org/sites/default/files/Discussion_pap_Government_Assessments_health_education_goals_undp_2013.pdf
Transcript of Discussion pap government assessments health education goals undp 2013

Discussion PaperAssessing Governance to achieve Health and Education Goals
October 2013

Acknowledgements
This paper was written by Eitan Felner, and substantively edited by Marie Laberge, Sarah Repucci, Shipra Narang Suri and Danae Issa. Special thanks for revising, commenting and advising on this paper go to (alphabetically): Diego Antoni, Gert Danielsen, Sarah Lister, Claudia Melim-McLeod, Joachim Nahem, John Samuel, Xiaojun Grace Wang and the UNDP Poverty Group.
DISCLAIMER
The views expressed in this paper are those of the authors and do not necessarily represent those of the United Nations, including UNDP, or UN Member States.
United Nations Development ProgrammeOslo Governance CentreDemocratic Governance GroupBureau for Development PolicyPostboks 2847, Solli 0204 Oslo-NorwayTel: +47 22121612
www.undp.org/oslocentrewww.gaportal.org

3 Assessing governAnce to Achieve heAlth And educAtion goAls
Contents
Executive Summary .................................................................................................................................................. 5Introduction .............................................................................................................................................................. 9
What is the Purpose of the Governance Assessment Framework for Health and Education (GAF)? .......................... 10 Who is the GAF for? .................................................................................................................................................................................. 10 What are the key characteristics of the GAF? .................................................................................................................................. 11 What is the structure of the GAF? ....................................................................................................................................................... 12 How to use the GAF? ............................................................................................................................................................................... 13
Chapter 1 ................................................................................................................................................................... 15
1.A. Economic growth without human development ............................................................................................ 16 Selected assessment questions to uncover ‘economic growth without human development’ .............................. 16
1.B. Wide disparities in social outcomes ................................................................................................................. 19 Selected assessment questions on wide disparities in social outcomes ......................................................................... 19 Comparison of a social indicator between population groups................................................................................................ 20 Comparison of an indicator across multiple social stratifiers ................................................................................................... 23 Comparison of rates of change ............................................................................................................................................................ 25
Chapter 2 ................................................................................................................................................................... 26
2.A. Identifying policy failures in providing essential goods and services (supply-side barriers) .................... 28 Selected assessment questions for identifying policy failures in providing essential goods and services
(supply-side barriers) .......................................................................................................................................................................... 28 Assessing availability of services ......................................................................................................................................................... 29 Assessing physical accessibility of services ..................................................................................................................................... 30 Assessing affordability of services ...................................................................................................................................................... 31 Assessing the quality of services ......................................................................................................................................................... 33 Survey of service users and household surveys ................................................................................................................... 33 Facility surveys ................................................................................................................................................................................. 34 Assessing the competence of service providers .................................................................................................................. 35 Assessing the effort of service providers ................................................................................................................................ 36
2.B. Identifying policy failures in tackling obstacles in the utilization of essential services (demand-side factors) ....................................................................................................................................... 37
Selected assessment questions for identifying policy failures in tackling obstacles in the utilization of essential services (demand-side factors) ................................................................................................................................ 37
Chapter 3 ................................................................................................................................................................... 39 Governance and barriers to social services ..................................................................................................................................... 39

4 Assessing governAnce to Achieve heAlth And educAtion goAls
3.A. Institutional Capacity ....................................................................................................................................... 41 Political will ................................................................................................................................................................................................. 41 Selected assessment questions on political will ....................................................................................................................... 41 Presence of ‘policy champions’ for the issue ......................................................................................................................... 42 Demand for information from political leaders ................................................................................................................... 43 Mobilization of support ................................................................................................................................................................ 43 Concrete policy steps..................................................................................................................................................................... 44 Allocating resources commensurate with the problem’s gravity .................................................................................. 44 Accountability ............................................................................................................................................................................................ 46 Selected assessment questions on accountability and transparency .............................................................................. 46 Political accountability .................................................................................................................................................................. 48 Judicial Accountability .................................................................................................................................................................. 48 Administrative Accountability .................................................................................................................................................... 49 Electoral Accountability ................................................................................................................................................................ 51 Social Accountability...................................................................................................................................................................... 52 Transparency ..................................................................................................................................................................................... 53 State capacity ............................................................................................................................................................................................. 54 Selected assessment questions on state capacity ................................................................................................................... 54 Financial Management .................................................................................................................................................................. 56 Civil Service management ........................................................................................................................................................... 58 Decentralization .............................................................................................................................................................................. 58
3.B. Patterns of power and interests ....................................................................................................................... 60 Discrimination ............................................................................................................................................................................................ 60 Selected assessment questions on discrimination .................................................................................................................. 60 Corruption ................................................................................................................................................................................................... 67 Selected assessment questions on corruption ......................................................................................................................... 67 Political Clientelism .................................................................................................................................................................................. 70 Selected assessment questions on political clientelism ........................................................................................................ 70 State capture .............................................................................................................................................................................................. 71 Selected assessment questions on state capture..................................................................................................................... 71
Annex 1: the GAF and the MAF ................................................................................................................................ 73Annex 2: Preliminary interviews ............................................................................................................................. 74 Interviews with non-governmental stakeholders ......................................................................................................................... 74 Interviewing government authorities ............................................................................................................................................... 74 Sample preliminary questionnaire ..................................................................................................................................................... 75Annex 3: Conducting a Political Economy Analysis ............................................................................................... 77
References ................................................................................................................................................................. 79

5 Assessing governAnce to Achieve heAlth And educAtion goAls
ExECUTIvE SUMMARy
When something is not being counted, it often means that it does not count.1 The Millennium Development Goals (MDGs) targets and indicators have shown that measurement influences action. They have been tremendously successful in galvanizing efforts to reduce poverty. The same applies for governance. If shortcomings in equity, accountability and transparency are not measured, it is unlikely that society will take strong action to address these governance failures.
Typically in social sectors such as health and education, the focus of measurement is on outcomes rather than pro-cesses. The analysis often stays at the national level, and growing disparities (whether between regions or different segments of the population) are concealed by national averages. At the same time, there is strong evidence that poor governance is an overarching reason for shortfalls in social sector goals, such as the MDGs.2 Multiple studies show that additional public spending reduces child mortality or increases primary school completion rates only when govern-ance is sound; it fails to do so in countries with weak governance.3 Moreover, since increased choices and opportunities are a condition for progress in human development, democratic governance – which empowers people to make those choices – is essential for achieving and sustaining the MDGs,4 as well as any other improvement in health, education and other social sectors.
At a time when new Sustainable Human Development Goals for a post-2015 context are being considered, lessons learned from MDG monitoring processes, whether related to extent of monitoring, types of indicators used, stakehold-ers involved, or the findings related to governance bottlenecks, can be very useful in informing the new agenda. Many discussions on the MDGs have focused on increasing resources to achieve the goals: scaling-up aid, borrowing abroad and mobilizing domestic resources. Yet there has been very little guidance available to diagnose systematically the many governance obstacles that hinder MDG achievement. This is an important gap. If improved democratic govern-ance is to be the lynchpin for effective, efficient and equitable resource management, obstacles to improvements in governance must first be identified – and monitored.
The starting point for this governance analysis of social sector progress is an illustration of how ‘national statistics do not only reveal; they also conceal’.5 Some call it the ‘fallacy of the mean’; others refer to the ‘tyranny of averages’. Disag-gregated data confirm that social indicators vary considerably across groups and/or regions within countries. Thus, a reliance on national averages often leads to false conclusions, as the consequences of governance deficits for service delivery can be hidden under national statistics that do not show differences between groups in society. The large dis-parities that remain are in fact slowing progress in many countries. The Governance Assessment Framework (GAF) pre-sented in this paper aims to delve deeper and gather more nuanced information, by providing a set of tools with which to diagnose and monitor a range of governance problems that are specific to the health and education sectors. Beyond the MDGs, it encourages researchers, activists and policymakers to map elements in patterns of abuse of power, such as discriminatory policies in the provision of social services, political clientelism, or state capture by economic elites. It presents simple assessment methods that can be used by national stakeholders to conduct diagnostics of governance obstacles that affect specific social sector outcomes – achieving universal primary education, promoting gender equal-ity in education, reducing child mortality and improving maternal health (MDGs 2 to 5) – as well as health and educa-tion deficiencies more broadly. The GAF aims to help assess to what extent certain deprivations or disparities in health and education sectors can be traced back to specific public policy failures, which in turn may be driven by governance problems. It places special emphasis on exclusion and discrimination in service delivery.
While it is useful for national planners and decision-makers as a policy tool, the framework can also be used by na-tional oversight institutions and civil society to monitor the efforts of governments in the concerned sectors. Most tools included in the GAF are simple methods that lend themselves to be displayed in visual forms, so maximizing their
1 Vandemoortele, 2009.2 UNDP 2010e.3 Wagstaff et al, 2006; Rajkumar and Swaroop, 2008.4 UNDP, 2010c.5 Vandemoortele, 2009.

6 Assessing governAnce to Achieve heAlth And educAtion goAls
advocacy potential. It is intended for use in all countries, including those that have made good national progress on health and education goals.
It is also a flexible framework, designed to allow those carrying out the assessment to determine which barriers and dimensions of governance to focus on and which specific methods to use. Although in some circumstances it may be relevant and possible to perform a complete analysis through all dimensions outlined in the framework, in others the main focus may only be on one or two of the aspects considered. These decisions should be based on the purpose of the assessment and the specific circumstances of the country where it is undertaken. In any case, the guidance pro-vided in the framework, including the specific tools and indicative assessment questions provided, should always be adapted by the users as relevant in the particular context of application.
To help analyse the multiple types of governance obstacles that affect specific social outcomes, particularly those re-lated to health and education, the assessment framework set out here aims to assess to what extent specific depriva-tions and disparities in health and education can be traced to particular failures of public policy, which in turn may be driven by governance problems. It proposes to achieve this through a division of three main layers of analysis, as shown in the following graph:
1) identifying shortfalls in achieving health and education goals; 2) mapping the main barriers to basic social services, which are essential for achieving progress in social sectors; and3) assessing the main governance deficits that have an effect on those barriers.
1. Shortfalls in health and Education
2. Barriers to social services
3. Governance deficits
1a 1b
2a 2b
3a 3b
Effect
Cause
Methodologicalsteps
E growthwithout HD
Disparities
Supply-side barriers Demand-side barriers
Institutional weaknesses Patters of power abuse
3-step assessment framework

7 Assessing governAnce to Achieve heAlth And educAtion goAls
The underlying assumption of this framework is that multiple dimensions of governance affect the delivery of basic social services, which in turn affects social outcomes. It does not seek to establish a systematic causal link between the three layers, but rather is based on a premise that lower layers act as contributing factors to higher layers.
Each of this paper’s three chapters deals with one of the framework’s three layers, offering selected assessment ques-tions and tools for each of them.
Layer 1: Identifying shortfalls in health and education is the first step of the proposed sequence of analysis, which starts from a specific problem or challenge of meeting set targets, and then works to a broader analysis of governance deficits that contribute to that specific challenge. This analysis can and must use existing data and information, for ex-ample data generated through MDG monitoring processes, and then identify and assess shortfalls. This provides the motivation behind the governance assessment. It focuses on two types of shortfall that are often symptomatic of poor governance: economic growth without human development, and wide disparities in social outcomes across various population groups.
As a rule of thumb, the existence in a given context of one or both of these patterns of human development – in reality, they typically occur together – can be seen as symptoms of poor governance, warranting further investigation.
Layer 2: Identifying the main barriers to achieving social sector goals is meant to help identify a number of barriers that often prevent access to basic social services by the poor and other disadvantaged groups. The framework describes key barriers to these services – physical, financial, legal and socio-cultural – and sets out some tools to identify such barriers in concrete situations. Assessment of these obstacles can help target intervention to improve performance on health and education goals. These barriers are divided into two broad groups: supply-side barriers, and demand-side barriers. The former are barriers that are caused by government and others who provide services, and the latter are those that stem from the side of beneficiaries or those utilizing the services.
This stage in the analysis is crucial from a human rights perspective, since typically the whole set of barriers dispro-portionately affects the poor and other disadvantaged groups. It focuses on barriers that have an impact on service delivery, but are not specifically caused by an intentional government policy or other abuse – the latter are dealt with by the third layer of analysis.
Layer 3: Assessing Governance Deficits is at the core of the GAF. The concept of governance encompasses a broad range of issues, and this part of the framework does not attempt to cover all aspects of governance assessment. It rather focuses selectively on those that are particularly relevant to the achievement of health and education goals, paying par-ticular attention to issues of equity and inclusiveness, two interrelated dimensions of good governance that are crucial from a human rights perspective.
Unlike conventional governance assessment tools, which usually focus exclusively on institutions, this framework also considers patterns of power and interests, which are embedded in unequal relationships and vested interests. This third layer of the framework comprises two distinct but interconnected dimensions of governance: Institutional capacity; and Patterns of power and interests. While analysis of institutional capacity deals with political will, accountability and state capacity, that related to patterns of power and interests includes measurement of discrimination, corruption, po-litical clientelism and state capture.
For each of these layers, tools and methods are provided that can be adapted and applied to different contexts, by a variety of stakeholders.

8 Assessing governAnce to Achieve heAlth And educAtion goAls
Finally, three annexes offer further guidance on preliminary steps to a governance assessment initiative for the health and education sectors.
• ThefirstannexdrawsthelinkbetweenGAFandMAF,alsodevelopedbyUNDPandbeingappliedinseveral countries. The present framework is not confined to the MDGs alone, nor does it cover all sectors covered by the MDGs, but recognizes the fact that many countries are focused on accelerating progress in the last years before the MDG deadline and are using the MAF to boost their efforts. For such countries, the GAF proposed herein can be an additional instrument to help them identify and address governance-related challenges in the health and education sectors that are impeding progress towards full achieve-ment of the MDGs.
• Thesecondannexprovidesguidanceontheuseofinterviewsinthecontextofagovernanceassess-ment, because interviews with stakeholders can be helpful in shortlisting key issues for the assessment and in ensuring that the chosen issues are indeed considered relevant for the country.
• Thethirdannexoffersguidanceandsupportinconductingapoliticaleconomyanalysis,applyingUN-DP’s Institutional and Context Analysis (ICA) approach. The ICA helps identify formal and informal institu-tions and key stakeholders and their incentives, abilities and constraints with regard to any development initiative. The ICA can be used in any sector to inform programming and support dialogue with national partners on key policy areas. More details on its application are provided in a Guidance Note developed for this purpose.6
6 UNDP 2012.
9 Assessing governAnce to Achieve heAlth And educAtion goAls
INTRODUCTION
There is strong evidence that poor governance is an overarching reason for shortfalls in various social sector goals, in-cluding, inter alia, the MDGs7. Studies show that additional public spending reduces child mortality or increases primary school completion rates only when governance is sound; it fails to do so in countries with weak governance.8 Moreover, since increased choices and opportunities are a condition for progress in human development, democratic governance – which empowers people to make those choices – is essential for achieving the MDGs and sustaining their results after 2015,9 as well as for other improvements in social sectors.
At the time when new Sustainable Human Development Goals in a post-2015 context are being considered, lessons learned from MDG monitoring processes, whether related to the extent of monitoring, types of indicators used, stake-holders involved, or the findings related to governance bottlenecks, can be particularly useful in informing the new agenda. Many discussions on the MDGs have focused on increasing resources to achieve the goals: scaling-up aid, borrowing abroad and mobilizing domestic resources. The United Nations Millennium Project, created to develop a concrete action plan for achieving the MDGs, focused its final report on investment strategies and ways to finance them.10 The more recently developed and piloted MDG Acceleration Framework focuses on bottlenecks that hamper progress in achieving the MDGs. They specifically include four aspects – policy and planning; budget and financing; ser-vice delivery (supply); and service utilization (demand).11 However, there is very little guidance available for diagnosing governance failures when considering how to promote progress on human development. This is an important gap. If improved democratic governance is to be the lynchpin for ensuring effective, efficient and equitable resource manage-ment, obstacles to improvements in governance must first be identified – and monitored.
When something is not being counted, it typically means that it does not count.12 The MDG targets and indicators have shown that measurement influences action, and, conversely, if something is not being measured, it is unlikely to be a priority area of intervention. The same applies for governance, whether generally or in relation to specific social targets. If shortcomings in equity, accountability and transparency in the provision of health care and education are not being measured, it is unlikely that society will take strong action to address these governance failures. Box 1 provides exam-ples of countries that have established a ninth MDG focusing on governance.
Box 1: MDG 9: Governance
While the MDGs are intimately tied to governance, none of the original eight goals are pointedly focused on governance itself. Therefore, some countries, notably Albania and Mongolia, created a ninth goal for democratic governance. In Albania, Goal 9 seeks to ‘Establish and Strengthen a Good Governance Process’ with a target to ‘Reform Overall State Systems of Public Administration, Legislation and Policies in Accordance with EU Standards of Justice, Rule of Law and Market Economies by 2015’. Albania adopted its indicators from the World Bank. Mon-golia developed its own set of indicators, with three targets: Fully respect and uphold the Universal Declaration of Human Rights, ensure the freedom of media, and provide the public with free access to information; Main-stream democratic principles and practices into life; and Develop a zero-tolerance environment to corruption in all spheres of society. Both have demonstrated progress since development of these goals.
Sources: UNDP 2010c; UNDP 2009c
7 UNDP, 2010e8 Wagstaff et al., 2006; Rajkumar and Swaroop, 20089 UNDP, 2010c10 UN Millennium Project 2005a11 See UNDP, 2010d.12 Vandemoortele, 2009

10 Assessing governAnce to Achieve heAlth And educAtion goAls
What is the Purpose of the Governance Assessment Framework for Health and Education (GAF)?The GAF proposed in this document is meant to help assess to what extent certain deprivations or disparities in the health and education sectors can be traced to specific failures of public policy, which in turn may be driven by govern-ance problems. The framework places specific emphasis on exclusion and discrimination in service delivery.
This paper presents simple assessment methods that can be used by national stakeholders to diagnose governance obstacles that affect the health and education sectors, specifically universal primary education, gender equality in edu-cation, child mortality and maternal health, as well as health and education deficiencies more broadly.
Box 2: Health and education MDGs
The following are the four MDGs loosely covered by this paper, as well as the targets against which their fulfilment is to be judged by 2015. It is important to note that this paper concerns not only the MDGs, but the health and education sectors generally.
Goal 2: Achieve Universal Primary EducationTarget: Ensure that, by 2015, children everywhere, boys and girls alike, will be able to complete a full course of primary schooling.
Goal 3: Promote Gender Equality and Empower WomenTarget: Eliminate gender disparity in primary and secondary education, preferably by 2005, and in all levels of education no later than 2015.
Goal 4: Reduce Child MortalityTarget: Reduce by two-thirds, between 1990 and 2015, the under-five mortality rate.
Goal 5: Improve Maternal HealthTarget: Reduce by three-quarters the maternal mortality ratio.
Source: www.un.org/millenniumgoals/
In many countries, health and education goals may be reached at the national level while certain groups or regions continue to lag behind. Relying on national averages can lead to false conclusions, as the consequences of governance deficits for service delivery can be hidden under national statistics that do not reveal differences between groups of society. The large disparities that remain are in fact slowing progress in many countries.13 This framework and the tools it proposes are a means to delve deeper and gather more nuanced information.
Who is the GAF for?Most governance assessment tools that include a component of political economy analysis were designed by develop-ment agencies to support more politically feasible donor strategies. Other international assessment methods may be useful in enabling broad cross-country comparisons, but ill-suited to the specific context of individual countries. The as-sessment approach presented here can be used by a range of national actors (e.g., policymakers, NGOs, media, national human rights institutions, parliamentary committees).
For national planners and decision-makers, it can be a policy formulation, monitoring and evaluation tool as it can help them identify failures in implementation and improve the design of service delivery mechanisms for the health and
13 idem

11 Assessing governAnce to Achieve heAlth And educAtion goAls
education sectors. At the same time, it can also be used by national oversight institutions and civil society actors to monitor the efforts of governments in following through on their commitments.
It is flexible and adaptable, allowing the appropriate tools to be selected and adapted for each context. The evidence generated can be used to facilitate a national dialogue on politically sensitive issues affecting sectoral goals. It can also be used effectively for advocacy purposes.
What are the key characteristics of the GAF?The GAF for health and education has several defining features.
From health and education deprivations and inequalities to power relations and vested interests Most governance assessment tools look at a specific governance issue (e.g., corruption or decentralization). Conversely, assessment tools that are designed for specific sectors, such as health or education, tend to leave out important governance aspects. This framework will help analyse the multiple types of governance obstacles that affect health and education outcomes, including governance deficits in terms of institutional capacity and other structural issues related to power relations and vested interests.
A cross-sectoral approach Many governance assessment tools that address specific sectors, such as education, health or nutrition, focus on that sector alone. However, given that efforts to improve social outcomes often require policy in-terventions that are outside the specific sector (e.g., the creation of access roads to help people living in remote rural areas to reach schools), the GAF proposes a systemic analysis of the wider policy and governance issues that may affect those social outcomes, often in indirect but crucial ways.
An emphasis on empirical evidence Governance assessment tools often rely heavily on expert opinions or percep-tion surveys. Although these methods can be effective for assessing some governance issues (such as corruption), this approach suggests methods that rely as much as possible on objective data (such as actual budget allocations, analysis of policy documents or data collected from on-site visits to schools/clinics). Beyond the methodological strengths of combining qualitative and quantitative analysis, relying on objective data for any assessment of politically sensitive is-sues (such as discriminatory policies against ethnic minorities or state capture by an economic elite or a teacher’s union) can be crucial to the assessment’s political legitimacy and credibility.
A human rights lens of analysis Most existing governance assessment tools either incorporate the ‘issue’ of human rights only as one dimension of governance or leave out the human rights framework altogether. In line with UNDP’s institutional mandate and the UN Common Understanding of a Human Rights Approach, this framework draws on human rights standards and principles. The tools presented can be used to measure three basic principles of a rights-based approach to development: 1) participation in the process of decision-making by all those who are potentially affected, particularly women and poor people; 2) accountability that enables rights-holders – women and men – to claim their rights and ensures that the state fulfills its obligations as duty bearer; and 3) non-discrimination and specific attention to vulnerable groups (depending on the context, these might include, e.g., women, ethnic minorities and people living in rural areas).14 It also includes human rights standards, such as economic, social and cultural rights (e.g., right to education, right to health) and their dimensions of availability, economic and physical accessibility, quality, and cultural acceptability. Layer 2 of the GAF presented below – just like the MAF – uses these dimensions to identify barriers/bottlenecks.
14 UNDP, 2007c

12 Assessing governAnce to Achieve heAlth And educAtion goAls
What is the structure of the GAF?The proposed GAF aims to assess the extent to which specific disparities in the MDGs can be traced to particular failures of public policy, which in turn may be driven by governance problems. The GAF is divided into three main layers of analysis: 1) identifying shortfalls in health and education; 2) mapping out the main barriers to basic social services; and 3) assessing the main governance deficits that have an effect on those barriers (Figure 1).
This framework’s underlying assumption is that multiple dimensions of governance affect the delivery of basic social services, which in turn affects health and education outcomes. The framework does not seek to establish a causal link between the three layers, but is based rather on the premise that lower layers act as contributing factors to higher layers.
Figure 1: Assessment framework
1. Shortfalls in health and Education
2. Barriers to social services
3. Governance deficits
1a 1b
2a 2b
3a 3b
Effect
Cause
Methodologicalsteps
E growthwithout HD
Disparities
Supply-side barriers Demand-side barriers
Institutional weaknesses Patters of power abuse
3-step assessment framework

13 Assessing governAnce to Achieve heAlth And educAtion goAls
The proposed sequence of analysis starts from a specific problem or challenge of meeting particular sectoral goals, then works to a broader analysis of governance deficits that contribute to that specific challenge. Rather than generally tracking progress on sectoral goals (international, such as the MDGs, or national goals), the first layer aims to identify and assess shortfalls, which provides the motivation behind the governance assessment. The framework will focus on two types of shortfall that are often symptomatic of poor governance, namely ‘economic growth without human devel-opment’ – a pattern of growth without significant progress (and sometimes stagnation or even reversal) in achieving predetermined targets – and ‘wide disparities in sectoral outcomes’ across various population groups.
The second layer of analysis focuses on barriers that often prevent certain population groups in a country from having access to basic social services. The framework describes key barriers to these services – physical, financial, legal and socio-cultural – and sets out tools to identify such barriers in concrete situations. Barriers are divided into two groups, as shown in Figure 1: those that are caused by government and others who provide services (supply-side), and those that stem from the side of beneficiaries (demand-side). This stage in the analysis is crucial from a human rights perspective, since typically this set of barriers disproportionately affects the poor and other disadvantaged groups.
Focusing on governance deficits, the third layer of analysis is the core of the assessment framework. Unlike conven-tional governance assessment tools that typically focus only on institutions, this framework also looks at patterns of power and interests, which are embedded in unequal relationships and vested interests. So, as Figure 1 also shows, the framework’s third layer comprises two distinct but interconnected dimensions of governance: analyses of institutional capacity and of patterns of power and interests. Under institutional capacity, tools are introduced to measure political will, accountability and state capacity, and under patterns of power and interests, other tools are presented to measure discrimination, corruption, political clientelism and state capture.
The use of a wider concept of governance in the proposed framework is premised on a growing recognition among development practitioners and academics that ultimately the real barriers to progress in health and education are rooted in unequal access to resources and distribution of power within and among countries.15 The two dimensions of governance are interconnected. Governance deficits in terms of institutional capacity, such as poor accountability mechanisms and lack of transparency in decision-making, are a result of, and a force to, sustain political, economic and cultural interests of powerful groups in society.
In some cases, the critical governance deficits that may impinge on progress in specific sectors may be primarily intra-sectoral problems (e.g., resistance by a strong teachers’ union to reform of the educational system that is necessary to strengthen accountability in the sector and improve the quality of education). In other cases, the key governance defi-cits may be related to structural issues beyond the specific sector (e.g., a kleptocratic government that siphons off most public funds for the education system). The extent to which the analysis will be specific to the sector or will focus on the wider governance environment depends on the country’s particular circumstances.
How to use the GAF? This framework allows those carrying out the assessment to determine which barriers and dimensions of governance to focus on and which specific methods to use. In some circumstances it may be relevant and possible to progress through all three layers, while in others there may be ample existing knowledge of layers one and two and the third layer may be the main focus. The framework is structured so that it allows users to jump from one layer to another in a non-linear fashion, if required.
Users of the GAF should make a decision about which layers to explore, and to what level of detail. These decisions should be based on the purpose of the assessment and the specific circumstances of the country where it is undertaken.
15 UNDP, 2010e

14 Assessing governAnce to Achieve heAlth And educAtion goAls
Each section of the paper begins with a summary of selected assessment questions, which are representative of the types of methods that exist, but are not exhaustive. Users can adapt the selected questions and add others as needed in their particular context. These selected questions are followed by more detailed text describing tools that can be used for the corresponding part of the assessment.
In applying the framework or any of the individual methods described here, it is important to keep in mind the possible impact on health and education outcomes. That is, while it may be straightforward to assess a governance deficit, it is not necessarily the case that remedying it will improve the health or education of the population. For that reason, it is important not to select methods without first understanding what types of changes can have a genuine impact on the specific country under consideration.
In addition, the social and political context is important when assessments are used to generate a baseline against which future measurements will be made. A preparatory contextual analysis will prevent a false perception that pro-gress had not taken place before the baseline was established.16
16 See Annexes 2 and 3; and UNDP, 2012

15 Assessing governAnce to Achieve heAlth And educAtion goAls
1. Shortfalls in health and Education
2. Barriers to social services
3. Governance deficits
1a 1b
2a 2b
3a 3b
Effect
Cause
Methodologicalsteps
E growthwithout HD
Disparities
Supply-side barriers Demand-side barriers
Institutional capacity Patters of power and interests
3-step assessment framework
CHAPTER 1
IDENTIFyING SHORTFALLS IN THE HEALTH AND EDUCATION SECTORS
Before assessing governance issues or failures with respect to the health and education, it is important to determine if any deficiencies in fact exist in these sectors. This forms the first layer of analysis.
In most cases, this analysis has already been performed, thanks to the reporting requirements on, for example, MDG achievement, annual and mid-term assessments. The pilot assessments undertaken as part of the MDG Acceleration Framework provide a very important recent reference. The MAF helps countries to develop their own action plans by systematically identifying and addressing bottlenecks that impede MDG progress. A number of countries have piloted the MAF, selecting one or more MDG targets, ranging from poverty reduction and education to maternal health and sanitation, whose progress has been unsatisfactory or off-track. Using the MAF, the countries identified the constraints hampering faster progress, possible solutions, and a set of activities and partners for each solution.17
An identified shortfall in MDG achievements can provide the impetus for a governance assessment in any given sector. Nevertheless, the tools described in this section can help assessors sharpen their understanding of the health or educa-tion deprivations recorded and identify how these problems might be related to governance weaknesses.
Given the profusion of existing assessment methods, this paper does not provide an overview of all that may be useful for assessing deprivations or disparities in education and health. Instead, this chapter focuses on two types of shortfall in the progress on health and education that are often related to governance deficits, and describes common methods to detect these patterns. These two patterns can be labelled as ‘economic growth without human development’ and ‘wide disparities in social outcomes’. As they typically occur together, the existence of these patterns could point to-wards poor governance, and a user could then decide to push the analysis to the next levels (Chapters 2 and 3).
17 UNDP, 2010d

16 Assessing governAnce to Achieve heAlth And educAtion goAls
Selected assessment questions to uncover ‘economic growth without human development’
Question Data collection Application
What is the difference between actual and pre-dicted levels of health/education indicators?
Review of past governmental or nongovernmental predictions, current statistics
If past predictions are available and current indicators are lagging
How do health/education indicators compare with GDP per capita over time?
Review of current statistics If health/education indicators have deteriorated in face of rising GDP per capita
How do health/education indicators and GDP per capita compare in similar countries?
Review of current statistics To assess whether indicators have improved, but not sufficiently
What is the expected vs. achieved coverage of health/education services?
Review of statistics, independent assessments and reports
To understand the extent to which sectoral goals are being met
A common reason why many countries are not making sufficient progress on health and education goals is that they are too poor to make the needed investments in infrastructure, social services and public administration to improve governance. The International Covenant on Economic, Social, and Cultural Rights, states that governments have an obligation to progressively realize these rights “to the maximum of a state’s available resources”.18 So, if income remains stagnant, it is difficult to improve human development including health and education. This is why, from the outset, a crucial strategy for achieving the MDGs has been to scale-up investment in development.
At the same time, evidence shows that some countries have had poorer outcomes in one or more MDGs than other countries with a similar level of income. In other cases, countries are failing to make any significant progress to meet one or more of the goals despite rapid economic growth.
Studies show that this pattern of development, in which a country fails to convert its economic growth into substantial progress in education, health or other human development outcomes, is a symptom of governance problems. For in-stance, a recent collection of essays analyses the pattern of growth without improvement on undernutrition in India. As the introductory chapter explains, “with rapid economic growth and little progress in banishing undernutrition, India is an economic powerhouse and a nutritional weakling.”19 The study goes on to conclude that this situation represents a failure of governance at many levels. “A poor capacity to deliver the right services at the right time to the right popula-tions, an inability to respond to citizens’ needs and weak accountability at the local level are all features of weak nutri-tion governance”.20
The simplest method for assessing patterns of economic growth without development within a country is to compare a social indicator over time, such as primary school completion rates or child malnutrition rates, with GDP per capita (as a proxy for available resources).21 This method is helpful in cases where a country experiences a reversal in a social indicator during a period of significant economic growth (Figure 2).
18 See International Covenant on Economic, Social, and Cultural Rights, art. 2:1; and UN Convention on the Rights of the Child, art 4.19 Haddad, 200920 idem21 The methods described here are taken from Felner, 2009. For more sophisticated methods, see Stewart 1985, ch 4; Moore et al., 2003; and Fukuda-Parr et al., 2008.
1.A. ECONOMIC GROWTH WITHOUT HUMAN DEvELOPMENT

17 Assessing governAnce to Achieve heAlth And educAtion goAls
However, cases in which social indicators actually deteriorate over time are relatively rare. In fact, most countries make some progress, in which case looking at changes within a single country is not very helpful. Cross-country comparisons can help determine whether this progress is adequate or too slow relative to the change in resources. One method compares the per-formance of the focus country with that of similar countries (e.g., countries in the same region, with similar levels of income and of development). A comparison of per capita incomes with social indicators22 can provide an objective benchmark against which actual performance may be judged. As an illustration, comparing Figure 3 with Figure 4, the Centre for Eco-nomic and Social Rights showed that while India had an income growth of 58 percent between 1995 and 2005 – one of the highest in the world – its reduction in the child mortality rate during the same period was one of the lowest in South Asia.23
Figure 3: Decrease in under-five mortality rates, 1995-2005
22 In such a comparison, one may want to control for other factors that could have an impact on the social outcome, independent of GDP. For instance, the RICE method (Relative Income Conversion Efficiency), which measures the efficiency with which any country converts its national material resources into human development, controlled for population density in order to take into account the fact that a country with a higher population density can more efficiently provide services than a larger country with lower population density (Moore et al., 2003). It is also advisable to make comparisons of countries in the same geographical region so as not to introduce additional variables that might affect the data.23 CESR, 2008
Figure 2: Primary completion rate versus GDP per capita, Jamaica, 1990-2005
Source: CESR 2008 based on World Bank 2008
Source: WDI (2008)
76
78
80
82
84
Primary completion rate GDP per capita
86
88
90
92
2,500
2,600
2,700
2,800
2,900
3,000
3,100
3,200
3,400
3,300
1990 1991 2004 2005
Pri
mar
y co
mp
leti
on
rat
e
GD
P p
er c
apit
a (c
on
stan
t 2,0
00 U
S$)
Percentage (%)
0 0.05 0.1 0.15 0.2 0.25 0.3 0.35 0.4 0.45 0.5
Nepal
Sri Lanka
Bangladesh
India
Pakistan

18 Assessing governAnce to Achieve heAlth And educAtion goAls
For any given year, this information can also be plotted on a single graph to show different levels of performance in a social indicator across countries with different GDP levels. Such a comparison can reveal that countries that have made relatively good progress in absolute terms are in fact still lagging behind, when compared to countries with similar de-velopment levels, or even poorer countries, in the same region.
For instance, Figure 5 compares the Education for All Development Index with the level of economic development for countries in Latin America. This is an index of key education outcomes developed by UNESCO as a proxy for the status of education in a given country. The index combines four basic dimensions of education: universal primary education, adult literacy, the quality of education, and gender parity. Figure 5 clearly shows that relative to its level of economic development, Guatemala is underperforming in education outcomes in comparison to other countries in the region, and even lags behind poorer countries such as Bolivia, Paraguay and Honduras.
Figure 5: Education for all index and GDP per capita, Latin America and the Caribbean, 2006
Figure 4: GDP per capita PPP* growth, 1995-2005
Source: CESR 2008 based on World Bank 2008
*Purchasing Power Parity is a method for calculating exchange rates that is commonly used to compare countries’ standard of living, or per capita GDP.
Percentage (%)
0 0,2 0,4 0,6 0,8
India
Sri Lanka
Bangladesh
Nepal
Pakistan
Source: WDI 2008 and UNESCO EFA Global Monitoring Report 2008
GDP per capita, PPP (constant 2005 internatonal $)
Edu
cati
on
for
All
Ind
ox
2,000 4,000 6,000 8,000 10,000 12,000
Bolivia Equador
Peru
Colombia
Dominican Rep. Jamaica
El SalvadorHonduras
NicaraguaGuatemala
Brazil
Panama
Uruguay
Argentina
Mexico
Venezuela
Chile
Paraguay
1
0.98
0.96
0.94
0.92
0.9
0.88
0.86
0.84
0.82
0.8

19 Assessing governAnce to Achieve heAlth And educAtion goAls
1.B. WIDE DISPARITIES IN SOCIAL OUTCOMES
Selected assessment questions on wide disparities in social outcomes
Question Data collection Application
How do health/education indicators compare to the regional average?
Review of current statistics To assess whether a country is lagging behind
How do health/education indicators compare between different population groups (by, e.g., gender, ethnic or religious group, income, geography)?
Review of current statistics To assess inequalities through side-by-side comparison
What is the ratio of a given health/education indicator in two population groups?
Calculation based on current statistics
To display a comparison in a more concise man-ner than side-by-side
How does the discrepancy in health/education outcome indicators compare with that in other countries of the same region?
Review of current statistics To assess whether inequalities in a given coun-try are larger or smaller than those of similar countries
How does the shortfall from the optimal value of a given health/education indicator compare across population groups?24
Calculation based on current statistics
To account for added complexity in the data, such as biological differences
How do health/education indicators compare across population groups after equity-adjustment?25
Calculation based on current statistics
To reflect nuances contained within national averages
How do health/education indicators compare within sub-groups of the same population (e.g., girls vs. boys in a rural population group)?
Review of current statistics To identify cumulative effects of multiple sources of inequalities
What is the rate of change of a health/education indicator?26
Calculation based on current statistics
To assess whether there is acceleration in the rate of progress (to measure ‘effort’) as opposed to merely meeting global targets
242526
The disparities between health and education outcomes in different locations can be stark. For example, comparing lifetime risk of maternal deaths between countries in the same region can give a dramatic demonstration of lagging performance. Figure 6 is a graphical representation of how much higher the rate of maternal deaths in Angola is than the regional average.
24 Sen, 199225 Vandemoortele, 200926 Fukuda-Parr and Greenstein, 2010

20 Assessing governAnce to Achieve heAlth And educAtion goAls
There are multiple reasons for differences in people’s health status or education achievements. But many disparities in education, health or other human development outcomes systematically coincide with certain group characteristics by which people are stratified in society, such as their gender, their level of wealth, where they live (e.g., rural or urban areas) or their ethnicity. From a good governance perspective, particularly one grounded in human rights, such dispari-ties are of concern, because they mean that the chances people have to enjoy their basic rights to education or health are heavily shaped by the circumstances into which they are born and not by factors over which they have control. In many countries, being a girl, being poor, belonging to an ethnic minority or living in rural areas radically reduces the chances of surviving childhood and of obtaining a proper education. It also largely determines women’s risk of dying during pregnancy or childbirth.
As we shall see in Chapter 3, wide disparities in social outcomes across gender or ethnicities are often symptoms of direct or indirect forms of discrimination, one of the hallmarks of poor governance.
Comparison of a social indicator between population groupsThe most common method to assess and present inequalities in health and education outcomes27 compares a given outcome indicator (e.g., child mortality rates, primary school completion rates) between two contrasting groups, such as men and women, urban and rural populations, or the poorest and wealthiest quintiles in society.
27 The literature on inequalities in human development is extensive, particularly for health. Therefore, the methods described here are only a small sample of those developed for this purpose. For a more comprehensive description and analysis of tools to measure health inequalities, see Anand et al. 2001, and Yazbeck, 2009 (particularly chapter 1).
Source: based on WDI 2009
Figure 6: Lifetime risk of maternal deaths
Angola Sub-SaharaAfrica
(1 in 12) (1 in 22)
= Maternal deaths
21 Assessing governAnce to Achieve heAlth And educAtion goAls
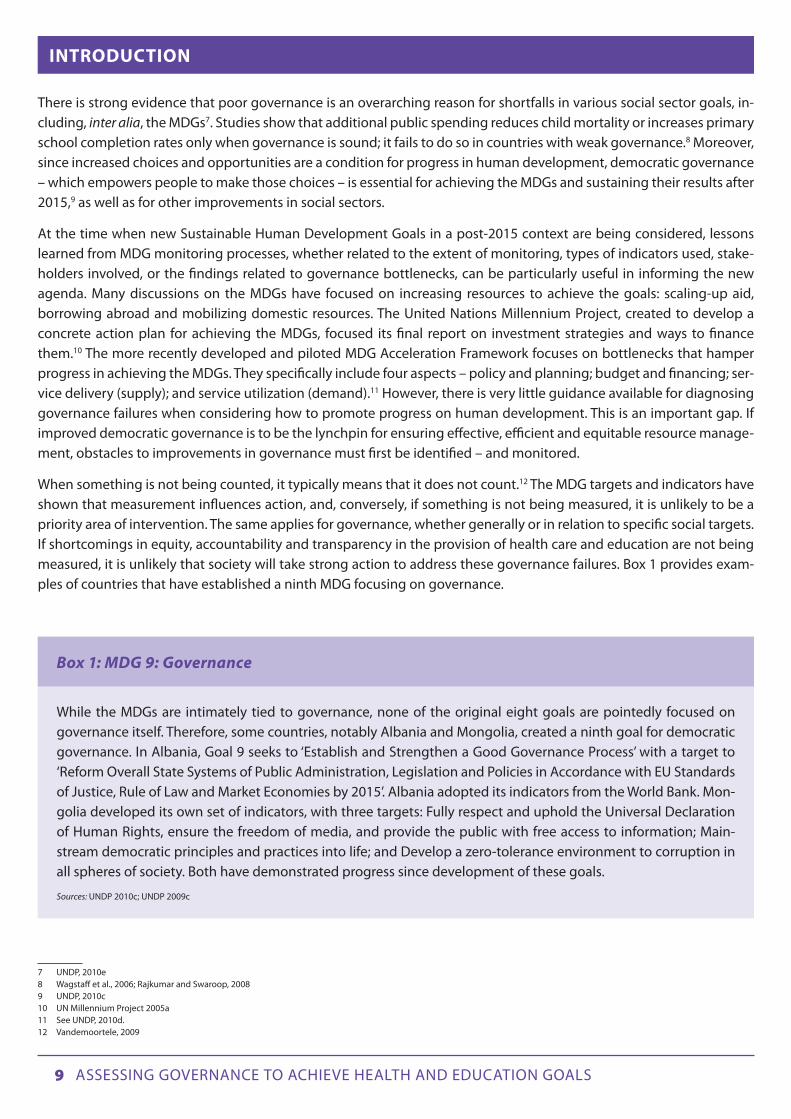
Source: based on World Bank EdStat
Figure 8: GPI primary completion rates, South America
Figure 7 compares the discrepancy between male and female primary school completion within a country with that of other countries. It shows that the gender gap in primary school completion rates in Chile is higher than those of its neighbours.
Figure 7: Primary School completion rates by gender, South America
Source: based on World Bank EdStat
80.00
85.00
90.00
95.00
100.00
105.00
110.00
115.00
Chile Bolivia Peru Paraguay Brazil Ecuador Venezuela Uruguay Colombia Argentina
Female primary completion rate Male primary completion rate
* Female-Male ratio: a value of less than one indicates lower completion rate for girls; a value greater than 1 denotes the opposite.
45% 50% 55%
Chile: 0.87Guatemala: 0.91
Bolivia: 0.99Peru: 0.99
Cuba: 0.99Paraguay: 1.00
Panama: 1.00Brazil: 1.01
Mexico: 1.01Ecuador: 1.01
Venezuela, RB: 1.02Uruguay: 1.02
Colombia: 1.03Dominican Republic: 1.03
El Salvador: 1.03Argentina: 1.04Costa Rica: 1.05Honduras: 1.06Nicaragua: 1.10
Female primary completion rate Male primary completion rate
22 Assessing governAnce to Achieve heAlth And educAtion goAls
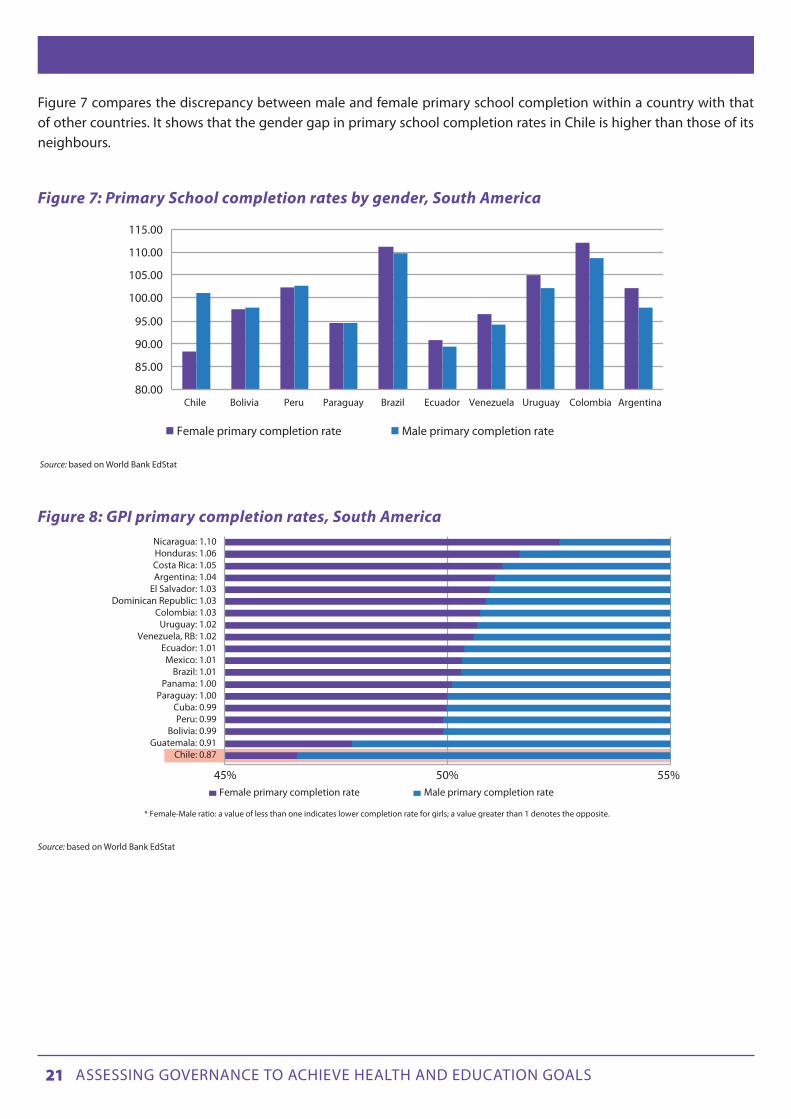
A variation of this method graphically represents the ratio between the rate of a given indicator for two contrasting groups. An example of this method is the Gender Parity Index (GPI), developed by UNESCO, which gives the female-to-male ratio of a given indicator. A GPI of 1 indicates parity between sexes; a GPI that varies between 0 and 1 means a disparity in favour of men/boys; a GPI greater than 1 indicates a disparity in favour of women/girls’.28 For instance, using the same example as Figure 7, it is possible to measure the GPI for primary school completion in these countries, as il-lustrated in Figure 8.
It is also possible to represent graphically the ratio between the wealthiest and poorest quintiles, urban and rural popula-tions, and other populations for any given indicator. Social indicators can also be compared between ethnic groups (Box 3).
Box 3: Comparison of a social indicator between ethnic groups
Assessing disparities by ethnic group or race is often more challenging than assessing disparities by other common social stratifiers, such as gender, income or place of residence. This is because, although the number of countries that collect and analyse education and health statistics by race or ethnicity is increasing, many – if not most – countries still do not do so because of political sensitivities. In such cases, it is common to use some other social stratifier, which, in the specific context, correlates to the ethnic divides (such as language or geography for relatively ethnically homogenous areas) as a proxy to collect and analyse data by ethnicity. For instance, in its efforts to monitor the health of indigenous peoples in the Americas and detect inequalities in health status and access to health services, the Pan American Health Organization compares data for municipalities with a majority of indigenous people to national data, rather than comparing individuals themselves.29 Another method that is increasingly used to measure ethnic disparities in human development is to compare the range in rates of a given indicator for a particularly disadvantaged ethnic minority group and those of the majority ethnic group in a country.
Source: UNICEF 2008
29
These methods are commonly used, because they are easy to understand and therefore accessible to policy makers and a wider audience. For certain purposes, though, it might be necessary to use more complex assessment methods. For instance, when assessing gender disparities in health outcomes related to life expectancy or mortality rates, a simple comparison of the rates of a particular indicator (e.g., life expectancy) for women and for men may be problematic, because it does not take full account of the fact that women on average live longer than men. To take account of this biological difference, Amartya Sen proposed assessing gender equality in health outcomes in terms of ‘shortfalls’ from the optimal value that both genders can respectively attain.30 Thus, “if the maximal life expectancy of women and men is 85 and 80 years, respectively, yet a life expectancy of only 60 years is achieved, the ‘shortfall inequality’ for women (25 years) would be greater than for men (20 years)”.31
A comprehensive analysis of education or health inequalities requires disaggregation to capture the differences within a population according to their income level. For instance, data for under-five mortality rates can be disaggregated by quintile rather than averaging all groups together. The distribution of under-five mortality rates can be different across different quintiles in different countries (Figure 9). The Democratic Republic of Congo (DRC) displays the expected pat-tern of mortality increasing as income decreases; Jordan has a much more egalitarian pattern, in which under-five mor-tality is roughly equal across income classes.
28 UNESCO, 200629 PAHO, 199730 Sen, 199231 Bhuiya et al., 2001

23 Assessing governAnce to Achieve heAlth And educAtion goAls
Another way to display differences in national averages is to weight the quintiles differently. For example, if the national average of under-five mortality improves in a country with high levels of inequity, it is likely that the higher income quintiles will benefit more. Consequently, the real problems affecting the poorest people in the population may not be alleviated despite improved national statistics. This can be demonstrated by assigning greater weight to the lower quintiles and lower weight to the higher quintiles, to obtain ‘equity-adjusted’ rates. Using the same example, if a coun-try with high levels of inequity shows an under-five mortality rate of 70 per 1,000 live births, the equity-adjusted rate would be higher, for example 80 per 1,000 live births, while it would remain close to 70 in a highly equitable country. The more equitable a country is, the closer its equity-adjusted rates would be to its standard national average. The less equitable it is, the greater the difference between these two averages. The choice of a weighted average or one of the simpler methods that compares the wealthiest with the poorest quintile hinges largely on strategic questions related to the purpose of the analysis and the target audience.
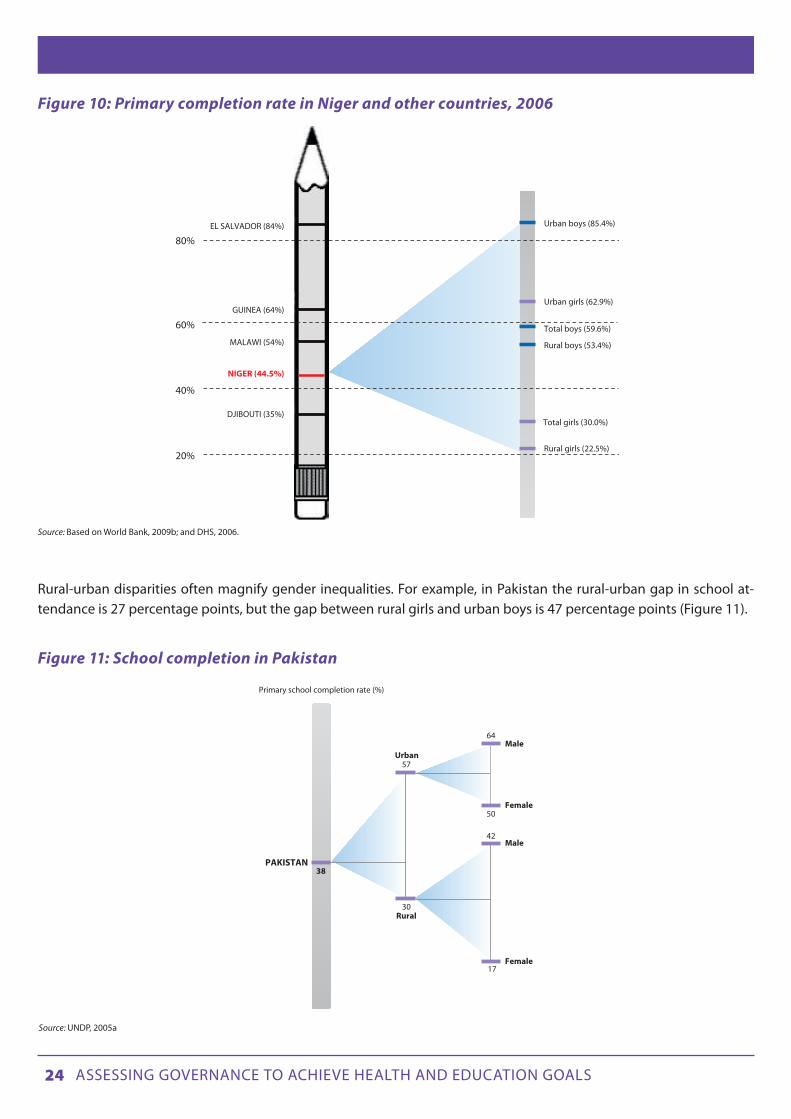
Comparison of an indicator across multiple social stratifiersAs well as assessing health and education disparities across a single social stratifier (e.g., gender, ethnicity or income level), it is revealing to measure compounded patterns of inequality, in order to identify the cumulative effect of multi-ple sources of inequalities – as, for instance, in the compounded effects of the urban-rural divide and the gender gap in the rates of primary school completion in segments of the population in Niger (Figure 10).
Figure 9: Under-5 mortality rate by quintile in selected countries
Source: Vandemoortele 2009
0
50
100
150
200
250
Bolivia (’98) Namibia (’92) DRC (’01) Jordan (’97)
Bottom Second Middle Fourth Top
24 Assessing governAnce to Achieve heAlth And educAtion goAls
Rural-urban disparities often magnify gender inequalities. For example, in Pakistan the rural-urban gap in school at-tendance is 27 percentage points, but the gap between rural girls and urban boys is 47 percentage points (Figure 11).
Figure 11: School completion in Pakistan
Figure 10: Primary completion rate in Niger and other countries, 2006
Source: Based on World Bank, 2009b; and DHS, 2006.
Source: UNDP, 2005a
NIGER (44.5%)
Total boys (59.6%)
Rural boys (53.4%)
Urban boys (85.4%)
Urban girls (62.9%)
Total girls (30.0%)
Rural girls (22.5%)
60%
80%
40%
20%
DJIBOUTI (35%)
MALAWI (54%)
GUINEA (64%)
EL SALVADOR (84%)
Primary school completion rate (%)
Male
Male
Urban57
64
50
42
17
30Rural
PAKISTAN
Female
Female
38

25 Assessing governAnce to Achieve heAlth And educAtion goAls
Comparison of rates of changeAn alternative method for evaluating the achievement of social goals is to determine if progress on meeting the goals has accelerated. The MDG indicators can be used as benchmarks of progress to see whether the pace of improvement in health and education has increased. For example, how does the rate of change in primary school enrolment in the 10 years prior to the launch of the MDGs compare to the rate of change in the 10 years since? While this is not explicitly a method for measuring disparities in health and education outcomes, it is nevertheless useful to consider here.
In How should MDG implementation be measured?,32 the authors calculated the rates of change in all countries where data were available, comparing the years before the launch of the MDGs with the subsequent years (different numbers of years were considered depending on the data available in each country). The calculations were made by dividing the difference in values by the number of years. For example, for primary school enrolment, the difference between the rate of enrolment at the time of the MDG launch and the rate x years earlier was divided by x. This was then compared to the same calculation for y years after the launch. If the latter was larger than the former, the country was considered to have accelerated its efforts as a result of the MDGs.
The authors found that in most countries, there has been little or no acceleration of improvement, and that many countries have actually regressed on many indicators. Their conclusion was that MDG-related efforts have not met expectations, as for example, for under-five mortality in Algeria (Figure 12). It is therefore important, even for countries that have ‘met’ the goals, to determine if more is being done to live up to commitments, resulting in faster progress. In other words, even those countries officially ‘on target’ could be considered to lag behind if their efforts are decreasing over time.
Figure 12: Average annual rate of reduction in under-five mortality in Algeria
Source: Fukuda-Parr and Greenstein 2010.
But at the same time, it should be remembered that future progress may be slower. The closer a country is to achieving 100 percent of its target, the more difficult it is to reach it (as, for example, for the 100 percent primary school enrolment target). Analysis of progress towards health and education outcomes needs to take account of this.
32 See Fukuda-Parr and Greenstein, 2010
0
0.5
1
1.5
2
2.5
3
3.5
4
4.5
5
1990-2000 2000-2007
Average annual rate of change

26 Assessing governAnce to Achieve heAlth And educAtion goAls
CHAPTER 2
IDENTIFyING THE MAIN BARRIERS TO ACHIEvING HEALTH AND EDUCATION OUTCOMES
This layer in the proposed framework is meant to help identify barriers that often prevent access by the poor and other disadvantaged groups to basic social services. These barriers are a primary reason why some countries are falling short in health and education targets (national or international) and why others may be reaching the goals at the national level, but with disadvantaged groups falling behind. Assessment of these obstacles can help target interventions that improve performance in the health and education sectors.
A literature review is beyond the scope of this proposed assessment framework, but it is worth pointing out some basic distinctions about the types of barriers that affect key areas of education and health.
Barriers in access to health and education can be broadly classified as supply-side and demand-side barriers. Supply-side barriers are associated with the provision of health and educational services, and are directly related to govern-ment policies and interventions. These barriers include inputs such as clinics and schools, medical and school supplies and equipment, and teachers and physicians. Demand-side barriers are those that come from the beneficiaries them-selves, although the beneficiaries in some cases may not have power to change them. Demand-side barriers include income poverty and cultural practices. (Note that while income poverty is a demand-side barrier, the cost of services is a supply-side barrier.)
Figure 13 provides some examples of supply-side and demand-side barriers to basic social services. It is clear that many of these are related to policies within the relevant sector (i.e., the health sector for barriers affecting health outcomes and the education sector for barriers affecting education outcomes). So rural children may be effectively prevented from attending school, because there are no available schools near where they live, or poor women may not use emer-gency obstetric care because of the costs of those services.
1. Shortfalls in health and Education
2. Barriers to social services
3. Governance deficits
1a 1b
2a 2b
3a 3b
Effect
Cause
Methodologicalsteps
E growthwithout HD
Disparities
Supply-side barriers Demand-side barriers
Institutional capacity Patters of power and interests
3-step assessment framework

27 Assessing governAnce to Achieve heAlth And educAtion goAls
At the same time, it is important to underscore that many barriers to achieving education and health targets can only be remedied through policy interventions that are outside the specific sectoral ministries or agencies (e.g., Ministry of Health or of Education). This includes the creation of access roads to overcome obstacles of physical accessibility to es-sential services for people living in remote rural areas, and the installation of sanitation systems to prevent spread of diarrhoea and other fatal diseases. Figure 14 illustrates how these various types of barriers may affect the access of girls to primary education.
Figure 14: Barriers to girls’ education
Figure 13: Sectoral barriers
The following discussion describes tools to assess barriers to health and education targets. This chapter focuses on ob-stacles that have a direct impact on service delivery, but are not specifically caused by an intentional government policy or other abuse, which is covered in Chapter 3.
Supply-sidebarriers
Demand-sidebarriers
Inadequateprovision of services
Insufficientavailability
Poorquality
Perception ofpoor quality
Culturallyinappropriate
Highfinancial cost
Lowincome
Governmentforbids girls toattend school
Schooltoo faraway
Poorquality ofteaching
Teachersare often
absent
Culturalbelief andpractices
Parentscan’t affordschool fees
Parents’ refusal tosend girls to school
Barriers to girls’ education
Supply side Demand side
Opportunitycosts forparents
Supply
Demand
Factors outside sector

28 Assessing governAnce to Achieve heAlth And educAtion goAls
2.A. IDENTIFyING POLICy FAILURES IN PROvIDING ESSENTIAL GOODS AND SERvICES (SUPPLy-SIDE BARRIERS)
Selected assessment questions for identifying policy failures in providing essential goods and services (supply-side barriers)
Question Data collection33
Application
How do health/education indicators com-pare against established benchmarks?
Review of current statistics To assess availability of services if estab-lished benchmarks are available and current indicators are lagging34
What is the patient flow (best answered through a diagram)?
Interviews/surveys of service providers and beneficiaries, review of health care policies if available
To assess the effectiveness of patient management
How much time is required to reach health/education facilities?
Household surveys, official information on facility and residence locations, inter-views/surveys of service providers and beneficiaries
To reveal inequalities in physical accessibility
What proportion of household expenses goes towards health/education services?
Household surveys To determine the extent to which cost may inhibit access to services without touching on sensitive questions of ability to pay
How many people are reached by a programme to address health/education deficiencies as compared to the number that were experiencing deprivation?
Official statistics on the number of people reached, household surveys
To determine whether official programmes are having the intended effect
How does the level of spending of a state on programmes to address health/educa-tion deficiencies compare to that of other states, controlling for level of deprivation?
Official statistics on spending, CSO reports or other indicators of level of deprivation
To determine whether spending on public programmes is adequate
What do beneficiaries think about the qual-ity of health/education services?
Interviews/surveys of beneficiaries, households
To assess the perceived quality of services
What are the physical conditions of health/education facilities?
Facility surveys To observe whether the physical conditions of facilities are adequate to ensure quality service delivery
How much training do health/education service providers have?
Official figures or interviews to determine level or length of training
To assess the adequacy of provider training
What proportion of health/education ser-vice providers have adequate skills to serve in their position?
Testing of service providers, clinical vignettes
To assess whether providers have adequate skills when available training may be inadequate
How much effort do health/education ser-vice providers make in their jobs?
On-site visits, especially unannounced; observation by trained observers
To uncover lack of effort
Do students achieve well on standardized tests?
Review of test results To assess quality of education after other factors of student background are taken into account
See also the Right to Education indicators on availability, accessibility, acceptability and adaptability of Education, as developed by the Right to Education project (www.right-to-education.org).
3334
33 Many of the assessment methods deployed for layers 1 and 2 involve primary data collection through surveys and interviews. These can be costly and national institutions will need dedicated resources (financial as well as human and technical) to conduct these on a regular basis.34 See for example EFA FTI, 2005; WHO, UNICEF and UNFPA 1997; Joint Learning Initiative 2004

29 Assessing governAnce to Achieve heAlth And educAtion goAls
Indicators of supply typically assess the following aspects of service provision:35 availability, accessibility, affordabil-ity and quality of goods, facilities and services. Together, these determine the adequacy of health and education provi-sion. Various tools may be used to identify key barriers to basic services and identify policy failures – both sectoral and extra-sectoral – that may be creating or perpetuating those barriers. The tools set out below focus on the most common policy failures that affect supply-side barriers.
Assessing availability of services Education and health services must be available in sufficient quantity and in the correct location in a given country or region to ensure adequate coverage for the entire population. These services include, inter alia, school buildings, sani-tation facilities for both sexes, safe drinking water, trained teachers, teaching materials (for education), and clinics and hospitals, trained medical and professional personnel, and essential drugs as well as other key determinants of health such as safe and potable drinking water and adequate sanitation facilities (for health).
One measure of the availability of services is the Lived Poverty Index.36 Based on the Afrobarometer, this index consid-ers how often a particular service, such as ‘medicines or medical treatment’, has been received in the past year. The responses are then averaged to create an index. In addition, the Lived Poverty Index used Afrobarometer data to see whether development infrastructure has an impact on health. The results showed that deficits in electricity, piped water and sewerage were related to respondents saying that they had been “worried or anxious or worn out or exhausted”, or “physically ill” in the previous month. Interestingly, the presence of a health clinic was not correlated with these responses.
With many services – such as teachers, hospital beds per 1,000 people or births attended by skilled health personnel – simply knowing the total number or the rates of those services per x inhabitants may not be enough to assess whether they are sufficiently available to adequately cover the population. One simple tool to assess availability of services is an objective benchmark. Such benchmarks are typically based on empirical evidence of the effectiveness of certain levels of input on a desired education or health outcome. Examples of these benchmarks include:
• TheEducationForAllFastTrackInitiative,aglobalpartnershiplaunchedbytheWorldBanktohelplow-income countries meet the education MDGs, which sets the following benchmarks: one trained teacher for every 40 primary school-age children, and between 850 and 1,000 annual instructional hours for pupil.37
• TheguidelinesdevelopedbyWHO,UNICEFandUNFPAtomonitortheavailabilityanduseofobstetricser-vices consider that for every 500,000 people there should be at least four basic emergency care facilities and at least one comprehensive emergency facility.38
• TheJointLearningInitiative,anenterpriseengagingmorethan100globalhealthleadersontheeffectsofHIV on children, suggests that a density of 2.5 workers per 1,000 may be considered a threshold necessary to attain adequate coverage of essential health interventions and core health services.
In addition to these internationally accepted benchmarks, the levels of goods and services in the country under assess-ment can be compared with those of similar countries (i.e., countries in the same region and/or with a similar level of income). For instance, if the focus country has fewer hospital beds per 1,000 people, a lower proportion of people with access to an improved water source, or a higher pupil-teacher ratio than similar countries, this suggests that these levels are insufficient given its level of development.
35 These aspects largely correspond to the essential attributes of the rights to education and health, as set out by the UN Committee on Economic, Social and Cultural Rights, the UN expert body responsible for monitoring compliance with the International Covenant on Economic, Social and Cultural Rights (see its General Comment 13 (the right to education). 8 Dec 1999, par. 6, and idem, General Comment 14, par. 12.)36 Mattes, 200837 EFA FTI, 200538 WHO, UNICEF and UNFPA 1997

30 Assessing governAnce to Achieve heAlth And educAtion goAls
Another way to assess the availability of health services in particular is to generate a patient flow (or pathway) diagram. A patient flow diagram is a kind of flow chart that tracks the steps that are followed – such as diagnostic testing, medi-cal care, counselling, and support services – when a patient accesses a service for a particular problem. An example of a flow diagram for HIV services in an effective system appears in Figure 15. When a system malfunctions, the flow diagram can be compared to those in other facilities or countries, allowing gaps to be readily identified.
Figure 15: Patient flow diagram for HIV testing and case management department
Assessing physical accessibility of servicesQuantitative tools can be used to assess inequalities in the physical accessibility of essential services to various sectors of a population. For this purpose, it is necessary to collect and analyse data both of the population distribution and of the relevant service. Since physical access depends partly on the quality of road infrastructure and transport networks, estimates of physical access using travel time rather than distance are considered more accurate. For example, the map below shows the travel time required of reproductive age women to reach health centres that offer reproductive ser-vices in a region of Madagascar.
Source: ‘Growing Innovative Care’, US Department of Health and Human Services http://hab.hrsa.gov/publications/growinginnovative/chapter2.htm
SYHC HIV TestingClient
Barriers:Language, Stigma,Lack of knowledge
HIV NegativeHIV Positive HIV Testing
Primary Medical CareReferral Referral
Disclosure Disclosure
Education
Ineligible for CaseManagement
Case Management Assessment
Eligible for CaseManagement
LinkageLinkage
Peer AdvocacyCase Management
Reinforcing and Interrelated Services
ADAP Mental Health Support Services Social Services
IndividualCounseling
and Support Groups
Art Therapy,Nutrition, Cooking
Classes, Yoga
Legal, Housing,Transportation,
Food Bank, Child Care

31 Assessing governAnce to Achieve heAlth And educAtion goAls
Map 1: Travel time to health service centres for women of reproductive age, Madagascar
Source: Deichmann 1999
Such data can highlight inequalities in coverage across regions. A study of the determinants of parasitic infections in school-age children in Western Ivory Coast, for instance, showed that schoolchildren from poorer households lived significantly further from healthcare facilities than schoolchildren from richer households.39 The Indian National Popula-tion Stabilization Fund (Jansankhya Sthirata Kosh) has mapped 450 districts in India through a unique amalgamation of GIS maps and census data, giving a picture of each district, its sub-divisions and the population of every village along with the distance to the health facility.40
Assessing affordability of servicesCost is perhaps the most immediate obstacle facing people who cannot access basic services. Table 1, which is based on data from country demographic and health surveys, shows the proportion of children that dropped out of school in a number of African countries, because their parents could not afford to pay the required formal and informal fees (e.g., fees for entrance, books, uniforms).
39 Raso et al., 200540 See www.jsk.gov.in/population_density.asp

32 Assessing governAnce to Achieve heAlth And educAtion goAls
Table 1: Reasons for dropping out of primary school, selected African countries, various years
Country Survey year Could not pay school (%)
Cameroon 1998 45.4
Kenya 1998 47.6
Nigeria 1999 33.9
Uganda 1995 75.3
Zambia 1996 43.7
Zimbabwe 1994 63
Source: Based on Measure DHS (undated)
Another standard indicator to assess affordability of services – which can also be obtained from household surveys – is the proportion of a household’s out-of-pocket payments that goes towards these services. If a survey collects infor-mation on the socio-economic status of respondents, it is also possible to determine how much money the poor pay compared to the rich.
A particular type of health cost that can have a critical effect on poverty is ‘catastrophic medical expenses’, i.e., health costs that drive people into poverty. To assess this phenomenon, it is again possible to use data from household surveys. For instance, a cross-country analysis from 59 countries assessed the extent to which people suffer from catastrophic health expenditure (defined in this study as cases in which a “household’s financial contributions to the health system exceed 40 percent of income remaining after subsistence needs have been met”). The study used this information to assess fairness in financing of health systems across countries.41
Some programmes are designed to improve affordability. They can be assessed by comparing the number of people covered by the programme with the number of people who could benefit from it. For example, in a scholarship pro-gramme meant to offset the costs of education, the number of poor families who previously did not send their children to school because of those costs can be compared to the number reached by the programme.
Another simple tool is to compare a country with similar countries to show whether the focus country is spending suf-ficient resources on a programme. This is done through a double comparison. First the resources a country devotes to a specific programme per capita are compared with those spent on similar programmes in other comparable countries in the same region. Second, this is contrasted with the level of deprivation that these programmes are intended to address.
For instance, Figure 16 shows how much money per student Guatemala devotes to its existing school meals programme, compared with similar programmes in other countries in the region. These data are then contrasted with the magnitude of one of the problems that this programme purportedly attempted to overcome, namely the reduction of child mal-nutrition. The comparisons suggest that Guatemala’s financial commitment to this programme is incommensurate with the enormity of the deprivations.
41 Xu et al., 2003

33 Assessing governAnce to Achieve heAlth And educAtion goAls
Figure 16: Food programme money spent annually per student and % of underweight children
Source: Felner, 2008
Assessing the quality of servicesA major obstacle to achieving national and international health and education targets is the poor quality of health and education services in many countries. Factors that affecting this include the physical conditions of schools and health facilities, availability of essential inputs (such as textbooks and medicines), the competence of teachers and health care providers, and their motivation to apply their knowledge. From a human rights perspective, another important aspect of quality of services, one that often receives insufficient attention, is the responsiveness of service providers and their level of adaptability to the specific needs of various segments of the population (i.e., gender sensitivity and cultural adequacy of services). Responsiveness is considered an essential element of the right to health and education.
Virtually all of these aspects of service quality are closely linked to governance issues. For instance, facilities may be in disrepair as a result of inefficient allocation of resources to a sector or failure to reach remote districts. Meagre ef-forts by teachers and health workers may be the result of inadequate workers’ incentives and/or poor accountability mechanisms.
Given the multidimensional nature of service quality, there is usually a need to apply several tools to comprehensively assess the quality of education and health care, or to select tools according to the specific aspects of service quality that are of interest. Following is a short description of a number of tools that are used to assess key aspects of education and health care quality.
Survey of service users and household surveys
Quality of services is often assessed through the perceptions of service users. One type of survey focuses on actual users, for which data is often collected through exit polls. But by focusing exclusively on actual users, such surveys do not reach non-users, whose perceptions may in fact affect their non-utilization of these services. To obtain a more
Food programme US$ spent annually per student
% o
f pre
-pri
mar
y an
d s
tud
ents
un
der
wei
gh
t
10 20 30 40 50 60 70 80 90 100
50
45
40
35
30
25
20
15
10
5
0
Bolivia Ecuador
Peru
Colombia
Costa Rica
Honduras
Nicaragua
Guatemala
Brazil
Panama
Uruguay
Argentina
Mexico
Venezuela
Chile

34 Assessing governAnce to Achieve heAlth And educAtion goAls
representative picture of both actual and potential service users, it is necessary to use household surveys.42 These can shed light on the constraints people face in accessing services, on their views of service quality and on the specific as-pects of these services that do not meet their needs and expectations.
Perception surveys can also provide useful information on the specific obstacles – in terms of service availability, acces-sibility affordability and quality – that occur most frequently from a user’s perspective. For instance, the Afrobarometer, a comparative series of national public attitude surveys in Africa, asked whether respondents had encountered any of seven common problems with their local public schools during the preceding 12 months.
Figure 17: Experience with education services, specific problems encountered, 18 African countries (2005)
Source: Bratton, 2007
Despite their many advantages, perception surveys have their limitations as a tool to assess quality of services. This is because perceptions are based on expectations of government performance. Such expectations may vary across in-come groups, education levels or place of residence (urban/rural), and can therefore giving misleading findings.43
Facility surveys
Facility surveys are commonly used to assess the physical conditions of the service facilities and the availability of es-sential inputs to provide the necessary services. Some facility surveys collect data only on basic infrastructure (such as
42 Lindelow and Wagstaff, 200843 McGee and Gaventa, 2010
MeanDesmand for bribes
Fees too expensive
Poor teaching
Abscent teachers
Substandard facilitits
Shortage of textbooks
Overcrowded classroom
100
90
80
70
60 57 56 5451 49
46
26
4850
40
30
20
10
0
Percentage encountering this problem* Mean percentage encountering a problem
“Have you encountered any of these problems with your local public schools during the past 12 months?
*Excludes those who say they don’t know or have no experience with a public school.

35 Assessing governAnce to Achieve heAlth And educAtion goAls
types of building, and availability of water and toilets). For instance, a school infrastructure survey conducted by the Ministry of Education in Guatemala in 2005 found that only 14.5 percent of public sector schools had the basic facilities necessary for teaching and learning, namely drinking water, electricity, classrooms in a decent condition, an adequate number of toilets (less than 35 students per toilet) and enough space (at least 2.5 square metres per student).44 Other surveys are much more comprehensive, collecting data not only on the characteristics of the facilities infrastructure, but also on the number and type of staff, availability of educational or medical supplies (e.g., textbooks, drugs and vaccines) and generic supplies.
Assessing the competence of service providers
Although the physical conditions of service facilities and the availability of inputs, such as books, medicines and vac-cines, are essential for service quality, they are obviously not sufficient to guarantee it. A study of health quality in Kenya found that despite the wide availability of contraceptive services, drugs and materials, compliance with infection control procedures, including the sterilization of equipment and the sterilization of needles, was poor.45 An Assessment of the quality of education or health care, therefore, requires an assessment of the content and form of teaching or the quality of diagnosis and treatment that doctors provide to patients.
The simplest way to assess the competence of service providers is to look at basic elements related to the formal train-ing of service providers. Some possible measures include the length of nurse training, the proportion of primary school teachers who have completed full qualifications, or the proportion of secondary school teachers who completed ter-tiary studies. Figure 18 shows the percentage of births attended by skilled health personnel in different regions.
Figure 18: Disparities in access to skilled health care personnel
Source: UNIFEM, 2008
44 MINEDUC, 200645 Cited in Lindelow and Wagstaff, 2008
0 25 50 75 100
Percentage of total births attended by skilled health personnel, 2000/2006
% of births:
Sub-Saharan Africa
Middle East & North Africa
South Asia
East Asia & Paci�c
Latin America & Caribbean
CEE/CIS
Developed Regions
Lowest value in the region(1 or more countries)
Notes: The percentage of total births attended by skilled health personnel includes the number of births out of 100 that took place under the supervision of an attendant with training in maternal care and child delivery. The graph includes information on the regional range of value (from minimum to maximum) as well as regional weighted average.
Average value in theregion (all countries of region)
Highest value in the region (1 or more countries)
6 44 99
63 84 100
14 47 97
19 90 100
26 91 100
83 97max: 100
95 100max: 100

36 Assessing governAnce to Achieve heAlth And educAtion goAls
Given that the quality of professional training can be very poor in many countries, formal training is often an inadequate indicator of the level of competence of service providers. To assess the competence of personnel more accurately, standardized assessments of frontline professionals can be used. For example, the first national systematic evaluation of primary teachers in Guatemala, carried out in 2004 using standardized tests, revealed that average teacher perfor-mance in reading was 58 out of 100 points, and in maths it was 26. The reported results suggest that many teachers do not have the basic reading skills necessary to fully benefit from any efforts in service training or professionalization.46
One method increasingly used to assess the clinical competence of health professionals involves ‘vignettes’. Clinical vignettes assess skills by presenting health professionals with hypothetical cases, in which the interviewer acts as a patient. The health worker is then requested to proceed exactly as s/he would under normal circumstances in handling such cases, asking questions about symptoms and performing the necessary examinations. The use of clinical vignettes in some studies in low-development countries has revealed that the basic essential procedures related to common diseases are often not used by health care providers.47
Assessing the effort of service providers
Another important aspect in the quality of education and health services is the effort made by providers in their job performance. Unexpected on-site visits to schools or health facilities are a simple way to document visible lack of effort, such as idleness of service providers (common in some countries). For instance, an assessment based on unannounced visits to a nationally representative sample of government primary schools in rural India found that only about half of educators were actually teaching.48
In the health sector, efforts made by health care providers can be assessed through direct observation by medically qualified professionals of the treatment of patients by health care providers. Studies using this method in a number of countries have revealed systematic differences in the efforts of health care workers, according to (among others) the incentives provided to the health workers and the level of monitoring.49
46 Rubio and Salanic, 200547 “In India, where close to 500,000 children die every year of diarrhoea, only 25 percent of providers in the richest state, Delhi, asked about blood/mucous in the stool, 49 percent asked whether the child has a fever, and 7 percent checked for a depression in the skull fontanel. These essential questions and examinations allow the provider to differentiate viral from bacterial causes and to assess the degree of dehydration—thus, whether the child needs immediate hospitalization. In Tanzania, these numbers are only slightly better.” (Das et al., 2008)48 Kremer et al., 200549 Das et al., 2008

37 Assessing governAnce to Achieve heAlth And educAtion goAls
2.B. IDENTIFyING POLICy FAILURES IN TACkLING OBSTACLES IN THE UTILIzATION OF ESSENTIAL SERvICES (DEMAND-SIDE FACTORS)
Selected assessment questions for identifying policy failures in tackling obstacles in the utilization of essential services (demand-side factors)
Question Data collection Application
How many potential beneficiaries have not used health/education services due to cost?
Household surveys To assess the extent to which cost inhibits access to services
How do groups of different cultural back-grounds compare in their use of health/education services?
Household surveys To assess cultural barriers to health/educa-tion without asking directly whether these prevent access
To what extent do tradition and social norms restrict women’s empowerment?
Social Institutions and Gender Index50 To assess whether restrictions may result in disparities in access to education/health
Several of the Right to Education project’s indicators on the “acceptability” of education services in relation with culture, religion, language, gender and other factors are relevant to the identification of demand-side barriers to education – see www.right-to-education.org.
50
To fully understand barriers in access to health and education, monitoring of state policy efforts must go beyond the adequacy of the supply factors. A complete governance assessment should also include the extent to which a state has adequate policies and programmes in place to address the demand factors that may prevent people from using essen-tial education and health services, commonly income poverty and cultural practices.
Most prominently, income poverty is a critical factor in the demand for education and health services. Income may determine whether a household chooses to pay for medical services or send its children to school. For example, poor households may not be able to pay both school costs – including the direct costs of attending school, such as uniforms, books, school supplies and transportation, and the opportunity cost of sending children to school rather than to work – and other basic needs. Income poverty is often the primary reason why children fail to enrol or end up abandon-ing school in many poor countries. Similarly, high costs also tend to be a factor in determining the demand for health services.51
To assess whether low income is inhibiting access to services, household surveys can ask whether people access basic services, and the reasons why if they do not. If it is not appropriate to ask directly whether money is a factor in the deci-sion, respondents can be asked for a list of their major expenses, which could indicate where they are spending their money if not on basic services.
The effects of low income go beyond limited ability to pay for healthcare and education. For example, income poverty both increases exposure and reduces resistance to disease. Poor people cannot afford clean water and sanitation, or non-polluting heating and cooking fuels, thereby increasing levels of exposure to unsanitary conditions. They are also likely to be malnourished, thereby reducing their resistance to sickness. All these reduce the likelihood that a child will attend school. At the same time, income poverty is typically associated with malnutrition and poor housing conditions, both of which generally inhibit the ability of children to learn. So it is not only relevant to find out whether families send their children to school, but also to learn about the environment that these children live in, including any evidence of harmful environmental conditions, access to clean water and sanitation, and rates of malnutrition in the region.
50 http://genderindex.org/51 Wagstaff et al., 2004

38 Assessing governAnce to Achieve heAlth And educAtion goAls
In many countries, cultural beliefs and traditional practices can also be strong barriers that determine who demands and uses health and educational services. This is particularly notable with culturally-defined roles between males and females. For instance, girls’ engagement in household chores and care of family members adversely affects their school participation. Similarly, concerns such as a school environment perceived as unsafe, son preference, or lack of female teachers that can serve as role models are all factors that influence household decisions on whether to send their girls to school. Cultural barriers may also prevent women from using health care services if health care providers are male, or because women have limited mobility. Similarly, son preference often means that households do not invest in health-care for girls and women.
For a discussion of the government’s role in creating or sustaining discrimination by failing to address discriminatory practices, see section 3B in Chapter 3.

39 Assessing governAnce to Achieve heAlth And educAtion goAls
CHAPTER 3
ASSESSING GOvERNANCE DEFICITS
Governance and barriers to social servicesGovernance problems are often a critical reason why people face multiple barriers to social services. For instance, a country may have:
• Insufficientavailabilityofprimaryschoolsorbasichealthfacilitiesinruralareas,becausemoststatere-sources for education and health are diverted to universities or highly specialized hospitals in the coun-try’s capital;52
• Poorqualitymedicalcareorteachingduetolackofmotivationbyserviceproviders,whichinturnmaybe the result of poor working conditions and weak accountability mechanisms;
• Teachers,doctorsornurseswhoarenotmonitoredorsanctionedfordiscriminatingagainstmembersof minority communities, denying or failing to provide adequate access to basic health or education services;53
• Lackofbasicmedicinesinhospitalsormissingtextbooksinschoolsbecauseofcorruption;and• Failuretoremedyentrenchedsocialinstitutionsthatdiscriminateagainstwomenandlimittheiraccess
to social services. These may include discrimination against girls in intra-household allocations related to food and health care, restriction of women’s mobility that affects their access to education or health services, or lack of opportunities for women in the labour force, which renders girls’ returns on education lower than boys’.54
52 See e.g., Mehrotra et al., 199653 See e.g., Amnesty International, 2003; and Amnesty International 2004 54 See World Bank, 2005a
1. Shortfalls in health and Education
2. Barriers to social services
3. Governance deficits
1a 1b
2a 2b
3a 3b
Effect
Cause
Methodologicalsteps
E growthwithout HD
Disparities
Supply-side barriers Demand-side barriers
Institutional capacity Patters of power and interests
3-step assessment framework

40 Assessing governAnce to Achieve heAlth And educAtion goAls
The concept of governance encompasses a broad range of issues, and this chapter does not attempt to cover all aspects of governance assessment. Rather, it focuses selectively on those that are especially relevant to basic health and edu-cation targets, paying particular attention to issues of equity and inclusiveness, two interrelated dimensions of good governance that are crucial from a human rights perspective. As UNESCO rightly points out, unlike the wealthy, who can opt for private provision, poor families depend on governments to deliver education services [as well as health]. When those services are of poor quality, inaccessible or unaffordable, it is the poor who bear the brunt.55
This chapter has two main sections, namely institutional capacity and patterns of power and interests.
55 UNESCO, 2009

41 Assessing governAnce to Achieve heAlth And educAtion goAls
3.A. INSTITUTIONAL CAPACITy
Governance deficits in terms of institutional capacity are those areas in which public institutions do not have the gov-ernance capacity to properly provide services. It covers three overarching dimensions of governance: political will, ac-countability and state capacity.56 For each of these dimensions, this chapter briefly describes various governance issues that typically have an impact on the equal access to quality education and health services. It also sets out a series of tools used to assess each of these issues and provides examples of actual use of these tools.57
Political will Selected assessment questions on political will
Question Data collection Application
How many people in the government or other leadership positions are advocating for reforms?
Review of government documents and parliamentary transcripts, interviews with political leaders and civil society
To assess whether policy champions are present
How often do national political leaders publicly express sustained concern for health/education deficiencies?
Review of political speeches, websites and other documentation; interviews with political leaders, civil society
To assess the public commitment of politi-cal leaders to health/education
Does the administration regularly collect information about education/health inputs (e.g., percentage of schools in disrepair, rates of vaccination) and outcomes (e.g., net enrollment, number of dropouts, child or maternal mortality rates) and publish regular reports with this information? Is the information disaggregated by sub-national units?
Interview with government representa-tives, civil society, journalists, etc.; review of government representative documenta-tion and websites
To assess whether political leaders provide transparent information and are interested in subgroups of the population
Has the government undertaken any in-depth analysis of the underlying causes of education/health deficiencies?
Interviews with government representa-tives, review of official documentation
To assess whether political leaders collect information that can be used to address problems effectively
Are key policies on health/education adopted after adequate consultation with all interested parties (including underrep-resented groups)?
Interviews with government representa-tives, civil society
To assess whether there is an inclusive policymaking process
Have civil society groups experienced any retaliation or intimidation in response to health/education initiatives?
Interviews with civil society To assess whether policymakers allow input from civil society
How many NGOs are active at the local level in the health/education sector?
Interviews with civil society, review of websites and press coverage
To assess whether civil society is active in the area of health/education
Do health/education officials regularly re-spond to inquiries from civil society actors on services and programmes, including visits?
Interviews with government representa-tives, civil society
To assess whether officials enable civil society monitoring
56 The framework of these three dimensions is taken from DFID (DFID, 2006a; and DFID, 2006b), although the specific aspects covered here under each of these dimensions is some-what different. 57 An alternate approach could be to draw more on UNDP’s model for capacity assessments, for example by unpacking institutional capacity along the agreed four core issues (institu-tional arrangements, leadership, knowledge and accountability) and the three points of entry (enabling environment, organizational, individual).
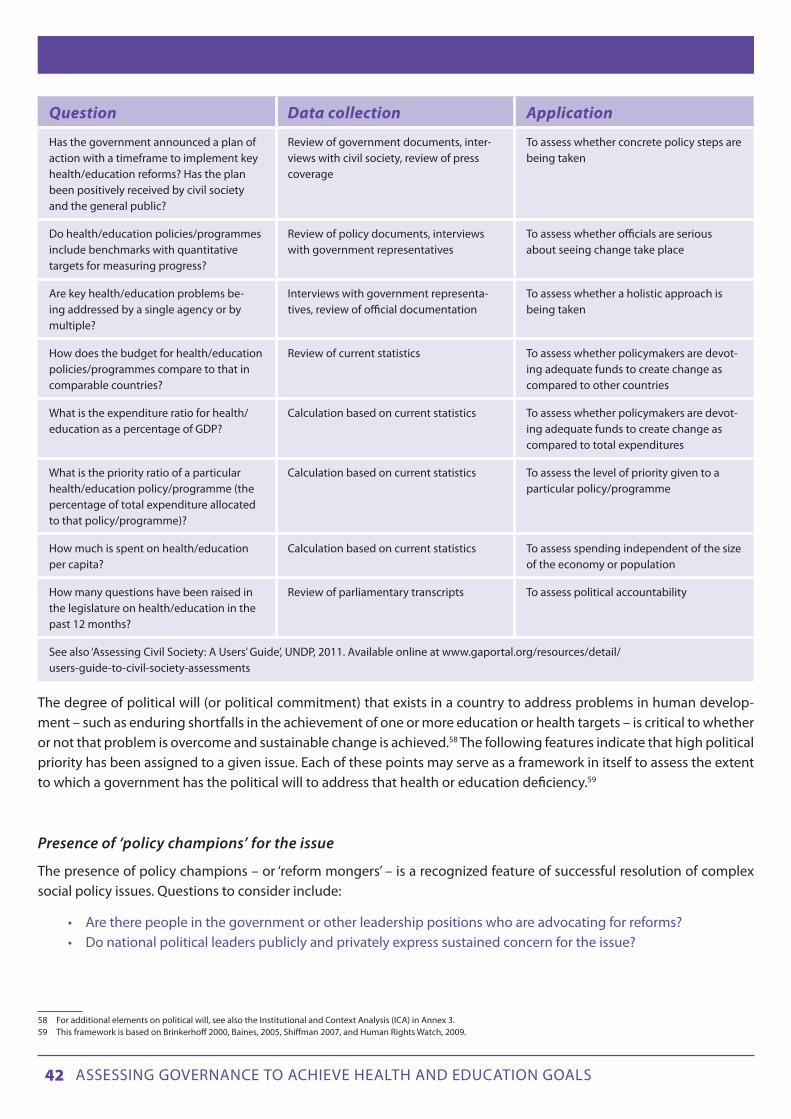
42 Assessing governAnce to Achieve heAlth And educAtion goAls
Question Data collection Application
Has the government announced a plan of action with a timeframe to implement key health/education reforms? Has the plan been positively received by civil society and the general public?
Review of government documents, inter-views with civil society, review of press coverage
To assess whether concrete policy steps are being taken
Do health/education policies/programmes include benchmarks with quantitative targets for measuring progress?
Review of policy documents, interviews with government representatives
To assess whether officials are serious about seeing change take place
Are key health/education problems be-ing addressed by a single agency or by multiple?
Interviews with government representa-tives, review of official documentation
To assess whether a holistic approach is being taken
How does the budget for health/education policies/programmes compare to that in comparable countries?
Review of current statistics To assess whether policymakers are devot-ing adequate funds to create change as compared to other countries
What is the expenditure ratio for health/education as a percentage of GDP?
Calculation based on current statistics To assess whether policymakers are devot-ing adequate funds to create change as compared to total expenditures
What is the priority ratio of a particular health/education policy/programme (the percentage of total expenditure allocated to that policy/programme)?
Calculation based on current statistics To assess the level of priority given to a particular policy/programme
How much is spent on health/education per capita?
Calculation based on current statistics To assess spending independent of the size of the economy or population
How many questions have been raised in the legislature on health/education in the past 12 months?
Review of parliamentary transcripts To assess political accountability
See also ‘Assessing Civil Society: A Users’ Guide’, UNDP, 2011. Available online at www.gaportal.org/resources/detail/users-guide-to-civil-society-assessments
The degree of political will (or political commitment) that exists in a country to address problems in human develop-ment – such as enduring shortfalls in the achievement of one or more education or health targets – is critical to whether or not that problem is overcome and sustainable change is achieved.58 The following features indicate that high political priority has been assigned to a given issue. Each of these points may serve as a framework in itself to assess the extent to which a government has the political will to address that health or education deficiency.59
Presence of ‘policy champions’ for the issue
The presence of policy champions – or ‘reform mongers’ – is a recognized feature of successful resolution of complex social policy issues. Questions to consider include:
• Aretherepeopleinthegovernmentorotherleadershippositionswhoareadvocatingforreforms?• Donationalpoliticalleaderspubliclyandprivatelyexpresssustainedconcernfortheissue?
58 For additional elements on political will, see also the Institutional and Context Analysis (ICA) in Annex 3. 59 This framework is based on Brinkerhoff 2000, Baines, 2005, Shiffman 2007, and Human Rights Watch, 2009.

43 Assessing governAnce to Achieve heAlth And educAtion goAls
Demand for information from political leaders
A government that publicly expresses concern for an issue, but fails to collect the necessary evidence about it and ana-lyse its multiple causes, demonstrates shallow willingness to actually bring change. For education, information should be collected on issues such as student enrolment rates, student retention rates, student-teacher ratios, and student achievement (through standardized tests). For health, important information includes child and maternal mortality rates, vaccination rates, number of in-patient beds, and malnutrition.
Moreover, the extent to which the data and indicators used by ministries in monitoring and evaluation are gender-sen-sitive and pro-poor should be considered.60 Disaggregated data by categories such as gender, socio-economic status, geographic area (rural/urban), and ethnicity is crucial not only to track inequalities in education and health outcomes, but also to understand the extent to which those inequalities are related to socio-economic conditions or various forms of discrimination.
Mobilization of support
The willingness of a government to mobilize support to adequately address an issue is often crucial to the success of any major policy reform. Questions to consider include:
• Hasthegovernmentdevelopedaparticipatorystrategythatincorporatestheinterestsofimportantstakeholders?
• Areleadersmusteringadequatesupporttoovercomeresistancefromthosestakeholderswhoseinter-ests are most threatened by particular reforms? Or, conversely, do authorities actively discourage the free functioning of civil society?
The active participation of ordinary citizens in the design, implementation and monitoring of development is crucial to achieving human development. Civil society organizations (CSOs) play a key role in enhancing citizens’ access to essen-tial public information, empowering disadvantaged and marginalized groups to actively participate in policy-making and ensure the relevance of social services to people’s needs. They can also play an important ‘watchdog’ role in moni-toring and evaluating government policies and programmes, holding politicians and service providers to account for the delivery of good quality social services in an equitable manner.
There are many aspects of civic participation in policy-making that can be assessed. Broadly, they either cover the con-ditions for government protection and promotion of independent civil society in a country, or the capacities of civil society to hold government agencies accountable.
The first category includes an evaluation of the extent to which a state promotes the laws, regulations, governance and cultural norms that are needed to create a conducive environment for civic engagement. For instance, reviewing the relevant legal framework, an assessment of accountability in the health sector in Mongolia carried out by UNDP found that the Law of Mongolia on Health explicitly supports the participation of NGOs in health protection and promotion.61
In another example, the Government of Gambia developed a community score card mechanism to increase civic par-ticipation and improve service delivery. Nearly 3,500 stakeholders participated in an exercise to evaluate the health and education sectors. Activities included comparisons of expected amenities with actual services provided, self-evaluation by service providers, identification of failures inhibiting quality performance, and performance score cards on the ade-quacy of services in health and education facilities. While score cards have been used in other circumstances (see ‘Social Accountability’, below), this is a rare example of a government-initiated participatory exercise to mobilize broad-based
60 See UNDP, 2006b; and UNDP, 2009a61 De Jaegere and Finley, 2009

44 Assessing governAnce to Achieve heAlth And educAtion goAls
support for reform.62
Several selected questions appear at the top of this section that cover both categories of civic participation assessment. The UNDP publication ‘Assessing Civil Society: A Users’ Guide’, is useful for identifying many other comprehensive meth-ods that are available.
Concrete policy steps
As with any other public policy issue, the real test of whether a government is genuinely committed to adequately address a shortfall in health or education is the extent to which it is ready to back up its promises with concrete policy steps that are commensurate with the severity of the problem. For example, has the government announced a plan of action with a specified timeframe to implement compulsory free primary education for all (or for health, a national policy on child health and nutrition)? 63 Has the plan/policy been positively received by civil society and the general public? It is also interesting to consider whether the issue is being addressed exclusively by one government agency (the ministry of education or the ministry of health), or through a cross-sector approach, recognizing all its dimensions and layers that could help solve the problem.
Allocating resources commensurate with the problem’s gravity64
The allocation of resources is often the final stumbling block to instigating change, and is a clear demonstration of political will. A simple method to assess whether the government has allocated sufficient budget resources to address a health or education deficiency is to compare how much the government is spending per person on the relevant programme, to the amount spent by similar countries. For instance, the study displayed in Figure 16 in the previous chapter found that Guatemala was spending very little money on a school meals programme (which had a stated goal of reducing child malnutrition) compared to similar programmes elsewhere in the region. This was despite the fact that child malnutrition was much worse in Guatemala than in these other countries.
Analysing the magnitude, composition and distribution of resources allocated to the educational or health systems is another way to assess if a state is committed to making progress in these sectors. An in-depth budget analysis is optimal for this purpose. But for assessors that may not have the technical skills, time or resources required to undertake com-plex budget analysis, there are simpler quantitative tools, such as the expenditure ratio. Using the example of primary education, the primary education expenditure ratio is the expenditure on primary education as a percentage of GDP. This ratio is based on three other ratios, as shown in Figure 19: the public expenditure ratio, the education allocation ratio and the primary education priority ratio.
62 See World Bank, 2005b63 For instance, around the time that India’s Prime Minister publicly stated the need to improve nutrition in the country, he also announced the establishment of the Prime Minister’s National Council on India’s Nutrition Challenges (Biswas and Verma 2009). Similarly, in several countries in Latin America, governments set up a national education commissions as a way to promote key education reforms (Grindle, 2004).64 This section is based on Felner, 2008

45 Assessing governAnce to Achieve heAlth And educAtion goAls
Figure 19: Expenditure ratios
The public expenditure ratio is the percentage of national income (using GDP as a proxy) that goes into public expendi-ture. It reflects the size of a government’s budget in relation to the size of its economy and, further, the ‘size of the pie’ of resources a government has at its disposal to undertake all its functions.
The education allocation ratio refers to the percentage of public expenditure allocated to education. It reflects the rela-tive priority given to education among competing budgetary needs. The primary education priority ratio, which refers to the percentage of the total education expenditure allocated to primary education, reflects priorities within a given educational system. Countries that have already achieved high standards of primary education may be justified in pri-oritizing higher education levels. However, in countries where a significant proportion of the population is illiterate or many children are deprived of the most basic forms of education, a low primary education priority ratio would be at odds with a genuine commitment to achieving this particular MDG. The combination of a significant proportion of the poorest population deprived of primary education or access to basic health, with regressive spending patterns that disproportionately benefit more affluent groups, is quite common in developing countries.
The expenditure ratio devoted to a basic social service, such as primary education, is determined by a set of policy deci-sions, ranging from fiscal policies to the distribution of resources within a specific social sector. It is possible to deter-mine if ratio levels in a given country are relatively high or low by comparing them with a reference point or objective benchmark. Specifically, ratio levels can be compared with:
• Statecommitments,suchastheconstitution,nationalplans,orpoliticalagreements.Forinstance,inthe1996 Guatemala Peace Agreements, the Government of Guatemala committed itself to ‘step up public spending on education as a proportion of gross domestic product by at least 50 percent over its 1995 level’.65 Similarly, in the 2001 Abuja Declaration on HIV/AIDS, Tuberculosis, and Other Related Infec-tious Diseases, African leaders pledged to increase health spending to 15 percent of their government budgets.
65 Presidential Peace Commission, 1996
Source: Felner, 2009, based on UNDP, 1991
Public Expenditure RatioGovernment Share of GDP
Education Allocation RatioEducation Share
Of Government Spending
Primary EducationPriority Ratio
Primary EducationShare of Education
Spending
Primary EducationExpenditure RatioPrimary Education
Share of GDP
Gross domestic product (GDP) Public spending on education
Public spending on Primary educationPublic expenditure

46 Assessing governAnce to Achieve heAlth And educAtion goAls
• Thelevelofthesameratioinothercountriesinthesameregion.Forexample,ifacountrywithalowlevel of primary school completion rates spends less than half the average of all countries in the same region, that would call into question the government’s commitment to progress on primary education.
• Asuggestedstandardbasedonempiricalevidence.Forinstance,whenoriginallyproposingitssetofra-tios as a means of analysing public spending from a human development perspective, UNDP suggested ‘ideal’ levels for these ratios: “keeping the public expenditure ratio moderate (around 25 percent), while allocating much of this to the social sectors (more than 40 percent) and focusing on the social priority areas (giving them more than 50 percent).”66
It is important to remember that the resources necessary for achieving health or education goals are not limited to those devoted to the relevant sectoral ministry. Evidence shows, for example, that the impact of public health expendi-tures on health outcomes may be little or none when complementary services such as roads or transportation are not in place.67 Therefore, assessors should determine (based on existing studies and interviews with experts in the sector) if some obstacles to the achievement of social sector goals may be outside of the specific sectoral ministry. If so, it may be necessary to analyse the level of expenditures in other sectors (such as roads or transportation).
An analysis of expenditure ratios should be complemented by an analysis of expenditure per capita on health or educa-tion. This is crucial, because the amount a state spends per capita on any sector depends not only on factors related to government policies and priorities (i.e., those reflected in the ratios described above), but also on the level of economic growth (or contraction) and the size of the population – two factors over which any government has, at best, only par-tial control. If the overall size of the economy increases, a government can devote more resources to social sectors like education, health or food security without necessarily allocating a bigger proportion of its economic resources to these sectors. As a study on the relationship between levels of economic development, health outcomes and health expendi-ture noted: “The most important source of increased health expenditure is economic growth. Even if the share of health spending in GDP remains constant, economic growth translates into more spending on health.”68
Accountability Selected assessment questions on accountability and transparency69
Question Data collection Application
Is the right to health/education recognized in domestic law? Does this law comply with international human rights standards?
Legal review, international sources (e.g., www2.ohchr.org/english/issues/educa-tion/rapporteur/index.htm, www.right-to-education.org, www2.ohchr.org/english/issues/health/right/, unesdoc.unesco.org/images/0015/001548/154861e.pdf, right-tomaternalhealth.org/
To assess judicial accountability as com-pared to international standards
How many legal cases have been brought against service providers compared to the number filed?
Legal review To assess whether the judiciary can hold public services accountable
66 UNDP, 199167 Bokhari et al., 200768 Preker, 200369 A deeper understanding of the political factors that may account for satisfactory answers to the questions below may be achieved through a political economy analysis of the health and education sectors. A political economy analysis, understood as an analysis of the interests driving or blocking change, can provide answers to why certain governance deficits persist in spite of official statements claiming commitment to reforms. By revealing the political, economic and social interests and incentives that promote policies aimed at improving health and education indicators, political economy analysis helps development practitioners understand how positive change can happen, where the obstacles lie, and how to address them. For more information on how to carry out a political economy analysis, please refer to Annex 3.

47 Assessing governAnce to Achieve heAlth And educAtion goAls
7071
70 INTOSAI, 197771 UN General Assembly, 1993
Question Data collection Application
Do citizens have access to the judicial sys-tem when their rights in health/education are violated?
Public opinion surveys To assess whether citizens know their rights and can use the legal system to protect them
Do key social programmes (e.g. cash trans-fer programmes) include formal account-ability mechanisms with clear complaint procedures and effective enforcement systems?
Review of government documents, inter-views with government representatives, civil society, beneficiaries
To assess administrative accountability in social programmes
How many service providers are covered by each supervisor?
Interviews/surveys of service providers, administrators
To assess the effectiveness of supervision
How many times per year do supervisors visit each facility?
Interviews/surveys of service providers, administrators
To assess the effectiveness of supervision
Are there clear and easily accessible complaint mechanisms to denounce any problem with service delivery?
Interviews with government representa-tives, service providers, surveys/focus groups with beneficiaries, interviews with civil society
To assess the adequacy of mechanisms of redress
Are details of complaints mechanisms published in local languages?
On-site visits, interviews with civil society and beneficiaries
To assess whether complaints mechanisms reach affected population groups
After a complaint is filed, how long does it take for the person responsible to respond?
Interviews with government representa-tives; household surveys, focus groups or interviews with beneficiaries; interviews with civil society
To assess whether complaints are ad-dressed within a reasonable amount of time
What is the number of complaints received in the last 12 months compared to the number of complaints investigated?
Interviews with government representatives
To assess whether complaints are investigated
What is the number of complaints investi-gated in the last 12 months compared to the number of cases that led to sanctions?
Interviews with government representatives
To assess whether complaints lead to sanctions
How do auditing procedures compare to the Lima Declaration of Guidelines on Auditing Precepts?70
Review of official documentation, inter-views with service providers, civil society
To assess effectiveness of audits for non-judicial administrative accountability
How do national human rights institutions compare to the Paris Principles relating to National Human Rights Institutions?71
Review of official documentation, inter-views with service providers, civil society
To assess effectiveness of human rights institutions for non-judicial administrative accountability
Are concrete policy recommendations regarding health/education deficiencies under consideration in the programme of any political party?
Review of campaign programmes of politi-cal parties
To assess whether health/education is prominent in electoral campaigns
Do citizens have access to information on the position and/or actions of elected rep-resentatives on health/education issues?
Review of budget and policy commit-ments, websites of elected representatives, etc.
To assess whether citizens can hold elected officials accountable for their positions/ac-tions on health/education

48 Assessing governAnce to Achieve heAlth And educAtion goAls
Question Data collection Application
What is the rate of political participation among disadvantaged groups (disaggre-gated by group)?
Review of voting statistics To assess whether disadvantaged groups in particular are holding elected officials accountable
Have any citizen-led assessments (e.g., report cards, budget analysis) been con-ducted in the health/education sectors?
Review of civil society websites, media; interviews with civil society
To assess the extent of social accountability
Is there access to health/education budgets?
Review of government websites, published information, public opinion surveys
To assess the extent of budget transparency
To what extent is the general public aware of health/education entitlements and how to claim them?
Public opinion surveys To assess transparency in service delivery
Accountability is the lynchpin of good governance. In numerous countries, many of the lasting problems in the delivery of education and health services – e.g., unequal access to those services, poor service quality, chronic absenteeism of frontline providers, endemic corruption – are related to weak accountability mechanisms.
There are several types of accountability within a governance system. This section covers political, judicial, administra-tive, electoral and social accountability as well as transparency.
Political accountability72
Political accountability refers to how government, elected representatives, and civil servants are held accountable by bodies of other elected representatives, whether at the national level (the parliament) or the local level (local assem-blies). It is both the right and the responsibility of a parliament to monitor the executive and hold it accountable for delivering quality services. For example, the number of parliamentary questions addressed to the minister of health or education can be compared in similar countries, or over time under different leaders. A study in India found that despite the fact that some 75 million children in the country are undernourished, only 3 percent of questions raised in parliament in the previous four years related to children.73 Depending on how many questions are raised, they can be grouped by subject matter. The number of questions raised by local assemblies can give additional information.
In an assessment of the effectiveness of a parliament to hold the executive accountable for the delivery of education or health services, it is important to consider the capacities of parliament, any corruption in the legislature, and the politi-cal context, all of which may affect the parliament’s oversight powers. It is also relevant to ask whether it is the parlia-ment or the executive that controls the budgets of the health and education systems.
Judicial Accountability
In more and more countries, the rights to education and health care are being enshrined in the constitution.74 In coun-tries where a right to education and/or health has been established, courts can play a key role in holding governments accountable for the provision of health care and education. The number of legal cases that have been brought under
72 For more elements on political accountability and how it is related to incentives and constraints, see Annex 3 on Institutional and Context Analysis (ICA). 73 Working Group on Children Under Six, referenced in Biswas and Verma, 200974 Gauri, 2004

49 Assessing governAnce to Achieve heAlth And educAtion goAls
these provisions can be one indicator of their effectiveness. At the same time, however, such provisions are in most cases relatively new and their limited use is not surprising.
Even without these provisions, access to health and education should be protected by the legal system. For example, how many legal cases have been brought against health workers or institutions compared to the number of complaints filed? If a survey has shown that there are high levels of corruption in the health sector, it may be interesting to con-sider the number of corruption cases that have been prosecuted in the sector. Brazil has seen far more cases filed in the health and education sectors than similar countries (Table 2).
Table 2: Number of individual and collective health and education cases filed in Brazil, India, South Africa, Indonesia and Nigeria
Health Education
Individual Collective Individual CollectiveBrazil 7,248 141 237 56
India 61 91 93 19
South Africa 3 8 2 9
Indonesia 3 4 0 5
Nigeria 9 3 12 3
Source: Brinks and Gauri, 2008
But it is important to bear in mind that the reasons behind these numbers are not limited to the effectiveness of courts at holding governments to account. They could also indicate that better investigation techniques have brought more cases to light, that more confidence in the system has led more people to report abuse, that more cases have been brought against certain political opponents, or other factors.
Public opinion surveys or other citizen consultation can be used to help determine if there is adequate information available on how to access the legal system and whether the justice system would be used in case of a problem. Ques-tions to be considered include:
• Whatareyourrightstohealthandeducationunderthelaw?• Doyouhaveaccesstolegalassistanceifyouexperienceaviolationoftheserights?• Haveyoueveraskedforlegalassistanceforanissuerelatedtohealth/education?Fromwhere?• Wasthisassistanceuseful?Whatwastheoutcome?
Administrative Accountability
Administrative accountability is another way to hold the public sector accountable. It includes two types of account-ability mechanisms: oversight mechanisms within a sectoral ministry, and non-judicial oversight institutions, such as a human rights commission, the supreme audit institution, or an anti-corruption agency.
Oversight mechanisms within a ministry of health or of education include monitoring, evaluation and complaint han-dling, which enable the sector to assess the availability, accessibility, acceptability and quality of its services, as well as their impact on the population. Here we highlight performance monitoring systems and complaint mechanisms.
Performance monitoring systems are methods that sectoral ministries (and others) use to track performance. In the ed-ucation sector, most countries have performance monitoring systems that operate through school visits and reporting.

50 Assessing governAnce to Achieve heAlth And educAtion goAls
Evidence shows, however, that these systems are often ineffective.75 In evaluating the extent to which this type of sys-tem is effective to hold service providers accountable for their performance, one should look, inter alia, at the following issues:
• Isthemonitoringsystemadequatelystaffed?• Dosupervisorsspendenoughtimeineachschoolinordertoprovideeffectiveevaluation?• Dothefindingsofmonitoringandevaluationhaveanimpactonpolicyreformandprogramme
implementation? • Towhatextentdosupervisorsseethemselvesasfulfillinganaccountabilitymechanismversussupport-
ing the interests of their staff?
Complaint mechanisms exist on paper in many education and health ministries. In evaluating the quality of these pro-cedures, assessors should examine potential problems with such mechanisms.
One such problem76 is poor access to grievance redress procedures. This may be due to lack of awareness by service users (patients in health facilities or parents and possibly children in schools) of the existence of complaint procedures. Therefore, an assessment can look at the extent to which service beneficiaries are aware of specific complaint proce-dures and the extent to which service providers publicize the existence of such procedures (e.g., placing a complaint box in a prominent area of a hospital). Language is another common barrier to complaint mechanisms, especially for indigenous peoples or members of an ethnic minority. The assessment of these procedures should consider whether complaints can be filed in a language other than the majority language. Finally, many people fear that making a com-plaint may lead to reprisals by service providers, especially in cases of corruption. Therefore, an assessment should examine whether there are effective guarantees to protect any person making a complaint against reprisal.
As well as poor access, complaint mechanisms can be weak, because of insufficient follow-through actions in response to complaints. Therefore, an assessment should consider whether official inquiries or other follow-up actions are taken after someone files a complaint, and whether those steps are carried out in a timely manner.
Non-judicial oversight institutions have been set up in most countries to exercise independent and external oversight of state agencies. These institutions include national human rights institutions, audit offices, and anti-corruption agen-cies. Many of these institutions monitor elected officials as well as civil servants.
One way to evaluate non-judicial oversight mechanisms is to conduct a review of complaints about the education and health services received by these institutions. Such complaints may come from, for example, ordinary citizens, staff working in the education and health sectors, and NGOs. The number of complaints filed in a given period (e.g., the pre-vious 12 months) would indicate the extent to which complaint mechanisms are being used. If the complaint forms that citizens fill out are sufficiently detailed, the assessment team might be able to analyse whether there are regions in the country that are filing relatively fewer complaints, which could lead to further investigation of the possible reasons for this discrepancy. By reviewing complaints, the assessment team can also learn what users see as the main problems in the delivery of education and health services. For instance, a mapping of the accountability mechanisms in the Mongo-lian health sector carried out by UNDP’s Regional Centre in Bangkok in 2009 found that most complaints received by the State Inspectorate of Health within the Specialized State Inspection Agency of Mongolia related to the interpersonal skills of doctors in their interaction with patients, the omission of urgent medical services in a timely manner, and the issue of extensive bureaucratic processes that result in patients waiting too long for diagnosis and treatment.77 A com-parison of the number of complaints received by the institution, the number investigated, the number substantiated by investigation and the number of sanctions for staff and/or redress for the citizens involved would demonstrate the extent to which the institution has effective enforcement powers.
75 De Grauwe, 200876 The description of these problems is based on Human Rights Watch, 2009.77 De Jaegere and Finley, 2009

51 Assessing governAnce to Achieve heAlth And educAtion goAls
To assess the extent to which non-judicial oversight institutions are effective in holding a government accountable for delivering education and health services, an assessment of responses from the relevant government agencies being investigated can be useful. For instance, the UNDP study on the Mongolian health sector found that the State Inspec-torate of Health received no formal responses to its annual report on investigations from the Minister of Health.78 Any governance assessment should also examine the extent to which non-judicial accountability mechanisms that have oversight powers over the education and/or health sectors meet minimum conditions to be able to function effectively, such as:
• completeindependenceofgovernment;• wide-ranginginvestigativepowers;• properresourcesandcost-freeservicetocomplainants;• accessibility,bothgeographically,throughlocaloffices,andelectronically;
reporting and accountability to parliament.79
Assessments of the effectiveness and independence of any specific non-judicial oversight institution can use any rel-evant international standards that may exist for that type of institution as a benchmark. For instance, the performance of a national audit agency can be assessed against the Lima Declaration of Guidelines on Auditing Precepts,80 which is intended to provide criteria to ensure the independence and effectiveness of government auditing. Similarly, when assessing the performance of a national human rights institution, the assessment team should take into account the Principles Relating to the Status and Functions of National Institutions for the Promotion and Protection of Human Rights81 – commonly known as the Paris Principles – which set out the minimum standards required by national human rights institutions to effectively fulfil their role.
Electoral Accountability
Electoral accountability refers to the use of elections as a means for voters to hold elected officials to account for the provision (or lack thereof ) of key services to their electorates.
In principle, electoral systems, which enable citizens to sanction governments for poor performance at the polls, should ensure that citizens are able to hold elected officials accountable for the provision of education and health services. In practice, the evidence shows that this is not often the case, and that the ability of the electorate to hold governments accountable for the delivery of education and health services is often hampered by socio-economic conditions, struc-tural weakness in the electoral systems, and political economy constraints. The difficulties of using the electoral system as an effective means of accountability are generally more pronounced among the poor and other marginalized groups.
When assessing electoral accountability in relation to health or education, assessors can examine a number of issues that impact the effectiveness of this form of accountability. These include:
a. Prominence of education or health issues in election campaigns. Education and health issues are often not promi-nent during election campaigns. This could partly be because elections are relatively infrequent and take place in relatively large districts and therefore these issues compete with many others for public attention. More importantly, in many countries, citizens vote for political parties with a slate of candidates, making it more difficult to determine how an elected individual will respond to a single issue. It is therefore interesting to consider how many times health or education are raised as issues during an election campaign.
78 idem 79 Based on Beetham, 200680 INTOSAI, 199781 UN General Assembly, 1993

52 Assessing governAnce to Achieve heAlth And educAtion goAls
b. Information among voters about politicians’ performance. Citizens are often not well informed about the quality of public services or who is responsible for improvements or deteriorations in those services. This problem is often more acute in countries or sectors that are going, or have gone, through a process of decentralization, which often creates confusion about the specific responsibilities of each layer of government in a sector. This may be evaluated by a review of publicly available information on the link between politicians and public services, e.g., through public statements of policy, budget review.
c. Political participation among the poor and other marginalized groups. The poor are often those most affected by a failure in health or education services, because they are the ones who cannot afford alternatives. They also often lack resources for lobbying and are less well connected than the elites and middle classes with decision-makers. Widespread illiteracy and lack of time often also inhibit political participation by the poor. An assessment of rates of political participation among the poor may indicate failures in electoral accountability to promote health and educa-tion. Such an assessment could be done through surveys of households or at polling places.
Social Accountability
Social accountability82 refers to actions taken by citizens and civil society organizations to hold government account-able for its performance, as well as efforts by the media and other actors to support those actions. This concern reflects the basic tenet that, as right-holders, poor people and other marginalized groups are not just passive beneficiaries of development, but active agents of development.
Citizens from around the world are undertaking a range of activities to promote vertical accountability in education and health, including social audits of frontline service providers, public hearings, public interest litigations, civil participa-tion in budget formulation and budget analysis. Through these and other initiatives, citizens are able to actively partici-pate in politics, expressing their needs and preferences and serving as watchdogs of state performance by demanding accountability.
Box 4: Citizen-led assessments in education and health – illustrative initiatives
Social Audits of School Programme in GuatemalaIn 2002, ASIES, a research and advocacy organization in Guatemala, launched a Grand National Campaign for Education (Gran Cam-paña por la Educación, or GCNE), working with a coalition of 77 NGOs from around the country. GCNE has since organized a number of community-focused surveys (which it calls social audits) to monitor the implementation of public primary school programmes, particu-larly those that provide free meals and textbooks.
The surveys, conducted in individual public schools, target principals, teachers, parents, and students on issues such as their awareness of the availability of free meals and textbooks, the adequacy of the budgets for these programmes, and their level of satisfaction with the programmes.
The surveys have uncovered startling findings that help explain the country’s lack of improvement in education. For example, one survey found that approximately 80 percent of principals were unaware of the free meal programme and that some 75 percent of schools did not receive textbooks for all students.Source: Rankumar, V. 2008 More information on GCNE: www.asies.org.gt/grancampa%C3%B1a/
82 See also UNDP, 2010f

53 Assessing governAnce to Achieve heAlth And educAtion goAls
Budget analysis of the health system in Mexico The use of budget analysis can be a powerful tool in CSOs’ efforts to hold governments accountable for their policy priorities and development programmes. Such analysis enables organizations to identify and challenge different types of leakages and failures in the budgeting process that prevent the allocation of adequate resources for the implementation of the MDGs.
For instance, Fundar, a Mexican centre for analysis and research, focused analysis on the health sector. Examining a gap between budgeted spending and actual spending, the study found that while the Ministries of Finance, Tourism, and Foreign Affairs each spent more during the course of the year than was allocated in the budget, this was not the case with the Ministry of Health. From this, Fundar was able to deduce that when extra resources became available, they were not allocated to the health programme. And comparing the budget for the health programme with other programmes outside the health sector, the Fundar study found that additional spending in the Ministries of Finance, Tourism, and Foreign Affairs was 2.3 times the total budget of a health care programme aimed at 10 million Mexicans in extreme poverty.
Fundar also examined the composition of the health budget. Mexico has two parallel health systems: the social security system that pro-vides health care to individuals who are legally employed and their families, and the public health system that provides health services to people who lack formal employment and are therefore not eligible for social security. Fundar compared the percentage of the total budget that goes to each of the two systems and found that although each of them roughly served half of the Mexican population, the social security system received nearly twice as much as the public health system. With a detailed budget analysis, Fundar was able to expose and challenge inequitable spending patterns in the Mexican health system.Source: Fundar et al., 2004
Citizens Report Cards – India and elsewhereCitizen Report Cards (CRCs) are participatory surveys that solicit user feedback on the performance of public services. They then ag-gregate this information in quantitative form and disseminate it in a format similar to a school report card according to the performance criteria of a given service, such as availability, access and quality. The findings present a collective measure of overall satisfaction with, and quality of, services over an array of indicators. CRCs go beyond a simple data collection exercise to exacting public accountability through media coverage and civil society advocacy. The tool was initially used in 1994 in Bangalore, India, by an independent NGO – the Public Affairs Centre. Today it is applied to numerous contexts in different regions.
From a methodological perspective, CRCs have sometimes been criticized for comparing different services or regions based on user per-ceptions. Perceptions are grounded in expectations of government performance, which may vary between different regions in the same country. A comparison of the results of citizen report card surveys in the Indian states of Bihar and Kerala illustrates the limitation of this tool in assessing the quality of service across regions. Although standards of education are much higher in Kerala, the school ratings ex-pressed by residents of Kerala were lower than those expressed by inhabitants of Bihar. This is because of differing expectations – Kerala residents, used to a more efficient state, expect more.
At the same time, CRCs are considered a powerful advocacy tool that enables ordinary citizens to credibly and collectively communicate to agencies on their performance and apply pressure for change. Comparison between agencies or locations attracts public attention and puts a sometimes unwelcome spotlight on the agencies. Sources: Based on World Bank 2003b; World Bank 2004a; World Bank 2004b; and Amin and Chaudhury, 2008
Transparency
Transparency, another key dimension of good governance, is the backbone of accountability. The efforts of civil soci-ety organizations and the media to hold governments accountable for the provision of quality education and health services can be significantly undermined without regular access to government documents, records and procedures.
The key policy instrument to ensure transparency in public affairs is freedom of information. To make education and health services accessible to everyone, citizens must be able to access information on the services they are entitled to, their costs (if any) and their rights vis-à-vis front line providers (including easily available information about complaint mechanisms). Various assessment tools can be used to measure the extent to which people are aware of their rights re-garding education and health. The assessment team can obtain relevant information through on-site visits to frontline facilities (for instance, to determine whether information on fees, and means to file a complaint are publicly displayed in hospital corridors). Household surveys – or, alternatively, a sample of interviews with service users – can also be used. In a survey conducted by Afrobarometer, 47 percent of respondents in Tanzania and 42.5 percent of respondents in

54 Assessing governAnce to Achieve heAlth And educAtion goAls
Malawi said they do have identity papers – without which people are often denied education and health services – be-cause they do not know how to obtain them.83
In 2010, Transparency International (TI) issued a report on anti-corruption and the MDGs that included correlations on transparency and other measures of accountability.84 The report compared transparency (using public access to information as a proxy) and literacy rates, integrity and maternal mortality, and accountability and quality of education (school management and performance). Based on the analysis, TI found significant correlations in all cases, concluding that lack of information is an impediment to achieving the MDGs.
8586
State capacity Selected assessment questions on state capacity
Question Data collection Application
Is the distribution of funds for health/education based on real and current needs rather than previous year allocations?
Comparison of current and previous year distribution of government budget across regions, districts or frontline service facilities
To assess whether the budget process sup-ports changes in policy priorities
What is the difference between allocated funds and actual expenditures in health/education?
Comparison of approved budget and executed budget
To assess whether budgets are executed as planned
Is there a gap between the quantity of health/education materials earmarked for service facilities and those that actually reach those facilities?
Public expenditure tracking surveys (PETS)85
To assess whether there is corruption or in-efficiency in allocation of goods/materials
Are audits of health/education carried out on a regular basis?
Interviews with government representa-tives, on-site visits and random review of accounts
To assess whether financial management is effective
What are the credentials required for ser-vice providers?
Interviews with service providers To assess whether requirements are ad-equate to provide good quality care
How do salaries in the health/education sector compare to those of similar civil ser-vice positions? Those in the private sector? Those in comparable countries?
Interviews/surveys of service providers, administrators; budget review
To assess whether service providers are paid a decent wage
Are performance reviews task-oriented, participative, and developmental?86
Interviews/surveys of service providers, administrators
To assess whether there are adequate performance reviews
What incentives exist to encourage quali-fied service providers to work in undesir-able locations?
Interviews with government representa-tives, service providers, civil society
To assess the likelihood that qualified service providers are reaching undesirable locations
What incentives exist to encourage people from disadvantaged groups to become frontline service providers?
Interviews with government representa-tives, service providers, civil society
To assess the likelihood that members of disadvantaged groups serve as frontline service providers
83 Afrobarometer, 2005-2006 84 Transparency International, 201085 World Bank (undated 1)86 For more information on these terms, see World Bank (undated 2).
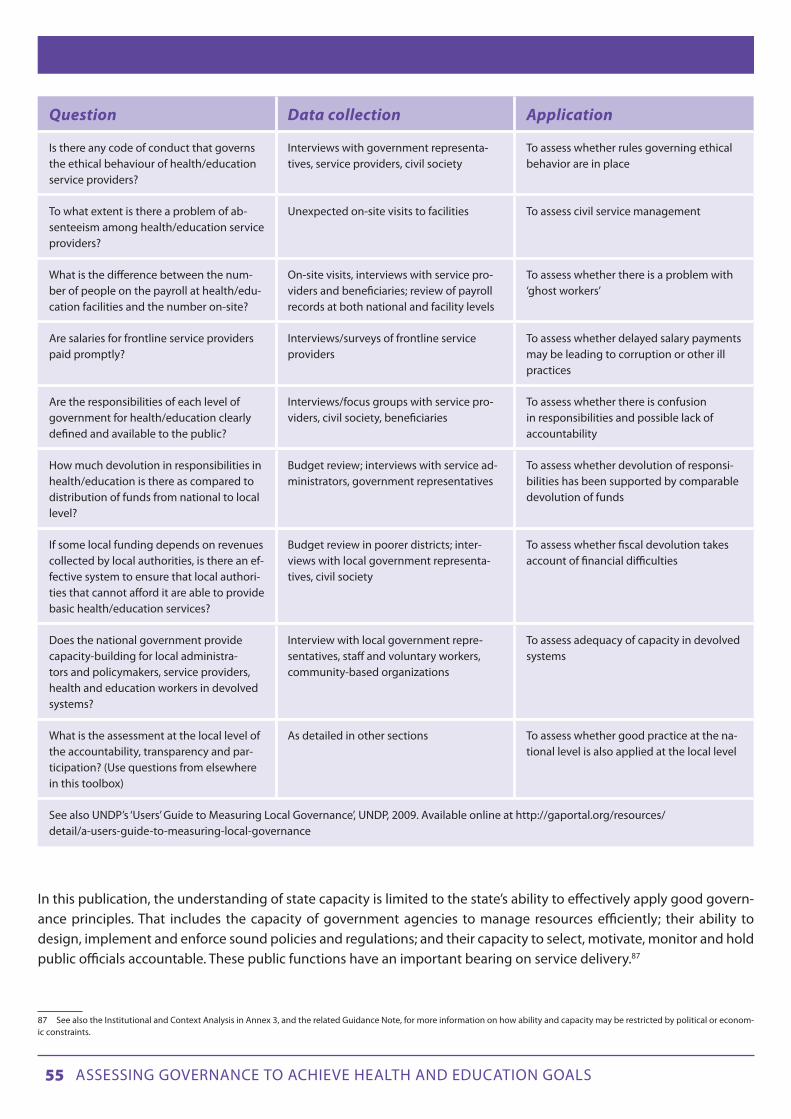
55 Assessing governAnce to Achieve heAlth And educAtion goAls
Question Data collection Application
Is there any code of conduct that governs the ethical behaviour of health/education service providers?
Interviews with government representa-tives, service providers, civil society
To assess whether rules governing ethical behavior are in place
To what extent is there a problem of ab-senteeism among health/education service providers?
Unexpected on-site visits to facilities To assess civil service management
What is the difference between the num-ber of people on the payroll at health/edu-cation facilities and the number on-site?
On-site visits, interviews with service pro-viders and beneficiaries; review of payroll records at both national and facility levels
To assess whether there is a problem with ‘ghost workers’
Are salaries for frontline service providers paid promptly?
Interviews/surveys of frontline service providers
To assess whether delayed salary payments may be leading to corruption or other ill practices
Are the responsibilities of each level of government for health/education clearly defined and available to the public?
Interviews/focus groups with service pro-viders, civil society, beneficiaries
To assess whether there is confusion in responsibilities and possible lack of accountability
How much devolution in responsibilities in health/education is there as compared to distribution of funds from national to local level?
Budget review; interviews with service ad-ministrators, government representatives
To assess whether devolution of responsi-bilities has been supported by comparable devolution of funds
If some local funding depends on revenues collected by local authorities, is there an ef-fective system to ensure that local authori-ties that cannot afford it are able to provide basic health/education services?
Budget review in poorer districts; inter-views with local government representa-tives, civil society
To assess whether fiscal devolution takes account of financial difficulties
Does the national government provide capacity-building for local administra-tors and policymakers, service providers, health and education workers in devolved systems?
Interview with local government repre-sentatives, staff and voluntary workers, community-based organizations
To assess adequacy of capacity in devolved systems
What is the assessment at the local level of the accountability, transparency and par-ticipation? (Use questions from elsewhere in this toolbox)
As detailed in other sections To assess whether good practice at the na-tional level is also applied at the local level
See also UNDP’s ‘Users’ Guide to Measuring Local Governance’, UNDP, 2009. Available online at http://gaportal.org/resources/detail/a-users-guide-to-measuring-local-governance
In this publication, the understanding of state capacity is limited to the state’s ability to effectively apply good govern-ance principles. That includes the capacity of government agencies to manage resources efficiently; their ability to design, implement and enforce sound policies and regulations; and their capacity to select, motivate, monitor and hold public officials accountable. These public functions have an important bearing on service delivery.87
87 See also the Institutional and Context Analysis in Annex 3, and the related Guidance Note, for more information on how ability and capacity may be restricted by political or econom-ic constraints.

56 Assessing governAnce to Achieve heAlth And educAtion goAls
Financial Management
Beyond the proportion of the budget that a state allocates to a specific social sector or sub-sector, there are many other indicators of the management of financial resources that bear upon the availability of quality education and health services.
First, it is possible to compare the approved budget of a sector like education or health with budget execution over time. This gives an indication of the government’s real commitment (as opposed to its intentions) to the sector. For in-stance, Armenia’s budget for health care shrank considerably between 1995 and 2003 as a proportion of its GDP, but it was able to execute its budget fully in 2002 and 2003, indicating an improvement over previous years (Table 3).
Table 3: Financing of Armenia’s healthcare system, 1995-2003
Indicators 1995 1996 1997 1998 1999 2000 2001 2002 2003
Planned state healthcare expenditure, % of GDP
2.4 2.0 1.3 1.8 1.8 1.9 1.6 1.2 1.3
Actual state healthcare ex-penditure, % of GDP
1.8 1.4 1.2 1.4 1.4 1.0 1.3 1.2 1.3
Source: UNDP, 2006a
Bolivia offers another interesting case. As in many developing countries with weak fiscal institutions, budgets are rarely executed as they were approved by the Congress. Examination of budget data reveals that in the fiscal years 1990-92/1994-96, between 15 and 50 percent of the approved agency budgets were reallocated across agencies.88
A further simple method for tracking budget and resource management is to calculate the difference between the pay-roll roster and health or education workers on site. This is especially relevant in the health sector, given that the payroll in this sector is often the largest among government sectors.89 The prices paid by different facilities for similar supplies can also be tracked, which can give an indication of potential supply leakages.
To assess the overall performance of the financial management system, the Public Expenditure and Financial Account-ability framework may be useful.90 This framework, developed by the World Bank, comprises a set of indicators designed to help assess and monitor performance in financial management. The framework tracks budget credibility, transpar-ency and the performance of key institutions involved in the budget cycle. While it is designed as a general framework, sector-specific indicators are under development and much of the current framework can be applied to the health and education sectors. Relevant indicators include: aggregate expenditure compared to original approved budget (if large discrepancies exist, allocated resources may not be reaching service providers), effectiveness of payroll controls, and availability of information on resources received by service delivery units. Figure 20 shows three PEFA indicators in selected countries.
88 World Bank, 200089 Lewis and Pettersson, 200990 See World Bank (undated 3)

57 Assessing governAnce to Achieve heAlth And educAtion goAls
Figure 20: Selected public expenditure and financial accountability indicators by country, 2005-2007
Another method for assessing financial management is to track public expenditures. Data on budget allocations on education or health provides a rough indication of the relative importance a government attributes to these areas, but offers little insight into how much of the allocated money ultimately reaches service providers. To analyse this and other issues related to budget utilization, the World Bank devised a diagnostic tool in the mid-1990s, the ‘public expenditure tracking surveys’ (PETS).91 This tracks the flows of resources from the central government (e.g., Ministry of Finance) through the various levels of state administration down to the front-line service facilities, focusing on en-route leakages and corruption.
The first PETS, carried out by the World Bank in 250 primary schools in Uganda, found that schools received only 13 percent of the non-salary-related funds to which they were entitled. Most schools had received no funds at all and most parents and teachers were not even aware that the grants existed. Financing earmarked for education was diverted to other sectors, used for political activities or stolen.
Since that Uganda PETS, similar surveys have been undertaken in many countries, both in the education and health sectors. However, most tracking surveys that followed the original PETS have been less effective in tracking leakages, because of a number of constraints. One such constraint is the poor record-keeping of many countries on expenditures and “discrepancies in expenditure records may sometimes stem from incorrect data entry rather than from the capture of funds by corrupt officials.”92 Another constraint is that many countries have soft rules for the allocation of resources, whereby resources are assigned to a bigger entity, such as a region or district, which has full discretion in their alloca-tion among facilities.93 This contrasts with Uganda, where simple and explicit rules about how much money each school
91 See World bank (undated 1)92 Amin and Chaudhury, 200893 idem
Source: PEFA Secretariat (various years).
0
1
2
3
4
Bangladesh Dominican Republic Macedonia Mozambique Ukraine
Aggregate expenditure outturn compared to original approved budget
Effectiveness of payroll controls
Available of information on resources received by service delivery unit
Sele
cted
PEF
A b
ud
get
per
form
ance
ind
icat
ors

58 Assessing governAnce to Achieve heAlth And educAtion goAls
was entitled to receive enabled the leakage rate to be tracked. As a result, it may be more difficult in other countries to determine whether expenditures were allocated as planned.
Even in countries where estimation of leakages is not possible, PETS generates useful findings on other governance deficits in resource management, human resources and the quality of service delivery.
Civil Service management
The performance of civil servants responsible for aspects of the chain of provision of education and health services – from those at the ministry level who design policies and allocate resources, to managers at other levels who regulate and supervise programmes and the use of resources by frontline service providers – is clearly crucial in determining the adequacy of those services. Analysis of the management of civil servants can either focus on a specific problem in their performance or may take the form of a more general assessment of the civil service management system.
For specific governance problems in many developing countries’ education and health sectors, the most serious in hu-man resources are the chronic levels of absenteeism by teachers, doctors and nurses. The standard tool to assess the magnitude of this problem is unannounced visits to schools and health care facilities to determine the percentage of service providers contracted for service but not on site. For instance, a recent survey made almost 70,000 unannounced visits to primary schools and clinics in six poor countries on three continents. It found that an average of 35 percent of health care providers were absent and 19 percent of teachers.94 The World Bank has also developed a survey instru-ment to measure absenteeism in education and health providers.95 After the levels of absenteeism are determined, the reasons can be investigated, along with an examination of the government’s efforts (if any) to curb the phenomenon.
A challenge somewhat related to chronic absenteeism – usually not widespread, but with more harmful consequences – is that of ghost teachers or health providers. This refers to people who are on the payroll and receive regular salaries from government funds, but do not work for those services. In 1993, a staggering 20 percent of teachers on the Ugan-dan payroll were found, through PETS, to be ghosts. In Honduras, 5 percent of teachers on the payroll were found to be ghosts, while in health care the figure stood at 8.3 percent of general practitioners.96
Decentralization
Decentralization (the transfer of power and responsibility from higher to lower levels) has been a central component of a broader process of governance reform around the world over the past decade. Moving decision-making as well as implementation to sub-national levels following the principle of subsidiarity is generally assumed to facilitate poverty reduction by making service delivery more efficient, service providers more accountable, and by enabling more active participation of stakeholders in the process. Therefore, as ever more countries devolve authority to sub-national gov-ernments, it becomes increasingly important for assessments to analyse how the various dimensions of governance at sub-national levels are affecting the delivery of high quality education and health services. With growing attention paid to the role of local governments in achieving/accelerating progress towards the MDGs, the framework proposed herein offers a more in-depth basis for assessing local governance gaps.
94 Chaudhury et al., 200695 World Bank, 200296 Reinikka and Smith, 2004

59 Assessing governAnce to Achieve heAlth And educAtion goAls
With particular reference to health and education, the evidence as to whether the decentralization of these services has brought about significant improvements in education and health outcomes is so far inconclusive. Several governance challenges emerge when a country goes through a process of decentralization, including reforms related to delivery of education and/or health services. Depending on the context, analysis of a specific country might also demand consid-eration of additional factors.97 The key challenges include:
1. Duplication and lack of clarity in the division of roles, or misaligned responsibilities, between different levels of government.
2. High dependency on grants, inadequate capacity of local government to mobilize local resources and finance social services.
3. Inability of local governments to spend national grants related to health and education programmes.4. Inadequate monitoring and oversight of level and quality of service provision, as well as disbursement of funds.5. Lack of adequate technical and managerial capacity at the local level.6. Ineffective or weak participatory processes and partnerships with local communities towards achieving social sec-
tor outcomes, including, for instance, in local needs assessments, planning and budgeting and monitoring and evaluation.
7. Unclear and non-transparent relationships between local governments and the private sector.
97 For more detailed guidance on indicators of decentralization and local governance, see UNDP, 2009b.

60 Assessing governAnce to Achieve heAlth And educAtion goAls
3.B. PATTERNS OF POWER AND INTERESTS
Drawing on the political economy, gender equality and human rights literature, this chapter provides a short descrip-tion of the most typical patterns of power and interests that impact the delivery of education and health services: discrimination, corruption, political clientelism, and state capture. These patterns are often very entrenched in a state, sometimes defining the character of the relationship between the state and its citizens. Familiarity with these patterns can help researchers assessing governance to identify and analyse some of the structural reasons for poor governance in a specific context. It can also help in investigations into the role of power and politics in the provision of education and health goods and services, and in assessments of the extent to which various political, economic and cultural vested interests may influence how responsive and accountable is a state to the basic welfare of people.
UNDP’s ICA considers the interests and incentives of different actors in society and the way that formal and informal institutions affect these incentives or the actors’ ability to act on them (see Annex 3).
98
Discrimination Selected assessment questions on discrimination
Question Data collection Application
Is there de jure discrimination ‘on the books’ (e.g., priority access for members of the majority, dress code that discriminates against minority groups, education in majority language only)?
Review of policy documents, civil society To assess whether discrimination is institutionalized
Is there an official policy of social inclusion in health/education that covers all poten-tially disadvantaged groups?
Review of relevant policy documents; interviews with service administrators, civil society
To assess whether an effective social inclu-sion policy is in place
Does the entire population have equal ac-cess to health care/education?
Review of relevant policy documents; interviews with service administrators, civil society
To assess whether there is discrimination against certain groups with regards to ac-cess to health care/education
Do beneficiaries perceive discrimination in health/education?
Public opinion surveys To assess beneficiaries’ perceptions of discrimination
Is the government taking any measures to combat de facto discrimination (in practice) in health/education?
Interviews with government representa-tives, civil society, UNDP User Guide meth-odology for the assessment of capacity of municipalities to deliver services98
To assess whether the government is ad-dressing discrimination
To what extent has the government adopted information and awareness-raising campaigns to encourage families to end discriminatory practices in health/education access at home?
Review of government policies/pro-grammes, interviews with government representatives, civil society, household surveys
To assess whether the government is ad-dressing discrimination within the home
Is there a gap between legal protection against discrimination and practice?
Legal review, expert assessment, house-hold surveys
To assess whether weak law enforcement is perpetuating discrimination
98 UNDP, 2010b

61 Assessing governAnce to Achieve heAlth And educAtion goAls
Question Data collection Application
Are there programmes in place to improve access to health/education for those who cannot afford any associated fees?
Interviews with service administrators; review of relevant documents (about the waiver system); interview with other stake-holders focusing on education policy (e.g., CSOs, journalists, academics)
To assess whether the poor are discrimi-nated against in health/education access
Are health/education services provided in minority languages?
Facility surveys; interviews with service providers, beneficiaries who do not speak the majority language
To assess whether people from certain language groups are discriminated against in health/education access
Are there programmes in place to improve access to health/education for people with disabilities?
Facility surveys; interviews with service providers, civil society, beneficiaries with disabilities
To assess whether people with disabilities are discriminated against in health/educa-tion access
What is the proportion of children with physical, mental, sensory and intellectual disabilities enrolled in primary education institutions?
Review of official statistics, interviews with school authorities, household surveys
To assess whether children with disabilities face discrimination in education in practice
Is the funding provided for health/educa-tion facilities in districts with non-majority groups (e.g., ethnic, religious, political) comparable to that in districts with major-ity groups?
Review of official statistics on demograph-ics, budgets
To assess whether certain districts face discrimination
Is the health/education system respon-sive to the needs of minority groups (e.g., recognition of minority holidays, avoidance of racist portrayals of minority groups in publications, cultural training for staff)?
Surveys/focus groups in areas with a large proportion of minority groups; interviews with beneficiaries from minority groups; interviews with minority rights or human rights civil society
To assess whether minority groups face discrimination
Do health/education facilities make an ef-fort to hire female service providers?
Facility surveys, on-site visits, interviews with service providers
To assess whether women face discrimi-nation in health/education as a result of majority-male service providers
How does the quality of service de-livery compare in regions of differing demography?
See section on assessing quality; review of official statistics
To assess discrimination in the quality of the provision of education and health services
Do service providers in different regions exert different levels of effort?
Clinical vignettes, on-side observation, interviews of service administrators
To assess whether service providers dis-criminate against beneficiaries according to location
Do women who suffer complications from abortion receive adequate treatment by health workers in public health facilities regardless of the legality of the abortion?
Interviews with health workers; interviews with CSO focusing on reproductive health
To assess whether women who have illegal abortions face discrimination in health services
What proportion of schools has separate bathrooms for boys and girls?
Facility surveys, on-site visits To assess whether girls might not be sent to school due to inadequate facilities
See also Corner, ‘Making the MDGs Work for All’, UNIFEM, 2008 See also UNDP’s Users’ Guide for Measuring Gender-Sensitive Basic Public Service Delivery, 2009. Available online at http://gaportal.org/resources/detail/a-users-guide-to-measuring-gender-sensitive-basic-service-delivery

62 Assessing governAnce to Achieve heAlth And educAtion goAls
Discrimination often limits disadvantaged groups’ access to basic education and health care. Specific groups that are discriminated against vary from country to country, but they often include women, ethnic or racial minorities, the poor, gay and lesbian, and people with disabilities. Wide disparities in basic human development outcomes across gender, geography, ethnicity or socio-economic status can be symptoms of poor governance and a form of discrimination.
Taking account of the multidimensional nature of discrimination, a range of tools and perspectives are needed to meas-ure the impact of these patterns of power on education and health outcomes. To start with, perception surveys can help assess the level of discrimination in health and education services. Experts or ordinary citizens can be asked about per-ceived levels of discrimination against various groups in the population. Perception surveys can also help identify any possible pattern of discrimination by teachers, nurses or doctors against marginalized groups. For example, questions can ask specifically about the responsiveness of frontline providers to language needs or sensitivity to cultural customs (e.g., regarding reproductive health) and then be disaggregated to reveal the responses of linguistic or ethnic minorities as compared to majority groups. A large gap may indicate discrimination.
Legal analysis in the education and health sectors can help identify cases where discrimination is entrenched in law. For instance, if the law specifies that schooling will be provided exclusively in the language of the ethnic majority, ethnic minorities are inhibited from learning in their own language. The legal framework can be assessed in checklist format, where each law is marked as either present or absent. But instead of a simple ‘yes’ or ‘no’ choice, a third option may indi-cate incomplete or substandard laws.
In many countries the laws ‘on the books’ are strong, but their enforcement is weak. Traditional forms of discrimination, such as lack of education or health services for girls, may be prohibited by law, but remain widely practiced because of poor enforcement. For example, lack of enforcement of labour laws that prescribe gender equality in working condi-tions could be a reason why poor parents who cannot afford to send all their children to school may prefer to send boys rather than girls.99
Other forms of discrimination include unfair distribution patterns of public programmes that benefit people other than those who need assistance most. Such discrimination can be assessed by contrasting the benefits of a programme with levels of deprivation that the programme is supposed to address. For instance, the allocation of resources from Guate-mala’s Scholarships for Girls programme, designed to reduce the staggering repetition and desertion of first grade girls, has often been skewed (Figure 21). Some municipalities with a relatively low number of girls dropping out of school after first grade in 2005 received a large number of Scholarships for Girls the following year. Other municipalities with much higher levels of girl deserters after first grade received fewer scholarships the following year.
99 UNDP, 2000

63 Assessing governAnce to Achieve heAlth And educAtion goAls
Figure 21: Scholarships for girls and primary school drop-out rates, Guatemala
Discrimination resulting in inequities in the quality of the provision of education and health services is a related prob-lem. One way to measure this is to compare data, disaggregated by region or municipality, on the quality of an essential service (e.g., quality of teachers or health professionals, conditions of school facilities or clinics) with demographic data from the same regions or municipalities disaggregated by ethnic group or poverty level. This could show, for instance, that less qualified teachers – a primary factor in the quality of education – are teaching in the areas largely populated by an ethnic minority or by poor people.100 A comparison of the results of the Guatemalan teacher evaluation by de-partment (administrative subdivision) with the incidence of poverty and concentration of indigenous peoples in each department shows that the most disadvantaged children are being taught by the least qualified teachers (Table 4). The three departments in which teachers had the lowest reading test scores are those with the highest incidence of pov-erty; and are also among the departments with the largest concentrations of indigenous people.
100 Felner, 2008
Source: Felner 2008, based on MINEDUC, 2005, and MINEDUC, 2006
0
500
1,000
1,500
2,000
2,500
3,000
3,500
San Juan Sacatepequez
Los Amantes
Joyabaj
San Tomas Chichicaste
nango
Palencia
Tajumuico
Number of Deserters after 1st Grade per Municipality, Girls 2006
Number of Scholarships for Girls’ per Municipality

64 Assessing governAnce to Achieve heAlth And educAtion goAls
Table 4: Qualified teachers, poverty incidence and concentration of indigenous people, Guatemala
In both poor and non-poor areas, clinical vignettes and direct observation of health care providers are also useful meth-ods to measure inequities in the quality of health care (see also Assessing the competence of service providers, above.) For instance, applying these methods in India, Indonesia and Tanzania, a study concluded that doctors in poorer areas are generally less competent than those in richer areas and put less effort into treatment. Indeed, the efforts of public sector doctors working in poor areas “is so low that it is often better to go to an untrained provider in the private sector than a trained doctor in the public sector, because the greater effort makes up for the lower level of competence.”101
101 Das and Leonard, 2008
Source: Felner, 2008, based on Rubio and Salanic, 2005; ENCOVI, 2005 and UNDP, 2005b
Teachers Reading Test scores poverty incidence and concentration of indigenous people Guatemala by department
Poverty Incidence Teachers’ Reading Test Scores Concentration of Indigenous People
Dept. Poverty Dept. Score Dept. % Pop. Indigenous
Quiché 81 Sacatepéquez 72.6 Totonicapán 98%
Alta Verpaz 78.8 Guatemala 66.5 Sololá 96%
Sololá 74.6 Chimaltenango 66 Alta Verapaz 93%
Totonicapan 71.9 El Progreso 61.4 Quiché 89%
Huehuetenango 71.3 RetaIhuleu 60.5 Chimaltenango 79%
Baja Verapaz 70.4 Petén 60.5 Huehuetenango 65%
San Marcos 65.5 San Marcos 60.2 Baja Verapaz 59%
Jalapa 61.2 Zacapa 59.9 Quetzaltenango 54%
Chimaltenango 60.5 Jalapa 59.8 Suchitepéquez 52%
Chiquimula 59.5 Chiquimula 59 3 Sacateéquez 42%
Santa Rosa 57.9 Escuintla 58 8 San Marcos 31%
Petén 5.7 Suchiteéquez 57.4 Petén 31%
Suchitepequez 54.7 Quetzaltenango 56,8 Retalhuleu 23%
Zacapa 53.9 Baja Verapaz 56.2 Jalapa 19%
RetaIhuleu 50.4 Jutiapa 55.6 Chiquimula 17%
Jutiapa 47.3 Totonicapán 54.2 Guatemala 14%
Quetzaltenango 44 Huehuetenango 53.5 Escuintla 7%
El Progreso 41.8 Santa Rosa 52.5 Jutiapa 3%
Escuintla 41.4 Sololá 51.4 Santa Rosa 3%
Sacatepéquez 36.5 Quiché 51.2 El Progreso 1%
Guatemala 16.3 Alta Verapaz 50.9 Zacapa 1%

65 Assessing governAnce to Achieve heAlth And educAtion goAls
Differences between regions are not in and of themselves proof of discrimination, although they can provide indirect evidence if correlated with public attitudes towards certain groups. Further verification can take place through inter-views with responsible authorities. They can be asked for explanations for skewed distributions, whether lists are main-tained of amounts distributed per beneficiary, whether complaints have been received about inequities, and about any measures that have been taken to address the problem. How forthcoming the responses are may be as much a sign of discrimination as the responses themselves.
To prevent entrenched discrimination in education and health, the state may need to introduce proactive policies to uncover and overcome such practices. One method for assessing these efforts is the UNDP User Guide Methodology for the assessment of capacity of municipalities to deliver services.102 This focuses on service delivery to traditionally excluded groups, such as women, vulnerable ethnic minorities, the poor and the disabled. It includes healthcare and education as well as waste management and water. While the method is designed for Turkey and the Western Balkans, most questions are more broadly applicable. Examples include:
• Towhatextentdoesinformationmadeavailabletothepubliccovertheshareofthebudgetforbasichealthcare/primary education that is planned to be used to target specifically women? (4-point scale)
• Doesthemunicipaladministrationuseanonymousclientsurveysonbasichealthcare/primaryeducationto target minorities through research and analysis? (4-point scale)
• Towhatextentdoesthemunicipaladministrationcollectdisaggregateddatabygender,ethnicity,ageand disability for basic healthcare/primary education, for example user data, assessments of impacts of services, number of staff, positions and payments, membership on public and private boards, etc.? (4-point scale)
• Towhatextenthavestaffinvolvedinpolicy,strategy,andservicedevelopmentforbasichealthcare/pri-mary education received training in gender mainstreaming? (4-point scale)
Even if official practices meet international standards, the government may need to address discrimination in soci-ety. From a governance perspective, a key question relates to how a state responds to such forms of intra-household inequalities. One way of assessing this is gauging the extent to which a government has adopted information and awareness-raising campaigns to encourage families to give up patriarchal beliefs and practices that give preferential treatment to boys and men in access to education or health care. For example, once household inequalities have been established (see Chapter 2), it is important to consider whether any campaigns have taken place, whether civil society actors consider them to be sufficient, and whether the authorities have made efforts to see if they reach their target audiences.
Assessment of whether discriminatory practices prevent a disadvantaged group from achieving equal access to educa-tion or health services must crucially analyse government policies beyond the specific sector, to gauge whether govern-ment action or inaction in other areas of public policy may be contributing to the unequal access to those services. For instance, a justice system that fails to ensure women’s safety and security may reinforce cultural norms that significantly restrict women’s mobility outside their village, which directly undermines female access to medical care and educa-tion. A more in-depth diagnostic of discrimination in health and education, then, will encompass an assessment of all aspects of discrimination in society more broadly.
Studies have shown that social institutions – such as the family code (e.g., age of women’s marriage, inheritance laws, custody rights over children), property rights (e.g., access to land or real estate by women or members of ethnic minori-ties, women’s access to bank loans) and labour laws (e.g., on discriminatory practices in salaries or working conditions) – can restrict the power of women in the family, in the market and in political and social life, leading to reduced access to health and education by both women and children. A recent study shows that social institutions that deprive women
102 See UNDP, 2010b

66 Assessing governAnce to Achieve heAlth And educAtion goAls
of their autonomy and bargaining power in the household, or that increase the private costs and reduce the private returns to investments in girls, are associated with lower female education, higher fertility rates and higher child mor-tality.103 Another study found evidence that women’s status – understood as women’s power relative to men – strongly influences women’s and children’s nutrition. “Women with low status tend to have weaker control over household re-sources, tighter time constraints, less access to information and health services, poorer mental health and lower self-esteem”. These factors are closely tied to women’s own nutritional status and, in turn, to children’s birth weights and the quality of care they receive.104 A Bangladesh study showed that expenditures on children’s clothing and education were higher and the rate of illness among girls was lower in households where women owned assets.105 So it is important to consider not only discrimination in health and education, but in society more broadly. One way to assess this is the Social Institutions and Gender Index (Box 5).
Box 5: The Social Institutions and Gender Index
The Social Institutions and Gender Index (SIGI), a composite index produced by the OECD in 2009, offers a tool to measure traditions and social norms that restrict women’s empowerment. Drawing on 12 indicators in five areas (Family Code, Physical Integrity, Son Preference, Civil Liberties and Ownership Rights), the index captures the underlying reasons for existing gender gaps. SIGI indicators are based on an in-depth assessment of the situation of women and men in 124 low- and middle-income countries, 102 of which are ranked based on their performance in social institutions. Country notes for all 124 countries present detailed information on each of the five areas covered.
The ranking and country notes take both the legal framework and the on-the-ground reality into account. Each of the 12 indicators is given a score on a scale from 0 (meaning no or very low inequality) and 1 (meaning very high inequality) based on the extent of discrimi-nation in each area and the share of the population that is affected.
The SIGI is designed to measure inputs – social institutions – that affect gender inequalities in education, health, economic or political participation, etc., as opposed to the inequalities themselves. However, the authors found that the results of the SIGI are related to health and education, even after controlling for region, religion, and level of economic development. The SIGI can be a useful tool for assessing the forms of discrimination that can indirectly affect health and education.
Source: http://genderindex.org/
More measurement tools and studies can be found in UNDP’s Users’ Guide on Measuring Gender-sensitive public ser-vice delivery, available online at http://gaportal.org/resources/detail/a-users-guide-to-measuring-gender-sensitive-basic-service-delivery.
103 Branisa et al., 2009104 Smith et al., 2003105 UN Millennium Project, 2005b
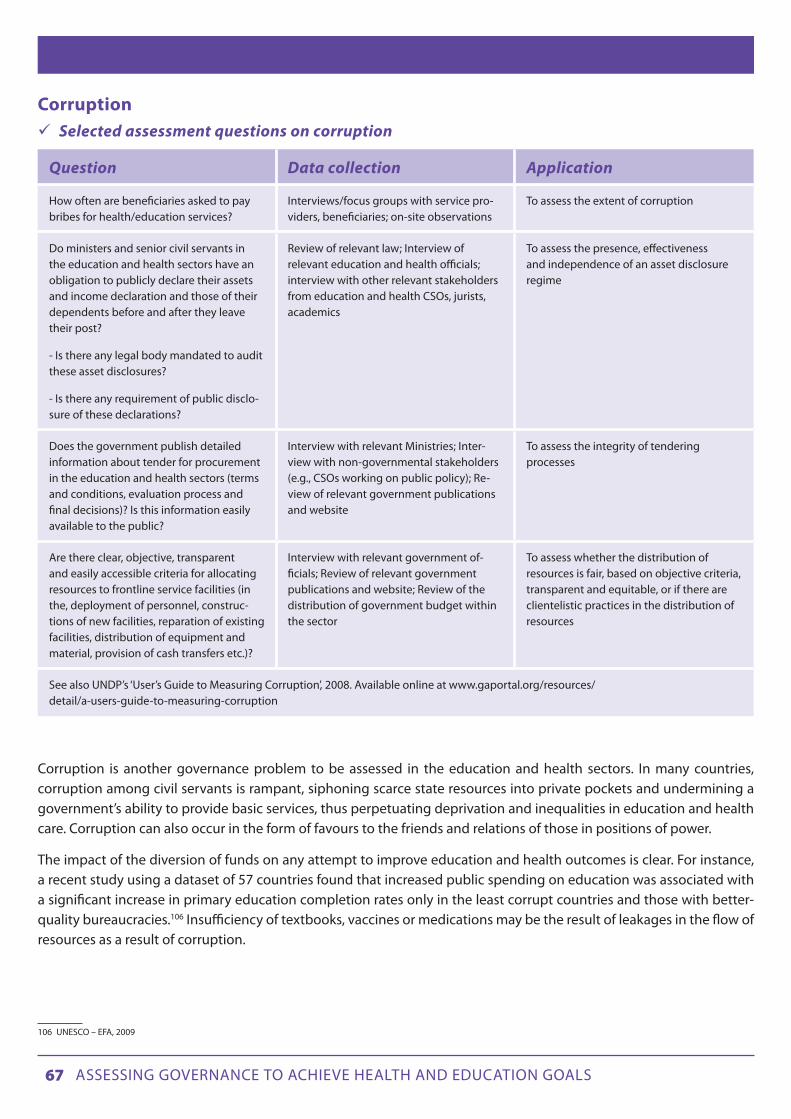
67 Assessing governAnce to Achieve heAlth And educAtion goAls
Corruption Selected assessment questions on corruption
Question Data collection Application
How often are beneficiaries asked to pay bribes for health/education services?
Interviews/focus groups with service pro-viders, beneficiaries; on-site observations
To assess the extent of corruption
Do ministers and senior civil servants in the education and health sectors have an obligation to publicly declare their assets and income declaration and those of their dependents before and after they leave their post?
- Is there any legal body mandated to audit these asset disclosures?
- Is there any requirement of public disclo-sure of these declarations?
Review of relevant law; Interview of relevant education and health officials; interview with other relevant stakeholders from education and health CSOs, jurists, academics
To assess the presence, effectiveness and independence of an asset disclosure regime
Does the government publish detailed information about tender for procurement in the education and health sectors (terms and conditions, evaluation process and final decisions)? Is this information easily available to the public?
Interview with relevant Ministries; Inter-view with non-governmental stakeholders (e.g., CSOs working on public policy); Re-view of relevant government publications and website
To assess the integrity of tendering processes
Are there clear, objective, transparent and easily accessible criteria for allocating resources to frontline service facilities (in the, deployment of personnel, construc-tions of new facilities, reparation of existing facilities, distribution of equipment and material, provision of cash transfers etc.)?
Interview with relevant government of-ficials; Review of relevant government publications and website; Review of the distribution of government budget within the sector
To assess whether the distribution of resources is fair, based on objective criteria, transparent and equitable, or if there are clientelistic practices in the distribution of resources
See also UNDP’s ‘User’s Guide to Measuring Corruption’, 2008. Available online at www.gaportal.org/resources/detail/a-users-guide-to-measuring-corruption
Corruption is another governance problem to be assessed in the education and health sectors. In many countries, corruption among civil servants is rampant, siphoning scarce state resources into private pockets and undermining a government’s ability to provide basic services, thus perpetuating deprivation and inequalities in education and health care. Corruption can also occur in the form of favours to the friends and relations of those in positions of power.
The impact of the diversion of funds on any attempt to improve education and health outcomes is clear. For instance, a recent study using a dataset of 57 countries found that increased public spending on education was associated with a significant increase in primary education completion rates only in the least corrupt countries and those with better-quality bureaucracies.106 Insufficiency of textbooks, vaccines or medications may be the result of leakages in the flow of resources as a result of corruption.
106 UNESCO – EFA, 2009

68 Assessing governAnce to Achieve heAlth And educAtion goAls
Various aspects of corruption and of an environment conducive for corruption can be assessed.107 One assessment tool that is especially relevant here is the series of country studies carried out by Africa Education Watch, an initiative of Transparency International (Box 6). In each country, the national chapter of this organization undertook a country-wide opinion survey of the financing mechanisms for primary education and conducted field research to assess school governance, transparency and resource management. Respondents in each country typically included about 1,000 households, 60 school head teachers, 60 parent and teacher committee chairs, and up to 20 inspectors or district of-ficials. Figure 22 shows the perceived rates of embezzled funds.
Figure 22: Proportion of head teachers and heads of parent-teacher associations who think resources are sometimes embezzled before reaching their school
Box 6: Understanding the corruption risks for primary education
The Africa Education Watch Programme is a three-year initiative started in 2007 by Transparency International. It focuses on developing well-governed, accountable and transparent primary schools. Combining a review of the financial mechanism of primary schools with on-site visits to schools enabled the assessors to obtain actionable information about some specific governance deficits that are driving ram-pant corruption in the education sector in those countries. While the participating countries presented diverse contexts, findings showed some key commonalities:
Financial systems: Limited financial information (current and historical) was available at district level offices and in the schools. Funding and resource provision to schools was unpredictable (i.e., timing and amount of flows). For example, on average, only 35 percent of head teachers knew what resources to expect. In Morocco and Niger, this figure was just 7 percent.
Information: Parents had few opportunities for taking part in, and little interest in, the financial oversight of schools. Financial information was not publicly or easily available.
Participation: When parents were engaged, typical participation channels were through parent and teacher associations and school man-agement committees. But these committees were shown to be vulnerable to ‘capture’ by teachers and/or local elites. Few parents know how to get involved in these structures.
Corrupt practices: Three common problems of corruption that were identified through the surveys were illegal demands for non-existent funds, embezzlement of resources, and abuse of power by teachers and officials.
Transparency International, 2009
107 For specific tools to measure corruption, please refer to UNDP’s ‘User’s Guide to Measuring Corruption’.
Source: Transparency International, AEW survey data
0%
10%
20%
30%
Ghana Madagascar Morocco Niger Senegal Sierra Leone Uganga
Head teachers Heads of Parent-Teacher Associations
12%9%
7%10%
27%
10%
15%
12%
0%
3%
8%
3%
8%
12%

69 Assessing governAnce to Achieve heAlth And educAtion goAls
Transparency International issued a second report based on additional data gathered through Africa Education Watch and other surveys.108 This report compared data on corruption with data on access to education, health and water. For example, reported levels of bribery were correlated with the maternal mortality ratio per 100,000 births, and also the literacy rate of 15 to 24 year olds. The analysis found significant correlations in both cases, indicating that higher levels of bribery impede achievement of the MDGs. Such statistical analysis can give striking visual results (Figure 23).
Figure 23: Literacy rate and reported levels of bribery, 48 countries
Source: Transparency International, 2010
In another initiative, the Government of Armenia implemented a comprehensive Anti-Corruption Participatory Moni-toring Methodology for the health and education sectors as part of its anti-corruption strategy.109 This method used interviews, observations, and focus group discussions to assess the impact of anti-corruption measures in the two sec-tors, covering quality of access to services, finances and monetary circulation, rights and legality, and administration and functions. Examples of indicators (and the method for data-gathering) include:
• Enrolmentofchildreninelitistpreschoolandafter-schoolinstitutionsthroughnepotismand/orbribes(expert interview)
• Sale,useorleaseofbuildings,facilitiesandpropertyforprofit(observation,expertinterview)• Athealthfacilities,salesofmedication(includingnon-registeredmedication)forprofitbydoctorsoutof
the facility (observation, focus group, expert interview)• Athealthfacilities,demandinginformalpaymentsfrompatientsnotregisteredwithhealthfacilities(ob-
servation, in-depth interview, expert interview)
108 Transparency International, 2010109 For a full description of the Anti-Corruption Participatory Monitoring Methodology developed for Armenia, see UNDP, 2006a To access the Armenian assessment report, see UNDP, 2008b
Reported levels of bribery – 2008(% of respondents – statistically coded)
Lite
racy
rat
e (%
) of 1
5-24
yea
r o
lds
– 20
08
0 27.5 55 82.5 100
100
91.25
77.5
63.75
50
Liberia
Ghana
Colombia
Georgia

70 Assessing governAnce to Achieve heAlth And educAtion goAls
Political Clientelism Selected assessment questions on political clientelism
Question Data collection Application
How does the amount of services (e.g., financial resources, number of textbooks) per capita in districts that support the rul-ing party compare to that in districts that support the opposition?
Review of budget information and voting records
To assess the extent to which the distribu-tion of services is influenced by political party affiliation
To what extent is entrance or promotion to health/education positions based on meritocracy versus political alliances?
Surveys of service providers To assess the extent of political clientelism in health/education jobs
To what extent have beneficiaries experi-enced differences in level of service based on political affiliation?
Beneficiary surveys To assess the extent of political clientelism in health/education service delivery
How does the level of benefits to correct skewed distribution patterns compare to health/education indicators of the level of deprivation?
Review of official statistics, programme documentation
To assess clientelism in the distribution of programme benefits
In many developing countries, the education or health systems are used by politicians as instruments of political pa-tronage or clientelism110 – the exchange of services, jobs and other benefits for political support. Since clientelism always entails the use or distribution of state resources, informal systems of clientelism are key contributors to the dis-tortion of public services’ delivery.
Public surveys are one way to obtain a snapshot of how pervasive clientelist practices are in a country. The survey can go beyond general questions about whether clientelism exists and instead ask respondents about their own knowledge of cases of clientelism. For instance, the opinion poll Latinobarómetro/PRODDAL 2002 asked respondents whether they “personally know of any case where someone has received privileges because of their relationship with the ruling party.” In the region as a whole, 31.4 percent of interviewees stated that they knew of one or more cases of such clientelism.111
Surveys can also provide data about people’s own experiences with specific clientelist practices. For instance, according to the 2005-2006 Afobarometer survey, 22.9 percent of respondents in Mozambique said that they have not obtained identity papers, because they do not have connections.112 In addition, surveys of civil servants can be useful to assess the extent to which entrance to the civil service system or promotion within it are based on a meritocratic or clientelist logic. In a survey of Egyptian civil servants, one in 10 volunteered that they had received their position through wasta or influence.113
Various methods can help assessors identify and analyse patterns of clientelism that may be hampering equal access to quality education and health services. First, an analysis of the patterns of recruitment and promotion procedures of civil servants can help assess the extent to which a clientelist pattern exists in the distribution of jobs by politicians to their political allies. For instance, a study on the status of the civil service in Latin America found that in the Dominican
110 The literature on political economy makes a distinction between concepts such as clientelism, patronage and neo-patrimonialism (see e.g., Erdmann and Engle, 2006), but for the sake of simplicity this assessment framework refers to all of these concepts as clientelism or patronage.111 UNDP, 2004b112 Afrobarometer, 2005-2006.113 Brinkerhoff and Goldsmith, 2004, and references therein.
71 Assessing governAnce to Achieve heAlth And educAtion goAls
Republic, political ties with the government in power are used for admission to the vast majority of government jobs (only less than 5 percent of staff in central government become officials based on merit). 114 A ‘Merit Index’ was designed to evaluate the degree to which the civil service system incorporates guarantees of professionalism in its policies and practices, protecting them from abuse, politicization and corruption. This index is made up of 10 qualitative indicators on issues such as recruitment and promotion procedures, the technical experience and independence of selection bodies, political patronage in wage decisions, and dismissals when the government changes political colour. A set of quantitative indicators is also proposed, such as the ‘vertical compression of wages’: the measurement of the difference between the total pay received by the employees at the top wage level and those at the lowest level. The existence of a high compression reflects significant internal inequality in the compensation structure and is symptomatic of a system dominated by elites.
Another way to identify a pattern of patronage in the provision of education or health services is to analyse the extent to which the distribution of some service or public good in these sectors (e.g., primary health clinics, textbooks or scholarships for poor children) may be influenced by the political party affiliation of those receiving the service or ben-efit. In clientelistic systems, government officials often provide social services to those areas that voted for the party in power.115 A relatively simple way of looking at this is to compare the distribution of some social service or public good to particular regions, districts or municipalities with the political affiliation of those responsible for the distribution of those services and of those receiving it. To assess bias in the allocation of services across localities, the level of service provided by a mayor in her/his village or city can be compared with that of another village under the jurisdiction of the same mayor.116
State capture Selected assessment questions on state capture
Question Data collection Application
To what extent do national health/educa-tion unions influence political appoint-ments or promotions within the respective ministries?
Interviews with government representa-tives, national unions, civil society
To assess state capture by trade unions
To what extent are health/education facilities used for the personal gain of local elites?
Interviews/focus groups with local leaders, civil society, service providers
To assess state capture by local elites
In many countries, the economic elite is able to use its wealth to bias policies and laws, allowing them to obtain selec-tive benefits at the expense of the rest of society. Sometimes they buy-off politicians or civil servants to obtain benefits for their own companies (e.g., to obtain licenses and contracts, state subsidies or condone arrears for their companies). In other cases, they use their wealth to shape laws and manipulate political institutions to their benefit. The capture of the state by the elite is a widespread phenomenon in many developing countries, but can be equally evident in devel-oped countries.117
114 Longo, 2002; IADB, 2006115 World Bank, 2004a116 see e.g., Cheema and Mohmand, 2006117 DFID, 2005

72 Assessing governAnce to Achieve heAlth And educAtion goAls
A governance assessment can analyse numerous issues related to the capture of the state by the economic elite. First, the economic elite may succeed in keeping the overall levels of taxes down, resulting in less government spending.118 When the state is captured by the economic elite, the composition of tax revenue would also typically be affected, generally following a pattern of regressive taxation. That is, relatively less of the overall tax burden would come from income and other wealth related taxes, while indirect taxes, particularly VAT (which puts a greater burden on the poor) would occupy a higher share within the overall tax burden. In addition, the wealthy are often able to obtain various tax exemptions.119
In another form of state capture, scarce resources available for public services might be skewed towards those services that provide greater benefit to the non-poor than to the poor, such as universities and tertiary health services in hospi-tals in the capital or large cities, rather than in improving equality of access and quality of primary school and primary health care facilities.
In addition to these aspects of fiscal policy and budget priorities, the economic elites may in some cases directly resist schooling of the poor because of fear of reducing the possibility of finding cheap labour and the social and political mobilization that education may bring.120 Furthermore, local elites may sometimes constrain access of the poor to basic social services. For instance, a survey of 125 primary schools in rural areas of Pakistan found that closed schools (a quar-ter of the schools were not open at the time of the surprise visits) were sometimes used as a personal building by the landowner (e.g., as a farm shed).121
118 World Bank, 2003a119 Di John, 2006.120 Tendler, 2002; Wiener, 1990; and Easterly, 2001; and references therein.121 Easterly, 2001, and references therein

73 Assessing governAnce to Achieve heAlth And educAtion goAls
ANNEx 1: THE GAF AND THE MAF
The summary table below describes how the Governance Assessment Framework (GAF) proposed herein can integrate itself in, and/or complement, the MDG Acceleration Framework (MAF), adopted by a number of countries that are lag-ging behind in achieving their MDG targets.
Actions outlined under the existing MAF
MAF/GAF interface Value-added of the GAF (which could be integrated into the MAF)
Step 1 Identifying key interventions (2-3) and classifying them by priority
This is done by conducting:• Anassessmentof
interventions based on impact
• Anassessmentofinterventions based on feasibility
The feasibility assessment includes:
• agovernance dimension (with a focus on political will and coordination)
• an‘additional factors’ dimension which is often used to refer to systemic governance issues, e.g., corruption
Some relevant questions from the ‘political will’ section of the GAF could be used as a means to conduct a more evidence-based analysis of the governance factors which may affect the implementation of an intervention- Dimensions covered under ‘political will’ in the GAF: presence of
policy champions for the issue, mobilization of support, concrete policy steps, allocating resources commensurate with the problem’s gravity
- An evidence-based assessment of the governance aspects which may affect the implementation of any given intervention might help to foster a consensus
- The GAF provides specific guidance on how to collect data on political will in a relatively quick and low-cost manner
Step 2 Identification of bottlenecks and classifying them by priority order
The MAF presents four categories of bottlenecks:
• Thoserelatedtopolicy and planning
• Thoserelatedtobudgeting and financing
• Thoserelatedtothesupply of services
• Thoserelatedtothedemand of services
(1) Complementary cross-cutting issues covered by the GAF include:- ‘engagement and encouragement’ (relevant section of the GAF:
political will)- ‘coordination and alignment’ (relevant section of the GAF: state
capacity – financial management, civil service management, decentralization)
- ‘responsibility and transparency’ (relevant sections of the GAF: accountability – political, judicial, administrative, electoral, social; AND patterns of power & interests – discrimination, corruption, political clientelism, state capture)
(2) While the MAF encourages working groups to conduct interviews with target populations & other stakeholders in order to obtain primary data, it does not include precise guidance on how to do so and the analytical framework it presents only refers to secondary sources of information – annual plans, budgets, laws, mid-term performance reviews, etc. The GAF can usefully complement the MAF through the guidance it provides on how to collect primary governance data for any given thematic area.
Step 3 Identifying and implementing solutionsThe identification of solutions is done through:• Anassessmentofsolutions
based on impact• Anassessmentofsolutions
based on feasibility
The feasibility assessment includes:• agovernance dimension• an‘additional factors’
dimension which is often used to refer to systemic governance issues, e.g., corruption
Similar to step 1, the section of the GAF on ‘political will’ could be used here once again
Step 4 Planning and monitoring of implementation
The MAF emphasizes the importance of setting up an M&E system to track the implementation of the ‘solutions’ identified in step 3
One key messages of the GAF is that the monitoring of the processes leading to any given outcomes is as important as monitoring the outcomes themselves, to ensure that the delivery of these outcomes is done in a fair, transparent, etc. manner. One contribution of the GAF here could be to propose that a complementary ‘governance/cross-cutting issues dashboard’ be designed in step 4 to monitor the implementation processes of the identified solutions.

74 Assessing governAnce to Achieve heAlth And educAtion goAls
ANNEx 2: PRELIMINARy INTERvIEWS
This annex provides some practical guidance on the use of preliminary interviews in the context of a governance as-sessment. Interviews with stakeholders can be helpful to shortlist some key issues for the assessment, or to ensure that the chosen issues are indeed considered relevant for the country context. They can be conducted as a separate prelimi-nary step to a governance assessment or within an institutional and context analysis as described in Annex 3. Interviews can be semi-structured, with a set of prepared questions. A sample questionnaire is provided below.
Interviews with non-governmental stakeholders Stakeholder interviews are often done with NGO representatives, academics, journalists, or any other person that may have a stake or expertise on the issue.
This method can be helpful at the beginning of the assessment process, for example to explore a content area prior to designing a more systematic data collection tool such as a survey questionnaire. It can also be helpful at the later stages of an assessment, for example to question a member of an ethnic minority about the quality of the services they receive, based on earlier findings that minority regions may have inferior services. See the sample preliminary survey questionnaire from Macedonia below.
Interviewees should be prompted during the interview to justify any opinion they express. For example, if during an interview an NGO representative claims that there is discrimination against some disadvantaged group in the provision of an education or health service, the interviewee should be asked to justify that opinion with objective information that backs up this opinion.
Interviewing government authoritiesInterviewing government authorities and civil servants – a well-known method used in human rights investigations – can be very effective for identifying specific governance deficits, particularly when carried out with people at different levels of responsibility in the chain of service delivery. For instance, according to a recent report by Human Rights Watch on Maternal Mortality in Uttar Pradesh in India – “The low priority given to data on maternal deaths became evident to Human Rights Watch when senior officials from the Directorate of Family Welfare appeared unaware of their own report-ing formats. What directorate officials told us was directly contradicted by workers in the field.”122 This investigation also found that government officials gave Human Rights Watch conflicting accounts of procedures for grievance redressal.
General questions call for general answers that usually do not provide much useful information. Therefore, when inter-viewing civil servants (particularly those at senior level responsible for a programme or a specific service), researchers should be as specific and pointed as possible in the questions they ask. For instance, when conducting an assessment of corruption in the education sector, instead of asking a general question about the programme (e.g., ‘are there any major leakages in the disbursement of scholarships’ or “are the scholarships distributed in an equitable manner’), asses-sors can first confirm with the interviewee the criteria according to which those scholarships were supposedly allocated (which you have read in a publication of the Ministry of Education or elsewhere), then ask for the actual distribution of scholarships by municipality.
Whenever possible, assessors should try to triangulate anecdotal or ‘soft’ information with ‘harder’ sources, such as ac-tual budget allocations.123 For instance, if they are told by an official at the Health Ministry that all health facilities have fee schedules displayed in a prominent location in the facility, they should verify that when conducting fieldwork visits, or review a budget. The triangulation strategy is particularly important in cases when stakeholders may have strong incentives to misreport information.
122 Human Rights Watch, 2009123 Fritz et al., 2009

75 Assessing governAnce to Achieve heAlth And educAtion goAls
Sample preliminary questionnaireThe following questionnaire was designed for preliminary interviews in Macedonia in preparation for a study of social inclusion in the health and education sectors. It can be used as a model when conducting preliminary interviews.
This questionnaire is meant to be conducted with people that are stakeholders in the education or health sectors (e.g., government officials in one of the Ministries, academic experts in education or health, NGOs working in one of these fields) or stakeholders in the field of governance (e.g., parliamentarians or academic experts on governance). Therefore, every time that education/health is written in the questionnaire (services, sector, etc), the interviewer should choose how to pose the question, depending on the identity of the interviewee (e.g., regarding question 1, if the interviewee is from the Ministry of Education ask: “Are there any groups of the population in Macedonia that face more obstacles in accessing the same level of education services than the majority of the population?”)
1. Are there any groups of the population in Macedonia that face more obstacles in accessing the same level of educa-tion/health services than the majority of the population? If so, which groups? [Interviewer: if the response is only in terms of ethnic groups, follow up with this question: What about exclusion in terms of gender, where people live, etc?]
2. How do multiple or overlapping identities affect exclusion (for example, Roma women)?
3. Do you know or have any data to back-up your responses to questions 1 and 2? [if so, ask the interviewee to tell/give you the data]
4. Could you give examples in which ways are each of these groups excluded from education/health services?
5. In your opinion, what are the reasons why these group(s) are excluded from these services?
6. Some groups in Macedonia don’t have effective access to education/health services because
a. lack of sufficient money to pay for direct and indirect costs Strongly agree/Agree/Don’t know/Disagree/Strongly disagree
b. they are asked to pay bribes or give presents to get those services and they can’t afford it Strongly agree/Agree/Don’t know/Disagree/Strongly disagree
c. difficulties reaching service facilities (schools, health clinics, etc) Strongly agree/Agree/Don’t know/Disagree/Strongly disagree
d. Discriminatory treatment against these groups by service providers (teachers, nurses, doctors, etc) Strongly agree/Agree/Don’t know/Disagree/Strongly disagree
7. What are the main efforts made by the government to tackle social exclusion in the field(s) of education/health?
8. Are these efforts effective? Not at all/Not very much/Somewhat effective/Don’t know Explain:
9. What in your opinion are the problems/shortcomings of these efforts?
10. In your opinion, is there anything that the government could be doing and is not doing to ensure equal access to these services?

76 Assessing governAnce to Achieve heAlth And educAtion goAls
11. Is the government designing and implementing policies that meet the rights, needs and interests of all social groups? Are resources allocated accordingly? Who does not benefit as they should? Are any geographical areas excluded?
12. To what extent is the ability of citizens to hold public officials accountable for the delivery of education/health ser-vices affected by who they are (e.g., their ethnicity, gender, socioeconomic status, etc)
Not at all/Not very much/Somewhat influenced/Very much/Don’t know Explain:
13. To what extent does civil society facilitate links between government and citizens in such a way that increases the voice and involvement of women and excluded people?
Not at all/Not very much/Somewhat/Very much/Don’t know Explain:
14. To what extent information and data about the distribution of education/health services across different groups is accessible to the public?
Not at all/Not very much/Somewhat/Very much/Don’t know Explain:
15. To what extent is the exclusion of some groups in Macedonia from education/health services associated with prob-lems related to the decentralization of these sectors?
Not at all/Not very much/Somewhat/Very much/Don’t know Explain:
16. The following problems related to the decentralization of the education sector contribute to the exclusion of some groups from education services:
a. lack of coordination between various tiers of government Strongly agree/Agree/Don’t know/Disagree/Strongly disagree
b. lack of sufficient resources by the poorer municipalities Strongly agree/Agree/Don’t know/Disagree/Strongly disagree
c. different political affiliation of education minister at the central government and mayor of municipalities where a large proportion of the excluded group lives Strongly agree/Agree/Don’t know/Disagree/Strongly disagree
d. different ethnic group of minister at the central government and most people living in some municipalities Strongly agree/Agree/Don’t know/Disagree/Strongly disagree
17. Are there any other governance issues that affect the exclusion of some groups in Macedonia from equal access to education/health services?
18. Could you please tell me of any study you are familiar with that has been done until now in the area of social exclu-sion in the education/health sectors in Macedonia?
19. Could you please tell me of any study you are familiar with that has been done until now in any of the areas of gov-ernance (e.g., accountability, transparency, participation) in Macedonia?

77 Assessing governAnce to Achieve heAlth And educAtion goAls
ANNEx 3 – CONDUCTING A POLITICAL ECONOMy ANALySIS
Comprehensive political economy analysis tools have been developed by bilateral and multilateral development organ-izations over recent years in an effort to understand why technically-sound interventions have not delivered expected results. While some of these tools have been used to support the foreign policy objectives of donor countries, others are used to inform programming and to support dialogue with national partners on key policy areas. As a response to demand from UNDP’s country offices, which wanted further support in analysing the local political and economic con-texts, UNDP developed an approach on Institutional and Context Analysis (ICA), which is described in a Guidance Note.
The overall goal of political economy analysis is to understand the political, economic and social processes in society – specifically, the incentives, relationships, distribution and contestation of power between different groups and indi-viduals – which contribute to the achievement of short- and medium-term development plans on local and national levels and have an impact on development outcomes. The ICA can help UNDP country offices become more strategic in their engagement with different actors and sectors. It does this by providing a framework for understanding the incen-tives and constraints that frequently pit social actors against one another, and against UNDP development interven-tions. Rather than undertaking situation analyses that rely on vague notions of ‘political will’, ICA instead focuses on how some actors stand to lose if a development programme is successful, while others are seen to win. National legislators, for example, may lose sources of patronage if civil service recruitment becomes more meritocratic, while national civil servants may lose if administrative functions are decentralized. The ICA is conceptually grounded in the following set of assumptions of how development works:
1. Development requires a change in power relations and/or incentive systems. 2. The powerful reward their supporters before anyone else. 3. Resources shape actors’ incentives. 4. But all stakeholders in society have constraints.124
The ICA process, as outlined in the Guidance Note, includes a series of questions to be asked for each of these assump-tions, with the aim of discovering the incentives for actors to engage in behaviour leading to pro-poor, gender-sensi-tive, development.
Having understood these assumptions and their importance to the analysis, the ICA takes the development practitioner through four steps of analysis which are thought to be useful to the development or modification of the project or pro-gramme in question:
Step 1: Defining the scope of the analysis
Step 2: Stakeholder and engagement analysis •Mappingthekeyactors,theirincentivesandtherulesthatconstrainthem,includinggenderrelations. •Identifyinghowtoengagewithdifferentsetsofstakeholders
Step 3: Identifying entry points and risks: •GiventhefindingsfromStep2,whatarethemostpromisingentrypoints? •Whataretherisks,andhowcantheybemitigated?
Step 4: Potential for change and areas to be prioritized
124 For more information on the assumptions and the ICA process, please see UNDP, 2012

78 Assessing governAnce to Achieve heAlth And educAtion goAls
The ICA can be applied to any sector in a development project or programme where it seems to be difficult to obtain the desired result, and at any time in the project or programme cycle. In this way, the ICA can help bring out the ‘hidden agendas’ and the relationships and dynamics between institutions and actors, which may not always appear through a situational analysis. Based on the assumption that formal and informal institutions – and incentives, or the lack thereof – shape or affect behaviour, the ICA can help highlight why change isn’t taking place and why certain actors behave the way they do, unpacking what many refer to as ‘political will’. This approach also allows development practitioners to plan their risk mitigation more meticulously.
An alternative political economy analysis, the ICA can be of great use to the Governance Assessment Framework and its application in health and education, or any other sector. While relevant to all three layers of analysis outlined in the GAF, it may be particularly useful with regard to layers 2 and 3. Its particular relevance to the GAF is further highlighted by the fact that social exclusion, inequalities and socio-economic disparities are a result of political and economic factors. By exploring these factors, and how different political and economic actors and institutions interact, it may be easier to address the challenges of changing these power structures and ensuring that development is achieved by also reach-ing out to the vulnerable, the poor and the marginalized.
For more information on the ICA, see the Guidance Note at www.undp.org/content/undp/en/home/librarypage/democratic-governance/oslo_governance_centre/Institutional_and_Context_Analysis_Guidance_Note/

79 Assessing governAnce to Achieve heAlth And educAtion goAls
REFERENCES
Afrobarometer (2006). An African-led series of national public attitude surveys on democracy and governance in Africa. Round 3 Survey 2005-2006.
Amin S. and N. Chaudhuri (2008). An Introduction to Methodologies for Measuring Service Delivery in Education” in Are You Being Served? New Tools for Measuring Service Delivery, ed. Amin et al. Washington: World Bank.
Amnesty International (2003). Prisoners in our own homes: Amnesty International’s concerns for the human rights of minorities in Kosovo. Amnesty International.
Amnesty International (2004). Myanmar: The Rohingya Minority – Fundamental Rights Denied.
S. Anand, F. Diderichsen, T. Evans, V. Shkolnikov, M. Wirth (2001). Measuring Disparities in Health: Methods and Indicators, in Challenging Inequities in Health: From Ethics to Action, ed. T. Evans, M. Whitehead. New York: Oxford University Press.
S. Baines (2005). Controlling Corruption: Lessons from the School Improvement Grants Program in Indonesia, International Conference Education Finance and Decentralization. Washington DC: World Bank.
D. Beetham (2006). Parliament and democracy in the twenty-first century: A guide to good practice. Inter-Parliamentary Union.
J. Biswas and J. S. Verma (2004). Tackling Child Undernutrition in India: Governance Challenges Need More Attention, in Lifting the Curse: Overcoming Persistent Undernutrition in India, eds. L. Haddad and S. Zeitlyn. IDS Bulletin, Volume 40, Number 4.
F. Bokhari, Y. Gai and P. Gottret (2007). Government health expenditures and health outcomes, in Health Economics, vol. 16, pp. 257–273.
M. Bratton (2007). Are You Being Served? Popular Satisfaction with Health and Education Services in Africa, Afrobarometer Working Papers 65.
B. Branisa, S. Klasen, and M. Ziegler (2009). Why we should all care about social institutions related to gender inequality. Poverty, Equity and Growth - Discussion Paper #10. Courant Research Centre.
D. Brinkerhoff (2000). Assessing Political Will for Anti-Corruption Efforts: An Analytic Framework, Public Administration and Development, vol. 20 (3), pp. 239-252.
D. Brinkerhoff and A. Goldsmith (2004). Clientelism, Patrimonialism and Democratic Governance: An Overview and Framework for Assessment and Programming, prepared for USAID. Available at: www.abtassociates.com/reports/2002601089183_30950.pdf
D. Brinks and V. Gauri (2008). A New Policy Landscape: Legalizing Social and Economic Rights in the Developing World, in Courting Social Justice: Judicial Enforcement of Social and Economic Rights in the Developing World, eds. D. Brinks and V. Gauri.
A. Bhuiya, M. Chowdhury, F. Ahmed, and A. Adams (2004): Bangladesh: an Intervention Study of the factors underlying increasing equity in child survival, in Challenging Inequities in Health: From Ethics to Action., ed. T. Evans et al. New York: Oxford University Press.
Center for Economic and Social Rights CESR (2008). ‘Fact Sheet No 1 – India’. Available at: http://www.cesr.org/downloads/India%20Fact%20Sheet.pdf
N. Chaudhury, J. Hammer, M. Kremer, K. Muralidharan and F. Halsey Rogers (2006). Missing in Action: Teacher and Health Worker Absence in Developing Countries, in The Journal of Economic Perspectives, vol. 20 (1), pp. 91-116.

80 Assessing governAnce to Achieve heAlth And educAtion goAls
A. Cheema and S. Mohmand (2006). Bringing Electoral Politics to the Doorstep: Who Gains Who Loses?. Available at: http://policydialogue.org/files/events/Cheema_Mohmand_Electoral_Politics_Who_Gains_Who_Loses.pdf
L. Corner (2008). Making the MDGs Work for All: Gender-Responsive Rights-Based Approaches to the MDGs. New York: UNIFEM.
Centre for Human Rights and Evictions (COHRE) (2006). Leading Cases on Economic, Social and Cultural Rights: Summaries.
Commonwealth Parliamentary Association (CPA) (2006). Benchmarks for Democratic Legislatures: A Study Group Report.
R.C. Crook and A.S. Sverrisson (2003). Does Decentralisation Contribute to Poverty Reduction? Surveying the Evidence, in Changing Paths: International Development and the New Politics of Inclusion, eds. P.P. Houtzager and M. Moore. Ann Arbor: University of Michigan Press 233–59.
R.C. Crook and A.S. Sverrisson (2011). Decentralisation and Poverty-Alleviation in Developing Countries: A Comparative Analysis or, is West Bengal Unique?, IDS Working Paper 130. Brighton: IDS.
M.R. Cyan, J. Martinez-Vazquez and A. Timofeev (2009). Feasibility Study Financing Equitable Service Delivery for All Citizens
J. Das, J. Hammer and K. Leonard (2008). The Quality of Medical Advice in low-income Countries, in Journal of Economic Perspectives, vol. 22 (2), pp. 93-114.
J. Das and K. Leonard (2008). Use of Vignettes to Measure the Quality of Health Care, in Are You being Served? New Tools for measuring Service Delivery, eds. S. Amin, J. Das and M. Goldstein. Washington D.C.: The World Bank.
Demographic and Health Survey (DHS) (2006). Niger
A. De Grauwe (2009). School Monitoring Systems and their Impact on Disparities, Background paper prepared for the Education for All Global Monitoring Report 2009: Overcoming Inequality: why governance matters.
S. De Jaegere and S. Finley (2009). Mapping accountability in the health sector and developing a sectoral assessment framework Mongolia. Bangkok: UNDP Regional Centre in Bangkok.
U. Deichmann (1999). Geographic aspects of inequality and poverty. Available at: http://siteresources.worldbank.org/INTPGI/Resources/Pro-Poor-Growth/5319_povmap.pdf
UK Department for International Development (DFID) (2005). Using Drivers of Change to improve aid effectiveness. DFID Practice Paper.
DFID (2006a). Eliminating World Poverty: Making Governance Work for the Poor - A White Paper on International Development. London: DFID.
DFID (2006b). Governance, Development and Democratic Politics: DFID’s work in building more effective states. London: DFID.
J. Di John (2006). The Political Economy of Taxation and Tax Reform in Developing Countries, Research Paper No. 2006/74. World Institute of Development Economics Research (WIDER).
W. Easterly (2001). The Political Economy of Growth Without Development - a case study of Pakistan. Paper for the Analytical Narratives of Growth Project. Cambridge, Massachusetts: Kennedy School of Government, Harvard University.

81 Assessing governAnce to Achieve heAlth And educAtion goAls
ENCOVI (2006). Encuesta Nacional de Condiciones de Vida 2006. Guatemala City: Instituto Nacional de Estadística.
G. Erdmann and U. Engle (2006). Neopatrimonialism Revisited: Beyond a Catch-All concept, GIGA Working Paper No 16. Hamburg: German Institute of Global and Area Studies.
E. Felner (2008). A new frontier in economic and social rights advocacy? Turning quantitative data into a tool for human rights accountability, in Sur: International Journal on Human Rights, Year 5, Number 9. Available at: www.surjournal.org/eng/conteudos/pdf/9/felner.pdf
E. Felner (2009). Closing the ‘Escape Hatch’ - A Toolkit to Monitor the Progressive Realization of Economic, Social and Cultural Rights, in Oxford Journal of Human Rights Practice, Vol. 1, Issue 3. Oxford.
Education for All Fast Track Initiative (EFA FTI) (2008). Guidelines for assessment and endorsement of the primary education component of an education sector plan. Washington D.C.: Worldbank. Available at: www.worldbank.org/education/efafti/documents/assessmentguidelines.pdf
V. Fritz, K. Kaiser and B. Levy (2009). Problem-Drive Approach to Governance and Politica Economy: Good Practice Framework. Washington D.C.: World Bank.
S. Fukuda-Parr, T. Lawson-Remer, and S. Randolph (2008). Measuring the Progressive Realization of Human Rights Obligations: An Index of Economic and Social Rights Fulfillment. Connecticut: University of Connecticut. Available at www.econ.uconn.edu/working/2008-22.pdf
S. Fukuda-Parr and J. Greenstein (2010). How should MDG implementation be measured?. Working paper no. 63. Brasilia: International Policy Centre for Inclusive Growth.
Fundar (2004). Dignity Counts: A Guide to Using Budget Analysis for Human Rights. Centro de Análisis e Investigación, International Budget Project, International Human Rights Internship Program. Available at: www.internationalbudget.org/wp-content/uploads/Dignity-Counts-A-Guide-to-Using-Budget-Analysis-to-Advance-Human-Rights-English.pdf
V. Gauri (2004). Social Rights and Economics: Claims to Health Care and Education in Developing Countries, in World Development 32(3), pp. 465-477.
M. Grindle (2004). Despite the Odds - The Contentious Politics of Education Reform. Princeton and Oxford: Princeton University Press.
L. Haddad (2009. Introduction: Lifting the Curse: Overcoming Persistent Undernutrition in India, in Lifting the Curse: Overcoming Persistent Undernutrition in India, eds. L. Haddad and S. Zeitlyn. IDS Bulletin, Volume 40, Number 4.
Human Rights Watch (2009). No Tally of the Anguish - Accountability in Maternal Health Care in India.
Inter-American Development Bank (2006). Informe sobre la situación del servicio civil en América Latina. Washington D.C.: Inter American Development Bank.
International Organization of Supreme Auditing Institutions (INTOSAI) (1977). The Lima Declaration of Guidelines on Auditing Precepts, adopted at the 9th International Congress of Supreme Audit Institutions in Lima, Peru. Available at: http://internationalbudget.org/wp-content/uploads/LimaDeclaration.pdf
Joint Learning Initiative (2004). Human Resources for Health: Overcoming the Crisis. Boston: Harvard University Global Equity Initiative.
M. Kremer, N. Chaudhury, F. H. Rogers, K. Muralidharan, and J. Hammer (2005). Teacher Absence in India: A Snapshot, in Journal of the European Economic Association, Vol. 3, No. 2-3, pp. 658-667.

82 Assessing governAnce to Achieve heAlth And educAtion goAls
Lakshminarayanan (2003). Decentralisation and its Implications for Reproductive Health: The Philippines Experience
Maureen Lewis and Gunilla Pettersson, Governance in health care delivery, Policy Research Working Paper 5074, (World Bank, 2009)
M. Lindelow and A. Wagstaff (2008). Assessment of Health Facility Performance – An introduction to data and measurement issues, in Are You being Served? New Tools for measuring Service Delivery, eds. Amin, J. Das and M. Goldstein. Washington D.C.: The World Bank.
F. Longo (2002). Analytical framework for institutional assessment of civil service systems. Washington D.C.: Inter-American Development Bank. Available at: http://idbdocs.iadb.org/wsdocs/getdocument.aspx?docnum=626933
Measure DHS (undated). STAT compiler (available at www.statcompiler.com/)
R. Mattes (2008). The Material and Political Bases of Lived Poverty in Africa: Insights From the Afrobarometer, in Barometers of Quality of Life Around the Globe: How Are We Doing?, eds. Valerie Møller, Dennis Huschka & Alex Michalos, pp. 161-186. Springer Science Business Media B.V.
R. McGee and J. Gaventa (2010). Review of Impact and Effectiveness of Transparency and Accountability Initiatives: Synthesis Report, prepared for the Transparency and Accountability Initiative Workshop, 14 – 15 October 2010. Available at: www.transparency-initiative.org/wp-content/uploads/2011/05/synthesis_report_final1.pdf
S. Mehrotra, J. Vandemoortele and E. Delamonica (1996). Basic Services for All? Public Spending and the Social Dimensions of Poverty. United Nations Children’s Fund: Innocenti Research Centre.
Ministerio de Educacion de Guatemala (2005). Memoria de labores del Ministerio de Educación. Guatemala
Ministerio de Educacion de Guatemala (2006). Sistema Nacional de Indicadores Educativos Guatemala 2006. Guatemala
M. Moore, J. Leavy and H. White (2003). Polity qualities: How Governance Affects Poverty?, in Changing Paths. International Development and the New Politics of Inclusion, eds. P.Houtzager, and M. Moore. Ann Arbour: University of Michigan Press.
Pan American Health Organization (1997). Health of Indigenous Peoples, in Pan American Journal of Public Health 2(5): pp. 357-62.
A. Preker (2003). From Health to Wealth and Back to Health: The Funding Gap in Social Protection against the Cost of Illnes, paper presented at the International Symposium on Social Protection and Solidarity in Developing Countries, Turin, Italy, 23–25 April 2003.
Presidential Peace Commission of the Government of Guatemala and Unidad Revolucionaria Nacional Guatemalteca (1996). Agreement on Social and Economic Aspects and Agrarian Situation, 6 May 1996.
A.S. Rajkumar and V. Swaroop (2008). Public spending and outcomes: Does governance matter?, in Journal of Development Economics, Volume 86, Issue 1, pp. 96–111. Availabel at: http://dx.doi.org/10.1016/j.jdeveco.2007.08.003
V. Rankumar (2008). Our Money, Our Responsibility: A Citizens’ Guide to Monitoring Government Expenditures. The International Budget Project. Available at www.internationalbudget.org/resources/expenditure/index.htm
G. Raso, J. Utzinger and K.D. Silue (2005). Disparities in parasitic infections, perceived ill health and access to health care among poorer and less poor schoolchildren in rural Côte d’Ivoire, in Tropical Medicine and International Health, v. 10, n. 1, pp. 42-57.

83 Assessing governAnce to Achieve heAlth And educAtion goAls
R. Reinikka and N. Smith (2004). Public Expenditure Tracking Surveys in Education. Paris: UNESCO, International Institute for Educational Planning.
F. Rubio and V. Salanic (2005). Diagnóstico De Habilidades de Lectura y Matemática de Docentes de Primer y Tercer Grado en Escuelas Públicas de Guatemala. Guatemala: USAID.
A. Sen (1992). Inequality Re-examined. Cambridge Massachusetts: Mass Harvard University Press.
G. Sen (1992). Institutions – What do we know and what can we do?, International Seminar on Informal Institutions and Development, Input Paper for Session A: Gender
J. Shiffman (2007). Generating Political Priority for Maternal Mortality Reduction in 5 Developing Countries. American Journal of Public Health, Vol 97, No. 5, pp.796-803. Washington D.C.
L. Smith, U. Ramakrishnan, A. Ndiaye, L. Haddad and R. Martorell (2003). The Importance Of Women’s Status For Child Nutrition In Developing Countries. International Food Policy Research Institute, Research Report 131. Washington D.C..
F. Stewart (1985). Planning to Meet Basic Needs. London: Macmillan.
Tendler (2003). The Fear of Education, in background paper for Inequality and the State in Latin America and the Caribbean. Washington D.C.: World Bank.
Transparency International (2009). Corruption in the Education Sector.
Transparency International (2010). The Anti-Corruption Catalyst: Realizing the MDGs by 2015.
Daniel Treisman (2000). The Causes of Corruption: A Cross-National Study, in Journal of Public Economics 76(3): 399-457.
United Nations (2009). The Millennium Development Goals Report. New York.
UN Millennium Project (2005a). Investing in Development: A Practical Plan to Achieve the Millennium Development Goals. New York
UN Millennium Project (2005b). Taking Action: Achieving Gender Equality and Empowering Women, Task Force on Education and Gender Equality.
UN General Assembly (1993). Principles Relating to the Status and Functions of National Institutions for the Promotion and Protection of Human Rights, adopted by the UN General Assembly in its Resolution 48/1993. New York.
UNDP (1991). Human Development Report 1991: Financing Human Development. Available at: http://hdr.undp.org/en/reports/global/hdr1991/
UNDP (2004a). Access to Justice, Practice Note. New York: United Nations. Available at www.undp.org/governance/docs/Justice_PN_En.pdf
UNDP (2004b). Democracy in Latin America - Towards a Citizens’ Democracy. Available at: http://www.un-ngls.org/orf/democracy-undp-publication.htm
UNDP (2005a). Human Development Report 2005: International Cooperation at a Crossroads: Aid Trade and Security in an Unequal World. Availabel at: http://hdr.undp.org/en/reports/global/hdr2005/
UNDP (2005b). Guatemala: Diversidad étnico-cultural y desarrollo humano: La ciudadanía en un estado plural. Informe Nacional de Desarrollo Humano 2005. Guatemala: United Nations Development Program.

84 Assessing governAnce to Achieve heAlth And educAtion goAls
UNDP (2006a). Methodology for Anti-Corruption Participatory Monitoring for Health and Education sectors. Armenia: Yerevan. Available at http://europeandcis.undp.org/uploads/public1/files/ACPN/APMM_English_Publishing_final%5B1%5D.doc
UNDP (2006b). Measuring Democratic Governance: A framework for selecting pro-poor and gender sensitive indicators. Oslo: United Nations Development Program. Available at: http://www.undp.org/content/rbas/en/home/presscenter/events/2012/November/regional_governance_week/_jcr_content/centerparsys/download_12/file.res/Measuring%20Democratic%20Governance_English%20Paper.pdf
UNDP (2007a). Access to basic services for the poor: the importance of good governance. Available at: http://www.unescap.org/pdd/publications/Mdg-access2basic-service/Mdg-access-to-basic-services.pdf
UNDP (2007b). Measuring Human Development: A Primer. Available at: http://hdr.undp.org/en/humandev/learnmore/title,4182,en.html
UNDP (2007c). Human Rights and the Millennium Development Goals: Making the Link. Available at http://hurilink.org/Primer-HR-MDGs.pdf
UNDP (2008a). A Users’ Guide to Measuring Corruption. Available at: http://gaportal.org/resources/detail/a-users-guide-to-measuring-corruption
UNDP (2008b). Strengthening Awareness and Response in Exposure of Corruption in Armenia, Final Report: Findings of the Anti-Corruption Participatory Monitoring Conducted in Health and Education Sectors by Civil Society Anti-Corruption Groups. Yerevan: UNDP Armenia.
UNDP (2009a). A Users’ Guide to Measuring Gender-Sensitive Basic Public Service Delivery. Oslo: United Nations Development Program. Available at: http://gaportal.org/resources/detail/a-users-guide-to-measuring-gender-sensitive-basic-service-delivery
UNDP (2009b). Users’ Guide to Measuring Local Governance. Oslo: United Nations Development Program. Available at: www.gaportal.org/resources/detail/a-users-guide-to-measuring-local-governance
UNDP (2009c). Millennium Development Goal 9: Indicators and the state of democracy in Mongolia.
UNDP (2010a). A Users’ Guide to Civil Society Assessments. Oslo: United Nations Development Program. Available at: http://gaportal.org/resources/detail/users-guide-to-civil-society-assessments)
UNDP (2010b). Methodology for the Assessment of Capacity of Municipalities in Turkey and the Western Balkans to Deliver Services. Available at: http://gaportal.org/resources/detail/methodology-for-the-assessment-of-capacity-of-municipalities-in-turkey-and-the-western-balkans-to-de)
UNDP (2010c). Beyond the Midpoint: Achieving the Millennium Development Goals. New York: United Nations Development Program.
UNDP (2010d). Unlocking progress: MDG acceleration on the road to 2015. Lessons from the MDG Acceleration Framework pilot countries. New York: United Nations Development Program. Available at: www.undp.org/content/undp/en/home/librarypage/mdg/unlocking-progress-maf-lessons-from-pilot-countries/
UNDP (2010e). What will it take to achieve the Millennium Development Goals?. New York: United Nations Development Program.
UNDP (2010f ). Fostering Social Accountability: from principle to practice, Guidance Note. Oslo: United Nations Development Program.

85 Assessing governAnce to Achieve heAlth And educAtion goAls
UNDP (2012). Institutional and Context Analysis Guidance Note. Oslo: United Nations Development Program. Available at www.undp.org/content/undp/en/home/librarypage/democratic-governance/oslo_governance_centre/Institutional_and_Context_Analysis_Guidance_Note/)
UNESCO (2003). EFA Global Monitoring Report 2003/4: Gender and Education for All – The leap to Equality. Paris: UNESCO Available at: http://unesdoc.unesco.org/images/0013/001325/132513e.pdf
UNESCO (2006), EFA Global Monitoring Report 2006: Literacy for Life. Paris: UNESCO
UNESCO 2008). EFA Global Monitoring Report: Education for All by 2015. Will we make it?. Paris: UNESCO.
UNESCO (2009). EFA Global Monitoring Report 2009: Overcoming Inequality: Why Governance Matters. Paris: UNESCO.
UNICEF (2008). Emerging challenges for children in Eastern Europe and Central Asia. Geneva: UNICEF.
UNIFEM (2008). Progress of The World’s Women 2008/2009: Who answers to women? Gender and accountability. New York: UNIFEM.
J. Vandemoortele (2009). Taking the MDGs Beyond 2015: Hasten Slowly. Devon. Available at: www.devstud.org.uk/downloads/4b9ea0272d30b_Vandemoortele_PAPER.pdf)
A. Wagstaff, F. Bustreo, J. Bryce, M. Claeson (2004). Child health: reaching the poor, in American Journal of Public Health; vol. 94, p.726–36.
A. Wagstaff, M. Claeson, R. Hecht, P. Gottret and Q. Fang (2006). Millennium Development Goals for Health: What Will It Take to Accelerate Progress? in Disease Control Priorities in Developing Countries, eds. D.T. Jamison, J.G Breman, A.R Measham, et al., 2nd edition. Washington, DC: World Bank.
WHO, UNICEF and UNFPA (1997). Methodological Issues in Measuring Maternal Mortality. Guidelines for Monitoring the Availability and Use of Obstetric Services. Washington D.C. Available at www.who.int/ reproductive-health/publications/unicef/monitoring_obstetric_services.pdf
Wiener (1990). The Child and the State in India. Princeton, New Jersey: Princeton University Press.
World Bank (undated 1). Public Expenditure Tracking Surveys (PETS). Washington D.C. Available at http://go.worldbank.org/KQQS1BDG90.
World Bank (undated 2). Individual Performance Management. Washington. D.C. Available at http://go.worldbank.org/EK0211BMW0
World Bank (undated 3). Public Expenditure and Financial Accountability (PEFA) Framework. Washington D.C.: World Bank. Available at http://go.worldbank.org/XS9RD1JSG0
World Bank (undated 3). Education Statistics. Washington D.C.: World Bank Available at www.worldbank.org/education/edstats
World Bank (2000). Bolivia: From Patronage to a Professional State, Bolivia Institutional and Governance Review (In Two Volumes), Volume l: Main Report August 25, Poverty Reduction and Economic Management, Latin America and the Caribbean Region. Document of the World Bank.
World Bank (2002). Survey of Education and Health Providers, Background Study for the World Development Report 2003/04 on Basic Service Delivery’. Washington D.C.: World Bank. Available at http://siteresources.worldbank.org/DEC/Resources/PS.service.provider.Absenteeism.project.nov1.2002.pdf

86 Assessing governAnce to Achieve heAlth And educAtion goAls
World Bank (2003a). Inequality in Latin America and the Caribbean: Breaking with History? Washington D.C.: World Bank.
World Bank (2003b). Case Study 1 - Bangalore, India: Participatory Approaches in Budgeting and Public Expenditure Management. Washington D.C.: World Bank. Available at https://openknowledge.worldbank.org/handle/10986/11308)
World Bank (2004a). World Development Report: Making services work for the poor. Washington D.C.: World Bank.
World Bank (2004b). Citizen Report Card Surveys; - A Note on the Concept and Methodology. Washington D.C.: World Bank.
Available at http://web.worldbank.org/servlets/ECR?contentMDK=20511066&sitePK=410136)
World Bank (2005a). Pakistan Country Gender Assessment: Bridging the Gender Gap: Opportunities and Challenges. Washington D.C.: World Bank.
World Bank (2005b). The Community Score Card Process in Gambia, SD Note no. 100. Washington D.C.: World Bank.
World Bank (2008). World Development Indicators. Washington D.C.: World Bank.
K. Xu, D. Evans, K. Kawabata, R. Zeramdini, J. Klavus, and C. J. L. Murray (2003). Household Catastrophic Health Expenditure: A Multi-Country Analysis, in The Lancet 362:111–7.
A.S. Yazbeck 2009. Attacking Inequality in the Health Sector: A synthesis and evidence of tools. Washington D.C.: World Bank.