Discriment analysis
18
Seminar by LIVI WILSON DFK 1305
-
Upload
college-of-fisheries-kvafsu-mangalore-karnataka -
Category
Education
-
view
35 -
download
0
Transcript of Discriment analysis
Seminar by
LIVI WILSON
DFK 1305

Discriminant analysis• Discriminant analysis is a branch of multivariate
statistics. It is a regression based statisticaltechnique used in determining which particularclassification or group an item of data oran object belongs to, on the basis ofits characteristics or essential features.

• Discriminant Analysis is a multivariate statisticaltechnique used when the dependent variable iscategorical and the independent variables arequantitative.
• Discriminant Function Analysis (DA) undertakes thesame task as multiple linear regression by predicting anoutcome .

• In many cases, the dependent variable consists of two groups orclassifications, for example, male versus female, high versus low orgood credit risk versus bad credit risk, therefore to classifybetween them we use Linear Discriminant Analysis (LDA).
• When three or more classifications are there for naturallyoccurring groups such as low, medium and high, differentlocations, this technique is referred to as Multiple DiscriminantAnalysis (MDA).

Objective• Its primary objective is to predict an individual's inclusion in
a group when his inclusion and a set of observations aboutthe group are known. This happens through a process ofdiscriminating one observed variable against the others.
• The second objective is to determine the quality of theobserved variables in the set. Determining variable qualityhelps improve the analysis' margin of error.

Group Inclusion
• For example, to predict the probability that someone will be included in a group of successful college graduates at university, use the known observation set of scores, high school grade point average, having an older sibling in college and class rank.

Variable Quality
• The secondary objective of discriminant analysis is to determine the quality of the variable used in your primary prediction. In our example, once time has passed and you can observe the group of successful college graduates, you can model your prediction theory against the actual outcome. You can determine which variables were best at predicting an individual's successful inclusion.

Controling Predictive Error
• Analyzing the predictive theory against actualresults creates a third objective, improving thepredictive model for the future. Using your analysis,you can show which variables were most relevant tosuccess.

Advantages
• Discrimination of different groups
• Accuracy of classification of groups can be determined
• Helps for categorical regression analysis
• Visual graphics makes clear understanding for the two or more
categories with computational logics.

• Linear discrimination cannot be used when subgroups are
stronger.
• The selection of the predictor variables are not strong until
a strong classification exists.
• It cannot be used when there is insufficient data to define
sample means
• If the number of observations are less, the discrimination
method cannot be used.
Disadvantages

Applications
• Widespread application in situations where the primary
objective is identifying the group to which an object belongs
• Agriculture- Fisheries, Crop studies, yield studies,
Geoinformatics, Bioinformatics
• Socio-economics and Behavioral studies of Fishermen
communities
• Morphometric analysis and taxonomic investigation

Applications
• Dynamics of the marine plankton, algae and
nekton on a spatial and temporal scale
• Stock structure studies in fish populations
• Hydrological and physico-chemical studies in
different water resources

• Bankruptcy prediction based on accounting ratios and other
financial variables (LDA)
• Face recognition (Computerized)
• Marketing –Different types of customers and products based on
surveys.
Applications
• The observations should be from the random sample.
• Each predictor variable is normally distributed.
• There must be at least two groups or categories.
• Each group or category must be well defined, clearly
differentiated from any other group(s).
• It deals large data sets only and invariable sample size also.
Assumptions
Hypothesis
• Discriminant analysis tests the following hypotheses:
H0: The group means of a set of independent variables
for two or more groups are equal.
Against
H1: The group means for two or more groups are not
equal
• This group means is referred to as a centroid.

Contd…
• If the overlap in the distribution is small, the
discriminant function separates the groups well.
• If the overlap is large, the function is a poor
discriminator between the groups.
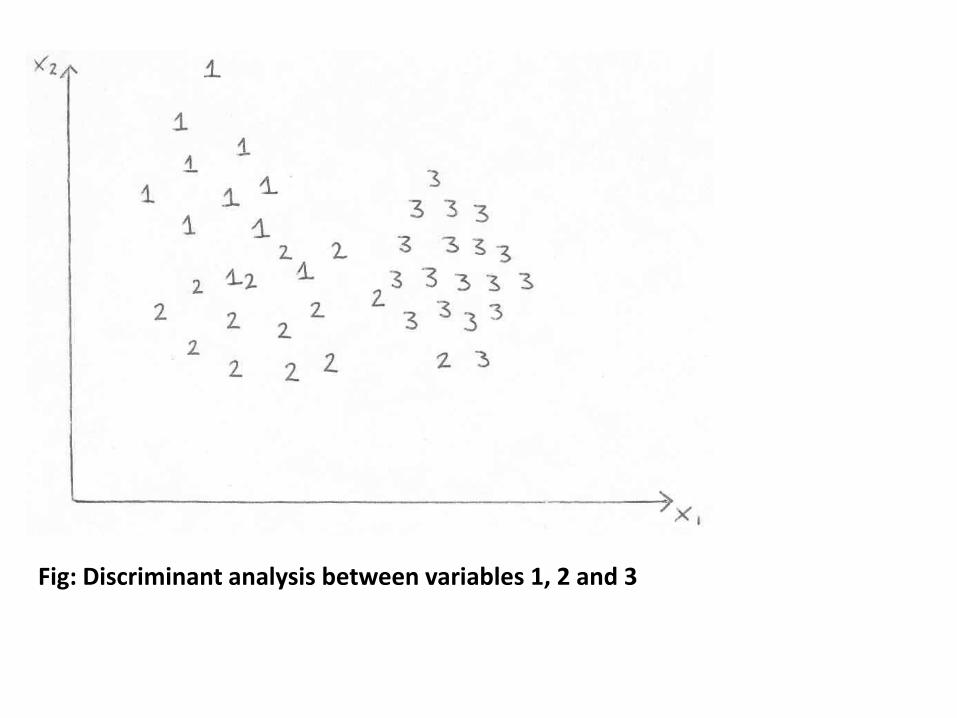
Fig: Discriminant analysis between variables 1, 2 and 3