Ratio Analysis. Financial Analysis Comparing Financial Statements Condensed Statement Analysis Trend...
19
Ratio Analysis
-
Upload
samson-james -
Category
Documents
-
view
238 -
download
1
Transcript of Ratio Analysis. Financial Analysis Comparing Financial Statements Condensed Statement Analysis Trend...
Ratio Analysis
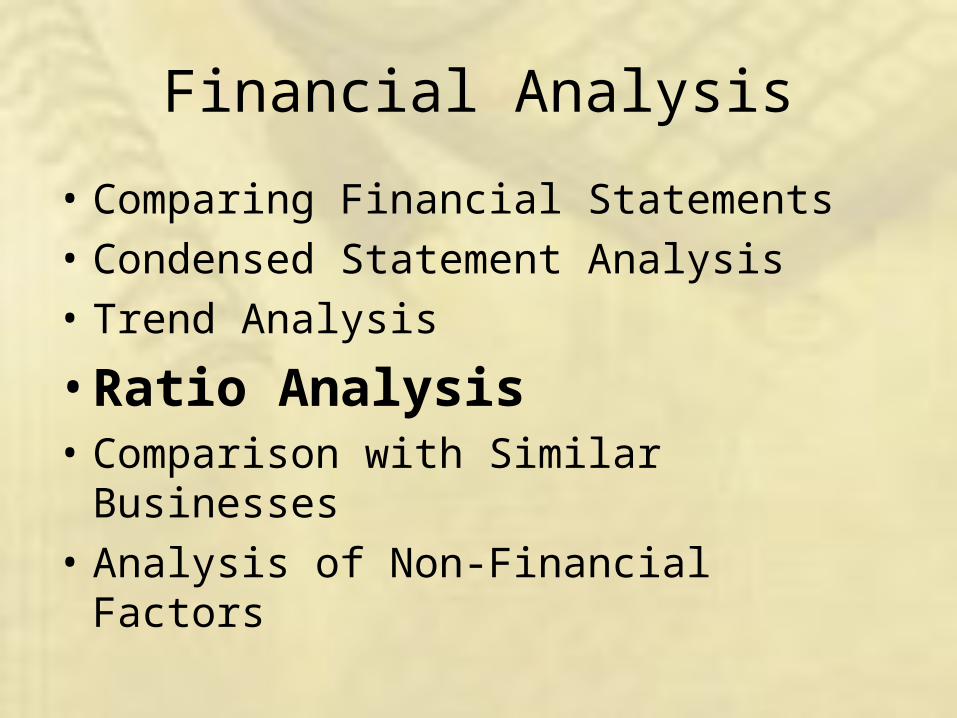
Financial Analysis
• Comparing Financial Statements• Condensed Statement Analysis• Trend Analysis
• Ratio Analysis• Comparison with Similar Businesses• Analysis of Non-Financial Factors

Homework Take-Up
Ratio Analysis
TODAY• Analysis of Liquidity• Analysis of Borrowing Capacity• Rate of ReturnIN THE FUTURE• Many, Many More!
Analysis of Liquidity
• Creditors want to make sure that a business is able to pay their debts
• Businesses can sell all their assets and creditors can collect
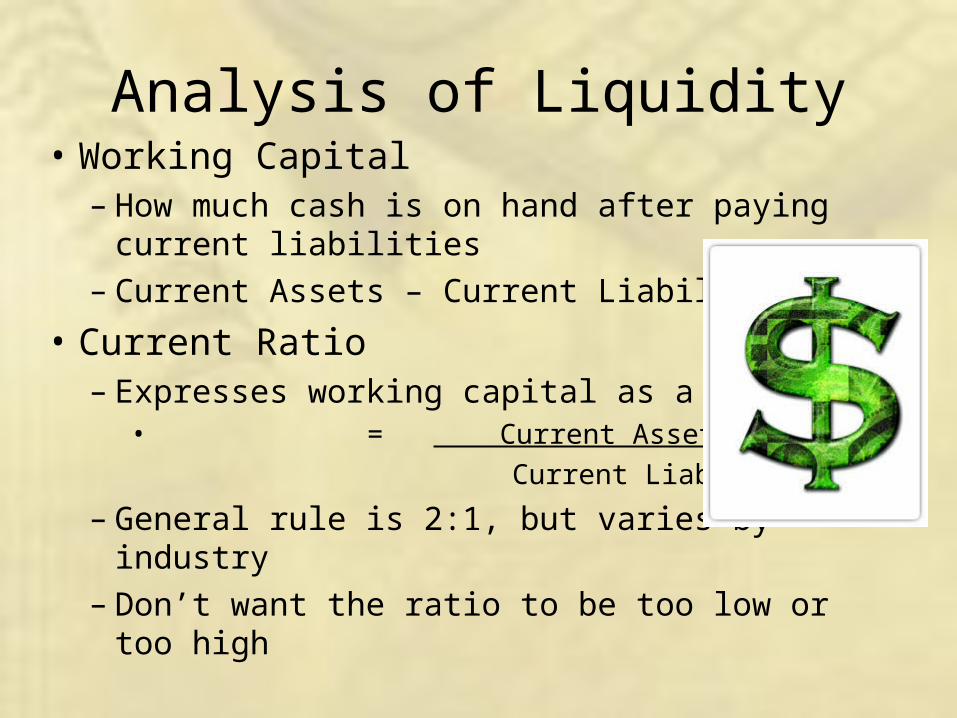
Analysis of Liquidity• Working Capital– How much cash is on hand after paying current
liabilities– Current Assets – Current Liabilities
• Current Ratio– Expresses working capital as a ratio• = Current Assets__ Current Liabilities
– General rule is 2:1, but varies by industry– Don’t want the ratio to be too low or too high
Analysis of Liquidity
WHAT DO BOTH WORKING CAPITAL AND CURRENT RATIO ASSUME
ABOUT ALL ASSETS?

Quick Ratio
• Only uses assets that are quickly converted to cash
• Cash• Accounts Receivable• Marketable Securities – SELL! SELL! SELL!
= Cash + A/R + Marketable Securities Current Liabilities
• General rule is 1:1

Lovett’s Lazer TagCondensed Balance Sheet
Dec. 31, 2013Assets
Current AssetsCash 10,200Accounts Receivable 300Merchandise Inventory 3,400Prepaid Expenses 1,200Total Current Assets 15,100Total Fixed Assets 124,000Total Assets 139,100
Liabilities and Owner’s Equity
Current Liabilities 24,300Long-Term Liabilities 43,000Total Liabilities 67,000Total Owner’s Equity 72,100Total Liabilities and Owners Equity 139,100

Turnover Ratios
Turnover Ratios• Restaurant – Table Turnover
• How many times can the restaurant get different people at the same table throughout the night
• More Turnover = More $$$$$ (revenue)• Accounting– Merchandise (Inventory) Turnover
• How many times can a restaurant sell their average inventory in a certain accounting period
= Cost of Goods Sold Average Inventory
Turnover Ratios• Accounts Receivable Collection Period– How long does it take a business to collect an average
accounts receivable?
= Average A/R x 365 Net Sales on Credit
– General rule: 45 days for a company with 30 day collection terms
– Too High: Too manyuncollectible = less $$$
– Too Low: Collection policies are too strict = lost business

Analysis of Borrowing Capacity
• Equity and Debt Ratio– Potential Lenders look at these ratios– How much of the business is financed by • Debt• Equity
– Lenders want to see higher Equity Ratio
– Business Owners want to see higher Debt Ratio
Analysis of Borrowing Capacity
• Equity Ratio= Owner’s Equity x 100% Total Assets
• Debt Ratio= Totals Debts x 100% Total Assets
• Debt Ratio + Equity Ratio = 100%– Debt and Equity are the only ways to finance a business

Rates of Return
• Rate of Return On Sales– How much are our sales contributing to the
bottom line.= Net Income x 100%
Net Sales
• Rate of Return on Average Owner’s Equity– The Owner or Investor could be putting their
money towards other businesses/ markets

Rate of Return on Average Owner’s Equity
• Steps– 1 – Average beginning and ending Owner’s Equity– 2 = Net Income_____ x 100%
Average Owner’s Equity
• Must be greater than the return the owner could get from other investments

All Ratios
• I have provided you with a handout of all of the ratios on a convenient two sided page!
• You will be allowed to take this into the exam with you– The formulas are not the important part• What the #’s mean and how to analyze them are
crucial
Comparison with Similar Businesses
• Many of the ratios and percentages we have discussed become more useful when compared to the competition– For example: compare net income with the
industry average• Gives further information on the success of the firm

Homework
• Reminder: There will be a quiz/test on all internal control lessons on Tuesday
• Today’s work: Page 683-688– 14, 17,19,20,21,22