Disclosures - IFFCO TOKIO General Insurance Co. Ltd. for … Disclosure... · FORM NL-1-B-RA...
52
1 NL-1-B-RA Revenue Account 2 NL-2-B-PL Profit & Loss Account 3 NL-3-B-BS Balance Sheet 4 NL-4-PREMIUM SCHEDULE Premium 5 NL-5-CLAIMS SCHEDULE Claims Incurred 6 NL-6-COMMISSION SCHEDULE Commission 7 NL-7-OPERATING EXPENSES SCHEDULE Operating Expenses 8 NL-8-SHARE CAPITAL SCHEDULE Share Capital 9 NL-9-PATTERN OF SHAREHOLDING SCHEDULE Pattern of Shareholding 10 NL-10-RESERVE AND SURPLUS SCHEDULE Reserves and Surplus 11 NL-11-BORROWING SCHEDULE Borrowings 12 NL-12-INVESTMENT SCHEDULE Shareholders 13 NL-13-LOANS SCHEDULE Loans 14 NL-14-FIXED ASSETS SCHEDULE Fixed Assets 15 NL-15-CASH AND BANK BALANCE SCHEDULE Cash and Bank Balance 16 NL-16-ADVANCES AND OTHER ASSETS SCHEDULE Advances & Other Assets 17 NL-17-CURRENT LIABILITIES SCHEDULE Current Liabilities 18 NL-18-PROVISIONS SCHEDULE Provisions 19 NL-19-MISC EXPENDITURE SCHEDULE Misc Expenditure 20 NL-21-STATEMENT OF LIABILITIES Statement of Liablities Disclosures - IFFCO TOKIO General Insurance Co. Ltd. for the period 1st April - 30th September, 2014 S.No. Form No Description
Transcript of Disclosures - IFFCO TOKIO General Insurance Co. Ltd. for … Disclosure... · FORM NL-1-B-RA...

1 NL-1-B-RA Revenue Account
2 NL-2-B-PL Profit & Loss Account
3 NL-3-B-BS Balance Sheet
4 NL-4-PREMIUM SCHEDULE Premium
5 NL-5-CLAIMS SCHEDULE Claims Incurred
6 NL-6-COMMISSION SCHEDULE Commission
7 NL-7-OPERATING EXPENSES SCHEDULE Operating Expenses
8 NL-8-SHARE CAPITAL SCHEDULE Share Capital
9 NL-9-PATTERN OF SHAREHOLDING SCHEDULE Pattern of Shareholding
10 NL-10-RESERVE AND SURPLUS SCHEDULE Reserves and Surplus
11 NL-11-BORROWING SCHEDULE Borrowings
12 NL-12-INVESTMENT SCHEDULE Shareholders
13 NL-13-LOANS SCHEDULE Loans
14 NL-14-FIXED ASSETS SCHEDULE Fixed Assets
15 NL-15-CASH AND BANK BALANCE SCHEDULE Cash and Bank Balance
16 NL-16-ADVANCES AND OTHER ASSETS SCHEDULE Advances & Other Assets
17 NL-17-CURRENT LIABILITIES SCHEDULE Current Liabilities
18 NL-18-PROVISIONS SCHEDULE Provisions
19 NL-19-MISC EXPENDITURE SCHEDULE Misc Expenditure
20 NL-21-STATEMENT OF LIABILITIES Statement of Liablities
Disclosures - IFFCO TOKIO General Insurance Co. Ltd. for the period 1st April - 30th September, 2014
S.No. Form No Description

21 NL-22-GEOGRAPHICAL DISTN OF BSNS Geographical Distribution of Business
22 NL-23-REINSURANCE RISK CONCENTRATION Reinsurance Risk Concentration
23 NL-24-AGEING OF CLAIMS Ageing of Claims
24 NL-25-CLAIMS DATA Claims Data (Incurred Claims+ Reported Claims)
25 NL-26-CLAIMS INFORMATION Claims Information
26 NL-27-OFFICE OPENING Office Opening
27 NL-28-STATEMENT OF ASSETS Statement of Investment of Assets
28 NL-29-DEBT SECURITIES Debt Securities
29 NL-30-ANALYTICAL RATIOS Analytical Ratios
30 NL-31-RELATED PARTY TRANSACTIONS Related Party Transanctions
31 NL-32-PRODUCT INFORMATION Product Information
32 NL-33-SOLVENCY MARGIN Solvency
33 NL-34-BOD Board of Directors & Management
34 NL-35-NPAs NPAs
35 NL-36-YIELD ON INVESTMENTS Yield on Investment
36 NL-37-DOWN GRADING OF INVESTMENTS Downgrading of Investment
37 NL-38-BSNS RETURNS ACROSS LOBQuarterly Business Returns for different line of
business (Premum amount and number of policies)
38 NL-39-RURAL AND SOCIAL SECTOR OBLIGATIONS Rural & Social Sector Obligations
39 NL-40-CHANNEL WISE PREMIUM Business Acquisition through different channels
40 NL-41-GRIEVANCE DISPOSAL Grievance Disposal

Name of the Insurer: IFFCO TOKIO GENERAL INSURANCE CO. LTD.
Registration No. 106 dated 4.12.2000
FIRE INSURANCE REVENUE ACCOUNT** FOR THE PERIOD ENDED 30TH SEPTEMBER 2014
Particulars Schedule QUARTER ENDED 30TH
SEPTEMBER 2014
PERIOD ENDED 30TH
SEPTEMBER 2014
QUARTER ENDED 30TH
SEPTEMBER 2013
PERIOD ENDED 30TH
SEPTEMBER 2013
(Rs.’000) (Rs.’000) (Rs.’000) (Rs.’000)
1 Premiums earned (Net) NL-4-Premium Schedule 103,668 211,394 104,127 227,263
2 Profit/ Loss on sale/redemption of Investments 237 459 266 503
3 Others 306 (450) (394) (1,646)
4 Interest, Dividend & Rent – Gross 19,626 37,474 18,796 36,705
TOTAL (A) 123,837 248,877 122,795 262,825
1 Claims Incurred (Net) NL-5-Claims Schedule 72,974 128,589 15,033 141,471
2 Commission NL-6-Commission Schedule (547) (89,517) (2,312) (85,080)
3 Operating Expenses related to Insurance Business NL-7-Operating Expenses Schedule
42,039 63,276 30,063 62,736
4 Premium Deficiency - - - -
TOTAL (B) 114,466 102,348 42,784 119,127
Operating Profit/(Loss) from
Fire/Marine/Miscellaneous Business C= (A - B)
9,371 146,529 80,011 143,698
APPROPRIATIONS
Transfer to Shareholders‟ Account
9,371 146,529 80,011 143,698
Transfer to Catastrophe Reserve - - - -
Transfer to Other Reserves (to be specified)
- - - -
TOTAL (C) 9,371 146,529 80,011 143,698
PERIODIC DISCLOSURES
FORM NL-1-B-RA

MARINE INSURANCE REVENUE ACCOUNT** FOR THE PERIOD ENDED 30TH SEPTEMBER 2014
Particulars Schedule QUARTER ENDED 30TH
SEPTEMBER 2014
PERIOD ENDED 30TH
SEPTEMBER 2014
QUARTER ENDED 30TH
SEPTEMBER 2013
PERIOD ENDED 30TH
SEPTEMBER 2013
(Rs.’000) (Rs.’000) (Rs.’000) (Rs.’000)
1 Premiums earned (Net) NL-4-Premium Schedule 122,361 221,614 100,223 173,039
2 Profit/ Loss on sale/redemption of Investments 265 515 302 552
3 Others (1,999) (2,061) 249 326
4 Interest, Dividend & Rent – Gross 21,972 42,054 21,309 40,243
TOTAL (A) 142,599 262,122 122,083 214,160
1 Claims Incurred (Net) NL-5-Claims Schedule 126,998 254,970 97,581 190,254
2 Commission NL-6-Commission Schedule (19,396) (22,513) (14,398) (18,802)
3 Operating Expenses related to Insurance Business NL-7-Operating Expenses Schedule 13,674 62,588 30,744 72,567
4 Premium Deficiency - - - -
TOTAL (B) 121,276 295,045 113,927 244,019
Operating Profit/(Loss) from
Fire/Marine/Miscellaneous Business C= (A - B)
21,323 (32,923) 8,156 (29,859)
APPROPRIATIONS
Transfer to Shareholders‟ Account 21,323 (32,923) 8,156 (29,859)
Transfer to Catastrophe Reserve - - - -
Transfer to Other Reserves (to be specified) - - - -
TOTAL (C) 21,323 (32,923) 8,156 (29,859)
FORM NL-1-B-RA
PERIODIC DISCLOSURES

MISCELLANEOUS INSURANCE REVENUE ACCOUNT** FOR THE PERIOD ENDED 30TH SEPTEMBER 2014
Particulars Schedule QUARTER ENDED 30TH
SEPTEMBER 2014
PERIOD ENDED 30TH
SEPTEMBER 2014
QUARTER ENDED 30TH
SEPTEMBER 2013
PERIOD ENDED 30TH
SEPTEMBER 2013
(Rs.’000) (Rs.’000) (Rs.’000) (Rs.’000)
1 Premiums earned (Net) NL-4-Premium Schedule 5,246,682 10,157,872 4,843,405 9,329,790
2 Profit/ Loss on sale/redemption of Investments 8,731 16,839 8,276 15,552
3 Others (4,522) (2,110) 3,195 6,098
4 Interest, Dividend & Rent – Gross 725,383 1,375,472 583,561 1,134,446
TOTAL (A) 5,976,274 11,548,073 5,438,437 10,485,886
1 Claims Incurred (Net) NL-5-Claims Schedule 4,087,441 7,776,221 3,801,379 7,150,920
2 Commission NL-6-Commission Schedule 59,480 216,976 (120,785) (10,526)
3 Operating Expenses related to Insurance Business NL-7-Operating Expenses Schedule 1,490,347 2,820,996 1,222,549 2,325,222
4 Premium Deficiency - - - -
TOTAL (B) 5,637,268 10,814,193 4,903,143 9,465,616
Operating Profit/(Loss) from
Fire/Marine/Miscellaneous Business C= (A - B)
339,006 733,880 535,294 1,020,270
APPROPRIATIONS
Transfer to Shareholders‟ Account 339,006 733,880 535,294 1,020,270
Transfer to Catastrophe Reserve - - - -
Transfer to Other Reserves (to be specified) - - - -
TOTAL (C) 339,006 733,880 535,294 1,020,270
Note: See Notes appended at the end of Form NL-2-B-PL
** please refer Regulation 1 Part V- Preparation of Financial Statement of IRDA (Accounting) Regulation 2002
FORM NL-1-B-RA
PERIODIC DISCLOSURES

Name of the Insurer: IFFCO TOKIO GENERAL INSURANCE CO. LTD.
Registration No. 106 dated 4.12.2000
PROFIT AND LOSS ACCOUNT FOR THE PERIOD ENDED 30TH SEPTEMBER 2014
Particulars Schedule QUARTER ENDED 30TH
SEPTEMBER 2014
PERIOD ENDED 30TH
SEPTEMBER 2014
QUARTER ENDED 30TH
SEPTEMBER 2013
PERIOD ENDED 30TH
SEPTEMBER 2013
(Rs.’000) (Rs.’000) (Rs.’000) (Rs.’000)
1 OPERATING PROFIT/(LOSS)
(a) Fire Insurance 9,371 146,529 80,011 143,698
(b) Marine Insurance 21,323 (32,923) 8,156 (29,859)
(c ) Miscellaneous Insurance 339,006 733,880 535,294 1,020,270
2 INCOME FROM INVESTMENTS
(a) Interest, Dividend & Rent – Gross 137,526 277,945 143,726 279,706
(b) Profit on sale of investments 1,651 3,402 2,038 3,834
Less: Loss on sale of investments - - - -
3 OTHER INCOME (To be specified) 6,812 18,429 11,303 13,977
TOTAL (A) 515,689 1,147,262 780,528 1,431,626
4 PROVISIONS (Other than taxation)
(a) For diminution in the value of investments - - - -
(b) For doubtful debts - - - -
(c) Others (For doubtful Advances) - - 21,169 21,169
5 OTHER EXPENSES
(a) Expenses other than those related to
Insurance Business
1,611 2,936 2,314 3,642
(b) Bad debts written off - - - -
(c) Loss on Sale/Scraping of Fixed Assets 13 13 140 159
TOTAL (B) 1,624 2,949 23,623 24,970
PERIODIC DISCLOSURESFORM NL-2-B-PL

Profit Before Tax 514,065 1,144,313 756,905 1,406,656
Provision for Taxation 156,690 357,990 250,600 466,900
APPROPRIATIONS
(a) Interim dividends paid during the year - - - -
(b) Proposed final dividend - - - -
(c) Dividend distribution tax - - - -
(d) Transfer to any Reserves or Other Accounts
(to be specified)
- - - -
Balance of profit/ loss brought forward from last
year - 3,594,110 - 1,433,260
Balance carried forward to Balance Sheet 4,380,433 2,373,016
Notes: to Form NL-1-B-RA and NL-2-B- PL
(a) Premium income received from business concluded in and outside India shall be separately disclosed.
(e) Fees and expenses connected with claims shall be included in claims.
(f) Under the sub-head "Others” shall be included items like foreign exchange gains or losses and other items.
(h) Income from rent shall include only the realised rent. It shall not include any notional rent.
(b) Reinsurance premiums whether on business ceded or accepted are to be brought into account gross (i.e. before deducting commissions) under the head reinsurance
premiums.
(d) Items of expenses and income in excess of one percent of the total premiums (less reinsurance) or Rs.5,00,000 whichever is higher, shall be shown as a separate
line item.
(g) Interest, dividends and rentals receivable in connection with an investment should be stated as gross amount, the amount of income tax deducted at source being
included under 'advance taxes paid and taxes deducted at source”..
(c) Claims incurred shall comprise claims paid, specific claims settlement costs wherever applicable and change in the outstanding provision for claims at the year-end,.

Name of the Insurer: IFFCO TOKIO GENERAL INSURANCE CO. LTD.
Registration No. 106 dated 4.12.2000
BALANCE SHEET AS AT 30TH SEPTEMBER 2014
Schedule AS AT 30TH SEPTEMBER 2014 AS AT 30TH SEPTEMBER 2013
(Rs.’000) (Rs.’000)
SOURCES OF FUNDS
SHARE CAPITAL NL-8-Share Capital Schedule 2,693,215 2,693,215
SHARE APPLICATION MONEY PENDING ALLOTMENT - -
RESERVES AND SURPLUS NL-10-Reserves and Surplus Schedule 6,950,388 4,942,971
FAIR VALUE CHANGE ACCOUNT 279 122
BORROWINGS NL-11-Borrowings Schedule - -
TOTAL 9,643,882 7,636,308
APPLICATION OF FUNDS
INVESTMENTS NL-12-Investment Schedule 26,120,229 21,024,272
LOANS NL-13-Loans Schedule - -
FIXED ASSETS NL-14-Fixed Assets Schedule 216,042 281,346
DEFERRED TAX ASSET 95,660 75,100
CURRENT ASSETS
Cash and Bank Balances NL-15-Cash and bank balance Schedule 14,288,765 14,279,074
Advances and Other Assets NL-16-Advancxes and Other Assets
Schedule
5,456,370 4,207,870
Sub-Total (A) 19,745,135 18,486,944
PERIODIC DISCLOSURESFORM NL-3-B-BS

CURRENT LIABILITIES NL-17-Current Liabilities Schedule 24,782,172 22,547,871
PROVISIONS NL-18-Provisions Schedule 11,751,012 9,683,483
DEFERRED TAX LIABILITY - -
Sub-Total (B) 36,533,184 32,231,354
NET CURRENT ASSETS (C) = (A - B) (16,788,049) (13,744,410)
MISCELLANEOUS EXPENDITURE (to the extent not written off or
adjusted)
NL-19-Miscellaneous Expenditure
Schedule
- -
DEBIT BALANCE IN PROFIT AND LOSS ACCOUNT - -
TOTAL 9,643,882 7,636,308
CONTINGENT LIABILITIES
Particulars AS AT 30TH SEPTEMBER 2014 AS AT 30TH SEPTEMBER 2013
(Rs.’000) (Rs.’000)
1 Partly paid-up investments - -
2 Claims, other than against policies, not acknowledged as debts by the
company
- -
3 Underwriting commitments outstanding (in respect of shares and
securities)
- -
4 Guarantees given by or on behalf of the Company - -
5 Statutory demands/ liabilities in dispute, not provided for 10,163 7,035
6 Reinsurance obligations to the extent not provided for in accounts - -
7 Others (to be specified) - -
TOTAL 10,163 7,035
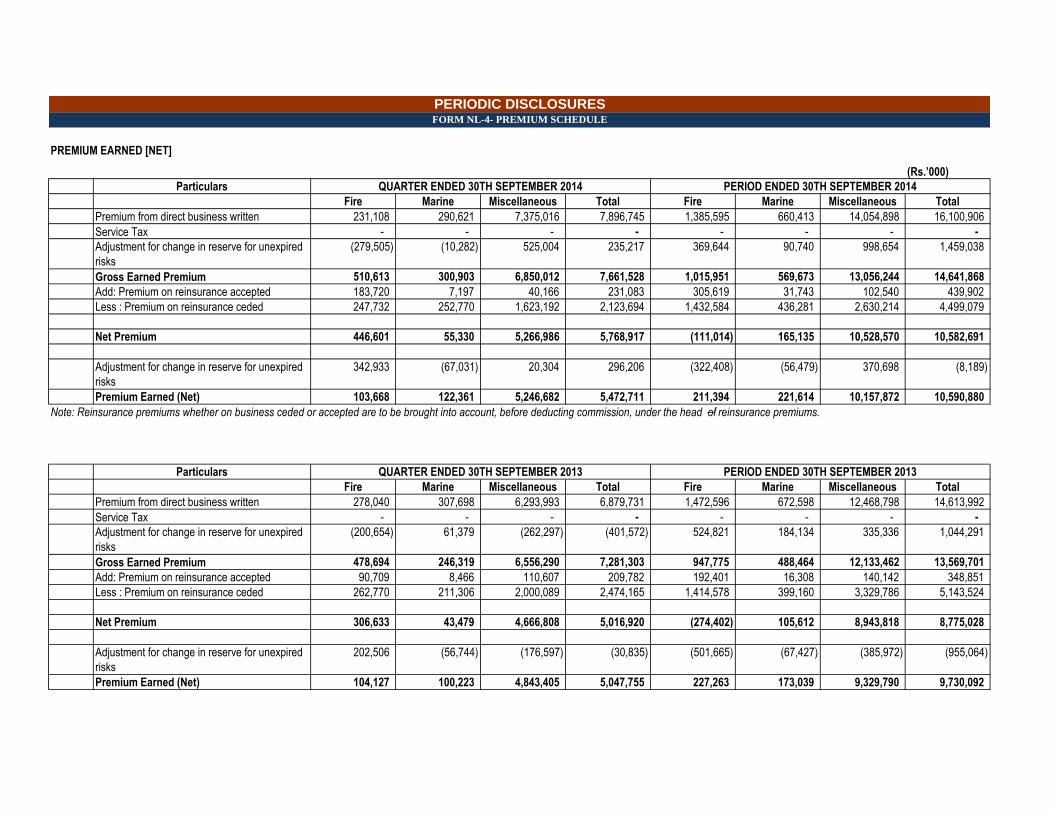
PREMIUM EARNED [NET]
(Rs.’000)
Particulars
Fire Marine Miscellaneous Total Fire Marine Miscellaneous Total
Premium from direct business written 231,108 290,621 7,375,016 7,896,745 1,385,595 660,413 14,054,898 16,100,906
Service Tax - - - - - - - -
Adjustment for change in reserve for unexpired
risks
(279,505) (10,282) 525,004 235,217 369,644 90,740 998,654 1,459,038
Gross Earned Premium 510,613 300,903 6,850,012 7,661,528 1,015,951 569,673 13,056,244 14,641,868
Add: Premium on reinsurance accepted 183,720 7,197 40,166 231,083 305,619 31,743 102,540 439,902
Less : Premium on reinsurance ceded 247,732 252,770 1,623,192 2,123,694 1,432,584 436,281 2,630,214 4,499,079
Net Premium 446,601 55,330 5,266,986 5,768,917 (111,014) 165,135 10,528,570 10,582,691
Adjustment for change in reserve for unexpired
risks
342,933 (67,031) 20,304 296,206 (322,408) (56,479) 370,698 (8,189)
Premium Earned (Net) 103,668 122,361 5,246,682 5,472,711 211,394 221,614 10,157,872 10,590,880
Particulars
Fire Marine Miscellaneous Total Fire Marine Miscellaneous Total
Premium from direct business written 278,040 307,698 6,293,993 6,879,731 1,472,596 672,598 12,468,798 14,613,992
Service Tax - - - - - - - -
Adjustment for change in reserve for unexpired
risks
(200,654) 61,379 (262,297) (401,572) 524,821 184,134 335,336 1,044,291
Gross Earned Premium 478,694 246,319 6,556,290 7,281,303 947,775 488,464 12,133,462 13,569,701
Add: Premium on reinsurance accepted 90,709 8,466 110,607 209,782 192,401 16,308 140,142 348,851
Less : Premium on reinsurance ceded 262,770 211,306 2,000,089 2,474,165 1,414,578 399,160 3,329,786 5,143,524
Net Premium 306,633 43,479 4,666,808 5,016,920 (274,402) 105,612 8,943,818 8,775,028
Adjustment for change in reserve for unexpired
risks
202,506 (56,744) (176,597) (30,835) (501,665) (67,427) (385,972) (955,064)
Premium Earned (Net) 104,127 100,223 4,843,405 5,047,755 227,263 173,039 9,329,790 9,730,092
PERIODIC DISCLOSURESFORM NL-4- PREMIUM SCHEDULE
QUARTER ENDED 30TH SEPTEMBER 2013 PERIOD ENDED 30TH SEPTEMBER 2013
QUARTER ENDED 30TH SEPTEMBER 2014 PERIOD ENDED 30TH SEPTEMBER 2014
Note: Reinsurance premiums whether on business ceded or accepted are to be brought into account, before deducting commission, under the head of reinsurance premiums.

CLAIMS INCURRED [NET]
(Rs.’000)
Particulars
Fire Marine Miscellaneous Total Fire Marine Miscellaneous Total
Claims paid
Direct claims 238,621 379,660 3,674,575 4,292,856 521,679 546,015 6,394,457 7,462,151
Add Claims Outstanding at the end of the period 32,538 18,347 1,198,646 1,249,531 509,186 580,483 15,319,023 16,408,692
Less Claims Outstanding at the beginning of the
year
- - - - 457,735 502,771 12,394,772 13,355,278
271,159 398,007 4,873,221 5,542,387 573,130 623,727 9,318,708 10,515,565
Add :Re-insurance accepted to direct claims 4,306 1,242 59,369 64,917 4,306 2,788 118,664 125,758
Less :Re-insurance Ceded to claims paid 202,491 272,250 845,150 1,319,891 448,847 371,545 1,661,151 2,481,543
Total Claims Incurred 72,974 126,999 4,087,440 4,287,413 128,589 254,970 7,776,221 8,159,780
Particulars
Fire Marine Miscellaneous Total Fire Marine Miscellaneous Total
Claims paid
Direct claims 770,651 159,417 2,724,080 3,654,148 925,539 352,528 4,924,630 6,202,697
Add Claims Outstanding at the end of the period (62,960) 34,071 1,661,147 1,632,258 438,999 546,645 11,277,187 12,262,831
Less Claims Outstanding at the beginning of the
year
- - (1) (1) 408,703 474,314 7,948,972 8,831,989
707,691 193,488 4,385,228 5,286,407 955,835 424,859 8,252,845 9,633,539
Add :Re-insurance accepted to direct claims 6,067 8,960 60,990 76,017 6,288 17,720 94,333 118,341
Less :Re-insurance Ceded to claims paid 698,725 104,867 644,839 1,448,431 820,652 252,325 1,196,258 2,269,235
Total Claims Incurred 15,033 97,581 3,801,379 3,913,993 141,471 190,254 7,150,920 7,482,645
Notes:
d) Claims cost should be adjusted for estimated salvage value if there is a sufficient certainty of its realisation.
QUARTER ENDED 30TH SEPTEMBER 2014 PERIOD ENDED 30TH SEPTEMBER 2014
QUARTER ENDED 30TH SEPTEMBER 2013 PERIOD ENDED 30TH SEPTEMBER 2013
PERIODIC DISCLOSURESFORM NL-5 - CLAIMS SCHEDULE
a) Incurred But Not Reported (IBNR), Incurred but not enough reported [IBNER] claims should be included in the amount for outstanding claims.
b) Claims includes specific claims settlement cost but not expenses of management
c) The surveyor fees, legal and other expenses shall also form part of claims cost.
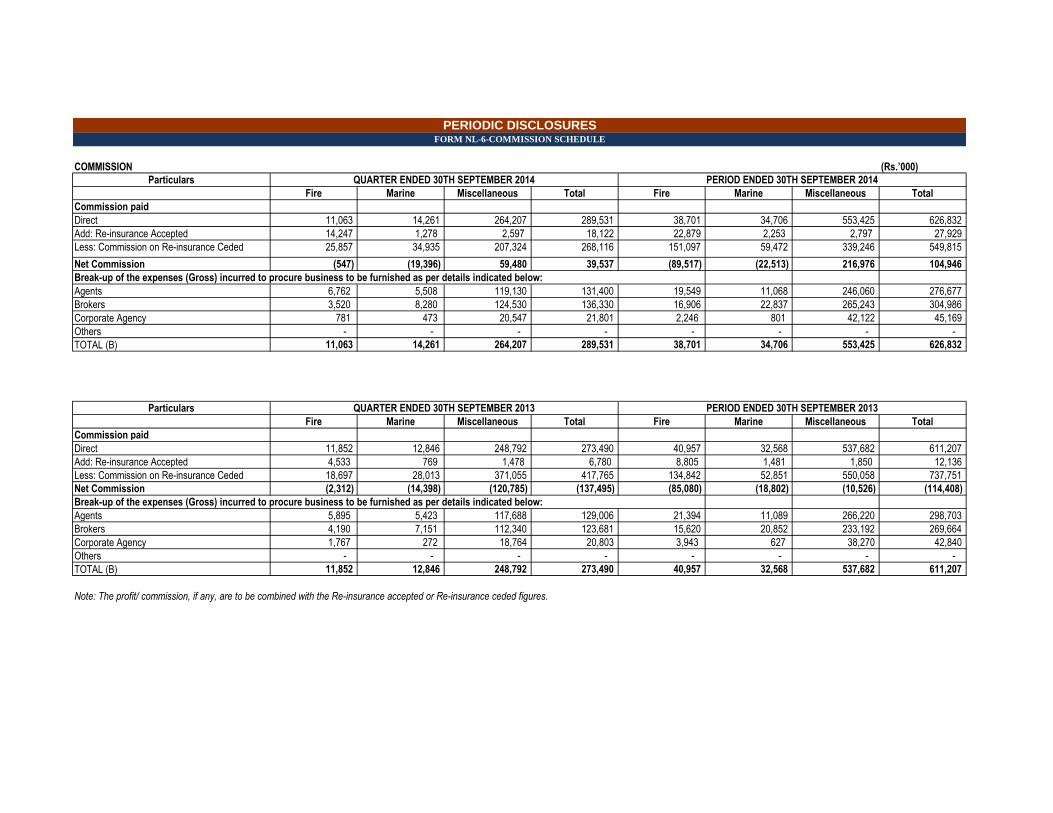
COMMISSION (Rs.’000)
Particulars
Fire Marine Miscellaneous Total Fire Marine Miscellaneous Total
Commission paid
Direct 11,063 14,261 264,207 289,531 38,701 34,706 553,425 626,832
Add: Re-insurance Accepted 14,247 1,278 2,597 18,122 22,879 2,253 2,797 27,929
Less: Commission on Re-insurance Ceded 25,857 34,935 207,324 268,116 151,097 59,472 339,246 549,815
Net Commission (547) (19,396) 59,480 39,537 (89,517) (22,513) 216,976 104,946
Agents 6,762 5,508 119,130 131,400 19,549 11,068 246,060 276,677
Brokers 3,520 8,280 124,530 136,330 16,906 22,837 265,243 304,986
Corporate Agency 781 473 20,547 21,801 2,246 801 42,122 45,169
Others - - - - - - - -
TOTAL (B) 11,063 14,261 264,207 289,531 38,701 34,706 553,425 626,832
Particulars
Fire Marine Miscellaneous Total Fire Marine Miscellaneous Total
Commission paid
Direct 11,852 12,846 248,792 273,490 40,957 32,568 537,682 611,207
Add: Re-insurance Accepted 4,533 769 1,478 6,780 8,805 1,481 1,850 12,136
Less: Commission on Re-insurance Ceded 18,697 28,013 371,055 417,765 134,842 52,851 550,058 737,751
Net Commission (2,312) (14,398) (120,785) (137,495) (85,080) (18,802) (10,526) (114,408)
Agents 5,895 5,423 117,688 129,006 21,394 11,089 266,220 298,703
Brokers 4,190 7,151 112,340 123,681 15,620 20,852 233,192 269,664
Corporate Agency 1,767 272 18,764 20,803 3,943 627 38,270 42,840
Others - - - - - - - -
TOTAL (B) 11,852 12,846 248,792 273,490 40,957 32,568 537,682 611,207
Note: The profit/ commission, if any, are to be combined with the Re-insurance accepted or Re-insurance ceded figures.
QUARTER ENDED 30TH SEPTEMBER 2014 PERIOD ENDED 30TH SEPTEMBER 2014
Break-up of the expenses (Gross) incurred to procure business to be furnished as per details indicated below:
PERIODIC DISCLOSURESFORM NL-6-COMMISSION SCHEDULE
QUARTER ENDED 30TH SEPTEMBER 2013 PERIOD ENDED 30TH SEPTEMBER 2013
Break-up of the expenses (Gross) incurred to procure business to be furnished as per details indicated below:
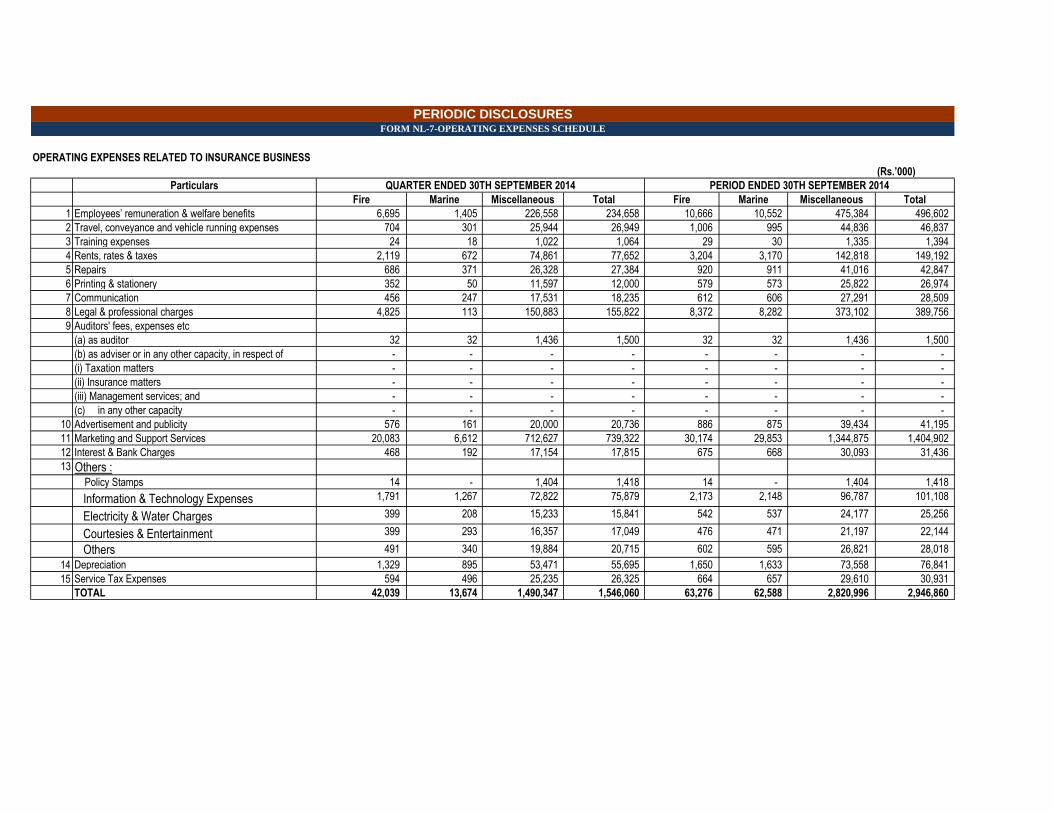
OPERATING EXPENSES RELATED TO INSURANCE BUSINESS
(Rs.’000)
Particulars
Fire Marine Miscellaneous Total Fire Marine Miscellaneous Total
1 Employees‟ remuneration & welfare benefits 6,695 1,405 226,558 234,658 10,666 10,552 475,384 496,602
2 Travel, conveyance and vehicle running expenses 704 301 25,944 26,949 1,006 995 44,836 46,837
3 Training expenses 24 18 1,022 1,064 29 30 1,335 1,394
4 Rents, rates & taxes 2,119 672 74,861 77,652 3,204 3,170 142,818 149,192
5 Repairs 686 371 26,328 27,384 920 911 41,016 42,847
6 Printing & stationery 352 50 11,597 12,000 579 573 25,822 26,974
7 Communication 456 247 17,531 18,235 612 606 27,291 28,509
8 Legal & professional charges 4,825 113 150,883 155,822 8,372 8,282 373,102 389,756
9 Auditors' fees, expenses etc
(a) as auditor 32 32 1,436 1,500 32 32 1,436 1,500
(b) as adviser or in any other capacity, in respect of - - - - - - - -
(i) Taxation matters - - - - - - - -
(ii) Insurance matters - - - - - - - -
(iii) Management services; and - - - - - - - -
(c) in any other capacity - - - - - - - -
10 Advertisement and publicity 576 161 20,000 20,736 886 875 39,434 41,195
11 Marketing and Support Services 20,083 6,612 712,627 739,322 30,174 29,853 1,344,875 1,404,902
12 Interest & Bank Charges 468 192 17,154 17,815 675 668 30,093 31,436
13 Others : Policy Stamps 14 - 1,404 1,418 14 - 1,404 1,418
Information & Technology Expenses 1,791 1,267 72,822 75,879 2,173 2,148 96,787 101,108
Electricity & Water Charges 399 208 15,233 15,841 542 537 24,177 25,256
Courtesies & Entertainment 399 293 16,357 17,049 476 471 21,197 22,144
Others 491 340 19,884 20,715 602 595 26,821 28,018
14 Depreciation 1,329 895 53,471 55,695 1,650 1,633 73,558 76,841
15 Service Tax Expenses 594 496 25,235 26,325 664 657 29,610 30,931
TOTAL 42,039 13,674 1,490,347 1,546,060 63,276 62,588 2,820,996 2,946,860
PERIODIC DISCLOSURESFORM NL-7-OPERATING EXPENSES SCHEDULE
QUARTER ENDED 30TH SEPTEMBER 2014 PERIOD ENDED 30TH SEPTEMBER 2014

OPERATING EXPENSES RELATED TO INSURANCE BUSINESS
Particulars
Fire Marine Miscellaneous Total Fire Marine Miscellaneous Total
1 Employees‟ remuneration & welfare benefits 5,407 5,555 219,242 230,204 11,117 12,864 411,957 435,938
2 Travel, conveyance and vehicle running expenses 502 519 20,221 21,242 997 1,152 36,914 39,063
3 Training expenses 84 93 3,223 3,400 117 136 4,347 4,600
4 Rents, rates & taxes 1,665 1,670 68,592 71,927 3,750 4,339 138,962 147,051
5 Repairs 808 897 31,010 32,716 1,124 1,301 41,658 44,083
6 Printing & stationery 291 299 11,764 12,354 592 685 21,937 23,214
7 Communication 308 306 12,742 13,356 713 825 26,419 27,957
8 Legal & professional charges 6,369 6,931 247,734 261,033 9,924 11,482 367,718 389,124
9 Auditors' fees, expenses etc
(a) as auditor 32 37 1,181 1,250 32 37 1,181 1,250
(b) as adviser or in any other capacity, in respect of - - - - - - - -
(i) Taxation matters - - - - - - - -
(ii) Insurance matters - - - - - - - -
(iii) Management services; and - - - - - - - -
(c) in any other capacity - - - - - - - -
10 Advertisement and publicity 485 542 18,469 19,496 638 738 23,638 25,014
11 Marketing and Support Services 10,426 10,078 439,736 460,240 26,575 30,750 984,757 1,042,082
12 Interest & Bank Charges 237 233 9,884 10,354 571 660 21,142 22,373
13 Others : Policy Stamps 17 - 1,242 1,259 17 - 1,242 1,259
Information & Technology Expenses 759 796 30,246 31,801 1,415 1,636 52,402 55,453
Electricity & Water Charges 335 356 13,247 13,938 587 679 21,752 23,018
Courtesies & Entertainment 152 158 6,087 6,397 292 337 10,797 11,426
Others 621 635 25,357 26,613 1,316 1,524 48,799 51,639
14 Depreciation 594 612 23,922 25,128 1,189 1,374 44,011 46,574
15 Service Tax Expenses 972 1,026 38,650 40,648 1,770 2,048 65,589 69,407
TOTAL 30,063 30,744 1,222,549 1,283,356 62,736 72,567 2,325,222 2,460,525
QUARTER ENDED 30TH SEPTEMBER 2013 PERIOD ENDED 30TH SEPTEMBER 2013

Particulars AS AT 30TH SEPTEMBER 2014 AS AT 30TH SEPTEMBER 2013
(Rs.’000). (Rs.’000).
1 Authorised Capital
Equity Shares of Rs. 10 each 4,000,000 4,000,000
2 Issued Capital
Equity Shares of Rs. 10each 2,693,215 2,693,215
3 Subscribed Capital
Equity Shares of Rs. 10each 2,693,215 2,693,215
4 Called-up Capital
Equity Shares of Rs. .....each 2,693,215 2,693,215
Less : Calls unpaid - -
Add : Equity Shares forfeited (Amount originally paid up) - -
Less : Par Value of Equity Shares bought back - -
Less : Preliminary Expenses - -
Expenses including commission or brokerage on - -
Underwriting or subscription of shares - -
TOTAL 2,693,215 2,693,215
PERIODIC DISCLOSURESFORM NL-8-SHARE CAPITAL SCHEDULE

PATTERN OF SHAREHOLDING
[As certified by the Management]
Shareholder
Number of Shares % of Holding Number of Shares % of Holding
Promoters
· Indian 199,297,910 74 199,297,910 74
· Foreign 70,023,590 26 70,023,590 26
Others - - - -
TOTAL 269,321,500 100 269,321,500 100
PERIODIC DISCLOSURESFORM NL-9-PATTERN OF SHAREHOLDING SCHEDULE
AS AT 30TH SEPTEMBER 2014 AS AT 30TH SEPTEMBER 2013

Particulars AS AT 30TH SEPTEMBER 2014 AS AT 30TH SEPTEMBER 2013
(Rs.’000). (Rs.’000).
1 Capital Reserve - -
2 Capital Redemption Reserve - -
3 Share Premium 2,568,789 2,568,789
General Reserves - -
Less: Debit balance in Profit and Loss
Account
- -
Less: Amount utilized for Buy-back - -
5 Catastrophe Reserve 1,166 1,166
6 Other Reserves (to be specified) - -
7 Balance of Profit in Profit & Loss Account 4,380,433 2,373,016
TOTAL 6,950,388 4,942,971
PERIODIC DISCLOSURES
FORM NL-10-RESERVE AND SURPLUS SCHEDULE
4

Particulars AS AT 30TH SEPTEMBER 2014 AS AT 30TH SEPTEMBER 2013
(Rs.’000). (Rs.’000).
1 Debentures/ Bonds - -
2 Banks - -
3 Financial Institutions - -
4 Others (to be specified) - -
TOTAL - -
Notes:
PERIODIC DISCLOSURESFORM NL-11-BORROWINGS SCHEDULE
a) The extent to which the borrowings are secured shall be separately disclosed stating the nature of the security
under each sub-head.
b) Amounts due within 12 months from the date of Balance Sheet should be shown separately

Particulars AS AT 30TH SEPTEMBER 2014 AS AT 30TH SEPTEMBER 2013
(Rs.’000). (Rs.’000).
LONG TERM INVESTMENTS
1 Government securities and Government guaranteed bonds including Treasury
Bills
12,678,452 11,524,950
2 Other Approved Securities - -
3 Other Investments
( a) Shares - -
(aa) Equity - -
(bb) Preference - -
( b) Mutual Funds - -
(c) Derivative Instruments - -
(d) Debentures/ Bonds (Housing) 4,012,665 3,262,667
(e) Other Securities (Non convertible Debentures) 1,300,000 900,000
(f) Subsidiaries 5,000 5,000
(g) Investment Properties-Real Estate - -
4 Investments in Infrastructure and Social Sector 6,421,942 3,835,240
5 Other than Approved Investments - -
SHORT TERM INVESTMENTS
1 Government securities and Government guaranteed bonds including Treasury
Bills
426,906 -
2 Other Approved Securities - -
3 Other Investments
( a) Shares
(aa) Equity - -
(bb) Preference - -
( b) Mutual Funds 540,279 720,122
(c) Derivative Instruments - -
(d) Debentures/ Bonds (Housing) 450,000 200,000
(e) Other Securities (Non convertible Debentures) - 216,304
(f) Subsidiaries - -
(g) Investment Properties-Real Estate - -
4 Investments in Infrastructure and Social Sector 284,985 359,989
5 Other than Approved Investments - -
TOTAL 26,120,229 21,024,272
PERIODIC DISCLOSURES FORM NL-12-INVESTMENT SCHEDULE

Notes:
(c) Investments made out of Catastrophe reserve should be shown separately.
(d) Debt securities will be considered as “held to maturity” securities and will be measured at historical cost subject to amortisation.
(e) Investment Property means a property [land or building or part of a building or both] held to earn rental income or for capital appreciation or for both, rather than for use in services or for
administrative purposes.
(f) Investments maturing within twelve months from balance sheet date and investments made with the specific intention to dispose of within twelve months from balance sheet date shall be classified
as short-term investments
(ii) Joint Venture is a contractual arrangement whereby two or more parties undertake an economic activity, which is subject to joint control.
(i) Joint control - is the contractually agreed sharing of power to govern the financial and operating policies of an economic activity to obtain benefits from it.
(ii) Associate - is an enterprise in which the company has significant influence and which is neither a subsidiary nor a joint venture of the company.
(iii) Significant influence (for the purpose of this schedule) - means participation in the financial and operating policy decisions of a company, but not control of those policies. Significant influence may be
exercised in several ways, for example, by representation on the board of directors, participation in the policymaking process, material inter-company transactions, interchange of managerial personnel or
dependence on technical information. Significant influence may be gained by share ownership, statute or agreement. As regards share ownership, if an investor holds, directly or indirectly through
subsidiaries, 20 percent or more of the voting power of the investee, it is presumed that the investor does have significant influence, unless it can be clearly demonstrated that this is not the case. Conversely,
if the investor holds, directly or indirectly through subsidiaries, less than 20 percent of the voting power of the investee, it is presumed that the investor does not have significant influence, unless such influence
is clearly demonstrated.
A substantial or majority ownership by another investor does not necessarily preclude an investor from having significant influence.
(b) Aggregate amount of company's investments other than listed equity securities and derivative instruments and also the market value thereof shall be disclosed.
(i) Holding company and subsidiary shall be construed as defined in the Companies Act, 1956:
(a) Investments in subsidiary/holding companies, joint ventures and associates shall be separately disclosed, at cost.
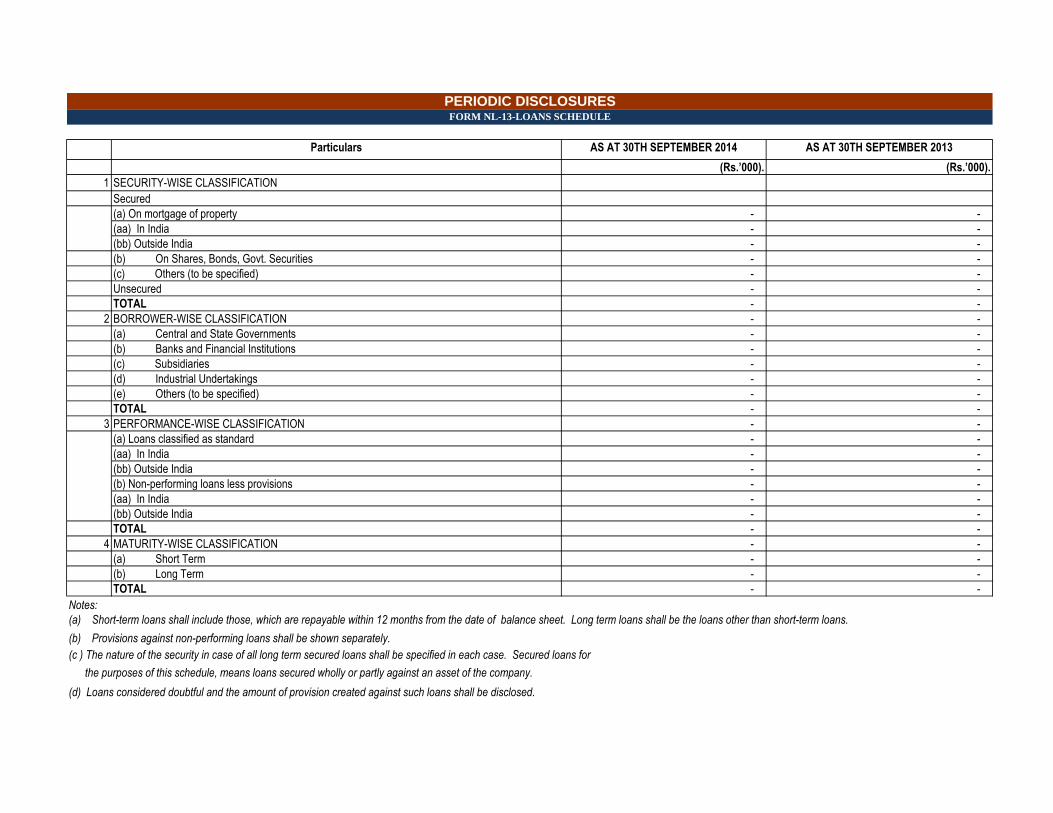
Particulars AS AT 30TH SEPTEMBER 2014 AS AT 30TH SEPTEMBER 2013
(Rs.’000). (Rs.’000).
1 SECURITY-WISE CLASSIFICATION
Secured
(a) On mortgage of property - -
(aa) In India - -
(bb) Outside India - -
(b) On Shares, Bonds, Govt. Securities - -
(c) Others (to be specified) - -
Unsecured - -
TOTAL - -
2 BORROWER-WISE CLASSIFICATION - -
(a) Central and State Governments - -
(b) Banks and Financial Institutions - -
(c) Subsidiaries - -
(d) Industrial Undertakings - -
(e) Others (to be specified) - -
TOTAL - -
3 PERFORMANCE-WISE CLASSIFICATION - -
(a) Loans classified as standard - -
(aa) In India - -
(bb) Outside India - -
(b) Non-performing loans less provisions - -
(aa) In India - -
(bb) Outside India - -
TOTAL - -
4 MATURITY-WISE CLASSIFICATION - -
(a) Short Term - -
(b) Long Term - -
TOTAL - -
Notes:
(c ) The nature of the security in case of all long term secured loans shall be specified in each case. Secured loans for
the purposes of this schedule, means loans secured wholly or partly against an asset of the company.
(d) Loans considered doubtful and the amount of provision created against such loans shall be disclosed.
PERIODIC DISCLOSURESFORM NL-13-LOANS SCHEDULE
(a) Short-term loans shall include those, which are repayable within 12 months from the date of balance sheet. Long term loans shall be the loans other than short-term loans.
(b) Provisions against non-performing loans shall be shown separately.

FIXED ASSETS
(Rs.’000)Particulars
Goodwill - - - - - - - - - -
Computer Software 202,814 5,543 - 208,356 154,644 15,177 - 169,820 38,536 38,243
Land-Freehold 37,849 - - 37,849 - - - - 37,849 37,849
Leasehold Property - - - - - - - - - -
Buildings 12,251 - - 12,251 803 102 138 767 11,484 11,548
Furniture & Fittings 263,179 3,869 - 267,048 203,021 9,667 - 212,688 54,360 62,918
Information Technology
Equipment
460,305 1,108 11 461,403 405,637 20,772 11 426,398 35,005 67,873
Vehicles 5,319 - - 5,319 1,430 579 - 2,008 3,311 4,542
Office Equipment 79,793 3,400 25 83,167 24,536 30,682 6 55,212 27,955 55,127
Others - - - - - - - - - -
TOTAL 1,061,510 13,920 36 1,075,393 790,071 76,979 155 866,893 208,500 278,100
Capital Work in Progress 5,233 7,542 5,233 7,542 790,069 7,542 3,246
Grand Total 1,066,743 21,462 5,269 1,082,935 1,580,140 76,979 155 866,893 216,042 281,346
Previous Period Total 1,000,366 62,246 10,912 1,051,698 726,089 46,574 2,310 770,352 281,346 -
Note:
Assets included in land, property and building above exclude Investment Properties as defined in note (e) to Form NL-12-Investment Schedule.
Upto 31st
March 2013
For The
Period
Upto 30th
September 2014
As At 30th
September 2014
As At 30th
September 2013
On sales /
adjustments
PERIODIC DISCLOSURESFORM NL-14-FIXED ASSETS SCHEDULE
Cost/ Gross Block Depreciation Net Block
As at 1st April,
2013
Additions
during the
period
Sales/
Adjustments
during the period
As at 30th
September 2014

Particulars AS AT 30TH SEPTEMBER 2014 AS AT 30TH SEPTEMBER 2013
(Rs.’000) (Rs.’000)
1 Cash (including cheques, drafts and stamps) 27,971 16,977
2 Bank Balances
(a) Deposit Accounts
(aa) Short-term (due within 12 months) 12,615,000 8,505,000
(bb) Others 790,000 5,240,000
(b) Current Accounts 855,794 517,097
(c) Others (to be specified) - -
3 Money at Call and Short Notice
(a) With Banks - -
(b) With other Institutions - -
4 Others (to be specified) - -
TOTAL 14,288,765 14,279,074
Balances with non-scheduled banks included in 2 and 3
above
- -
PERIODIC DISCLOSURES FORM NL-15-CASH AND BANK BALANCE SCHEDULE
Note : Bank balance may include remittances in transit. If so, the nature and amount should be separately
stated.

Particulars AS AT 30TH SEPTEMBER 2014 AS AT 30TH SEPTEMBER 2013
(Rs.’000). (Rs.’000).
ADVANCES
1 Reserve deposits with ceding companies - -
2 Application money for investments - 200,000
3 Prepayments 173,140 109,860
4 Advances to Directors/Officers - -
5 Advance tax paid and taxes deducted at source (Net of provision for
taxation)
148,013 19,831
6 MAT Credit Entitlement - 68,900
7 Deposit towards Rent 52,520 51,486
8 Service Tax Recoverable - -
9 Others 44,884 68,372
TOTAL (A) 418,557 518,449
OTHER ASSETS
1 Income accrued on investments 1,864,948 1,380,657
2 Outstanding Premiums 1,421,701 1,351,168
3 Agents‟ Balances - -
4 Foreign Agencies Balances - -
5 Due from other entities carrying on insurance business 1,669,890 846,564
6 Due from subsidiaries/ holding 81,274 111,032
7 Deposit with Reserve Bank of India - -
[Pursuant to section 7 of Insurance Act, 1938]
8 Others (to be specified) - -
TOTAL (B) 5,037,813 3,689,421
TOTAL (A+B) 5,456,370 4,207,870
Notes:
(c) Sundry Debtors will be shown under item 9(others)
PERIODIC DISCLOSURES FORM NL-16-ADVANCES AND OTHER ASSETS SCHEDULE
(a) The items under the above heads shall not be shown net of provisions for doubtful amounts. The amount of provision against each head should be shown separately.
(b) The term „officer‟ should conform to the definition of that term as given under the Companies Act, 1956.

CURRENT LIABILITIES
Particulars AS AT 30TH SEPTEMBER 2014 AS AT 30TH SEPTEMBER 2013
(Rs.’000). (Rs.’000).
1 Agents‟ Balances 155,300 118,607
2 Balances due to other insurance companies 1,130,458 1,788,620
3 Deposits held on re-insurance ceded - -
4 Premiums received in advance 144,133 150,883
5 Unallocated Premium - -
6 Sundry creditors 697,277 824,097
7 Due to subsidiaries/ holding company - -
8 Claims Outstanding * 22,013,432 19,169,457
9 Due to Officers/ Directors - -
10 Deposit Premium 122,766 139,558
11 Service Tax Payable 163,994 81,018
12 Employee Benefits 128,854 86,749
13 Policy Holder Dues 225,958 188,882
TOTAL 24,782,172 22,547,871
PERIODIC DISCLOSURESFORM NL-17-CURRENT LIABILITIES SCHEDULE
* Claims Outstanding Includes Rs 5,604,740 thousand (Previous Year Rs 6,906,625 thousands) on account of settlement received from the
IMTPIP towards the company's share of claim liability determined by the pool upto the date of dismantling (Net of claims paid upto reporting
period)

PROVISIONS
Particulars AS AT 30TH SEPTEMBER 2014 AS AT 30TH SEPTEMBER
2013
(Rs.’000). (Rs.’000).
1 Reserve for Unexpired Risk 11,751,012 9,683,483
2 For taxation (less advance tax paid and taxes
deducted at source)
- -
3 For proposed dividends - -
4 For dividend distribution tax - -
5 Others (to be specified) - -
6Reserve for Premium Deficiency
- -
TOTAL 11,751,012 9,683,483
PERIODIC DISCLOSURESFORM NL-18-PROVISIONS SCHEDULE

MISCELLANEOUS EXPENDITURE
(To the extent not written off or adjusted)
Particulars AS AT 30TH SEPTEMBER 2014 AS AT 30TH SEPTEMBER 2013
(Rs.’000). (Rs.’000).
1 Discount Allowed in issue of
shares/ debentures
- -
2 Others (to be specified) - -
TOTAL - -
Notes:
(b) The amount to be carried forward in respect of any item included under the head “Miscellaneous Expenditure”
shall not exceed the expected future revenue/other benefits related to the expenditure.
PERIODIC DISCLOSURESFORM NL-19 MISC EXPENDITURE SCHEDULE
(a) No item shall be included under the head “Miscellaneous Expenditure” and carried forward unless:
1. some benefit from the expenditure can reasonably be expected to be received in future, and 2. the amount of such benefit is reasonably determinable.

Insurer: IFFCO TOKIO GENERAL INSURANCE CO. LTD. Date:
(Rs in Lakhs)
Sl.No. ParticularReserves for unexpired
risks
Reserve for
Outstanding ClaimsIBNR Reserves Total Reserves
Reserves for
unexpired risks
Reserve for
Outstanding
Claims
IBNR Reserves Total Reserves
1 Fire 4,035.48 4,209.97 881.89 9,127.34 3,817.45 3,525.37 864.63 8,207.44
2 Marine
a Marine Cargo 2,765.27 3,164.45 1,316.91 7,246.64 3,865.01 3,259.83 1,157.27 8,282.12
b Marine Hull 203.52 978.90 344.57 1,526.98 357.03 663.79 385.56 1,406.37
3 Miscellaneous
a Motor 90,237.67 78,290.68 109,361.39 277,889.74 74,378.90 77,291.47 84,708.28 236,378.65
b Engineering 959.56 2,971.59 659.48 4,590.62 1,022.78 2,948.05 623.57 4,594.40
c Aviation 13.32 221.39 - 234.71 36.95 690.62 - 727.57
d Liabilities 908.92 674.96 731.41 2,315.29 667.86 547.26 717.78 1,932.90
e Others 7,968.84 8,013.83 2,927.23 18,909.90 6,806.50 7,478.86 2,724.33 17,009.69
4 Health Insurance 10,417.55 3,209.91 2,175.76 15,803.23 5,882.34 2,588.68 1,519.23 9,990.25
5 Total Liabilities 117,510.13 101,735.69 118,398.63 337,644.44 96,834.82 98,993.93 92,700.64 288,529.40
PERIODIC DISCLOSURES
FORM NL-21 Statement of Liabilities
30th September 2014
Statement of Liabilities
As At 30th September 2014 As At 30th September 2013

FORM NL-22 Geographical Distribution of Business
Insurer:
IFFCO Tokio
General
Insurance
Company Ltd Date:
GROSS DIRECT PREMIUM UNDERWRITTEN FOR THE QUARTER:
(Rs in Lakhs) *GDP figures (Excluding pool)
For the qtr Upto the qtr For the qtrUpto the
qtr
For the
qtr
Upto the
qtrFor the qtr
Upto the
qtrFor the qtr Upto the qtr For the qtr Upto the qtr For the qtr
Upto the
qtr
For the
qtr
Upto the
qtrFor the qtr Upto the qtr
For the
qtr
Upto the
qtrFor the qtr Upto the qtr For the qtr Upto the qtr For the qtr Upto the qtr
Andhra Pradesh 159.45 307.63 0.66 1.38 0.57 1.09 4.75 10.75 722.28 1,385.69 660.65 1,197.22 0.97 1.15 2.38 9.30 11.15 35.48 0.65 1.05 - - 28.47 127.05 1,591.99 3,077.78
Arunachal Pradesh - - - - - - - - - - - - - - - - - - - - - - - - - -
Assam 0.14 61.45 - - - - - - - - - - - - - - - - - - - - - - 0.14 61.45
Bihar 412.91 444.46 - 0.02 - - (0.04) 0.61 155.92 300.63 75.53 134.35 - - 1.00 1.60 1.43 2.69 - - 637.84 637.84 0.21 1.81 1,284.78 1,523.99
Chhattisgarh 5.08 39.91 1.25 1.44 - - 5.95 14.95 544.31 1,108.79 309.95 620.39 - - 2.27 2.26 8.80 15.90 0.18 0.28 - - 15.71 33.02 893.51 1,836.95
Goa 17.26 42.75 2.22 5.06 40.93 80.74 6.78 15.54 339.63 608.61 253.25 460.42 0.60 0.73 5.12 15.12 14.81 19.96 0.35 0.77 - - 12.90 23.43 693.85 1,273.12
Gujarat 286.57 2,492.08 201.67 407.20 0.74 2.15 63.48 146.59 2,534.83 5,009.19 3,050.42 5,957.70 23.53 95.41 121.76 254.41 713.94 1,253.94 4.96 15.38 - - 552.51 1,148.20 7,554.42 16,782.26
Haryana 208.45 1,101.79 696.42 1,369.78 1.45 1.45 85.47 450.01 1,352.32 2,782.02 613.88 1,201.40 46.82 132.73 359.29 559.84 670.22 969.39 3.59 8.45 - - 283.26 564.64 4,321.17 9,141.49
Himachal Pradesh 12.59 38.22 - - - - - - - - - - - - - - - - - - - - - - 12.59 38.22
Jammu & Kashmir 0.31 2.62 - - - - - - 395.51 796.79 143.41 292.33 - - 0.21 1.04 1.16 3.10 - - - - 0.54 0.87 541.14 1,096.74
Jharkhand 6.49 21.94 1.00 1.25 - - 9.35 13.43 514.41 944.49 225.25 408.67 0.17 0.17 0.47 0.60 0.97 1.85 - - 325.00 325.00 8.23 8.38 1,091.33 1,725.78
Karnataka 98.25 728.57 24.91 51.04 - - 75.02 120.48 2,201.25 4,116.32 1,676.57 3,012.57 84.46 190.09 34.02 63.92 264.71 671.88 1.46 2.62 1,100.39 1,100.39 92.98 192.89 5,654.03 10,250.79
Kerala 45.25 90.42 (0.03) 1.25 - - 0.29 0.62 1,260.96 2,145.29 270.71 485.09 0.27 0.38 3.51 5.84 17.90 32.40 0.10 0.59 - - 60.33 114.32 1,659.29 2,876.21
Madhya Pradesh 63.67 239.70 48.27 91.05 - - 20.94 35.95 1,127.64 2,432.11 1,047.07 2,071.30 18.01 20.30 12.03 20.64 37.98 857.61 2.89 8.53 2.43 2.43 81.66 174.34 2,462.59 5,953.96
Maharasthra 414.67 1,962.22 179.68 805.43 98.32 805.28 492.12 1,104.80 3,664.24 7,414.47 3,088.80 5,923.37 244.65 1,346.90 121.40 366.19 1,718.75 4,039.05 12.57 37.26 1.46 1.46 3,520.65 5,441.13 13,557.32 29,247.55
Manipur - - - - - - - - - - - - - - - - - - - - - - - - - -
Meghalaya 0.11 0.11 - - - - - - - - - - - - - - - - - - - - - - 0.11 0.11
Mizoram - - - - - - - - - - - - - - - - - - - - - - - - - -
Nagaland 20.61 118.58 - - - - - - - - - - - - - - - - - - - - - - 20.61 118.58
Orissa 14.23 1,135.46 (0.04) 16.77 0.22 0.22 17.24 31.91 502.93 1,116.29 516.19 1,036.89 0.15 (1.43) 20.77 22.23 597.33 2,364.38 0.75 1.60 - - 22.87 43.04 1,692.64 5,767.35
Punjab 41.80 123.68 1.94 3.56 - - 2.02 29.67 1,468.45 3,102.86 1,045.57 2,090.12 8.20 9.85 50.94 83.16 38.69 60.72 1.68 3.85 - - 77.25 252.00 2,736.53 5,759.47
Rajasthan 118.85 321.18 4.48 7.22 - - 12.88 23.81 1,404.71 2,579.72 1,716.29 2,836.87 2.11 3.72 8.38 13.97 25.65 38.96 0.54 1.14 3,718.09 3,718.09 93.33 154.86 7,105.32 9,699.53
Sikkim - - - - - - - - - - - - - - - - - - - - - - - - - -
Tamil Nadu 85.09 684.23 223.85 712.38 - - 23.52 51.38 2,532.62 4,823.49 1,886.50 3,504.10 32.37 72.75 25.63 41.72 242.17 381.89 2.59 5.61 - - 126.89 267.03 5,181.22 10,544.59
Telangana - - 11.68 13.36 - - 432.12 487.34 721.25 1,513.81 446.17 898.65 23.57 38.51 15.33 52.07 1,295.76 1,861.46 1.05 3.54 - - 324.50 333.69
Tripura 0.07 0.76 - - - - - - - - - - - - - - - - - - - - - - 0.07 0.76
Uttar Pradesh 145.36 2,940.88 70.85 136.79 - - 26.59 75.40 2,069.39 4,392.38 1,229.47 2,372.64 1.55 8.65 7.19 16.19 62.06 123.48 2.93 5.89 2,292.55 2,318.87 46.18 72.40 5,954.13 12,463.58
Uttrakhand 24.69 131.44 0.44 2.60 - - 3.58 4.13 226.34 502.60 169.71 349.13 0.13 0.20 16.65 20.58 5.26 12.63 0.08 0.11 - - 12.70 40.91 459.59 1,064.32
West Bengal 64.94 562.66 7.33 28.15 - - 19.82 58.36 829.17 1,664.98 448.98 882.75 20.88 33.30 10.06 59.09 90.12 180.50 1.51 4.26 - 1.28 40.99 114.62 1,533.81 3,589.96
Andaman & Nicobar Is. 0.25 0.25 - - - - - - - - - - - - - - - - - - - - - - 0.25 0.25
Chandigarh 4.87 12.67 6.90 15.62 - - 3.22 4.97 1,089.76 2,336.68 686.40 1,364.15 0.87 1.15 50.87 63.68 31.04 50.67 0.43 0.83 - 967.54 39.14 76.60 1,913.51 4,894.55
Dadra & Nagra Haveli 1.27 16.66 - - - - - - - - - - - - - - - - - - - - - - 1.27 16.66
Daman & Diu 4.95 5.34 - - - - - - - - - - - - - - - - - - - - - - 4.95 5.34
Delhi 73.12 257.01 1,174.00 2,188.87 - 16.50 296.13 756.23 2,924.45 6,103.28 1,511.94 3,055.82 184.23 345.30 62.27 227.69 1,970.14 4,025.52 53.73 124.19 - - 864.94 1,514.42 9,114.95 18,614.82
Lakshadweep - - - - - - - - - - - - - - - - - - - - - - - - - -
Puducherry 0.27 0.54 - - - - - - - - - - - - - - - - - - - - - - 0.27 0.54
Total 2,331.60 13,885.22 2,657.51 5,860.23 142.23 907.42 1,601.21 3,436.91 28,582.39 57,180.49 21,072.71 40,155.92 693.55 2,299.87 931.55 1,901.13 7,820.03 17,003.46 92.06 225.95 8,077.75 9,072.89 6,306.23 10,699.67 80,308.80 162,629.16
Grand Total
PERIODIC DISCLOSURES
Apr'14 to Sep'14
STATES
Fire Marine (Cargo) Marine (Hull) Engineering Motor Own Damage Motor Third Party Liability insurance Personal Accident Medical InsuranceOverseas medical
InsuranceCrop Insurance All Other Miscellaneous

FORM NL-23 Reinsurance Risk Concentration
Insurer:IFFCO TOKIO GENERAL INSURANCE CO.LTD. Date:
Public Disclosures IInd quarter ending September, 2014 (Rs in Lakhs)
Proportional Non-Proportional Facultative
1 No. of Reinsurers with rating of AAA and above 0 - - - 0%
2 No. of Reinsurers with rating AA but less than AAA 17 6,915 476 7,253 31%
3 No. of Reinsurers with rating A but less than AA 98 18,849 1,267 9,284 62%
4 No. of Reinsurers with rating BBB but less than A 21 1,573 197 35 4%
5 No. of Reinsurers with rating less than BBB 0 - - - 0%
6 No.of Indian Reinsurers other than GIC 10 - - 1,901 4%
146 27,337 1,940 18,472 100% Total
PERIODIC DISCLOSURES
01/07/2014 TO 30/09/2014
Reinsurance Risk Concentration
S.No. Reinsurance Placements No. of reinsurers
Premium ceded to reinsurers Premium ceded to reinsurers
/ Total reinsurance premium
ceded (%)
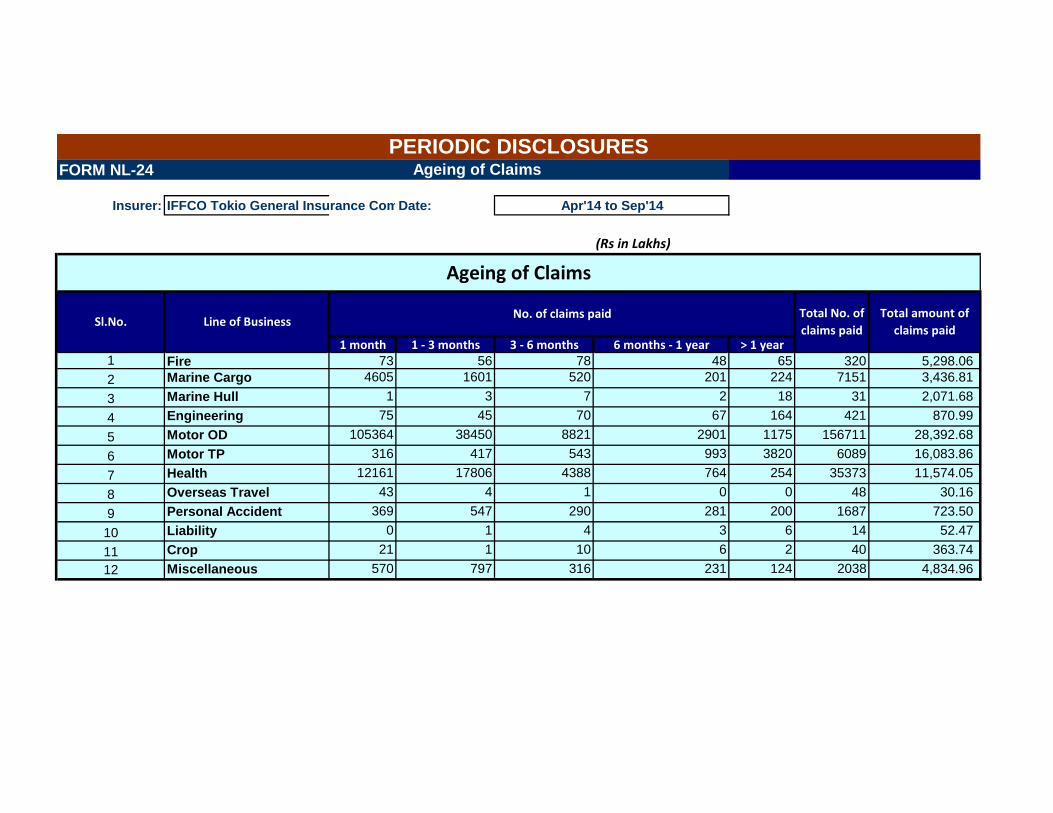
FORM NL-24 Ageing of Claims
Insurer: IFFCO Tokio General Insurance Company LtdDate:
(Rs in Lakhs)
1 month 1 - 3 months 3 - 6 months 6 months - 1 year > 1 year1 Fire 73 56 78 48 65 320 5,298.06
2 Marine Cargo 4605 1601 520 201 224 7151 3,436.81
3 Marine Hull 1 3 7 2 18 31 2,071.68
4 Engineering 75 45 70 67 164 421 870.99
5 Motor OD 105364 38450 8821 2901 1175 156711 28,392.68
6 Motor TP 316 417 543 993 3820 6089 16,083.86
7 Health 12161 17806 4388 764 254 35373 11,574.05
8 Overseas Travel 43 4 1 0 0 48 30.16
9 Personal Accident 369 547 290 281 200 1687 723.50
10 Liability 0 1 4 3 6 14 52.47
11 Crop 21 1 10 6 2 40 363.74
12 Miscellaneous 570 797 316 231 124 2038 4,834.96
PERIODIC DISCLOSURES
Apr'14 to Sep'14
Ageing of Claims
Sl.No. Line of BusinessNo. of claims paid Total No. of
claims paid
Total amount of
claims paid
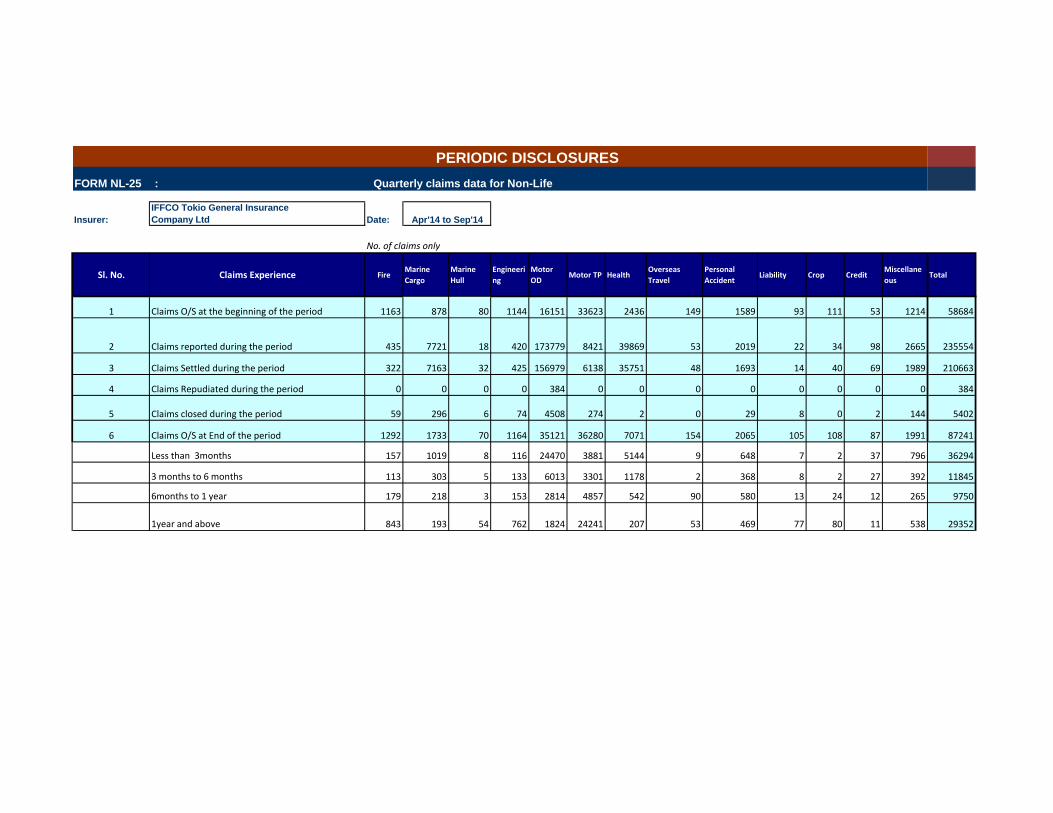
FORM NL-25 : Quarterly claims data for Non-Life
Insurer:
IFFCO Tokio General Insurance
Company Ltd Date:
No. of claims only
Sl. No. Claims Experience FireMarine
Cargo
Marine
Hull
Engineeri
ng
Motor
ODMotor TP Health
Overseas
Travel
Personal
AccidentLiability Crop Credit
Miscellane
ousTotal
1 Claims O/S at the beginning of the period 1163 878 80 1144 16151 33623 2436 149 1589 93 111 53 1214 58684
2 Claims reported during the period 435 7721 18 420 173779 8421 39869 53 2019 22 34 98 2665 235554
3 Claims Settled during the period 322 7163 32 425 156979 6138 35751 48 1693 14 40 69 1989 210663
4 Claims Repudiated during the period 0 0 0 0 384 0 0 0 0 0 0 0 0 384
5 Claims closed during the period 59 296 6 74 4508 274 2 0 29 8 0 2 144 5402
6 Claims O/S at End of the period 1292 1733 70 1164 35121 36280 7071 154 2065 105 108 87 1991 87241
Less than 3months 157 1019 8 116 24470 3881 5144 9 648 7 2 37 796 36294
3 months to 6 months 113 303 5 133 6013 3301 1178 2 368 8 2 27 392 11845
6months to 1 year 179 218 3 153 2814 4857 542 90 580 13 24 12 265 9750
1year and above 843 193 54 762 1824 24241 207 53 469 77 80 11 538 29352
PERIODIC DISCLOSURES
Apr'14 to Sep'14

Insurer : IFFCO TOKIO GENERAL INSURANCE CO. LTD.
Solvency for the Period Ended on 30th September 2014
Required solvency margin based on net premium and net incurred claims (Rs. in Lacs)
1 Fire 24,563.15 3,887.84 16,641.05 3,677.04 2,456.32 2,496.16 2,496.16
2 Marine Cargo 10,842.82 3,273.83 8,983.36 4,106.40 1,301.14 1,617.00 1,617.00
3 Marine Hull 1,082.93 202.86 2,446.81 553.95 108.29 367.02 367.02
4 Motor 189,235.15 171,332.94 136,213.45 117,463.69 34,266.59 35,239.11 35,239.11
5 Engineering 6,539.16 1,330.09 3,725.24 1,381.41 653.92 558.79 653.92
6 Aviation 97.95 2.30 584.80 490.45 9.80 147.13 147.13
7 Laibilities 3,454.64 1,726.72 4,266.57 231.13 518.20 959.98 959.98
8 Others 23,291.16 9,784.49 24,535.16 8,030.89 3,260.76 5,152.38 5,152.38
9 Health 27,567.10 23,191.48 24,316.60 20,774.06 4,638.30 6,232.22 6,232.22
Total 286,674.07 214,732.57 221,713.04 156,709.02 47,213.30 52,769.79 52,864.92
Note : Based on IRDA circular No IRDA/F&A/CIR/FA/126/07/2013 dated 3rd July, 2013, premium considered for the computation of RSM1 do not include premiums in respect of expired policies
RSM-1 RSM-2 RSM
PERIODIC DISCLOSURES
FORM NL-26 - CLAIMS INFORMATION - KG Table I
Item No. Description
PREMIUM
Gross Premium Net Premium
Gross incurred
claim
Net incurred
Claim

Sl. No.
1
2
3 Out of approvals of previous quarter
4 Out of approvals of this quarter
5
6
7
8
9
PERIODIC DISCLOSURES
FORM NL-27: Offices information for Non-Life
Insurer: IFFCO TOKIO General Insurance Co. Ltd. Date: 1st July, 2014 - 30th September, 2014
Office Information Number
No. of offices at the beginning of the Quarter 79
No. of branches approved during the Quarter 0
No. of branches opened
during the Quarter0
0
No. of rural branches 0
No. of urban branches 79
No. of branches closed during the Quarter 0
No of branches at the end of the Quarter 79
No. of branches approved but not opend 0

FORM - 3B
FORM - NL 28 STATEMENT OF ASSETS
COMPANY NAME & CODE: IFFCO-TOKIO GENEAL INSURANCE CO LTD & 106
STATEMENT AS ON : 30th September 2014
STATEMENT OF INVESTMENT ASSETS (General Insurer, Re-Insurer)
( Business within India)
PERIODICITY OF SUBMISSION: QUARTERLY
1 Investments 8 261,202.00
2 Loans 9 -
3 Fixed Assets 10 2,160.00
4 Current Assets -
a. Cash & Bank Balance 11 142,888.00
b. Advances & Other Assets 12 54,564.00
5 Current Liablities -
a. Current Liabilities 13 247,822.00
b. Provisions 14 117,510.00
c. Misc. Exp not written off 15
d. Debit Balance of P&L A/c
Application of Funds as per balance Sheet (A) 826,146.00
Less: Other Assets SCH
1 Loans (if any) 9 -
2 Fixed Assets (if any) 10 2,160.00
3 Cash & Bank Balance (if any) 11 8,838.00
4 Advances & Other Assets (if any) 12 54,564.00
5 Current Liablities 13 247,822.00
6 Provisions 14 117,510.00
7 Misc. Exp not written off 15 -
8 Debit Balance of P&L A/c
Total (B) 430,894.00
Investment Assets' as per FORM 3B (A-B) 395,252.00
Cont to next page…
PERIODIC DISCLOSURES

Cont from prev page… ( Rs in Lakhs)
Balance FRSM*
(a) (b) ('c) d=(b+c) (e) (d+e)
1 Not less than 20% 13605.00 71215.00 84,820.00 21.46% 0.00 84820.00 829.96
2 Not less than 30% 21021.00 110033.00 131,054.00 33.16% 0.00 131054.00 128,805.00
3
Not less than 15% 17916.00 93780.00 111,696.00 28.26% 0.00 111696.00 116,030.00
24461.00 128039.00 152,500.00 38.58% 2.00 152502.00 152,638.00
0.00 0.00 - 0.00% 0.00 0.00 -
TOTAL INVESTMENT ASSETS 100% 0 63398.00 331852.00 395,250.00 100.00% 2.00 395252.00 397473.00
Company is not splitting shareholders funds on the basis of solvency margin into FRSM & Balance, therefore, all shareholders funds are showh in FRSM column i.e., (b)
Note:
(*) FRSM refers 'Funds representing solvency margin'
(*) Pattern of investment will apply only to SH funds representing FRMS
(*) Book Value shall not include funds beyond solvency margin
Other Investments are as permitted under Sec27A(2) and 27B(3)
Government Securities
Government Securities or other approved securities (including
(I) above )
S.
No
. 'Investment' represented as Reg %
% ACTUAL
FVC Amount Total MARKET
VALUE
SH
PH Book Value(SH+PH)
Investment subject to Exposure Norms
1. Housing and Loans to SG for Housing and Fire Fighting
Equipment, Infrastructure Investments
2. Approved InvestmentsNot exceeding 55%
3. Other Investments(not exceeding 25%)
`

FORM NL-29 Detail regarding debt securities
Insurer: Date: 30-Sep-2014
(Rs in Lakhs)
As at 30.09.2014 as % of total for this
class As at 30.09.13
as % of total for
this class As at 30.06.2014
as % of total for
this class As at 30.09.13
as % of total for
this class
Break down by credit rating
AAA rated 249,410.00 96.68% 189,358.00 96.80% 247,750.00 96.87% 196,992.00 96.51%
AA or better 8,560.00 3.32% 6,254.00 3.20% 8,000.00 3.13% 6,000.00 3.49%
Rated below AA but above A - - 0.00% - - 0.00%
Rated below A but above B - - 0.00% - - 0.00%
Any other - - 0.00% - - 0.00%
BREAKDOWN BY
RESIDUALMATURITY
Up to 1 year 143,144.51 36.01% 101,951.00 30.61% 143,168.91 36.22% 102,013.00 31.18%
more than 1 year and upto
3years 46,865.91 11.79% 73,292.00 19.10% 46,900.20 11.87% 73,597.00 19.43%
More than 3years and up to
7years 73,247.98 18.43% 63,078.00 14.21% 74,117.69 18.75% 64,852.00 14.20%
More than 7 years and up to 10
years 67,046.28 16.87% 63,880.00 23.34% 66,908.16 16.93% 66,859.00 23.00%
above 10 years 67,167.97 16.90% 40,113.00 12.74% 64,154.54 16.23% 42,370.00 12.18%
Breakdown by type of the
issurer
a. Central Government 82,996.00 32.17% 75,116.00 37.62% 84,821.00 33.17% 79,507.00 37.72%
b. State Government 45,809.00 17.76% 34,306.00 18.07% 46,233.00 18.08% 35,743.00 17.82%
c.Corporate Securities 129,165.00 50.07% 86,190.00 44.31% 124,696.00 48.76% 87,742.00 44.46%
-
Note
1. In case of a debt instrument is rated by more than one agency, then the lowest rating will be taken for the purpose of classification.
2. Market value of the securities will be in accordnace with the valuation method specified by the Authority under Accounting/ Investment regulations.
PERIODIC DISCLOSURES
Iffco Tokio General Insurance Co. Ltd.
Detail Regarding debt securitiesMARKET VALUE Book Value

FORM NL-30 Analytical Ratios
Insurer: IFFCO TOKIO GENERAL INSURANCE CO. LTD.
S.No. Particular
Quarter Ended
30th September
2014
Period Ended 30th
September 2014
Quarter Ended 30th
September 2013
Period Ended 30th
September 2013
1 Gross Direct Premium Growth Rate 14.78% 10.17% 1.72% 15.77%
FIRE -16.88% -5.91% 1.15% 14.87%
MARINE -5.55% -1.81% 7.65% 19.18%
MISCELLANEOUS 17.18% 12.72% 1.47% 15.70%
2 Gross Direct Premium to Net Worth Ratio NA 1.67 NA 1.91
3 Growth rate of Net Worth NA 26.29% NA 26.93%
4 Net Retention Ratio 73.87% 72.80% 65.10% 65.62%
FIRE 40.28% 15.29% 28.74% 15.04%
MARINE 15.13% 36.97% 33.17% 42.06%
MISCELLANEOUS 78.11% 81.42% 68.77% 73.59%
5 Net Commission Ratio 0.66% 0.87% -2.98% -1.17%
FIRE -0.33% -34.61% -2.18% -33.98%
MARINE -43.06% -8.80% -13.73% -6.49%
MISCELLANEOUS 1.03% 1.88% -2.74% -0.11%
6Expense of Management to Gross Direct
Premium Ratio23.24% 22.20% 22.63% 21.02%
7Expense of Management to Net Written
Premium Ratio30.57% 29.68% 33.73% 31.28%
8 Net Incurred Claims to Net Earned Premium 78.34% 77.05% 77.54% 76.90%
9 Combined Ratio 104.75% 102.39% 102.37% 100.79%
10 Technical Reserves to Net Premium ratio NA 2.80 NA 2.94
PERIODIC DISCLOSURES
Analytical Ratios for Non-Life companies

11 Underwriting balance ratio -7.31% -5.86% -0.24% -1.01%
FIRE -10.42% 51.58% 58.91% 47.58%
MARINE 0.89% -33.13% -13.67% -41.02%
MISCELLANEOUS -7.44% -6.46% -1.23% -1.46%
12 Operating Profit Ratio 6.87% 8.05% 12.29% 11.61%
13 Liquid Assets to liabilities ratio NA 0.47 NA 0.54
14 Net earning ratio 5.95% 6.53% 10.97% 9.57%
15 Return on Net worth ratio NA 8.15% NA 12.31%
16Available Solvency Margin (ASM) to
Required Solvency Margin (RSM) RatioNA 1.67 NA 1.56
17 NPA Ratio
Gross NPA Ratio - - - -
Net NPA Ratio - - - -
1 (a) No. of shares NA 269,321,500 NA 269,321,500
2(b) Percentage of shareholding (Indian /
Foreign)NA 74/26 NA 74/26
3( c) %of Government holding (in case of public
sector insurance companies)NIL NIL NIL NIL
4
(a) Basic and diluted EPS before extraordinary
items (net of tax expense) for the period (not to
be annualized)
NA 2.92 NA 3.49
5
(b) Basic and diluted EPS after extraordinary
items (net of tax expense) for the period (not to
be annualized)
NA 2.92 NA 3.49
6 (iv) Book value per share (Rs) NA 35.81 NA 28.35
Note
Equity Holding Pattern for Non-Life Insurers
The Analytical Ratios has been calculated in accordance with the directions contained in IRDA’s circular dated 5th October 2012.

FORM NL-31: Related Party Transactions
Insurer: IFFCO TOKIO General Insurance Co.Ltd. Date: 30th September, 2014
Premium collected from direct business 6,178.62 5,823.51
Claims paid on direct basis 1,460.99 864.69
Payment of Rent and other expenses 1,074.62 974.91
Deposit of Insurance Premium 25.00 25.00
Premium collected from direct business 459.00 441.54
Deposit of Insurance Premium 1.00 1.00
Payment of Rent and other expenses - 5.37
Claims paid on direct basis 991.32 190.27
3 Tokio Marine Asia Pte Ltd(formerly Millea Asia Pte Ltd) Promoters with more than 20% Voting
rights
Payment of Fee 42.64 9.96
Premium on Cession of Re-insurance Premium 2,245.41 2,013.37
Commission Earned on Premium Ceded 489.53 391.33
Losses Recovered from Re-insurer 560.43 1,082.39
5Tokio Marine Claim Service Asia Pte Ltd Associate of Promoters with more than
20% Voting rights
Payment of Fee 1.67 13.36
Premium on Cession of Re-insurance Premium 46.29 382.13
Commission Earned on Premium Ceded 12.88 58.08
Losses Recovered from Re-insurer 10.20 382.32
7Tokio Marine Insurans(Malaysia) Berhad Associate of Promoters with more than
20% Voting rightsPayment of Fees 2.53 1.83
Payment of Fees 5.11 11.75
Claim/Reimbursement of Expenses 20.27 9.49
Claim/Reimbursement of Expenses 2.79 27.81
Payment of Fees 2.74 5.52
Premium on Cession of Re-insurance Premium 642.38 -
Commission Earned on Premium Ceded 100.59
Losses Recovered from Re-insurer 274.48
Claim/Reimbursement of Expenses - -
Payment of Fees 4.71 -
12 K. Sriniwasa Gowda Chairman Payment of Rent on ofiice Building 24.00 20.80
Premium collected from direct business 35.00 32.00
Claims paid on direct basis 9.02 6.79
Payment of -Commission 242.27 232.87
-Service Charges 2,512.40 2,024.60
Premium on Cession of Re-insurance Premium 1.79 -
Commission Earned on Premium Ceded 0.62
Losses Recovered from Re-insurer -
15 TOKIO MARINE & NICHIDO RISK CONSULTING CO. LTD. Associate of Promoters with more than
20% Voting rights
Payment of Fees 2.87 -
PERIODIC DISCLOSURES
4
Tokio Marine & Nichido Fire Insurance Co Ltd Associate of Promoters with more than
20% Voting rights
6
Tokio Marine Global Re Ltd. Associate of Promoters with more than
20% Voting rights
1
INDIAN FARMERS FERTILISER COOP LTD Promoters with more then 20% voting
rights
2
Indian Potash Limited Associate of Promoters with more than
20% Voting rights
(Rs in 'Lakhs)
Related Party Transactions
Sl.No. Name of the Related PartyNature of Relationship with the
CompanyDescription of Transactions / Categories
Up to 30th September 2014 Up to 30th September
2013
13
IFFCO TOKIO INSURANCE SERVICES LTD Subsidiary of the company with 100%
voting rights
14
Tokio Marine Europe Insurance Ltd. Associate of Promoters with more than
20% Voting rights
10
Tokio Marine Insurance Singapore Ltd Associate of Promoters with more than
20% Voting rights
11TM Management Services Ltd. Associate of Promoters with more than
20% Voting rights
8
Tokio Marine Services Europe Ltd.Associate of Promoters with more than
20% Voting rights
9TM Claims Services Inc Associate of Promoters with more than
20% Voting rights
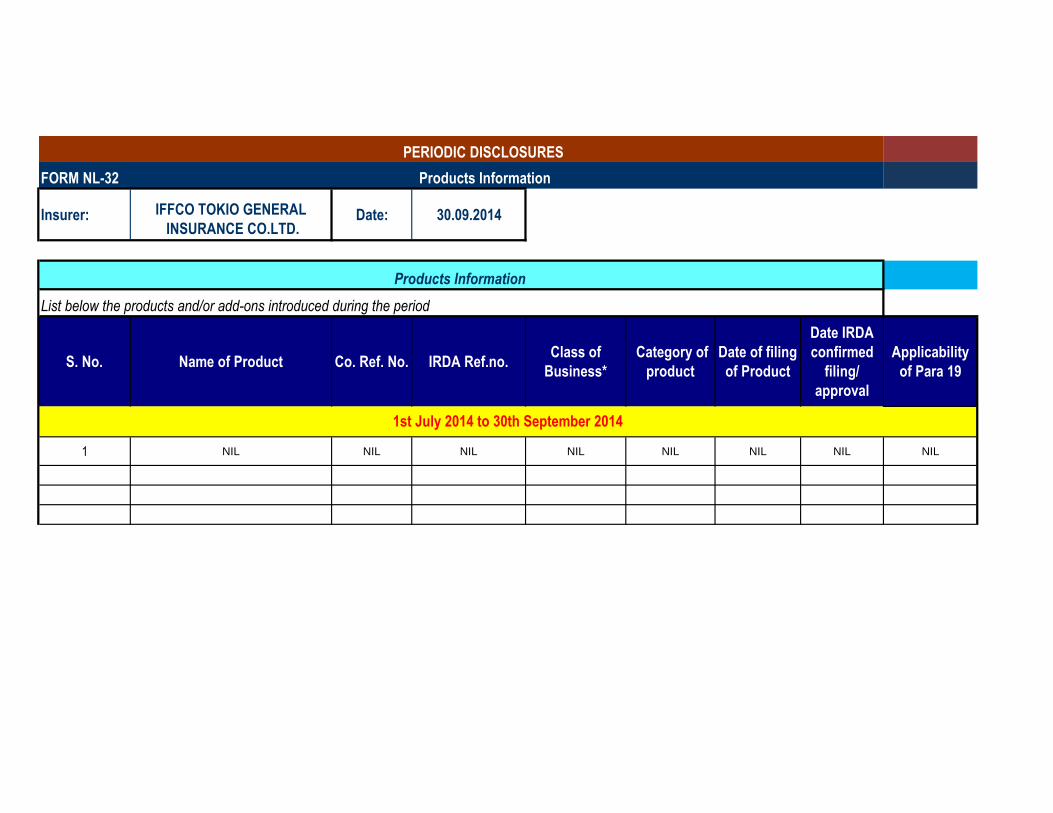
FORM NL-32
Insurer: IFFCO TOKIO GENERAL
INSURANCE CO.LTD.Date: 30.09.2014
List below the products and/or add-ons introduced during the period
S. No. Name of Product Co. Ref. No. IRDA Ref.no. Class of
Business*
Category of
product
Date of filing
of Product
Date IRDA
confirmed
filing/
approval
Applicability
of Para 19
1 NIL NIL NIL NIL NIL NIL NIL NIL
PERIODIC DISCLOSURES
Products Information
Products Information
1st July 2014 to 30th September 2014

FORM NL-33 - SOLVENCY MARGIN - KGII
TABLE - II
Solvency for the Period Ended on 30th September 2014
Available Solvency Margin and Solvency Ratio
(Rs. in Lacs)
Item Description Notes No. Amount
(1) (2) (3) (4)
1 Available Assets in Policyholders‟ Funds (adjusted value 342,573.00
of Assets as mentioned in Form IRDA-Assets-AA):
Deduct:
2 Liabilities (reserves as mentioned in Form HG) 337,644.44
3 Other Liabilities (other liabilities in respect of 4,928.55
Policyholders‟ Fund as mentioned in Balance Sheet)
4 Excess in Policyholders’ Funds (1-2-3) (0.00)
5 Available Assets in Shareholders‟ Funds (value of 130,813.94
Assets as mentioned in Form IRDA-Assets-AA):
Deduct:
6 Other Liabilities (other liabilities in respect of 42,606.12
Shareholders‟ Fund as mentioned in Balance Sheet)
7 Excess in Shareholders’ Funds (5-6) 88,207.82
8 Total Available Solvency Margin [ASM] (4+7) 88,207.82
9 Total Required Solvency Margin [RSM] 52,864.92
10 Solvency Ratio (Total ASM/Total RSM) 1.67
PERIODIC DISCLOSURES
FORM NL-33 - SOLVENCY MARGIN - KGII
Name of the Insurer: IFFCO TOKIO GENERAL INSURANCE CO. LTD.

Sl. No. Name of person Role/designation
1 Mr. K. Srinivasa Gowda Chairman
2 Mr. Lee King Chi Arthur Vice Chairman
3 Mr. Balvinder Singh Nakai Director
4 Dr. U.S. Awasthi Director
5 Mr. Rakesh Kapur Director
6 Dr. P.S. Gahlaut Director
7 Mr. S.K. Kanwar Director
8 Mr. Bahushrut Lugani Director
9 Mr. Yogesh Lohiya Managing Director & CEO
10 Mr. H.O. Suri Director (Marketing)
11 Mr. Ichiro Maeda Director (Operations)
12 Mr. Ravindra Pratap Singh Director
13 Mr. Khushwant Pahwa Appointed Actuary
14 Mr. V. Rajaraman Chief of Internal Audit
15 Mr. Sanjeev Chopra Chief Finance Officer
1 Key Persons as defined in IRDA Registration of Companies Regulations, 2000
No change
PERIODIC DISCLOSURES
FORM NL-34: Board of Directors & Key Persons
Insurer: IFFCO TOKIO General Insurance Co. Ltd. Date: 1st July, 2014 to 30th September, 2014
BOD and Key Person information
Details of change in the period
No change
No change
No change
No change
No change
No change
No change
No change
No change
No change
No change
No change
No change
No change

Company Name & Code: Iffco Tokio General Insurance Company Ltd (106)
Statement as on:
Details of Investment Portfolio
Periodicity of Submission : Quarterly
%Has there
been revision?Amount
Board
Approval Ref
Note:
A. Category of Investmet (COI) shall be as per INV/GLN/001/2003-04
B. FORM 7A shall be submitted in respect of each 'fund'.
C. Classification shall be as per F&A-Circulars-169-Jan-07 Dt.24-01-07.
Name of the Fund
COI Company NameInstrument
Type
Interest Rate
Total O/s
(Book Value)
Default
Principal
(Book Value)
Default
Interest (Book
Value)
PERIODIC DISCLOSURES
FORM NL-35-NON PERFORMING ASSETS-7A
ClassificationProvision
(%)
Provision
(Rs)
Principal
Due from
Interest
Due from
Deferred
Principal
Deferred
Interest
Rolled
Over?
Has there been any
Principal Waiver?
30th September 2014

COMPANY NAME & CODE: IFFCO-TOKIO GENEAL INSURANCE CO LTD & 106
STATEMENT AS ON : 30th September 2014 NAME OF THE FUND :
STATEMENT OF INVESTMENT AND INCOME ON INVESTMENT PERIODICITY OF SUBMISSION: QUARTERLYRs In Lakhs
Income on
Investment (Rs.)
Gross Yield
(%)1
Net Yield
(%)2
Income on
Investment (Rs.)
Gross
Yield (%)1
Net Yield
(%)2
Income on
Investment (Rs.)
Gross
Yield (%)1
Net Yield
(%)2
Book Value
Market
Value Book Value
Market
Value Book Value Market Value
1 CENTRAL GOVERNMENT BONDS CGSB 83,696.00 81,880.00 1,722.00 2.06 1.36 82,906.00 81,880.00 3,400.00 4.10 2.71 73,961.00 74,026.00 2,982.00 4.03 2.66
2 SPECIAL DEPOSITS CSPD - - - - - - - - - - - - - - -
3
DEPOSIT UNDER SECTION 7 OF INSURANCE
ACT, 1938 CDSS 1,155.00 1,116.00 24.11 2.09 1.38 1,156.42 1,116.00 48.00 4.17 2.75 1,161.44 1,089.00 48.00 4.15 2.74
4 TREASURY BILLS CTRB - - - - - - - - - - - - -
5 STATE GOVERNMENT BONDS SGGB 41,957.00 42,861.00 919.00 2.19 1.45 38,716.00 42,861.00 1,693.00 4.37 2.89 32,657.00 31,520.00 1,419.00 4.35 2.87
6 STATE GOVERNMENT GUARANTEED LOANS SGGL - - - - - - - - - - - - - -
7
OTHER APPROVED SECURITIES (EXCLUDING
INFRASTRUCTURE INVESTMENTS) SGOA 3,119.00 2,948.00 66.48 2.13 1.41 3,114.00 2,948.00 133.00 4.27 2.82 3,079.00 2,786.00 133.00 4.32 2.85
8 GUARANTEED EQUITY SGGE - - - - - - - - - - - - - - -
9 CENTRAL GOVERNMENT GUARANTEED LOANS CGSL - - - - - - - - - - - - - - -
10 LOANS TO STATE GOVERNMENT FOR HOUSING HLSH - - - - - - - - - - - - - - -
11
LOANS TO STATE GOVERNMENT FOR FIRE
FIGHTING EQUIPMENTS HLSF - - - - - - - - - - - - - - -
12
TERM LOAN - HUDCO / NHB / INSTITUTIONS
ACCREDITED BY NHB HTLH - - - - - - - - - - - - - - -
13
COMMERCIAL PAPERS - NHB / INSTITUTIONS
ACCREDITED BY NHB HTLN - - - - - - - - - - - - - - -
14 BONDS / DEBENTURES ISSUED BY HUDCO HTHD - - - - - - - - - - 2,000.00 1,936.00 73.00 3.64 2.40
15
BONDS / DEBENTURES ISSUED BY NHB /
INSTITUTIONS ACCREDITED BY NHB HTDN - - - - - - - - - - - - - - -
16
BONDS / DEBENTURES ISSUED BY AUTHORITY
CONSTITUTED UNDER ANY HOUSING / BUILDING
SCHEME APPROVED BY CENTRAL / STATE / ANY
AUTHORITY OR BODY CONSTITUTED BY
CENTRAL / STATE ACT HTDA 37,409.00 38,455.00 874.00 2.34 1.54 34,673.00 38,455.00 1,613.00 4.65 3.07 31,125.00 30,879.00 1,455.00 4.67 3.09
17 BONDS / DEBENTURES ISSUED BY HUDCO HFHD 5,000.00 5,549.00 103.00 2.07 2.07 5,000.00 5,549.00 206.00 4.12 4.12 1,208.00 1,370.00 48.00 3.95 3.95
18
BONDS / DEBENTURES ISSUED BY NHB /
INSTITUTIONS ACCREDITED BY NHB HFDN 1,025.65 1,314.00 22.20 2.19 1.44 1,026.00 1,314.00 45.00 4.35 2.87 - - - - -
19
BONDS / DEBENTURES ISSUED BY AUTHORITY
CONSTITUTED UNDER ANY HOUSING / BUIDLING
SCHEME APPROVED BY CENTRAL / STATE / ANY
AUTHORITY OR BODY CONSTITUTED BY
CENTRAL / STATE ACT HFDA - - - - - - - - - - - - - - -
20 HOUSING - SECURITISED ASSETS HMBS - - - - - - - - - - - - - - -
21
DEBENTURES / BONDS / CPS / LOANS -
(PROMOTER GROUP) HDPG - - - - - - - - - - - - - - -
22 DEBENTURES / BONDS / CPS / LOANS HODS - - - - - - - - - - - - - - -
23 HOUSING - SECURITISED ASSETS HOMB - - - - - - - - - - - - - - -
24
DEBENTURES / BONDS / CPS / LOANS -
(PROMOTER GROUP) HOPG - - - - - - - - - - - - - - -
25
INFRASTRUCTURE - OTHER APPROVED
SECURITIES ISAS - - - - - - - - - - - - - - -
26
INFRASTRUCTURE - PSU - EQUITY SHARES -
QUOTED ITPE - - - - - - - - - - - - - - -
27
INFRASTRUCTURE - INFRASTRUCTURE
DEVELOPMENT FUND (IDF) IDDF - - - - - - - - - - - - - - -
Investment (Rs.)
PERIODIC DISCLOSURES
FORM NL-36-YIELD ON INVESTMENTS 1
NO. Category of Investment
Category
Code
Current Quarter Year to Date Previous Year
Investment (Rs.) Investment (Rs.)

28
INFRASTRUCTURE - PSU - DEBENTURES /
BONDS IPTD 43,485.00 47,112.00 1,001.00 2.30 1.52 39,623.00 47,112.00 1,787.00 4.51 2.98 38,968.00 34,886.00 1,727.00 4.43 2.93
29
INFRASTRUCTURE - CORPORATE SECURITIES -
EQUITY SHARES-QUOTED ITCE - - - - - - - - - - - - - - -
30 INFRASTRUCTURE - PSU - CPS IPCP - - - - - - - - - - - - - - -
31
INFRASTRUCTURE - EQUITY AND EQUITY
RELATED INSTRUMENTS (PROMOTER GROUP) IEPG - - - - - - - - - - - - - - -
32
INFRASTRUCTURE - OTHER CORPORATE
SECURITIES - DEBENTURES/ BONDS ICTD - - - - - - - - - - - - - - -
33 INFRASTRUCTURE - SECURITISED ASSETS IESA - - - - - - - - - - - - - - -
34
INFRASTRUCTURE - DEBENTURES / BONDS /
CPS / LOANS - (PROMOTER GROUP) IDPG - - - - - - - - - - - - - - -
35
INFRASTRUCTURE - OTHER CORPORATE
SECURITIES - CPS ICCP - - - - - - - - - - - - - - -
36
INFRASTRUCTURE - TERM LOANS (WITH
CHARGE) ILWC - - - - - - - - - - - - - - -
37
INFRASTRUCTURE - PSU - DEBENTURES /
BONDS IPFD 19,846.00 23,599.00 416.00 2.09 2.09 19,846.00 23,599.00 827.00 4.17 4.17 5,299.00 6,062.00 202.00 3.81 3.81
38
INFRASTRUCTURE - OTHER CORPORATE
SECURITIES - DEBENTURES/ BONDS ICFD - - - - - - - - - - - - - - -
39
INFRASTRUCTURE - EQUITY (INCLUDING
UNLISTED) IOEQ - - - - - - - - - - - - - - -
40
INFRASTRUCTURE - DEBENTURES / BONDS /
CPS / LOANS IODS - - - - - - - - - - - - - - -
41 INFRASTRUCTURE - SECURITISED ASSETS IOSA - - - - - - - - - - - - - - -
42
INFRASTRUCTURE - EQUITY (PROMOTER
GROUP) IOPE - - - - - - - - - - - - - - -
43
INFRASTRUCTURE - DEBENTURES / BONDS /
CPS / LOANS - (PROMOTER GROUP) IOPD - - - - - - - - - - - - - - -
44 PSU - EQUITY SHARES - QUOTED EAEQ - - - - - - - - - - - - - - -
45
CORPORATE SECURITIES - EQUITY SHARES
(ORDINARY)- QUOTED EACE - - - - - - - - - - - - - - -
46 CORPORATE SECURITIES - BONDS - (TAXABLE) EPBT 12,793.00 13,135.00 312.00 2.44 1.61 12,104.00 13,135.00 586.00 4.84 3.20 10,098.00 11,057.00 481.00 4.77 3.15
47 CORPORATE SECURITIES - BONDS - (TAX FREE) EPBF - - - - - - - - - - - - - - -
48
CORPORATE SECURITIES - PREFERENCE
SHARES EPNQ - - - - - - - - - - - - - - -
49
CORPORATE SECURITIES - INVESTMENT IN
SUBSIDIARIES ECIS 50.00 50.00 - - - 50.00 50.00 - - - 50.00 50.00 - - -
50 CORPORATE SECURITIES - DEBENTURES ECOS - - - - - - - - - - - - - - -
51
CORPORATE SECURITIES - DERIVATIVE
INSTRUMENTS ECDI - - - - - - - - - - - - - - -
52 MUNICIPAL BONDS EMUN - - - - - - - - - - - - - - -
53 INVESTMENT PROPERTIES - IMMOVABLE EINP - - - - - - - - - - - - - - -
54 LOANS - POLICY LOANS ELPL - - - - - - - - - - - - - - -
55
LOANS - SECURED LOANS - MORTGAGE OF
PROPERTY IN INDIA (TERM LOAN) ELMI - - - - - - - - - - - - - - -
56
LOANS - SECURED LOANS - MORTGAGE OF
PROPERTY OUTSIDE INDIA (TERM LOAN) ELMO - - - - - - - - - - - - - - -
57
DEPOSITS - DEPOSIT WITH SCHEDULED BANKS,
FIS (INCL. BANK BALANCE AWAITING
INVESTMENT), CCIL, RBI ECDB 136,680.00 134,050.00 3,343.00 2.45 1.61 141,313.00 134,050.00 6,905.00 4.89 3.23 139,480.00 137,450.00 6,712.00 4.81 3.18
58 DEPOSITS - CDS WITH SCHEDULED BANKS EDCD - - - - - - - - - - - - - - -
59
DEPOSITS - REPO / REVERSE REPO - GOVT
SECURITIES ECMR - - - - - - - - - - - - - - -
60
DEPOSITS - REPO / REVERSE REPO -
CORPORATE SECURITIES ECCR - - - - - - - - - - - - - - -
61
DEPOSIT WITH PRIMARY DEALERS DULY
RECOGNISED BY RESERVE BANK OF INDIA EDPD - - - - - - - - - - - - - - -
62 CCIL - CBLO ECBO - - - - - - - - - - - - - - -
63 COMMERCIAL PAPERS ECCP - - - - - - - - - - - - - - -

64 APPLICATION MONEY ECAM - - - - - - - - 2,000.00 2,000.00 3.00 0.14 0.09
65
PERPETUAL DEBT INSTRUMENTS OF TIER I & II
CAPITAL ISSUED BY PSU BANKS EUPD - - - - - - - - - - - - - - -
66
EQUITY SHARES - COMPANIES INCORPORATED
OUTSIDE INDIA (INVESTED PRIOR TO IRDA
REGULATIONS) EFES - - - - - - - - - - - - - - -
67
PERPETUAL DEBT INSTRUMENTS OF TIER I & II
CAPITAL ISSUED BY NON-PSU BANKS EPPD - - - - - - - - - - - - - - -
68
EQUITY SHARES (INCL. EQUITY RELATED
INSTRUMENTS) - PROMOTER GROUP EEPG - - - - - - - - - - - - - - -
69
PERPETUAL NON-CUM. P.SHARES &
REDEEMABLE CUMULATIVE P.SHARES OF TIER 1
& 2 CAPITAL ISSUED BY PSU BANKS EUPS - - - - - - - - - - - - - - -
70
PERPETUAL NON-CUM. P.SHARES &
REDEEMABLE CUMULATIVE P.SHARES OF TIER 1
& 2 CAPITAL ISSUED BY NON-PSU BANKS EPPS - - - - - - - - - - - - - - -
71
CORPORATE SECURITIES - DEBENTURES /
BONDS/ CPS /LOAN - (PROMOTER GROUP) EDPG - - - - - - - - - - - - - - -
72
FOREIGN DEBT SECURITIES (INVESTED PRIOR
TO IRDA REGULATIONS) EFDS - - - - - - - - - - - - - - -
73
MUTUAL FUNDS - GILT / G SEC / LIQUID
SCHEMES EGMF 4,672.00 5,403.00 109.00 2.33 1.54 5,013.00 5,403.00 212.00 4.23 2.79 3,785.00 4,001.00 165.00 4.35 2.87
74
MUTUAL FUNDS - (UNDER INSURERS
PROMOTER GROUP) EMPG - - - - - - - - - - - - - - -
75
NET CURRENT ASSETS (ONLY IN RESPECT OF
ULIP BUSINESS) ENCA - - - - - - - - - - - - - - -
76 BONDS - PSU - TAXABLE OBPT - - - - - - - - - - - - - - -
77 BONDS - PSU - TAX FREE OBPF - - - - - - - - - - - - - - -
78 EQUITY SHARES (INCL CO-OP SOCIETIES) OESH - - - - - - - - - - - - - - -
79 DEBENTURES OLDB - - - - - - - - - - - - - - -
80 MUNICIPAL BONDS OMUN - - - - - - - - - - - - - - -
81 COMMERCIAL PAPERS OACP - - - - - - - - - - - - - - -
82 PREFERENCE SHARES OPSH - - - - - - - - - - - - - - -
83
VENTURE FUND / SEBI APPROVED ALTERNATE
INVESTMENT FUND OVNF - - - - - - - - - - - - - - -
84 EQUITY SHARES (PSUS & UNLISTED) OEPU - - - - - - - - - - - - - - -
85 SHORT TERM LOANS (UNSECURED DEPOSITS) OSLU - - - - - - - - - - - - - - -
86
EQUITY SHARES (INCL. EQUITY RELATED
INSTRUMENTS) - PROMOTER GROUP OEPG - - - - - - - - - - - - - - -
87 TERM LOANS (WITHOUT CHARGE) OTLW - - - - - - - - - - - - - - -
88
DEBENTURES / BONDS/ CPS / LOANS ETC. -
(PROMOTER GROUP) ODPG - - - - - - - - - - - - - - -
89
MUTUAL FUNDS - DEBT / INCOME / SERIAL
PLANS / LIQUID SECEMES OMGS - - - - - - - - 1,799.00 3,200.00 40.00 2.21 1.46
90
MUTUAL FUNDS - (UNDER INSURERS
PROMOTER GROUP) OMPG - - - - - - - - - - - - - - -
91 DERIVATIVE INSTRUMENTS OCDI - - - - - - - - - - - - - - -
92 SECURITISED ASSETS OPSA - - - - - - - - - - - - - - -
93 INVESTMENT PROPERTIES - IMMOVABLE OIPI - - - - - - - - - - - - - - -
94 Total 390,888.00 397,473.00 8,912.00 2.28 1.55 384,539.00 397,473.00 17,454.00 4.54 3.09 346,670.00 342,312.00 15,487.00 4.47 3.14
Note: Category of Investment(COI) shall be as per Guidelines
1. To be calculated based on Monthly or lesser frequency'Weighted Average' of Investments
2. Yield netted for Tax
3. FORM-1 shall be prepared in respect of each fund

Statement as on: Name of Fund
Statement of Down Graded Investments
Periodicity of Submission: Quarterly
Rs. Lakhs
No Name of the Security COI AmountDate of
Purchase
Rating
Agency
Original
Grade
Current
Grade
Date of
DowngradeRemarks
A. During the Quarter ¹
- - - - - - - - -
B. As on Date ²
10.09% MRF BS 27-05-2019 EPBT 1000 5/27/2011 CRISIL LAAA AA+ 10/30/2013
8.10% HUDCO DB 05-03-2022 HFHD 2000 4/4/2012 CRISIL AAA AA+ 3/5/2012
Date:
Note:
1 Provide details of Down Graded Investments during the Quarter.
2 Investments currently upgraded, listed as Down Graded during earlier Quarter shall be deleted from the Cumulative listing.
3 FORM-2 shall be prepared in respect of each fund.
4 Category of Investmet (COI) shall be as per INV/GLN/001/2003-04
30th September 2014
PERIODIC DISCLOSURES
FORM NL-37-DOWN GRADING OF INVESTMENT-2

FORM NL-38 Quarterly Business Returns across line of Business
Insurer:
IFFCO Tokio General Insurance
Company Ltd Date:
Gross Direct Premium (Rs in Lakhs) (Rs in Lakhs)
Premium No. of Policies Premium No. of Policies Premium No. of Policies PremiumNo. of
Policies
1 Fire 2,331.60 14747 2,809.17 18626 13,885.22 28429 14,754.74 34930
2 Cargo & Hull 2,799.73 4517 3,068.14 2905 6,767.65 8806 6,717.14 5565
3 Motor TP 21,072.71 87988 15,431.33 17268 40,155.92 122532 34,378.47 35690
4 Motor OD 28,582.39 959267 22,932.20 825113 57,180.49 1917582 49,141.26 1791501
5 Engineering 1,601.21 1652 2,898.02 1417 3,436.91 3248 5,708.01 2901
6 Workmen's Compensation 588.81 4603 368.58 2470 1,123.04 8329 807.41 5360
7 Employer's Liability - 0 - 0 - 0 - 0
8 Aviation 28.72 3 54.92 3 60.45 10 241.00 16
9 Personal Accident 931.55 29432 702.83 32902 1,901.13 68424 1,607.25 75402
10 Health 7,912.08 39641 6,392.05 26855 17,229.41 75569 12,746.55 53616
11 Others* 14,460.00 104703 15,192.38 71872 20,888.93 216768 21,090.42 140595
Note:
1. Premium stands for amount of premium
2. The line of business which are not applicable for any company should be filled up with NA.
Figure '0' in those fields will imply no business in the segment.
*any other segment contributing more than 5% of the total premium needs to be shown separately
3.Premium is Gross Direct Premium
same period of the previos
year
1st Apr'14 to 30th Sep'2014
PERIODIC DISCLOSURES
Quarterly Business Returns across line of Business
Sl.No. Line of BusinessCurrent Quarter Same Quarter previous year upto the period

Insurer:
IFFCO TOKIO General
Insurance Company Date: July- Sep' 2014
(Rs in Lakhs)
(Rs in Lakhs)
Sl.No. Line of Business Particular No. of Policies Issued Premium Collected Sum Assured
Rural 1,794 92.61 281,444.51
Social
Rural - - 0.00
Social
Rural - 5,795.49 0.00
Social
Rural 189,752 4,175.81 373,391.33
Social
Rural 27 3.79 609.79
Social
Rural 121 14.67 3,111.77
Social
Rural 125 2.27 409.46
Social
Rural - - 0.00
Social
Rural 5,611 537.87 1,862,472.85
Social 1,208 26.38 1,301,984.00
Rural 1,224 3,151.36 287,421.50
Social 13 2,501.61 281,645.70
Rural 15,260 9,879.43 532,902.86
Social 4,978 2,346.36 30,425.31
Engineering
6 Workmen's Compensation
Rural & Social Obligations (Quarterly Returns)
1 Fire
2 Cargo & Hull
3 Motor TP
10 Health
11 Others
PERIODIC DISCLOSURES FORM NL-39 Rural & Social Obligation
Rural & Social Obligations (Quarterly Returns)
7 Employer's Liability
8 Aviation
9 Personal Accident
4 Motor OD
5

FORM NL-40
Insurer:
IFFCO Tokio General
Insurance Company Ltd Date:
(Rs in Lakhs)
No. of Policies Premium No. of Policies Premium No. of Policies Premium No. of Policies Premium
1 Individual agents 611730 22,545.24 528383 17,913.61 1233013 45,285.52 890846 32,211.61
2 Corporate Agents-Banks 2558 59.14 4243 94.00 6709 159.06 7549 192.00
3 Corporate Agents -Others 199815 4,117.80 136233 3,558.00 396304 8,075.83 194505 4,322.00
4 Brokers 200825 30,776.23 143961 22,187.74 401441 64,581.93 318804 49,001.74
5 Micro Agents 1560 18.43 1944 20.00 2778 33.55 4304 42.00
6 Direct Business 230065 22,791.96 184667 26,076.29 409452 44,493.27 729568 61,422.91
Total (A) 1246553 80,308.80 999431 69,849.64 2449697 162,629.16 2145576 147,192.26
1 Referral (B) - - - - - - - -
Grand Total (A+B) 1246553 80,308.80 999431 69,849.64 2449697 162,629.16 2145576 147,192.26
Note:
1. Premium means amount of premium received from business acquired by the source
2. No of Policies stand for no. of policies sold
3.The channel mapping has been corrected in FY 2013-14
4.Premium is Gross Direct Premium
PERIODIC DISCLOSURES Business Acquisition through different channels
Sl.No.
Business Acquisition through different channels
ChannelsCurrent Quarter Same quarter Previous Year Up to the period Same period of the previous year
1st Apr'14 to 30th Sep'2014

FORM NL-41 GREIVANCE DISPOSAL
Insurer: IFFCO-TOKIO GENERAL INSURANCE Co. Ltd. Date: July-Sep'2014
Fully AcceptedPartial
AcceptedRejected
1 Complaints made by customers
a) Proposal related 0 0 0 0 0 0
b) Claim 32 579 445 39 44 83
c) Policy Related 28 124 104 19 9 20
d) Premium 1 5 1 0 0 5
e) Refund 0 0 0 0 0 0
f) Coverage 0 0 0 0 0 0
g) Cover note related 0 0 0 0 0 0
h) Product 0 0 0 0 0 0
i) others 11 17 12 5 4 7
Total Number of Complaints 72 725 562 63 57 115
2 Total No. of policies during previous year 4,455,505 2013-14
3 Total No. of Claims during previous year 377,973 2013-14
4 Total no. of policies during current year 1,246,623 Q2 - 2014-15
5 Total no. of claims during current year 125,069 Q2 - 2014-15
6 Total No. of Policy Complaints (current year) per
10,000 policies (current year) 1.17 Q2 - 2014-15
7 Total No. of Claim Complaints (current year) per
10,000 claims registered (current year) 46.29 Q2 - 2014-15
8 Duration wise Pending Status
Complaints made
by customers
Complaints made
by intermediaries Total
(a) Up to 7 days 37 0 37
(b) 7-15 days 23 0 23
© 15-30 days 16 0 16
(d) 30-90 days 38 0 38
(e) 90 days and beyond 1 0 1
Total Number of Complaints 115 0 115
PERIODIC DISCLOSURES
GRIEVANCE DISPOSAL FOR THE PERIOD July- September, 2014 DURING THE FINANCIAL YEAR 2014-15
Sl No. Particulars Opening Balance * Additions Complaints Resolved Complaints Pending