Disaster Recovery and High Availability Configuration Guide
11
Disaster Recovery and High Availability Configuration Guide www.eventloganalyzer.com
Transcript of Disaster Recovery and High Availability Configuration Guide
Disaster Recovery and High AvailabilityConfiguration Guide
www.eventloganalyzer.com

Table of Contents
Purpose of the document
EventLog Analyzer Distributed Edition
Disaster Recovery for EventLog Analyzer Distributed Edition
High availability in EventLog Analyzer Distributed Edition
Why it is necessary to ensure high availability of EventLog Analyzer?
Working of High Availability in EventLog Analyzer
Prerequisites
Steps to configure high availability
Steps to activate standby server automatically
1
1
2
2
2
3
4
5
9
1
Purpose of the documentThis document highlights the provisions for disaster recovery in the distributed edition of EventLog
Analyzer. It also illustrates the working and benefits of the high availability feature in the product.
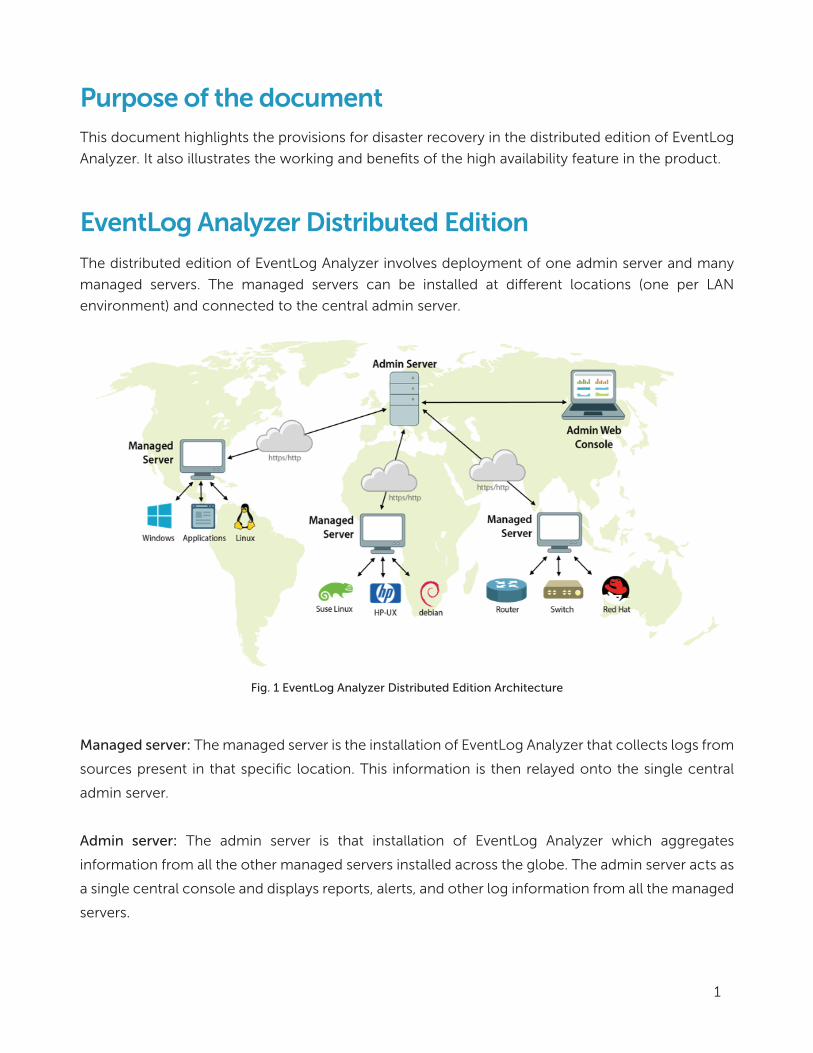
EventLog Analyzer Distributed EditionThe distributed edition of EventLog Analyzer involves deployment of one admin server and many
managed servers. The managed servers can be installed at di�erent locations (one per LAN
environment) and connected to the central admin server.
Managed server: The managed server is the installation of EventLog Analyzer that collects logs from
sources present in that specific location. This information is then relayed onto the single central
admin server.
Admin server: The admin server is that installation of EventLog Analyzer which aggregates
information from all the other managed servers installed across the globe. The admin server acts as
a single central console and displays reports, alerts, and other log information from all the managed
servers.
Fig. 1 EventLog Analyzer Distributed Edition Architecture
Why it is necessary to ensure high availability of EventLog Analyzer?
Being a network security solution, EventLog Analyzer constantly monitors log data, looks for
anomalies and attack patterns, validates threats, and helps in combating security attacks.
If the EventLog Analyzer server goes down, it would result in stoppage of log data collection and
analysis. This could cause failure in identifying security incidents and in turn result in serious data
breaches. Such breaches can cause not just huge financial losses and non-compliance penalties
but also loss of credibility and reputation. Hence it's advisable to ensure high availability of EventLog
Analyzer and thereby keep it running all the time.
2
Disaster Recovery for EventLog AnalyzerDistributed Edition
High availability in EventLog AnalyzerDistributed Edition
Log data from all possible log sources is collected and stored in the EventLog Analyzer server. This
data is analyzed to detect anomalies and network security threats. Hence, the EventLog Analyzer
server is a critical component from the perspective of an organization's network security. In the
unlikely event of a major glitch in your environment which causes the EventLog Analyzer server to
go down, log processing and analysis would come to a halt. This stoppage might turn out to be a
gateway for security breaches. To avert such disasters, EventLog Analyzer has a backup mechanism.
As a disaster recovery measure, EventLog Analyzer o�ers the high availability feature. It allows for
every EventLog Analyzer server, both admin and managed, to be configured with a standby server.
This standby server would continuously monitor the primary server. In case the primary server fails,
the standby server would immediately step in and start performing all the duties of the primary one
without any lapse. Read more about the working of EventLog Analyzer's high availability module in
the upcoming sections.
To configure high availability for the distributed edition, the below mentioned procedure needs to
performed on each installation of EventLog Analyzer, be it an admin server or a managed server.

Working of High Availability in EventLog Analyzer
EventLog Analyzer’s high availability setup includes two separate installations. One of them acts as
a primary server while the other acts as a standby server. Both the installations would point to the
same database. And the archived log data and ES data will be available in the common network
share.
Standbyserver
Status: Up and running Status: Standby mode
Primary server
Archive and ES (in remote machine for
common access)
Common database
3
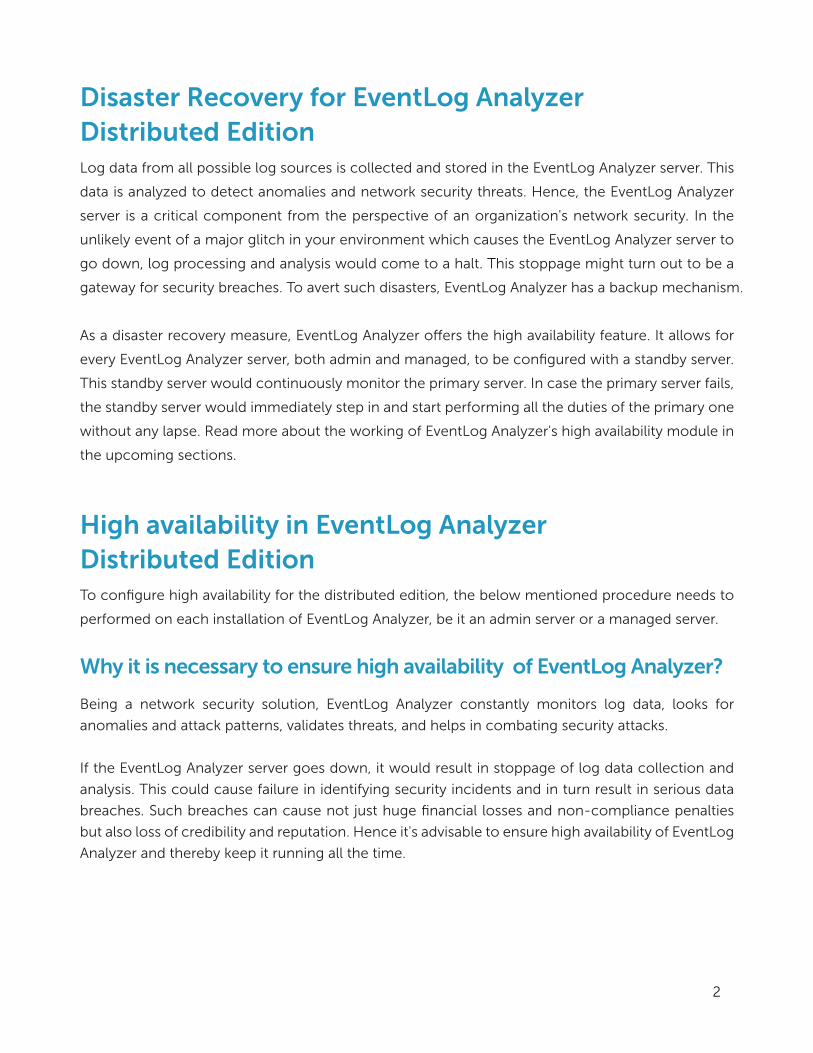
By default, the primary server will deliver all the required services. The standby server will also be
started but it will remain in the standby mode. But it will continuously keep monitoring the primary
server's status. Whenever the primary server fails, the standby server will kick in and take up the role
of the primary server. It will start collecting the logs to prevent any data loss and continue to
perform all the functions of the primary server until the actual primary server is brought back into
service.
Standbyserver
Status: DownStatus: Up
Functions as primary server
Primary server
Archive and ES (in remote machine for
common access)
Common database
Prerequisites
Before beginning configuring EventLog Analyzer for high availability, make sure you have two static
IP addresses and one virtual IP address.
4
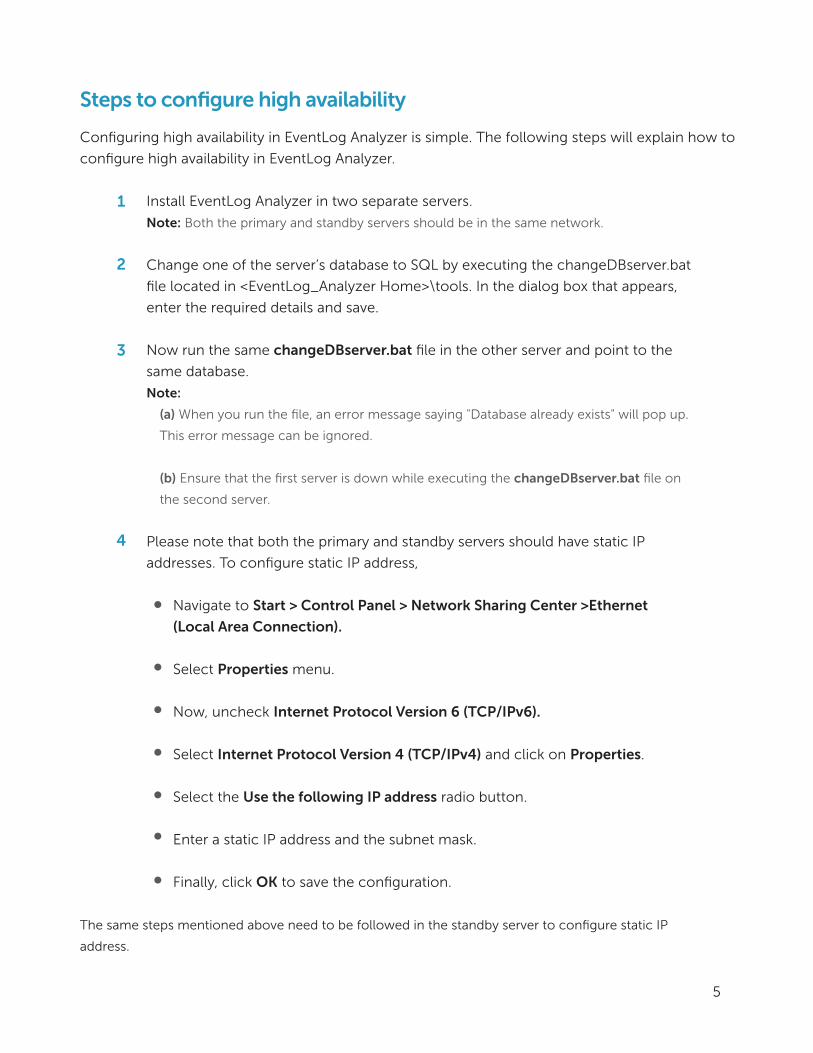
Steps to configure high availability
Configuring high availability in EventLog Analyzer is simple. The following steps will explain how to
configure high availability in EventLog Analyzer.
Install EventLog Analyzer in two separate servers.
Note: Both the primary and standby servers should be in the same network.
Change one of the server’s database to SQL by executing the changeDBserver.bat
file located in <EventLog_Analyzer Home>\tools. In the dialog box that appears,
enter the required details and save.
Now run the same changeDBserver.bat file in the other server and point to the
same database.
Note:
(a) When you run the file, an error message saying "Database already exists" will pop up.
This error message can be ignored.
(b) Ensure that the first server is down while executing the changeDBserver.bat file on
the second server.
Please note that both the primary and standby servers should have static IP
addresses. To configure static IP address,
Navigate to Start > Control Panel > Network Sharing Center >Ethernet
(Local Area Connection).
Select Properties menu.
Now, uncheck Internet Protocol Version 6 (TCP/IPv6).
Select Internet Protocol Version 4 (TCP/IPv4) and click on Properties.
Select the Use the following IP address radio button.
Enter a static IP address and the subnet mask.
Finally, click OK to save the configuration.
The same steps mentioned above need to be followed in the standby server to configure static IP
address.
1
2
3
4
5

Now add the below entry in wrapper.conf file located in <EventLog
Analyzer_Home>\server\conf.
In the primary server, include the below lines:
wrapper.java.additional.x+1=-DremoteIp=<Secondary Server IP>
wrapper.java.additional.x+2=-DlocalIp=<Primary Server IP>
wrapper.java.additional.x+3=-DvirtualIp=<Virtual IP>
In the standby server add the below lines:
wrapper.java.additional.x+1=-DremoteIp=<Primary Server IP>
wrapper.java.additional.x+2=-DlocalIp=<Standby Server IP>
wrapper.java.additional.x+3=-DvirtualIp=<Virtual IP>
wrapper.java.additional.x+4=-DSecondary=true
Note: Both the primary and standby servers should be configured with the same virtual
IP address.
The value of x varies depending on the setup in your organization. To find the
value of x that you need to enter,
Navigate to <EventLog Analyzer_Home>\server\conf\wrapper.conf and search
for "wrapper.java.additional.".
Navigate to the last occurence of the search result and note down the
numerical value that is next to "wrapper.java.additonal." It is your value for x.
Add the commands for primary and secondary servers based on this value of x.
For example, let us consider the last occurence of searching for
"wrapper.java.additional." to be "wrapper.java.additional.36". In this scenario,
your value for x is 36 and the lines you would need to add in the primary server
would be:
wrapper.java.additional.37=-DremoteIp=123.456.789.123
wrapper.java.additional.38=-DlocalIp=123.456.789.124
wrapper.java.additional.39=-DvirtualIp=123.456.789.125
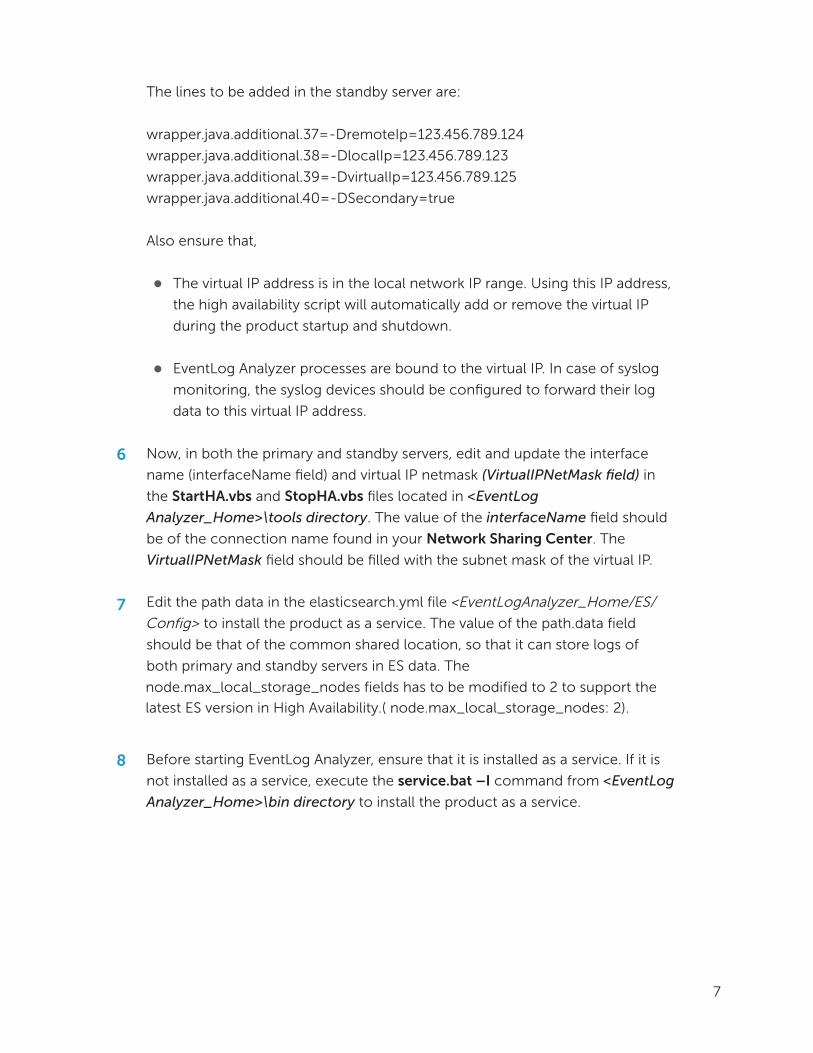
5 The lines to be added in the standby server are:
wrapper.java.additional.37=-DremoteIp=123.456.789.124
wrapper.java.additional.38=-DlocalIp=123.456.789.123
wrapper.java.additional.39=-DvirtualIp=123.456.789.125
wrapper.java.additional.40=-DSecondary=true
Also ensure that,
The virtual IP address is in the local network IP range. Using this IP address,
the high availability script will automatically add or remove the virtual IP
during the product startup and shutdown.
EventLog Analyzer processes are bound to the virtual IP. In case of syslog
monitoring, the syslog devices should be configured to forward their log
data to this virtual IP address.
Now, in both the primary and standby servers, edit and update the interface
name (interfaceName field) and virtual IP netmask (VirtualIPNetMask field) in
the StartHA.vbs and StopHA.vbs files located in <EventLog
Analyzer_Home>\tools directory. The value of the interfaceName field should
be of the connection name found in your Network Sharing Center. The
VirtualIPNetMask field should be filled with the subnet mask of the virtual IP.
Edit the path.data in the elasticsearch.yml file located in <EventLog
Analyzer_Home\ES\Config. The value of the path.data field should be that of
the common shared location, so that it can store logs of both primary and
standby servers in ES data.
Note: Please ensure that both primary and standby servers have full permission to the
shared folder.
Before starting EventLog Analyzer, ensure that it is installed as a service. If it is
not installed as a service, execute the service.bat –I command from <EventLog
Analyzer_Home>\bin directory to install the product as a service.
6
Now add the below entry in wrapper.conf file located in <EventLog
Analyzer_Home>\server\conf.
In the primary server, include the below lines:
wrapper.java.additional.x+1=-DremoteIp=<Secondary Server IP>
wrapper.java.additional.x+2=-DlocalIp=<Primary Server IP>
wrapper.java.additional.x+3=-DvirtualIp=<Virtual IP>
In the standby server add the below lines:
wrapper.java.additional.x+1=-DremoteIp=<Primary Server IP>
wrapper.java.additional.x+2=-DlocalIp=<Standby Server IP>
wrapper.java.additional.x+3=-DvirtualIp=<Virtual IP>
wrapper.java.additional.x+4=-DSecondary=true
Note: Both the primary and standby servers should be configured with the same virtual
IP address.
The value of x varies depending on the setup in your organization. To find the
value of x that you need to enter,
Navigate to <EventLog Analyzer_Home>\server\conf\wrapper.conf and search
for "wrapper.java.additional.".
Navigate to the last occurence of the search result and note down the
numerical value that is next to "wrapper.java.additonal." It is your value for x.
Add the commands for primary and secondary servers based on this value of x.
For example, let us consider the last occurence of searching for
"wrapper.java.additional." to be "wrapper.java.additional.36". In this scenario,
your value for x is 36 and the lines you would need to add in the primary server
would be:
wrapper.java.additional.37=-DremoteIp=123.456.789.123
wrapper.java.additional.38=-DlocalIp=123.456.789.124
wrapper.java.additional.39=-DvirtualIp=123.456.789.125
The lines to be added in the standby server are:
wrapper.java.additional.37=-DremoteIp=123.456.789.124
wrapper.java.additional.38=-DlocalIp=123.456.789.123
wrapper.java.additional.39=-DvirtualIp=123.456.789.125
wrapper.java.additional.40=-DSecondary=true
Also ensure that,
The virtual IP address is in the local network IP range. Using this IP address,
the high availability script will automatically add or remove the virtual IP
during the product startup and shutdown.
EventLog Analyzer processes are bound to the virtual IP. In case of syslog
monitoring, the syslog devices should be configured to forward their log
data to this virtual IP address.
Now, in both the primary and standby servers, edit and update the interface
name (interfaceName field) and virtual IP netmask (VirtualIPNetMask field) in
the StartHA.vbs and StopHA.vbs files located in <EventLog
Analyzer_Home>\tools directory. The value of the interfaceName field should
be of the connection name found in your Network Sharing Center. The
VirtualIPNetMask field should be filled with the subnet mask of the virtual IP.
Edit the path data in the elasticsearch.yml file <EventLogAnalyzer_Home/ES/
Config> to install the product as a service. The value of the path.data field
should be that of the common shared location, so that it can store logs of
both primary and standby servers in ES data. The
node.max_local_storage_nodes fields has to be modified to 2 to support the
latest ES version in High Availability.( node.max_local_storage_nodes: 2).
Before starting EventLog Analyzer, ensure that it is installed as a service. If it is
not installed as a service, execute the service.bat –I command from <EventLog
Analyzer_Home>\bin directory to install the product as a service.
6
7
8
7
Start the primary server from Windows Services console.
Note: Please use only an administrator credential to start EventLog Analyzer service in
both primary and standby servers.
Now in EventLog Analyzer, navigate to Settings> Archive> Settings and change
the location of archive log data to the common shared folder by providing its
exact UNC path.
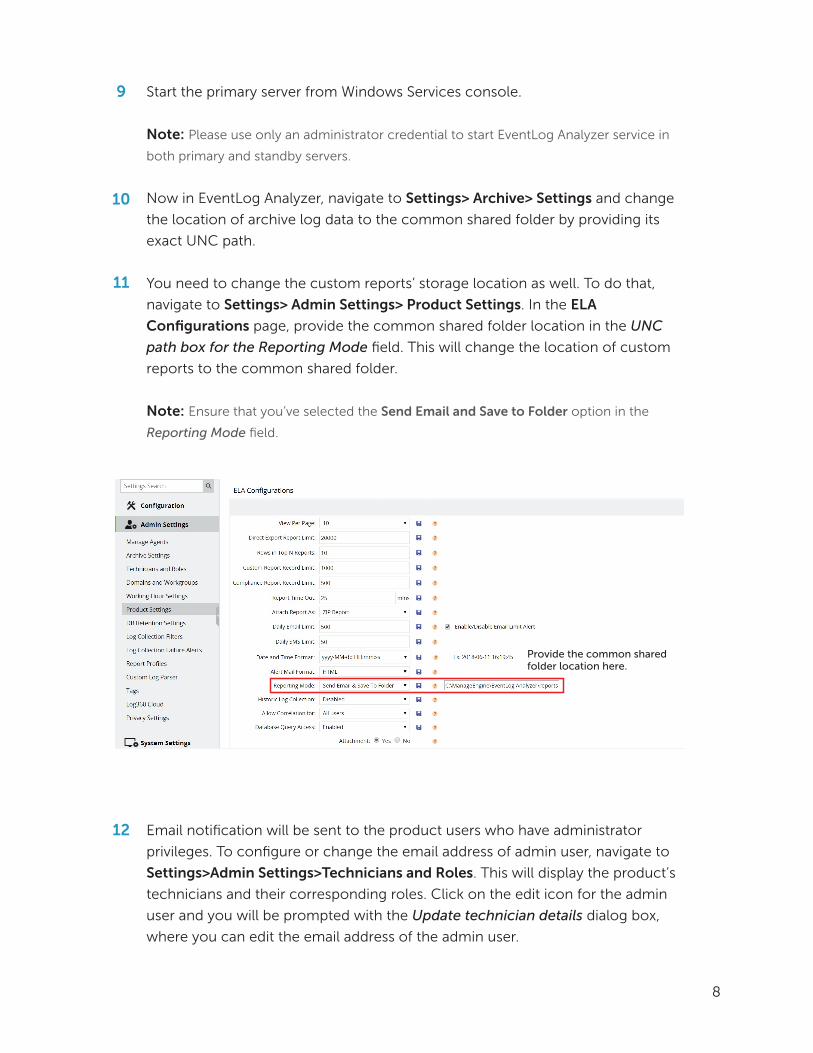
You need to change the custom reports’ storage location as well. To do that,
navigate to Settings> Admin Settings> Product Settings. In the ELA
Configurations page, provide the common shared folder location in the UNC
path box for the Reporting Mode field. This will change the location of custom
reports to the common shared folder.
Note: Ensure that you’ve selected the Send Email and Save to Folder option in the
Reporting Mode field.
9
10
11
Email notification will be sent to the product users who have administrator
privileges. To configure or change the email address of admin user, navigate to
Settings>Admin Settings>Technicians and Roles. This will display the product’s
technicians and their corresponding roles. Click on the edit icon for the admin
user and you will be prompted with the Update technician details dialog box,
where you can edit the email address of the admin user.
12
8
Provide the common shared folder location here.
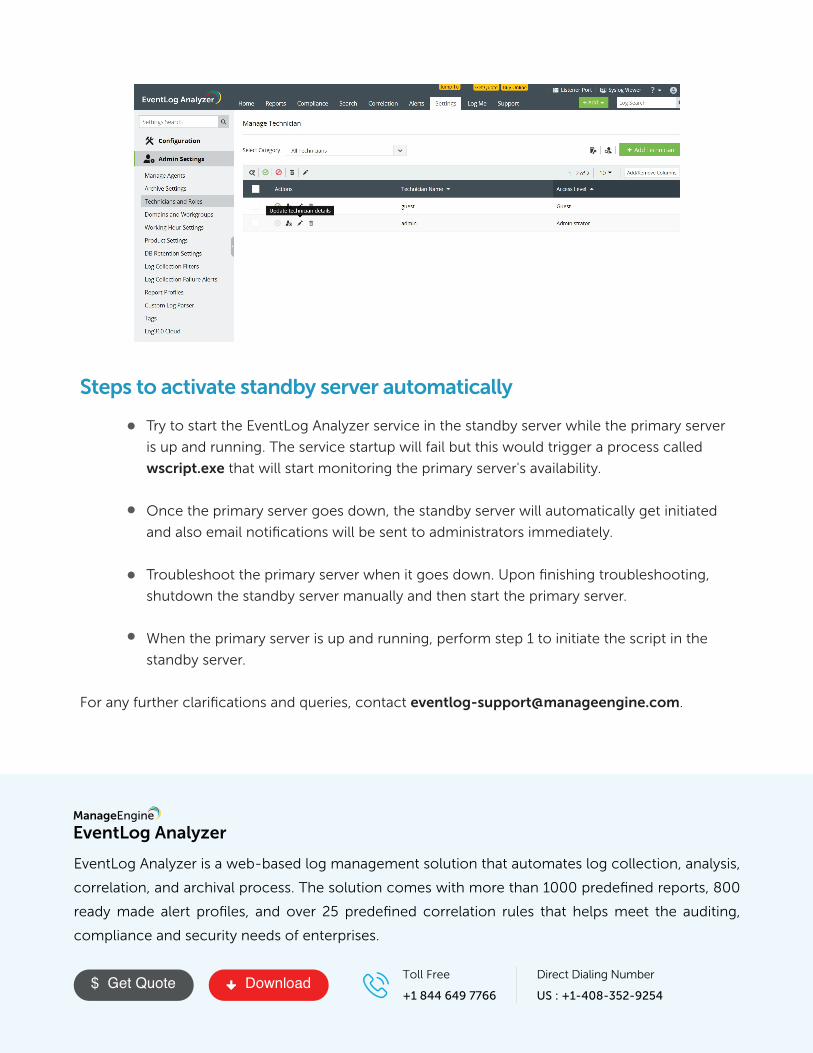
Try to start the EventLog Analyzer service in the standby server while the primary server
is up and running. The service startup will fail but this would trigger a process called
wscript.exe that will start monitoring the primary server's availability.
Once the primary server goes down, the standby server will automatically get initiated
and also email notifications will be sent to administrators immediately.
Troubleshoot the primary server when it goes down. Upon finishing troubleshooting,
shutdown the standby server manually and then start the primary server.
When the primary server is up and running, perform step 1 to initiate the script in the
standby server.
For any further clarifications and queries, contact [email protected].
Steps to activate standby server automatically
Download$ Get Quote
EventLog Analyzer is a web-based log management solution that automates log collection, analysis,
correlation, and archival process. The solution comes with more than 1000 predefined reports, 800
ready made alert profiles, and over 25 predefined correlation rules that helps meet the auditing,
compliance and security needs of enterprises.
Toll Free
+1 844 649 7766
Direct Dialing Number
US : +1-408-352-9254


![11-High Availability Configuration Guide-VRRP Configuration[1]](https://static.fdocuments.us/doc/165x107/577ce4921a28abf1038e9dd7/11-high-availability-configuration-guide-vrrp-configuration1.jpg)