DIRECTED NUMBER - reSolve reSolve... · DIRECTED NUMBER Lesson 3: Chill Out ... for students to...
16
We value your feedback after this lesson via http://tiny.cc/lesson-feedback DIRECTED NUMBER Lesson 3: Chill Out Australian Curriculum: Mathematics – Year 6 ACMNA124: Investigate everyday situations that use integers. Locate and represent these numbers on a number line. ACMNA128: Add and subtract decimals, with and without digital technologies, and use estimates and rounding to check reasonableness. Lesson abstract Students will locate decimal numbers on a horizontal number line that extends below zero. They will complete a data table of positive and negative temperatures and temperature ranges for different cities around the world. They will represent temperature ranges on a horizontal bar graph to show the distance between positive and negative numbers. There are also options for students to work with heights above and below sea level, and credit and debit. Mathematical purpose (for students) To work with negative numbers in real situations. Mathematical purpose (for teachers) This lesson extends the students’ understanding of negative numbers. Students are required to apply knowledge of negative numbers to everyday situations, in this case looking at temperatures around the world. Temperatures are often expressed as decimals. Students explore the arrangement of decimals and negative numbers on the number line. They develop a meaningful strategy to calculate the difference between positive and negative numbers, some of which are whole numbers and some of which are decimals. At the end of this lesson, students will be able to: • Use a horizontal number line. • Identify the positions of positive and negative decimals on a number line. • Use a number line to find differences between numbers, including decimals. Lesson Length 90 minutes approximately Vocabulary Encountered • temperature range • maximum temperature • minimum temperature Lesson Materials • Student Sheet 1 - World Map (1 per student) • Student Sheet 2 - Weather Data Table (1 per student) • Student Sheet 3 - Temperature for 5 Cities (1 per student) • Teacher Sheet 1 - Unlabelled Number Line • Student Sheet 4 - Mathematicians’ Seamounts (2 pages - optional) • Student Sheet 5 - Decimal Number Grid (3 pages - optional) • Student Sheet 6 - Maeve’s Money (1 page - optional)
-
Upload
truongthuy -
Category
Documents
-
view
221 -
download
3
Transcript of DIRECTED NUMBER - reSolve reSolve... · DIRECTED NUMBER Lesson 3: Chill Out ... for students to...
We value your feedback after this lesson via http://tiny.cc/lesson-feedback
DIRECTED NUMBER Lesson 3: Chill Out Australian Curriculum: Mathematics – Year 6 ACMNA124: Investigate everyday situations that use integers. Locate and represent these numbers on a number line. ACMNA128: Add and subtract decimals, with and without digital technologies, and use estimates and rounding to check reasonableness.
Lesson abstract Students will locate decimal numbers on a horizontal number line that extends below zero. They will complete a data table of positive and negative temperatures and temperature ranges for different cities around the world. They will represent temperature ranges on a horizontal bar graph to show the distance between positive and negative numbers. There are also options for students to work with heights above and below sea level, and credit and debit.
Mathematical purpose (for students) To work with negative numbers in real situations.
Mathematical purpose (for teachers) This lesson extends the students’ understanding of negative numbers. Students are required to apply knowledge of negative numbers to everyday situations, in this case looking at temperatures around the world. Temperatures are often expressed as decimals. Students explore the arrangement of decimals and negative numbers on the number line. They develop a meaningful strategy to calculate the difference between positive and negative numbers, some of which are whole numbers and some of which are decimals.
At the end of this lesson, students will be able to:
• Use a horizontal number line. • Identify the positions of positive and negative decimals on a number line. • Use a number line to find differences between numbers, including decimals.
Lesson Length 90 minutes approximately
Vocabulary Encountered • temperature range • maximum temperature • minimum temperature
Lesson Materials • Student Sheet 1 - World Map (1 per student) • Student Sheet 2 - Weather Data Table (1 per student) • Student Sheet 3 - Temperature for 5 Cities (1 per student) • Teacher Sheet 1 - Unlabelled Number Line • Student Sheet 4 - Mathematicians’ Seamounts (2 pages - optional) • Student Sheet 5 - Decimal Number Grid (3 pages - optional) • Student Sheet 6 - Maeve’s Money (1 page - optional)
2
Describing Temperatures Using Negatives
Introduction to negative temperatures • Initiate the conversation about negative numbers in the context of weather and temperature. • Discuss students’ experiences with cold temperatures at different times and in different places. • Focus on the use of negative numbers to describe really cold temperatures.
Enabling Prompt
• What are some of the coldest places in the world?
Expected Student Response
• The South Pole; the North Pole; Alaska; Siberia etc.
Teacher Notes
• When students make comments such as, “It was -5 degrees.” extend the conversation by using the expression “5 degrees below zero.” as a way of developing the context of the number line and the importance of zero. Remind students that 0oC has been chosen as the temperature at which water freezes. Water will normally be a liquid or gas when the temperature is higher than 0oC (above ‘freezing’) and it will be ice below 0oC.
• Some children may want to talk about “absolute zero” – this is the point at which atoms stop vibrating. Absolute zero is accepted as −273.15° on the Celsius scale. Scientists have got close to but have never achieved this temperature.
• Another point to note is that “hot” and “cold” are words on the same scale and as such are relative terms. A hot day in Reykjavik may be the same as a cool day in Sydney.
• This is a good opportunity to address a common misconception. Some students think that a number like -3 is actually less than a number like -10 because 3 is less than 10. Being "more cold" means having a lower temperature. So 10 degrees below zero (-10) is colder than 3 degrees below zero (-3).-10 is less than -3.
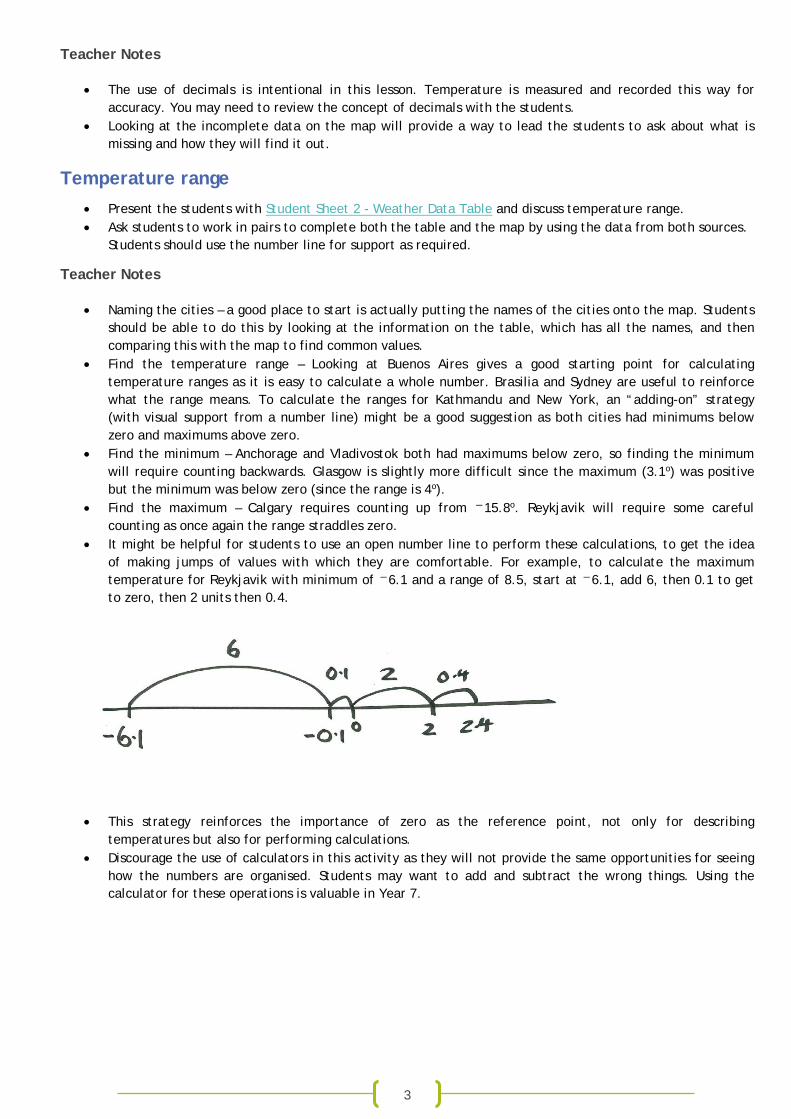
Temperatures around the World
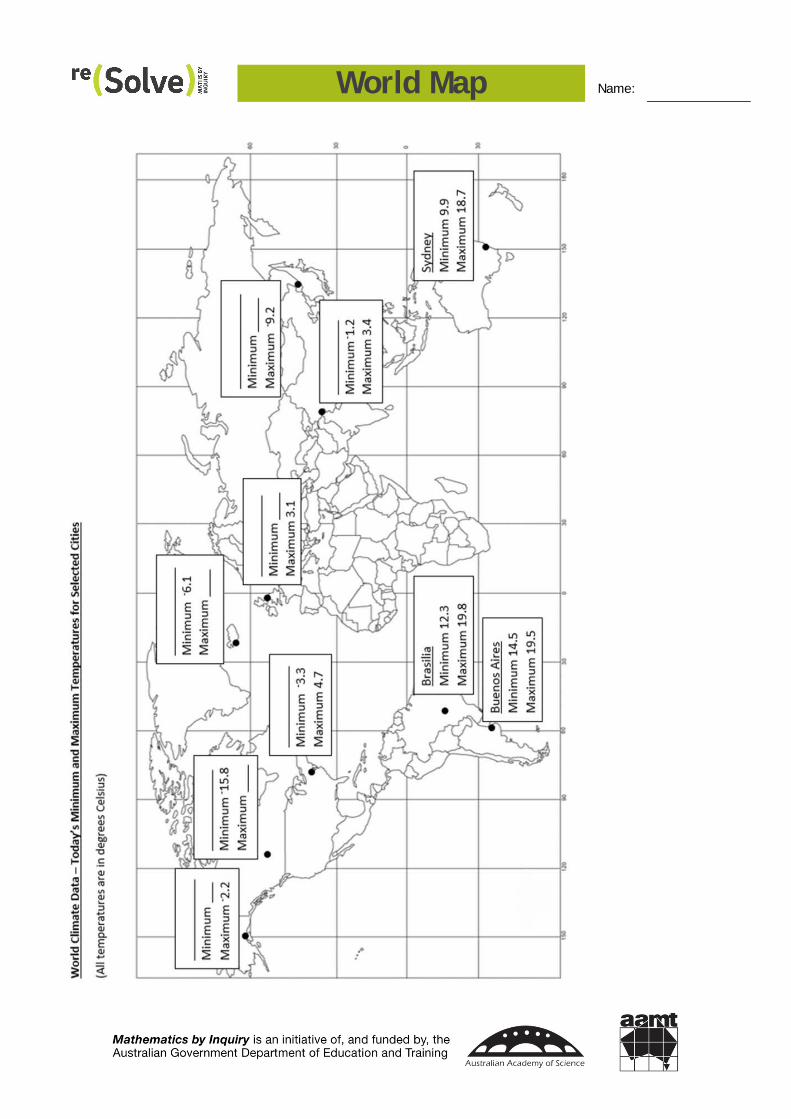
Exploring real data • Show the students Student Sheet 1 - World Map. • Discuss the ideas of maximum temperature and minimum temperature. • Discuss the data presented on the map.
Expected Student Response
• There are 10 cities. • Only three of the cities are named. • Three cities are missing their minimum temperature and three are missing their maximum temperature. • Some of the temperatures go below zero. • Some of the maximum temperatures are below zero so the minimum must be even lower. • All the temperatures use decimals.
3
Teacher Notes
• The use of decimals is intentional in this lesson. Temperature is measured and recorded this way for accuracy. You may need to review the concept of decimals with the students.
• Looking at the incomplete data on the map will provide a way to lead the students to ask about what is missing and how they will find it out.
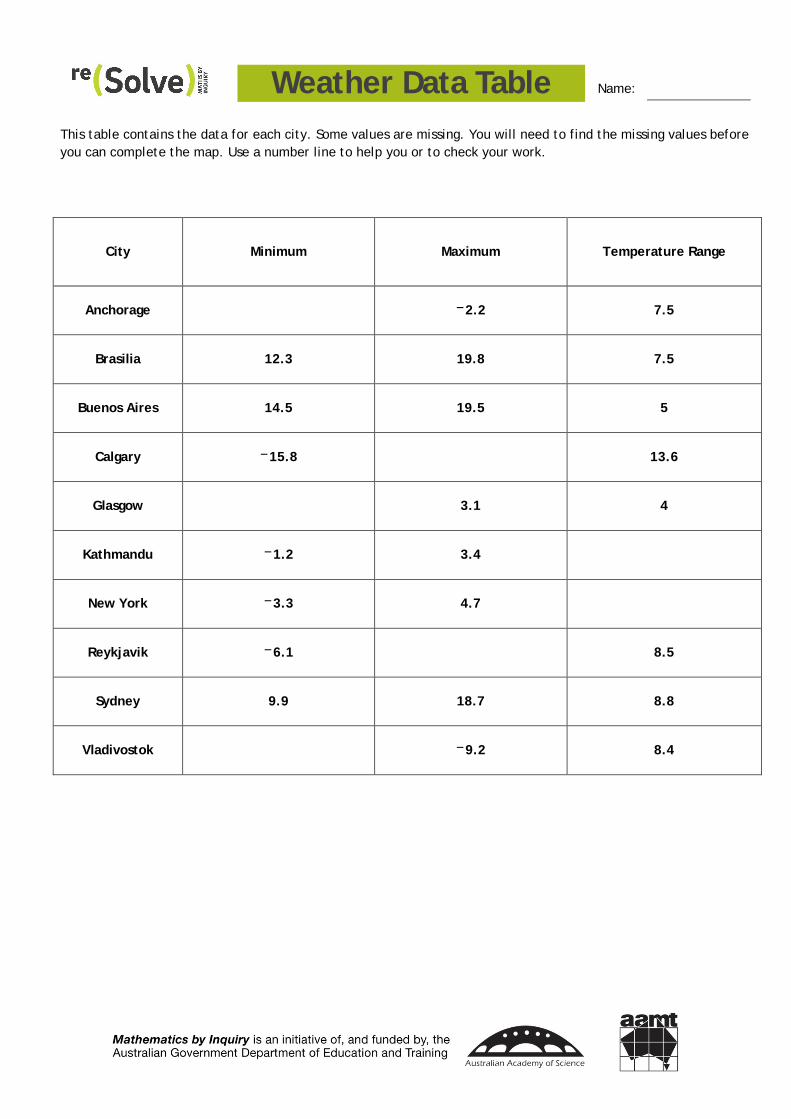
Temperature range • Present the students with Student Sheet 2 - Weather Data Table and discuss temperature range. • Ask students to work in pairs to complete both the table and the map by using the data from both sources.
Students should use the number line for support as required.
Teacher Notes
• Naming the cities – a good place to start is actually putting the names of the cities onto the map. Students should be able to do this by looking at the information on the table, which has all the names, and then comparing this with the map to find common values.
• Find the temperature range – Looking at Buenos Aires gives a good starting point for calculating temperature ranges as it is easy to calculate a whole number. Brasilia and Sydney are useful to reinforce what the range means. To calculate the ranges for Kathmandu and New York, an “adding-on” strategy (with visual support from a number line) might be a good suggestion as both cities had minimums below zero and maximums above zero.
• Find the minimum – Anchorage and Vladivostok both had maximums below zero, so finding the minimum will require counting backwards. Glasgow is slightly more difficult since the maximum (3.1o) was positive but the minimum was below zero (since the range is 4o).
• Find the maximum – Calgary requires counting up from -15.8o. Reykjavik will require some careful counting as once again the range straddles zero.
• It might be helpful for students to use an open number line to perform these calculations, to get the idea of making jumps of values with which they are comfortable. For example, to calculate the maximum temperature for Reykjavik with minimum of -6.1 and a range of 8.5, start at -6.1, add 6, then 0.1 to get to zero, then 2 units then 0.4.
• This strategy reinforces the importance of zero as the reference point, not only for describing temperatures but also for performing calculations.
• Discourage the use of calculators in this activity as they will not provide the same opportunities for seeing how the numbers are organised. Students may want to add and subtract the wrong things. Using the calculator for these operations is valuable in Year 7.
4
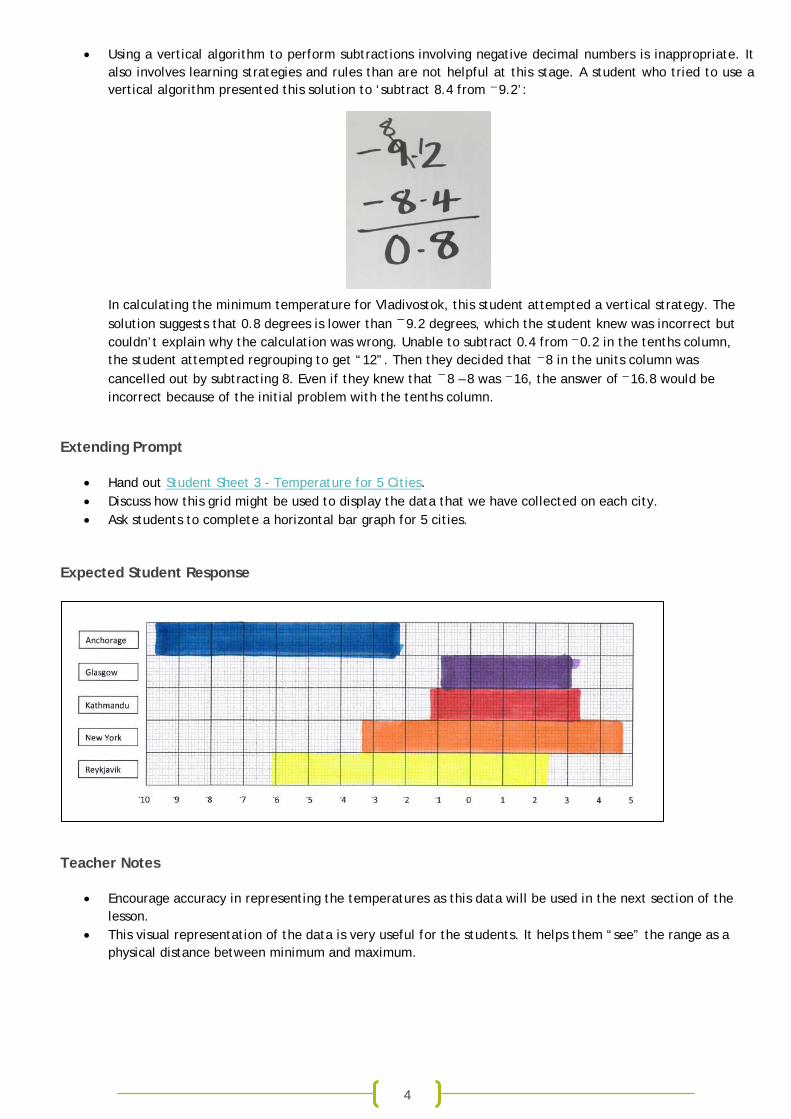
• Using a vertical algorithm to perform subtractions involving negative decimal numbers is inappropriate. It also involves learning strategies and rules than are not helpful at this stage. A student who tried to use a vertical algorithm presented this solution to ‘subtract 8.4 from -9.2’:
In calculating the minimum temperature for Vladivostok, this student attempted a vertical strategy. The solution suggests that 0.8 degrees is lower than -9.2 degrees, which the student knew was incorrect but couldn’t explain why the calculation was wrong. Unable to subtract 0.4 from -0.2 in the tenths column, the student attempted regrouping to get “12”. Then they decided that -8 in the units column was cancelled out by subtracting 8. Even if they knew that -8 – 8 was -16, the answer of -16.8 would be incorrect because of the initial problem with the tenths column.
Extending Prompt
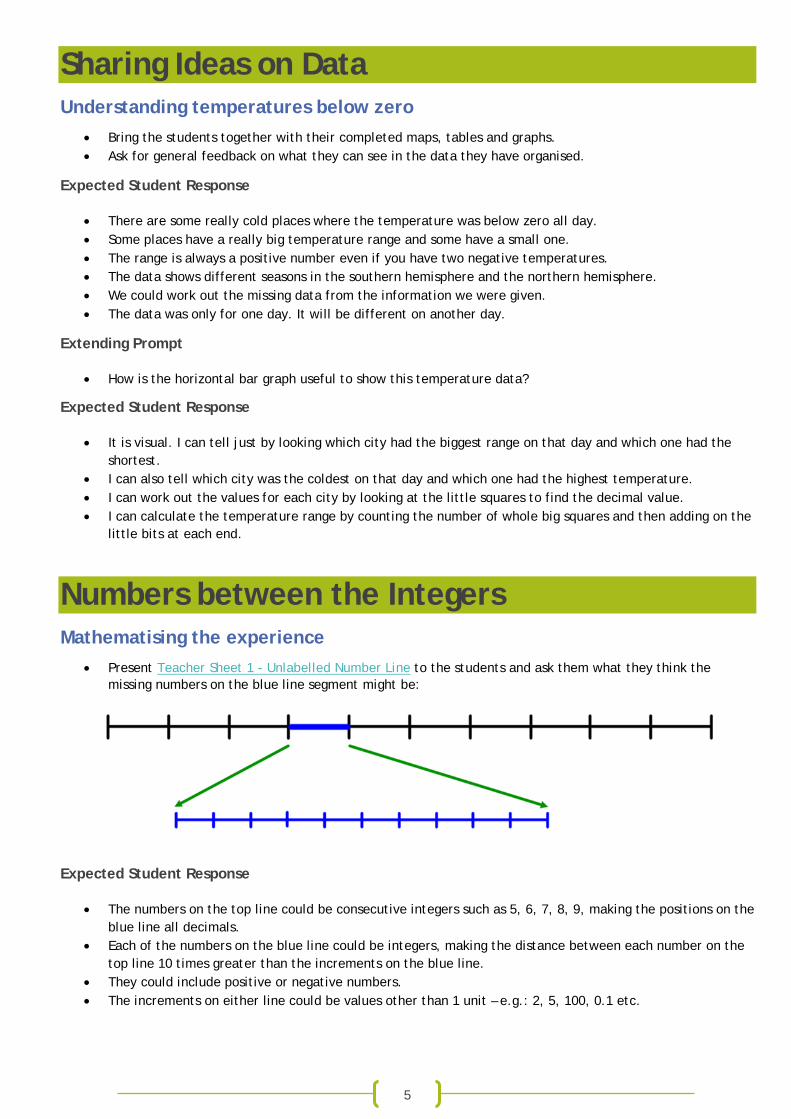
• Hand out Student Sheet 3 - Temperature for 5 Cities. • Discuss how this grid might be used to display the data that we have collected on each city. • Ask students to complete a horizontal bar graph for 5 cities.
Expected Student Response
Teacher Notes
• Encourage accuracy in representing the temperatures as this data will be used in the next section of the lesson.
• This visual representation of the data is very useful for the students. It helps them “see” the range as a physical distance between minimum and maximum.
5
Sharing Ideas on Data Understanding temperatures below zero
• Bring the students together with their completed maps, tables and graphs. • Ask for general feedback on what they can see in the data they have organised.
Expected Student Response
• There are some really cold places where the temperature was below zero all day. • Some places have a really big temperature range and some have a small one. • The range is always a positive number even if you have two negative temperatures. • The data shows different seasons in the southern hemisphere and the northern hemisphere. • We could work out the missing data from the information we were given. • The data was only for one day. It will be different on another day.
Extending Prompt
• How is the horizontal bar graph useful to show this temperature data?
Expected Student Response
• It is visual. I can tell just by looking which city had the biggest range on that day and which one had the shortest.
• I can also tell which city was the coldest on that day and which one had the highest temperature. • I can work out the values for each city by looking at the little squares to find the decimal value. • I can calculate the temperature range by counting the number of whole big squares and then adding on the
little bits at each end.
Numbers between the Integers Mathematising the experience
• Present Teacher Sheet 1 - Unlabelled Number Line to the students and ask them what they think the missing numbers on the blue line segment might be:
Expected Student Response
• The numbers on the top line could be consecutive integers such as 5, 6, 7, 8, 9, making the positions on the blue line all decimals.
• Each of the numbers on the blue line could be integers, making the distance between each number on the top line 10 times greater than the increments on the blue line.
• They could include positive or negative numbers. • The increments on either line could be values other than 1 unit – e.g.: 2, 5, 100, 0.1 etc.
6
Extending Prompt
• In Teacher Sheet 1 - Unlabelled Number Line what are the important elements that need to be identified?
Expected Student Response
• increasing value left to right • equally spaced divisions • the word “decimals” means there are 10 of them
Optional Consolidation and Extension Ideas
There are four optional extension activities to support the Directed Number lesson sequence. Student sheets are included at the end of this document.
Mathematicians’ Seamounts
• An interesting look at underwater mountains where sea level is used as the “zero” point and students calculate heights and depths from this point. The question of the tallest mountain on earth is also raised. Is Mt Everest really the tallest mountain, or is Mauna Kea in Hawai’i taller if measured from its base, which is under water? This will require the students to do some additional research by themselves to collect data that will support their answer.
Decimal Number Grid Puzzle
• Print a copy of the grid for each student. Use different coloured cardboard sheets to help keep sets together. Laminate the grid then cut into puzzle pieces. Ask the students to re-assemble the grids. There are two different versions of the grid provided. The first allows students to cut their puzzle pieces into any size or shape they want. The second version is divided into pentominoes – shapes made up of five squares. This template means all students have the same shaped pieces for their puzzles and helps guide the conversation in a different direction.
Maeve’s Money
• The activity introduces the idea that owing money or debt can be represented as a negative value. From this activity, students may plan their own budgets.
• There will be various correct answers for Sunday 7th and Monday 8th, but not after this. • On Wednesday 10th, Maeve owes her mother $6.50. • On Saturday 6th, Maeve owed her Mum $5.00 more than on Wednesday 3rd.
Number Line Rope
• Get a piece of rope or string about 5 metres long. Have a student hold each end and give them each names – one a positive number (such as 3) and the other a negative number (such as -2). Now ask a student to stand exactly half way between the two ends and ask what their name would be (in this case 0.5). Now get four students to place themselves evenly along the rope. What would they be called? (-1, 0, 1, 2) Try this again with different end points for the rope and different numbers of students spaced evenly along the rope.
World Map Name:
Student Sheet 1 – World Map
Weather Data Table Name:
Student Sheet 2 – Weathe r Data Table
This table contains the data for each city. Some values are missing. You will need to find the missing values before you can complete the map. Use a number line to help you or to check your work.
City
Minimum Maximum Temperature Range
Anchorage -2.2 7.5
Brasilia 12.3 19.8 7.5
Buenos Aires 14.5 19.5 5
Calgary -15.8 13.6
Glasgow 3.1 4
Kathmandu -1.2 3.4
New York -3.3 4.7
Reykjavik -6.1 8.5
Sydney 9.9 18.7 8.8
Vladivostok -9.2 8.4
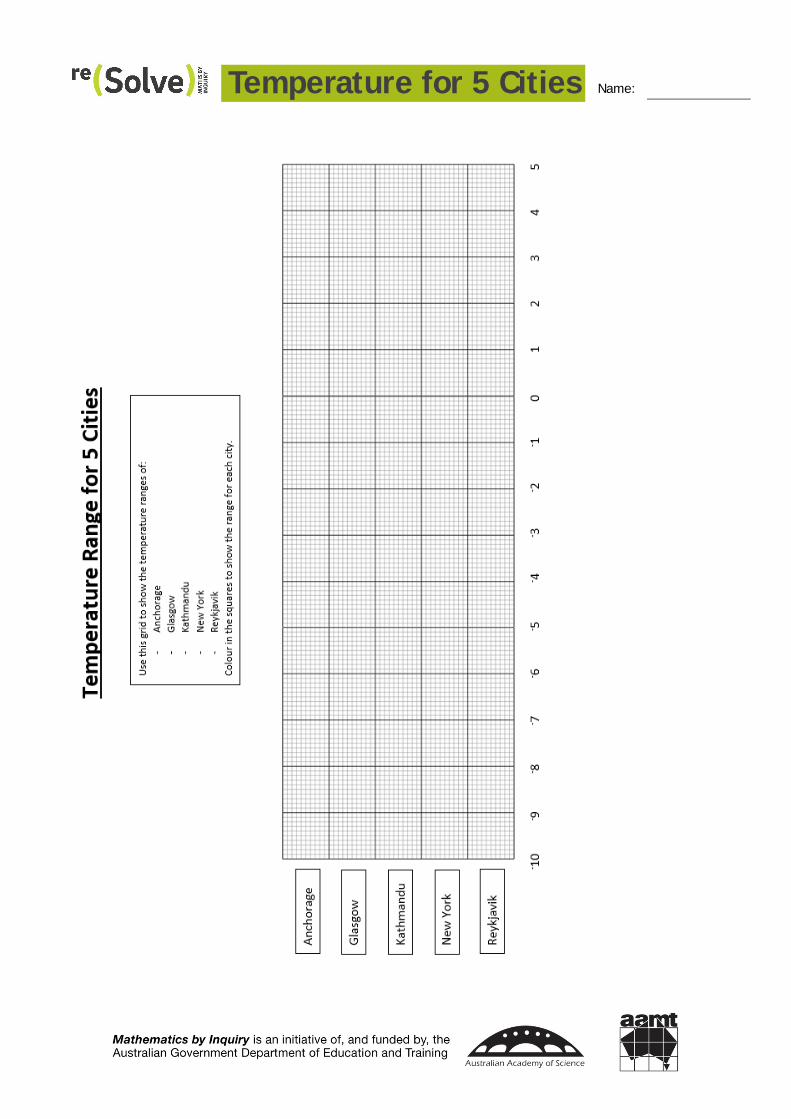
Temperature for 5 Cities Name:
Student Sheet 3 – Temperatu re fo r 5 Cities
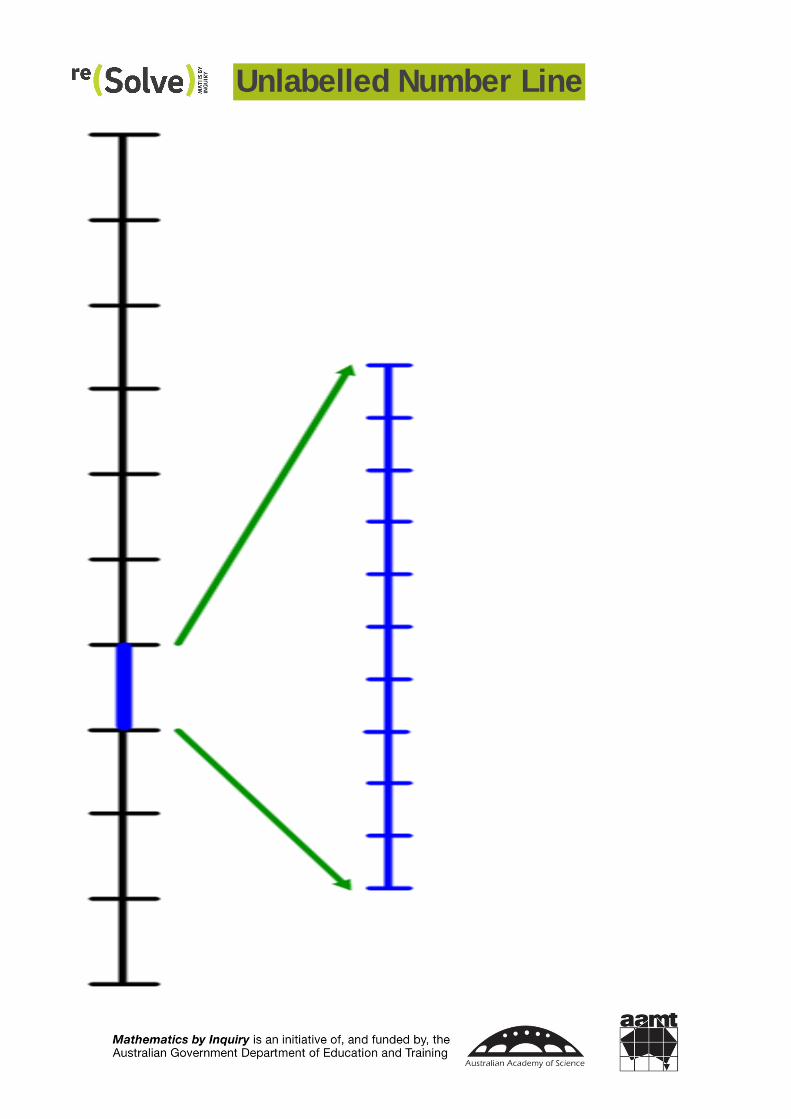
Unlabelled Number Line
Teacher Sheet 1 – Unlabe lled Number Line
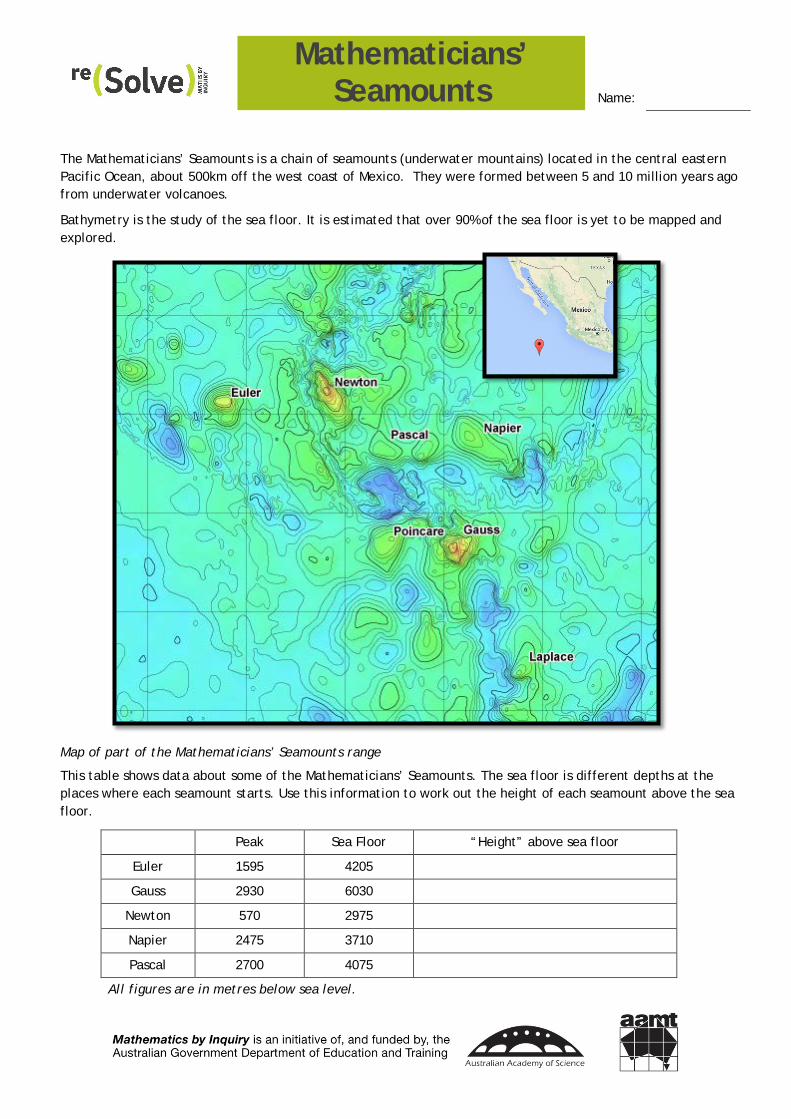
Mathematicians’ Seamounts Name:
Student Sheet 4 – Mathematicians’ Seamounts
The Mathematicians’ Seamounts is a chain of seamounts (underwater mountains) located in the central eastern Pacific Ocean, about 500km off the west coast of Mexico. They were formed between 5 and 10 million years ago from underwater volcanoes.
Bathymetry is the study of the sea floor. It is estimated that over 90% of the sea floor is yet to be mapped and explored.
Map of part of the Mathematicians’ Seamounts range
This table shows data about some of the Mathematicians’ Seamounts. The sea floor is different depths at the places where each seamount starts. Use this information to work out the height of each seamount above the sea floor.
Peak Sea Floor “Height” above sea floor
Euler 1595 4205
Gauss 2930 6030
Newton 570 2975
Napier 2475 3710
Pascal 2700 4075
All figures are in metres below sea level.
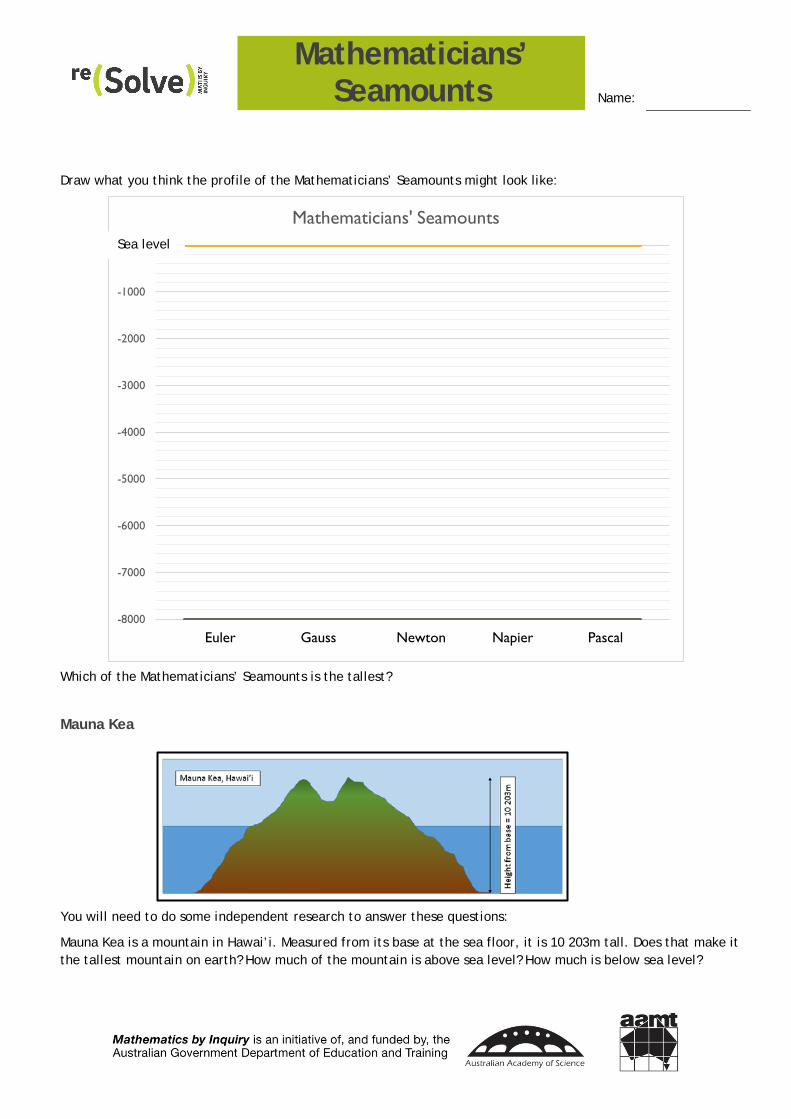
Mathematicians’ Seamounts Name:
Draw what you think the profile of the Mathematicians’ Seamounts might look like:
Which of the Mathematicians’ Seamounts is the tallest?
Mauna Kea
You will need to do some independent research to answer these questions:
Mauna Kea is a mountain in Hawai’i. Measured from its base at the sea floor, it is 10 203m tall. Does that make it the tallest mountain on earth? How much of the mountain is above sea level? How much is below sea level?
-8000
-7000
-6000
-5000
-4000
-3000
-2000
-1000
0
Mathematicians' Seamounts
Euler Gauss Newton Napier Pascal
Sea level
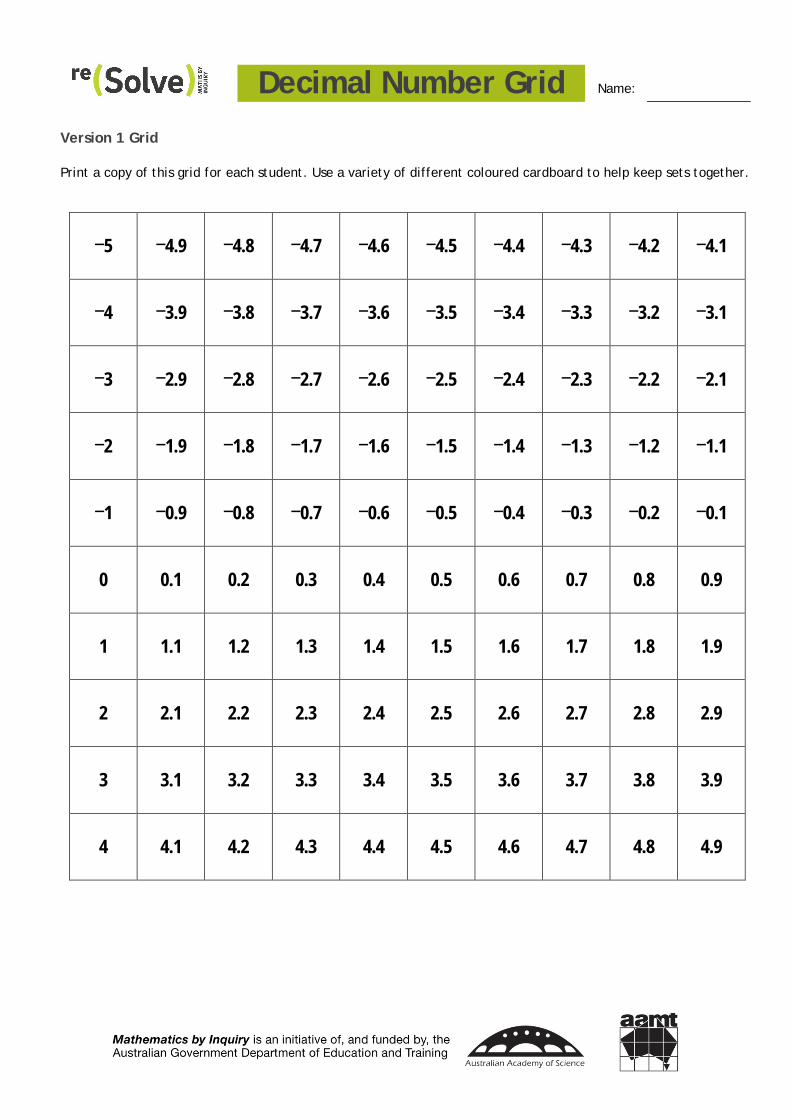
Decimal Number Grid Name:
Student Sheet 5 – Decimal Nu mber Grid
Version 1 Grid
Print a copy of this grid for each student. Use a variety of different coloured cardboard to help keep sets together.
-5 -4.9 -4.8 -4.7 -4.6 -4.5 -4.4 -4.3 -4.2 -4.1
-4 -3.9 -3.8 -3.7 -3.6 -3.5 -3.4 -3.3 -3.2 -3.1
-3 -2.9 -2.8 -2.7 -2.6 -2.5 -2.4 -2.3 -2.2 -2.1
-2 -1.9 -1.8 -1.7 -1.6 -1.5 -1.4 -1.3 -1.2 -1.1
-1 -0.9 -0.8 -0.7 -0.6 -0.5 -0.4 -0.3 -0.2 -0.1
0 0.1 0.2 0.3 0.4 0.5 0.6 0.7 0.8 0.9
1 1.1 1.2 1.3 1.4 1.5 1.6 1.7 1.8 1.9
2 2.1 2.2 2.3 2.4 2.5 2.6 2.7 2.8 2.9
3 3.1 3.2 3.3 3.4 3.5 3.6 3.7 3.8 3.9
4 4.1 4.2 4.3 4.4 4.5 4.6 4.7 4.8 4.9
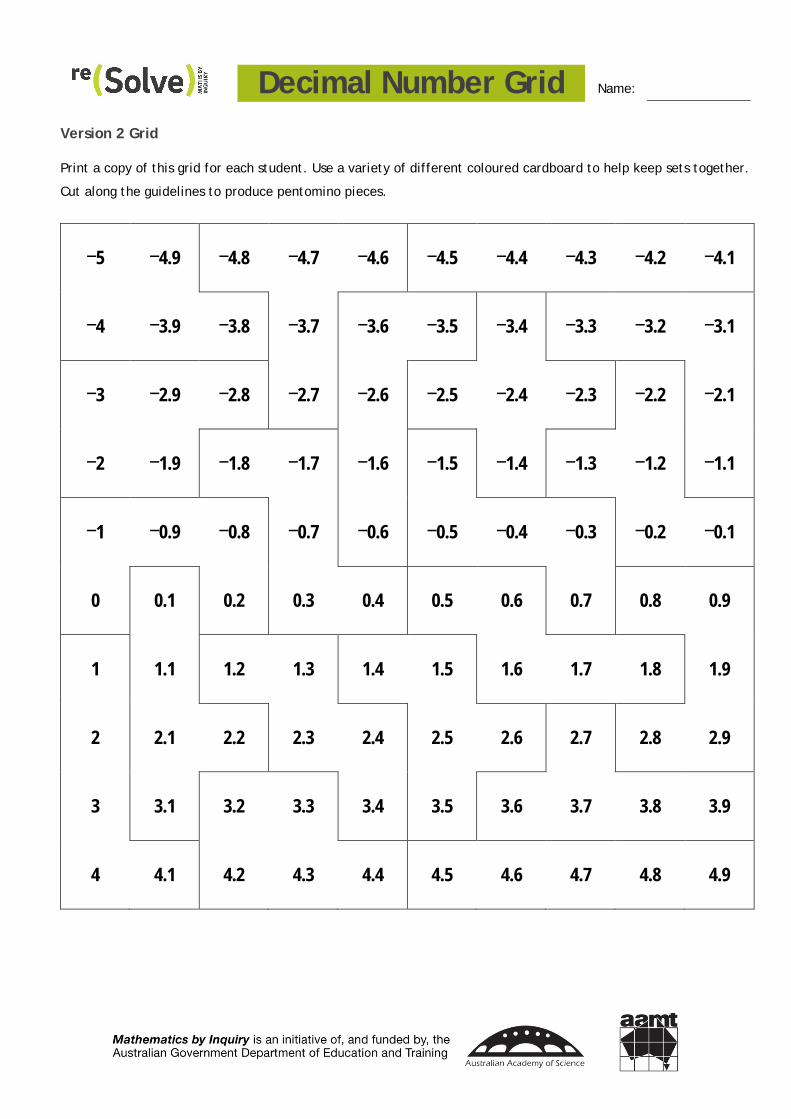
Decimal Number Grid Name:
Version 2 Grid
Print a copy of this grid for each student. Use a variety of different coloured cardboard to help keep sets together.
Cut along the guidelines to produce pentomino pieces.
-5 -4.9 -4.8 -4.7 -4.6 -4.5 -4.4 -4.3 -4.2 -4.1
-4 -3.9 -3.8 -3.7 -3.6 -3.5 -3.4 -3.3 -3.2 -3.1
-3 -2.9 -2.8 -2.7 -2.6 -2.5 -2.4 -2.3 -2.2 -2.1
-2 -1.9 -1.8 -1.7 -1.6 -1.5 -1.4 -1.3 -1.2 -1.1
-1 -0.9 -0.8 -0.7 -0.6 -0.5 -0.4 -0.3 -0.2 -0.1
0 0.1 0.2 0.3 0.4 0.5 0.6 0.7 0.8 0.9
1 1.1 1.2 1.3 1.4 1.5 1.6 1.7 1.8 1.9
2 2.1 2.2 2.3 2.4 2.5 2.6 2.7 2.8 2.9
3 3.1 3.2 3.3 3.4 3.5 3.6 3.7 3.8 3.9
4 4.1 4.2 4.3 4.4 4.5 4.6 4.7 4.8 4.9
Decimal Number Grid Name:
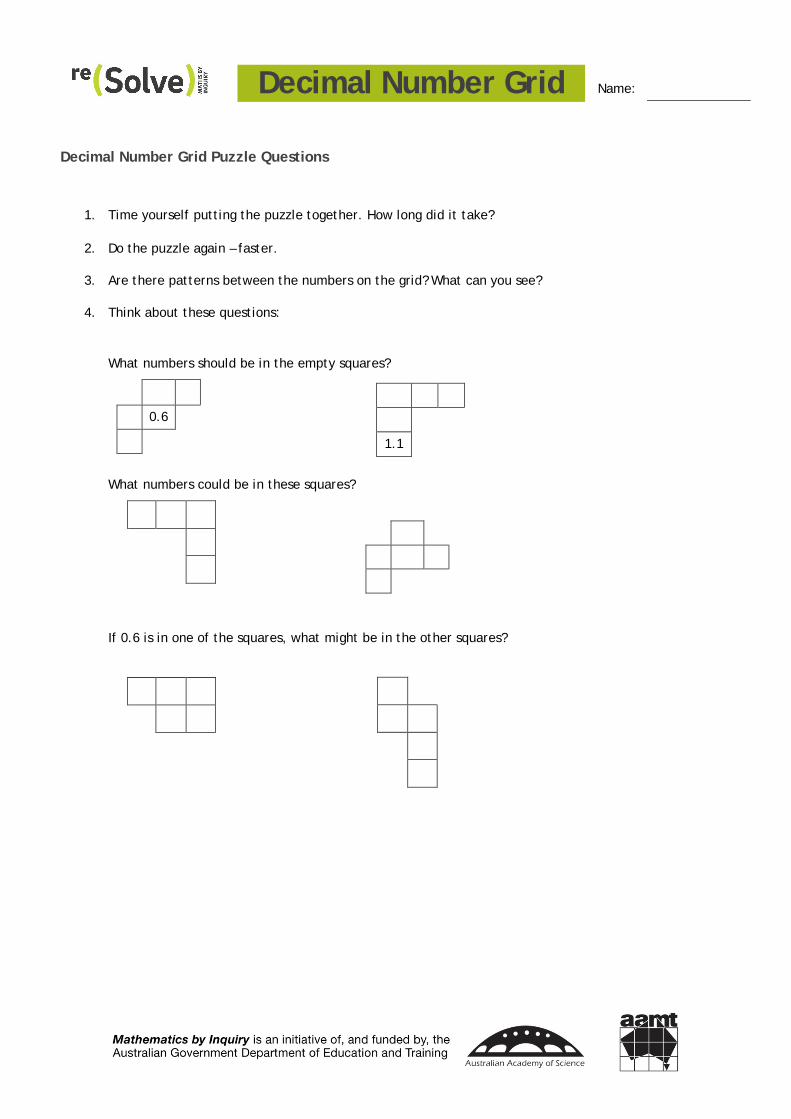
Decimal Number Grid Puzzle Questions
1. Time yourself putting the puzzle together. How long did it take?
2. Do the puzzle again – faster.
3. Are there patterns between the numbers on the grid? What can you see?
4. Think about these questions:
What numbers should be in the empty squares?
0.6
What numbers could be in these squares?
If 0.6 is in one of the squares, what might be in the other squares?
1.1
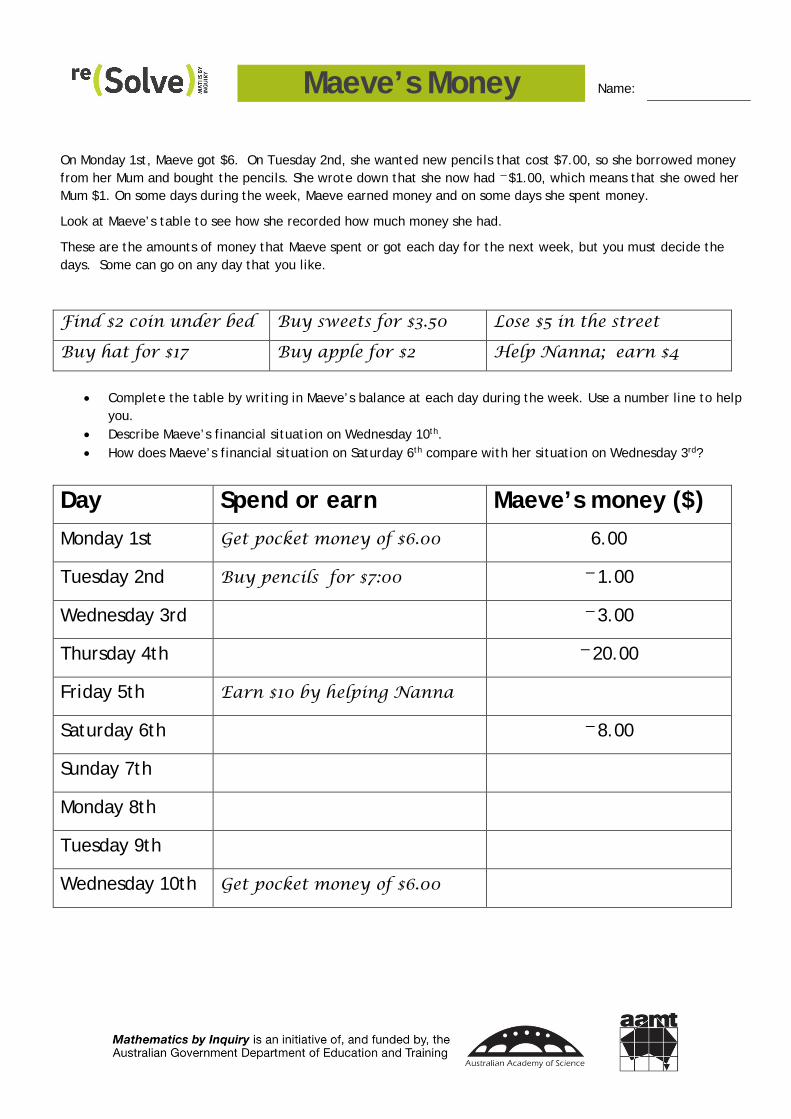
Maeve’s Money Name:
Student Sheet 6 – Maeve’s Money
On Monday 1st, Maeve got $6. On Tuesday 2nd, she wanted new pencils that cost $7.00, so she borrowed money from her Mum and bought the pencils. She wrote down that she now had -$1.00, which means that she owed her Mum $1. On some days during the week, Maeve earned money and on some days she spent money.
Look at Maeve’s table to see how she recorded how much money she had.
These are the amounts of money that Maeve spent or got each day for the next week, but you must decide the days. Some can go on any day that you like.
Find $2 coin under bed Buy sweets for $3.50 Lose $5 in the street
Buy hat for $17 Buy apple for $2 Help Nanna; earn $4
• Complete the table by writing in Maeve’s balance at each day during the week. Use a number line to help
you. • Describe Maeve’s financial situation on Wednesday 10th. • How does Maeve’s financial situation on Saturday 6th compare with her situation on Wednesday 3rd?
Day Spend or earn Maeve’s money ($) Monday 1st Get pocket money of $6.00 6.00
Tuesday 2nd Buy pencils for $7:00 -1.00
Wednesday 3rd -3.00
Thursday 4th -20.00
Friday 5th Earn $10 by helping Nanna
Saturday 6th -8.00
Sunday 7th
Monday 8th
Tuesday 9th
Wednesday 10th Get pocket money of $6.00