Direct comparison of disaccharide interaction with li- pid ...
19
1 Direct comparison of disaccharide interaction with li- pid membranes at reduced hydrations Ben Kent 1 , Thomas Hauß 1 , Bruno Demé 2 , Viviana Cristiglio 2 , Tamim Darwish 3 , Taavi Hunt 4 , Gary Bryant 4 and Christopher J. Garvey 3 * 1 Institute for Soft Matter and Functional Materials, Helmholtz-Zentrum Berlin, Hahn-Meitner-Platz 1, Berlin, Germany 2 Institute Laue Langevin, Grenoble, France 3 Bragg Institute, Australian Nuclear Science and Technology Organisation, Lucas Heights, Australia 4 Centre for Molecular and Nanoscale Physics, School of Applied Sciences, RMIT University, Mel- bourne, Australia Abstract: Understanding sugar-lipid interactions during desiccation and freezing is an important step in the elucidation of cryo- and anhydro- protection mechanisms. We determine sucrose, trehalose and water concentration distributions in intra-bilayer volumes between opposing dioleoylphosphatidylcholine bilayers over a range of reduced hydrations and sugar concentrations. Stacked lipid bilayers at reduced hydration provide a suitable system to mimic environmental dehydration effects, as well as a suitable system for direct probing of sugar locations by neutron membrane diffraction. Sugar distributions show that sucrose and trehalose both behave as typical uncharged solutes, largely excluded from the lipid bilayers regardless of sugar identity, and with no correlation between sugar distribution and the lipid headgroup position as the hydration is changed. These results are discussed in terms of current opinions about cryo- and anhydro- protection mechanisms.
Transcript of Direct comparison of disaccharide interaction with li- pid ...

1
Direct comparison of disaccharide interaction with li-
pid membranes at reduced hydrations
Ben Kent1, Thomas Hauß1, Bruno Demé2, Viviana Cristiglio2, Tamim Darwish3, Taavi Hunt4, Gary
Bryant4 and Christopher J. Garvey3*
1Institute for Soft Matter and Functional Materials, Helmholtz-Zentrum Berlin, Hahn-Meitner-Platz
1, Berlin, Germany
2Institute Laue Langevin, Grenoble, France
3Bragg Institute, Australian Nuclear Science and Technology Organisation, Lucas Heights, Australia
4Centre for Molecular and Nanoscale Physics, School of Applied Sciences, RMIT University, Mel-
bourne, Australia
Abstract:
Understanding sugar-lipid interactions during desiccation and freezing is an important step in the
elucidation of cryo- and anhydro- protection mechanisms. We determine sucrose, trehalose and water
concentration distributions in intra-bilayer volumes between opposing dioleoylphosphatidylcholine
bilayers over a range of reduced hydrations and sugar concentrations. Stacked lipid bilayers at reduced
hydration provide a suitable system to mimic environmental dehydration effects, as well as a suitable
system for direct probing of sugar locations by neutron membrane diffraction. Sugar distributions
show that sucrose and trehalose both behave as typical uncharged solutes, largely excluded from the
lipid bilayers regardless of sugar identity, and with no correlation between sugar distribution and the
lipid headgroup position as the hydration is changed. These results are discussed in terms of current
opinions about cryo- and anhydro- protection mechanisms.

2
Introduction
Sugars, particularly disaccharides, are widely recognized for their ability to protect cellular mem-
branes in environments with scarce liquid water. In the regimes of drying and freezing by slow cool-
ing, which are mechanistically equivalent1, sugars are observed to be associated with tolerance to dry
and cold environmental conditions2-7. Both of these environments involve an efflux of water from
cells. During desiccation, removal of water external to the cells leads to a concentration of solutes in
the extra-cellular solvent, and water effluxes from the cells until the osmotic gradient across the cell
membrane returns to zero. In the case of slow cooling – cooling slow to allow sufficient time for water
concentrations to respond to osmotic gradients – ice usually forms first in the extra-cellular solution,
concentrating the solutes in the remaining liquid water and creating an osmotic gradient across the cell
boundary in a similar way to desiccation. On the time scales of natural environmental changes, cryo-
and anhydro- protection can therefore be considered together.
During dehydration, lipid bilayer membranes are forced into close proximity with neighboring mem-
branes. It is generally assumed that a primary mechanism for maintaining membrane viability is the
avoidance of deleterious phase transitions in the membrane, as the normal transport properties of a
membrane are predominantly associated with the lamellar fluid phase8. Phase transitions which affect
the partitioning between the intra- and extra- cellular compartments (e.g. lamellar to hexagonal phase
transition9), or change the dynamic nature of the hydrophobic domain through more rigid lipid chain
packing (lamellar fluid to gel phase transition10) are found to be inhibited by sugar molecules in both
model systems and biological cells.11-12
Several molecular mechanisms have been proposed to explain the stabilization of the fluid lamellar
phase and the protective mechanism of sugars. The water replacement hypothesis4 suggests that a
specific interaction between sugar molecules and lipid headgroups is the primary mechanism of pro-
tection. The effects of a particular disaccharide consisting of two alpha linked glucose units, trehalose,
is suggested to have a superior efficacy as a protectant based on its ability to hydrogen bond with lipid
head groups and replace smaller and more dynamic water molecules. The evidence for this interaction

3
is based on both (indirect) experimental evidence13-18 and molecular dynamics simulations19. An al-
ternative mechanism for the effect has been suggested, ascribing a key role to non-specific volumetric
and osmotic effects of the sugars which mediate the compressive stresses induced in membranes
brought into close contact by dehydration3, 20-21. This explanation is supported by a model which quan-
titatively predicts the hydration dependence of the fluid-gel transition temperature22, as well as (indi-
rect) experimental evidence that sugars tend to be excluded from the regions close to the membranes23-
26. Andersen et. al.27 have attempted to reconcile the two views with a concentration dependent expla-
nation, where the water replacement mechanism is dominant at low sugar concentration, to be replaced
in importance by non-specific effects at higher sugar concentrations.
Note that the discussion above is relevant to moderate levels of dehydration/freezing where glass
formation does not occur. The formation of glassy sugar solutions28 is an additional but separate pro-
tective mechanism which occurs at lower hydrations and/or temperatures. The effects of sugars on the
structure of aqueous solutions, and in particular the glass transition, have been studied in detail29-33.
The related effects of glass formation on membranes is discussed in detail in references15, 34-36. The
remainder of this paper is concerned with conditions where glass formation does not occur.
Phenomenologically, these two sugar membrane protection theories differ in the predicted sugar
concentration profile between bilayers: in the case of the water replacement hypothesis the sugar con-
centration should be enhanced at the interface between the water and lipid bilayer; by contrast in the
case of the non-specific volumetric based hypothesis, sugar molecules are likely to be more concen-
trated in the solvent phase constrained by the barrier of the bilayer. Small angle neutron scattering has
shown that sugars partition unequally between lipid phases and coexisting excess solution phases,
giving a mesoscopic view of the sugar location within lipid bilayer systems23. Recently37 we have
demonstrated how the membrane neutron diffraction technique38-42 can be used to directly extract the
density profile of sugar molecules in the aqueous layer between opposing lipid bilayers. It was shown,
at a single sugar composition, that the density profile is a Gaussian centered in the water layer. This
approach41, where the components of a fluid bilayer are decomposed into quasi-molecular fragments,
and a Gaussian describes the probability of occupancy per unit length across the bilayer (Figure 1),
was extended to extract the profile of the sugar molecules.

4
Figure 1. Bilayer centered scattering density profile of dioleoylphosphatidylcholine (DOPC) equili-
brated at 57% RH (green line). A model fitted to this profile (black line) is the sum of the scattering
densities (grey lines for lipid components, blue line for water) of the individual components of the unit
cell: 1. terminal methyl group, 2. acyl group, 3. double bond, 4. acyl groups, 5. glycerol, 6. phospho-
rous, 7. choline, 8. water.
As lipid bilayer membranes are forced into close proximity due to dehydration, they form stacks of
bilayers periodically interspersed with aqueous solution. This formation – effectively 1-dimensional
crystallites – is an ideal system to study by diffraction. By reconstructing the scattering density pro-
files of the system, the average position and distribution of components within the bilayer unit cell can
be determined. Variation of the scattering contrast of the sugar – its neutron scattering length density
(SLD) – by selective deuteration of its non-exchangeable hydrogens allows the sugars to be labeled
and identified separately from the rest of the system. In this paper, we present the results of neutron
membrane diffraction experiments into the locations of trehalose and sucrose within a DOPC bilayer
system at reduced hydrations.
Materials and Methods
Stacked Bilayers
Samples consisted of stacked bilayers of the unsaturated phospholipid dioleoylphosphatidylcholine
(DOPC) on quartz slides. DOPC was used as purchased from Avanti Polar Lipids (Alabaster, Al).
Deposition onto the substrate was achieved by dissolving DOPC in a chloroform/methanol mixture
-20 -10 0 10 20Distance from bilayer centre (Å)
0.20
0.15
0.10
0.05
0.00
-0.05
Sca
tterin
g Le
ngth
12
3
4
56
7
8

5
and spraying the sample evenly over the entire surface of the slide (65 x 25 mm). Spraying was per-
formed with a low pressure regulated nitrogen supply and was performed over several minutes to
prevent build-up of excess solvent on the slide surface. Trehalose or sucrose were incorporated by
dissolving in methanol and adding this to the mixture prior to spraying. Any solvent remaining fol-
lowing deposition was removed by placing the samples in a vacuum for several hours. Sample quan-
tities were determined gravimetrically following removal of all solvent. Samples averaged approxi-
mately 7 mg, corresponding to about 1500 bilayers, assuming an even coverage across the slide.
Sample hydration was controlled by equilibrating the samples in chambers of known humidity (at a
selected level of deuteration using an appropriate mixture of H2O and D2O) for at least 8 hours. As
water is absorbed from the gas phase, the lipids self-assemble into stacked bilayers. The treha-
lose/DOPC samples were measured at 0.063, 0.15, 0.21 and 0.50 sugars per lipid, while sucrose/DOPC
samples were measured at 0.063, 0.21 and 0.50 sugars per lipid. For one value of relative humidity
(57% RH) we compare sucrose and trehalose at several sugar/lipid ratios. The effects of different
humidities, from 11% to 75% RH, was studied at a single trehalose/lipid ratio (0.5), and compared to
DOPC without sugar.
Note that we are interested here in the mechanisms by which sugars protect membranes during des-
iccation. The hydrations studied here (where samples are equilibrated to relative humidities between
75% and 11%) range from mild to severe dehydration. 75% relative humidity corresponds to an os-
motic pressure of -40 MPa43, and is equivalent to freeze dehydration at about -33 °C21. This is exactly
the range that is of interest in cryobiology and anhydrobiology. So although conducting similar studies
at higher hydrations may be of interest for other reasons, it is not very relevant to freezing or desicca-
tion, or the effect of sugars in this range. This technique was chosen precisely because it can give such
excellent results over the hydration ranges of interest.
Sugar Deuteration
Hydrogenated sugars, sucrose and trehalose (Figure 2), and the Raney nickel catalyst were pur-
chased from Sigma-Aldrich, Inc. (St. Louis, MO). Deuterated trehalose with two different non-ex-
changeable deuterium abundances (67.8 %D and 73.4 %D), as well as deuterated sucrose (60.0 %D)

6
were prepared by catalytic exchange reactions following a procedure of Koch and Stuart44-45 using a
deuterated Raney nickel catalyst in D2O. The percentage deuteration at each specific carbon site in
sucrose and trehalose molecules was calculated by 1H NMR by measuring the relative integrations of
the residual proton signals of the exchanged proton sites and those which remain un-exchanged (car-
bon-bound hydrogens vicinal to hydroxyl groups i.e., C1,1’ C5,5’ in trehalose and C5 C1’C5’ in su-
crose). Mass Spectroscopy was utilized to confirm the overall isotopic purity of the molecule. Figures
and spectra can be found in the supplementary material.
Figure 2. The two sugars considered in this study. Numbers indicate the sites of the unexchangeable
hydrogens, deuterated as described in the text.
Neutron Diffraction and Scattering density profile reconstruction
Neutron diffraction data consists of intensity peaks (pseudo Bragg) caused by the constructive in-
terference of scattered neutrons, superimposed upon a linear background signal. The angular, , posi-
tion of the peaks is described by the Bragg equation:
2݀ sinߠ = (1) ߣ݊
where d is the distance of the repeat spacing; n is an integral number, the order of the peak; and is
the wavelength of the neutrons.
Scattering density profiles of the samples were reconstructed using Fourier synthesis46. The integral
scattered intensities of the pseudo-Bragg peaks were determined by fitting Gaussian distributions of
intensity over a linear background determined from the scattered intensity either side of the reflection.

7
Structure factor magnitudes were calculated from these intensities after accounting for the Lorentz
correction and an absorption correction using a model of an infinite plane of finite thickness47, to
correct for the different path lengths of the scattered neutrons through the sample at different scattering
angles:
(2)
where f(h) is the structure factor magnitude of the hth order, I(h) is the scattered intensity, A(h) is
the absorption correction, and sin θ is the Lorentz correction.
Neutron membrane diffraction was performed on the V1 membrane diffractometer at the Helmholtz-
Zentrum Berlin (Germany) from samples of DOPC, trehalose/DOPC and sucrose/DOPC, and on the
D16 small momentum transfer diffractometer (Institut Laue-Langevin, Grenoble, France) from sam-
ples of DOPC and sucrose/DOPC. These instruments probe the appropriate angular range and hence
repeat spacings for lipid bilayers through a combination of high angular resolution and long wave-
length neutrons (cf Equation1).
On the V1 instrument the neutron wavelength was 4.56 Å. A 19 x 19 cm2 area detector was used
with a sample to detector distance of 1.0 m. Rocking curves of each of the first five pseudo-Bragg
peak orders were recorded by positioning the center of the detector on the peak and rotating the sample
relative to the incident neutron beam through a small angle around the maximum intensity for each
peak. Samples were mounted vertically and sealed in an aluminum canister sample environment with
the selected saturated salt solution at least 12 hours prior to measurement. The salt solutions and hu-
midities generated were 11% (lithium chloride); 33% (magnesium chloride); 57% (sodium bromide)
and 75% (sodium chloride)43. The temperature of the samples was fixed at 25 °C for all measurements.
On the D16 instrument the wavelength was 4.7 Å. To optimize the incident neutron flux, the beam
was vertically-focused to the sample, and to optimize sample illumination and angular resolution in
the horizontal direction two pairs of collimating slits were used. Diffraction patterns were collected
using the Millimeter Resolution Large Area Neutron Detector (MiLAND), a high pressure 3He neutron
detector with an area of 320 mm 320 mm and a “pixel” resolution of 1 mm 1 mm. The sample-to-
detector distance was 900 mm. Two overlapping detector positions were used, 13° and 30° to the
sinhAhIhf

8
incident beam, covering reflection orders 1-4 and 4-5 respectively. The incident angle of neutrons on
the sample was varied continuously by rotating the sample through the angular ranges 1-12° and 10-
18° respectively for each detector position. D16 measurements utilized a controlled humidity and tem-
perature environment the operation of which is detailed elsewhere48. On both instruments diffraction
orders higher than the fifth order were not detected above the background.
The SLD on a per lipid scale *(z) is calculated from the structure factors by Fourier summation:
(3)
where z is the distance from the center of the bilayer, *o is the product of the average SLD of the
unit cell and the area per lipid, d is the repeat spacing and k is an instrumental scaling constant.
Structure factor phases were determined by varying the SLD of the water layer between opposing
lipid bilayers42, achieved by varying the D2O:H2O in the sample chamber. Scattering density profiles
were scaled to number density per lipid. This is achieved by dividing the dimensionless absolute scat-
tering density per lipid42 by the difference in scattering lengths of one molecule of the labeled compo-
nent at the higher and lower deuteration amounts. Further details on the structure factor phasing and
scaling method can be found in the supplementary material.
Results and Discussion
Water distribution profiles and sugar distribution profiles were determined by subtraction of SLD
profiles from the profiles of their corresponding higher-deuterated equivalent sample. Truncation ar-
tifacts, consisting of ripples in the difference profiles, can be observed due to the truncation of the
Fourier series to the number of pseudo-Bragg peaks observed49. In all measurements, four or five
pseudo-Bragg peaks were observed, and errors due to truncation artifacts were minimal. Typical dif-
fraction curves are shown in Figure 3. To check whether truncation artifacts were masking real differ-
ences due to deuterated labeled components in the system, difference profiles at each of the three
D2O:H2O ratios were compared. In each case the difference profiles were consistent while the back-
ground truncation artifacts varied. Sugar distribution profiles using the lower D2O:H2O ratios (0% or
8% D2O) were used in the final analysis to maximize the difference in the SLD between the hydro-
genated and deuterated sugars and the water layer.
n
h dhzhf
dkz
1
*0
* 2cos2

9
Figure 3. Diffraction data for 0.5 trehalose/DOPC equilibrated at 57% RH with three water contrasts
(translated vertically for clarity). The area under the peak [I(h)] goes through a minimum when the
form factor [f(h)] changes phase. This can be seen in the second peak, which changes phase between
8% D2O and 50% D2O (See Supplementary Information Figure S1).
To better focus on the water layer the remaining SLD profiles are shown centered on the middle of
the water layer (rather than centered on the middle of the bilayer, as in Figure 1). Figure 4 shows an
example scattering density plot of trehalose/DOPC at three measured D2O:H2O ratios, with their cor-
responding difference profiles showing the scattering density differences in the water layer due to the
differences of the relative amounts of deuterium and hydrogen in the water layer. In regions in the
system where there is no water, i.e. within the DOPC bilayer, the scattering density profiles of the
system are identical and the difference profiles are zero within errors. The integrated area of each
water layer difference profile yields a total SLD difference equal to the SLD difference between the
H2O and D2O of the two systems producing the difference profile. As the y-axis scattering density is
scaled on a per-lipid basis, dividing the SLD total difference by the SLD difference of two water
molecules of the same D2O and H2O ratios, the number of water molecules per lipid can be determined.
Comparisons of this number from multiple difference profiles for each system provides an additional
check of the scattering density scaling factors.
1
10
100
1000
Inte
nsity
(a.u
.)0.70.60.50.40.30.20.1
q (Å-1)
8% D2O
20% D2O
50% D2O
10
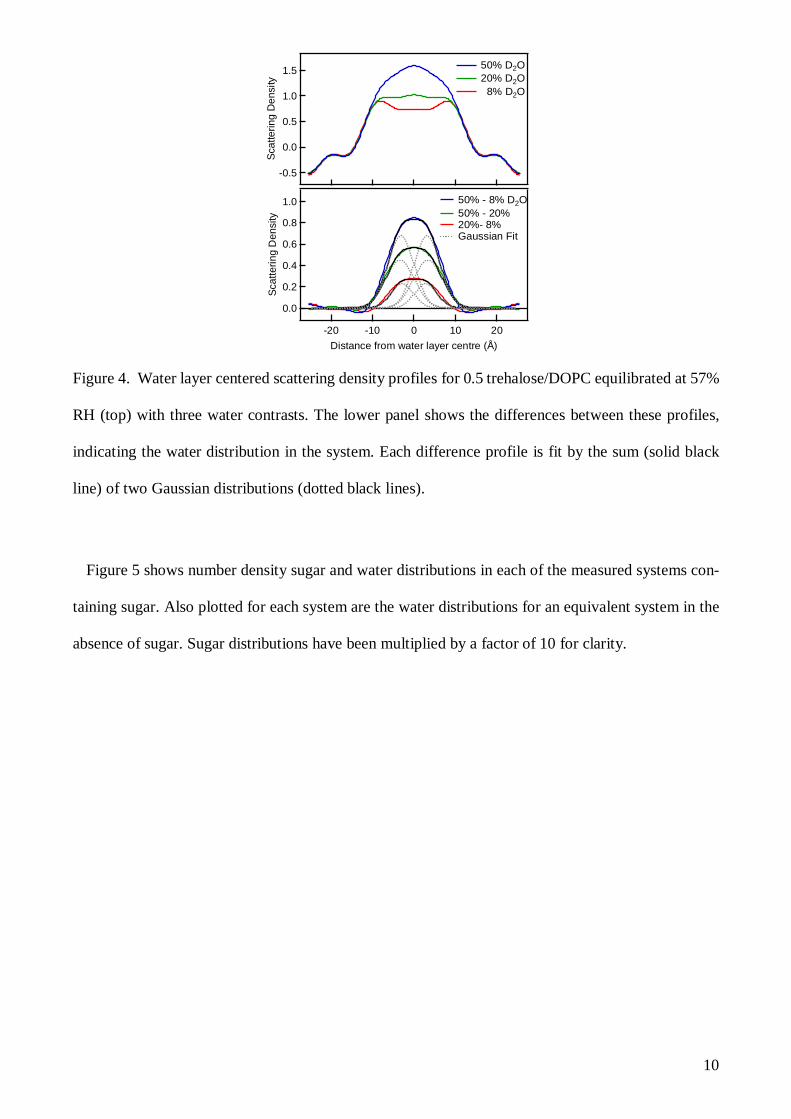
Figure 4. Water layer centered scattering density profiles for 0.5 trehalose/DOPC equilibrated at 57%
RH (top) with three water contrasts. The lower panel shows the differences between these profiles,
indicating the water distribution in the system. Each difference profile is fit by the sum (solid black
line) of two Gaussian distributions (dotted black lines).
Figure 5 shows number density sugar and water distributions in each of the measured systems con-
taining sugar. Also plotted for each system are the water distributions for an equivalent system in the
absence of sugar. Sugar distributions have been multiplied by a factor of 10 for clarity.
1.5
1.0
0.5
0.0
-0.5
Scat
terin
g D
ensi
ty
1.0
0.8
0.6
0.4
0.2
0.0
Scat
terin
g D
ensi
ty
-20 -10 0 10 20Distance from water layer centre (Å)
50% - 8% D2O 50% - 20% 20%- 8% Gaussian Fit
50% D2O 20% D2O 8% D2O

11
Figure 5. Sugar and water number densities per lipid as a function of the distance from the water layer
centre in bilayer DOPC systems. Sugar distributions have been multiplied by a factor of 10 for clarity.
Left and middle columns: sucrose and trehalose in DOPC at various sugar/lipid (S/L) ratios at 57%
RH. Right column: trehalose at 0.5 sugars/lipid for various relative humidities.
For all systems, the water distributions are best fit by the envelope of two Gaussian profiles (cf
DOPC bilayers Figure 4 bottom). The double Gaussian form has been observed previously in a full
deconvolution of the scattering length density profile of DOPC41 and may be due to the slight densi-
fication of water hydrating the lipid headgroups50. By contrast to the two Gaussian distributions re-
quired to fit the water distribution, the distribution profiles of both sugars for all systems are best fit
by a single Gaussian centered in the middle of the water layer.
The results show the qualitative differences between the sugar and water locations. At a constant
57% relative humidity (Figure 5 left and middle columns) the sugar distributions increase in area and
amplitude as the sugar/DOPC ratio increases, reflecting the greater contrast between the hydrogenated
1.2
0.8
0.4
0.0
-20 -10 0 10 20
Water (no sugar) Trehalose (x 10) Water 0.063 S/L
1.2
0.8
0.4
0.0
-30 -20 -10 0 10 20 30
0.15 S/L
1.2
0.8
0.4
0.0
-20 -10 0 10 20
0.21 S/L
1.2
0.8
0.4
0.0
-20 -10 0 10 20
0.5 S/L
1.2
0.8
0.4
0.0
n·S
(104 Å
-1)
-20 -10 0 10 20
0.063 S/L Water (no sugar) Sucrose (x 10) Water
1.2
0.8
0.4
0.0
n·S
(104 Å
-1)
-20 -10 0 10 20
0.21 S/L
1.2
0.8
0.4
0.0
n·S
(104 Å
-1)
-20 -10 0 10 20
0.5 S/L
1.2
0.8
0.4
0.0
n·S
(104 Å
-1)
-20 -10 0 10 20
11% RH Water (no sugar) Trehalose (x 10) Water
1.2
0.8
0.4
0.0
n·S
(104 Å
-1)
-20 -10 0 10 20
33% RH
1.2
0.8
0.4
0.0
n·S
(104 Å
-1)
-20 -10 0 10 20
57% RH
1.2
0.8
0.4
0.0
n·S
(104 Å
-1)
-20 -10 0 10 20
75% RH
Sucrose, 57% RH Trehalose, 57% RH 0.5 Trehalose/DOPCDistance from water layer centre (Å) Distance from water layer centre (Å) Distance from water layer centre (Å)
Not Measured

12
and deuterated sugars at higher sugar concentrations. It is clear from the shape and location of the
distributions there is a propensity for the sugars to accumulate in the middle of the water layer. The
sucrose distributions are comparatively broader when compared to the equivalent trehalose distribu-
tions, suggesting sucrose penetrates slightly further into the bilayer headgroup region than trehalose.
While the trehalose distributions have the same form as sucrose, they follow a sharper Gaussian profile
and show that trehalose is excluded from or has negligible concentration in the outer regions of the
water distributions. This indicates that trehalose is not present in the water that penetrates furthest into
the headgroup region of the lipid bilayer. It is also important to note that there is no explicit chemical
detail in the quasi-molecular fragment model and it does not provide information on any preferred
molecular orientation,
The highest sugar/lipid ratio of 0.5 sugars/lipid produces the largest and broadest sugar distributions.
An increase to this sugar/lipid ratio coincides with a broadening in the water distribution, which is
evident when comparing with the water distribution for the equivalent sugar-free system. While this
change increases the repeat spacing of the lipid bilayer (Figure 6a), there is no evidence of an increase
in the number of waters per lipid (Figure 6b). Instead, the volume of the sugar-water solution is greater
in the system containing sugar than the volume of the water in the equivalent sugar-free system, there-
fore there is an increase in the distance between opposing lipid headgroups and the repeat spacing with
the addition of sugar at constant environmental conditions.
51.5
51.0
50.5
50.0
49.5
49.0
d S
paci
ng (Å
)
Trehalose Sucrose DOPC
(a)
8
7
6
5
4
Wat
ers
per l
ipid
0.50.40.30.20.10.0
Sugars per lipid
(b)

13
Figure 6. System parameters of DOPC, trehalose/DOPC and sucrose/DOPC as a function of sugar/li-
pid ratio: (a) Bilayer repeat spacing; (b) Number of waters per lipid. All measurements at 57% RH.
The absence of correlation between number of water molecules present and the bilayer repeat spac-
ing can also be seen at lower sugar/lipid ratios. The clearest example of this is the jump in number of
water molecules while the repeat spacing remains constant between the pure DOPC system and both
the 0.063 sugars/lipid systems.
At low sugar/lipid ratios, the hydration (osmotic) effect of the sugar dominates – the presence of the
sugar helps retain more water in the system at fixed RH51, increasing the number of waters per lipid
and water distribution width but having little effect on the bilayer repeat spacing. This hydrating effect
appears to be constant within the range of sugar/lipid ratios studied here.
At higher sugar/lipid ratios, the volumetric effects of the sugar dominate over the hydrating effects.
The physical volume of the sugars increases the volume of the intra-bilayer solution, further separating
opposing lipid bilayers, with this effect increasingly evident as the sugar/lipid ratio is increased, and
is the same general trend as found previously for hydrated lamellar phases22. Increasing this separation
between bilayers reduces hydration forces acting on the bilayer20, and therefore reduces the possibility
of phase transitions.
For a constant humidity the results show that there is no propensity for the sugars to locate prefer-
entially near the hydration shell of the DOPC headgroup, and consequently there is no evidence of a
change in the shapes of the sugar distributions as the sugar ratio increases due to a sugar saturation
effect surrounding the headgroup. The changes in the system parameters as the sugar/lipid ratio is
changed provide direct evidence that the hydrating effects of sugars and the volumetric effects of
sugars could account for observed cryo-protective effects of sugars.
This clear experimental result contradicts molecular dynamics (MD) simulations which have been
cited as evidence for the water replacement hypothesis19, 52, and the modifications to the water replace-
ment hypothesis proposed by Westh et al.27, 53, where after an initial enhancement of concentration in

14
the head group region the effect is saturated, with the remainder of the saccharide molecules behaving
as simple solutes in the intervening water bilayer54.
Turning now to the effect of hydration at constant sugar:lipid ratio, DOPC and 0.5 trehalose/DOPC
samples were measured 11%, 33%, 57% and 75% RH (Figure 5 right column). At 11% RH, the DOPC
sample exhibited a qualitatively different scattering density profile to the other measurements (Figure
7 top), accompanied by a change in the bilayer repeat spacing. We attribute these features to the for-
mation of a rhombohedral phase in this sample55. The presence of trehalose prevented this phase for-
mation, with all measurement consistent with a fluid lamellar phase56.
Figure 7. Water layer centered scattering density profiles for DOPC (top) and 0.5 trehalose/DOPC
(bottom) for four relative humidities. A change in the bilayer profile at 11% RH for the DOPC sample
is believed to be due to the formation of a rhombohedral phase.
The trehalose distribution for 0.5 sugars/lipid remains similar for all relative humidities (Figure 5,
right column). However, over the same RH range, there is a significant change in the water distribu-
tions, which increase in amplitude and width as the RH increases. This correlates with an increase in
the number of waters per lipid as the RH increases (Figure 8b), and causes an increase in the bilayer
repeat spacing (Figure 8a) as the volume of the intra-bilayer solution increases. The qualitatively dif-
ferent behaviors between the trehalose and water distributions as the RH changes indicates there is
little correlation between the distribution of the sugar and the hydration of the system.
2.0
1.5
1.0
0.5
0.0
-0.5
Sca
tterin
g de
nsity
-20 -10 0 10 20
Distance from water layer center (Å)
2.0
1.5
1.0
0.5
0.0
-0.5
Sca
tterin
g de
nsity
11% RH 33% 57% 75%
DOPC
0.5 Trehalose/DOPC

15
Adding trehalose increases the repeat spacing at each relative humidity. However, it is not until the
RH is raised to 57% RH, that this increase is accompanied by an increase in the number of waters per
lipid (Note that the number of waters per lipid for DOPC at 75% RH was not measured). At the lower
hydration of 33% RH, the increase in repeat spacing due to the presence of trehalose cannot be at-
tributed to the hydrating properties of trehalose. Instead, the volumetric properties appear to dominate.
Significantly, these results show there is no correlation between the trehalose distribution and the
position of the DOPC headgroups. As the relative humidity changes, the distance between opposing
DOPC headgroups changes as the volume of solution between the bilayers changes. This can be ob-
served in the increase in the repeat spacing and the increase in the water distribution area and width
with increasing RH. During these changes, the location of the trehalose remains constant within errors.
Such a result could not be expected if there was a relationship between the location of the trehalose
and the position of the DOPC headgroups. These results clearly show trehalose acts in the same way
as any non-specific uncharged solute with no (significant) specific interaction with DOPC headgroups.
Finally, we again point out that the range of hydrations studied here is exactly the range of interest
for desiccation and freezing damage of membranes.
Even though the distances between opposing bilayers are small, the sugars are concentrated in the
centre of the water layers, regardless of hydration. If specific interactions with the lipid headgroups
were to play a major role, they would be distributed much more evenly across the water layer. Indeed,
if the sugars were truly replacing the water, one would expect the number densities of sugar (Figure
5) to be broader than the number densities of the water. This is clearly not the case.
54
52
50
48
46
44
42
d sp
acin
g (Å
)
DOPC Trehalose
(a)

16
Figure 8. System parameters as a function of relative humidity for DOPC and 0.5 trehalose/DOPC: (a)
d spacing; (b) Number of water molecules per lipid.
Conclusions
When examining the scattering density profiles of DOPC bilayer stacks we find that the presence of
sugar has little effect on the bilayer itself for a given hydration, therefore the main changes are in the
structure of the aqueous layer (Figure 5, right column). The fact that the sugar layer can be fit to a
Gaussian profile centered in the middle of the water layer implies that the sugars are concentrated
more in the center of the bilayer, rather than around the headgroups.
The basis of the water replacement hypothesis is that sugar molecules, most notably trehalose, are
able to stabilize the area per lipid head group during dehydration4, 57 by replacing the more thermally
mobile water molecules around the lipid headgroups. By examining the location and distribution pro-
file of sucrose and trehalose as a function of sugar/lipid ratio at constant relative humidity, we have
shown that there is no qualitative change to the sugar distribution as the sugar/lipid ratio increases. At
constant sugar/lipid ratio, there is clearly no correlation between the sugar distribution and the position
of the DOPC headgroups. Combined, these results show that sugars impart a cryoprotective effect on
lipid bilayer membranes that is due to an increase in distance between opposing lipid bilayer head-
groups due to the hydration and volumetric properties of the sugars, without specific interaction be-
tween the sugars and the lipids.
ASSOCIATED CONTENT
Supporting Information. Structure factor phasing and scaling method, sugar deuteration method
and associated NMR spectra. This material is available free of charge via the Internet at
http://pubs.acs.org.
8
6
4
2
0
Wat
ers
per l
ipid
806040200
Relative Humidty (%)
(b)
17
Corresponding Author
Funding Sources
This research was supported by the Australian Research Council through Discovery Projects
DP110105380 and DP0881009 and Linkage Project LP0884027, with additional financial support
from BHP Billiton Worsley Alumina and Alcoa of Australia. This work was supported through the
Australian Access to Major Research Facilities Fund (AMRF), and AINSE grants 11173, 12024 and
13075.
Acknowledgements
We thank the ILL and HZB for allocation of beamtime. The authors also acknowledge the use of
NCRIS-supported National Deuteration Facility Laboratories for the synthesis of deuterated sugar
molecules.
Abbreviations
SLD, Scattering length density; DOPC, dioleoylphosphatidylcholine; %D, percent deuteration; RH,
relative humidity
References (1) Storey, K. B. Organic solutes in freezing tolerance. Comparative Biochemistry and Physiology a-Physiology 1997, 117 (3), 319-326. (2) Billi, D.; Potts, M. Life and death of dried prokaryotes. Res. Microbiol. 2002, 153 (1), 7-12. (3) Bryant, G.; Koster, K. L.; Wolfe, J. Membrane behaviour in seeds and other systems at low water content: the various effects of solutes. Seed Sci. Res. 2001, 11 (1), 17-25. (4) Crowe, J. H.; Crowe, L. M.; Chapman, D. Preservation of Membranes in Anhydrobiotic Organisms: The Role of Trehalose. Science 1984, 223 (4637), 701-703. (5) Crowe, L. M.; Crowe, J. H.; Rudolph, A.; Womersley, C.; Appel, L. Preservation of freeze-dried liposomes by trehalose. Arch. Biochem. Biophys. 1985, 242 (1), 240-247. (6) Crowe, J. H.; Crowe, L. M.; Carpenter, J. F.; Wistrom, C. A. Stabilization of dry phospholipid bilayers and proteins by sugars. Biochem. J. 1987, 242 (1), 1-10. (7) Rolland, F.; Baena-Gonzalez, E.; Sheen, J. Sugar sensing and signaling in plants: Conserved and novel mechanisms. In Annual Review of Plant Biology; Annual Reviews: Palo Alto, 2006; Vol. 57, pp 675-709. (8) Singer, S. J.; Nicolson, G. L. FLUID MOSAIC MODEL OF STRUCTURE OF CELL-MEMBRANES. Science 1972, 175 (4023), 720-&. (9) Garvey, C. J.; Lenne, T.; Koster, K. L.; Kent, B.; Bryant, G. Phospholipid Membrane Protection by Sugar Molecules during Dehydration-Insights into Molecular Mechanisms Using Scattering Techniques. International Journal of Molecular Sciences 2013, 14 (4), 8148-8163. (10) Lenné, T.; Bryant, G.; Holcomb, R.; Koster, K. L. How much solute is needed to inhibit the fluid to gel membrane phase transition at low hydration? Biochimica et Biophysica Acta-Biomembranes 2007, 1768 (5), 1019-1022. (11) Gordon-Kamm, W. J.; Steponkus, P. L. Lamellar-to-hexagonal II phase-transitions in the plasma-membrane of isolated protoplasts after freeze-induced dehydration. Proceedings of the National Academy of Sciences of the United States of America-Biological Sciences 1984, 81 (20), 6373-6377. (12) Steponkus, P. L. Role of the Plasma Membrane in Freezing Injury and Cold Acclimation. Annual Review of Plant Physiology and Plant Molecular Biology 1984, 35 (1), 543-584. (13) Crowe, L. M.; Crowe, J. H. Hydration-dependent hexagonal phase lipid in a biological membrane. Arch. Biochem. Biophys. 1982, 217 (2), 582-587. (14) Crowe, J. H.; Crowe, L. M.; Oliver, A. E.; Tsvetkova, N.; Wolkers, W.; Tablin, F. The trehalose myth revisited: Introduction to a symposium on stabilization of cells in the dry state. Cryobiology 2001, 43 (2), 89-105. (15) Sun, W. Q.; Leopold, A. C.; Crowe, L. M.; Crowe, J. H. Stability of dry liposomes in sugar glasses. Biophys. J. 1996, 70 (4), 1769-1776. (16) Crowe, J. H.; Hoekstra, F. A.; Crowe, L. M. Anhydrobiosis. Annual Review of Physiology 1992, 54, 579-599.

18
(17) Lambruschini, C.; Relini, A.; Ridi, A.; Cordone, L.; Gliozzi, A. Trehalose interacts with phospholipid polar heads in Langmuir monolayers. Langmuir 2000, 16 (12), 5467-5470. (18) Konov, K. B.; Isaev, N. P.; Dzuba, S. A. Low-Temperature Molecular Motions in Lipid Bilayers in the Presence of Sugars: Insights into Cryoprotective Mechanisms. The Journal of Physical Chemistry B 2014, 118 (43), 12478-12485. (19) Pereira, C. S.; Hunenberger, P. H. Interaction of the sugars trehalose, maltose and glucose with a phospholipid bilayer: A comparative molecular dynamics study. J. Phys. Chem. B 2006, 110 (31), 15572-15581. (20) Bryant, G.; Wolfe, J. Interfacial forces in cryobiology and anhydrobiology. Cryo-Lett. 1992, 13 (1), 23-36. (21) Wolfe, J.; Bryant, G. Freezing, Drying, and/or Vitrification of Membrane-Solute-Water Systems. Cryobiology 1999, 39, 103-129. (22) Lenné, T.; Garvey, C. J.; Koster, K. L.; Bryant, G. Effects of Sugars on Lipid Bilayers during Dehydration: SAXS/WAXS Measurements and Quantitative Model. The Journal of Physical Chemistry B 2009, 113 (8), 2486-2491. (23) Demé, B.; Zemb, T. Measurement of sugar depletion from uncharged lamellar phases by SANS contrast variation. J. Appl. Crystallogr. 2000, 33 (3-1), 569-573. (24) Lenné, T.; Bryant, G.; Garvey, C. J.; Keiderling, U.; Koster, K. L. Location of sugars in multilamellar membranes at low hydration. Physica B: Condensed Matter 2006, 385-386 (Part 2), 862-864. (25) Pincet, F.; Perez, E.; Wolfe, J. Do Trehalose and Dimethyl Sulfoxide Affect Intermembrane Forces? Cryobiology 1994, 31 (6), 531-539. (26) Yoon, Y. H.; Pope, J. M.; Wolfe, J. The effects of solutes on the freezing properties of and hydration forces in lipid lamellar phases. Biophys. J. 1998, 74 (4), 1949-1965. (27) Andersen, H. D.; Wang, C.; Arleth, L.; Peters, G. H.; Westh, P. Reconciliation of opposing views on membrane - sugar interactions. Proc. Natl. Acad. Sci. U. S. A. 2011, 108 (5), 1874-1878. (28) Green, J. L.; Angell, C. A. PHASE-RELATIONS AND VITRIFICATION IN SACCHARIDE-WATER SOLUTIONS AND THE TREHALOSE ANOMALY. J. Phys. Chem. 1989, 93 (8), 2880-2882. (29) Lerbret, A.; Affouard, F.; Hédoux, A.; Krenzlin, S.; Siepmann, J.; Bellissent-Funel, M.-C.; Descamps, M. How Strongly Does Trehalose Interact with Lysozyme in the Solid State? Insights from Molecular Dynamics Simulation and Inelastic Neutron Scattering. The Journal of Physical Chemistry B 2012, 116 (36), 11103-11116. (30) Lerbret, A.; Bordat, P.; Affouard, F.; Descamps, M.; Migliardo, F. How Homogeneous Are the Trehalose, Maltose, and Sucrose Water Solutions? An Insight from Molecular Dynamics Simulations. The Journal of Physical Chemistry B 2005, 109 (21), 11046-11057. (31) Magazù, S.; Migliardo, F.; Mondelli, C.; Vadalà, M. Correlation between bioprotective effectiveness and dynamic properties of trehalose–water, maltose–water and sucrose–water mixtures. Carbohydr. Res. 2005, 340 (18), 2796-2801. (32) Magazu, S.; Migliardo, F.; Ramirez-Cuesta, A. J. Inelastic neutron scattering study on bioprotectant systems. Journal of the Royal Society Interface 2005, 2 (5), 527-532. (33) Magazù, S.; Migliardo, F.; Telling, M. T. F. α,α-Trehalose−WaterSolutions.VIII.StudyoftheDiffusiveDynamicsofWaterbyHigh-Resolution Quasi Elastic Neutron Scattering. The Journal of Physical Chemistry B 2006, 110 (2), 1020-1025. (34) Bryant, G.; Koster, K. L.; Wolfe, J. Membrane behaviour in seeds and other systems at low water content: the various effects of solutes. Seed Science Research 2001, 11, 17-25. (35) Koster, K. L.; Ping Lei, Y.; Anderson, M.; Martin, S.; Bryant, G. Effects of vitrified and nonvitrified sugars on phosphatidylcholine fluid-to-gel phase transitions. Biophys. J. 2000, 78 (4), 1932. (36) Koster, K. L.; Webb, M. S.; Bryant, G.; Lynch, D. V. Interactions between soluble sugars and POPC (1-palmitoyl-2-oleoylphosphatidylcholine) during dehydration: vitrification of sugars alters the phase behavior of the phospholipid. Biochimica et Biophysica Acta (BBA) - Biomembranes 1994, 1193 (1), 143-150. (37) Kent, B.; Hunt, T.; Darwish, T. A.; Hauss, T.; Garvey, C. J.; Bryant, G. Localization of trehalose in partially hydrated DOPC bilayers: insights into cryoprotective mechanisms. Journal of the Royal Society Interface 2014, 11 (95), 6. (38) Al Kayal, T.; Russo, E.; Pieri, L.; Caminati, G.; Berti, D.; Bucciantini, M.; Stefani, M.; Baglioni, P. Interactions of lysozyme with phospholipid vesicles: effects of vesicle biophysical features on protein misfolding and aggregation. Soft Matter 2012, 8 (35), 9115-9126. (39) Hristova, K.; White, S. H. Determination of the Hydrocarbon Core Structure of Fluid Dioleoylphosphocholine (DOPC) Bilayers by X-Ray Diffraction Using Specific Bromination of the Double-Bonds: Effect of Hydration. 1998, 74 (5), 2419-2433. (40) Wiener, M. C.; White, S. H. Fluid Bilayer Structure Determination by the Combined Use of X-Ray and Neutron-Diffraction .1. Fluid Bilayer Models and the Limits of Resolution. Biophys. J. 1991, 59 (1), 162-173. (41) Wiener, M. C.; White, S. H. Fluid Bilayer Structure Determination by the Combined Use of X-Ray and Neutron-Diffraction .2. Composition-Space Refinement Method. Biophys. J. 1991, 59 (1), 174-185. (42) Wiener, M. C.; White, S. H. Structure of a Fluid Dioleoylphosphatidylcholine Bilayer Determined by Joint Refinement of X-Ray and Neutron-Diffraction Data .3. Complete Structure. Biophys. J. 1992, 61 (2), 434-447. (43) Greenspan, L. Humidity Fixed Points of Binary Saturated Aqueous Solutions. Journal of Research of the National Bureau of Standards - A. Physics and Chemistry 1977, 81A (No 1), 89-95. (44) Koch, H. J.; Stuart, R. S. The catalytic C-deuteration of some carbohydrate derivatives. Carbohydr. Res. 1978, 67 (2), 341-348. (45) Koch, H. J.; Stuart, R. S. A novel method for specific labelling of carbohydrates with deuterium by catalytic exchange. Carbohydr. Res. 1977, 59 (1), C1-C6. (46) Worcester, D. L. Neutron diffraction studies of biological membranes and membrane components. In Brookhaven symposia in biology, 1976; Vol. 27, pp III37-III57. (47) Franks, N. P.; Lieb, W. R. The structure of lipid bilayers and the effects of general anaesthetics : An X-ray and neutron diffraction study. J. Mol. Biol. 1979, 133 (4), 469-500. (48) Schneck, E.; Rehfeldt, F.; Oliveira, R. G.; Gege, C.; Dem; eacute; Bruno; Tanaka, M. Modulation of intermembrane interaction and bending rigidity of biomembrane models via carbohydrates investigated by specular and off-specular neutron scattering. Physical Review E 2008, 78 (6), 061924. (49) Bracewell, R. N. The Fourier transform and its applications; McGraw Hill2000. (50) Caracciolo, G.; Pozzi, D.; Caminiti, R. Hydration effect on the structure of dioleoylphosphatidylcholine bilayers. Appl. Phys. Lett. 2007, 90 (18), 3. (51) Bryant, G.; Koster, K. L. Dehydration of solute-lipid systems: hydration forces analysis. Colloids Surf. 2004, 35, 73-79. (52) Sum, A. K.; Faller, R.; de Pablo, J. J. Molecular simulation study of phospholipid bilayers and insights of the interactions with disaccharides. Biophys. J. 2003, 85 (5), 2830-2844. (53) Westh, P. Glucose, sucrose and trehalose are partially excluded from the interface of hydrated DMPC bilayers. Phys. Chem. Chem. Phys. 2008, 10 (28), 4110-4112. (54) Tian, J.; Sethi, A.; Swanson, Basil I.; Goldstein, B.; Gnanakaran, S. Taste of Sugar at the Membrane: Thermodynamics and Kinetics of the Interaction of a Disaccharide with Lipid Bilayers. Biophys. J. 2013, 104 (3), 622-632. (55) Yang, L.; Huang, H. W. A Rhombohedral Phase of Lipid Containing a Membrane Fusion Intermediate Structure. Biophys. J. 2003, 84 (3), 1808-1817. (56) Koster, K. L.; Lei, Y. P.; Anderson, M.; Martin, S.; Bryant, G. Effects of vitrified and nonvitrified sugars on phosphatidylcholine fluid-to-gel phase transitions. Biophys. J. 2000, 78 (4), 1932-1946. (57) Crowe, J. H.; Crowe, L. M.; Mouradian, R. Stabilization of Biological-Membranes at Low Water Activities. Cryobiology 1983, 20 (3), 346-356.

19
TOC Graphic