diploma!thesis! - gfc.at · Erklärung an Eides statt Affidavit Wir erklären hiermit an Eides...
134
Federal Training and Research Institute for Industrial Chemistry Secondary College for Chemical Technology educational focus: Biochemistry, Biotechnology and Genetic Engineering Höhere Bundeslehr- und Versuchsanstalt für chemische Industrie – Höhere Lehranstalt – Biochemie, Biotechnologie und Gentechnik diploma thesis (Diplomarbeit) Optimization of the Synthesis of Magnetic Cellulose Microparticles for the Extracorporeal Blood Purification conducted in the academic year 2010/11 by: supervised by: Prof. Dipl.Ing. Dr. rer. nat. tech. DominicPhilipp Klein 5AHCHB8 Veronika EBERT (internal supervision) Prof. Dipl.Ing. Dr. techn. Viktoria Maria Enk 5AHCHB4 Bibiana Meixner (examiner) Dipl.Ing. Dr. techn. Marion Ettenauer (external supervision) Vienna (Wien), 23 rd of May 2011 In cooperation with the „Department für Klinische Medizin und Biotechnologie – Zentrum für Biomedizinische Technologie“ at the „DonauUniversiät Krems“. A project sponsored by .
-
Upload
nguyenhuong -
Category
Documents
-
view
219 -
download
0
Transcript of diploma!thesis! - gfc.at · Erklärung an Eides statt Affidavit Wir erklären hiermit an Eides...

Federal Training and Research Institute for
Industrial Chemistry Secondary College for Chemical Technology
educational focus: Biochemistry, Biotechnology and Genetic Engineering
Höhere Bundeslehr- und Versuchsanstalt für chemische Industrie – Höhere Lehranstalt – Biochemie, Biotechnologie und Gentechnik
diploma thesis (Diplomarbeit)
Optimization of the Synthesis of Magnetic Cellulose Microparticles
for the Extracorporeal Blood Purification conducted in the academic year 2010/11 by:
supervised by:
Prof. Dipl.-Ing. Dr. rer. nat. tech.
Dominic-‐Philipp Klein 5AHCHB-‐8 Veronika EBERT (internal supervision) Prof. Dipl.-Ing. Dr. techn. Viktoria Maria Enk 5AHCHB-‐4 Bibiana Meixner (examiner) Dipl.-Ing. Dr. techn. Marion Ettenauer (external supervision)
Vienna (Wien), 23rd of May 2011
In cooperation with the „Department für Klinische Medizin und Biotechnologie – Zentrum für Biomedizinische Technologie“ at the „DonauUniversiät Krems“.
A project sponsored by .

Erklärung an Eides statt
Affidavit
Wir erklären hiermit an Eides statt, dass wir die vorliegende Diplomarbeit,
We hereby declare that the following diploma thesis,
„Optimization of the Synthesis of
Magnetic Cellulose Microparticles for the Extracorporeal Blood Purification“
selbstständig und ohne Hilfe verfasst, andere als die angegebenen Quellen nicht benutzt und die benutzten Quellen wörtlich oder inhaltlicher entnommenen Stellen als solche kenntlich gemacht haben.
was written without any exception by ourselves and without the use of any other than the sources, tools and all other explanations that we copied directly or in their sense are indicated as such.
Ort, Datum Viktoria Maria Enk Ort, Datum Dominic-Philipp Klein

Who is who?
This page serves the facility to the authors of this diploma-‐thesis to introduce themself.
I, Dominic-‐Philipp Klein, ... … was born on the 13th of December 1991 in Vienna where I grew up. I spend a lot of my leisure time traveling round the world what I would describe as my favorite hobby. I'm a very convivial companion and for that reason often "on the road" but I do also like spending my time with my family at home. In high school, I fell in love with chemistry and biology what encouraged me to leave the „Bernoulli Gymnasium“ in Wien-‐Donaustadt and sign up for the „Höhere Bundes-‐, Lehr-‐ und Versuchsanstalt für chemische Industie”. After leaving school I would like to study medicine, that’s why I’m that much amazed by our project.
Vienna, 17th of June 2010
I, Viktoria Maria Enk … was born on the 18th of September 1992 in Lilienfeld. I spent my childhood in Wiesenbach in Lower Austria and attended language school in Lilienfeld until I went to the Rosensteingasse in 2006. I moved to Vienna in 2009 because the exertion of the long way had become too hard. I like spending my time with my friends and my animals, travelling and having fun. Sometimes I even like going to school! The reason why I´ve convinced my diploma-‐thesis-‐partner to write the paper in english, is because I want to study in Ireland after school so I need to learn the technical vocabulary better.
Vienna, 22th of June 2010
… and now please enjoy reading the following pages!
Yours Viktoria and Dominic!

Acknowledgements
This thesis would not have been possible unless the support of many important people:
To write this thesis would not have been possible unless the support of our external supervision DI Dr. techn. Marion Ettenauer, who helped us whenever a problem occurred during the practical work.
We would also like to thank Priv. Doz. Dr. Viktoria Weber, and Univ. Prof. Dr. Dieter Falkenhagen the Head of the Department of Clinical Medicine and Biotechnology, who also helped us with answering our questions and providing us the literature we needed.
We would also like to show our gratitude to AV Prof. DI Dr. techn. Bibiana Meixner “Bibi” who not only supported us during the work on this thesis but also during the last few years at school. We are very grateful for making the experience of having such a caring teacher who was a little bit of a mum to all of us.
Prof. Dr. rer. nat. tech. Veronika Ebert has made available her support in a number of ways reading our thesis many times. We want to thank her for the good preparation for all the theses that may follow in our academic lives.
We are grateful for the contribution of Prof. Mag. Christine Raschauer-Andrecs who read all our text parts and corrected english language mistakes.
Another important person who is to be acknowledged here is Prof. DI Bert Sefcik “Onkel Bert”, our form teacher.
We also want to thank our parents, grandparents and other family members who are the ones who have been supporting us our whole lives long and made the education at this school possible.
An extraordinary “Dankeschön” goes to Dominics aunt, Rosa Krail, who provided accommodation and just the best he could wish of support in the time of the practical part of the thesis.
We would like to thank Chrisi Julius for her help and support with our graphics.
We want to show our gratitude to Johannes Theierling, for printing our final papers.
Last but not least we want to thank our friends,
Andi Dietrich, Daniel Theierling, Nici Golias, Mo Schöll, Simone Panholzer
for having endured all of our bad moods in our time together.

Viktoria Maria Enk page 1 of 130 Dominic-Philipp Klein
TABLE OF CONTENTS
1. ABSTRACT............................................................................................................................................ 3
2. AIM.....................................................................................................................................................13
3. INTRODUCTION..................................................................................................................................14 3.1 THE LIVER ............................................................................................................................................... 14 3.2 BIOCHEMICAL PROCESSES ......................................................................................................................... 15
3.2.1 REGULATIVE FUNCTIONS:..................................................................................................................... 15 3.2.2 SYNTHESIS FUNCTIONS: ....................................................................................................................... 15 3.2.3 STORAGE-‐FUNCTION: .......................................................................................................................... 15 3.2.4 CATABOLISM OF BODY OWN SUBSTANCES: .............................................................................................. 16 3.2.5 CATABOLISM OF FOREIGN SUBSTANCES: ................................................................................................. 18
3.3 LIVER FAILURE: ........................................................................................................................................ 20 3.4 THE PROMETHEUS SYSTEM (COMBINED DIALYSIS-‐ADSORBER-‐TREATMENT): .................................................. 21 3.5 THE MICROSPHERES DETOXIFICATION SYSTEM (MDS):................................................................................. 24 3.6 SAFETY CONSIDERATIONS:......................................................................................................................... 26 3.7 AIMS OF THIS STUDY: ............................................................................................................................... 28
4. MATERIALS AND METHODS .................................................................................................................30 4.1 MATERIALS ............................................................................................................................................. 30
4.1.1 DEVICES ........................................................................................................................................... 30 4.1.2 SINGLE USE MATERIALS ...................................................................................................................... 32 4.1.3 CHEMICAL SUBSTANCES ....................................................................................................................... 33
4.2 METHODS.............................................................................................................................................. 36 4.2.1 SYNTHESIS OF MAGNETIC CELLULOSE MICROPARTICLES ............................................................................ 37 4.2.3 CHARACTERISATION OF MAGNETIC CELLULOSE MICROPARTICLES................................................................ 42
5. RESULTS .............................................................................................................................................47 5.1 GUIDELINES FOR INTERPRETATION OF THE RESULTS ..................................................................................... 47 5.1.1 THE MAGNETIC MICROPARTICLES WERE ANALYZED ACCORDING TO THE FOLLOWING ASPECTS: .................. 47 5.1.2 OVERVIEW OF THE PROCESSES:........................................................................................................... 48 5.1.3 AN OPTIMAL SUITABLE PARTICLE SHOULD HAVE FOLLOWING PROPERTIES:..................................................... 49

Viktoria Maria Enk page 2 of 130 Dominic-Philipp Klein
5.2. RESULTS .............................................................................................................................................. 49 5.2.1 VISUAL CHARACTERISTICS-‐ PRE TESTS .................................................................................................... 49 5.2.2 SCANNING ELECTRON MICROSCOPY PICTURES ................................................................................... 57 5.2.3 DETERMINATION OF THE MAGNETIC BEHAVIOUR................................................................................. 68 5.2.4 DETERMINATION OF THE PARTICLE SIZE AND SIZE DISTRIBUTION .................................................... 73 5.2.5 MEASUREMENT OF DENSITY .......................................................................................................... 112 5.2.6 DRY MATTER CONTENT.................................................................................................................. 115 5.2.7 COMPARISON OF SIZE DISTRIBUTIONS AFTER 5MIN/10MIN AND WITHOUT AN ULTRASONIC BATH .... 116
5.3 SUMMARY OF THE BEST PARTICLES AND INTERPRETATION .......................................................................... 120
APPENDIX.............................................................................................................................................124 INDEX OF FIGURES: ...................................................................................................................................... 127 INDEX OF TABLES: ........................................................................................................................................ 129 INDEX OF ABBREVIATIONS:............................................................................................................................ 130 COURSE OF THE PROJECT:............................................................................................................................... 130

Viktoria Maria Enk page 3 of 130 Dominic-Philipp Klein
1. ABSTRACT
ENGLISH
The liver is the central organ of the human metabolism so a complete breakdown would
cause a patients death. Due to the fact that the liver is a regenerative organ it can be
supported in its regeneration through supporting metabolic functions such as
detoxification.
If the liver cannot regenerate itself it has to be replaced by a donate organ. The time from
the failure of the organ to the transplantation has to be bridged. Because the body does
not have a detoxification unit during this time, sepsis is a possible risk. Because of this
reason the detoxification is supported by the MDS.
The MDS (Microspheres based Detoxification System) is a further development of the
Prometheus System that is already in clinical use.
For both systems blood is taken from the patient and the cells, that are recycled into the
body, are separated from the plasma. In the so called primary circuit blood and cells are
circulated while the secondary circuit contains just plasma.
The blood plasma contains coagulation factors that make the use of heparin necessary.
The plasma is purified in the secondary circuit of the Prometheus systems in capsules with
immobilized mircoparticles by the use of variable sorption-processes.

Viktoria Maria Enk page 4 of 130 Dominic-Philipp Klein
Medical applications have to be proved by double failure security. It has to be secured that
the patient cannot be harmed in case of breakdown of one security barrier. In the
Prometheus system this can be ensured by the immobilization in capsules.
In the MDS- System the specific surface is maximized through the use of smaller particles
(10µm in the Prometheus <5µm in the MDS). The efficiency is also increased by the
use of a particle suspension instead of capsules as a secondary circuit.
Figure 1: The MDS-system
If the particles enter the body they could cause embolism. Thus it has to be considered
that the safety barrier of the immobilization in capsules is not available in this system so it
has to be substituted with another security barrier.
Therefore a fluorescence detector with a magnetic trap was developed and 1-10% marker
particles are added to the adsorber or absorber particles.
The magnetically and fluorescence labeled particles are accumulated in front of the
detector to increase the emitted signal. If a fluorescence signal is detected the pumps are
stopped and the trespass of microparticles from the suspension into the human body is
prevented.

Viktoria Maria Enk page 5 of 130 Dominic-Philipp Klein
Currently just the so called Dynabeads® Tosylactivated (Invitrogen) are available
commercially. These are suitable for use in the system but are very expensive. For
medical application it is important to find a cost reduced version of the particles.
These particles are cellulose-beads in whose pores magnetite is precipitated in alkaline
media following the reaction below:
Fe2+ + 2 Fe3+ + 8 OH- → Fe3O4 + 4 H2O
The aim was to find an optimal way for the synthesis of the magnetic microparticles for the
extracorporeal blood purification.
The particles act as a carrier medium for covalently bound adsorbent and absorbent
material. They are also used for binding the fluorescence agent, cresyl violet on the
surface of the marker particles.
The synthesis was varied concerning impregnation, precipitation and removal of residual
components (washing) to synthesize ideal and cheap microparticles.
For impregnation steps the protective colloids Methylcellulose (MC) und Polyethylenglycol
(PEG) were used. To make a comparison possible one series of tests was made without
coating.
The two different alkali Sodium hydroxide and ammonia were used for precipitation. Each
precipitation was done one time with and one time without a disperser, the so called Ultra
Turrax.
In the last step of the synthesis all residuals of the precipitation steps should be removed
(for instance excess precipitation reagent, precipitate outside of the pores or destroyed
cellulose beads).
For this experiment reversed osmosis water, phosphate buffer (PBS) or an albumin solution were used.

Viktoria Maria Enk page 6 of 130 Dominic-Philipp Klein
Figure 2: synthesis chain
The suitability of the particles was tested with several analyses. The particles were
suspended in the washing agents to test their behavior in a suspension.
To test the properties of sedimentation the density which is an important parameter for the
sedimentation was measured.
The magnetic properties were determined through wandering of the particles in a magnetic
field from the suspension to a permanent magnet.
This value is measured in seconds that the suspension needs to become clear. This is
very important because the magnetic accumulation in front of the detector is the crucial
factor for the velocity of the signaling and stop of the pumps.

Viktoria Maria Enk page 7 of 130 Dominic-Philipp Klein
A further point is the homogeneity of the particle size which was determined with the
“Mastersizer” from Malvern Instruments.
The method is based on refraction and bending of bundled light on the surface of the
particles (Mie-theory)
For visualization the best particles were sent to the TU Dresden for analysis with scanning
electron microscopy. On these pictures suspicions of aggregations can be proved or
withdrawn.
Furthermore undesirable precipitation on the surface of the particles can be shown.
Magnetite on the surface of the particles also reduces the possible covalent binding sites.
The optimal way of synthesis that was determined in this study is:
• coating with Polyethylenglycol
• precipitation with ammonia
• with Ultra Turrax
• washing with reversed osmosis water
These particles have the best properties for further application.

Viktoria Maria Enk page 8 of 130 Dominic-Philipp Klein
DEUTSCH
Die Leber ist das Zentrum des Stoffwechsels im menschlichen Körper ein Ausfall dieses
Organs würde für den Patienten unbehandelt den Tod bedeuten. Da die Leber ein
regeneratives Organ ist, kann sie bei ihrem Wiederaufbau unterstützt werden indem ihr
Stoffwechselfunktionen, wie die Entgiftung des Körpers, abgenommen werden.
Im Fall eines kompletten Ausfalls des Organs muss dieses durch ein Spenderorgan
ersetzt werden. Die Zeit vom Organversagen bis zur Transplantation muss jedoch
überbrückt werden. Da der Patient keine funktionierende Entgiftungseinheit im Körper trägt
droht eine Sepsis. Diese Entgiftung wird durch ein extrakorporales System ersetzt, das
Microspheres based Detoxification System.
Das MDS (Microspheres based Detoxification System) ist eine Weiterentwicklung des
bereits in klinischer Anwendung befindlichen Prometheus Systems. Für beide Systeme
wird das aus dem Patienten entnommene venöse Blut von zellulären Bestandteilen
getrennt, welche direkt wieder dem Körper zugeführt werden. Es wird allgemein von einem
Primärzyklus (Blut mit zellulären Bestandteilen) und einem Sekundärzyklus
(Plasmakreislauf) gesprochen. Das Blutplasma (serale Blutkomponenten zuzüglich
Gerinnungsfaktoren) wird im Prometheus System mit in Kapseln immobilisierten
Mikropartikel, durch variable Sorptionsverfahren gereinigt.
Medizinische Anwendungen verlangen doppelte Fehlersicherheit, das bedeutet, dass im
Falle des Ausfalls einer Komponente der Patient nicht gefährdet wird. Diese doppelte
Fehlersicherheit ist im Prometheussystem durch die Immobilisierung der Micropartikel
gegeben.

Viktoria Maria Enk page 9 of 130 Dominic-Philipp Klein
Im MDS System wird die spezifische Oberfläche und damit die Sorptionskapazität erhöht
indem die Partikel noch kleiner (10µm im Prometh <5µm im MDS) synthetisiert werden.
Weiters wird der Phasenübergang durch die Verwendung einer Partikelsuspension als
Sekundärkreislauf massiv erhöht.
Figure 3: The MDS-system
Ein Eindringen der Partikel in den menschlichen Körper könnte fatale Folgen haben, als
eine von vielen drastischen Folgen lässt sich Embolie, also eine Ansammlung von
Partikeln in Gefäßen bis zur Verstopfung, nennen.
Bei der Anwendung von den Partikeln in Suspension fällt eine Sicherheitsbarriere
(Immobilisierung in Kapseln) weg welche durch eine andere substituiert werden muss. Für
das MDS wurde daher ein Fluoreszenzdetektor mit Magnetfalle entwickelt. Durch die
Magnetfalle sammeln sich die Partikel vor dem Detektionsfeld und erzeugen dadurch ein
höheres Signal, dieses Signal unterbricht die Blutentnahme aus dem Patienten und damit
auch die Rückführung. Diese Methode setzt jedoch den Einsatz von Fluoreszenz –
markierten, magnetischen Mikropartikeln voraus, welche zu ca. 1-10% der Summe an
Partikeln in Suspension zugegeben werden müssen.

Viktoria Maria Enk page 10 of 130 Dominic-Philipp Klein
Gegenwärtig sind nur die so genannten Dynabeads® Tosylactiviert von Invitrogen
kommerziell erhältlich und bieten sich für die Verwendung an. Diese Dynabeads zeichnen
sich jedoch durch einen sehr hohen Preis aus. Für die medizinische Anwendung gilt es
daher eine kostenreduzierte Version der Partikel zu finden.
Es handelt sich bei diesen Mikropartikeln um Cellulose-Perlen in deren Poren Magnetit
nach folgendem Schema in basischem Milieu präzipitiert wurde:
Fe2+ + 2 Fe3+ + 8 OH- → Fe3O4 + 4 H2O
Die Zielsetzung dieser Arbeit war es einen optimalen Syntheseweg für die Herstellung von
diesen magnetischen Mikropartikeln für die extracorporale Blutreinigung zu finden. Diese
Partikel dienen als Trägermedium für kovalent gebundene Adsorbenzien und
Absorbenzien. Weiters dienen diese Partikel als Grundlage für die kovalente Bindung des
Fluoreszenzfarbstoffes, Cresylviolett auf den Detektorpartikeln.
Die Synthese wurde in den Hauptpunkten Imprägnierung, Fällung und Entfernung von
Restbestandteilen aus der Fällung (Waschen) variiert um ideale und günstige Mikropartikel
zu synthetisieren.
Im Punkt Imprägnierung wurden die protektiven Kolloide MethylCellulose (MC) und
PolyEthylenGlycol (PEG) verwendet. Des Weiteren wurde aus Vergleichsgründen auch
eine Synthesereihe ohne Imprägnierschritt hergestellt.
Im Fällungsschritt wurden die verschiedenen Fällungsreagenzien Natriumhydroxid und
Ammoniak variiert. Um den Einfluss von Dispergiergeräten auf die Fällung auszutesten
wurde jede Versuchsreihe jeweils einmal mit und einmal ohne Ultra Turrax ausgefällt.
In der letzten Synthesestufe sollen alle Restbestandteile der Fällung entfernt werden, dazu
zählt beispielsweise überschüssiges Fällungsreagenz, Präzipitat außerhalb der
Celluloseporen und zerstörte Cellulosebeads. Für diesen Versuch wurde in einer Reihe

Viktoria Maria Enk page 11 of 130 Dominic-Philipp Klein
Umkehrosmosewasser verwendet in anderen Versuchen, Phosphatpuffer und eine
Albuminlösung.
Figure 4: synthesis chain
Die Eignung der Partikel wurde durch zahlreiche Analysen überprüft. Durch die Aufnahme
der Partikel in ihren Waschlösungen wurden deren Eigenschaften in einer Suspension
ermittelt.
Um unterschiedliche Sedimentationsverhalten abzuschätzen wurde die Partikeldichte
bestimmt, da die Dichte ein Einflussfaktor auf die Sedimentation ist.
Die magnetische Separation aus dem Träger wurde mittels der Wanderung im
magnetischen Feld ermittelt. Dieser Wert ist insbesondere wichtig weil sich die
magnetische Separation aus dem Medium bestimmend für Geschwindigkeit der
Signalgabe ist.
Viktoria Maria Enk page 12 of 130 Dominic-Philipp Klein
Ein weiterer Punkt ist die Gleichmäßigkeit der Größe der Partikel, um diese zu bestimmen
wurde die Mastersizing-Methode von Malvern Instruments verwendet. Diese Methode
basiert auf der Brechung und Beugung von gebündeltem Licht an der Partikeloberfläche
(Mie-Theorie).
Zum Zweck der Visualisierung wurden Partikel, welche in oben genannten Analysen die
besten Resultate aufwiesen, nach Dresden geschickt um dort Bilder im
Rasterelektronenmikroskop aufzunehmen. Auf diesen Bildern können eventuelle
Verdachte von Aggregation aus der Größenverteilungsmessung bestätigt oder verworfen
werden. Des Weiteren können auch unerwünschte Präzipitation an der Partikeloberfläche
dargestellt werden. (Magnetit an der Partikeloberfläche verringert die möglichen
kovalenten Bindungsstellen der Cellulose)
Aus der Arbeit geht als optimaler Syntheseweg hervor, dass Partikel welche mit
PolyEthylenGlycol vor der Fällung geschützt, mit Ammoniumhydroxid unter Verwendung
eines Ultra Turrax Dispergiergeräts gefällt und mit Umkehrosmosewasser gewaschen
wurden, die beste Eignung für die Weiterverwendung aufweisen.

Viktoria Maria Enk page 13 of 130 Dominic-Philipp Klein
2. AIM
The aim of this thesis was to optimize the synthesis of magnetic cellulose microparticles
for the extracorporeal blood purification.
The at present available magnetic microparticles on the global marked are settled on a
high price level so that mass application for extracorporeal blood purification methods is
too expensive.
The particle synthesis designed for the Microspheres based Detoxification System is a
cheaper alternative for the commercially available magnetic beads.
The optimization setup was to vary several steps of the synthesis (impregnation,
precipitation, reaction support, washing) provided by the Donau Universität Krems.
The impregnation was varied using different protective colloids before the precipitation.
Those protective colloids were MethylCellulose and PolyEthylene Glycol for comparison
another series was conducted without any protective colloid.
Precipitation was conducted with different precipitants (Sodiumhydroxide and
Ammoniumhydroxide). Both precipitations were realized twice, one time with a Ultra Turrax
dispenser as reaction support, the second one without any support.
The removal of residuals of the precipitation was also varied using different washing
agents (water, albumin solution, phosphate buffered solution).
Viktoria Maria Enk page 14 of 130 Dominic-Philipp Klein
3. INTRODUCTION
3.1 THE LIVER
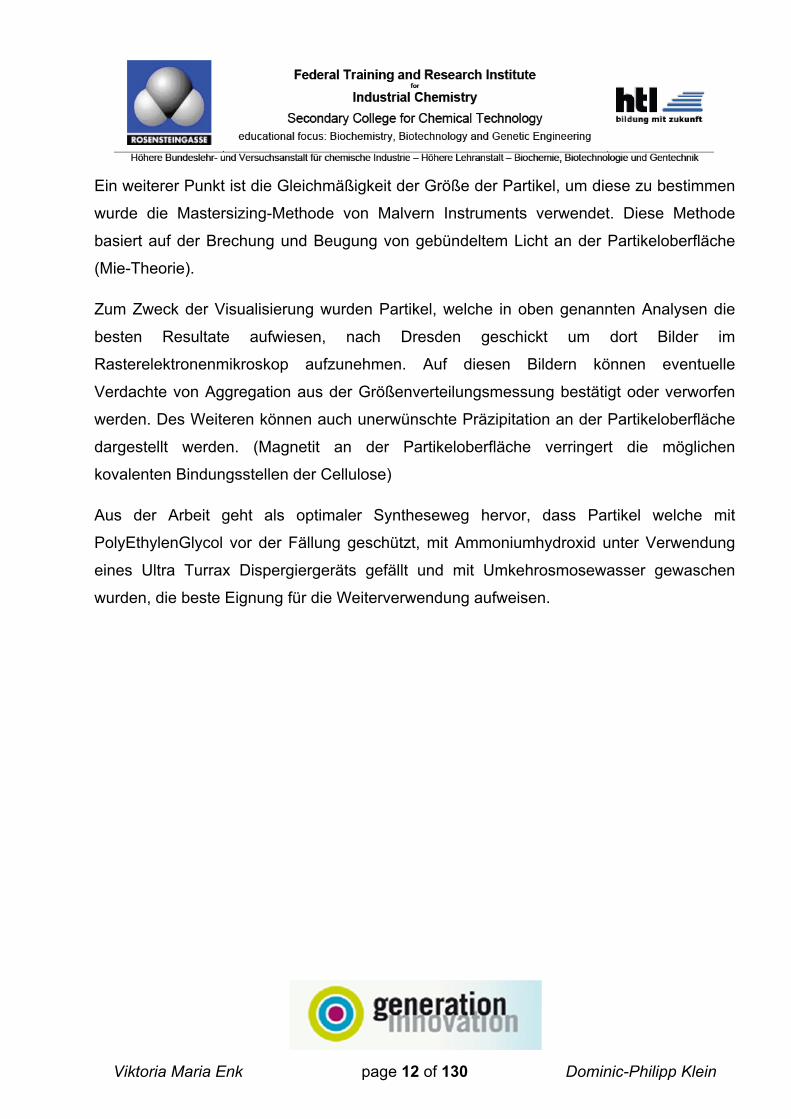
The liver is the central organ of the metabolism and the biggest gland in the body of
vertebrates. A human liver weighs between 1500 and 2000g and is located in the right
upper abdomen. [16]
Figure 3: Structure of the liver
http://en.wikipedia.org/wiki/File:Anatomy_of_liver_and_gall_bladder.png (25.12.2010)

Viktoria Maria Enk page 15 of 130 Dominic-Philipp Klein
As seen in Figure 3 the liver can be divided in two big lobes. The right lobe is under the
phrenic and partly fused with it, the left lobe is smaller and extends to the left upper
abdomen. Two smaller lobes that are not shown in this picture (the quadratic and the
caudate lobe) are also part of the liver. [2]
3.2 BIOCHEMICAL PROCESSES
The functions of the liver can be sub-divided into:
3.2.1 REGULATIVE FUNCTIONS:
The liver plays an important role in the regulation of glucose, fat and protein-
metabolism. It can convert glucose into glycogen when a high glucose level is in the
blood and backwards at a low level. This keeps the blood glucose level constant. [2]
3.2.2 SYNTHESIS FUNCTIONS:
The gluconeogenesis (synthesis of D-glucose from glycerol, lactate or pyruvate),
the syntheses of ketones, cholesterine, bile and blood-proteins (albumin, globuline,
coagulation factors) take place in the liver. [2]
3.2.3 STORAGE-FUNCTION:
Glycogen, lipoproteins and vitamins are stored in the liver. There is also a high
amount of blood located in the liver. [17]

Viktoria Maria Enk page 16 of 130 Dominic-Philipp Klein
3.2.4 CATABOLISM OF BODY OWN SUBSTANCES:
The liver catabolizes bilirubine and steroid hormons. Firstly water insoluble
substances are modified to become water soluble and can then be eliminated by
the kidneys. Large compounds, that are retained by the kidneys are catabolized by
the liver itself. [2]
There is a difference in the decomposition of protein-bound and non-protein-bound
substances both at body own and foreign substances. Protein-bound substances
are decomposed by the liver while non-protein-bound substances can be removed
by the kidneys. [16]
3.2.4.1 Bilirubine-catabolism (protein-bound substance):
Figure 4: Chemical formula of the Hem group
http://de.academic.ru/pictures/dewiki/72/Heme_
b.png (25.12.2010)
Figure 5: Chemical formula of bilirubin
http://en.wikipedia.org/wiki/File:Bilirubin_ZZ.png (9.3.2011)

Viktoria Maria Enk page 17 of 130 Dominic-Philipp Klein
The figure below shows the catabolism of the red blood cells via bilirubin to
urobilinogen and sterkobilinogen that are excreted.[4]
Figure 6: decomposition of Hemoglobin in liver and kidneys
http://www.elmhurst.edu/~chm/vchembook/images/634bilimap.gif (25.12.2010)
When red blood cells lyse hemoglobin is released into the blood. During
degradation the Hem group and the globine group are separated. The globine part
is degraded to amino acids while Hem is converted to Bilirubine via Biliverdine.
During the transport bilirubine is reversibly bound to albumin which increases the
solubility and is transported into the liver.

Viktoria Maria Enk page 18 of 130 Dominic-Philipp Klein
In the cells of the liver (hepatocytes) the conjugation of bilirubine with glucuronic
acid to the water soluble bilirubinmonoglucuronid or –diglucuronid takes place by
way of the enzyme UDP-Glukuronyltransferase.
The water soluble products can be egested through the bile afterwards.
In the intestines bilirubine is reduced to urobilinogen and sterkobilinogen (the brown
colorant of feces). One part of this is reabsorbed by the intestine and egested
through the kidneys (yellow colour of urine).
If bilirubin is not removed by the liver an icterus can develop. [4] [17]
3.2.5 CATABOLISM OF FOREIGN SUBSTANCES:
Substances that are harmful for the body including ammonia or drugs are
catabolized in the liver. As an example the catabolism of ethanol is described. This
is an example of a non-protein-bound substance. [4] [17]

Viktoria Maria Enk page 19 of 130 Dominic-Philipp Klein
3.2.5.1 Alcohol-catabolism (non- protein-bound substance):
As can be seen in figure 7 the enzyme alcohol- dehydrogenase converts ethanol
into ethanal, then into the anion ethanoate, that reacts to Acetyl-Co-enzyme-A with
the Co-enzyme-A. [17]
Figure 7: Decomposition of ethanol
http://www.ganfyd.org/images/thumb/d/d4/Ethanol_metabolism.
gif/180px-Ethanol_metabolism.gif (25.12.2010)
As shown in the figure above the end product of the decomposition of ethanol is
acetyl-Co-enzyme A. This can enter the citrate circuit for subsequent degradation.
[2] [17]

Viktoria Maria Enk page 20 of 130 Dominic-Philipp Klein
3.3 LIVER FAILURE:
Liver failure can be caused by hepatitis- virus, drugs (e.g. with suicidal intention), alcohol
abuse or other toxins.
Symptoms of liver failure are icterus, blood coagulation diseases, a reduced albumin level,
endocrine diseases, kidney failure, hepatic coma (function diseases of the brain) and
death.
Liver dialysis can help patients to bridge the time between liver failure and a
transplantation or to support the liver and faciliate the regeneration of liver tissue. This is
no long-term solution and can just be used for temporary treatment.
The compensation of the liver´s synthesis functions cannot be done by now, the
detoxification system is just able to replace the catabolism. For that reason the processes
of syntheses are not described in more detail.
The liver removes substances that are too large for removal with normal dialysis that is
used to treat kidney failure. Examples are albumin-bound metabolites, like bilirubin, bile
acids, phenolic compounds, and aromatic amino acids.
There are two different systems of liver dialysis systems that remove both albumin bound
substances (e.g. unconjugated bilirubin or cholic acid) and non protein-bound substances.
[1] [2]

Viktoria Maria Enk page 21 of 130 Dominic-Philipp Klein
3.4 THE PROMETHEUS SYSTEM (COMBINED DIALYSIS-ADSORBER-TREATMENT):
The system combines normal dialysis, that is used for the removal of water soluble
substances with adsorber- treatment for water insoluble and protein-bound substances.
Figure 8 gives an overview of conventional dialysis.
Figure 8: Dialysis
http://kidney.niddk.nih.gov/kudiseases/pubs/hemodialysis/images/dialysis.gif
(25.12.2010)
In normal dialysis blood is pumped outside of the body and Heparin is added to prevent
coagulation. Afterwards the blood passes a Dialyzer where small molecules e.g. ethanol
are retained.

Viktoria Maria Enk page 22 of 130 Dominic-Philipp Klein
Blood cells and larger molecules do not enter the filter and are not retarded therefore.
Afterwards the purified blood passes an air trap and an air detector to prevent air from
entering the body. Afterwards the clean blood returns into the body.
Figure 9: Prometheus System
Kindly provided by Univ.-Prof. Dr. Viktoria Weber (28.3.2011)
As mentioned at the beginning of the chapter the Prometheus system combines
normal dialysis (circuit 2, Figure 9) with adsorber treatment (circuit 1, figure 9).

Viktoria Maria Enk page 23 of 130 Dominic-Philipp Klein
In circuit one the blood is pumped outside of the body(Fig. 9). Subsequently a
membrane module (Albuflow) is used for separation of plasma from blood cells.
Water-insoluble substances that are bound to albumin are removed from the
plasma in a the plasma circuit by adsorber particles. Blood cells that have been
separated before the plasma circuit are added again. In circuit 2 water soluble
substances are removed through a dialysis system.
The adsorber-particles used in the Prometheus system are cellulose microparticles
with diameter of >10µm. They have a low specific surface and a high amount of
blood is needed outside of the body. The particles are enclosed in capsules (Fig. 9-
“Adsorber Prometh 01”)
If a large volume of blood is outside of the body because of the treatment, the
patients suffer from similar symptoms as the ones after loss of blood: they feel very
dizzy and thirsty.
For that reason it is tried to reduce the needed amount of blood, which can be done
through a higher specific surface of the particles (smaller particles). This leads to
the development of the MDS-System. [1] [7]

Viktoria Maria Enk page 24 of 130 Dominic-Philipp Klein
3.5 THE MICROSPHERES DETOXIFICATION SYSTEM (MDS):
Figure 10: Correlation between volume and surface
http://www.uwgb.edu/dutchs/Graphics-
Geol/GEOMORPH/SurfaceVol0.gif (25.12.2010)
For blood purification with the MDS smaller cellulose particles (<5µm) are used because
they have a higher specific surface and thus can bind more toxins per volume. In contrast
to the Prometheus system the particles are not encapsulated and move freely in the
plasma.
The figure above shows that the surface-volume-relation of a particle increases if it is not
just one big particle but many small ones that altogether have the same volume.

Viktoria Maria Enk page 25 of 130 Dominic-Philipp Klein
The big advantage of smaller particles is that using the same volume of <5µm particles
instead of >10µm particles a smaller volume of blood is needed outside of the body.
In some of the first tests commercially available particles (so called Dynabeads®) were
used but they are too expensive for clinical application. Therefore cellulose microparticles
are utilized and show as good results when treated correctly.
Figure 11: MDS- System
http://www.donau-uni.ac.at/de/department/kmbt/forschung/biomedizinischetechnologie/projekte/id/14431/index.php (25.12.2010)

Viktoria Maria Enk page 26 of 130 Dominic-Philipp Klein
As can be seen in figure 11 the blood is pumped out of the body and citrate is added to
prevent coagulation. The blood enters a plasma-filter to remove blood cells. The plasma
enters a second circuit, where the microparticle suspension is added. Afterwards the
suspension passes a plasma filter again and the microparticles are retarded. Blood cells
and plasma are unified again.
Since particles can cause thrombosis and embolism in the human body they must not
reach the patient´s own blood circuit.
To protect the patient in the case of a malfunction of the plasma filter a microparticle
detector after the filter stops the pumps if particles are detected. Then the blood passes a
dialysis filter, where a dialysis is performed.
Finally calcium is added to reverse the effects of citrate and allow a normal coagulation
behaviour of the blood reentering the body.
[7] [8] [9]
3.6 SAFETY CONSIDERATIONS:
For systems that are used in medicine a double failure protection has to be guaranteed.
While the Prometheus system has two barriers between the cellulose microparticles and
the human body (filter membrane at the end of the capsule and the Filter of the Albuflow (
black bars, Fig .12a)) .
In contrast the particles in the MDS are only separated from the body by the Albuflow
membrane. To guarantee double failure protection a microparticle detector is attached
after the plasma filter. (black bars, Fig. 12b).

Viktoria Maria Enk page 27 of 130 Dominic-Philipp Klein
Figure 12 Comparison of Prometheus´and MDS´ safety
The microparticle detector is capable of detecting fluorescence signals. For that reason
1% (vol/vol) of the adsorber particles are fluorescent, magnetic cellulose microparticles.
In case of malfunction of the plasma filter the microparticle detector detects a fluorescence
signal and stops the pumps. To increase the sensitivity of the detector the fluorescence
particles are magnetized and can be concentrated in front of the detector by a magnetic
trap. [9] [10]
Viktoria Maria Enk page 28 of 130 Dominic-Philipp Klein
3.7 AIMS OF THIS STUDY:
Optimum suitable particles should have the following properties:
• Size <5µm
• No or only minor aggregations
• A similar density as non-magnetic celluloses to achieve an even distribution of the
magnetic particles all over the plasma circuit
• Accumulation beneath the magnet in less than five seconds [12]
The aim of our work was to improve the synthesis of the magnetic particles by trying
different types of coatings (Methylcellulose or Polyethylenglycol).
The variation of the washing process (use of albumin-solution, PBS-solution or water) to
reduce agglomerations was also an important influence on the results. The standard
procedure was modified as showed in the figure above. All of the synthesized particles
should be tested for magnetic properties, density and agglomeration.
Agglomerations can be detected through particle size distribution measurement with the
Mastersizer 2000. The Mastersizer 2000 is a device for the testing of microparticle size
distribution by laser light diffraction.
The magnetic behaviour is tested with a permanent magnet that is also used in the
magnetic trap assembled in the MDS. The time until the suspension has cleared has to be
less than 5 seconds otherwise in practical use particles could enter the body and cause
embolism.
It should also be tested whether an ultrasonic bath prevents particle aggregations.

Viktoria Maria Enk page 29 of 130 Dominic-Philipp Klein
Further analysis should be the determination of dry mass and density of magnetic
celluloses, unmodified celluloses and hydrophobic HPR10 adsorber.
Large differences in density could cause an unbalanced distribution of the magnetic
particles in the solution. As a result the magnetic particles could flow slower through the
circuit and pass the trap later than the normal particles. Because of this the detection could
be too late to prevent the trespass of some particles into the body.

Viktoria Maria Enk page 30 of 130 Dominic-Philipp Klein
4. Materials and Methods
4.1 MATERIALS
All Materials required for the experiments:
4.1.1 DEVICES
Centrifuges:
1) Hettich Universal 32 R
rotor nr: 1617
rotor radius: 120mm
maximum acceleration to: 1199g
2) Hettich Universal Rotanta 460 R
rotor nr: 5624
rotor radius: 196mm
maximum acceleration to: 4637g
inserts: 4839 for 15ml Greiner tubes
4840 for 50ml Greiner tubes
3) Heraeus Megafuge 10 R
rotor nr: 2702
rotor radius: 169mm
maximum acceleration to: 3023g
Viktoria Maria Enk page 31 of 130 Dominic-Philipp Klein
Mastersizer 2000, Malvern Instruments, Herrenberg, Germany
Pipettes:
10 – 100µl (Eppendorf research)
100 – 1000µl (Eppendorf research)
100µl (Eppendorf research)
1000µl (Eppendorf research)
5000µl (Eppendorf research)
Balances:
1) Kern&Sohn 770 analytical balance
2) Kern&Sohn K8 precision balance
magnetic stir sticks (20mm, 30mm, 40mm)
Vortex Mixer, LabMixer Ms2, IKA®
Magetic Stirrers:
1) yellow line MST basic
2) IKA® PCT basic
3) IKA® RT10 power
4) IKA® big squid froggy
5) IKA® MS1 Minishaker
Ultra Turrax Dispenser:
engine: yellow line DI 25 basic
dispersing tools: IKA® 1024200 S25N-8G
IKA® 0593400 S25N-18G

Viktoria Maria Enk page 32 of 130 Dominic-Philipp Klein
Glass Ware:
beakers (Schott Duran,100ml, 250ml)
erlenmeyer flasks (Schott Duran, 250ml)
petri dishes (ø 80mm)
graduated cylinder (Schott, 100ml, 250ml)
pasteur pipettes
Ultrospec 3300 pro UV/VIS–spectrometer, Amersham Bioscience,
Freiburg, Germany
Enviro Genie® shaking bench and incubator, Scientific Industries Inc.
Reverse-Osmosis-Supply:
device: euRO 20DI, SG Wasseraufbreitungs und Regnerier GmbH
article nr. 3001-DI, serial nr. 83275-01
modules: AMB Modul, prod. nr. 2057
VMD Modul, prod. nr. 2050
Permanent Magnet, field strength 1T
Nikon Coolpix L100, Nikon GmbH, Düsseldorf, Germany
4.1.2 SINGLE USE MATERIALS
centrifugation tubes (polypropylene, 15ml, 50ml)
Greiner Bio-One GmbH, Frickenhausen, Germany

Viktoria Maria Enk page 33 of 130 Dominic-Philipp Klein
pipette tips (polypropylene, 100µl, 1000µl, 5000µl)
Eppendorf AG, Hamburg, Germany
laboratory film (Parafilm® M)
Sigma-Aldrich, Fluka analytical, Buchs, Switzerland
4.1.3 CHEMICAL SUBSTANCES
substance consistence source product nr. LOT
cellulose microparticles in 20%(v/v) TU Dresden,
<5µm ethanol and
water
(Institute of Plant- and
Wood Chemistry)
PCKT 047 #1908
Germany
Dynabeads® M-280 Dynal Biotech
ASA,
Tosylactivated in water Oslo, Norway 301.01 H11102
osmosis water supplied by euRO 20DI reverse-osmosis-system

Viktoria Maria Enk page 34 of 130 Dominic-Philipp Klein
0,9%(w/w) Fresenius sodium chloride
in water Bad Homburg,
Germany
0698121/02A 14CK1004
iron-(II)-sulphate Sigma Aldrich,
heptahydrate Fluka analytical
purum p.a. Buchs,
Switzerland
44980 #0001320556
iron-(III)-chloride Sigma Aldrich,
hexahydrate Fluka analytical
purum p.a. Buchs,
Switzerland
31232 SZB91390
0,1 mol/L in water Sigma Aldrich,
f = 0,987 Fluka analytical sulfuric acid
Buchs,
Switzerland
38295 65596JJ
Sigma Aldrich,
Fluka analytical sodium hydroxide
purum p.a. Buchs,
Switzerland
71691 #72190

Viktoria Maria Enk page 35 of 130 Dominic-Philipp Klein
Sigma Aldrich,
Fluka analytical ammonium hydroxide
5,01 mol/L in water
Buchs, Switzerland
318612 22897JJ
albumin Sigma Aldrich,
(from bovines serum) Fluka analytical
purity: >96%(w/w)
Buchs, Switzerland
A3912 #028K0667
Sigma Aldrich,
Fluka analytical phophate buffered saline
tablet Buchs,
Switzerland
P4417 #107K8217
„One tablet dissolved in 200ml of deionized water yields 0.01M phosphate buffer.“
polyethylene glycol Sigma Aldrich,
(average mol weight 200g/mol) Fluka analytical
/
Buchs, Switzerland
P3015 # 029K0174
methylcellulose Sigma Aldrich,
(Methocel MC 1200-1800 mPas) Fluka analytical
(mol weight 204,22 g/mol)
/
Buchs, Switzerland
24645 #9004675
Table 1: chemicals used in the experiments

Viktoria Maria Enk page 36 of 130 Dominic-Philipp Klein
4.2 METHODS
Figure 13: synthesis chain [12] [13]

Viktoria Maria Enk page 37 of 130 Dominic-Philipp Klein
4.2.1 SYNTHESIS OF MAGNETIC CELLULOSE MICROPARTICLES
All experiments were carried out with reverse osmosis water (in further text: water) at room
temperature if there are no variations sighted.
4.2.1.1 Purification of Cellulose Microparticles
The particles were supplied in an ethanol suspension.
To remove the ethanol, the cellulose microparticles were washed with water by
shaking and an additional centrifugation step (2839g, 20 min). The supernatant was
decanted and the cellulose sediment was resuspended in fresh water. The
procedure was repeated until the supernatant was clear and foamless.
The cellulose microparticles were resuspended in water again and incubated over
night at 30°C on a shaking bench.
The suspension was centrifuged (2839g, 20min) again and the supernatant was
analyzed by UV/VIS-spectrometry at 280 nm (verification step of tensids). If no
peak was visible the sample was free of tensids as is should be
For further experiments, a homogeneous 50% (v/v) cellulose microparticle
suspension in water was prepared. [12]

Viktoria Maria Enk page 38 of 130 Dominic-Philipp Klein
4.2.1.2 Magnetization of Cellulose Microparticels by Alkaline (Precipitation of Magnetite in Cellulose Pores)
Fe2+ + 2 Fe3+ + 8 OH- Fe3O4 + 4 H2O
Preparation of Iron Solutions
4mol/L FeCl3 * 7H2O: 54g of FeCl37H2O were dissolved in 50mL of water to obtain
a 4mol/L ferric solution.
2mol/L of FeSO4 * 6H2O: 28 g of FeSO46H2O were dissolved in 50mL of
0.1mol/L H2SO4 to obtain a 2mol/L ferrous solution. [12] [13]
Soaking Procedure
2mL of the 50% (v/v) cellulose microparticle suspension (~1g wet microparticles, in
50mL centrifugation tube) were combined with 12mL
4mol/L ferric and 12mL 2mol/L ferrous solution. To remove oxygen from the
reaction mixture it was vented with gaseous nitrogen. The iron-soaked cellulose
suspension was gently mixed and incubated on a shaking bench over night at 30
°C.
After the incubation step, the suspension was centrifuged (2839g, 20min) and the
supernatant was decanted. The iron-soaked cellulose microparticle sediment was
used for further experiments [12][13]

Viktoria Maria Enk page 39 of 130 Dominic-Philipp Klein
4.2.1.2.1 Impregnation methods
To test if particle aggregation can be prevented, protective colloids were added to
the iron-soaked cellulose microparticle sediment before the precipitation step.
a) no protective colloid
For the comparison of the efficiency of different protective colloids, experiments
were carried out without any additives in the first test series.
b) methylcellulose
1mL of a 0.5%(w/v) methylcellulose solution was added to the iron-soaked cellulose
microparticle sediment. The mixture was homogenized before the precipitation step.
Figure 14: experimental setting for the oxygen removal (degassing)

Viktoria Maria Enk page 40 of 130 Dominic-Philipp Klein
c) polyethylene glycol
1mL of polyethylene glycol was added to the iron-soaked cellulose microparticle
sediment. The mixture was homogenized before the precipitation step. [13]
4.2.1.2.2 Precipitation of Iron-Soaked Cellulose Microparticles in Alkaline Medium
a) Precipitation in sodium hydroxide
In order to precipitate the magnetite in the cellulose pores 20mL of a 1mol/L sodium
hydroxide solution was added to the iron-soaked cellulose microparticles.
In one experiment the precipitation was supported with an Ultra Turrax dispenser
(“+UT”), in another the reaction mixture was simply homogenized with a vortex
labmixer (“-UT”).
b) Precipitation in ammonium hydroxide
In order to precipitate the magnetite in the cellulose pores 20mL of a
1mol/L ammonium hydroxide solution was added to the iron-soaked cellulose
microparticles.
In one experiment the precipitation was supported with an Ultra Turrax dispenser
(“+UT”), in another the reaction mixture was simply homogenized with a vortex
labmixer (“-UT”). [13]

Viktoria Maria Enk page 41 of 130 Dominic-Philipp Klein
4.2.1.3 Washing of the Magnetic Cellulose Microparticles
a) washing in water
The magnetized particles (obtained from 4.2.1.2) were aliquoted in portions of 5g
per 15mL centrifugation tube. The sediment was resuspended in 5mL of water
(eluent) and centrifuged (2839g, 10min). The supernatant was decanted. This
washing step was repeated three times.
Thereafter the sediment was resuspended in 5ml of water and incubated on a
shaking bench for 2 hours at 30°C.
The suspension was centrifuged (2839g, 10min.) and the sediment washed once
again with 5mL of water. The microparticle sediment was resuspended and
incubated over night (shaking bench, 30°C).
The tubes were centrifuged (2839g, 10min) again, and resuspended in 50mL of
water.
b) bovines albumin solution (1mg/mL)
The washing procedure with bovines albumin solution (1mg/mL) follows the
procedure described in 4.2.1.3 a), using bovines albumin solution (1mg/mL) instead
of water.
c) phosphate buffer solution (pH 7.4, 0.01mol/L)
The washing procedure with phosphate buffer solution (pH 7.4, 0.01mol/L) follows
the procedure described in 4.2.1.3 a), using phosphate buffer solution (pH 7.4,
0.01mol/L) instead of water.

Viktoria Maria Enk page 42 of 130 Dominic-Philipp Klein
To obtain a 100mg/mL suspension of magnetic microparticles in water ,bovines
albumin solution (1mg/mL) or phosphate buffer solution (pH 7.4, 0.01mol/L), 1mL of
the eluent was withdrawn and mixed with 4 mL of fresh eluent. [12] [14]
4.2.3 CHARACTERISATION OF MAGNETIC CELLULOSE MICROPARTICLES
4.2.3.1 Visual Characteristics
The color of the supernatant and of the microparticle sediment was determined after
the last centrifugation step in 4.2.1.3.
As another characteristic, the simplicity of the resuspension in the last washing step
of 4.2.1.3 was recorded.
To get further information about the particles aggregation behavior, the particles
that showed the best results in former analysis were sent to the TU Dresden where
they were imaged by scanning electron microscopy. [15]
4.2.3.3 Determination of the Particles Size and Size Distribution
The measurement was carried out with a “mastersizer 2000” device from Malvern
Instruments (www.malvern.de), using red, green and blue wavelength lasers
(focused light).
The particles were treated 0,5 and 10 minutes by ultra sound before the
measurement. [14]

Viktoria Maria Enk page 43 of 130 Dominic-Philipp Klein
4.2.3.2 Determination of the Magnetic Behavior
A permanent magnet with the field strength of 1T was attached to the centrifugation
tube containing the homogeneous 100mg/mL suspension obtained in 4.2.1.3.
The time span was recorded that the particles took to form first signs of
inhomogeneity in the suspension.
If the suspension showed no inhomogeneity within 10 seconds the measurement
was aborted. [14]
As a reference the “Dynabeads® M-280 Tosylactivated” (www.invitrogen.com)
which took 3 to 4 seconds to first remarkable inhomogeneity, were used.
Figure 15: magnetic cellulose microparticle suspension
Figure 16: assembly of measurement & time-stop-point
Figure 17: completely separated microparticles
(for the visualisation of this measurement see video:
measurement_mag_behavior.mov on the attached CD)

Viktoria Maria Enk page 44 of 130 Dominic-Philipp Klein
4.2.3.4 Determination of the Dry Matter Content
The homogeneous 100mg/mL suspension obtained in 4.2.1.3 was centrifuged
(2839g, 20min). The obtained particle sediment was transferred to a glass petri dish
(the particle weight recorded) and dried at 105°C until constant weight (max. 0,5mg
difference within one hour at 105°C). [14]
4.2.3.5 Determination of the Particles Density
The necessary pyknometers were dried with cotton swabs and left stand overnight.
This process was repeated after each measurement for further experiments.
At first the net weight ( mP ) of the pyknometer was measured.
Approximately 0,5g of the to-be-measured solid substance was weighted into the
pyknometer and the weight (pyknometer + solid substance) recorded. ( mP+S )
The solid substance (dry matter) for this analysis was obtained in 4.2.3.4.
The pyknometer was completely filled with water so that no bubbles rested in
between the solid or at the pyknometers inner wall. The weight (pyknometer + solid
substance + water) was recorded. ( mP+S+W )
The pyknometer was emptied and washed with water, at least it was filled up with
water and the weight (pyknometer + water) was determined. ( mP+W ) [14]

Viktoria Maria Enk page 45 of 130 Dominic-Philipp Klein
Figure 18: net weight of
pyknometer
Figure 19: pyknometer containing
the solid substance
Figure 20: pyknometer
containing the
solid filled up
with water
Figure 21: pyknometer filled
with water

Viktoria Maria Enk page 46 of 130 Dominic-Philipp Klein
As a reference the density of a commercially available adsorber microparticle
(hydrophobic HPR10) was recorded.
The density of the solid substance was determined by entering the recorded
weights into the formula:

Viktoria Maria Enk page 47 of 130 Dominic-Philipp Klein
5. RESULTS
5.1 GUIDELINES FOR INTERPRETATION OF THE RESULTS
5.1.1 THE MAGNETIC MICROPARTICLES WERE ANALYZED ACCORDING TO THE FOLLOWING ASPECTS:
• Colour (qualitative, indirect method)
• Particle size distribution (Mastersizer 2000)
• Magnetic properties (permanent magnet)
• Morphology ( scanning electron microscopy)
• For additional information:
o Density
o Dry matter content
[15]

Viktoria Maria Enk page 48 of 130 Dominic-Philipp Klein
5.1.2 OVERVIEW OF THE PROCESSES:
Figure 22: overview of treatments used for the preparation of magnetic cellulose
microparticles
“UT”... Ultraturrax
Figure 22 gives an overview of treatments that were used for the preparation of
magnetic microparticles. Cellulose microparticles were magnetized through
treatment with iron-solutions.
Afterwards they were protected with different impregnations (methylcellulose,
polyethylenglycol or no impregnation). The washing process was also variegated.
Water, albumin-solution or PBS were used for washing. [13]

Viktoria Maria Enk page 49 of 130 Dominic-Philipp Klein
5.1.3 AN OPTIMAL SUITABLE PARTICLE SHOULD HAVE FOLLOWING PROPERTIES:
• Size <5µm
• No or just minimal aggregations
• A similar density as non-magnetic celluloses to achieve an even distribution of the
magnetic particles all over the plasma circuit
• Accumulation beneath the magnet that is used in the magnetic trap in less than five
seconds. [14]
5.2. RESULTS
5.2.1 VISUAL CHARACTERISTICS- PRE TESTS
The visual characteristics were not decisive if a particle is suitable for use in the system,
they were just acting as a brief pilot test.
The color of the particles should be preferably dark. Reddish looking particles indicate
oxidations that decrease the magnetic properties.
Most of the particles had a slight shimmer of red. This is caused by the presence of
molecular oxygen during the precipitation which could have been cause by incomplete
removal of oxygen.
The resuspension behavior depended on the washing agent. When the particles were
washed with PBS, sucking and extruding with a syringe was necessary to resuspend the
particles completely.
Particles that were washed with water could mostly be resuspended with the vortex,
sometimes an initial mechanical help was required. The supernatant was slightly colored
but not as intensively as the one from washing steps with albumin. The particles that were
washed with albumin solution could be resuspended by shaking the tube gently. [10]

Viktoria Maria Enk page 50 of 130 Dominic-Philipp Klein
5.3.1 Uncoated Particles
The following tables give an overview of colour and behaviour of the particles
depending on the precipitation steps.
Washed with Albumin:
Precipitation
NaOH+ UT NH4OH+ UT NaOH- UT NH4OH- UT
supernatant yellow-orange-
brown;
Clear
yellow-orange-
brown
Clear
particle behavoir
easy to suspend
easy to suspend
easy to suspend easy to suspend
colour of resuspended
particles
dirty brown with
a shimmer of
red
black with a
shimmer of red-
brown
dirty brown with
a shimmer of
red
similar to
NH4OH+ UT,
but a little bit
lighter
Table 2: uncoated particles washed with Albumin

Viktoria Maria Enk page 51 of 130 Dominic-Philipp Klein
Washed with reverse osmosis water:
Precipitation
NaOH+ UT NH4OH+ UT NaOH- UT NH4OH- UT
supernatant less coloured than with albumin but also visibly yellow- orange- brown
coloration
particle behavoir
particles easier to suspend than in PBS, but not as easy as in albumin
colour of resuspended
particles dirty brown with a shimmer of red
Table 3: uncoated particles washed with reversed osmosis water
Washed with PBS:
Precipitation
NaOH+ UT NH4OH+ UT NaOH- UT NH4OH- UT
supernatant clear
particle behavoir
particles are hard to suspend, vortex needed
colour of resuspended
particles dirty brown with a shimmer of red
Table 4: uncoated particles washed with PBS
Viktoria Maria Enk page 52 of 130 Dominic-Philipp Klein
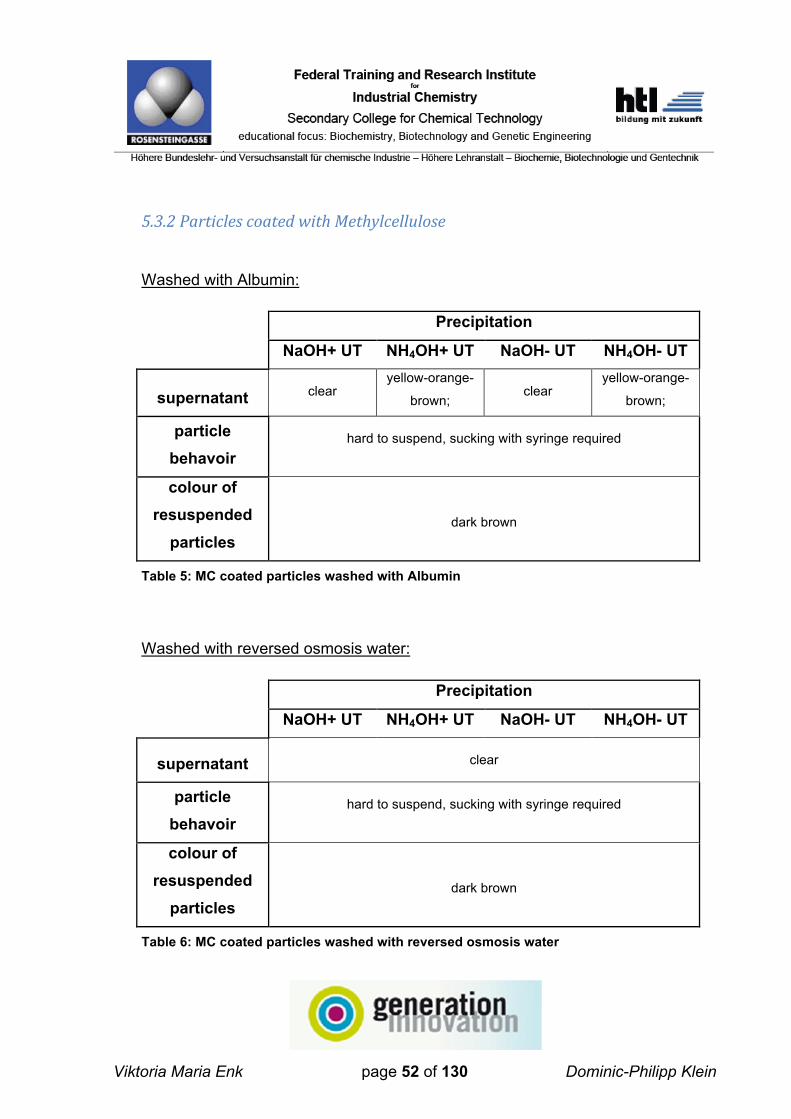
5.3.2 Particles coated with Methylcellulose
Washed with Albumin:
Precipitation
NaOH+ UT NH4OH+ UT NaOH- UT NH4OH- UT
supernatant clear yellow-orange-
brown; clear
yellow-orange-
brown;
particle behavoir
hard to suspend, sucking with syringe required
colour of resuspended
particles dark brown
Table 5: MC coated particles washed with Albumin
Washed with reversed osmosis water:
Precipitation
NaOH+ UT NH4OH+ UT NaOH- UT NH4OH- UT
supernatant clear
particle behavoir
hard to suspend, sucking with syringe required
colour of resuspended
particles dark brown
Table 6: MC coated particles washed with reversed osmosis water

Viktoria Maria Enk page 53 of 130 Dominic-Philipp Klein
Washed with PBS:
Precipitation
NaOH+ UT NH4OH+ UT NaOH- UT NH4OH- UT
supernatant clear
particle behavoir
hard to suspend, sucking with syringe required
colour of resuspended
particles dark brown
Table 7: MC coated particles washed with PBS
As shown in table 2 to 7 all the color of all the particles was dark brown. The
supernatants were mostly clear, just two tubes that were washed with albumin had
a slightly orange supernatant. Their ability to resuspend them was similar with all
washing agents. All of them were very hard to suspend.
Viktoria Maria Enk page 54 of 130 Dominic-Philipp Klein
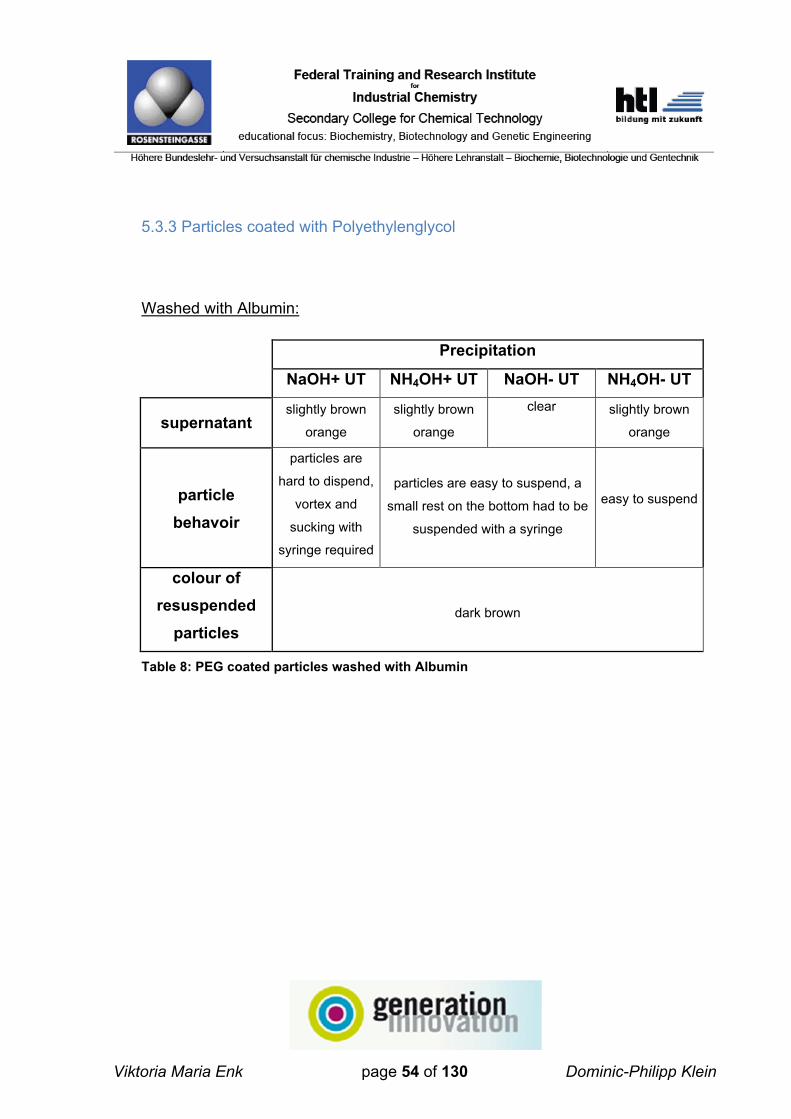
5.3.3 Particles coated with Polyethylenglycol
Washed with Albumin:
Precipitation
NaOH+ UT NH4OH+ UT NaOH- UT NH4OH- UT
supernatant slightly brown
orange
slightly brown
orange
clear slightly brown
orange
particle behavoir
particles are
hard to dispend,
vortex and
sucking with
syringe required
particles are easy to suspend, a
small rest on the bottom had to be
suspended with a syringe
easy to suspend
colour of resuspended
particles dark brown
Table 8: PEG coated particles washed with Albumin

Viktoria Maria Enk page 55 of 130 Dominic-Philipp Klein
Washed with reversed osmosis water:
Precipitation
NaOH+ UT NH4OH+ UT NaOH- UT NH4OH- UT
supernatant slightly brown
orange clear slightly brown
orange clear
particle behavoir
particles are
hard to dispend,
vortex and
sucking with
syringe required
particles are
easy to
suspend, a
small rest on the
bottom had to
be suspended
with a syringe
particles are hard to dispend,
vortex and sucking with syringe
required
colour of resuspended
particles dark brown
Table 9: PEG coated particles washed with reversed osmosis water

Viktoria Maria Enk page 56 of 130 Dominic-Philipp Klein
Washed with PBS:
Precipitation
NaOH+ UT NH4OH+ UT NaOH- UT NH4OH- UT
supernatant clear
particle behavoir
particles are
hard to dispend,
vortex and
sucking with
syringe required
easy to
suspend, a
small rest on the
bottom had to
be suspended
with a syringe
particles are
hard to dispend,
vortex and
sucking with
syringe required
particles are
easy to suspend
with vortex
colour of resuspended
particles dark brown
Table 10: PEG coated particles washed with PBS
As it can be seen in table 8 to table 10 the particles coated with PEG were dark
brown so it can be said that no oxidation had occurred. The particles weren´t as
compact as when coated with methylcellulose, but not as easy to suspend as
uncoated particles. It can also be said that the supernatants when washed with
albumin or water were colored in most cases, when washed with PBS they were
clear.

Viktoria Maria Enk page 57 of 130 Dominic-Philipp Klein
5.2.2 SCANNING ELECTRON MICROSCOPY PICTURES
The pictures below show whether agglomerations had occurred in the samples or
not. The scanning electron microscopy was performed at the Technical University
of Dresden. Results and interpretations were forwarded to us via E-Mail. [11]
Figure 23: difference between unaggregated and aggregated particles
Figure 23 shows the interpretation of the scanning electron microscopy. The difference
between aggregated particles and unaggregated particles can be seen clearly.

Viktoria Maria Enk page 58 of 130 Dominic-Philipp Klein
Sample 1: uncoated, precipitated with NH4OH with ultraturrax, washed with H2O
Figure 24: Sample 1: uncoated, precipitated with NH4OH with ultraturrax, washed with H2O

Viktoria Maria Enk page 59 of 130 Dominic-Philipp Klein
Figure 25: Sample 1: uncoated, precipitated with NH4OH with ultraturrax, washed with H2O

Viktoria Maria Enk page 60 of 130 Dominic-Philipp Klein
Sample 2: uncoated, precipitated with NH4OH without ultraturrax, washed with H2O
Figure 26: Sample 2: uncoated, precipitated with NH4OH without ultraturrax, washed with H2O
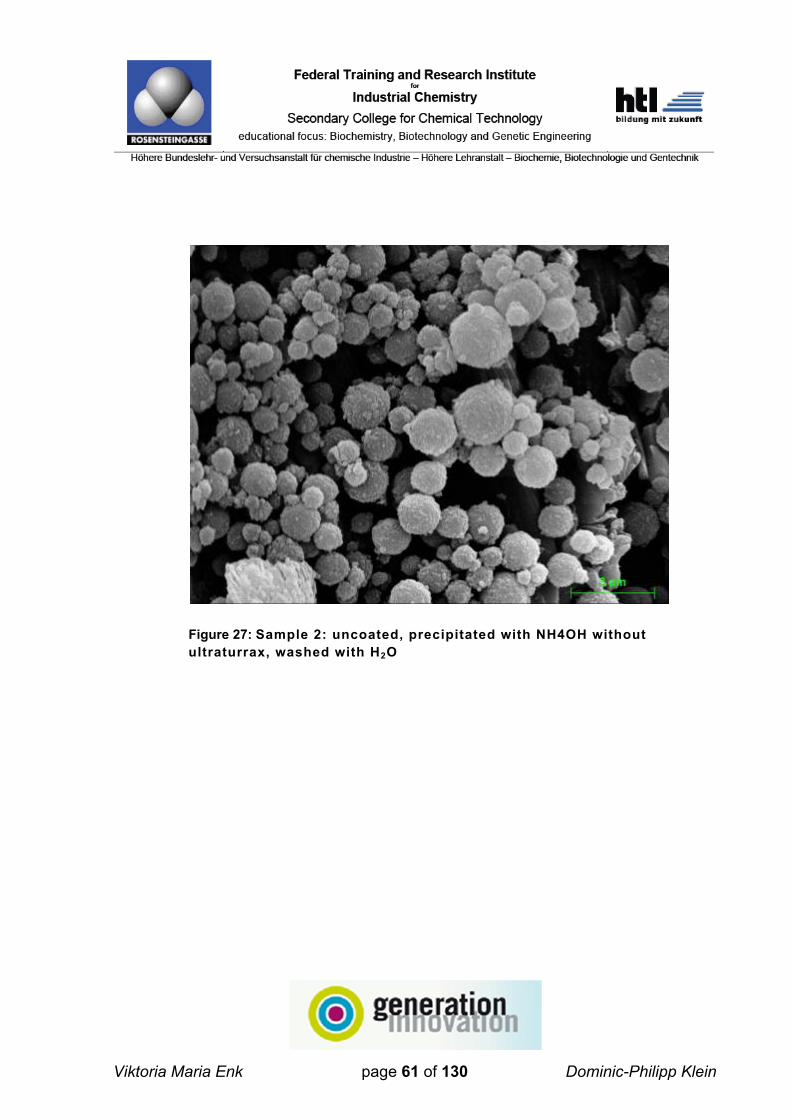
Viktoria Maria Enk page 61 of 130 Dominic-Philipp Klein
Figure 27: Sample 2: uncoated, precipitated with NH4OH without ultraturrax, washed with H2O

Viktoria Maria Enk page 62 of 130 Dominic-Philipp Klein
Sample 3: Coated with methylcellulose, precipitated with NH4OH with ultraturrax, washed with H2O
Figure 28: Coated with methylcellulose, precipitated with NH4OH with ultraturrax, washed with H2O

Viktoria Maria Enk page 63 of 130 Dominic-Philipp Klein
Figure 29: Coated with methylcellulose, precipitated with NH4OH with
ultraturrax, washed with H2O

Viktoria Maria Enk page 64 of 130 Dominic-Philipp Klein
Sample 4: Coated with methylcellulose, precipitated with NH4OH without ultraturrax, washed with H2O
Figure 30: Coated with methylcellulose, precipitated with NH4OH without ultraturrax, washed with H2O

Viktoria Maria Enk page 65 of 130 Dominic-Philipp Klein
Figure 31: Coated with methylcellulose, precipitated with NH4OH without ultraturrax, washed with H2O

Viktoria Maria Enk page 66 of 130 Dominic-Philipp Klein
Sample 5: Coated with polyethylenglycol, precipitated with NH4OH with ultraturrax, washed with H2O
Figure 32: Coated with polyethylenglycol, precipitated with NH4OH with ultraturrax,
washed with H2O

Viktoria Maria Enk page 67 of 130 Dominic-Philipp Klein
Figure 33: Coated with polyethylenglycol, precipitated with NH4OH with ultraturrax,
washed with H2O
The pictures from scanning electron microscopy (Fig. 24-33) show that almost all
particles are smaller than 5µm. The size varies from 0,5µm to 3µm. [15]

Viktoria Maria Enk page 68 of 130 Dominic-Philipp Klein
5.2.3 DETERMINATION OF THE MAGNETIC BEHAVIOUR
5.2.3.1 uncoated cellulose microparticles:
When the particles are concentrated by a permanent magnet the solution has to be
clear in less than 5 seconds, otherwise the particles aren´t suitable for clinical use. If
the system was leaky, too many particles could trespass into the body in more than
five seconds. [8] [9]
Washed with Albumin:
Precipitation
NaOH NH4OH
using UT > 10s > 10s 6s 5s
without
using UT > 10s > 10s 7s 4s
Table 11: magnetic behaviour of uncoated particles
washed with albumin
Washed with reversed osmosis water:
Precipitation
NaOH NH4OH
using UT > 10s > 10s 3s 2s
without
using UT > 10s > 10s 3s 4s
Table 12: magnetic behaviour of uncoated particles washed with reversed osmosis water

Viktoria Maria Enk page 69 of 130 Dominic-Philipp Klein
Washed with PBS:
Precipitation
NaOH NH4OH
using UT > 10s 9s 2s 4s
without
using UT > 10s > 10s 6s 5s
Table 13: magnetic behaviour of uncoated particles
washed with PBS
In general precipitation of the particles with NH4OH was the best (Table 11-13, right
side) and the use of the ultraturrax made it even better. The use of water and PBS
for washing showed the best results. As it can be seen in table 10 the use of
albumin for washing didn´t lead to suitable particles.
5.2.3.2 cellulose microparticles coated with methlycellulose:
Washed with Albumin:
Precipitation
NaOH NH4OH
using UT > 10s > 10s > 10s > 10s
without
using UT > 10s > 10s 7s 8s
Table 14: magnetic behaviour of MC-coated particles
washed with albumin

Viktoria Maria Enk page 70 of 130 Dominic-Philipp Klein
Washed with reversed osmosis water:
Precipitation
NaOH NH4OH
using UT 4s 5s > 10s > 10s
without
using UT 3s 2s 8s 10s
Table 15: magnetic behaviour of MC-coated particles
washed with reversed osmosis water
Washed with PBS:
Precipitation
NaOH NH4OH
using UT > 10s > 10s > 10s > 10s
without
using UT > 10s > 10s 7s 5s
Table 16: magnetic behaviour of MC-coated particles
washed with PBS

Viktoria Maria Enk page 71 of 130 Dominic-Philipp Klein
5.2.3.3 cellulose microparticles coated with PEG:
Washed with Albumin:
Precipitation
NaOH NH4OH
using UT > 10s > 10s > 10s > 10s
without
using UT > 10s > 10s 6s 6s
Table 17: magnetic behaviour of PEG-coated particles
washed with albumin
Washed with reversed osmosis water:
Precipitation
NaOH NH4OH
using UT > 10s > 10s 3s 3s
without
using UT > 10s > 10s 2s 1s
Table 18: magnetic behaviour of PEG-coated particles
washed with reversed osmosis water

Viktoria Maria Enk page 72 of 130 Dominic-Philipp Klein
Washed with PBS:
Precipitation
NaOH NH4OH
using UT 8s 9s 7s 6s
without
using UT 7s 7s 3s 3s
Table 19: magnetic behaviour of PEG-coated particles
washed with PBS

Viktoria Maria Enk page 73 of 130 Dominic-Philipp Klein
5.2.4 DETERMINATION OF THE PARTICLE SIZE AND SIZE DISTRIBUTION
The particle size distribution was determined by the Mastersizer and interpreted as follows:
• d(0,1) means that 10% of the particles are smaller than the given size. It can be
said that green labeled particles have no or just minimal aggregations
• d(0,5) means that 50% of the particles are smaller than the given size. Yellow
particles are also suitable for further analyses (e.g. ultrasonic bath) to test whether
the non-optimal size distribution has an influence on other important parameter
such as magnetic behavior.
• d(0,9) means that 90% of the particles are smaller than the given size. Red labeled
particles should not be used in the system if other (better) particles are available.
The d-values are the results that are printed out after measuring the samples with the
Mastersizer. The d(0,9)-value was taken for comparing the results. [14]

Viktoria Maria Enk page 74 of 130 Dominic-Philipp Klein
5.2.4.1 Guidelines for the colorous labeling:
If d(0,9) has a value of less than 20 the labeling is green, if it is less than 100, the
labeling is yellow, and if the value exceeds 100 it is labeled red. If the d(0,9) is low,
most of the particles are not aggregated. If the value is high, big particles
(aggregations) have been measured.
d(0,9)<20…green
Figure 34: Example for green labelling
(no significant aggregations)
d(0,9)<100…yellow
Figure 35: Example for yellow labelling
(some aggregations visible, particle can be used)

Viktoria Maria Enk page 75 of 130 Dominic-Philipp Klein
d(0,9)>100… red
Figure 36: Example for red labelling
(many aggregations visible)
[9] [10]
5.2.4.1.1 unmodified cellulose- microparticles:
d(0,1)= 0,996 µm d(0,5)= 1,465 µm d(0,9)= 2,183 µm
Figure 37: unmodified cellulose- microparticles
The figure above shows the size distribution of the unmodified cellulose
microparticles after conditioning with water.

Viktoria Maria Enk page 76 of 130 Dominic-Philipp Klein
5.2.4.2 uncoated cellulose microparticles
Precipitated with NaOH without ultraturrax, washed with albumin
d(0,1)= 1,358 µm d(0,5)= 3,255 µm d(0,9)= 11,866 µm
Figure 38: uncoated cellulose microparticles precipitated
with NaOH without ultraturrax, washed with albumin
In the figure above few agglomerations could be detected so the particle has
to be subjected to further analyses to clarify whether the other parameters
are as good as the size distribution.

Viktoria Maria Enk page 77 of 130 Dominic-Philipp Klein
Precipitated with NH4OH without ultraturrax, washed with albumin
d(0,1)= 1,814 µm d(0,5)= 4,924 µm d(0,9)= 125,398 µm
Figure 39: uncoated cellulose microparticles precipitated
with NH4OH without ultraturrax, washed with albumin
The figure above shows a high degree of agglomerations of the particles.
Therefore these particles cannot be used for further analyses.

Viktoria Maria Enk page 78 of 130 Dominic-Philipp Klein
Precipitated with NaOH with ultraturrax, washed with albumin
d(0,1)= 1,467 µm d(0,5)= 3,089 µm d(0,9)= 10,149 µm
Figure 40: uncoated cellulose microparticles precipitated
with NaOH with ultraturrax, washed with albumin
In the figure above few agglomerations could be detected so the particle has
to be subjected to further analyses to clarify whether the other parameters
are as good as the size distribution.

Viktoria Maria Enk page 79 of 130 Dominic-Philipp Klein
Precipitated with NH4OH with ultraturrax, washed with albumin
d(0,1)= 1,448 µm d(0,5)= 3,368 µm d(0,9)= 140,947 µm
Figure 41: uncoated cellulose microparticles precipitated with NH4OH with ultraturrax, washed with albumin
The figure above shows a high degree of agglomerations of the particles.
Therefore these particles cannot be used for further analyses.

Viktoria Maria Enk page 80 of 130 Dominic-Philipp Klein
Precipitated with NaOH without ultraturrax, washed with PBS
d(0,1)= 1,857 µm d(0,5)= 7,795 µm d(0,9)= 149,763 µm
Figure 42: uncoated cellulose microparticles precipitated
with NaOH without ultraturrax, washed with PBS
The figure above shows a high degree of agglomerations of the particles.
Therefore these particles cannot be used for further analyses.

Viktoria Maria Enk page 81 of 130 Dominic-Philipp Klein
Precipitated with NH4OH without ultraturrax, washed with PBS
d(0,1)= 1,428 µm d(0,5)= 3,543 µm d(0,9)= 87,400 µm
Figure 43: uncoated cellulose microparticles precipitated
with NH4OH without ultraturrax, washed with PBS
In the figure above some agglomerations are visible but the particles can be
used for further analyses.

Viktoria Maria Enk page 82 of 130 Dominic-Philipp Klein
Precipitated with NaOH with ultraturrax, washed with PBS
d(0,1)= 1,616 µm d(0,5)= 4,569 µm d(0,9)= 70,036 µm
Figure 44: uncoated cellulose microparticles precipitated with NaOH with ultraturrax, washed with PBS
In the figure above some agglomerations are visible but the particles can be
used for further analyses.

Viktoria Maria Enk page 83 of 130 Dominic-Philipp Klein
Precipitated with NH4OH with ultraturrax, washed with PBS
d(0,1)= 1,248 µm d(0,5)= 2,545 µm d(0,9)= 173,469 µm
Figure 45: uncoated cellulose microparticles precipitated with NH4OH with ultraturrax, washed with PBS
The figure above shows a high degree of agglomerations of the particles.
Therefore these particles cannot be used for further analyses.

Viktoria Maria Enk page 84 of 130 Dominic-Philipp Klein
Precipitated with NH4OH with ultraturrax, washed with H2O
d(0,1)= 1,560 µm d(0,5)= 2,985 µm d(0,9)= 7,851 µm
Figure 46: uncoated cellulose microparticles precipitated with NH4OH with ultraturrax, washed with H2O
In the figure above few agglomerations could be detected so the particle has
to be subjected to further analyses to clarify whether the other parameters
are as good as the size distribution.

Viktoria Maria Enk page 85 of 130 Dominic-Philipp Klein
Precipitated with NaOH without ultraturrax, washed with H2O
d(0,1)= 2,111 µm d(0,5)= 5,279 µm d(0,9)= 58,183 µm
Figure 47: uncoated cellulose microparticles precipitated
with NH4OH without ultraturrax, washed with H2O
In the figure above some agglomerations are visible but the particles can be
used for further analyses.

Viktoria Maria Enk page 86 of 130 Dominic-Philipp Klein
Precipitated with NaOH with ultraturrax, washed with H2O
d(0,1)= 1,986 µm d(0,5)= 3,926 µm d(0,9)= 21,586 µm
Figure 48: uncoated cellulose microparticles precipitated
with NaOH with ultraturrax, washed with H2O
In the figure above few agglomerations could be detected so the particle has
to be undertaken further analyses to clarify whether the other parameters are
as good as the size distribution.

Viktoria Maria Enk page 87 of 130 Dominic-Philipp Klein
Precipitated with NH4OH without ultraturrax, washed with H2O
d(01,)= 1,555 µm d(0,5)= 3,371 µm d(0,9)= 42,569 µm
Figure 49: uncoated cellulose microparticles precipitated with NH4OH without ultraturrax, washed with H2O
In the figure above some agglomerations are visible but the particles can be
used for further analyses.

Viktoria Maria Enk page 88 of 130 Dominic-Philipp Klein
5.2.4.3 Magnetic cellulose microparticles coated with methylcellulose
Precipitated with NaOH without ultraturrax, washed with albumin
d(0,1)= 1,664 µm d(0,5)= 3,980 µm d(0,9)= 39,269 µm
Figure 50: MC-coated cellulose microparticles precipitated
with NaOH without ultraturrax, washed with albumin
In the figure above some agglomerations are visible but the particles can be
used for further analyses.

Viktoria Maria Enk page 89 of 130 Dominic-Philipp Klein
Precipitated with NH4OH without ultraturrax, washed with albumin
d(0,1)= 1,941 µm d(0,5)= 9,399µm d(0,9)= 214,952µm
Figure 51: MC-coated cellulose microparticles precipitated
with NH4OH without ultraturrax, washed with albumin
The figure above shows a high degree of agglomerations of the particles.
Therefore these particles cannot be used for further analyses.

Viktoria Maria Enk page 90 of 130 Dominic-Philipp Klein
Precipitated with NaOH with ultraturrax, washed with albumin
d(0,1)= 1,731 µm d(0,5)= 4,737 µm d(0,9)= 147,388 µm
Figure 52: MC-coated cellulose microparticles precipitated with NaOH with ultraturrax, washed with albumin
The figure above shows a high degree of agglomerations of the particles.
Therefore these particles cannot be used for further analyses.

Viktoria Maria Enk page 91 of 130 Dominic-Philipp Klein
Precipitated with NH4OH with ultraturrax, washed with albumin
d(0,1)= 1,778 µm d(0,5)= 5,007 µm d(0,9)= 227,287µm
Figure 53: MC-coated cellulose microparticles precipitated with NH4OH with ultraturrax, washed with albumin
The figure above shows a high degree of agglomerations of the particles.
Therefore these particles cannot be used for further analyses.

Viktoria Maria Enk page 92 of 130 Dominic-Philipp Klein
Precipitated with NaOH without ultraturrax, washed with PBS
d(0,1)= 1,572 µm d(0,5)= 4,017 µm d(0,9)= 17,442 µm
Figure 54: MC-coated cellulose microparticles precipitated
with NaOH without ultraturrax, washed with PBS
In the figure above few agglomerations could be detected so the particle has
to be subjected to further analyses to clarify whether the other parameters
are as good as the size distribution.

Viktoria Maria Enk page 93 of 130 Dominic-Philipp Klein
Precipitated with NH4OH without ultraturrax, washed with PBS
d(0,1)= 1,322 µm d(0,5)= 4,580 µm d(0,9)= 222,565 µm
Figure 55: MC-coated cellulose microparticles precipitated with NH4OH without ultraturrax, washed with PBS
The figure above shows a high degree of agglomerations of the particles.
Therefore these particles cannot be used for further analyses.

Viktoria Maria Enk page 94 of 130 Dominic-Philipp Klein
Precipitated with NaOH with ultraturrax, washed with PBS
d(0,1)= 1,470 µm d(0,5)= 3,547µm d(0,9)= 115,984 µm
Figure 56: MC-coated cellulose microparticles precipitated with NaOH with ultraturrax, washed with PBS
The figure above shows a high degree of agglomerations of the particles.
Therefore these particles cannot be used for further analyses.

Viktoria Maria Enk page 95 of 130 Dominic-Philipp Klein
Precipitated with NH4OH with ultraturrax, washed with PBS
d(0,1)= 1,264 µm d(0,5)= 2,610 µm d(0,9)= 140,227 µm
Figure 57: MC-coated cellulose microparticles precipitated
with NH4OH with ultraturrax, washed with PBS
The figure above shows a high degree of agglomerations of the particles.
Therefore these particles cannot be used for further analyses.

Viktoria Maria Enk page 96 of 130 Dominic-Philipp Klein
Precipitated with NH4OH with ultraturrax, washed with H2O
d(0,1)= 1,325 µm d(0,5)= 3,103 µm d(0,9)= 58,070 µm
Figure 58: MC-coated cellulose microparticles precipitated with NH4OH with ultraturrax, washed with H2O
In the figure above some agglomerations are visible but the particles can be
used for further analyses.

Viktoria Maria Enk page 97 of 130 Dominic-Philipp Klein
Precipitated with NaOH without ultraturrax, washed with H2O
d(0,1)= 1,826 µm d(0,5)= 5,214 µm d(0,9)= 118,138 µm
Figure 59: MC-coated cellulose microparticles precipitated with NaOH without ultraturrax, washed with H2O
The figure above shows a high degree of agglomerations of the particles.
Therefore these particles cannot be used for further analyses.

Viktoria Maria Enk page 98 of 130 Dominic-Philipp Klein
Precipitated with NaOH with ultraturrax, washed with H2O
d(0,1)= 1,749 µm d(0,5)= 3,862 µm d(0,9)= 39,849 µm
Figure 60: MC-coated cellulose microparticles precipitated
with NaOH with ultraturrax, washed with H2O
In the figure above some agglomerations are visible but the particles can be
used for further analyses.

Viktoria Maria Enk page 99 of 130 Dominic-Philipp Klein
Precipitated with NH4OH without ultraturrax, washed with H2O
d(0,1)= 1,141 µm d(0,5)= 2,105 µm d(0,9)= 31,745 µm
Figure 61: MC-coated cellulose microparticles precipitated with NH4OH without ultraturrax, washed with H2O
In the figure above some agglomerations are visible but the particles can be
used for further analyses.

Viktoria Maria Enk page 100 of 130 Dominic-Philipp Klein
5.2.4.4 Magnetic cellulose microparticles coated with PEG
Precipitated with NaOH without ultraturrax, washed with albumin
d(0,1)= 1,410 µm d(0,5)= 3,331 µm d(0,9)= 82,532 µm
Figure 62: PEG-coated cellulose microparticles precipitated
with NaOH without ultraturrax, washed with albumin
In the figure above some agglomerations are visible but the particles can be
used for further analyses.

Viktoria Maria Enk page 101 of 130 Dominic-Philipp Klein
Precipitated with NH4OH without ultraturrax, washed with albumin
d(0,1)= 1,453 µm d(0,5)= 4,635 µm d(0,9)= 163,063 µm
Figure 63: PEG-coated cellulose microparticles precipitated with NH4OH without ultraturrax, washed with albumin
The figure above shows a high degree of agglomerations of the particles.
Therefore these particles cannot be used for further analyses.

Viktoria Maria Enk page 102 of 130 Dominic-Philipp Klein
Precipitated with NaOH with ultraturrax, washed with albumin
d(0,1)= 1,413 µm d(0,5)= 3,446 µm d(0,9)= 75,438µm
Figure 64: PEG-coated cellulose microparticles precipitated
with NaOH withultraturrax, washed with albumin
In the figure above some agglomerations are visible but the particles can be
used for further analyses.

Viktoria Maria Enk page 103 of 130 Dominic-Philipp Klein
Precipitated with NH4OH with ultraturrax, washed with albumin
d(0,1)= 1,448 µm d(0,5)= 3,368 µm d(0,9)= 140,947 µm
Figure 65: PEG-coated cellulose microparticles precipitated
with NH4OH with ultraturrax, washed with albumin
The figure above shows a high degree of agglomerations of the particles.
Therefore these particles cannot be used for further analyses.

Viktoria Maria Enk page 104 of 130 Dominic-Philipp Klein
Precipitated with NaOH without ultraturrax, washed with PBS
d(0,1)= 1,659 µm d(0,5)= 3,785 µm d(0,9)= 18,307 µm
Figure 66: PEG-coated cellulose microparticles precipitated with NaOH without ultraturrax, washed with PBS
In the figure above few agglomerations could be detected so the particle has
to be subjected to further analyses to clarify whether the other parameters
are as good as the size distribution.

Viktoria Maria Enk page 105 of 130 Dominic-Philipp Klein
Precipitated with NH4OH without ultraturrax, washed with PBS
d(0,1)= 1,181 µm d(0,5)= 2,476 µm d(0,9)= 96,500 µm
Figure 67: PEG-coated cellulose microparticles precipitated
with NH4OH without ultraturrax, washed with PBS
In the figure above some agglomerations are visible but the particles can be
used for further analyses.

Viktoria Maria Enk page 106 of 130 Dominic-Philipp Klein
Precipitated with NaOH with ultraturrax, washed with PBS
d(0,1)= 1,535 µm d(0,5)= 3,430 µm d(0,9)= 22,212 µm
Figure 68: PEG-coated cellulose microparticles precipitated
with NaOH with ultraturrax, washed with PBS
In the figure above some agglomerations are visible but the particles can be
used for further analyses.

Viktoria Maria Enk page 107 of 130 Dominic-Philipp Klein
Precipitated with NH4OH with ultraturrax, washed with PBS
d(0,1)= 1,248 µm d(0,5)= 2,545 µm d(0,9)= 173,469 µm
Figure 69: PEG-coated cellulose microparticles precipitated
with NH4OH with ultraturrax, washed with PBS
The figure above shows a high degree of agglomerations of the particles.
Therefore these particles cannot be used for further analyses.

Viktoria Maria Enk page 108 of 130 Dominic-Philipp Klein
Precipitated with NH4OH with ultraturrax, washed with H2O
d(0,1)= 1,155 µm d(0,5)= 2,328 µm d(0,9)= 108,888 µm
Figure 70: PEG-coated cellulose microparticles precipitated
with NH4OH with ultraturrax, washed with H2O
The figure above shows a high degree of agglomerations of the particles.
Therefore these particles cannot be used for further analyses.

Viktoria Maria Enk page 109 of 130 Dominic-Philipp Klein
Precipitated with NaOH without ultraturrax, washed with H2O
d(0,1)= 1,462 µm d(0,5)= 3,560 µm d(0,9)= 45,549 µm
Figure 71: PEG-coated cellulose microparticles precipitated
with NaOH without ultraturrax, washed with H2O
In the figure above some agglomerations are visible but the particles can be
used for further analyses.

Viktoria Maria Enk page 110 of 130 Dominic-Philipp Klein
Precipitated with NaOH with ultraturrax, washed with H2O
d(0,1)= 1,472 µm d(0,5)= 3,937 µm d(0,9)= 51,322 µm
Figure 72: PEG-coated cellulose microparticles precipitated
with NaOH with ultraturrax, washed with H2O
In the figure above some agglomerations are visible but the particles can be
used for further analyses.

Viktoria Maria Enk page 111 of 130 Dominic-Philipp Klein
Precipitated with NH4OH without ultraturrax, washed with H2O
d(01,)= 1,447 µm d(0,5)= 2,613 µm d(0,9)= 4,795µm
Figure 73: PEG-coated cellulose microparticles precipitated
with NH4OH without ultraturrax, washed with H2O
In the figure above few agglomerations could be detected so the particle has
to be subjected to further analyses to clarify whether the other parameters
are as good as the size distribution.

Viktoria Maria Enk page 112 of 130 Dominic-Philipp Klein
5.2.5 MEASUREMENT OF DENSITY
The density is a very important measure because the density is a factor of sedimentation. To keep the plasma-particle-suspension of the secondary circuit homogenous the magnetic particles must not show a higher density than other particles in the cycle otherwise the magnetic celluloses would rather form a sediment than other particles. The requirement to the magnetic particles is that the density-difference to non-magnetic ones is not too high.
The variables from the pyknometric formula:
were substitued to the pariables given:
ρS ... Density [ρ]
mP ... m0
mPS ... m2
mPSW ... m3
mW ... m1
ρW ... density of water at measurement temperature
All measurements were conducted at 24°C the density of water at this temperature is 0,99729 g/cm3. [6]

Viktoria Maria Enk page 113 of 130 Dominic-Philipp Klein
5.2.5.1 Magnetic celluloses:
Table 20: Density of magnetic celluloses
The measurement of the Density of the magnetic celluloses led to an appoximate density of:
DENSITY (MAGNETIC MICROPARTICLES) : 1,57255 g/cm3
The measurement nr.2 was not included into the approximation, it was assumed an outlier.

Viktoria Maria Enk page 114 of 130 Dominic-Philipp Klein
5.2.5.2 HPR 10:
The HPR10 is commercially available particle and served as reference for our measurements.
Table 21: Density of HPR 10
The measurement of the Density of the HPR10 led to an appoximate density of:
DENSITY (HPR10) : 0,31054 g/cm3
5.2.5.3 Celluloses from the TU Dresden (in water)
Table 22: Density of Celluloses from the TU Dresden
The measurement of the Density of the non-magnetic celluloses led to an appoximate density of:
DENSITY (NON-MAGNETIC CELLULOSES) : 1,42727 g/cm3
As conclusion can be said that non-magnetic and magnetic microparticles do not distinguish in an inacceptable way so that they could both be used in the MDS. [12]

Viktoria Maria Enk page 115 of 130 Dominic-Philipp Klein
5.2.6 DRY MATTER CONTENT
Table 23: Dry matter content
As shown in table 23 above the dry matter of the unmodified cellulose
microparticles is the highest, followed by the magnetic celluloses
microparticles. The HPR10- adsorber- particles have the least dry matter of
all measured particles. [7] [8]

Viktoria Maria Enk page 116 of 130 Dominic-Philipp Klein
5.2.7 COMPARISON OF SIZE DISTRIBUTIONS AFTER 5MIN/10MIN AND WITHOUT AN ULTRASONIC BATH
Table 24: comparison of size distributions
Table 25: comparison of size distributions
Table 26: comparison of size distributions

Viktoria Maria Enk page 117 of 130 Dominic-Philipp Klein
Table 27: comparison of size distributions
Table 28: comparison of size distributions
Table 29: comparison of size distributions

Viktoria Maria Enk page 118 of 130 Dominic-Philipp Klein
Table 30: comparison of size distributions
Table 31: comparison of size distributions
Table 32: comparison of size distributions

Viktoria Maria Enk page 119 of 130 Dominic-Philipp Klein
Table 33: comparison of size distribution

Viktoria Maria Enk page 120 of 130 Dominic-Philipp Klein
5.3 SUMMARY OF THE BEST PARTICLES AND INTERPRETATION
a) Uncoated magnetic cellulose microparticles (U-mcm)
Parameter: NH4OH / + UT / H2O
• before the precipitation: no coating
• precipitation in NH4OH
• use of Ultraturrax
• use of H2O for washing
Table 34: magnetic properties of uncoated particles precipitated
with NH4OH with UT washed with
H2O
Figure 74: comparison of size distributions of uncoated particles precipitated with
NH4OH with UT washed with H2O

Viktoria Maria Enk page 121 of 130 Dominic-Philipp Klein
b) MC-coated magnetic cellulose microparticles (MC-mcm)
Parameter: NH4OH / - UT / H2O
• before the precipitation: use of Methylcellulose
• precipitation in NH4OH
• without Ultraturrax
• use H2O for washing
Table 35: magnetic properties of
MC-coated particles precipitated
with NH4OH without UT washed with H2O
Figure 75: comparison of size distributions of MC-coated particles precipitated with
NH4OH without UT washed with H2O

Viktoria Maria Enk page 122 of 130 Dominic-Philipp Klein
c) PEG-coated magnetic cellulose microparticles (PEG-mcm)
Parameter: NH4OH / - UT / H2O
• before the precipitation: use of Polyethylenglycol
• precipitation in NH4OH
• without Ultraturrax
• use of H2O for washing
Table 36: magnetic properties of PEG-coated particles precipitated
with NH4OH without UT washed
with H2O
Figure 76: comparison of size distributions of PEG-coated particles precipitated
with NH4OH without UT washed with H2O

Viktoria Maria Enk page 123 of 130 Dominic-Philipp Klein
Interpretation:

Viktoria Maria Enk page 124 of 130 Dominic-Philipp Klein
APPENDIX

Viktoria Maria Enk page 125 of 130 Dominic-Philipp Klein
BIBLIOGRAPHY
[1] Weber, Viktoria: Blut – Gerinnung und Reinigung einer besondern Flüssigkeit - Präsentation des
Zentrum für Biomedizinische Technologie Donau-Universität Krems – Krems: Club Biotech, 26.01.2010
[2] Wikipedia – Liver
(online in the internet: URL: http://en.wikipedia.org/wiki/Liver, 07.04.2011 )
[3] Wikipedia – Blood
(online in the internet: URL: http://en.wikipedia.org/wiki/Blood, 28.01.2011 )
[4] Wikipedia – Hemoglobin
(online in the internet: URL: http://en.wikipedia.org/wiki/Hemoglobin, 24.05.2011 )
[5] Wikipedia – Liver Failure
(online in the internet: URL: http://en.wikipedia.org/wiki/Liver_failure, 24.05.2011 )
[6] AMBERCHROM – HPR 10
(online in the internet: URL:
http://www.dow.com/products/product_detail.page?product=1120267&application=1011017,
24.05.2011 )
[7] Falkenhagen, Dieter; Brandl, Martin; Jens, Hartmann; Kellner, Karl-Heinz; Posnicek, Thomas;
Weber, Viktoria: Fluidized Bed Adsorbent Systems for Extracorporeal Liver Support – Center for
Biomedicals Technology & Christian Doppler Laboratoy for Specific Adsorption Technologies in
Medicine, Danube University Krems, Krems, Austria, 2006;
[8] Falkenhagen, Dieter; Brandl, Martin; Jens, Hartmann; Schildboeck, Claudia: Particle Leakage in
Extracorporeal Purification Systems Based on Microparticle Suspensions – Center for Biomedicals
Technology & Christian Doppler Laboratoy for Specific Adsorption Technologies in Medicine, Danube
University Krems, Krems, Austria, 2005;

Viktoria Maria Enk page 126 of 130 Dominic-Philipp Klein
[9] Brandl, M.; Hartmann, J.; Posnicek, T.; Ausenegg, F.R.; Leitner, A.; Falkenhagen, D.: Detection of
Flourescently Labeled Microparticles in Blood - Center for Biomedicals Technology, Danube University
Krems, Krems, Austria & Christian Doppler Laboratoy for Specific Adsorption Technologies in Medicine
& Institute of Experimental Physics, Karl Franzens University Graz, Graz, Austria, 2005;
[10] Falkenhagen, Dieter; Brandl, Martin; Ettenauer, Marion; Posnicek, Thomas; Weber, Viktoria:
Magnetic Fluorescent Microparticles as Markers for Particle Transfer in Extracorporeal Blood
Purification - Center for Biomedicals Technology, Danube University Krems, Krems, Austria, 2007;
[11] Fischer, Steffen; Thümmler, Katrin; Volkert, Bert; Hettrich, Kay; Schmidt, Ingerborg; Fischer, Klaus:
Properties and Applications of Cellulose Acetate – Institute of wood and plant chemistry, technical
University of Dresden, Tharandt, Germany & Fraunhofer Institute for Applied Polymer Research
Potsdam-Golm, Potsdam, Germany, 2008;
[12] Gupta, Ajay-Kumar; Gupta, Mona: Synthesis and Surface Engineering in Iron Oxide Nanoparticles for
Biomedical Applications – Crusade Laboratories Limited, Southern General Hospital, Glasgow,
Scotland, UK & Division of Biochemistry and Molecular Biology, University of Glasgow, Glasgow,
Scatland, UK; SienceDirect; Elsevier Ltd, 2005;
[13] M. Yamaure et al.: Preparation and Coating Precedures for Magnetic Nanoparticles – published in the
Journal of Magnetism and Magnetic Materials, Nr. 279, pages 210 to 217, 2004;
[14] Ettenauer, Marion: Diplomarbeit – Untersuchungen zur Bioverträglichkeit von Polymeren auf
Kolenhydrat-basis für die extrakorporale Blutreinigung – Zentrum für Biomedizinische Technologie der
Donau Univerisät Krems, Krems, 2003;
[15] Stößer, Kathi: Diplomarbeit – Herstellung, Verwendung und Charakterisierung von Perlcellulosen zur
Immobilisierung von Magnetit – Hochschule für Technik und Wirtschaft Dresden, Dresden,
Deutschland, 2009;
[16] Fritsch, H.; Kuehnel, W.: Internal Organs, Color Atlas od Human Anatomy Vol.2, 5th edition – Thieme
Verlag, Stuttgart, Germany, 2008;
[17] Notations from the lessons of Prof. DI Dr. techn. Bibiana Meixner

Viktoria Maria Enk page 127 of 130 Dominic-Philipp Klein
INDEX OF FIGURES:
Figure 1: The MDS-system ...........................................................................................................................................................4 Figure 2: synthesis chain ..............................................................................................................................................................6 Figure 3: Structure of the liver....................................................................................................................................................14 Figure 4: Chemical formula of the Hem group ............................................................................................................................16 Figure 5: Chemical formula of bilirubin .......................................................................................................................................16 Figure 6: decomposition of Hemoglobin in liver and kidneys......................................................................................................17 Figure 7: Decomposition of ethanol ............................................................................................................................................19 Figure 8: Dialysis ........................................................................................................................................................................21 Figure 9: Prometheus System ....................................................................................................................................................22 Figure 10: Correlation between volume and surface ..................................................................................................................24 Figure 11: MDS- System.............................................................................................................................................................25 Figure 12 Comparison of Prometheus´and MDS´ safety ............................................................................................................27 Figure 13: synthesis chain [12] [13] .........................................................................................................................................36 Figure 14: experimental setting for the oxygen removal (degassing) .....................................................................................41 Figure 15: magnetic cellulose microparticle suspension.............................................................................................................43 Figure 16: assembly of measurement & time-stop-point ............................................................................................................43 Figure 17: completely separated microparticles .........................................................................................................................43 Figure 18: net weight of ..............................................................................................................................................................45 Figure 19: pyknometer ................................................................................................................................................................45 Figure 20: pyknometer ................................................................................................................................................................45 Figure 21: pyknometer filled........................................................................................................................................................45 Figure 22: overview of treatments used for the preparation of magnetic cellulose microparticles..............................................48 Figure 23: difference between unaggregated and aggregated particles.....................................................................................57 Figure 24: Sample 1: uncoated .............................................................................................................................................58 Figure 25: Sample 1: uncoated .............................................................................................................................................59 Figure 26: Sample 2: uncoated .............................................................................................................................................60 Figure 27: Sample 2: uncoated .............................................................................................................................................61 Figure 28: Coated with methylcel lu lose .............................................................................................................................62 Figure 29: Coated with methylcel lu lose .............................................................................................................................63 Figure 30: Coated with methylcel lu lose .............................................................................................................................64 Figure 31: Coated with methylcel lu lose .............................................................................................................................65 Figure 32: Coated with polyethylenglycol ...................................................................................................................................66 Figure 33: Coated with polyethylenglycol ...................................................................................................................................67 Figure 34: Example for green labelling .......................................................................................................................................74 Figure 35: Example for yellow labelling ......................................................................................................................................74 Figure 36: Example for red labelling ...........................................................................................................................................75 Figure 37: unmodified cellulose- microparticles..........................................................................................................................75 Figure 38: uncoated cellulose microparticles..............................................................................................................................76 Figure 39: uncoated cellulose microparticles..............................................................................................................................77 Figure 40: uncoated cel lu lose micropart ic les ...................................................................................................................78 Figure 41: uncoated cel lu lose micropart ic les ...................................................................................................................79 Figure 42: uncoated cel lu lose micropart ic les ...................................................................................................................80 Figure 43: uncoated cel lu lose micropart ic les ...................................................................................................................81 Figure 44: uncoated cel lu lose micropart ic les ...................................................................................................................82

Viktoria Maria Enk page 128 of 130 Dominic-Philipp Klein
Figure 45: uncoated cel lu lose micropart ic les ...................................................................................................................83 Figure 46: uncoated cel lu lose micropart ic les ...................................................................................................................84 Figure 47: uncoated cel lu lose micropart ic les ...................................................................................................................85 Figure 48: uncoated cel lu lose micropart ic les ...................................................................................................................86 Figure 49: uncoated cel lu lose micropart ic les ...................................................................................................................87 Figure 50: MC-coated cel lu lose micropart ic les ................................................................................................................88 Figure 51: MC-coated cel lu lose micropart ic les ................................................................................................................89 Figure 52: MC-coated cel lu lose micropart ic les ................................................................................................................90 Figure 53: MC-coated cel lu lose micropart ic les ................................................................................................................91 Figure 54: MC-coated cel lu lose micropart ic les ................................................................................................................92 Figure 55: MC-coated cel lu lose micropart ic les ................................................................................................................93 Figure 56: MC-coated cel lu lose micropart ic les ................................................................................................................94 Figure 57: MC-coated cel lu lose micropart ic les ................................................................................................................95 Figure 58: MC-coated cel lu lose micropart ic les ................................................................................................................96 Figure 59: MC-coated cel lu lose micropart ic les ................................................................................................................97 Figure 60: MC-coated cel lu lose micropart ic les ................................................................................................................98 Figure 61: MC-coated cel lu lose micropart ic les ................................................................................................................99 Figure 62: PEG-coated cel lu lose micropart ic les ...........................................................................................................100 Figure 63: PEG-coated cel lu lose micropart ic les ...........................................................................................................101 Figure 64: PEG-coated cel lu lose micropart ic les ...........................................................................................................102 Figure 65: PEG-coated cel lu lose micropart ic les ...........................................................................................................103 Figure 66: PEG-coated cel lu lose micropart ic les ...........................................................................................................104 Figure 67: PEG-coated cel lu lose micropart ic les ...........................................................................................................105 Figure 68: PEG-coated cel lu lose micropart ic les ...........................................................................................................106 Figure 69: PEG-coated cel lu lose micropart ic les ...........................................................................................................107 Figure 70: PEG-coated cel lu lose micropart ic les ...........................................................................................................108 Figure 71: PEG-coated cel lu lose micropart ic les ...........................................................................................................109 Figure 72: PEG-coated cel lu lose micropart ic les ...........................................................................................................110 Figure 73: PEG-coated cel lu lose micropart ic les ...........................................................................................................111 Figure 74: comparison of size distributions of uncoated particles ..........................................................................................120 Figure 75: comparison of size distributions of MC-coated particles.........................................................................................121 Figure 76: comparison of size distributions of PEG-coated particles......................................................................................122

Viktoria Maria Enk page 129 of 130 Dominic-Philipp Klein
INDEX OF TABLES:
Table 1: chemicals used in the experiments ...............................................................................................................................35 Table 2: uncoated particles washed with Albumin ......................................................................................................................50 Table 3: uncoated particles washed with reversed osmosis water .............................................................................................51 Table 4: uncoated particles washed with PBS............................................................................................................................51 Table 5: MC coated particles washed with Albumin ...................................................................................................................52 Table 6: MC coated particles washed with reversed osmosis water ..........................................................................................52 Table 7: MC coated particles washed with PBS .........................................................................................................................53 Table 8: PEG coated particles washed with Albumin .................................................................................................................54 Table 9: PEG coated particles washed with reversed osmosis water ........................................................................................55 Table 10: PEG coated particles washed with PBS .....................................................................................................................56 Table 11: magnetic behaviour of uncoated particles ..................................................................................................................68 Table 12: magnetic behaviour of uncoated particles ..................................................................................................................68 Table 13: magnetic behaviour of uncoated particles ..................................................................................................................69 Table 14: magnetic behaviour of MC-coated particles................................................................................................................69 Table 15: magnetic behaviour of MC-coated particles................................................................................................................70 Table 16: magnetic behaviour of MC-coated particles................................................................................................................70 Table 17: magnetic behaviour of PEG-coated particles..............................................................................................................71 Table 18: magnetic behaviour of PEG-coated particles..............................................................................................................71 Table 19: magnetic behaviour of PEG-coated particles..............................................................................................................72 Table 20: Density of magnetic celluloses..................................................................................................................................113 Table 21: Density of HPR 10 ....................................................................................................................................................114 Table 22: Density of Celluloses from the TU Dresden..............................................................................................................114 Table 23: Dry matter content ........................................................................................................................................................115 Table 24: comparison of size distributions................................................................................................................................116 Table 25: comparison of size distributions................................................................................................................................116 Table 26: comparison of size distributions...............................................................................................................................116 Table 27: comparison of size distributions...............................................................................................................................117 Table 28: comparison of size distributions...............................................................................................................................117 Table 29: comparison of size distributions...............................................................................................................................117 Table 30: comparison of size distributions...............................................................................................................................118 Table 31: comparison of size distributions...............................................................................................................................118 Table 32: comparison of size distributions...............................................................................................................................118 Table 33: comparison of size distribution.................................................................................................................................119 Table 34: magnetic properties of ..............................................................................................................................................120 Table 35: magnetic properties of .............................................................................................................................................121 Table 36: magnetic properties of ...............................................................................................................................................122

Viktoria Maria Enk page 130 of 130 Dominic-Philipp Klein
INDEX OF ABBREVIATIONS:
COURSE OF THE PROJECT:
1. day: washing of ethanol soaked particles 2. day: preparation of ferric and ferrous solutions and particle soaking 3. day: precipitation and washing 4. day: analysis of uncoated particles 5. day: planning of strategy and course, weekly report
6. day: impregnation with methylcellulose 7. day: precipitation and washing 8. day: analysis of MC-coated particles 9. day: Presentation of Prof. Weber „Blutreinigung – Basics“, analysis 10. day: planning, weekly report
11. day: impregnation with polyethylene glycol 12. day: precipitation and washing 13. day: analysis of PEG-coated particles 14. day: preparations for density measurement (dry matter) 15. day: density measurement of cellulose, planning, weekly report
16. day: density measurement of magnetic particles 17. day: density measurement of HPR-10 (reference) 18. day: Presentation of Jens Hartmann „Koagulation“ – analysis of best particles 19. day; analysis of best particles, cleaning of the laboratory 20. day: final meeting with supervision, final report