Martinotti G, Santacroce R , Cinosi E. Dipartimento di Neuroscienze ed Imaging
Upload
iris-davisCategory
view
224download
1
Dipartimento di Oncologia & Neuroscienze
Stefano IacobelliUniversità “G. d’Annunzio”
Chieti-Pescara
Genomic and proteomic predictors of sensitivity to preoperative chemotherapy

No. of patients needed to treat to obtain one favorable event
Adjuvant hormonotherapy :15-30Adjuvant chemotherapy : 2-15
Metastatic disease : 2-10
Neoadjuvant chemotherapy* : 2-15
*pCR

Preoperative systemic treatment (neoadjuvant or primary therapy)
1. Allows the tumor to be used as a measure of response in vivo
2. Trials in this setting require fewer patients and can be completed rapidly
Improvement of the rate of development of new agents in early BC
Development of short-term surrogate of response that could predict long-term outcome

Pathological complete response (pCR) to neoadjuvant CT is associated to significantly improved OS
No difference in survival between neoadjuvant or adjuvant CT

epirubicin 75 mg/m andcyclophosphamide 1,200 mg/m2
q14 days for 6 cycles (dose-dense)
80 (noninflammatory) breast cancers
mastectomy

IHC: ESR1 (estrogen receptor 1)
KRT5/6/17 (keratin 5/6/17) basal featuresCDKN2A (cyclin-dependent kinase inhibitor 2A) cell cycle arrestPROM1 (prominin 1) stem cell
RT-PCR: ERBB2
TP53 status: determined by the yeast functional assay
Mutant TP53 transcripts = red colonies Wild-type transcripts = white colonies
Molecular analyses in pretreatment biopsy samples

*Complete disappearance of invasive tumor cells in the mastectomy specimen and in the lymph nodes, or a single microscopic invasive focus, or residual in situ carcinoma
80 pts
52 WT p53 28 mutated p53
15 pCR*
0 pCR

pCR according to clinical or biological features (dark yellow and bold type, p=0.0001; light yellow,=p=0.0001, or p=0.01)
TP53 status significantly linked to pCR in univariate analysis;
After stratification for TP53 status, all other variables, with the exception of KRT5/6/17, remained no longer significant

Kaplan-Meier analysis of the event-free and overall survival(stratified by TP53 status)
TP53 mutant tumors had a favorable, although not significant, event-free survival (46 mo median F-U, too short?)
Among patients who did not reach pCR, those with WT-TP53 tumors had a more favorable overall survival compared with those with TP53-mutant tumors
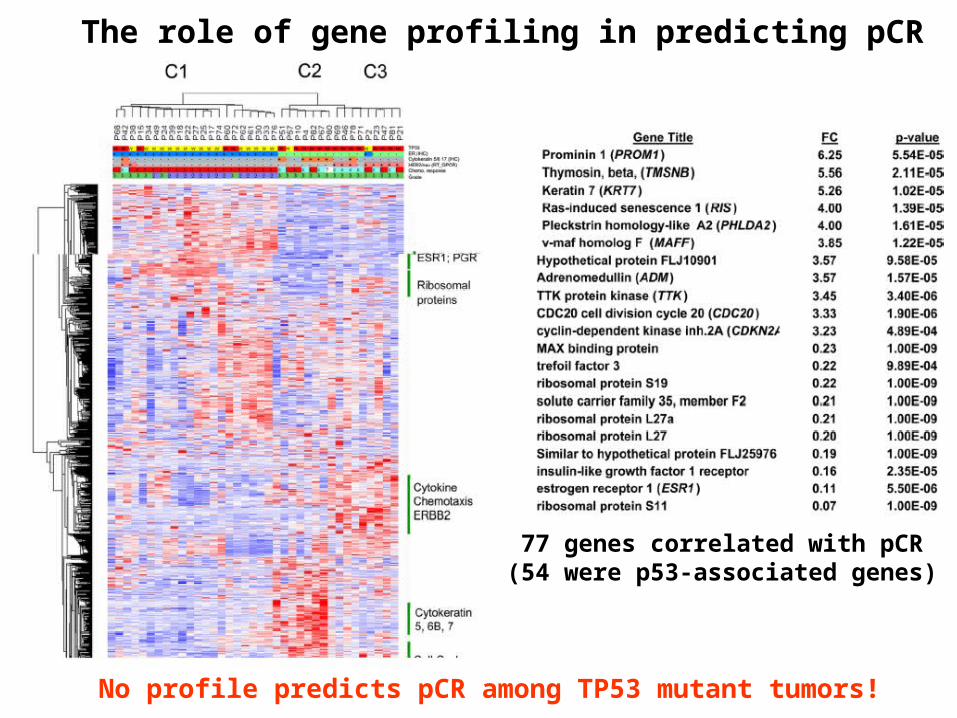
77 genes correlated with pCR(54 were p53-associated genes)
The role of gene profiling in predicting pCR
No profile predicts pCR among TP53 mutant tumors!

Conclusion:
TP53 mutations are highly predictive of pCR to a dose-dense neoadjuvant epirubicin–cyclophosphamide regimen.
Why did previous studies fail to identify this relationship?
1. TP53 status, using yeast functional assay, detects not only mutations and deletions, but also abnormal splicing events;
2. The dose intensity of the regimen is 2-4 times higher than previous ones.

Basal-like: ER - PR - HER2 -HER2+: ER - PR - HER2 +Luminal B: ER/PR + HER2 +Luminal A: ER/PR + HER2 -
IHC subtypes of breast cancer:

Doxorubicin 60 mg/m2 +Cyclophosphamide 600 mg/m2
q14 days (28 pts)q21 days (79 pts)
107 breast cancers
Surgery (27 pts)
Adjuvant hormonal therapy for HR positive
4 cycles
Taxanes (80 pts)
Surgery

The higher pCR (stage=0) rate was observed in basal-like and HER-2+ subtypes

DDFS and OS according to breast cancer subtype
DDFS of patients with pCR and without pCR after CT

DDFS among patients with residual disease after CT by breast cancer subtype

Patients with basal-like and HER2+/ER- subtype have higher rates of pathologic complete response to neoadjuvant anthracycline-based CT than those with luminal subtype;
Patients achieving a pathologic complete response have a highly favorable outcome.
Patients with basal-like and HER2+/ER- subtype with residual disease have early relapse and death compared with those with luminal subtype
Conclusion

•Caspase-3 is a central protease in the execution of apoptosis;
•Cyclophosphamide, via its activated 4-hydroxy metabolites, determines cell death by stimulating apoptosis (therefore in presence of caspase-3);
•Lack or down-regulation of caspase-3 expression is a mechanism of resistance to anticancer agents and overexpression of caspase-3 restores chemosensitivity;
•Paradoxically, expression of caspase-3 is up-regulated in breast cancer in parallel to the increase in the apoptotic index and tumor progression;
•The expression of Caspase-3s, a splice variant (95-amino acid shorter) which antagonizes caspase-3 activity, might have a role in the regulation of apoptosis.
Background:

Caspase-3 and caspase-3s expression in breast tumor cell lines (A and B) and the effect of caspase-3 and/or caspase-3s transfection in MCF-7 (C) and HBL-100 (D) cells on cyclophosphamide (CPA)-induced apoptosis.
• Overexpression of caspase-3 and caspase-3s inhibits CPA-induced apoptosis y (P < 0.0001) both in MCF-7 and HBL-100 cell lines

130 pts with breast cancer(analyzed retrospectively)
90 pts with LABC 40 pts
Surgery
Neodjuvant therapy withFEC100 (4-6 cycles) Adjuvant therapy
Surgery
Pretreatment biopsy samples for RT-PCR evaluation of:Caspase-3Caspase-3s

• Expression of caspase-3 is higher in cancer than in adjacent normal tissues;
• No differences for caspase-3s

No relation between the expression of the caspase-3, caspase-3s, or the ratio caspase-3s/caspase-3 and patient characteristics

No relation between caspase-3, caspase-3s, or the caspase-3s/caspase-3 and clinical outcome

Responders (pCR) included patients with no evidence of residual tumor in the breast or axillary lymph nodes and patients with only residual in situ carcinoma.
90 pts with LABC
30 Responders 60 Nonresponders
Caspase-3s/caspase-3 ratio significantly increased in nonresponders
FEC100

Increased caspase-3s expression is an independent indicator of no response to chemotherapy

The RS was clinically validated to quantify the risk of distant recurrence in 668 women with ER+, N0 breast tumors treated with adjuvant tamoxifen in a clinical trial conducted by the NSABP
Is RS, along with additional genes, associated with pCR?
RT-PCR(259 candidate genes)
formalin-fixed paraffin-embedded (FPE) tumors
(447 pts)21-gene panel
(Oncotype DX 21)
Recurrence Score (RS) algorithm.
Background

formalin-fixed paraffin-embedded
core biopsy(95/102 pts)
RT-PCR(384 genes, including
21 genes of RS)
Correlation with pCR*
doxorubicin 60 mg/m2 andpaclitaxel 200 mg/m2
q 21 days for 3 cycles
102 locally advanced breast cancers
surgeryweekly paclitaxel (80 mg/m2) x 12
Validation series in a separate cohort of 82 patients treated at M.D. Anderson Cancer Center receiving a similar chemotherapy
?
*defined as the absence of invasive cancer in the breast


ER-negative tumors were more likely to have a pCR:7/31 (23%) were ER-negative 4/52 (8%) were ERpositive
There was no correlation between patient age or tumor grade and pCR.

These genes fell into categories defined by their biologic function:
proliferation (eg, MCM6, E2F1, MYBL2), apoptosis (BBC3, BAD, DR4, TP53BP1), invasion & metastasis (FYN, MMP12), drug resistance/metabolism(ABCC5, ALDH1A1, CYP3A4).
86 genes correlated with pCR (p<0.05)

The cluster analysis of the 86 genes revealed 3 groups related to the likelihood of pCR:
1. ER-related gene cluster 2. Proliferation-related gene cluster3. Immune-related gene cluster.
Supervised analysis

Higher expression of the ER gene cluster (including PR, SCUBE2, ER, NPD009, GATA3, IGF1R, IRS1) correlated with a low likelihood of pCR.
Higher expression of the proliferation gene cluster (including CDC20, E2F1, MYBL2, TOP2A, FBXO5, MCM2, MCM6, CDC25B) or immune-related gene cluster (including MCP1, CD68, CTSB, CD18, ILT-2, CD3z, FasL, HLA.DPB1, GBP1) correlated with a high likelihood of pCR.

The RS was positively associated with pCR (P < 0.005), suggesting that the pts who are at highest recurrence risk are more likely to have chemotherapy benefit
Recurrence Score (RS) (Oncotype DX 21) and pCR
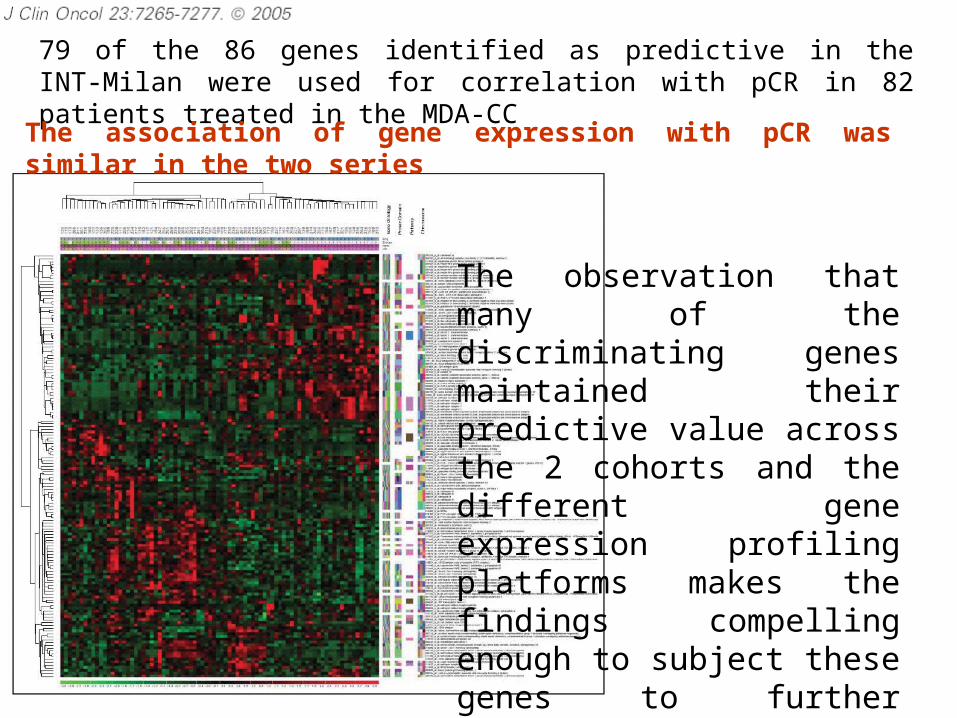
79 of the 86 genes identified as predictive in the INT-Milan were used for correlation with pCR in 82 patients treated in the MDA-CC
The association of gene expression with pCR was similar in the two series
The observation that many of the discriminating genes maintained their predictive value across the 2 cohorts and the different gene expression profiling platforms makes the findings compelling enough to subject these genes to further clinical evaluation

Topoisomerase 2-alpha (TOPO IIa)-marker for anthracycline sensitivity
Microtubule-associated protein tau (MAPT)
-marker for taxane sensitivity

doxorubicin 50 mg/m2cyclophosphamide 500 mg/m2docetaxel 75 mg/m2
q 21 days for 2 cycles
70 breast cancers
TAC
Responders Nonresponders
6 TAC4 TAC 4 NX4 TACVinorelbine 25 mg/m2 d1, 8 q21Xeloda 1000 mg/mq x2 days 1-14 q21
Surgery Surgery Surgery Surgery
pCR defined as no evidence of invasive tumor in breast and node50 biopsy specimens were available for microarray

8 pCR: 7 after TAC; 1 after NX

ER and PR negativity
(determined by IHC)
were predictive of pCR
Tumor stage, histological type, grading, and menopausal status showed no power in predicting pCR after CT

Gene expression evaluated by microarray analysis
HER-2 gene expression revealed to be strongly
predictive of pCR
TOPO II was not significant in predicting pCR(2 different probes)

Gene expression evaluated by microarray analysis
MAP-Tau was not significant in predicting pCR(3 different probes)

After CT
Patient 1
Before CT
Patient 2

The data shown refer to the initial biopsy sample


Doxorubicin study (51 pts) FUMI study (30 pts)
(Doxorubicin weekly for 16 weeks) (5-FU+ Mitomycin)
Two previous studies correlating TP53 with response to therapy
81 pts
Microarray analysis

Based on gene expression profile, breast cancers is classified in 5 different subtypes:
1. Luminal A2. Luminal B3. ERBB2+4. Basal-like5. Normal-like
This classification showed prognostic effects on DFS and OS
Thus far, limited value to predict response to therapy


Both studies showed a lower PD for Luminal A (2/36 vs 13/45, p<0.0089)Higher PD for Luminal B in the doxorubicin group (5/8, p<0.0078)
No other associations between response and tumor subtype
No gene profile predicts response to either treatment in supervised analysis
But, just clinical response!!

(Molecular) Imaging


After 6 cycles of CT, using an arbitrary cutoff value of 60% of tumor size at baseline:
SensitivitySpecificityPPVNPV
Physical exam US Mammography
100 31 67100
64435355
31564245

FDG PET provides early information on tumor response to CT!


Diffuse Optical Spectroscopy (DOS)
Provides functional informations about tumor biochemical composition,by noninvasive quantitative measurement* of tissue concentration of:
- oxygenated Hb ctO2Hb - deoxygenated Hb ctHHb- water ctH2O - bulk lipid
*1. Absorption spectra at near-infrared absosrption (NIR) 2. Reduced scattered spectra


1. Tumor concentration of ctCHHb, ctO2Hb, and ctH2O dropped within one week of the neoadjuvant CT only for pathology confirmed responders;
2. The best single predictor of response was ctCHHb (83% sensistivity; 100% specificity)Best combination: ctCHHb + ctH20
(100% sensitivity and specificity)
3. The tumor/normal ratio of ctO2Hb was significantly higher in responders than in nonresponders
1. CONCLUSION
DOS as a new tool for predicting and monitoring an individual’s response to treatment?

Clinical decision making in medical oncology
Treatment selection
Today
Data from clinical trials
Risk assessment
The future?Molecular profiiling of tumors (genomics, proteomics)
Probability of response

BC: targets we want to direct therapy toward
Agent VEGF VEGFR PDGFR EGFR HER-2 c-KIT MAPtau TopoII mTOR
Bevacizumab X
Sunitinib X X X
Lapatinib X X Trastuzumab X
mTOR inhibitors x
Anthracyclines X X
Taxanes X

ICONA ICONA - - IImmune mmune CCompetition ompetition OOn n AArrayrray
++
1. Tissue sample 1. Tissue sample lysate (Biomarkers)lysate (Biomarkers)
2. Recombinantfluorescent proteins
Antibody coated chipFl
uore
scence
inte
nsi
tyAmount of Biomarker
*A CINBO’s Project
1.
KDR P38 MAPK2.
HER-2 Akt3.
2. Bevacizumab
3. TrastuzumabPI3K
1. mTOR inhibitorspAkt
Akt/PKB
Smart Chip® (antibody array)
EGFR HER-24. 4. LapatinibAktPKB
p27 pS6
Flt
PTEN
RAS
PTEN

Optimize Therapy through Pathway Evaluation(OTPE)
Bio
mar
ker
Eva
luat
ion
“Smart Chip” (antibody array)Patients with
LABC
*A CINBO’s Project
The expression pattern of activated signaling molecules can be used to map pathways in biopsy sample!
Anthracyclines vs taxanes
Arm A or B
Arm C
Bevacizumab
Arm D
Lapatinib
Trastuzumab
Arm E
Arm X, Y, Z

CONCLUSION
In the future, it is hoped that neoadjuvant therapy will increase our knowledge of the molecular effects of treatment in vivo and enable the development of robust surrogate biological markers of response that predict long-term outcome.
This will enhance the assessment of new treatments and enable the development of tailored treatments for an individual patient.