Digital realty 3 q16 earnings presentation final
31
-
Upload
irdigitalrealty -
Category
Investor Relations
-
view
7.149 -
download
1
Transcript of Digital realty 3 q16 earnings presentation final


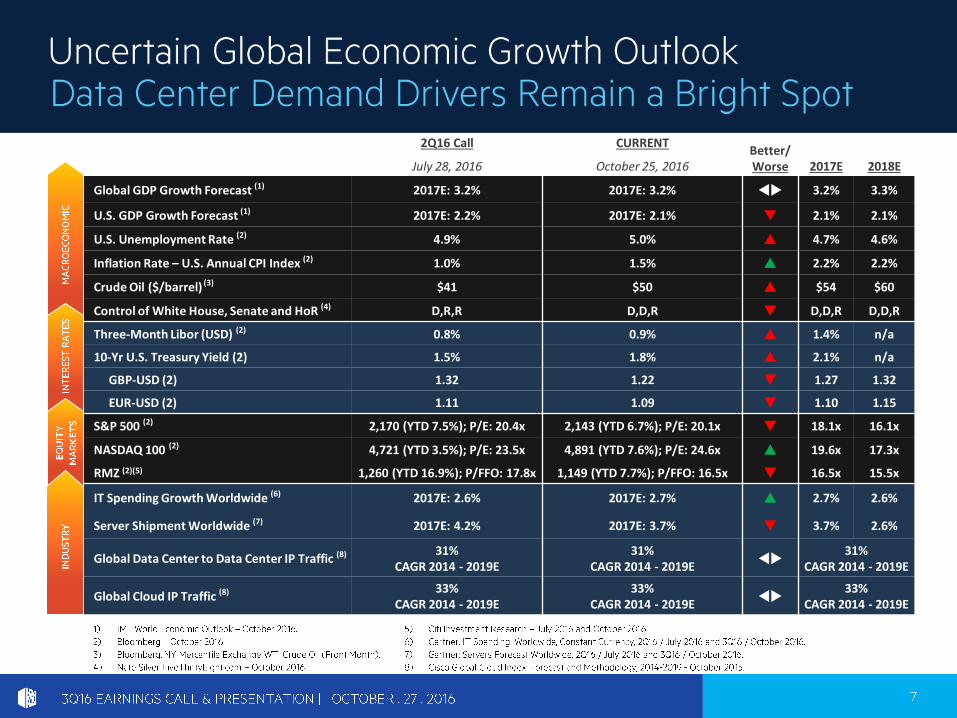
2Q16 Call CURRENTBetter/WorseJuly 28, 2016 October 25, 2016 2017E 2018E
Global GDP Growth Forecast (1) 2017E: 3.2% 2017E: 3.2% tu 3.2% 3.3%
U.S. GDP Growth Forecast (1) 2017E: 2.2% 2017E: 2.1% q 2.1% 2.1%
U.S. Unemployment Rate (2) 4.9% 5.0% p 4.7% 4.6%
Inflation Rate – U.S. Annual CPI Index (2) 1.0% 1.5% p 2.2% 2.2%
Crude Oil ($/barrel) (3) $41 $50 p $54 $60
Control of White House, Senate and HoR (4) D,R,R D,D,R q D,D,R D,D,R
Three-Month Libor (USD) (2) 0.8% 0.9% p 1.4% n/a
10-Yr U.S. Treasury Yield (2) 1.5% 1.8% p 2.1% n/a
GBP-USD (2) 1.32 1.22 q 1.27 1.32
EUR-USD (2) 1.11 1.09 q 1.10 1.15
S&P 500 (2) 2,170 (YTD 7.5%); P/E: 20.4x 2,143 (YTD 6.7%); P/E: 20.1x q 18.1x 16.1x
NASDAQ 100 (2) 4,721 (YTD 3.5%); P/E: 23.5x 4,891 (YTD 7.6%); P/E: 24.6x p 19.6x 17.3x
RMZ (2)(5) 1,260 (YTD 16.9%); P/FFO: 17.8x 1,149 (YTD 7.7%); P/FFO: 16.5x q 16.5x 15.5x
IT Spending Growth Worldwide (6) 2017E: 2.6% 2017E: 2.7% p 2.7% 2.6%
Server Shipment Worldwide (7) 2017E: 4.2% 2017E: 3.7% q 3.7% 2.6%
Global Data Center to Data Center IP Traffic (8) 31%CAGR 2014 - 2019E
31%CAGR 2014 - 2019E
tu31%
CAGR 2014 - 2019E
Global Cloud IP Traffic (8) 33%CAGR 2014 - 2019E
33%CAGR 2014 - 2019E
tu33%
CAGR 2014 - 2019E


•
•
•
•
•
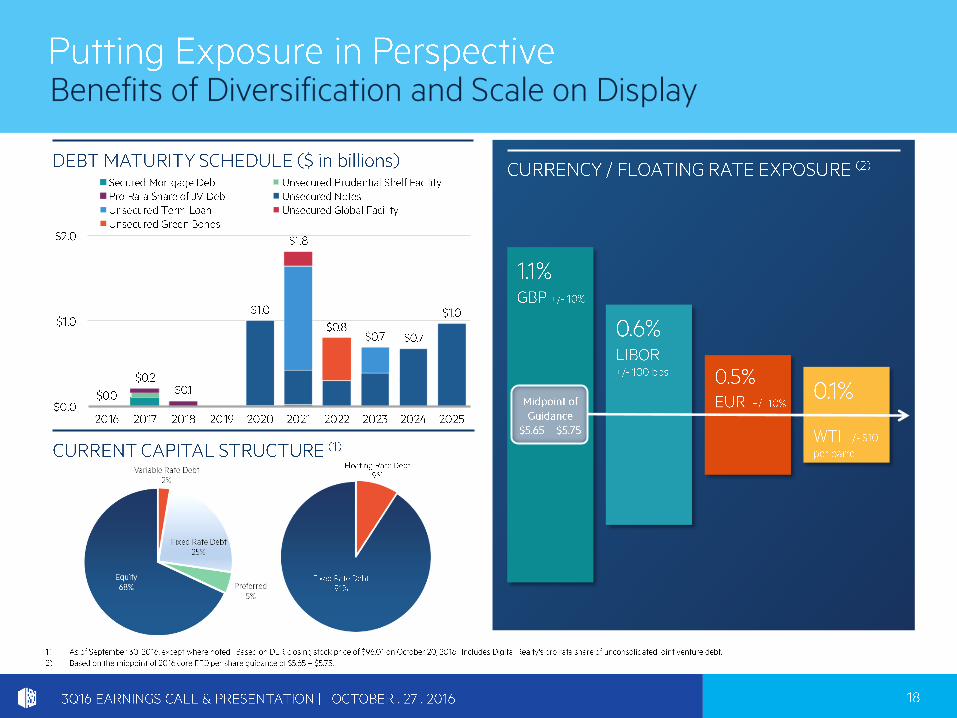
Cash RentChange


The information included in this presentation contains certain non-GAAP financial measures that management believes are helpful in understanding our business, as further described below. Our definition and calculation of non-GAAP financial measures may differ from those of other REITs, and, therefore, may not be comparable. The non-GAAP financial measures should not be considered an alternative to net income or any other GAAP measurement of performance and should not be considered an alternative to cash flows from operating, investing or financing activities as a measure of liquidity.
FUNDS FROM OPERATIONS (FFO)
We calculate funds from operations, or FFO, in accordance with the standards established by the National Association of Real Estate Investment Trusts, or NAREIT. FFO represents net income (loss) (computed in accordance with GAAP), excluding gains (or losses) from sales of property, excluding a gain from a pre-existing relationship, impairment charges, real estate related depreciation and amortization (excluding amortization of deferred financing costs) and after adjustments for unconsolidated partnerships and joint ventures. Management uses FFO as a supplemental performance measure because, in excluding real estate related depreciation and amortization and gains and losses from property dispositions and after adjustments for unconsolidated partnerships and joint ventures, it provides a performance measure that, when compared year over year, captures trends in occupancy rates, rental rates and operating costs. We also believe that, as a widely recognized measure of the performance of REITs, FFO will be used by investors as a basis to compare our operating performance with that of other REITs. However, because FFO excludes depreciation and amortization and captures neither the changes in the value of our properties that result from use or market conditions, nor the level of capital expenditures and capitalized leasing commissions necessary to maintain the operating performance of our properties, all of which have real economic effect and could materially impact our financial condition and results from operations, the utility of FFO as a measure of our performance is limited. Other REITs may not calculate FFO in accordance with the NAREIT definition and, accordingly, our FFO may not be comparable to such other REITs’ FFO. Accordingly, FFO should be considered only as a supplement to net income computed in accordance with GAAP as a measure of our performance.
CORE FUNDS FROM OPERATIONS (Core FFO)
We present core funds from operations, or core FFO, as a supplemental operating measure because, in excluding certain items that do not reflect core revenue or expense streams, it provides a performance measure that, when compared year over year, captures trends in our core business operating performance. We calculate core FFO by adding to or subtracting from FFO (i) termination fees and other non-core revenues, (ii) transaction expenses, (iii) loss from early extinguishment of debt, (iv) costs on redemption of preferred stock, (v) change in fair value of contingent consideration, (vi) severance-related expense, equity acceleration, and legal expenses, (vii) bridge facility fees, (viii) loss on currency forwards and (ix) other non-core expense adjustments. Because certain of these adjustments have a real economic impact on our financial condition and results from operations, the utility of core FFO as a measure of our performance is limited. Other REITs may not calculate core FFO in a consistent manner. Accordingly, our core FFO may not be comparable to other REITs' core FFO. Core FFO should be considered only as a supplement to net income computed in accordance with GAAP as a measure of our performance.
CONSTANT-CURRENCY CORE FUNDS FROM OPERATIONS
We calculate constant-currency core funds from operations by adjusting the core funds from operations for foreign currency translations.
ADJUSTED FUNDS FROM OPERATIONS (AFFO)
We present adjusted funds from operations, or AFFO, as a supplemental operating measure because, when compared year over year, it assesses our ability to fund dividend and distribution requirements from our operating activities. We also believe that, as a widely recognized measure of the operations of REITs, AFFO will be used by investors as a basis to assess our ability to fund dividend payments in comparison to other REITs, including on a per share and unit basis. We calculate AFFO by adding to or subtracting from core FFO (i) non-real estate depreciation, (ii) amortization of deferred financing costs, (iii) amortization of debt discount/premium, (iv) non-cash stock-based compensation expense, (v) non-cash stock-based compensation expense, (vi) straight-line rent revenue, (vii) straight-line rent expense, (viii) above-and below-market rent amortization, (ix) deferred non-cash tax expense, (x) capitalized leasing compensation, (xi) recurring capital expenditures and (xii) capitalized internal leasing commissions. Other REITs may not calculate AFFO in a consistent manner. Accordingly, our AFFO may not be comparable to other REITs’ AFFO. AFFO should be considered only as a supplement to net income computed in accordance with GAAP as a measure of our performance.
EBITDA and Adjusted EBITDA:
We believe that earnings before interest, loss from early extinguishment of debt, income taxes and depreciation and amortization, or EBITDA, and Adjusted EBITDA (as defined below), are useful supplemental performance measures because they allow investors to view our performance without the impact of non-cash depreciation and amortization or the cost of debt and, with respect to Adjusted EBITDA, change in fair value of contingent consideration, severance related expense, equity acceleration, and legal expenses, transaction expenses, gain (loss) on sale of property, gain on settlement of pre-existing relationship with Telx, loss on currency forwards, other non-core expense adjustments, noncontrolling interests, and preferred stock dividends. Adjusted EBITDA is EBITDA excluding change in fair value of contingent consideration, severance related expense, equity acceleration, and legal expenses, transaction expenses, gain (loss) on sale of property, gain on settlement of pre-existing relationship with Telx, loss on currency forwards, other non-core expense adjustments, noncontrolling interests, preferred stock dividends and issuance costs associated with redeemed preferred stock. In addition, we believe EBITDA and Adjusted EBITDA are frequently used by securities analysts, investors and other interested parties in the evaluation of REITs. Because EBITDA and Adjusted EBITDA are calculated before recurring cash charges including interest expense and income taxes, exclude capitalized costs, such as leasing commissions, and are not adjusted for capital expenditures or other recurring cash requirements of our business, their utility as a measure of our performance is limited. Other REITs may calculate EBITDA and Adjusted EBITDA differently than we do; accordingly, our EBITDA and Adjusted EBITDA may not be comparable to such other REITs’ EBITDA and Adjusted EBITDA. Accordingly, EBITDA and Adjusted EBITDA should be considered only as supplements to net income computed in accordance with GAAP as a measure of our financial performance.
Core EBITDA
Core EBITDA is a non-GAAP financial metric that Telx uses as a supplemental measure of its operating performance that adjusts net loss to eliminate the impact of certain items that it does not consider indicative of its core operating performance. We believe that Core EBITDA is a useful supplemental performance measure because it allows investors to view Telx’s performance without the impact of noncash depreciation and amortization, the cost of debt, deferred rent expenses, stock-based compensation expenses, sponsor management fees and transaction costs. Other companies may calculate Core EBITDA or similar metrics differently; accordingly, the Core EBITDA presented herein may not be comparable to other companies’ Core EBITDA or similar metrics.
NET OPERATING INCOME (NOI) AND CASH NOI
Net Operating Income (NOI) and Cash NOI: Net operating income, or NOI, represents rental revenue, interconnection and other revenue and tenant reimbursement revenue less utilities, rental property operating expenses, repair and maintenance expenses, property taxes and insurance expenses (as reflected in the statement of operations). NOI is commonly used by stockholders, company management and industry analysts as a measurement of operating performance of the company’s rental portfolio. Cash NOI is NOI less straight-line rents, net, and above and below market rent amortization. Cash NOI is commonly used by stockholders, company management and industry analysts as a measure of property operating performance on a cash basis. However, because NOI and cash NOI exclude depreciation and amortization and capture neither the changes in the value of our properties that result from use or market conditions, nor the level of capital expenditures and capitalized leasing commissions necessary to maintain the operating performance of our properties, all of which have real economic effect and could materially impact our results from operations, the utility of NOI and cash NOI as measures of our performance is limited. Other REITs may not calculate NOI and cash NOI in the same manner we do and, accordingly, our NOI and cash NOI may not be comparable to such other REITs’ NOI and cash NOI. Accordingly, NOI and cash NOI should be considered only as supplements to net income computed in accordance with GAAP as measures of our performance.
SAME-CAPITAL CASH NOI
Same-capital Cash NOI is Cash NOI (as defined above) calculated for “Same-capital” properties. “Same-capital” properties are defined as properties owned as of December 31, 2014 with less than 5% of total rentable square feet under development and excludes properties that were undergoing, or were expected to undergo, development activities in 2015-2016, properties classified as held for sale, and properties sold or contributed to joint ventures for all periods presented.

The information included in this presentation contains forward-looking statements. Such statements are based on management’s beliefs and assumptions made based on information currently available to management. Such forward-looking statements include statements relating to: our economic outlook; opportunities and strategies, including ROIC, recycling assets and capital, and sources of growth; the expected effect of foreign currency translation adjustments on our financials; business drivers; sources and uses; our expected development plans and completions, including timing, total square footage, IT capacity and raised floor space upon completion; expected availability for leasing efforts, sales incentive program, mid-market and colocation initiatives; organizational initiatives; our expected product offerings; joint venture opportunities; occupancy and total investment; our expected investment in our properties; our estimated time to stabilization and targeted returns at stabilization of our properties; our expected future acquisitions; acquisitions strategy; available inventory and development strategy; the signing and commencement of leases, and related rental revenue; lag between signing and commencement of leases; our expected same store portfolio growth; our expected growth and stabilization of development completions and acquisitions; our expected mark-to-market rates on lease expirations, lease rollovers and expected rental rate changes; our expected yields on investments; our expectations with respect to capital investments at lease expiration on existing Turn-Key Flex space; barriers to entry; competition; debt maturities; lease maturities; our expected returns on invested capital; estimated absorption rates; our other expected future financial and other results, and the assumptions underlying such results; our top investment markets and market opportunities; our ability to access the capital markets; expected time and cost savings to our customers; our customers’ capital investments; our plans and intentions; future data center utilization, utilization rates, growth rates, trends, supply and demand, and demand drivers; datacenter outsourcing trends; datacenter expansion plans; estimated kW/MW requirements; growth in the overall Internet infrastructure sector and segments thereof; the replacement cost of our assets; the development costs of our buildings, and lead times; estimated costs for customers to deploy or migrate to a new data center; capital expenditures; the effect new leases and increases in rental rates will have on our rental revenues and results of operations; lease expiration rates; our ability to borrow funds under our credit facilities; estimates of the value of our development portfolio; our ability to meet our liquidity needs, including the ability to raise additional capital; the settlement of our forward sales agreements; credit ratings; capitalization rates, or cap rates, potential new markets; the expected impact of our global expansion; dividend payments and our dividend policy; projected financial information and covenant metrics; annualized; other forward-looking financial data; leasing expectations; our exposure to tenants in certain industries; our expectations and underlying assumptions regarding our sensitivity to fluctuations in foreign exchange rates and energy prices; and the sufficiency of our capital to fund future requirements. You can identify forward-looking statements by the use of forward-looking terminology such as “believes,” “expects,” “may,” “will,” “should,” “seeks,” “approximately,” “intends,” “plans,” “pro forma,” “estimates” or “anticipates” or the negative of these words and phrases or similar words or phrases which are predictions of or indicate future events or trends and discussions which do not relate solely to historical matters. Such statements are subject to risks, uncertainties and assumptions, are not guarantees of future performance and may be affected by known and unknown risks, trends, uncertainties and factors that are beyond our control that may cause actual results to vary materially. Some of the risks and uncertainties include, among others, the following: the impact of current global economic, credit and market conditions; current local economic conditions in the geographies in which we operate; decreases in information technology spending, including as a result of economic slowdowns or recession; adverse economic or real estate developments in our industry or the industry sectors that we sell to (including risks relating to decreasing real estate valuations and impairment charges); our dependence upon significant tenants; bankruptcy or insolvency of a major tenant or a significant number of smaller tenants; defaults on or non-renewal of leases by tenants; our failure to obtain necessary debt and equity financing; risks associated with using debt to fund our business activities, including re-financing and interest rate risks, our failure to repay debt when due, adverse changes in our credit ratings or our breach of covenants or other terms contained in our loan facilities and agreements; financial market fluctuations; changes in foreign currency exchange rates; our inability to manage our growth effectively; difficulty acquiring or operating properties in foreign jurisdictions; our failure to successfully integrate and operate acquired or developed properties or businesses, including Telx; the suitability for our properties and data center infrastructure, delays or disruptions in connectivity, failure of our physical infrastructure or services or availability of power; risks related to joint venture investments, including as a result of our lack of control of such investments; delays or unexpected costs in development of properties; decreased rental rates, increased operating costs or increased vacancy rates; increased competition or available supply of data center space; our inability to successfully develop and lease new properties and development space; difficulties in identifying properties to acquire and completing acquisitions; our inability to acquire off-market properties; our inability to comply with the rules and regulations applicable to reporting companies; our failure to maintain our status as a REIT; possible adverse changes to tax laws; restrictions on our ability to engage in certain business activities; environmental uncertainties and risks related to natural disasters; losses in excess of our insurance coverage; changes in foreign laws and regulations, including those related to taxation and real estate ownership and operation; and changes in local, state and federal regulatory requirements, including changes in real estate and zoning laws and increases in real property tax rates. The risks described above are not exhaustive, and additional factors could adversely affect our business and financial performance, including those discussed in our annual report on Form 10-K for the year ended December 31, 2015, as amended, and subsequent filings with the Securities and Exchange Commission. We expressly disclaim any responsibility to update forward-looking statements, whether as a result of new information, future events or otherwise.
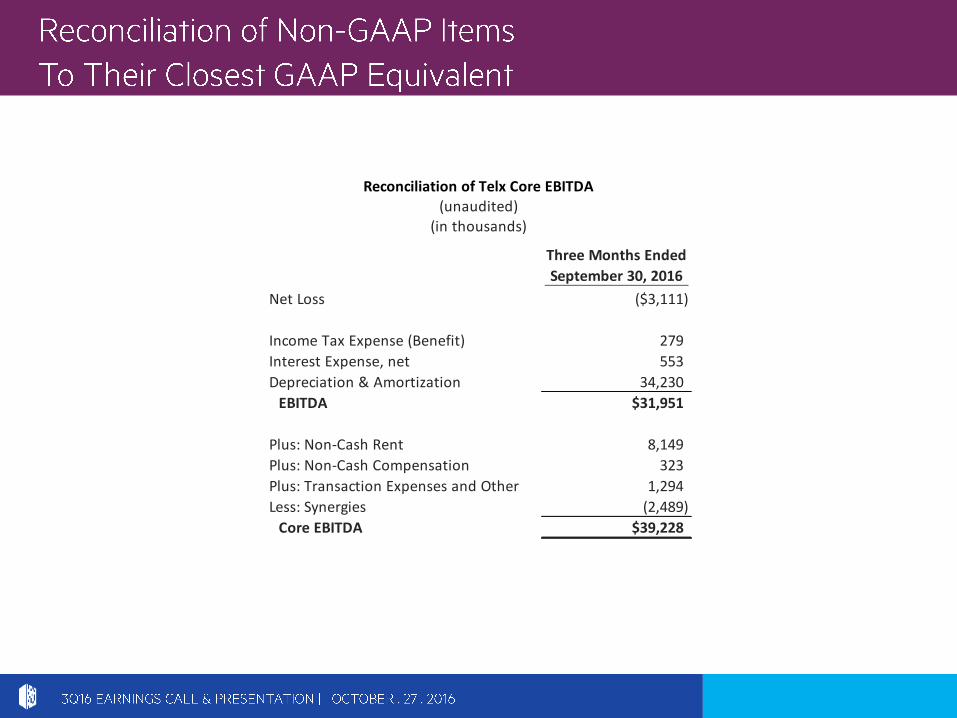
Reconciliation of Telx Core EBITDA(unaudited)
(in thousands)
Three Months Ended
September 30, 2016
Net Loss ($3,111)
Income Tax Expense (Benefit) 279
Interest Expense, net 553
Depreciation & Amortization 34,230
EBITDA $31,951
Plus: Non-Cash Rent 8,149
Plus: Non-Cash Compensation 323
Plus: Transaction Expenses and Other 1,294
Less: Synergies (2,489)
Core EBITDA $39,228

Year Ended
September 30, 2016 September 30, 2015 September 30, 2016 September 30, 2015 December 31, 2015
Net income (loss) available to common stockholders 187,330$ 38,522$ 254,406$ 257,305$ 217,265$
Adjustments:
Noncontrolling interests in operating partnership 3,024 747 4,144 5,150 4,442
Real estate related depreciation and amortization (1) 175,332 135,613 509,287 393,634 563,729
Real estate related depreciation and amortization related to investment in
unconsolidated joint ventures 2,810 2,760 8,423 8,551 11,418
Impairment charge on Telx trade name - - 6,122 - -
Gain on sale of properties (169,000) 207 (170,097) (94,282) (94,604)
Gain on settlement of pre-existing relationships with Telx - - - - (14,355)
FFO available to common stockholders and unitholders 199,496$ 177,849$ 612,285$ 570,358$ 687,895$
Basic FFO per share and unit 1.33$ 1.28$ 4.11$ 4.12$ 4.88$
Diluted FFO per share and unit 1.31$ 1.28$ 4.09$ 4.10$ 4.85$
Weighted average common stock and units outstanding
Basic 149,778 138,468 149,137 138,481 141,108
Diluted 151,765 139,192 149,861 139,051 141,725
(1) Real estate related depreciation and amortization was computed as follows:
Depreciation and amortization per income statement 178,133 136,974 522,743 397,571 570,527
Impairment charge on Telx trade name - - (6,122) - -
Non-real estate depreciation (2,801) (1,361) (7,334) (3,937) (6,798)
175,332$ 135,613$ 509,287$ 393,634$ 563,729$
Year Ended
September 30, 2016 September 30, 2015 September 30, 2016 September 30, 2015 December 31, 2015
FFO available to common stockholders and unitholders -- basic and diluted 199,496$ 177,849$ 612,285$ 570,358$ 687,895$
Weighted average common stock and units outstanding 149,778 138,468 149,137 138,481 141,108
Add: Effect of dilutive securities 1,987 724 724 570 617
Weighted average common stock and units outstanding -- diluted 151,765 139,192 149,861 139,051 141,725
Three Months Ended Nine Months Ended
Nine Months Ended
Digital Realty Trust, Inc. and Subsidiaries
Reconciliation of Net Income Available to Common Stockholders to Funds From Operations (FFO)
(in thousands, except per share and unit data)
(unaudited)
Three Months Ended

Year Ended
September 30, 2016 September 30, 2015 September 30, 2016 September 30, 2015 December 31, 2015
FFO available to common stockholders and unitholders -- diluted 199,496$ 177,849$ 612,285$ 570,358$ 687,895$
Termination fees and other non-core revenues (3)
(2) (580) (93) 680 680
Significant transaction expenses 6,015 11,042 11,530 14,301 17,400
Loss from early extinguishment of debt 18 - 982 148 148
Costs on redemption of preferred stock 10,328 - 10,328 - -
Change in fair value of contingent consideration (4) - (1,594) - (44,276) (44,276) Severance accrual and equity acceleration (5) 2,580 (3,676) 5,536 (979) 5,146
Loss on currency forwards - - 3,082 - -
Bridge facility fees - - - - 3,903
Other non-core expense adjustments (6) (22) 51 (23) (8) 75,261
CFFO available to common stockholders and unitholders -- diluted 218,413$ 183,092$ 643,627$ 540,224$ 746,157$
Diluted CFFO per share and unit 1.44$ 1.32$ 4.29$ 3.89$ 5.26$
(3) Includes one-time fees, proceeds and certain other adjustments that are not core to our business.
(4) Relates to earn-out contingency in connection with Sentrum Portfolio acquisition.
(5) Relates to severance charges related to the departure of company executives.
(6) Includes reversal of accruals and certain other adjustments that are not core to our business.
Digital Realty Trust, Inc. and Subsidiaries
Reconciliation of Funds From Operations (FFO) to Core Funds From Operations (CFFO)
(in thousands, except per share and unit data)
(unaudited)
Three Months Ended Nine Months Ended

September 30, 2016 September 30, 2015 September 30, 2016 September 30, 2015
Net income (loss) available to common stockholders 187,330$ 38,522$ 254,406$ 257,305$
Interest 63,084 48,138 180,254 139,718
Loss from early extinguishment of debt 18 - 982 148
Taxes 3,720 1,850 8,081 6,087
Depreciation and amortization 178,133 136,974 522,743 397,571
EBITDA 432,285 225,484 966,466 800,829
Change in fair value of contingent consideration - (1,594) - (44,276)
Severance accrual and equity acceleration 2,580 (3,676) 5,536 (979)
Transactions 6,015 11,042 11,530 14,301
Gain on sale of properties (169,000) 207 (170,097) (94,282)
Loss on currency forwards - - 3,082 -
Other non-core expense adjustments (22) 51 (23) (8)
Noncontrolling interests 3,247 864 4,600 5,492
Preferred stock dividends 21,530 18,456 66,378 55,367
Issuance costs associated with redeemed preferred stock 10,328 - 10,328 -
Adjusted EBITDA 306,963$ 250,834$ 897,800$ 736,444$
Digital Realty Trust, Inc. and Subsidiaries
Reconciliation of Net Income Available to Common Stockholders to Earnings Before Interest, Taxes, Depreciation and Amortization (EBITDA) and Adjusted EBITDA
(in thousands)
(unaudited)
Nine Months EndedThree Months Ended

September 30, 2016 September 30, 2015 September 30, 2016 September 30, 2015
Rental revenues 203,155$ 205,215$ 616,392$ 614,622$
Tenant reimbursements - Utilities 40,590 40,710 108,800 112,110
Tenant reimbursements - Other 18,743 15,351 53,764 46,973
Interconnection and other 1,661 1,321 4,645 3,741
Total Revenue 264,149 262,597 783,601 777,446
Utilities 42,578 43,154 113,080 117,247
Rental property operating 19,833 21,607 59,679 62,317
Repairs & maintenance 16,854 16,370 48,504 50,783
Property taxes 15,175 10,902 46,673 38,381
Insurance 1,672 1,668 4,962 5,026
Total Expenses 96,112 93,701 272,898 273,754
Net Operating Income 168,037$ 168,896$ 510,703$ 503,692$
Less:
Stabilized straight-line rent 1,719$ 3,422$ 6,163$ 14,202$ Above and below market rent 2,223 2,917 6,931 9,072 Cash Net Operating Income 164,095$ 162,557$ 497,609$ 480,418$
Three Months Ended Nine Months Ended
Digital Realty Trust, Inc. and Subsidiaries
Reconciliation of Same Capital Cash Net Operating Income
(in thousands)
(unaudited)

Nine Months Ended Year Ended
September 30, 2016 December 31, 2015
Core FFO available to common stockholders and unitholders 643,627$ 746,157$
Non-real estate depreciation 7,334 6,798
Amortization of deferred financing costs 7,454 8,481
Amortization of debt discount/premium 2,029 2,296
Non-cash stock-based compensation expense 12,091 11,748
Straight-line rental revenue (19,043) (50,977)
Straight-line rental expense 17,990 5,944
Above- and below-market rent amortization (6,265) (9,336)
Deferred non-cash tax expense 1,117 1,546
Capitalized leasing compensation (7,945) (10,216)
Recurring capital expenditures (54,230) (91,876)
Capitalized internal leasing commissions (5,487) (4,081)
AFFO available to common stockholders and unitholders - basic 598,672$ 616,484$
Weighted-average shares and units outstanding - basic 149,352 141,108
Weighted-average shares and units outstanding - diluted 150,076 141,725
AFFO available to common stockholders and unitholders - basic and diluted 598,672$ 616,484$
AFFO per share - diluted 3.99$ 4.35$
Dividends per share and common unit 2.64$ 3.40$
Diluted AFFO Payout Ratio 66.2% 78.2%
Nine Months Ended Year Ended
Share Count Detail September 30, 2016 December 31, 2015
Weighted Average Common Stock and Units Outstanding 149,352 141,108
Add: Effect of dilutive securities 724 617
Weighted Avg. Common Stock and Units Outstanding - diluted 150,076 141,725
Digital Realty Trust, Inc. and Subsidiaries
Reconciliation of Core Funds From Operations and Adjusted Funds From Operations (AFFO)
(in thousands)
(unaudited)