1 q16 investment commentary
16
Take Hold Of Your Wealth Quarterly Investment Review First Quarter 2016
-
Upload
melanig123 -
Category
Economy & Finance
-
view
426 -
download
0
Transcript of 1 q16 investment commentary

Take Hold Of Your Wealth
Quarterly Investment ReviewFirst Quarter 2016

2
Quarterly Market ReviewFirst Quarter 2016
Overview:
Market Summary
World Stock Market Performance
World Asset Classes
US Stocks
International Developed Stocks
Emerging Markets Stocks
Select Country Performance
Real Estate Investment Trusts (REITs)
Commodities
Fixed Income
Global Diversification
Quarterly Topic: Free Throws
This report features world capital market performance
and a timeline of events for the past quarter. It begins
with a global overview, then features the returns of
stock and bond asset classes in the US and
international markets.
The report also illustrates the performance of globally
diversified portfolios and features a quarterly topic.
Market SummaryFirst Quarter 2016 Index Returns
3
• Past performance is not a guarantee of future results. Indices are not available for direct investment. Index performance does not reflect the expenses associated
with the management of an actual portfolio. Market segment (index representation) as follows: US Stock Market (Russell 3000 Index), International Developed Stocks
(MSCI World ex USA Index [net div.]), Emerging Markets (MSCI Emerging Markets Index [net div.]), Global Real Estate (S&P Global REIT Index), US Bond Market
(Barclays US Aggregate Bond Index), and Global Bond ex US Market (Citigroup WGBI ex USA 1−30 Years [Hedged to USD]). The S&P data are provided by Standard
& Poor's Index Services Group. Russell data © Russell Investment Group 1995–2016, all rights reserved. MSCI data © MSCI 2016, all rights reserved. Barclays data provided by Barclays Bank PLC. Citigroup bond indices © 2016 by Citigroup.
US Stock
Market
International
Developed
Stocks
Emerging
Markets
Stocks
Global
Real
Estate
US Bond
Market
Global
Bond
Market
ex US
1Q 2016 STOCKS BONDS
0.97% -1.95% 5.71% 6.94% 3.03% 4.16%
Since Jan. 2001
Avg. Quarterly Return 1.7% 1.3% 2.9% 2.9% 1.3% 1.2%
Best 16.8% 25.9% 34.7% 32.3% 4.6% 5.5%
Quarter Q2 2009 Q2 2009 Q2 2009 Q3 2009 Q3 2001 Q4 2008
Worst -22.8% -21.2% -27.6% -36.1% -2.4% -3.2%
Quarter Q4 2008 Q4 2008 Q4 2008 Q4 2008 Q2 2004 Q2 2015
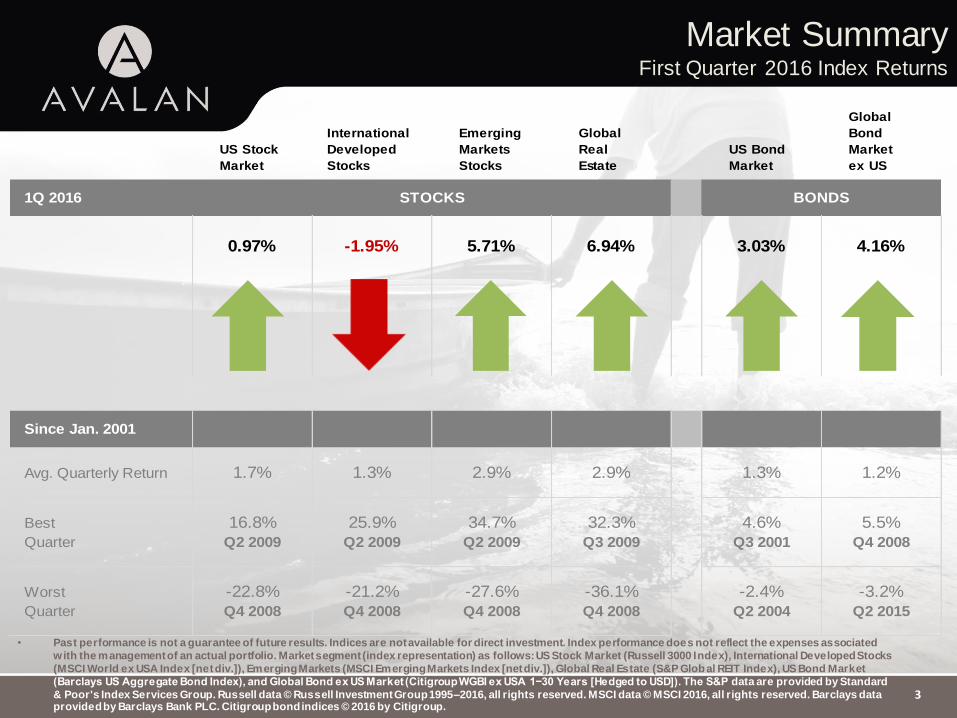
World Stock Market PerformanceFirst Quarter 2016
Graph Source: MSCI ACWI Index. MSCI data © MSCI 2016, all rights reserved.It is not possible to invest directly in an index. Performance does not reflect the expenses associated with management of an actual portfolio. Past performance is not a guarantee of future results.
4
These headlines are not offered to explain market returns. Instead, they serve as a reminder that investors should view daily events from a
longer-term perspective and avoid making investment decisions based solely on the news.
MSCI All Country World Index with selected headlines
125
145
165
185
205
225“China Market Drop
Leads to Worries of
Further Turmoil”
“Dow, S&P Off to the
Worst Starts Ever for
Any Year”
“Oil Skids to
12-Year Low”
“Iran Sanctions
End as Deal Takes
Effect”
“Bank of Japan
Introduces Negative
Interest Rates”
“US Budget Deficit Falls to
Lowest Level since
August 2008”
“Nikkei Posts Largest
Weekly Percentage Drop
since Financial Crisis”
“British Pound Sinks to
Seven-Year Low on
‘Brexit’ Fears”
“US, China Agree to
Sanction North Korea
on Nuclear Program”
“US Economy
Starting 2016 on
Solid Footing”
“Net Worth of US Households
Rose to Record $86.8 Tril l ion
in Fourth Quarter”
“Global Currencies
Soar, Defying
Central Bankers”
“S&P 500 Turns
Positive for the Year”
“US Dollar on Track
for Worst Quarter
since 2010”

World Stock Market Performance First Quarter 2016
5These headlines are not offered to explain market returns. Instead, they serve as a reminder that investors should view daily events from a long-term perspective and avoid making investment decisions based solely on the news.Graph Source: MSCI ACWI Index. MSCI data © MSCI 2016, all rights reserved.It is not possible to invest directly in an index. Performance does not reflect the expenses associated with management of an actual portfolio. Past performance is not a guarantee of future results.
MSCI All Country World Index with selected headlines from past 12 months
140
160
180
200
Mar-2015 Jun-2015 Sep-2015 Dec-2015 Mar-2016
Long Term (2000–Q1 2016)
0.000
50.000
100.000
150.000
200.000
250.000
2000 2005 2010 2015
Last 12
months
“Nasdaq Composite,
S&P 500 Close at New
Highs”
“Home Building
Surges to Best Pace
since 2007”
“Eurozone Finance Ministers
Reject Greek Request for
One-Month Bailout Extension”
“Iran, World Powers
Reach Nuclear Deal”
“US Oil
Prices Fall to
Six-Year Low”
“US Consumer Prices
Rise for Sixth Straight
Month”
“US Second Quarter
GDP Grows 3.9%”
“IMF Downgrades
Global Economic
Outlook Again”
“Paris Attacks Leave
More than 100
Dead”
“European Markets
to Finish 2015 among
World’s Top Performers”
“Dow, S&P Off to the
Worst Starts Ever
for Any Year”
“British Pound Sinks
to Seven-Year Low
on ‘Brexit’ Fears”
“Net Worth of US
Households Rose to
Record $86.8 Tril l ion
in Fourth Quarter”
“S&P 500
Turns Positive
for the Year”

World Asset ClassesFirst Quarter 2016 Index Returns (%)
Looking at broad market indices, emerging markets outperformed developed markets, including the US. Developed markets REITs recorded the highest returns.
The value effect was positive in the US and emerging markets but negative in developed markets outside the US. Small caps outperformed large caps in the non-US markets but underperformed in the US and emerging markets.
8.60
7.79
5.71
5.12
3.03
1.70
1.64
1.35
0.97
0.60
0.05
-1.52
-1.95
-2.57
S&P Global ex US REIT Index (net div.)
MSCI Emerging Markets Value Index (net div.)
MSCI Emerging Markets Index (net div.)
Dow Jones US Select REIT Index
Barclays US Aggregate Bond Index
Russell 2000 Value Index
Russell 1000 Value Index
S&P 500 Index
MSCI Emerging Markets Small Cap Index (net div.)
MSCI World ex USA Small Cap Index (net div.)
One-Month US Treasury Bills
Russell 2000 Index
MSCI World ex USA Index (net div.)
MSCI World ex USA Value Index (net div.)
Past performance is not a guarantee of future results. Indices are not available for direct investment. Index performance doe s not reflect the expenses associated with the management of an actual portfolio. The S&P data is provided by Standard & Poor's Index Services Group. Russell data © Russell Investment Group 1995 –2016, all rights reserved. MSCI data © MSCI 2016, all rights reserved. Dow Jones data (formerly Dow Jones Wilshire) provided by Dow Jones Indexes. Barclays data provided by Barclays Bank PLC.
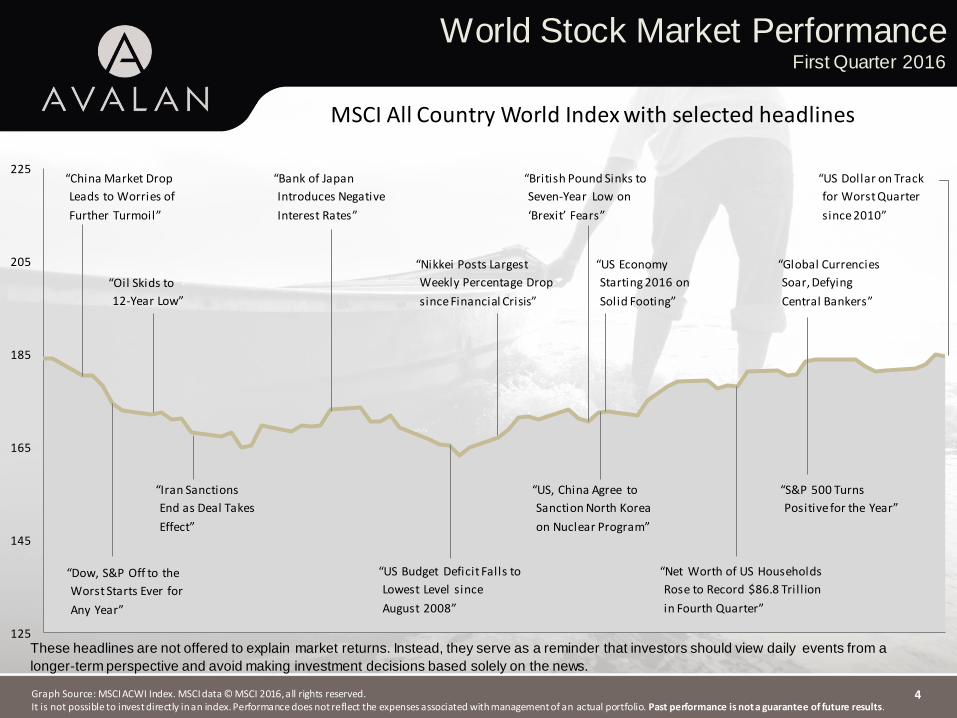
US StocksFirst Quarter 2016 Index Returns
Past performance is not a guarantee of future results. Indices are not available for direct investment. Index performance doe s not reflect the expenses associated with the management of an actual portfolio. Market segment (index representation) as follows: Marketwide (Russell 3000 Index), Large Cap (S&P 500 Index), Large Cap Value (Russell 1000 Value Index), Large Cap Growth (Russell 1000 Growth Index), Small Cap (Russell 2000 Index), Small Cap Value (Russell 2000 Value Index), and Small Cap Growth (Russell 2000 Growth Index). World Market Cap represented by Russell 3000 Index, MSCI World ex USA IMI Index, and MSCI Emerging Markets IMI Index. Russell 3000 Index is used as the proxy for the US market. Russell data © Russell Investment Group 1995–2016, all rights reserved. The S&P data are provided by Standard & Poor's Index Services Group. 7
1.70
1.64
1.35
0.97
0.74
-1.52
-4.68
Small Cap Value
Large Cap Value
Large Cap
Marketwide
Large Cap Growth
Small Cap
Small Cap Growth
Ranked Returns for the Quarter (%)
The broad US equity market recorded slightly positive performance for the quarter.
Value indices outperformed growth indices across all size ranges.
Small caps underperformed large caps.
53%US
Market $22.0 tri l lion
World Market Capitalization—US Period Returns (%) * Annualized
Asset Class YTD 1 Year 3 Years** 5 Years** 10 Years**
Marketwide 0.97 -0.34 11.15 11.01 6.90
Large Cap 1.35 1.78 11.82 11.58 7.01
Large Cap Value 1.64 -1.54 9.38 10.25 5.72
Large Cap Growth 0.74 2.52 13.61 12.38 8.28
Small Cap -1.52 -9.76 6.84 7.20 5.26
Small Cap Value 1.70 -7.72 5.73 6.67 4.42
Small Cap Growth -4.68 -11.84 7.91 7.70 6.00

International Developed StocksFirst Quarter 2016 Index Returns
Past performance is not a guarantee of future results. Indices are not available for direct investment. Index performance doe s not reflect the expenses associated with the management of an actual portfolio.Market segment (index representation) as follows: Large Cap (MSCI World ex USA Index), Small Cap (MSCI World ex USA Small Cap Index), Value (MSCI World ex USA Value Index), and Growth (MSCI World ex USA Growth). All index returns are net of withholding tax on dividends. World Market Cap represented by Russell 3000 Index, MSCI World ex USA IMI Index, and MSCI Emerging Markets IMI Index. MSCI World ex USA IMI Index used as the proxy for the International Developed market. MSCI data © MSCI 2016, all rights reserved. 8
In US dollar terms, developed markets outside the US lagged both the US equity market and emerging markets indices during the quarter.
Small caps outperformed large caps in non-US developed markets.
The value effect was negative in non-US developed markets using broad market indices. Large cap value indices underperformed large cap growth indices. The opposite was true in small caps; small cap value indices outperformed small cap growth indices.
0.60
-1.35
-1.95
-2.57
-3.45
-5.36
-5.78
-6.21
Small Cap
Growth
Large Cap
Value
Ranked Returns (%) Local currency US currency
37%International Developed Market $15.1 tri l lion
World Market Capitalization—International Developed Period Returns (%) * Annualized
Asset Class YTD 1 Year 3 Years** 5 Years** 10 Years**
Large Cap -1.95 -8.44 1.69 1.62 1.80
Small Cap 0.60 1.99 5.54 3.84 3.09
Value -2.57 -12.34 0.07 0.37 0.76
Growth -1.35 -4.52 3.24 2.81 2.77

Past performance is not a guarantee of future results. Indices are not available for direct investment. Index performance doe s not reflect the expenses associated with the management of an actual portfolio.Market segment (index representation) as follows: Large Cap (MSCI Emerging Markets Index), Small Cap (MSCI Emerging Markets Small Cap Index), Value (MSCI Emerging Markets Value Index), and Growth (MSCI Emerging Markets Growth Index). All index returns are net of withholding tax on dividends. World Market Cap represented by Ru ssell 3000 Index, MSCI World ex USA IMI Index, and MSCI Emerging Markets IMI Index. MSCI Emerging Markets IMI Index used as the proxy for the emerging market portion of the market. MSCI data © MSCI 2016 , all rights reserved.
Emerging Markets StocksFirst Quarter 2016 Index Returns
9
In US dollar terms, emerging markets indices outperformed developed markets, including the US.
Value outperformed growth across all size ranges.
Small cap indices underperformed large cap indices.
4.69
2.73
0.80
-1.22
7.79
5.71
3.66
0.97
Value
Large Cap
Growth
Small
Ranked Returns (%) Local currency US currency
10%Emerging Markets$4.2 tri l lion
World Market Capitalization—Emerging Markets Period Returns (%) * Annualized
Asset Class YTD 1 Year 3 Years** 5 Years** 10 Years**
Large Cap 5.71 -12.03 -4.50 -4.13 3.02
Small Cap 0.97 -9.20 -2.69 -2.56 5.08
Value 7.79 -12.56 -6.46 -5.86 2.96
Growth 3.66 -11.60 -2.66 -2.48 2.99
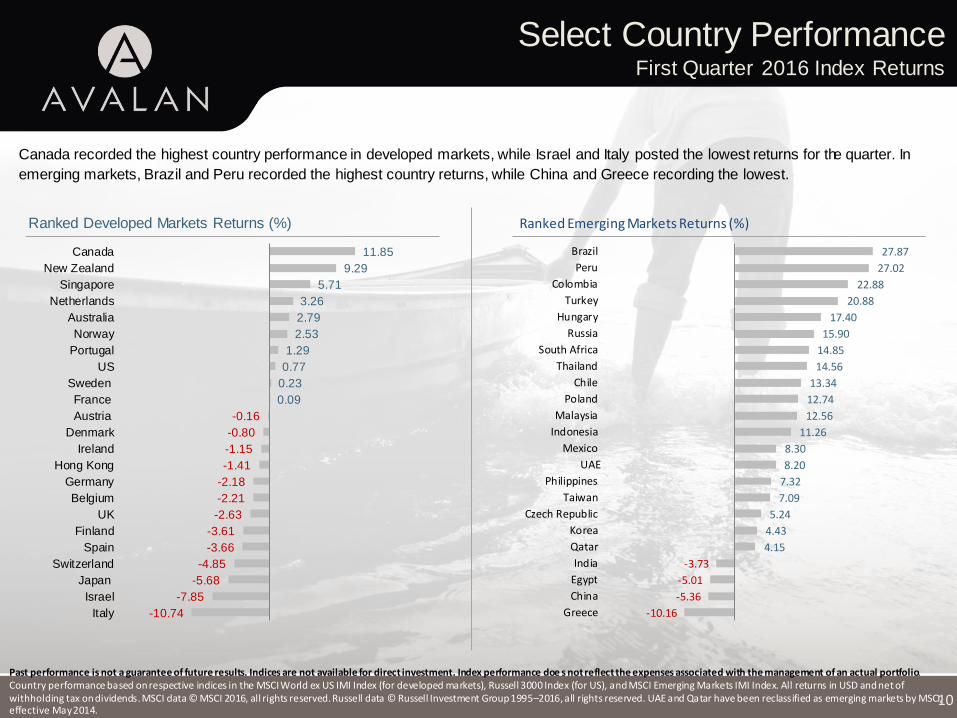
Select Country PerformanceFirst Quarter 2016 Index Returns
Past performance is not a guarantee of future results. Indices are not available for direct investment. Index performance doe s not reflect the expenses associated with the management of an actual portfolio. Country performance based on respective indices in the MSCI World ex US IMI Index (for developed markets), Russell 3000 Index (for US), and MSCI Emerging Markets IMI Index. All returns in USD and net of withholding tax on dividends. MSCI data © MSCI 2016, all rights reserved. Russell data © Russell Investment Group 1995–2016, all rights reserved. UAE and Qatar have been reclassified as emerging markets by MSCI, effective May 2014.
10
Canada recorded the highest country performance in developed markets, while Israel and Italy posted the lowest returns for the quarter. In
emerging markets, Brazil and Peru recorded the highest country returns, while China and Greece recording the lowest.
-3.73
-5.01
-5.36
-10.16
27.87
27.02
22.88
20.88
17.40
15.90
14.85
14.56
13.34
12.74
12.56
11.26
8.30
8.20
7.32
7.09
5.24
4.43
4.15
Brazil
Peru
Colombia
Turkey
Hungary
Russia
South Africa
Thailand
Chile
Poland
Malaysia
Indonesia
Mexico
UAE
Philippines
Taiwan
Czech Republic
Korea
Qatar
India
Egypt
China
Greece
Ranked Emerging Markets Returns (%)
-0.16
-0.80
-1.15
-1.41
-2.18
-2.21
-2.63
-3.61
-3.66
-4.85
-5.68
-7.85
-10.74
11.85
9.29
5.71
3.26
2.79
2.53
1.29
0.77
0.23
0.09
Canada
New Zealand
Singapore
Netherlands
Australia
Norway
Portugal
US
Sweden
France
Austria
Denmark
Ireland
Hong Kong
Germany
Belgium
UK
Finland
Spain
Switzerland
Japan
Israel
Italy
Ranked Developed Markets Returns (%)
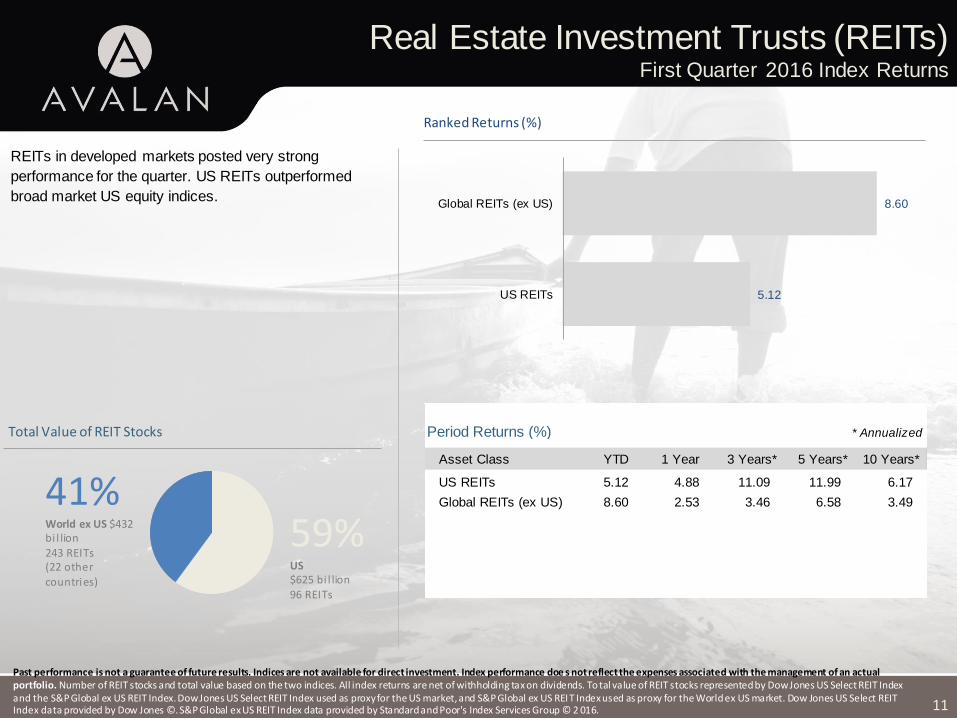
Real Estate Investment Trusts (REITs) First Quarter 2016 Index Returns
Past performance is not a guarantee of future results. Indices are not available for direct investment. Index performance doe s not reflect the expenses associated with the management of an actual portfolio. Number of REIT stocks and total value based on the two indices. All index returns are net of withholding tax on dividends. To tal value of REIT stocks represented by Dow Jones US Select REIT Index and the S&P Global ex US REIT Index. Dow Jones US Select REIT Index used as proxy for the US market, and S&P Global ex US REIT Index used as proxy for the World ex US market. Dow Jones US Select REIT Index data provided by Dow Jones ©. S&P Global ex US REIT Index data provided by Standard and Poor's Index Services Group © 2 016. 11
REITs in developed markets posted very strong
performance for the quarter. US REITs outperformed
broad market US equity indices.
59%US $625 bi l lion96 REITs
41%World ex US $432 bi l lion243 REITs(22 other
countries)
Total Value of REIT Stocks
8.60
5.12
Global REITs (ex US)
US REITs
Ranked Returns (%)
Period Returns (%) * Annualized
Asset Class YTD 1 Year 3 Years** 5 Years** 10 Years**
US REITs 5.12 4.88 11.09 11.99 6.17
Global REITs (ex US) 8.60 2.53 3.46 6.58 3.49

CommoditiesFirst Quarter 2016 Index Returns
12
Commodities were mixed during the first quarter. The
Bloomberg Commodity Index Total Return gained 0.42%.
Precious metals led the index with gold returning 16.40%
and silver returning 11.87%.
Energy was the worst-performing complex. Natural gas
fell 21.81%, while unleaded gas declined 11.81%. WTI
crude oil was down 11.58%.
Grains were slightly positive. Soybean oil gained 10.44%,
but corn fell 3.33%. Livestock was mixed. Lean hogs
gained 7.30%, while live cattle fell 2.51%.
Past performance is not a guarantee of future results. Index is not available for direct investment. Index performance does not reflect the expenses associated with the management of an actual portfolio. All index returns are net of withholding tax on dividends. Securities and commodities data provided by Bloomberg.
Period Returns (%)
Asset Class YTD 1 Year 3 Years** 5 Years** 10 Years**
Commodities 0.42 -19.56 -16.87 -14.15 -6.16
* Annualized
-0.19
-0.21
-0.45
-1.18
-2.51
-3.33
-4.19
-8.46
-11.58
-11.81
-21.81
16.40
12.32
11.87
10.44
7.30
4.88
2.10
1.28
0.54
Gold
Zinc
Silver
Soybean Oil
Lean Hogs
Soybean
Copper
Sugar
Heating Oil
Wheat
Aluminum
Brent Oil
Coffee
Live Cattle
Corn
Nickel
Cotton
WTI Crude Oil
Unleaded Gas
Natural Gas
Ranked Returns for Individual Commodities (%)

Fixed IncomeFirst Quarter 2016 Index Returns
Past performance is not a guarantee of future results. Indices are not available for direct investment. Index performance doe s not reflect the expenses associated with the management of an actual portfolio.1. Barclays US Corporate Bond Index. 2. Barclays Municipal Bond Index. Yield curve data from Federal Reserve. State and local bonds are from the Bond Buyer Index, general obligation, 20 years to maturity, mixed quality. AAA-AA Corporates represent the Bank of America Merrill Lynch US Corporates, AA-AAA rated. A-BBB Corporates represent the Bank of America Merrill Lynch US Corporates, BBB-A rated. Barclays data provided by Barclays Bank PLC. US long-term bonds, bills, inflation, and fixed income factor data © Stocks, Bonds, Bills, and Inflation (SBBI) Yearbook™, Ibbotson Associates, Chicago (annually updated work by Roger G. Ibbotson and Rex A. Sinquefield). Citigroup bond indices © 2016 by Citigroup. The BofA Merrill Lynch Indices are used with permission; © 2016 Merrill Lynch, Pierce, Fenner & Smith Incorporated; all rights reserved. Merrill Lynch, Pierce, Fenner & Smith Incorporated is a wholly owned subsidiary of Bank of America Corporation.
13
Interest rates across the US fixed
income markets generally decreased
during the quarter. The yield on the 5-
year Treasury note fell 55 basis points
(bps) to 1.21%. The yield on the 10-
year Treasury note declined 49 bps to
1.78%. The 30-year Treasury bond
declined 40 bps to finish at 2.61%.
The yield on the 1-year Treasury bill
dipped 6 bps to 0.59%, and the 2-year
Treasury note declined 33 bps to
0.73%. The 3-month T-bill increased 5
bps to yield 0.21%, while the 6-month
T-bill decreased 10 bps to 0.39%.
Short-term corporate bonds gained
1.16%, intermediate-term corporate
bonds returned 2.76%, and long-term
corporate bonds returned 6.83%.1
Short-term municipal bonds returned
0.71% while intermediate-term munis
gained 1.55%. Revenue bonds slightly
outperformed general obligation bonds
for the quarter.2
1.78
3.38
2.38
3.33
10-Year USTreasury
State andLocal
Municipals
AAA-AACorporates
A-BBBCorporates
Bond Yields across Issuers (%)
Period Returns (%)
Asset Class YTD 1 Year 3 Years** 5 Years** 10 Years**
BofA Merrill Lynch Three-Month US Treasury Bill Index 0.07 0.12 0.07 0.08 1.15
BofA Merrill Lynch 1-Year US Treasury Note Index 0.36 0.40 0.29 0.32 1.74
Citigroup WGBI 1-5 Years (hedged to USD) 1.14 1.52 1.47 1.86 3.00
Barclays Long US Government Bond Index 8.06 2.80 6.04 9.52 7.88
Barclays US Aggregate Bond Index 3.03 1.96 2.50 3.78 4.90
Barclays US Corporate High Yield Index 3.35 -3.69 1.84 4.93 7.01
Barclays Municipal Bond Index 1.67 3.98 3.63 5.59 4.86
Barclays US TIPS Index 4.46 1.51 -0.71 3.02 4.63
* Annualized
0
1
2
3
4
US Treasury Yield Curve (%)
1Yr
5Yr
10Yr
30Yr
3/31/16
3/31/15
12/31/15

Global DiversificationFirst Quarter 2016 Index Returns
Diversification does not eliminate the risk of market loss. Past performance is not a guarantee of future results. Indices are not available for direct investment. Index performance doe s not reflect expenses associated with the management of an actual portfolio. Asset allocations and the hypothetical index portfolio returns are for illustrative purposes only and do not represent actual performance. Global Stocks represented by MSCI All Country World Index (gross div.) and Treasury Bills represented by US One -Month Treasury Bills. Globally diversified allocations rebalanced monthly, no withdrawals. Data © MSCI 2016, all rights reserved. Treasury bills © Stocks, Bonds, Bills, and Inflation Yearbook™, Ibbotson Associates, Chicago (annually updated work by Roger G. Ibbotson and Rex A. Sinquefield).
Mar-
12
14
These portfolios illustrate the performance of different
global stock/bond mixes and highlight the benefits of
diversification. Mixes with larger allocations to stocks
are considered riskier but have higher expected
returns over time.
$0
$10,000
$20,000
$30,000
$40,000
$50,000
$60,000
$70,000
$80,000
$90,000
12/1988 12/1993 12/1998 12/2003 12/2008 12/2013
Growth of Wealth: The Relationship between Risk and Return
Stock/Bond Mix
0.05
0.22
0.33
0.38
0.38
100% Treasury Bills
25/75
50/50
75/25
100% Stocks
Ranked Returns (%)
Asset Class YTD 1 Year 3 Years** 5 Years** 10 Years**
100% Stocks 0.38 -3.81 6.10 5.80 4.63
75/25 0.38 -2.64 4.69 4.51 4.01
50/50 0.33 -1.61 3.20 3.12 3.20
25/75 0.22 -0.71 1.65 1.62 2.20
100% Treasury Bills 0.05 0.06 0.03 0.04 1.03
* AnnualizedPeriod Returns (%)
100% Stocks
75/25
50/50
100% Treasury Bills
25/75

Free ThrowsDave Butler offers a sports example to help investors apply discipline in a stressful market
Adapted from “Free Throws,” Advisor Community column, March 2016. Dimensional Fund Advisors LP is an investment advisor registered with the Securities and Exchange Commission. All expressions of opinion are subject to change. This information is intended for educational purposes, and it is not to be construed as an offer, solicitation, recommendation, or endorsement of any particular security, products, or services.
15
“What do you regard as the most difficult
period in the financial markets during your 25
years in the investment business?”
I am often asked this question, usually by people
who already have a framework and opinion as a
result of living through one or several market
downturns. For example, many older advisors
and their clients regard the 1973–1974 bear
market as the toughest period in their investment
lifetime. Middle-aged investors may consider the
tech boom and bust of the late 1990s and early
2000s to be the bellwether event for a generation
of investors who assumed they could get rich on
one great stock pick. Today, just about everyone
remembers the 2008–2009 global financial crisis,
having experienced the anxiety of declining
investment accounts themselves
or knowing someone who did.
The market decline in early 2016 has much of the
same feel as past events. Times like these are
never easy for clients or advisors, who must
confront their concern that “things just might be
different this time.” When in the midst of a market
decline, it is natural to sense that the volatility is
lasting longer and is worse than anything before.
As a result, advisors spend a lot of time talking to
their clients in an effort to alleviate elevated
concerns and fears.
How do we find the words that might help
minimize the fear and anxiety advisors’ clients
feel about their investment portfolios and
retirement security? As you know, no single word
or story can ease their concerns—and certainly
not overnight. The more effective course may be
for advisors to steadily lead clients down a path
from worry to calm through a conversational
approach that emphasizes the importance of
sticking with their plan.
LINKING PROCESS TO DISCIPLINE
I had the opportunity a few weeks ago to speak at
an advisor’s client event in California. As I was
driving to the event, I thought about how
to make the presentation conversational and
ensure the concepts of process and discipline
resonate with the audience.
The audience was a sports-oriented crowd,
and I had about 15 minutes to get across one
important concept that might help them navigate
the choppy markets. Then I remembered an
article I read about world-class athletes and their
approach to success. The author described how
the greatest athletes, from Olympians to all-star
professionals, focus on process rather than
outcome when competing at the highest level. I
thought about this in context of my own college
athletic experience, which, although not at the
Olympic level, involved the same need for calm
and focus during high-pressure moments in
a basketball game.
Imagine yourself playing in a championship
basketball game. Your team is trailing by one
point. You are fouled just as the game clock goes
to zero. You have two free throws. Make both and
you win. Miss them and you lose.
What do you do to contain the pressure and focus
on the task? The great athletes look to process.
While each process may be different, each one
reflects a personal routine a player has performed
thousands of times in practice. For instance, you
start your routine as you approach the free throw
line; you take a deep
(CONTINUED ON PAGE 16)

Free Throws (Continued)Dave Butler offers a sports example to help investors apply discipline in a stressful market
16
breath and imagine the ball going through the
hoop; you step to the line and find the exact spot
(usually a nail right behind the painted line) where
your right foot will anchor; you look at the back (or
front) of the rim and notice the paint peeling or the
net missing a connecting loop—or anything else
to help you concentrate and calm your mind; and
you take the ball from the referee and continue
your routine. You dribble twice and flip the ball in
the air, take a couple of knee bends, find the
grooves on the ball, and spread your fingers
across it. You feel the texture of the ball, the
rough orange leather and the smooth black
rubber on the grooves, and finally time the motion
so that your body, the release of the ball, and the
follow-through of your hand are all in perfect
synch as the ball elevates and descends to the
basket.
The effective athlete does not hope for an
outcome or get nervous or scared as the moment
approaches. He or she immediately falls back on
the tried and tested routine performed countless
times in a more serene environment (practice).
Following the routine dulls the noise of the crowd
and brings clarity of mind.
The same lessons apply to the seasoned
investor. A chaotic market is akin to what the
visiting team experiences in a gym, where
opposing fans and players are doing everything
possible to distract you. You stay focused on a
routine burned into your nature through coaching
and repetitive practice.
The components of the seasoned investor’s
routine are similar: the investment policy
statement, the regular review of family goals and
liquidity needs, and the regular calls an advisor
makes during good and bad markets. These and
other actions are all part of the process
developed to summon that muscle memory
needed in stressful times. Just as the great
athlete navigates through the moments
of pressure in any athletic event, the actions
are part of the routine that allows the individual to
navigate through a chaotic market like we have
today.
I believe there are many stories and anecdotes
that parallel the basic needs of an investor, but it
is up to the advisor to find one that resonates with
a particular client or audience. The example could
involve a great violinist, a world-class chef, or
even a gardener. In each case, there is a story of
discipline behind the person who continually
works to perfect the craft and a reminder of how a
successful investor can do the same.
Statistics and data are the bedrock for the
insights we gain about the capital markets, but it
is often the conversational story that can help
clients of advisors focus on the simplest and most
important tenets of investment success.
Regardless of the market or time period, advisors
can encourage their clients to maintain the
discipline needed to follow a process, which can
lead to a great investment experience.