4 q16 earnings presentation final
33
4Q16 EARNINGS PRESENTATION NYSE: DOOR
-
Upload
masoniteinvestors -
Category
Investor Relations
-
view
3.095 -
download
0
Transcript of 4 q16 earnings presentation final

4Q16 EARNINGS PRESENTATION
NYSE: DOOR

2 2
Safe Harbor / Non-GAAP Financial Measures
SAFE HARBOR / FORWARD LOOKING STATEMENT
This investor presentation contains forward-looking information and other forward-looking statements within the meaning of applicable Canadian and/or U.S. securities laws, including our discussion of
our 2017 outlook or long term growth framework, housing and other markets, and the effects of our strategic initiatives. When used in this Investor Presentation, such forward-looking statements may
be identified by the use of such words as “may,” “might”, “could,” “will,” would,” “should,” “expect,” “believes,” “outlook,” “predict,” “forecast,” “framework,” “objective,” “remain,” “anticipate,” “estimate,”
“potential,” “continue,” “plan,” “project,” “targeting,” or the negative of these terms or other similar terminology.
Forward-looking statements involve significant known and unknown risks, uncertainties and other factors that may cause the actual results, performance or achievements of Masonite, or industry
results, to be materially different from any future plans, goals, targets, objectives, results, performance or achievements expressed or implied by such forward-looking statements. As a result, such
forward-looking statements should not be read as guarantees of future performance or results, should not be unduly relied upon, and will not necessarily be accurate indications of whether or not such
results will be achieved. Factors that could cause actual results to differ materially from the results discussed in the forward-looking statements include, but are not limited to, our ability to successfully
implement our business strategy; general economic, market and business conditions; levels of residential new construction; residential repair, renovation and remodeling; and non-residential building
construction activity; the United Kingdom passage of legislation authorizing its exit from the European Union; competition; our ability to manage our operations including integrating our recent
acquisitions and companies or assets we acquire in the future; our ability to generate sufficient cash flows to fund our capital expenditure requirements, to meet our pension obligations, and to meet our
debt service obligations, including our obligations under our senior notes and our ABL Facility; labor relations (i.e., disruptions, strikes or work stoppages), labor costs and availability of labor; increases
in the costs of raw materials or any shortage in supplies; our ability to keep pace with technological developments; the actions taken by, and the continued success of, certain key customers; our ability
to maintain relationships with certain customers; the ability to generate the benefits of our restructuring activities; retention of key management personnel; environmental and other government
regulations; and limitations on operating our business as a result of covenant restrictions under our existing and future indebtedness, including our senior notes and our ABL Facility.
NON-GAAP FINANCIAL MEASURES
Our management reviews net sales and Adjusted EBITDA (as defined below) to evaluate segment performance and allocate resources. Net assets are not allocated to the reportable segments.
Adjusted EBITDA is a non-GAAP financial measure which does not have a standardized meaning under GAAP and is unlikely to be comparable to similar measures used by other companies. Adjusted
EBITDA should not be considered as an alternative to either net income or operating cash flows determined in accordance with GAAP. Additionally, Adjusted EBITDA is not intended to be a measure of
free cash flow for management's discretionary use, as it does not include certain cash requirements such as interest payments, tax payments and debt service requirements. Beginning with the third
quarter of 2015, we revised our calculation of Adjusted EBITDA to separately exclude loss (gain) on disposal of subsidiaries. This definition of Adjusted EBITDA differs from the definitions of EBITDA
contained in the indenture governing the 2023 Notes and the credit agreement governing the ABL Facility. Adjusted EBITDA, as calculated under our ABL Facility or senior notes would also include,
among other things, additional add-backs for amounts related to: cost savings projected by us in good faith to be realized as a result of actions taken or expected to be taken prior to or during the
relevant period; fees and expenses in connection with certain plant closures and layoffs; and the amount of any restructuring charges, integration costs or other business optimization expenses or
reserve deducted in the relevant period in computing consolidated net income, including any one-time costs incurred in connection with acquisitions. The tables in the appendix to this presentation
reconcile Adjusted EBITDA to net income (loss) attributable to Masonite for the periods indicated. We are not providing a quantitative reconciliation of our Adjusted EBITDA outlook to the corresponding
GAAP information because the GAAP measures that we exclude from our Adjusted EBITDA outlook are difficult to predict and are primarily dependent on future uncertainties.
Adjusted EBITDA margin is defined as Adjusted EBITDA divided by Net Sales. Management believes this measure provides supplemental information on how successfully we operate our business.
Adjusted EPS for the quarter ended January 1, 2017 and January 3, 2016 is diluted earnings per common share attributable to Masonite (EPS) less asset impairment charges, loss (gain) on disposal of
subsidiaries and loss on extinguishment of debt, net of related tax expense (benefit). Management uses this measure to evaluate the overall performance of the Company and believes this measure
provides investors with helpful supplemental information regarding the underlying performance of the Company from period to period. This measure may be inconsistent with similar measures
presented by other companies.

3
Agenda
1. Company Overview
2. 2016 Financial Review
3. Financial Outlook
4. Summary / Q&A

4
COMPANY OVERVIEW

5 5
$105.9
$137.1
$204.2
$252.5
6.1%
7.5%
10.9%
12.8%
2013 2014 2015 2016
2016 Full Year Highlights
Strong NA Residential sales volume
Continued strength at DSI despite
uncertainty in UK
6th consecutive year of positive AUP
Q4 was the 15th consecutive quarter of
positive AUP
Digital Innovation Center opened
Transformation projects in Architectural
business
Execution of share repurchase program
$150 million authorized on 2/24/16
$109 million, or 1.7 million shares,
purchased in 2016
Authorized up to an additional $200
million on February 22, 2017
Adj. EBITDA* Growth & Margin Expansion
2016 Adjusted EBITDA* increased 24%
2016 incremental margins >45%
Solid progress toward achieving long term
growth framework objectives
(*) – See safe harbor/non-GAAP financial measures on page 2 for definitions and other information and appendix for non-GAAP reconciliations
($ in millions)

6 6
New Business Wins
2016 Execution
2017 Wins
Approx. $50mm of incremental net sales
Successful shift from Reliabilt private label
to Masonite branded products
Outperformed the millwork category at
new stores
Millwork partner of the year at Home
Depot Canada (2015 & 2016)
Home Depot Florida business win
New products and assortment
improvements to drive higher AUP
Transition plans to new Masonite brand
imagery

7 7

8 8
Brand Re-Launch
Change the conversation around
doors
Make the door
category more relevant
Take a leadership
position by creating a
differentiated Masonite brand
experience
Rise above the sea of sameness
and stand apart from others in the
category

9 9
Brand Re-Launch – Brand Pillars
Exceptional Quality
Unmatched Service
Customer-Driven
Innovation
Trend Leadership

10 10
Brand Re-Launch – Key Enablers
Innovative Products
Innovative Marketing
Innovative Routes to Market
Masonite Innovation Center, W. Chicago, IL

11 11
Brand Re-Launch – All New Website
Innovating the digital approach on how to buy
a door at the new masonite.com

12 12
Digital Innovations
Opened Digital Innovation
Center in Ybor City, Tampa
USA Wood Door – All new
web-based door configurator
Continued roll out of ERP in
Architectural business

13 13
Manufacturing Capabilities
New fiberglass press lines
Digital Initiatives
ERP, configurator tools
Automation Initiatives
UK paint line
Investing in the Business
Previous Projects Capex Spending
30%
70%
Maintenance Capex Strategic/Growth Capex
Future Projects
Productivity Improvements
Interior plant re-configuration
Manufacturing Efficiency
Harmonize architectural product
specifications
Cost Reduction
Optimize wood components yield
Increased investment in 2016 and
2017 to support:
Market growth
Digital capabilities
Product development
Operational excellence

14
FINANCIAL REVIEW
15 15
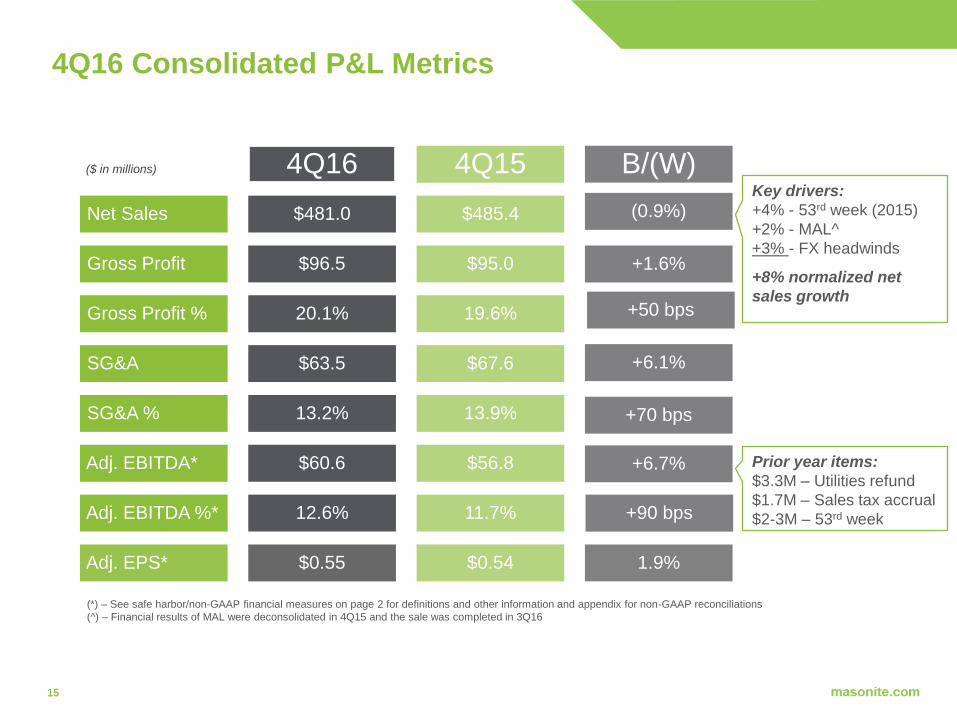
4Q16 Consolidated P&L Metrics
Net Sales
Gross Profit
Gross Profit %
SG&A
SG&A %
Adj. EBITDA*
Adj. EBITDA %*
Adj. EPS*
4Q16
$481.0
$96.5
20.1%
$63.5
13.2%
$60.6
12.6%
$0.55
4Q15
$485.4
$95.0
19.6%
$67.6
13.9%
$56.8
11.7%
$0.54
B/(W)
(0.9%)
+1.6%
+50 bps
+6.1%
+70 bps
+6.7%
+90 bps
1.9%
($ in millions)
Key drivers:
+4% - 53rd week (2015)
+2% - MAL^
+3% - FX headwinds
+8% normalized net
sales growth
Prior year items:
$3.3M – Utilities refund
$1.7M – Sales tax accrual
$2-3M – 53rd week
(*) – See safe harbor/non-GAAP financial measures on page 2 for definitions and other information and appendix for non-GAAP reconciliations
(^) – Financial results of MAL were deconsolidated in 4Q15 and the sale was completed in 3Q16

16
North American Residential
9% sales volume growth in 4Q
Double digit growth in retail
-0.2% AUP in 4Q16, +1.2% AUP in FY16
Stronger relative growth continues in interior vs.
entry creating AUP headwind
Decline in Mexican peso negatively impacted net sales
by approximately $2 million in 4Q16.
Notified of additional business wins in retail and
wholesale to begin in 2017
($ in millions) 2016 2015 Diff 2016 2015 Diff
Net Sales $336.7 $310.9 +8% $1,351.3 $1,193.2 +13%
Net sales ex-Fx +9% +15%
Adj. EBITDA $49.9 $45.6 +9% $212.6 $165.6 +28%
Margin 14.8% 14.7% +10bps 15.7% 13.9% +180bps
Fourth Quarter Full Year
(*) – See safe harbor/non-GAAP financial measures on page 2 for definitions and other information and appendix for non-GAAP reconciliations
*

17
Europe
Uneven UK new housing market
Private housing market remains relatively stable
Public housing market weaker on Brexit-related
uncertainty
RRR demand remains robust, with DSI delivering 15%
sales volume growth in 4Q
Weakness in Pound Sterling negatively impacted net
sales by approximately $13 million in 4Q16
Price increase across all UK brands effective as of
January 1, 2017
($ in millions) 2016 2015 Diff 2016 2015 Diff
Net Sales $68.3 $81.3 -16% $301.2 $311.8 -3%
Net sales ex-Fx +0.5% +6%
Adj. EBITDA $7.9 $9.9 -20% $38.8 $30.5 27%
Margin 11.6% 12.2% -60bps 12.9% 9.8% +310bps
Fourth Quarter Full Year
(*) – See safe harbor/non-GAAP financial measures on page 2 for definitions and other information and appendix for non-GAAP reconciliations
*

18
Architectural
Strong 4Q15 December sales volume contributed to
difficult 4Q16 comparable
AUP growth driven by mix shift to higher end doors
Demand increase of high end doors through our
Harring brand
High demand in lower end stock doors
experienced in 4Q15
Digitizing the quick ship model at USA Wood Door
($ in millions) 2016 2015 Diff 2016 2015 Diff
Net Sales $70.2 $74.8 -6% $297.9 $291.8 +2%
Net sales ex-Fx -6% +3%
Adj. EBITDA $5.8 $4.9 +18% $25.2 $23.3 +8%
Margin 8.3% 6.6% +170bps 8.4% 8.0% +40bps
Fourth Quarter Full Year
(*) – See safe harbor/non-GAAP financial measures on page 2 for definitions and other information and appendix for non-GAAP reconciliations
*

19 19
2016 Consolidated P&L Metrics
Net Sales
Gross Profit
Gross Profit %
SG&A
SG&A %
Adj. EBITDA*
Adj. EBITDA %*
Adj. EPS*
2016
$1,974.0
$409.6
20.8%
$260.4
13.2%
$252.5
12.8%
$3.03
2015
$1,872.0
$350.9
18.7%
$244.1
13.0%
$204.2
10.9%
$1.49
B/(W)
+5.4%
+16.7%
+210 bps
(6.7%)
(20 bps)
+23.7%
+190 bps
+103.4%
($ in millions)
Net sales +11%
excluding Fx and
adjusted for MAL
(*) – See safe harbor/non-GAAP financial measures on page 2 for definitions and other information and appendix for non-GAAP reconciliations

20 20
Liquidity, Credit & Debt Profile
Credit & Debt (millions of USD)
TTM Adj. EBITDA* $252.5 $204.2
TTM Interest Expense $28.2 $32.9
Total Debt $470.7 $468.9
Net Debt^ $399.0 $379.7
2016 2015
12 months
ended 1/1/2017
12 months
ended 1/3/2016
Unrestricted cash $71.7 $89.2
Total available liquidity $222.8 $234.0
Cash flow from operations $174.0 $161.0
Capital expenditures $82.3 $51.1
Share repurchases $109.2 NA
Liquidity & Cash Flow (millions of USD)
(*) – See safe harbor/non-GAAP financial measures on page 2 for definitions and other information and appendix for non-GAAP reconciliations
(^) – Net debt equals total debt less unrestricted cash

21 21
2017 Viewpoints*
Continued U.S. housing market growth
Expect mid to high-single digit growth in
U.S. housing completions
Expect mid-single digit growth in the
U.S. RRR market
PLR wins accretive to 2017
Market outperformance from Door Stop
International
New products and value-added services
continue supporting higher AUP
Price increases in all business
segments
Tightening labor market in U.S.
Increased hiring costs
Lower productivity from recent
employee hires
Uncertainty in UK new housing market
Modest commodities increases
Uncertainty around U.S. tax and
regulatory environment
Tailwinds Headwinds
(*) – Our 2017 viewpoints are a forward-looking statement and subject to risks and uncertainties. See "Safe Harbor/Forward Looking Statement”

22 22
2017 Outlook*
2017 P&L Metrics
Net Sales
Adjusted EPS^
+ 7% - 9% (+ 8% - 10% excl. Fx)
$4.10 - $4.60
Adjusted EBITDA ^ $285 - $305M
Capital Expenditures $80 - $85M
Tax Rate 19% – 23%
Cash Taxes $9 - $12M
Other Key Items
(*) – Based on 2017 viewpoints highlighted on prior page. Our 2017 outlook is a forward-looking statement and subject to risks and uncertainties. See "Safe
Harbor/Forward Looking Statement”
( )̂ – See definition of non-GAAP financial measures on page 2. We are not providing a quantitative reconciliation of our Adjusted EBITDA or Adjusted EPS outlook to the
corresponding GAAP information because the GAAP measures that we exclude from our Adjusted EBITDA and Adjusted EPS outlook are difficult to predict and are
primarily dependent on future uncertainties.

23 23
Long-Term Growth Framework*
Margin Factors
Cost Factors
Volume Leverage
~25% incremental margin on
volume
Return to 1.5M housing starts in
U.S. by 2019
Flat housing market in Canada
Mid single digit growth in RRR
market
Mid single digit growth in
non-residential construction
Uneven growth in UK new
residential construction
Introduction of new products at
higher price points
Leverage new branding to bring
focus to richer mix of products
Value-added services with higher
margin profiles
Pre-hanging and
pre-finishing
Quick ship options
Custom machining and
finishing
Tightening labor market
Longer term materials cost
inflation
Focus on increasing factory
productivity
Continued investments in R&D
(*) - Company long term growth framework is a forward-looking statement and subject to risks and uncertainties. See "Safe Harbor/Forward Looking Statement”

24 24
12.8%
2016 2019
$2.0
2016 2019
Long-Term Growth Framework
7% - 9%
CAGR
16% - 17%
Adjusted EBITDA* Margin
Net Sales
( )̂ - Company long term growth framework is a forward-looking statement and subject to risks and uncertainties. See "Safe Harbor/Forward Looking Statement”
(*) – See definition of Adjusted EBITDA on page 2. We are not providing a quantitative reconciliation of our Adjusted EBITDA or Adjusted EPS outlook to the corresponding GAAP information because the GAAP
measures that we exclude from our Adjusted EBITDA and Adjusted EPS outlook are difficult to predict and are primarily dependent on future uncertainties.
Cash Flow Deployment
CapEx to Support Growth
Opportunistic Share
Repurchase
Strategic Acquisitions
Fund Working Capital

25
SUMMARY

26 26
• More efficient footprint
• Simplify the product
offering
• Improve productivity
• Decrease lead times
Architectural Transformation Improving Productivity Elevating the Door Category
• Efficient routes to market
• Automate the process
• Digital tools to improve
ordering, manufacturing,
and delivery
• Inspiring consumers
• Trend leaders
• Elevate the experience
• Drive higher AUP
STRATEGIC OUTLOOK

27
SUMMARY
Strong 2017 outlook: +7-9% Net Sales and
$285 - $305 million Adjusted EBITDA*
2016 Net sales of +11%, excluding Fx and adjusted
for the deconsolidation of MAL
Sixth consecutive year of positive AUP
Adjusted EBITDA +24%
Adjusted EBITDA margin of 12.8%
190bp adjusted EBITDA* margin expansion
More than 2x margins since going public
Repurchased $109 million of shares & additional
$200 million authorized
Investing to elevate the Door Category, Transform
Architectural and Improve Productivity
(*) – See safe harbor/non-GAAP financial measures on page 2 for definitions and other information and appendix for non-GAAP reconciliations

28
APPENDIX

29 29
4Q15 Net Sales
Forex
Volume*
AUP
Other
4Q16 Net Sales
NA Residential
$310.9
($1.9)
$27.6
($0.6)
$0.7
$336.7
Europe
$81.3
($13.4)
($1.2)
$2.8
($1.2)
$68.3
Architectural
$74.8
--
($9.5)
$5.3
($0.4)
$70.2
C&O
$18.5
($0.1)
($12.0)
--
($0.4)
$5.9
Segment Sales Walks
+9% ex Fx +0.5% ex Fx -6% Reflects sale of S.
Africa
($ in millions)

30 30
2015 Net Sales
Forex
Volume*
AUP
Other
2016 Net Sales
NA Residential
$1,193.2
($17.8)
$160.4
$14.2
$1.3
$1,351.3
Europe
$311.8
($28.0)
($4.8)
$24.2
($2.0)
$301.2
Architectural
$291.8
($1.3)
($5.4)
$10.4
$2.4
$297.9
C&O
$75.1
($0.3)
($50.4)
--
($0.3)
$23.6
Segment Sales Walks
+15% ex Fx +6% ex Fx +3% ex Fx Reflects sale of S.
Africa
($ in millions)

31 31
Reconciliation of Adj. EBITDA to net income
(loss) attributable to Masonite
Three Months Ended January 1, 2017
(In thousands)
North American
Residential Europe Architectural Corporate &
Other Total
Adjusted EBITDA $ 49,930 $ 7,905 $ 5,828 $ (3,014 ) $ 60,649
Less (plus):
Depreciation 7,447 1,972 2,797 2,010 14,226
Amortization 870 1,997 1,773 888 5,528
Share based compensation expense — — — 6,868 6,868
Loss (gain) on disposal of property, plant and equipment 252
391
378
—
1,021
Restructuring costs — (2 ) 1,313 3 1,314
Asset impairment — — 1,511 — 1,511
Interest expense (income), net — — — 7,028 7,028
Other expense (income), net — 411 — (1,156 ) (745 )
Income tax expense (benefit) — — — 6,196 6,196
Loss (income) from discontinued operations, net of tax —
—
—
144
144
Net income (loss) attributable to non-controlling interest 767
—
—
1,361
2,128
Net income (loss) attributable to Masonite $ 40,594
$ 3,136
$ (1,944 ) $ (26,356 ) $ 15,430
Three Months Ended January 3, 2016
(In thousands)
North American
Residential Europe Architectural Corporate &
Other Total
Adjusted EBITDA $ 45,615 $ 9,905 $ 4,925 $ (3,605 ) $ 56,840
Less (plus):
Depreciation 7,896 2,157 2,145 2,692 14,890
Amortization 1,295 2,806 2,311 1,069 7,481
Share based compensation expense — — — 6,261 6,261
Loss (gain) on disposal of property, plant and equipment 53
292
436
5
786
Restructuring costs 2 87 — 1,106 1,195
Loss (gain) on disposal of subsidiaries — — — 30,263 30,263
Interest expense (income), net — — — 7,165 7,165
Other expense (income), net (50 ) 882 — 950 1,782
Income tax expense (benefit) — — — (1,595 ) (1,595 )
Loss (income) from discontinued operations, net of tax —
—
—
247
247
Net income (loss) attributable to non-controlling interest 866
—
—
717
1,583
Net income (loss) attributable to Masonite $ 35,553
$ 3,681
$ 33
$ (52,485 ) $ (13,218 )
Year Ended January 1, 2017
(In thousands)
North American
Residential Europe Architectural Corporate &
Other Total
Adjusted EBITDA $ 212,619 $ 38,795 $ 25,160 $ (24,061 ) $ 252,513
Less (plus):
Depreciation 31,159 8,480 9,622 8,343 57,604
Amortization 4,383 9,069 7,999 3,276 24,727
Share based compensation expense — — — 18,790 18,790
Loss (gain) on disposal of property, plant and equipment 1,094
564
484
(31 ) 2,111
Restructuring costs — 19 1,313 113 1,445
Asset impairment — — 1,511 — 1,511
Loss (gain) on disposal of subsidiaries — (1,431 ) — (5,144 ) (6,575 )
Interest expense (income), net — — — 28,178 28,178
Other expense (income), net — 557 — (2,516 ) (1,959 )
Income tax expense (benefit) — — — 21,787 21,787
Loss (income) from discontinued operations, net of tax —
—
—
752
752
Net income (loss) attributable to non-controlling interest 3,389
—
—
2,131
5,520
Net income (loss) attributable to Masonite $ 172,594
$ 21,537
$ 4,231
$ (99,740 ) $ 98,622
Year Ended January 3, 2016
(In thousands)
North American
Residential Europe Architectural Corporate &
Other Total
Adjusted EBITDA $ 165,560 $ 30,468 $ 23,281 $ (15,112 ) $ 204,197
Less (plus):
Depreciation 31,456 8,105 8,223 11,376 59,160
Amortization 4,954 6,860 8,428 3,483 23,725
Share based compensation expense — — — 13,236 13,236
Loss (gain) on disposal of property, plant and equipment 796
325
548
(298 ) 1,371
Restructuring costs 10 2,501 — 3,167 5,678
Asset impairment — 9,439 — — 9,439
Loss (gain) on disposal of subsidiaries — 29,721 — 30,263 59,984
Interest expense (income), net — — — 32,884 32,884
Loss on extinguishment of debt — — — 28,046 28,046
Other expense (income), net (50 ) 1,087 — (2,794 ) (1,757 )
Income tax expense (benefit) — — — 14,172 14,172
Loss (income) from discontinued operations, net of tax —
—
—
908
908
Net income (loss) attributable to non-controlling interest 3,323
—
—
1,139
4,462
Net income (loss) attributable to Masonite $ 125,071
$ (27,570 ) $ 6,082
$ (150,694 ) $ (47,111 )

32 32
Reconciliation of Adj. EBITDA to net income
(loss) attributable to Masonite
(In thousands)
January 1,
2017
January 3,
2016
December 28,
2014
December 29,
2013
December 30,
2012
January 1,
2012
January 2,
2011
Adjusted EBITDA 252,513$ 204,197$ 137,087$ 105,877$ 97,261$ 81,994$ 80,678$
Less (plus):
Depreciation 57,604 59,160 60,622 62,080 63,348 60,784 58,633
Amortization 24,727 23,725 21,722 17,058 15,076 10,569 8,092
Share based compensation expense 18,790 13,236 9,605 7,752 6,517 5,888 9,626
Loss (gain) on disposal of property, plant and equipment 2,111 1,371 3,816 (1,775) 2,724 3,654 1,301
Registration and listing fees — — — 2,421 — — —
Restructuring costs 1,445 5,678 11,137 10,630 11,431 5,116 7,000
Asset impairment 1,511 9,439 18,202 1,904 1,350 2,516 —
Loss (gain) on disposal of subsidiaries (6,575) 59,984 — — — — —
Interest expense (income), net 28,178 32,884 41,525 33,230 31,454 18,068 245
Loss on extinguishment of debt — 28,046 — — — — —
Other expense (income), net (1,959) (1,757) (587) 2,316 528 1,111 1,030
Income tax expense (benefit) 21,787 15,168 4,533 (21,377) (13,365) (21,560) (11,396)
Loss (income) from discontinued operations, net of tax 752 908 630 598 (1,480) 303 1,718
Net income (loss) attributable to non-controlling interest 5,520 4,462 3,222 2,050 2,923 2,079 1,390
Net income (loss) attributable to Masonite 98,622 (48,107) (37,340) (11,010) (23,245) (6,534) 3,039
Twelve months ended,

33 33
Reconciliation of Adj. EPS to net income
(loss) attributable to Masonite
Three Months Ended Year Ended
(In thousands) January 1,
2017 January 3,
2016 January 1,
2017 January 3,
2016
Net income (loss) attributable to Masonite $ 15,430 $ (13,218 ) $ 98,622 $ (47,111 )
Add: Asset impairment 1,511 — 1,511 9,439
Add: Loss (gain) on disposal of subsidiaries — 30,263 (6,575 ) 59,984
Add: Loss on extinguishment of debt — — — 28,046
Tax impact of adjustments — — 737 (3,248 )
Adjusted net income (loss) attributable to Masonite $ 16,941 $ 17,045 $ 94,295 $ 47,110
Diluted earnings (loss) per common share attributable to Masonite ("EPS") $ 0.50
$ (0.43 ) $ 3.17
$ (1.56 )
Diluted adjusted earnings (loss) per common share attributable to Masonite ("Adjusted EPS") $ 0.55
$ 0.54
$ 3.03
$ 1.49
Shares used in computing diluted EPS 31,010,490 30,402,479 31,101,076 30,266,747
Incremental shares issuable under share compensation plans and warrants —
1,171,874
—
1,304,745
Shares used in computing diluted Adjusted EPS 31,010,490 31,574,353 31,101,076 31,571,492