
DIGITAL MYLAR: A TOOL TO ATTRIBUTE … sheets were transparent, ... This led to technology ... in...
7
Remote Sensing for Field Users Proceedings of the Tenth Forest Service Remote Sensing Applications Conference Salt Lake City, Utah April 5-9 2004 DIGITAL MYLAR: A TOOL TO ATTRIBUTE VEGETATION POLYGON FEATURES OVER HIGH-RESOLUTION IMAGERY Jess T. Clark, Remote Sensing Analyst Mark V. Finco, Ph.D., Senior Scientist USDA Forest Service, Remote Sensing Applications Center, Salt Lake City, UT 84119 [email protected] , [email protected] Ralph Warbington, Section Head, Planning and Inventory Brian Schwind, Project Leader – Remote Sensing USDA Forest Service, Pacific Southwest Region, Remote Sensing Lab, Sacramento, CA 95814 [email protected] , [email protected] ABSTRACT Digital Mylar was developed as a joint software development project between the US Forest Service Remote Sensing Applications Center (RSAC) and the Pacific Southwest Region (Region 5) Remote Sensing Lab. Digital Mylar provides templates for tree size and cover and other tools to help users objectively attribute vegetation polygon features digitized or derived from high-resolution imagery. High-resolution imagery is an important source of information for forest and range managers. There is a need to conduct consistent mapping to national standards among forests to produce existing vegetation GIS layers depicting floristic levels and attributes. The Digital Mylar templates aid in accomplishing consistency as these GIS data layers are captured and recorded. This tool exists for the ArcGIS 8 platform, and continues to be developed to help users make objective observations and records from the high-resolution imagery. INTRODUCTION Methods for photo interpretation, attribution, and implementation into a GIS have evolved significantly during the last decade. Traditional methods included the acquisition of aerial photography (emulsion-coated film). With the hardcopy photos, trained analysts began the process of interpretation by drafting polyons and labels directly over aerial photos. To do this, they often started with draping a mylar or acetate sheet over the photo, securing it so it would not move once placed into position. These sheets were transparent, allowing the detail from the photo to show through, and this sheet also allowed analysts to draw directly on it, without compromising the hardcopy photo. Analysts then interpreted the photograph for a number of attributes, including percent canopy closure, size class, and vegetation type. Photo interpretation keys or templates were developed to aid in the interpretation process. After photo typing was completed, map features and labels were transferred to base maps, commonly registered to 7.5 minute USGS quadarangle sheets. As GIS technology became available, these maps were captured as GIS coverages that we commonly use today. Fundamentally there are a number of methods used to interpret high-resolution imagery. One such method subjectively compares the subject polygon with photo and/or graphical “image keys” to assign attributes. The predefined attribute of the most similar “image key” is assigned to the subject polygon. A senior photo interpreter or a similarly responsible individual / committee must develop the image keys prior to their use by photo interpreters. Both areal proportion and categorical attributes can be determined using image keys (Paine, 1981). Another approach to polygon attribution uses samples to estimate the proportion of each land cover type within a target polygon. The most popular sampling method applies a dot grid to select sample point locations to be photo interpreted. Dots may be distributed systematically or randomly within the grid. If a systematic dot grid is used, the grid must be oriented at an angle so rows of dots do not align with regular, typically anthropogenic landscape features (e.g., roads). The number of sample points (dots) required depends on the type of characteristic being interpreted (e.g., categorical or ratio typed data), the number of categories, and the degree of accuracy required of the estimates (higher accuracies require more sample points) (Paine, 1981). To actually attribute these polygon features, users drew the appropriate code within the polygon drawn on the mylar or acetate sheet. To get this information into a GIS, users had to either heads-up digitize or scan the mylar or acetate sheet and convert it into formats usable in a GIS (Caylor & Lachowski, 1988).
Transcript of DIGITAL MYLAR: A TOOL TO ATTRIBUTE … sheets were transparent, ... This led to technology ... in...
Remote Sensing for Field Users Proceedings of the Tenth Forest Service Remote Sensing Applications Conference
Salt Lake City, Utah April 5-9 2004
DIGITAL MYLAR: A TOOL TO ATTRIBUTE VEGETATION POLYGON FEATURES OVER HIGH-RESOLUTION IMAGERY
Jess T. Clark, Remote Sensing Analyst Mark V. Finco, Ph.D., Senior Scientist
USDA Forest Service, Remote Sensing Applications Center, Salt Lake City, UT 84119 [email protected], [email protected]
Ralph Warbington, Section Head, Planning and Inventory
Brian Schwind, Project Leader – Remote Sensing USDA Forest Service, Pacific Southwest Region, Remote Sensing Lab, Sacramento, CA 95814
[email protected], [email protected] ABSTRACT Digital Mylar was developed as a joint software development project between the US Forest Service Remote Sensing Applications Center (RSAC) and the Pacific Southwest Region (Region 5) Remote Sensing Lab. Digital Mylar provides templates for tree size and cover and other tools to help users objectively attribute vegetation polygon features digitized or derived from high-resolution imagery. High-resolution imagery is an important source of information for forest and range managers. There is a need to conduct consistent mapping to national standards among forests to produce existing vegetation GIS layers depicting floristic levels and attributes. The Digital Mylar templates aid in accomplishing consistency as these GIS data layers are captured and recorded. This tool exists for the ArcGIS 8 platform, and continues to be developed to help users make objective observations and records from the high-resolution imagery.
INTRODUCTION
Methods for photo interpretation, attribution, and implementation into a GIS have evolved significantly during the last decade. Traditional methods included the acquisition of aerial photography (emulsion-coated film). With the hardcopy photos, trained analysts began the process of interpretation by drafting polyons and labels directly over aerial photos. To do this, they often started with draping a mylar or acetate sheet over the photo, securing it so it would not move once placed into position. These sheets were transparent, allowing the detail from the photo to show through, and this sheet also allowed analysts to draw directly on it, without compromising the hardcopy photo.
Analysts then interpreted the photograph for a number of attributes, including percent canopy closure, size class, and vegetation type. Photo interpretation keys or templates were developed to aid in the interpretation process. After photo typing was completed, map features and labels were transferred to base maps, commonly registered to 7.5 minute USGS quadarangle sheets. As GIS technology became available, these maps were captured as GIS coverages that we commonly use today.
Fundamentally there are a number of methods used to interpret high-resolution imagery. One such method subjectively compares the subject polygon with photo and/or graphical “image keys” to assign attributes. The predefined attribute of the most similar “image key” is assigned to the subject polygon. A senior photo interpreter or a similarly responsible individual / committee must develop the image keys prior to their use by photo interpreters. Both areal proportion and categorical attributes can be determined using image keys (Paine, 1981).
Another approach to polygon attribution uses samples to estimate the proportion of each land cover type within a target polygon. The most popular sampling method applies a dot grid to select sample point locations to be photo interpreted. Dots may be distributed systematically or randomly within the grid. If a systematic dot grid is used, the grid must be oriented at an angle so rows of dots do not align with regular, typically anthropogenic landscape features (e.g., roads). The number of sample points (dots) required depends on the type of characteristic being interpreted (e.g., categorical or ratio typed data), the number of categories, and the degree of accuracy required of the estimates (higher accuracies require more sample points) (Paine, 1981).
To actually attribute these polygon features, users drew the appropriate code within the polygon drawn on the mylar or acetate sheet. To get this information into a GIS, users had to either heads-up digitize or scan the mylar or acetate sheet and convert it into formats usable in a GIS (Caylor & Lachowski, 1988).

Remote Sensing for Field Users Proceedings of the Tenth Forest Service Remote Sensing Applications Conference
Salt Lake City, Utah April 5-9 2004
Today, much of the aerial photography and all satellite imagery is acquired in digital format. This led to
technology development that now provides the algorithms and processing power to segment digital raster images into homogenous regions appropriate for both medium and fine-resolution imagery (Riley, Schwind, Daliparthi, Warbington, 2002). These tools include Visual Learning Systems’ Feature Analyst (http://www.featureanalyst.com) and Definiens Imaging’s eCognition (http://www.definiens-imaging.com), for example. Both provide the methods necessary to segment high-resolution imagery into homogeneous regions (polygons) and the resulting output is a GIS-compatible data layer. Once these homogeneous polygons are derived, analysts still have to interpret those regions for the attributes desired. Digital Mylar was developed to assist in this step of the process.
DIGITAL MYLAR DEVELOPMENT
The theory behind the development of Digital Mylar was to develop a tool that facilitated traditional methods in a digital format. In essence, the software was designed to make photo interpretation image keys digital, allowing users to overlay them on digital raster images and scale the key with the raster images. The software was also designed to provide an easy way to attribute the polygons, lessening the likelihood for “keying,” or data entry, errors. To ensure users across the Forest Service could use this software, it was developed as an extension within ArcGIS 8 – ArcMap, a standard software package for all Forest Service computers. Digital Mylar is delivered as a dynamic linked library (DLL) for use within ArcMap.
Visual Basic 6.0 was used to develop Digital Mylar while incorporating ESRI’s ArcObjects, a set of COM objects used in object-oriented programming for ESRI products. Utilizing ArcObjects allows software developers to directly interface with the ArcMap graphical user interface (GUI) and functions. This was necessary for Digital Mylar development as it is a fully integrated tool within ArcMap. Developing the Image Keys
Perhaps the most important development aspect of Digital Mylar was the use of digital, scalable image keys. Keys were developed for both conifer and hardwood size classes and tree cover from above classes. The classes for both tree size and cover are consistent with the Forest Service Technical Guide for Existing Vegetation Classification and Mapping (Brohman & Bryant, eds. 2003.), and specifically designed to promote the consistent use of the vegetation mapping standards for mid and base-level mapping efforts (Warbington, Schwind, Brohman, Brewer, Clerke, 2002).
To build the image keys, developers at RSAC used the Stand Visualization System (SVS), developed by Robert McGaughey of the Forest Service (McGaughey, 1999). This tool allows users to input a variety of variables and the result is a graphical representation of forestland according to the attribute inputs. The inputs to these models include species code, DBH (diameter at breast height), height, crown ratio, crown radius, status code, tree class, crown class, and expansion factor (% canopy closure). To derive all the necessary inputs for this model, developers used algorithms developed by the U.S. Forest Service’s Pacific Southwest Region (Warbington & Levitan, 1992). The logic behind these algorithms is that maximum crown width/diameter at breast height (DBH) relationships can be used to estimate individual tree crown widths. Crown models can be used to estimate live crown radius at any height of a tree based on stand exam or forest inventory estimates of species composition, DBH, total tree height, live crown ratio and number of trees per acre. Estimates of total canopy cover and cover at any height can also be determined. Such estimates can be further enhanced for even or random distributions of the trees within a stand. Multiple equations are available, depending on species. For example, for a Douglas Fir, users would use the linear model:
Crown Width = a + (b*DBH), where a = Intercept and b = Coefficient
For a Douglas Fir, the Intercept and Coefficient are provided (6.81 and .732, respectively). With this information, users simply input the desired DBH, along with variables a and b, and can easily arrive at an appropriate crown width value.
For a Ponderosa Pine, users should use the exponential model:
Crown Width = a*DBHb
Remote Sensing for Field Users Proceedings of the Tenth Forest Service Remote Sensing Applications Conference
Salt Lake City, Utah April 5-9 2004
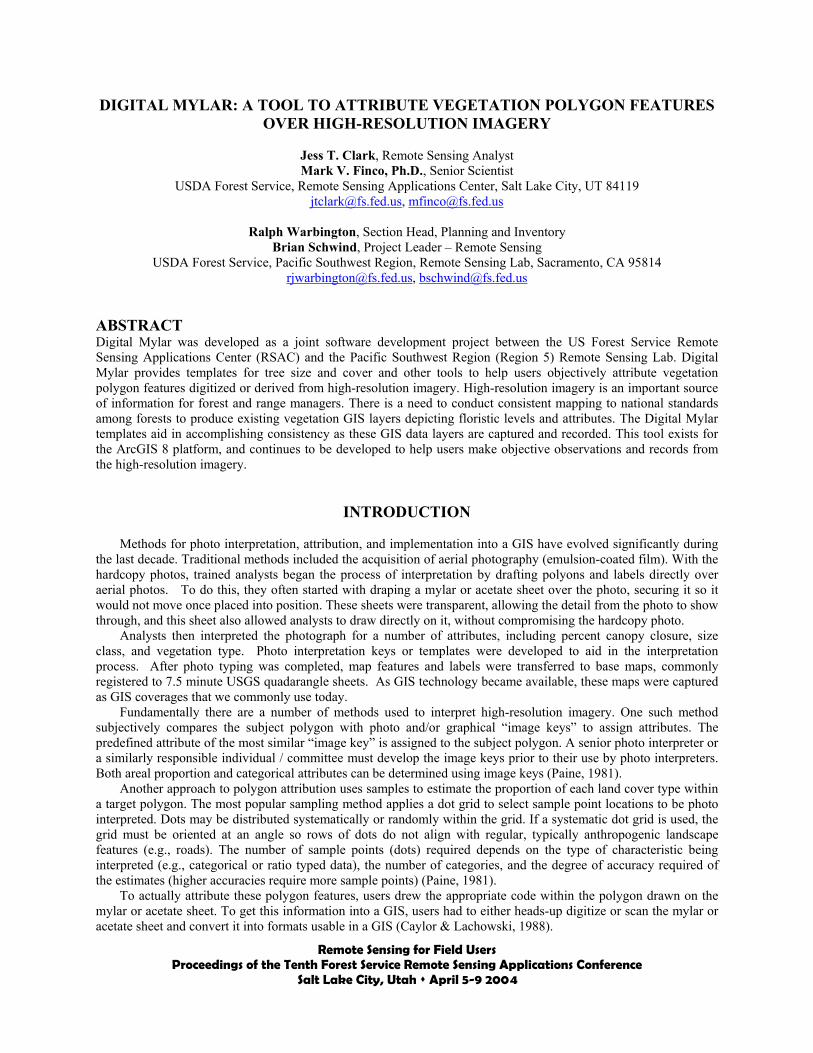
The intercept and coefficient are also provided, in this case, 2.24 and 0.763, respectively. Following these algorithms and tables, developers input data into the SVS software to build image keys for a variety of attributes (Figure 1).
Figure 1. Example input to the SVS models. The only input users enter is the bottom line, highlighted.
Developers built image keys specifically representing both tree size and percent canopy closure classes for hardwood (Black Oak) and conifer (Ponderosa Pine) species, as typical representative species for western hardwoods and conifers. The image output from the SVS is of bitmap (BMP) format, each image representing an acre of land.
The images derived from SVS are neither geolocated nor GIS-ready. To be able to use the image keys in a GIS as a scalable image, each bitmap needed some sort of geolocational information. Images are stored as raster data, where each cell in the image has a row and column number. GIS data layers are stored in real-world coordinates and in order to display images with these GIS layers, it is necessary to establish an image-to-world transformation that converts the image coordinates to real-world coordinates. This transformation information is typically stored with the image in headers. Images that store this information in their headers include ERDAS Imagine, BSQ, BIL, BIP, GeoTIFF, and ARC/INFO grids. ArcGIS uses this information if it is present. However, other image formats (JPEG, GIF, TIFF, BMP, for example) store this information in a separate ASCII file. This file is generally referred to as the world file, since it contains the real-world transformation information used by the image. The data contained in a world file is as follows:
• x-scale; dimension of a pixel in map units in x direction • translation terms; x,y map coordinates of the center of the upper-left pixel • negative of y-scale; dimension of a pixel in map units in y direction Developers at RSAC built world files for each image key produced from the SVS. For the translation terms (x,y
map coordinates) in the world files, a generic value was used. This is possible because of ArcMap’s ability to reproject on the fly. As long as the pixel size of the image key was listed accurately in the world file, the image key would scale appropriately. Using world files in the development of the image keys for Digital Mylar allow the images to be scaled according to the scale of the base map, such as the high-resolution imagery and the derived polygons. For this to work in ArcMap, the image keys had to be loaded as a separate Data Frame and viewed in the Layout View, which allows multiple Data Frames to be visible at once. This allows users to have the high-resolution imagery and polygons visible in one data frame, with the SVS-derived image key loaded in a separate data frame. Configured like this, the image key data frame can be dragged over the high-resolution imagery for a better ocular comparison. Code was added that forced the image key data frame to adhere to the same scale as the main data frame that includes the high-resolution imagery and derived polygons. This functionality is vital to the success of Digital Mylar.
Remote Sensing for Field Users Proceedings of the Tenth Forest Service Remote Sensing Applications Conference
Salt Lake City, Utah April 5-9 2004
METHODS FOR USE
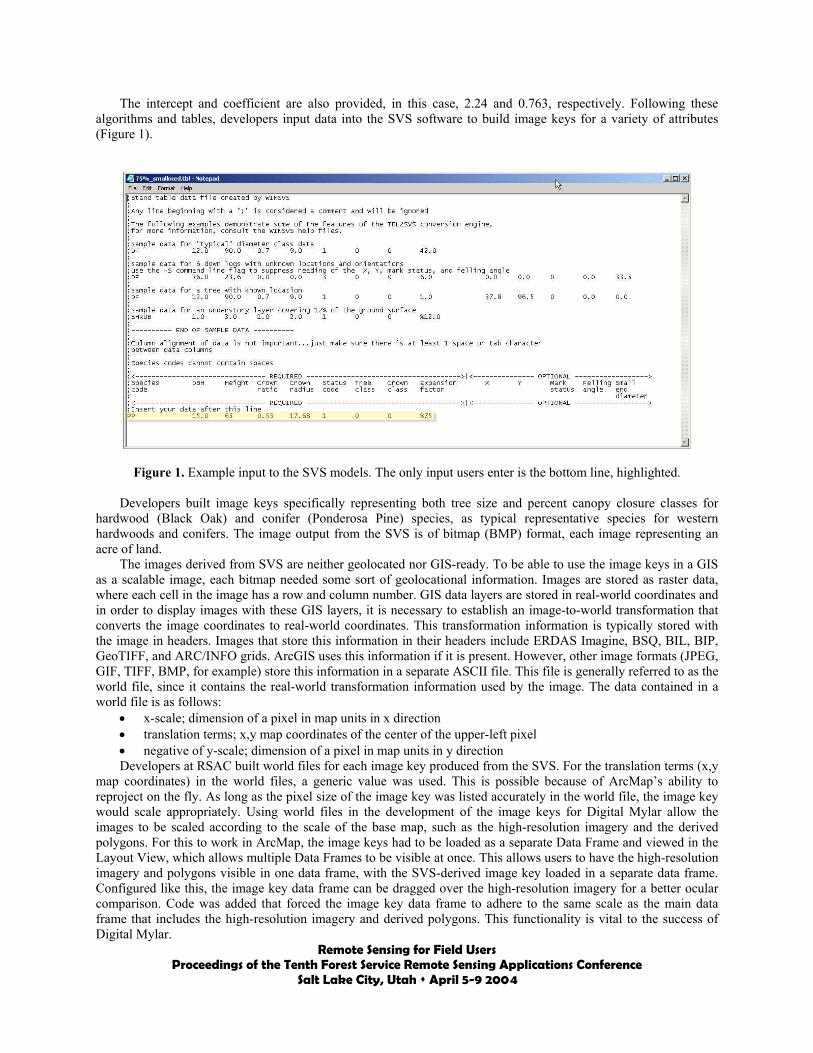
To access the image keys derived from the SVS and attribute the homogenous polygons, users must utilize the Digital Mylar toolbar. This toolbar provides options for users to add data, to start and stop vector editing, and to query a database to display image keys for the desired attribute to interpret.
The programming code was written so that the top-most vector layer loaded in the main data frame becomes the active layer and gets attributed. Once all the appropriate data layers are added, users can query an Access database that stores all the image keys. This is done by selecting the attribute desired, which for Digital Mylar v1.0 includes % Canopy Cover and Size Class. Conforming to base-level standards, users have the option to map for the most abundant type, 2nd most abundant type, and 3rd most abundant type for each of these attributes. For example, assuming the most abundant type of vegetation shown in one of the polygons is Ponderosa Pine, and the user selects “Most Abundant Type” from the drop-down menu under % Canopy Cover, any attribution should represent interpretation for the Ponderosa Pine canopy closure within the bounds of that polygon.
After choosing an attribute to interpret, the appropriate image keys are displayed in a separate window (Figure 3), which is made visible by clicking on the last button on the Digital Mylar toolbar. This new window shows the image keys, stratified by base-level divisions on the Y-axis, and, in the case of % Canopy Cover, by size class on the X-axis.
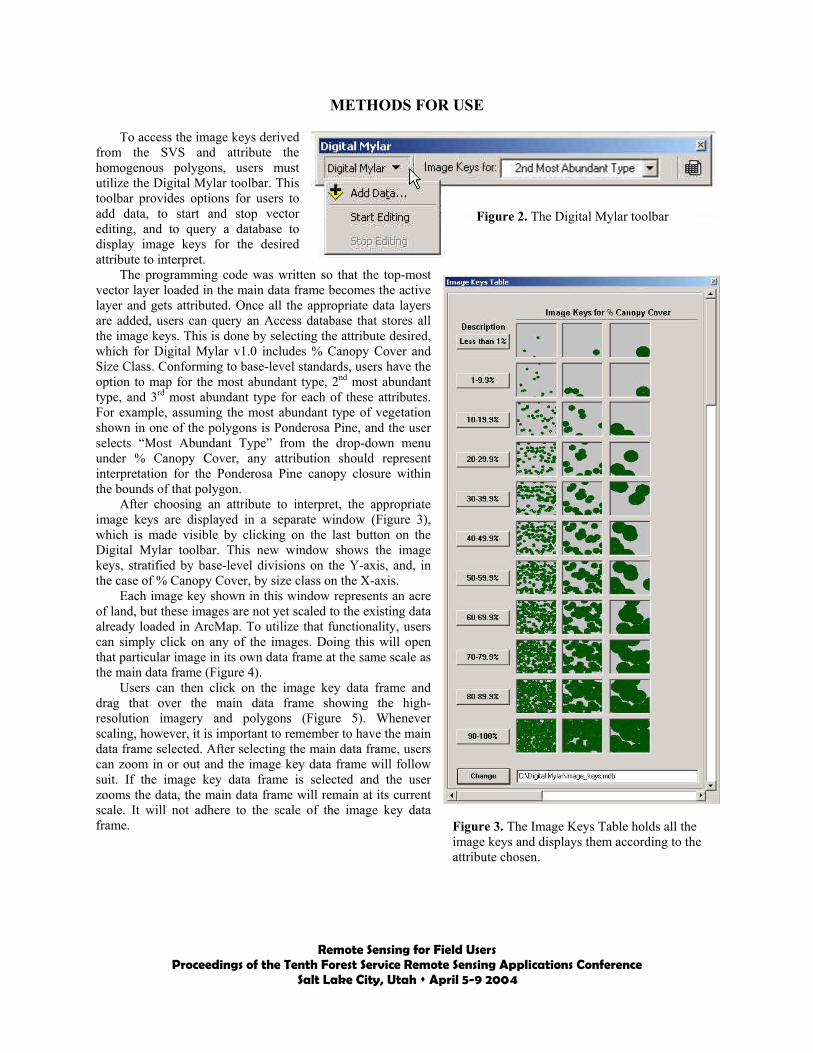
Each image key shown in this window represents an acre of land, but these images are not yet scaled to the existing data already loaded in ArcMap. To utilize that functionality, users can simply click on any of the images. Doing this will open that particular image in its own data frame at the same scale as the main data frame (Figure 4).
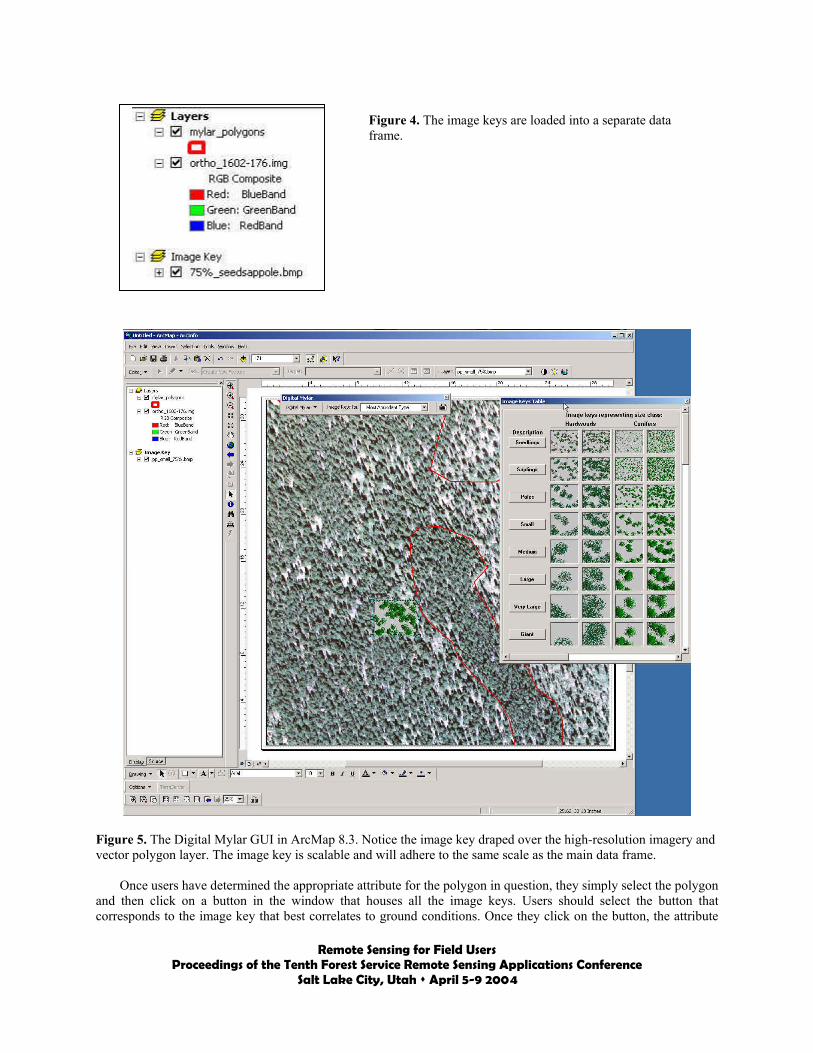
Users can then click on the image key data frame and drag that over the main data frame showing the high-resolution imagery and polygons (Figure 5). Whenever scaling, however, it is important to remember to have the main data frame selected. After selecting the main data frame, users can zoom in or out and the image key data frame will follow suit. If the image key data frame is selected and the user zooms the data, the main data frame will remain at its current scale. It will not adhere to the scale of the image key data frame.
Figure 3. The Image Keys Table holds all the image keys and displays them according to the attribute chosen.
Figure 2. The Digital Mylar toolbar
Remote Sensing for Field Users Proceedings of the Tenth Forest Service Remote Sensing Applications Conference
Salt Lake City, Utah April 5-9 2004
Figure 5. The Digital Mylar GUI in ArcMap 8.3. Notice the image key draped over the high-resolution imagery and vector polygon layer. The image key is scalable and will adhere to the same scale as the main data frame.
Once users have determined the appropriate attribute for the polygon in question, they simply select the polygon and then click on a button in the window that houses all the image keys. Users should select the button that corresponds to the image key that best correlates to ground conditions. Once they click on the button, the attribute
Figure 4. The image keys are loaded into a separate data frame.

Remote Sensing for Field Users Proceedings of the Tenth Forest Service Remote Sensing Applications Conference
Salt Lake City, Utah April 5-9 2004
table is updated for all polygon features selected. The values that are populated in the attribute table are from the national standards for base-level vegetation mapping.
BENEFITS OF USING DIGITAL MYLAR
Even in its first release, Digital Mylar provides many benefits for its use. First and foremost, it allows users to use many of the traditional methods of photo interpretation and attribution in a digital environment. The use of digital image keys as a “digital mylar” is a great advantage to using this tool. Having a scalable digital image key also allows users to make objective ocular estimates regarding polygons drawn around homogeneous stands of vegetation. It is objective because the image keys were built using mathematic algorithms and are mathematically correct; it is still ocular because users still have to make a visual judgment. But Digital Mylar makes that visual judgment easier by providing the digital image keys.
Digital Mylar also helps eliminate attribution-keying errors. The ability for a one-button click means that users will not make errors in typing the correct codes into the attribute table. The button approach also means that the values entered into the table are guaranteed to be consistent with coding required by the national existing vegetation mapping standards. This method also eliminates the need for duplicate work, allowing users to skip any hard-copy attribution. The work done using Digital Mylar is immediately entered into the attribute table of GIS-ready data layers.
FUTURE DEVELOPMENTS Digital Mylar is now in its first release. This initial software build was designed for a specific audience with
software capabilities to attribute only two selected field variables, tree size and cover, for base-level mapping. Ideally, Digital Mylar would be set up to allow users to attribute all existing vegetation layer attributes according to national standards. Digital Mylar could provide templates to accurately attribute variables such as Anderson Land Use / Land Cover, to physiognomic map attributes (division, order, class, etc.), to floristic map attributes (broad cover types, dominance type, plant alliance, etc.), to the base and mid-level detail (% canopy cover, size class).
Developers may also develop pick lists and database insert routines that directly interact with a Spatial Data Engine (SDE) structure in ArcOracle. Interaction with a SDE structure would provide excellent data management options and it would also ensure that the data is entered properly and that it complies with national standards for vegetation mapping.
The software has been tested on few active mapping projects, including a base-level mapping pilot project on the Stanislaus National Forest, (Schwind, Warbington, Brohman, in press.) and for obtaining reference site information on mid-level mapping efforts of the Southern Sierra Nevada forested areas of California. Potential exists for using this tool for map accuracy assessment reference sites, and as both a training and quality-control tool for basic photo interpretation work.
CONCLUSIONS
Basic photo interpretation methodology and the use of interpretation keys are still relevant for existing vegetation mapping efforts. However, traditional approaches are labor intensive and expensive. The use of high-resolution digital imagery, automated segmentation and GIS software tools are emerging technologies that promote cost effective mapping. Digital Mylar is the latest tool in making the process of attributing polygons derived from high-resolution imagery easier, consistent, and more efficient. Further investments in a fully functioning existing vegetation mapping toolkit could provide the Forest Service with a modern software system that fully supports standards and methodology for mapping and updating this important geospatial resource information.

Remote Sensing for Field Users Proceedings of the Tenth Forest Service Remote Sensing Applications Conference
Salt Lake City, Utah April 5-9 2004
REFERENCES Brohman, R., and L. Bryant, Eds. 2003. Existing Vegetation Classification and Mapping Technical Guide – Review
Draft, USDA Forest Service, Washington Office, Ecosystem Management Coordination Staff. Caylor, J.A., H.M. Lachowski (1988). How To Use Aerial Photographs For Natural Resource Applications. USDA
Forest Service Nationwide Forestry Applications Program, Salt Lake City, UT, pp. 15-1 – 15-16. McGaughey, R. (1999). SVS – Stand Visualization System. http://forsys.cfr.washington.edu/svs.html. Paine, D.P. (1981). Aerial Photography and Image Interpretation for Resource Management. John Wiley & Sons,
Inc., New York, pp. 417-446. Riley, M., B. Schwind, P. Daliparthi, R. Warbington. (2002). A Comparison of Covertype Delineations from
Automated Image Segmentation of Independent and Merged IRS and LANDSAT TM Image-Based Data Sets. http://www.fs.fed.us/r5/rsl/publications/rsmapping/compare-irs-tm.pdf. USDA Forest Service.
Schwind, B., R. Warbington, R. Brohman. (2004). USDA Forest Service Mapping Standards for Existing Vegetation – A Test of the Base Level Mapping Standards. 2004 Forest Service Remote Sensing Conference, Salt Lake City, UT. (In press).
Warbington, R., B. Schwind, R. Brohman, K. Brewer, W. Clerke. (2002). Requirements of Remote Sensing and Geographic Information Systems to Meet the New Forest Service Existing Vegetation Classification and Mapping Standards. 2002 Forest Service Remote Sensing Conference, San Diego, CA.
Warbington, R., J. Levitan. (1992). How to estimate canopy cover using maximum crown width/DBH relationships. The Proceeding of the Stand Inventory Technologies: An International Multiple Resource Conference.