Digital Elevation Model with the Ground-based SAR IBIS-L ...
24
HAL Id: hal-00615321 https://hal.archives-ouvertes.fr/hal-00615321 Submitted on 19 Aug 2011 HAL is a multi-disciplinary open access archive for the deposit and dissemination of sci- entific research documents, whether they are pub- lished or not. The documents may come from teaching and research institutions in France or abroad, or from public or private research centers. L’archive ouverte pluridisciplinaire HAL, est destinée au dépôt et à la diffusion de documents scientifiques de niveau recherche, publiés ou non, émanant des établissements d’enseignement et de recherche français ou étrangers, des laboratoires publics ou privés. Digital Elevation Model with the Ground-based SAR IBIS-L as Basis for Volcanic Deformation Monitoring Sabine Rödelsperger, Matthias Becker, Carl Gerstenecker, Gwendolyn Läufer, Kathrin Schilling, Dieter Steineck To cite this version: Sabine Rödelsperger, Matthias Becker, Carl Gerstenecker, Gwendolyn Läufer, Kathrin Schilling, et al.. Digital Elevation Model with the Ground-based SAR IBIS-L as Basis for Volcanic Deformation Monitoring. Journal of Geodynamics, Elsevier, 2010, 49 (3-4), pp.241. 10.1016/j.jog.2009.10.009. hal-00615321
Transcript of Digital Elevation Model with the Ground-based SAR IBIS-L ...

HAL Id: hal-00615321https://hal.archives-ouvertes.fr/hal-00615321
Submitted on 19 Aug 2011
HAL is a multi-disciplinary open accessarchive for the deposit and dissemination of sci-entific research documents, whether they are pub-lished or not. The documents may come fromteaching and research institutions in France orabroad, or from public or private research centers.
L’archive ouverte pluridisciplinaire HAL, estdestinée au dépôt et à la diffusion de documentsscientifiques de niveau recherche, publiés ou non,émanant des établissements d’enseignement et derecherche français ou étrangers, des laboratoirespublics ou privés.
Digital Elevation Model with the Ground-based SARIBIS-L as Basis for Volcanic Deformation Monitoring
Sabine Rödelsperger, Matthias Becker, Carl Gerstenecker, Gwendolyn Läufer,Kathrin Schilling, Dieter Steineck
To cite this version:Sabine Rödelsperger, Matthias Becker, Carl Gerstenecker, Gwendolyn Läufer, Kathrin Schilling, etal.. Digital Elevation Model with the Ground-based SAR IBIS-L as Basis for Volcanic DeformationMonitoring. Journal of Geodynamics, Elsevier, 2010, 49 (3-4), pp.241. �10.1016/j.jog.2009.10.009�.�hal-00615321�

Accepted Manuscript
Title: Digital Elevation Model with the Ground-based SARIBIS-L as Basis for Volcanic Deformation Monitoring
Authors: Sabine Rodelsperger, Matthias Becker, CarlGerstenecker, Gwendolyn Laufer, Kathrin Schilling, DieterSteineck
PII: S0264-3707(09)00142-2DOI: doi:10.1016/j.jog.2009.10.009Reference: GEOD 947
To appear in: Journal of Geodynamics
Received date: 18-12-2008Revised date: 22-10-2009Accepted date: 29-10-2009
Please cite this article as: Rodelsperger, S., Becker, M., Gerstenecker, C., Laufer, G.,Schilling, K., Steineck, D., Digital Elevation Model with the Ground-based SAR IBIS-L as Basis for Volcanic Deformation Monitoring, Journal of Geodynamics (2008),doi:10.1016/j.jog.2009.10.009
This is a PDF file of an unedited manuscript that has been accepted for publication.As a service to our customers we are providing this early version of the manuscript.The manuscript will undergo copyediting, typesetting, and review of the resulting proofbefore it is published in its final form. Please note that during the production processerrors may be discovered which could affect the content, and all legal disclaimers thatapply to the journal pertain.

Page 1 of 22
Accep
ted
Man
uscr
ipt
1
Digital Elevation Model with the Ground-based SAR IBIS-L1
as Basis for Volcanic Deformation Monitoring2
Sabine Rödelsperger*1, Matthias Becker1, Carl Gerstenecker1, Gwendolyn Läufer1, Kathrin 3
Schilling2, Dieter Steineck34
5
1) Institute of Physical Geodesy, Technische Universität Darmstadt, Petersenstrasse 13, 6
64287 Darmstadt, Germany7
2) i3mainz, FH Mainz, Holzstrasse 36, 55116 Mainz, Germany8
3) Institute of Photogrammetry and Cartography, Technische Universität Darmstadt, 9
Petersenstrasse 13, 64287 Darmstadt, Germany10
11
12
13
14
15
16
17
18
19
20
21
22
* Corresponding author: Tel.: +49 6151 16 6560, Fax: +49 6151 16 4512,23
eMail: [email protected]
25

Page 2 of 22
Accep
ted
Man
uscr
ipt
2
Abstract1
Within the project Exupéry, a hybrid deformation observation system is developed, which is 2
part of a Volcano Fast Response System (VFRS). The VFRS shall be a mobile, robust, real-3
time, easy to use early warning system, which, in case of a volcanic crisis, will support the 4
locale authorities in their decisions about hazard mitigation provisions, especially about the 5
evacuation of people.6
The hybrid deformation observation system combines a ground-based Synthetic Aperture 7
Radar named IBIS-L with a network of GPS receivers and will allow the continuous, weather 8
independent determination of areal 3D displacements.9
In this paper we present the results of first tests with IBIS-L in an active quarry near Dieburg, 10
Germany. A Digital Elevation Model (DEM) was determined with IBIS-L and compared with11
a DEM derived by terrestrial laserscanning and photogrammetry. The ability to determine 12
accurate DEMs with IBIS-L is the basis for the combination of different observation 13
techniques, as without a DEM the displacements observed with IBIS-L cannot be 14
georeferenced.15
The standard deviation of the differences between the DEM by IBIS-L and the DEM by 16
laserscanning and photogrammetry depends on the surface characteristics. We found a 17
standard deviation of 0.8 m at a slope of rocks and debris, 2.0 m at mining terraces with low 18
vegetation and 3.0 m in a vegetation covered area.19
20
21
22
Keywords: Ground-based Synthetic Aperture Radar (GB-SAR), IBIS-L, Digital Elevation 23
Model (DEM), Atmospheric effect, Volcano Fast Response System24
25
Page 3 of 22
Accep
ted
Man
uscr
ipt
3
Introduction1
Within the framework of the German research program “Geotechnologien”, funded by the 2
Bundesministerium für Bildung und Forschung (BMBF), the multi-disciplinary project 3
Exupéry has the aim to develop a mobile Volcano Fast Response System (VFRS) for hazard 4
mitigation (see http://www.geotechnologien.de and http://www.exupery-vfrs.de).5
The system allows a quick deployment at any volcano in case of indications for a volcanic 6
crisis or volcanic unrest. The core of the VFRS consists of well-known volcanic monitoring 7
techniques, both space and ground based, to observe seismicity, ground deformation, gas 8
emissions and thermal activity. All data are processed in near real-time and stored in a central 9
data base. Models will be derived to determine the actual state of activity and to set alert 10
levels. The different tasks of Exupéry are described in more detail in Zaksek et al. (2008).11
Within the Exupéry project, the Institute of Physical Geodesy, Technische Universität 12
Darmstadt, Germany develops a hybrid ground based sensor system to monitor displacements 13
of the volcano surface. Such a system has to fulfil certain requirements as:14
- high mobility to enable a quick deployment of the system15
- weather independent continuous and automated monitoring16
- high temporal and spatial resolution17
- real-time evaluation18
Classical approaches for monitoring ground deformation (e.g. extensometers, inclinometers, 19
tiltmeters) require the installation in the volcanic area which might be inaccessible during a 20
volcanic crisis. Therefore the system consists of a network of dual and single frequency GPS 21
receivers in combination with a Ku-band ground-based Synthetic Aperture Radar (GB-SAR) 22
named IBIS-L. The low-cost single-frequency GPS receivers will be stationed inside the radar 23
beam, while the precise dual frequency receivers form the base network. In a new processing 24
approach a joined analysis of discrete GPS data and areal interferometric SAR data, will 25

Page 4 of 22
Accep
ted
Man
uscr
ipt
4
deliver georeferenced areal deformation in real-time with a spatial resolution of several 1
meters and a temporal resolution of several minutes.2
Many studies show the potential of GB-SAR in applications like displacement monitoring at 3
landslides (e.g. Luzi et al., 2006, Antonello et al., 2004), avalanches (e.g. Martinez-Vazquez 4
and Fortuny-Guash, 2005) and glaciers (e.g. Noferini et al., 2009). The advantage compared 5
to optical remote sensing instruments is the ability to monitor areal displacements at any 6
weather condition independent on daylight with a measurement accuracy of 0.1 to 1 mm.7
A further application of GB-SAR is the generation of a Digital Elevation Model (DEM) (e.g.8
Pieraccini et al., 2001, Noferini et al., 2007). The possibility to generate a DEM with IBIS-L 9
is very important within the Exupéry project. The goal of the project is to combine several 10
observation techniques to determine the actual condition of a volcano, which necessitates a 11
common reference system. A DEM is required to georeference the measured displacements 12
with IBIS-L, i.e. to project the displacements into the common reference system. As result of 13
the Shuttle Radar Topography Mission (SRTM) a DEM with a ground resolution of 90 x 90 m 14
is globally available for free.15
This resolution is, however, not sufficient for our application. This paper focuses on the 16
generation of a DEM with IBIS-L which is the basis for the combined displacement 17
monitoring of IBIS-L and GPS.18
19
IBIS-L20
IBIS-L (Image By Interferometric Survey) is a GB-SAR device developed by IDS, Pisa, Italy. 21
It consists of a Stepped-Frequency Continuous-Wave radar unit, operating at 17.2 GHz (Ku-22
band) with a bandwidth of 200 MHz. The synthetic aperture is realized by the movement of 23
the radar unit along a linear rail of 2 m length. The result of one scan along the entire rail is a 24
two dimensional image containing amplitude and phase with a maximum resolution of 0.75 m 25
Page 5 of 22
Accep
ted
Man
uscr
ipt
5
in range and 4.5 mrad in cross-range (i.e. 4.5 m at 1 km distance to the sensor). The maximum1
observation range is 4 km.2
An interferogram is formed by computing the difference between the phase images of two 3
scans at different times. The observed interferometric phase obs of each pixel is a sum of4
several effects5
noiseatmdisptopoobs (1)6
where topo is the phase difference due to topography, disp the displacement in line-of-sight 7
(LOS), atm the atmospheric disturbance and noise the instrumental noise and unmodelled 8
effects (i.e. variations of dielectrical properties of the surface).9
In contrast to spaceborne SAR, the spatial baseline (i.e. the distance between the two antenna 10
positions in one interferogram) can be selected consciously, depending on the application.11
The zero-baseline condition (i.e. spatial baseline is zero) is the ideal condition for 12
displacement monitoring because then topo is zero.13
If the spatial baseline is not zero, a DEM can be derived from topo . Assuming a spatial 14
baseline only in vertical direction, the relation between elevation z and phase difference topo15
of one particular pixel can be approximated by (Noferini et al., 2007)16
B
rz topo
4 (2)17
with being the wavelength, r the distance to the target and B the vertical baseline.18
In case of IBIS-L a spatial baseline length between 0.025 and 0.1 m is possible.19
IBIS-L delivers amplitude and phase organized in a two dimensional array of pixels with 20
range and cross-range resolution. Assuming that the position and the orientation of IBIS-L is 21
known, a DEM of the illuminated area is necessary to transform the array of amplitude and 22
phase into the common reference system. The error of the projected positioning x in LOS 23
Page 6 of 22
Accep
ted
Man
uscr
ipt
6
onto the DEM depends on the error of elevation z and the elevation angle of the target 1
with reference to IBIS-L (see Figure 1)2
tanzx (3)3
4
DEM generation5
To determine a DEM with IBIS-L, the phase difference topo has to be extracted from the 6
observed interferometric phase obs . As stated in formula (1), additionally to the topography,7
the observed interferometric phase is also subjected to LOS displacements, instrumental noise 8
and atmospheric disturbances.9
Due to the short temporal baseline (i.e. time interval between the images) of about 5 to 10 10
minutes, the LOS displacements are assumed to be zero. Assuming the instrumental noise to 11
be white noise, the noise can be reduced considerably with the stacking of repeated 12
measurements.13
Even with short temporal baselines, the atmospheric effect cannot be neglected. Different 14
methods exist to account for the atmospheric path delay (e.g. Zebker et al., 1997, Luzi et al., 15
2004).16
Assuming constant atmospheric conditions along the path, the path delay r can, according 17
to Zebker et al. (1997), be approximated by18
rT
e
T
Pr
2
15 1073.31076.7 (4)19
whereas P is the atmospheric pressure in hPascal, T the temperature in Kelvin, e the partial 20
pressure of water vapour in hPascal and r the path length.21
The assumption of constant atmospheric conditions along the path results in a linear model22
rtcr )( (5)23
with )(tc being constant for all pixels at time t and determined as stated in equation (4).24
Page 7 of 22
Accep
ted
Man
uscr
ipt
7
Whether the approach with a linear model is sufficient or not depends on the conditions of the 1
site. Especially the maximum range and the look angle play an important role in the decision 2
of the method for the estimation of atmospheric effects. With great distances and steep look 3
angles non-linearities (e.g. spatial variations of the atmosphere) have to be taken into account.4
The corrected phase difference is still wrapped within the range -π to +π. To retrieve the 5
unwrapped phase difference uw of one particular pixel, the absolute offset (i.e. an integer 6
multiple of 2π) has to be determined7
nuw 2 (6)8
with n being the unknown integer.9
Here, a conventional branch cut algorithm as described in Goldstein et al. (1988) was used for 10
the phase unwrapping. The branch cut algorithm is a path-following method, which works 11
very well for data with high coherence. With a larger spatial baseline a better accuracy can be 12
achieved but the phase unwrapping is more difficult since the height of ambiguity is smaller. 13
The height of ambiguity is the height z which corresponds to one fringe, i.e. a phase change14
of 2topo in equation (2) (e.g. Bamler and Hartl 1998, Noferini et al. 2008).15
DEM generation at a test site16
The selected test site is an active quarry in Dieburg owned by the Odenwälder Hartstein 17
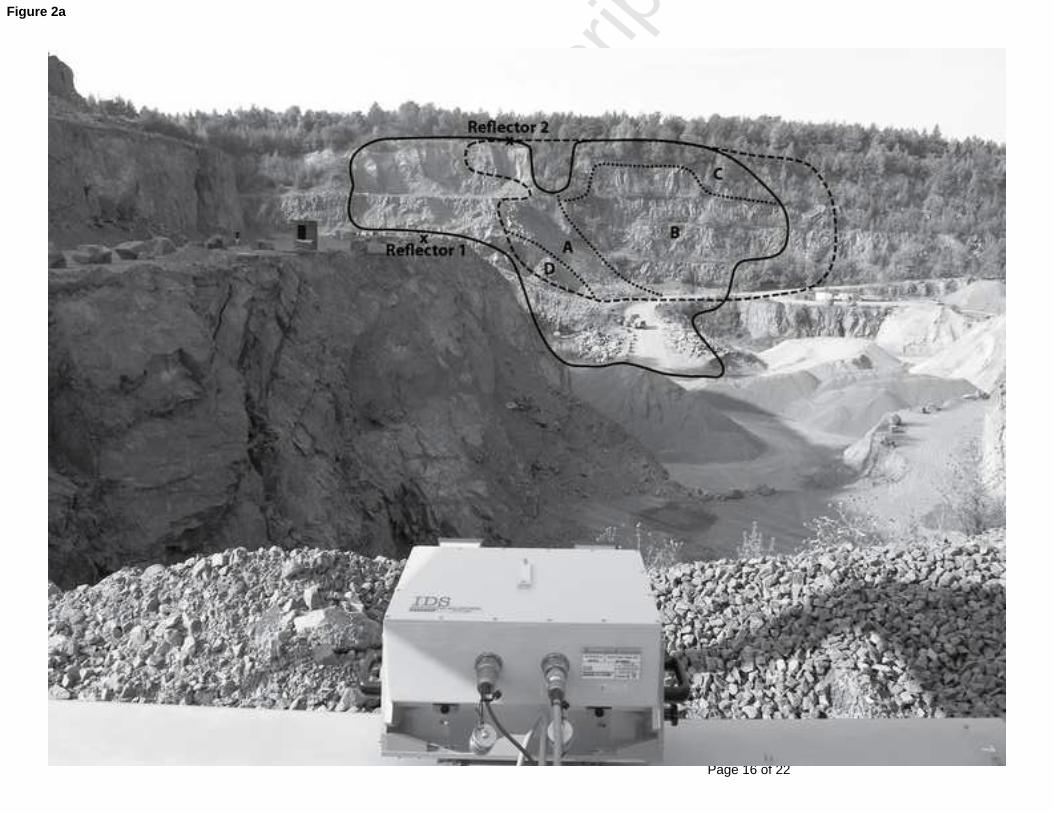
Industrie (see Figure 2 a). The coherence of this scene is shown in Figure 2 b).18
For the validation of the DEM derived from IBIS-L, a reference DEM was determined by a 19
combination of terrestrial photogrammetry and laser scanning. The laser scan was performed 20
with a Leica HDS 3000 and the photos were taken with the Wild camera P31. The 21
specifications of the used camera and laser scanner are listed in Table 1 and Table 2, 22
respectively.23
Both methods delivered point clouds which were registered and combined by transformation 24
with a set of identical control points. The comparison of both DEMs yields a standard 25
Page 8 of 22
Accep
ted
Man
uscr
ipt
8
deviation of 0.07 m in areas where rock and debris dominate and a standard deviation of 0.41 1
m where vegetation is present. The combined DEM is shown in Figure 4 a.2
With IBIS-L, 45 interferograms where acquired with vertical baselines of 0.05 and 0.1 m. The 3
specifications are given in Table 3.4
Before the generation of the DEM, the atmospheric effects were accounted for by applying5
equation (4). A weather station logged humidity, temperature and pressure at the IBIS-L 6
station. Estimations showed that a linear model is sufficient in this test area with a maximum 7
distance of 300 m and an almost horizontal look angle. At this distance the error caused by a 8
change in humidity of 1 % at 25°C is almost 2.5 m in height. Here, during the measurement 9
campaign with duration of 4.5 hours, the temperature rose by about 10°C while humidity 10
dropped by about 20%. This shows the importance of considering atmospheric effects.11
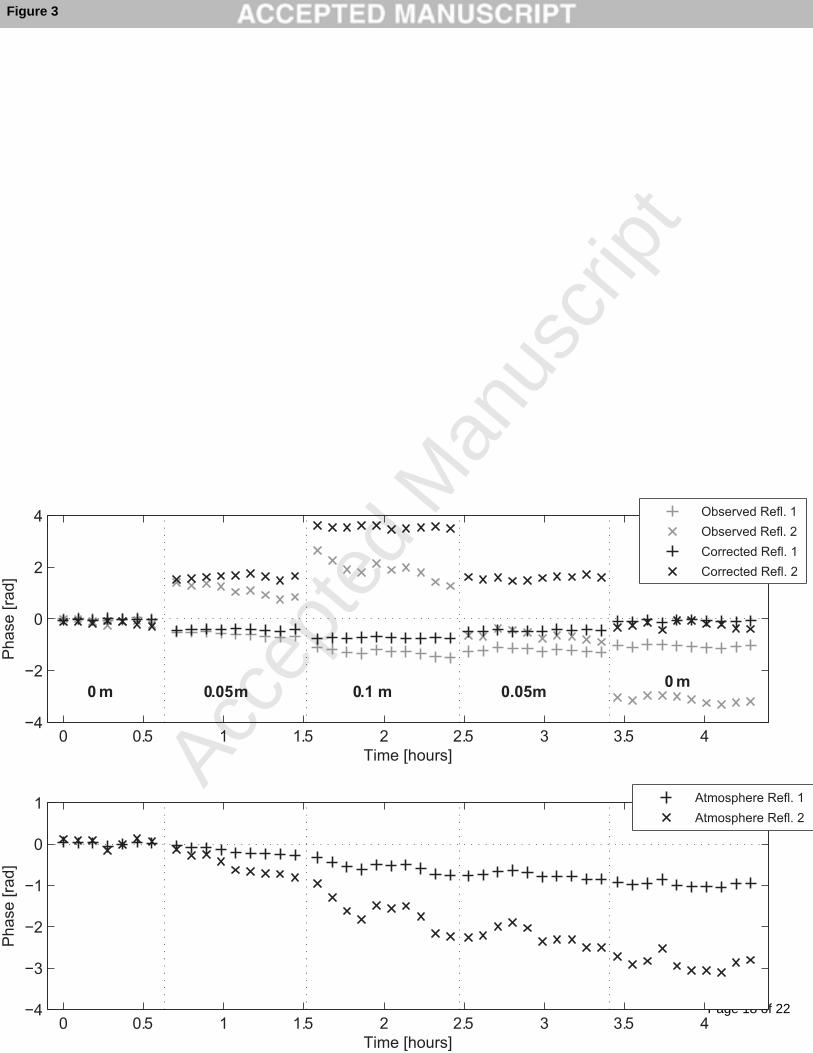
Figure 3 shows the observed phase of two control points before and after atmospheric 12
correction. Control point 1 is a triangular reflector (edge length 0.22 m) at a distance of 100 13
m, control point 2 is quadrangular reflector (edge length 0.22 m) at a distance of 300 m (see 14
also Figure 2). The jumps in the time series are induced by the introduction of a spatial 15
baseline. Since control point 1 is 1 m lower than the IBIS instrument the jump is negative.16
Especially in the last section where the observed phase should be zero (because spatial 17
baseline = 0 m), the amount of atmospheric disturbance is clearly visible. The lower graph 18
shows the applied atmospheric correction, whereas the correction for control point 2 is three 19
times higher than for control point 1 (due to the linear model).20
The standard deviation of the corrected observation is 0.04 rad for control point 1 and 0.12 21
rad for control point 2. This leads to an error in height of 0.05 m for control point 1 and 0.11 22
m for control point 2 with a baseline of 0.1 m. The error doubles for a baseline of 0.05 m.23
All possible interferograms were formed and averaged, which resulted in one mean 24
interferogram for each baseline (0.05 and 0.1 m). The DEMs were computed using equation 25
Page 9 of 22
Accep
ted
Man
uscr
ipt
9
(2). The standard deviation of the difference between the DEMs with baseline 0.05 and 0.1 m 1
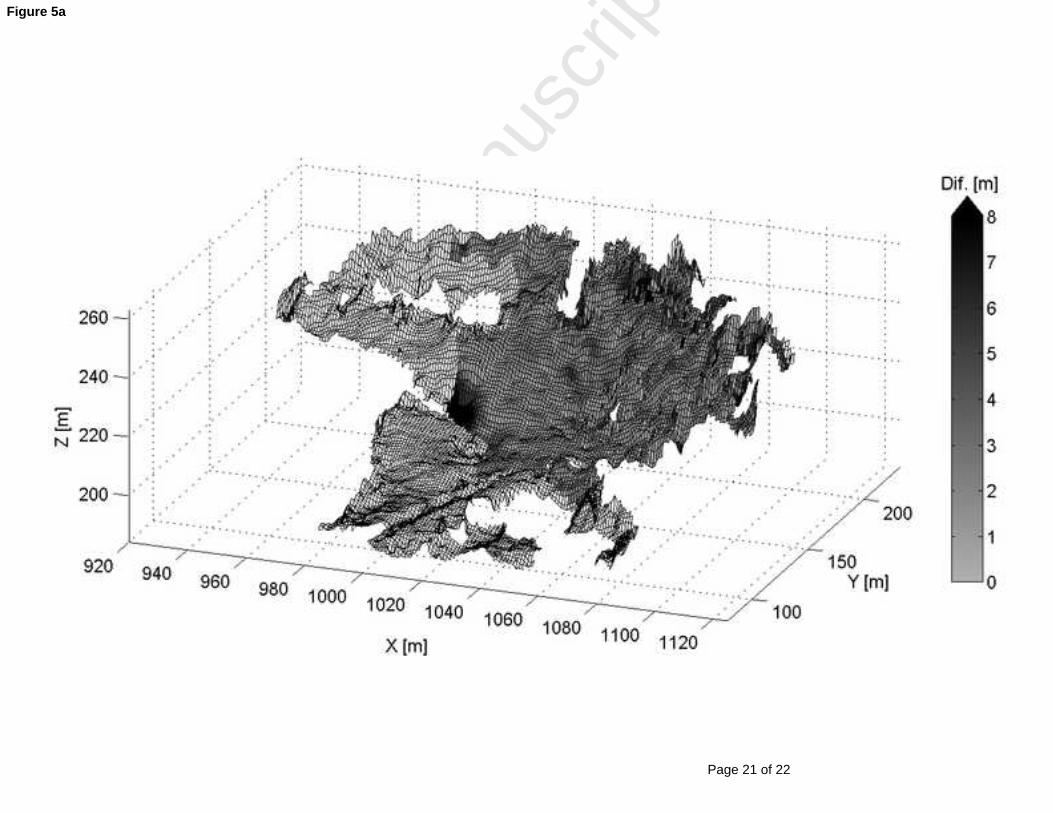
is 1.0 m. The final DEM derived from IBIS-L (average of both single DEMs) is shown in 2
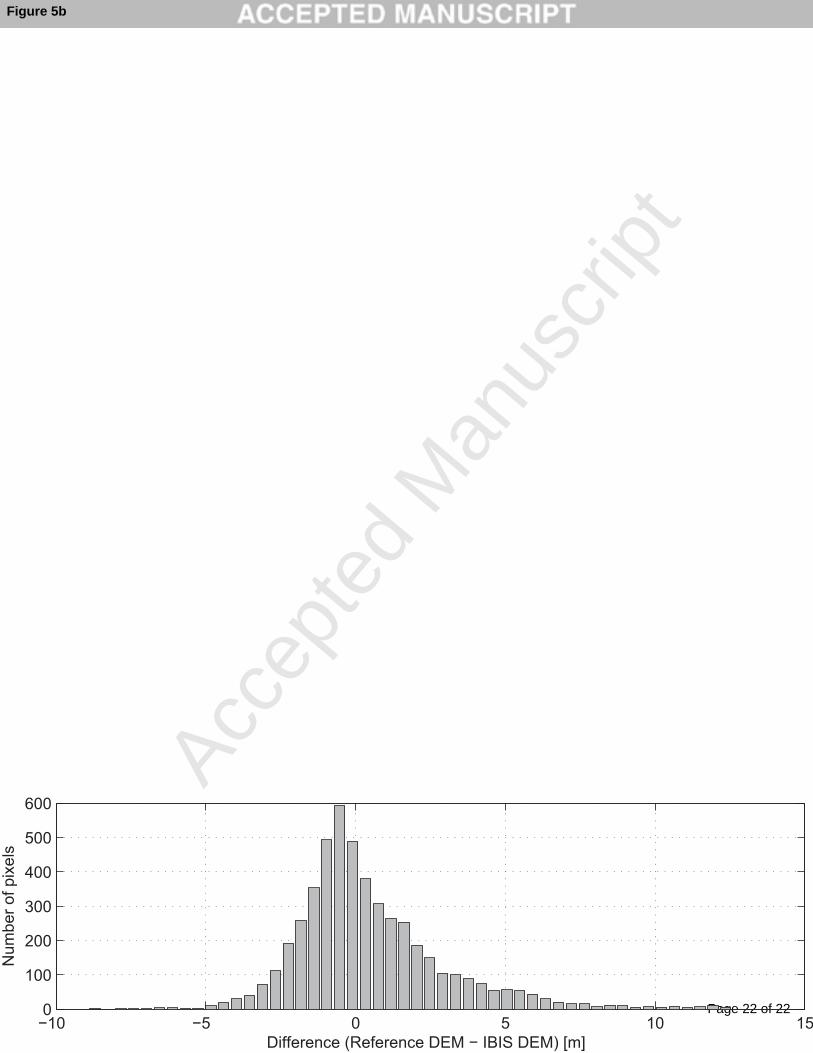
Figure 4 b. The difference between the reference DEM and the IBIS-DEM is shown Figure 53
a. The mean absolute deviation is 1.8 m. 50 % of the differences are below 0.4 m. Figure 5 b4
shows the histogram of differences. The corresponding standard deviation is 2.5 m.5
To better understand the differences, the test site is classified into four zones A-D (see Figure 6
2). Table 4 shows a summary of the different zones and their accuracy. Zone A is a slope with 7
an angle of 40°, which mainly consists of rocks, debris and low vegetation (e.g. grass). The 8
mean coherence is 0.8 ± 0.06 and the found standard deviation 0.8 m. Applying equation (3), 9
the positioning accuracy of georeferencing for an elevation angle of 20° is 0.3 m, which is 10
below the spatial resolution of IBIS-L.11
Zone B is an old mining area consisting of four terraces with almost vertical walls. The top of 12
each terrace is covered with low vegetation, e.g. bushes and low trees. The mean coherence of 13
this area is with 0.7 not bad but the variation (coherence standard deviation 0.23) is very high 14
due to the covering with vegetation. The standard deviation of height amounts to 2.0 m which 15
leads to positioning accuracy of 0.7 m for an elevation angle of 20°. In general, vertical walls 16
are not represented well in a conventional DEM.17
Zone C is mainly covered with vegetation as bushes and trees. The mean coherence is 0.5 ± 18
0.22. Large discrepancies can be found here, which is expected because vegetation is moving 19
constantly due to wind and thus increases the noise. In this zone the standard deviation 20
amounts to 3.0 m which corresponds to a positioning accuracy of 1.0 m for an elevation angle 21
of 20°.22
Zone D only consists of rocks and the coherence is very high but this area was dug off 23
between the measurements of the IBIS-L DEM and reference DEM because more than one 24

Page 10 of 22
Accep
ted
Man
uscr
ipt
10
month passed by. So, differences of more than ten meters can be found between both DEMs, 1
which are no indication for the measurement accuracy.2
Conclusion and outlook3
A DEM was generated out of the IBIS-L measurements after the atmospheric effects were 4
removed. A comparison with a reference DEM derived from terrestrial laserscanning and 5
photogrammetry resulted in standard deviations of 0.8 m to 3.0 m depending on the character 6
of the target. The best agreement between both DEMs was found at a slope of rocks and 7
debris. As expected, low coherence targets (e.g. vegetation) decreases the accuracy of the 8
IBIS-DEM considerably. The accuracy of photogrammetry and laserscanning may, however, 9
suffer similar problems in areas with vegetation.10
The advantage of using a DEM generated by IBIS-L for georeferencing versus a DEM 11
retrieved from other techniques is clearly that no further measurement instrument is necessary 12
and that the DEM has the same pixel geometry and resolution as the displacement images (i.e. 13
interpolation is unnecessary). The disadvantage is the lower accuracy, especially in areas with 14
low coherence. In areas without vegetation, the positioning accuracy of georeferencing is 15
between 0.3 and 0.7 m in a maximum range of 300 m. Since the maximum achievable 16
resolution in range is 0.75 m with IBIS-L, the accuracy is sufficient.17
Further investigations have to be made concerning the accuracy in greater distances. Noferini 18
et al. (2007) achieved a standard deviation of 5.5 m with C-band SAR in 2 km distance, which 19
corresponds to a positioning accuracy of 2 m. As Ku-band SAR, the measurement accuracy of 20
IBIS-L is higher but it also suffers more from atmospheric disturbance and decorrelation.21
Here we have shown for the first time the generation of a DEM with a Ku-band GB-SAR 22
IBIS-L and compared it with a high accuracy reference DEM by terrestrial photogrammetry 23
and laser scanning. The goal of the volcano monitoring system is to combine the areal LOS24
displacements of IBIS-L with 3D displacements measured by GPS. The possibility to 25
Page 11 of 22
Accep
ted
Man
uscr
ipt
11
generate a DEM is an important step towards this combined analysis, as it enables us to 1
project the particular pixels of IBIS-L images and their displacements to a common reference 2
system. It is the basis for the monitoring of 3D areal displacement, whereas GPS delivers the 3
third dimension at particular points.4
Acknowledgments5
The authors thank the Odenwälder Hartstein Industrie for permitting us the installation of 6
IBIS-L in the quarry in Dieburg. This project is funded by the Bundesministerium für Bildung 7
und Forschung within the Geotechnologien program.8
References9
Antonello, G., Casagli, N., Farina, P., Leva, D., Nico, G., Sieber, A. and Tarchi, D. (2004): 10
Ground-based SAR interferometry for monitoring mass movements. Landslides 1, pp. 11
21-28.12
Bamler, R. and Hartl, P. (1998): Synthetic aperture radar interferometry. Inverse Problems 14, 13
R1-R54.14
Goldstein, R.M., Zebker, H.A. and Werner, C.L. (1988): Satellite radar interferometry: two-15
dimensional phase unwrapping. Radio Science 23 (4), pp. 713-720.16
Luzi, G., Pieraccini, M., Mecatti, D., Noferini, L., Guidi, G., Moia, F. and Atzeni, C. (2004): 17
Ground-based radar interferometry for landslides monitoring: Atmospheric and 18
instrumental decorrelation sources on experimental data. IEEE Transactions on 19
Geoscience and Remote Sensing 42, pp. 2454-2466.20
Luzi, G., Pieraccini, M., Mecatti, D., Noferini, L., Macaluso, G., Galgaro, A. and Atzeni, C. 21
(2006): Advances in ground-based microwave interferometry for landslide survey: a 22
case study. International Journal of Remote Sensing 27, pp. 2331-2350.23
Page 12 of 22
Accep
ted
Man
uscr
ipt
12
Martinez-Vazquez, A. and Fortuny-Guash, J. (2005): Monitoring structural changes and 1
Stability of the snow cover with a Ground-based Synthetic Aperture Radar, Proceedings 2
of URSI Commission F Symposium on Microwave Remote Sensing of the Earth, 3
Ocean, Ice and Atmosphere, 20-21 April, Ispra, Italy.4
Noferini, L., Pieraccini, M., Mecatti, D., Macaluso, G., Luzi, G. and Atzeni, C. (2007): DEM 5
by Ground-Based SAR Interferometry. Geoscience and Remote Sensing Letters 4 (4), 6
pp. 659-663.7
Noferini, L., Mecatti, D., Macaluso, G., Pieraccini, M. and Atzeni, C. (2009): Monitoring of 8
Belvedere Glacier using a wide angle GB-SAR interferometer. Journal of Applied 9
Geophysics 68 (2), pp. 289-293.10
Pieraccini, M., Luzi, G. and Atzeni, C. (2001): Terrain mapping by ground-based 11
interferometric radar. IEEE Transactions on Geoscience and Remote Sensing 39, pp. 12
2176-2181.13
Zaksek, K., Hort, M. and the Exupery Team(2008): Exupery: The mobile Volcano Fast 14
Response System. IEEE proceedings of 2nd USEReST Workshop, 11-14 November, 15
2008, Naples, Italy.16
Zebker, H.A., Rosen, P.A. and Hensley, S. (1997): Atmospheric effects in interferometric17
synthetic aperture radar surface deformation and topographic maps. Journal of 18
Geophysical Research 102 (B4), pp. 7547-7563.19
Figures20
Figure 1: Influence of the error of elevation on the projected position.21
Figure 2: Picture (a) and coherence (b) of the observed scene covered by the antenna beam in 22
a quarry in Dieburg. The continuous line is the area of the DEM derived from IBIS; the 23
dashed line represents the area of the DEM derived from photogrammetry and laserscanning. 24

Page 13 of 22
Accep
ted
Man
uscr
ipt
13
Reflector 1 and 2 indicate two control points. The different zones, named A to D are 1
described in the text.2
Figure 3: Phase of the two control points 1 (+) and 2 (x) in 100 and 300 m distance, 3
respectively. The upper graph shows the observed phase measurements (grey) and the phase 4
after atmospheric correction (black). In the lower graph the applied atmospheric correction for 5
both control points is plotted.6
Figure 4: DEM generated by photogrammetry and laserscanning (a) and by IBIS-L (b).7
Figure 5: Comparison of DEM derived from IBIS-L and the combination of photogrammetry 8
and laserscanning in m (a). The histogram shows the distribution of differences (b).9
Tables10
Table 1: Specifications of the camera at the test site in Dieburg.11
Camera Wild P31Focal length 20 cmScanned pixel size 15 μmNumber of reference points 4Baseline 30 mMaximum distance 200 mAccuracy of height measurement 3 cm
12
Table 2: Specifications of the laserscanner at the test site in Dieburg.13
Laserscanner Leica HDS 3000Instrument type PulsedMaximum distance 300 mMaximum field-of-view 360° x 270°Accuracy of single measurement- Position- Distance
6 mm at 50 m4 mm at 50 m
Used resolution 3 cm at 50 mUsed max. distance 110 m
14
Table 3: Specifications of IBIS-L at the test site in Dieburg.15
Maximum distance 300 mScan length 2 m

Page 14 of 22
Accep
ted
Man
uscr
ipt
14
Center frequency 17.2 GHzBandwidth 200 MHzResolution 0.75 m x 4 mradAcquisition time 6 minVertical baseline 0.05 and 0.1 m
1
Table 4: Found accuracy of the different zones.2
Zone Description Coherence Standard deviation of height
A Slope with rocks, debris covered with grass 0.8 ± 0.06 0.8 mB Mining terraces partly covered with bushes and low
trees0.7 ± 0.24 2.0 m
C Covered with bushes and trees 0.5 ± 0.22 3.0 mD Working area (digging between generation of IBIS-
DEM and reference DEM)0.9 ± 0.04 -
3

Page 15 of 22
Accep
ted
Man
uscr
ipt
β
σz
σx
rangez
IBIS-Lx
Figure 1
Page 16 of 22
Accep
ted
Man
uscr
ipt
Figure 2a

Page 17 of 22
Accep
ted
Man
uscr
ipt
Figure 2b
Page 18 of 22
Accep
ted
Man
uscr
ipt
0 0.5 1 1.5 2 2.5 3 3.5 4−4
−2
0
2
4
Phase [rad]
Time [hours]
0 m 0.05 m 0.1 m 0.05 m0 m
Observed Refl. 1
Observed Refl. 2
Corrected Refl. 1
Corrected Refl. 2
0 0.5 1 1.5 2 2.5 3 3.5 4−4
−3
−2
−1
0
1
Phase [rad]
Time [hours]
Atmosphere Refl. 1
Atmosphere Refl. 2
Figure 3

Page 19 of 22
Accep
ted
Man
uscr
ipt
Figure 4a

Page 20 of 22
Accep
ted
Man
uscr
ipt
Figure 4b
Page 21 of 22
Accep
ted
Man
uscr
ipt
Figure 5a
Page 22 of 22
Accep
ted
Man
uscr
ipt
−10 −5 0 5 10 150
100
200
300
400
500
600
Difference (Reference DEM − IBIS DEM) [m]
Nu
mb
er
of p
ixe
lsFigure 5b