
Computed SAR and thermal elevation in a 0.25-mm 2 … · LAZZI et al.: COMPUTED SAR AND THERMAL...
10
2286 IEEE TRANSACTIONS ON ANTENNAS AND PROPAGATION, VOL. 51, NO. 9, SEPTEMBER 2003 Computed SAR and Thermal Elevation in a 0.25-mm 2-D Model of the Human Eye and Head in Response to an Implanted Retinal Stimulator—Part II: Results Gianluca Lazzi, Senior Member, IEEE, Stephen C. DeMarco, Wentai Liu, Senior Member, IEEE, James D. Weiland, Member, IEEE, and Mark S. Humayun, Member, IEEE Abstract—This is the second of a series of two papers on the thermal increase in the human eye and head in response to an implanted retinal stimulator. This paper provides specific absorp- tion rates induced in the human head by the extraocular unit and the temperature increases associated with induced electromagnetic fields and power dissipation of the implanted microchip. Results are provided for different assumptions about choroid blood flow. It is shown that computed results associated with the power dissi- pation of the implanted microchip, corresponding to temperature increases of approximately 0.6 C in the midvitreous of the eye and 0.2 C in the retina, closely parallel in-vivo experimental results in animals. Index Terms—Age-related macular degeneration, finite-differ- ence time domain (FDTD), retina prosthesis, retinitis pigmentosa, specific absorption rate (SAR), stimulator IC, temperature, thermal simulation. I. INTRODUCTION T HE specific absorption rate and the dissipated stimulator IC power are the mechanisms that are expected to account for the ocular heating. Therefore, the numerical finite-difference time-domain (FDTD) method for specific absorption rate (SAR) computation and the numerical thermal method in Part I are ap- plied to the newly developed truncated head/eye model to esti- mate the increase in temperature. In order to gain further insight into the results, the influence of SAR and dissipated power in the implant are considered separately. II. SPECIFIC ABSORPTION RATE (SAR) In a typical application of North Carolina State University’s Retina-3.5 microstimulator [1], in which it is assumed that the implant is operating with all channels active at current levels 100% of maximum specifications, required continuous supply currents of 10 mA were predicted. Experiments with induc- tive coupling based on the work in [2] showed that a power Manuscript received November 1, 2001; revised June 3, 2002. The work of G. Lazzi was supported in part by the Whitaker Foundation under Contract RG-00-0298 and in part by NSF CAREER Award 0091599. The work of W. Liu was supported in part by NSF Award BES-9808040 and in part by the Na- tional Institutes of Health (NIH). The work of J. D. Weiland and M. S. Humayun was supported in part by NSF Award BES-9810914 and in part by the NIH. G. Lazzi, S. C. DeMarco, and W. Liu are with the Department of Electrical and Computer Engineering, North Carolina State University, Raleigh, NC 27695 USA (e-mail: [email protected]) J. D. Weiland and M. S. Humayun are with the Doheny Eye Institute, Uni- versity of Southern California, Los Angeles, CA 90089 USA. Digital Object Identifier 10.1109/TAP.2003.816394 of 200 Vpp at 2 A in the primary coil was necessary to obtain 10 mA of source current at and on the secondary side (power receiving coil). Therefore, the SAR distribution resulting from the numerical FDTD at 2 MHz has been linearly scaled to reflect the primary side input power used in these experiments. A color-mapped graphical representation of the resulting SAR is provided in Fig. 1. The transmitter coil was constructed with a 2-in diameter and ten turns. In two-di- mensional simulation, it is represented as two point sources of opposite polarity and is positioned, as indicated in Fig. 1, above the left eye at a location consistent with attachment to a pair of framed reading glasses. The truncated head/eye model is sur- rounded with 50 perfectly matched layers (PMLs) and then ex- cited with the -field sourced from the two-dimensional coil. Results in Fig. 1 show the power levels, which are scaled to mW/kg and are provided in scale for best viewing with the linear scale added for reference. The SAR distribution shows that the right eye receives more deposited power than the tar- geted left eye containing the prosthesis. The major reason for the location of this peak SAR in the right eye is the much higher conductivity of the eye humor with respect to other organs, such as cartilage, bone, or skin. The eye with the prosthesis is ex- posed to minimal electric field (electric field on the axis of the coil is ideally zero), while the largest electric field is found on the sides of the coil. Thus, the opposite eye is exposed to large electric fields compared to organs normal to the axis of the coil. Considering the higher conductivity of the eye humor, this re- sults in relatively high SAR compared to other organs. III. INFLUENCE OF CHOROIDAL BLOOD FLOW ON OCULAR TEMPERATURE Studies have revealed a relation between damage to the pho- toreceptor layer of the retina and ocular temperature [3], [4]. Anterior to the human retina’s photoreceptor layer and to the pigmented epithelium lies the choroid, which is a vascularized layer supplying blood to the outer retina. The blood circulation density to the outer retina by way of the choroid is known to be higher than in any other bodily tissue [5], [6]. In fact, the blood flow exceeds the oxygenation needs of the outer retina and the retinal pigment epithelium [5], [6]. It is proposed that the high blood flow from the choroidal layer facilitates the regulation of retinal temperature, which would otherwise increase in the outer retina during the phototransduction of incident light and absorp- tion in the epithelium of excess light energy [7]. Experiments 0018-926X/03$17.00 © 2003 IEEE
Transcript of Computed SAR and thermal elevation in a 0.25-mm 2 … · LAZZI et al.: COMPUTED SAR AND THERMAL...

2286 IEEE TRANSACTIONS ON ANTENNAS AND PROPAGATION, VOL. 51, NO. 9, SEPTEMBER 2003
Computed SAR and Thermal Elevation in a 0.25-mm2-D Model of the Human Eye and Head in Responseto an Implanted Retinal Stimulator—Part II: Results
Gianluca Lazzi, Senior Member, IEEE, Stephen C. DeMarco, Wentai Liu, Senior Member, IEEE,James D. Weiland, Member, IEEE, and Mark S. Humayun, Member, IEEE
Abstract—This is the second of a series of two papers on thethermal increase in the human eye and head in response to animplanted retinal stimulator. This paper provides specific absorp-tion rates induced in the human head by the extraocular unit andthe temperature increases associated with induced electromagneticfields and power dissipation of the implanted microchip. Resultsare provided for different assumptions about choroid blood flow.It is shown that computed results associated with the power dissi-pation of the implanted microchip, corresponding to temperatureincreases of approximately 0.6 C in the midvitreous of the eye and0.2 C in the retina, closely parallel in-vivo experimental results inanimals.
Index Terms—Age-related macular degeneration, finite-differ-ence time domain (FDTD), retina prosthesis, retinitis pigmentosa,specific absorption rate (SAR), stimulator IC, temperature,thermal simulation.
I. INTRODUCTION
T HE specific absorption rate and the dissipated stimulatorIC power are the mechanisms that are expected to account
for the ocular heating. Therefore, the numerical finite-differencetime-domain (FDTD) method for specific absorption rate (SAR)computation and the numerical thermal method in Part I are ap-plied to the newly developed truncated head/eye model to esti-mate the increase in temperature. In order to gain further insightinto the results, the influence of SAR and dissipated power in theimplant are considered separately.
II. SPECIFICABSORPTIONRATE (SAR)
In a typical application of North Carolina State University’sRetina-3.5microstimulator [1], in which it is assumed that theimplant is operating with all channels active at current levels100% of maximum specifications, required continuous supplycurrents of 10 mA were predicted. Experiments with induc-tive coupling based on the work in [2] showed that a power
Manuscript received November 1, 2001; revised June 3, 2002. The work ofG. Lazzi was supported in part by the Whitaker Foundation under ContractRG-00-0298 and in part by NSF CAREER Award 0091599. The work of W.Liu was supported in part by NSF Award BES-9808040 and in part by the Na-tional Institutes of Health (NIH). The work of J. D. Weiland and M. S. Humayunwas supported in part by NSF Award BES-9810914 and in part by the NIH.
G. Lazzi, S. C. DeMarco, and W. Liu are with the Department of Electricaland Computer Engineering, North Carolina State University, Raleigh, NC 27695USA (e-mail: [email protected])
J. D. Weiland and M. S. Humayun are with the Doheny Eye Institute, Uni-versity of Southern California, Los Angeles, CA 90089 USA.
Digital Object Identifier 10.1109/TAP.2003.816394
of 200 Vpp at 2 A in the primary coil was necessary to obtain10 mA of source current at and onthe secondary side (power receiving coil). Therefore, the SARdistribution resulting from the numerical FDTD at 2 MHz hasbeen linearly scaled to reflect the primary side input power usedin these experiments. A color-mapped graphical representationof the resulting SAR is provided in Fig. 1. The transmitter coilwas constructed with a 2-in diameter and ten turns. In two-di-mensional simulation, it is represented as two point sources ofopposite polarity and is positioned, as indicated in Fig. 1, abovethe left eye at a location consistent with attachment to a pair offramed reading glasses. The truncated head/eye model is sur-rounded with 50 perfectly matched layers (PMLs) and then ex-cited with the -field sourced from the two-dimensional coil.
Results in Fig. 1 show the power levels, which are scaled tomW/kg and are provided in scale for best viewing with thelinear scale added for reference. The SAR distribution showsthat the right eye receives more deposited power than the tar-geted left eye containing the prosthesis. The major reason forthe location of this peak SAR in the right eye is the much higherconductivity of the eye humor with respect to other organs, suchas cartilage, bone, or skin. The eye with the prosthesis is ex-posed to minimal electric field (electric field on the axis of thecoil is ideally zero), while the largest electric field is found onthe sides of the coil. Thus, the opposite eye is exposed to largeelectric fields compared to organs normal to the axis of the coil.Considering the higher conductivity of the eye humor, this re-sults in relatively high SAR compared to other organs.
III. I NFLUENCE OFCHOROIDAL BLOOD FLOW ON OCULAR
TEMPERATURE
Studies have revealed a relation between damage to the pho-toreceptor layer of the retina and ocular temperature [3], [4].Anterior to the human retina’s photoreceptor layer and to thepigmented epithelium lies the choroid, which is a vascularizedlayer supplying blood to the outer retina. The blood circulationdensity to the outer retina by way of the choroid is known to behigher than in any other bodily tissue [5], [6]. In fact, the bloodflow exceeds the oxygenation needs of the outer retina and theretinal pigment epithelium [5], [6]. It is proposed that the highblood flow from the choroidal layer facilitates the regulation ofretinal temperature, which would otherwise increase in the outerretina during the phototransduction of incident light and absorp-tion in the epithelium of excess light energy [7]. Experiments
0018-926X/03$17.00 © 2003 IEEE

LAZZI et al.: COMPUTED SAR AND THERMAL ELEVATION IN MODEL OF HUMAN EYE AND HEAD—PART II 2287
Fig. 1. Specific absorption rate in log scale at 2-MHz irradiation for 2-A coil current.
revealed that less energy from incident light was necessary indead animals than in living animals to incur retinal damage [5].Furthermore, reducing blood flow in living animals also encour-aged retinal damage from light energy. Other studies revealed atype of closed-loop neural feedback in which increased energyfrom incident light produced an increase in choroidal blood flow[8], [9].
In order to gain insight into the influence of choroidal bloodflow on ocular cooling, numerical simulations are conducted tocompare thermal results first assuming no choroidal blood flowin the head/eye model of Part I, Fig. 8, and subsequently withblood flow modeled. Under both assumptions, the choroid is notconsidered blood, but is instead identified as an independent,unique tissue type. However, because it is heavily vascularized,it is modeled with the same dielectric and thermal properties andmass density of blood.
IV. THERMAL SIMULATIONS IN THE ABSENCE OFCHOROIDAL
BLOOD FLOW
We first consider the absence of choroidal blood flow whereinthe temperature of the choroidal tissue is allowed to rise as dic-tated by the bioheat equation, as any other tissue type wouldwhen exposed to heat. Note that the retina is assigned a highblood perfusion constant in Part I, Table IV, wherein the sourceof this blood is the adjacent choroidal tissue. Thus, we imposethe additional constraint that the parameter ofoccurring inthe bioheat equation when evaluating retinal temperature willbe replaced with the computed temperature of the choroid andwill not be considered fixed at 37C as is the case for other tis-sues, which are perfused with flowing blood. Thus, we considera fixed blood temperature C for all perfused tissuesexcept retina and a variable blood temperature , inlieu of the retina. The cooling term in the bioheat equation willbe for nonretinal tissue and forretina.
Fig. 2. Initial temperature distribution (anterior portion) in the humanhead/eye model in the absence of choroidal blood flow and with no excitationfrom SAR or from the stimulator IC.
A. Initial Temperature Distribution
As we are interested in the temperature increase above thenatural temperature distribution, it is necessary to first simulatethermal spread in the head/eye model of Part I, Fig. 7, begin-ning at an initial assumed air temperature of 24C, while devoidof the influence of SAR and of the implanted IC. The results ofthis simulation appear consistent with expectations of the nat-ural temperature distribution in the human head. A peak tem-perature of 37.2857C occurs within the brain due to the highbasal metabolism associated with white and gray matter as seenin Part I, Table IV. Cooler temperatures occur near the interfacebetween the head model and the surrounding air where thermalconvection occurs.
The anterior portion of the initial temperature distributioncorresponding to the truncated head/eye model of Part I, Fig. 8,is then isolated (Fig. 2) to provide a starting point for predictingthermal increase above the natural temperature distribution dueto SAR and the implanted microchip. In this front portion of

2288 IEEE TRANSACTIONS ON ANTENNAS AND PROPAGATION, VOL. 51, NO. 9, SEPTEMBER 2003
(a)
(b)
Fig. 3. Predicted ocular heating in the head/eye model due to SAR in the absence of choroidal blood flow. (a) Temperature increase versus time. (b) Steady-statedistribution after 60 min.
the head model, a peak temperature of 37.1094C occurs in thebrain.
B. Temperature Increase Due to SAR
A thermal simulation predicting the temperature increasearising from the SAR of Fig. 1 applied to the head/eye model ofPart I, Fig. 8, is run with a simulated time coverage of one hour.At the end of one hour of simulated time, the peak temperaturerise in the right eye has converged to a value of 0.0685C andthe rate of increase has diminished to approximately 10Cwhen monitored at 0.5-s intervals.
A plot of temperature increase over time due to SAR for theleft and right eyes is provided in Fig. 3(a). The vertical axis rep-resents the increase above the initial temperature distribution
encountered over each eye. The SAR distribution of Fig. 1 indi-cates that most of the power is deposited in the right eye despitetargeting the stimulator IC in the left eye, owing to the-fielddistribution associated with the -field sourced from the pri-mary coil. Accordingly, the peak thermal increase of 0.0685Calso occurs in the right eye. Note that the temperature rise ineach eye asymptotically approaches steady state as heat con-tinues to spread beyond the eyes and into the surrounding headtissues.
A color-mapped graphical plot of the steady-state tempera-ture distribution resulting from the SAR of Fig. 1 is providedin Fig. 3(b). The maximum temperature increase of 0.0685Cis indicated by the red area near the lens of the right eye. Onceagain, this is consistent with the location of the SAR maximumfrom Fig. 1.

LAZZI et al.: COMPUTED SAR AND THERMAL ELEVATION IN MODEL OF HUMAN EYE AND HEAD—PART II 2289
(a)
(b)
Fig. 4. Predicted ocular heating in the head/eye model due to stimulator implant power in the absence of choroidal blood flow. (a) Temperature increase versustime. (b) Steady-state distribution after 60 min.
C. Temperature Increase Due to Power Dissipation in theImplanted Stimulator IC
The stimulator power estimates of Part I Table II, acquiredfrom Hspicesimulation have been passed to the thermal numer-ical method developed in Part I, Section II, in order to pre-dict ocular heating. These values correspond to and
are used to compute in Part I, (3), according to
derivation in Part I, Section IV. A separate thermal simulationhas been conducted for each of the 12 variations in biphasicstimulus currents. As with the simulations of thermal increasedue to SAR, the initial temperature distribution of Fig. 2 is as-sumed at the start of each simulation.
A plot of temperature increase in the left eye over time for the12 stimulation cases is provided in Fig. 4(a). The vertical axisrepresents the temperature increase of the midvitreous above theinitial temperature distribution for the left eye of Part I, Fig. 8, inwhich the stimulator IC is modeled. Notice again the asymptoticconvergence of temperature rise in the left eye occurring foreach power scenario, as heat spreads beyond the confines of theleft eye.
A color-mapped graphical plot of the predicted steady-statetemperature distribution arising from operation of the stimulatorIC is provided in Fig. 4(b), corresponding to the expected worstcase power dissipation from Part I,Table II. A temperature increase of 0.6123C is indicated abovethe region of the IC in the left eye. At the surface of the retina,the temperature increase appears to be near 0.2–0.25C.
V. THERMAL SIMULATIONS IN THE PRESENCE OFCHOROIDAL
BLOOD FLOW
Since the blood flow rate is considered to vary with incidentlight energy [8], [9], the heat dissipating influence of flowingblood is modeled by holding the choroidal temperature at
C, thereby assuming ideally an “infinite” blood flow. Inthe biological system, the blood is expected to increase above
C as it carries away heat absorbed in the outer retinaand pigmented epithelium. But as it quickly circulates and is re-placed by fresh blood, we assume that a fixed choroidal temper-ature of C in the head/eye model of Part I,Fig. 8, closely approximates the true response of the choroid.

2290 IEEE TRANSACTIONS ON ANTENNAS AND PROPAGATION, VOL. 51, NO. 9, SEPTEMBER 2003
Fig. 5. Initial temperature distribution (anterior portion) in the humanhead/eye model in the presence of choroidal blood flow and with no excitationfrom SAR or from the stimulator IC.
A. Initial Temperature Distribution
In Section IV-A, the initial steady-state temperature distribu-tion in the absence of choroidal blood flow was computed as astarting point for simulations predicting thermal increase. Sim-ilarly, a new initial distribution is computed in the presence ofchoroidal blood flow. Once again, this is obtained by assuminga fixed choroidal blood temperature of C and is com-puted beginning with an air temperature of 24C and devoid ofthe influence of SAR and the implant IC.
The anterior portion of the initial temperature distributioncorresponding to the truncated head/eye model of Part I, Fig. 8,is again isolated from the initial distribution as shown in Fig. 5.This new initial temperature distribution clearly highlights thechoroidal blood flow now accounted for in thermal simulation,as can be seen in the region posterior to the retina in both eyes ascompared with the same areas in Fig. 2 where choroidal bloodflow was not included. Thus, this new truncated initial distribu-tion will serve to initialize the thermal simulations of SAR andof the implant IC in the context of blood flow in the choroid. Apeak temperature of 37.2159C occurs in the anterior portionof the initial temperature distribution, resulting from a forcedchoroidal blood temperature of C. This forced bloodtemperature in conjunction with heating from the brain with itshigh basal metabolism results in a peak temperature within theregion slightly in excess of the 37.1094C encountered in Fig. 2.
B. Temperature Increase Due to SAR
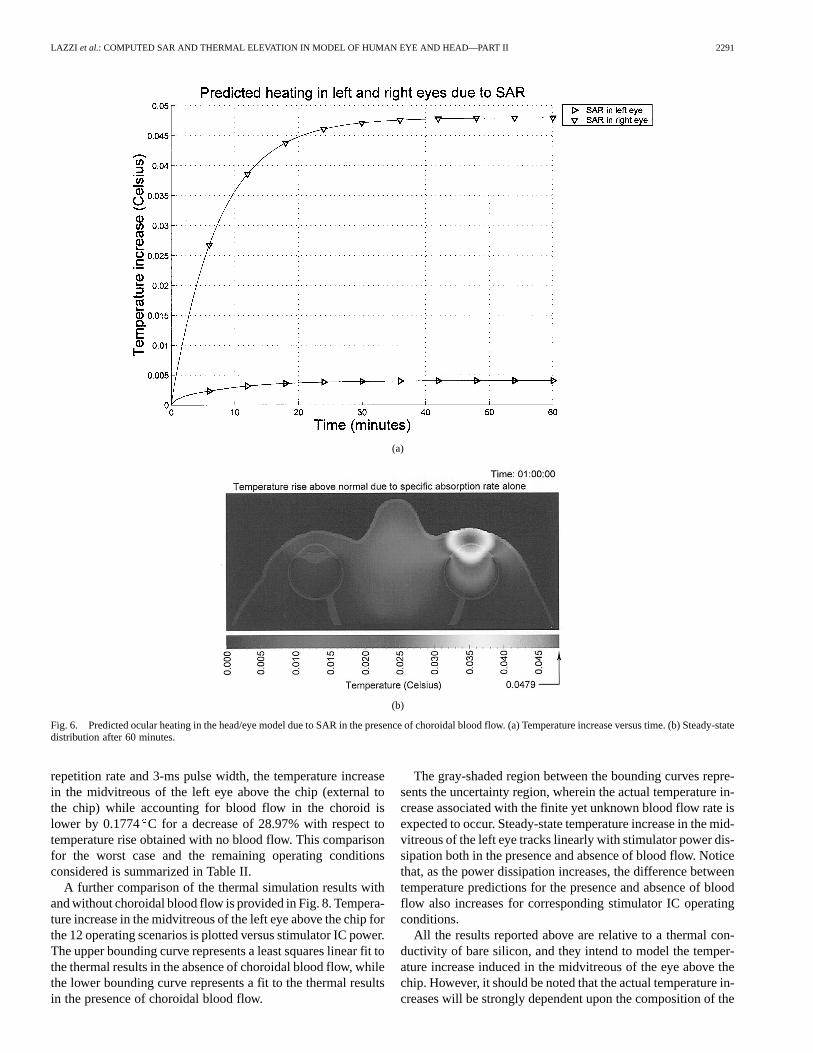
Under the assumption of fixed choroidal temperature, athermal simulation predicting the temperature increase arisingfrom the SAR of Fig. 1 is again run with a simulated timecoverage of one hour. After one hour of simulated time, thepeak temperature rise in the right eye has converged to a valueof 0.0479 C.
A plot of temperature increase over time due to SAR for theleft and right eyes is provided in Fig. 6(a). In contrast to thecurves of Fig. 3, the temperature increases for both eyes appearto reach steady state around 35–40 min. The reason for this rapidconvergence is that the fixed blood of 37C in the eyes preventsheat from spreading across the choroid as can be clearly seen
in the color-mapped graphical plot of the steady-state temper-ature distribution resulting from the SAR of Fig. 1 as providedin Fig. 6(b). This is in strong contrast to the situation present inFig. 3, where the diffusion of heat does occur across the choroidwhere its temperature is not forced at 37C. The maximum tem-perature increase of 0.0479C is indicated by the red area con-centrated in the aqueous humor of the anterior chamber forwardof the lens. The fact that the isotherms over the right eye ofFig. 6(b) do not cross over the choroid as they do in Fig. 3(b) in-dicates that the choroid is acting to provide thermal regulation.This is no longer evident near the vitreous base and over thecornea where the SAR-induced heat expands beyond the bound-aries of the right eye.
C. Temperature Increase Due to Power Dissipation in theImplanted Stimulator IC
Again under the assumption of fixed choroidal temperature,thermal simulations are once more run for each of the 12 stimu-lation cases, using microchip power estimates from Part I, TableII, in order to predict ocular heating in the left eye due to thestimulator implant.
A plot of temperature increase in the left eye over time forthe 12 stimulation cases is provided in Fig. 7(a). As with theSAR-induced heating in the context of choroidal blood flow, thetemperature increases again appear to converge to steady statewithin 30 min.
A color-mapped graphical plot of the predicted steady-statetemperature distribution arising from operation of the stimulatorIC is provided in Fig. 7(b), corresponding to the expected worstcase power dissipation mW from Part I,Table II. Due to the fixed temperature of the choroid, a reducedtemperature increase of 0.4349C is now indicated in the regionabove the IC in the left eye. The temperature increase appearsminimal near the surface of the retina. In contrast to Fig. 4(b),where heat from the stimulator IC expands beyond the eye re-gion and into the surrounding head tissues, Fig. 7(b) indicates alarger portion of the heat is localized by the choroid. Only nearthe anterior of the eye where the choroid ends do we see heatspreading beyond the left eye boundary.
VI. COMPARISON OFTHERMAL RESULTSWITH AND WITHOUT
CHOROIDAL BLOOD FLOW
The numerical simulations of Sections IV and V clearly indi-cate the potential benefit that may be afforded to an implantableprosthesis by the blood flow of the choroid. In regards to SAR,notice that the amount of cooling is more prominent in theright eye where the SAR (deposited electromagnetic power) isgreater. The temperature in the right eye is lower by 0.0206Cfor a decrease of 30.07%, while the maximum in the left eye islower by 0.0039 C for a decrease of 49.37%, as summarizedin Table I.
Similar comparisons are provided for ocular heating due topower dissipation in the stimulator IC and take into accountthe 12 simulated variations in biphasic stimulus currents. Inthe worst operating conditions considered, corresponding tobiphasic stimulus currents of 600A amplitude at 60-Hz
LAZZI et al.: COMPUTED SAR AND THERMAL ELEVATION IN MODEL OF HUMAN EYE AND HEAD—PART II 2291
(a)
(b)
Fig. 6. Predicted ocular heating in the head/eye model due to SAR in the presence of choroidal blood flow. (a) Temperature increase versus time. (b) Steady-statedistribution after 60 minutes.
repetition rate and 3-ms pulse width, the temperature increasein the midvitreous of the left eye above the chip (external tothe chip) while accounting for blood flow in the choroid islower by 0.1774 C for a decrease of 28.97% with respect totemperature rise obtained with no blood flow. This comparisonfor the worst case and the remaining operating conditionsconsidered is summarized in Table II.
A further comparison of the thermal simulation results withand without choroidal blood flow is provided in Fig. 8. Tempera-ture increase in the midvitreous of the left eye above the chip forthe 12 operating scenarios is plotted versus stimulator IC power.The upper bounding curve represents a least squares linear fit tothe thermal results in the absence of choroidal blood flow, whilethe lower bounding curve represents a fit to the thermal resultsin the presence of choroidal blood flow.
The gray-shaded region between the bounding curves repre-sents the uncertainty region, wherein the actual temperature in-crease associated with the finite yet unknown blood flow rate isexpected to occur. Steady-state temperature increase in the mid-vitreous of the left eye tracks linearly with stimulator power dis-sipation both in the presence and absence of blood flow. Noticethat, as the power dissipation increases, the difference betweentemperature predictions for the presence and absence of bloodflow also increases for corresponding stimulator IC operatingconditions.
All the results reported above are relative to a thermal con-ductivity of bare silicon, and they intend to model the temper-ature increase induced in the midvitreous of the eye above thechip. However, it should be noted that the actual temperature in-creases will be strongly dependent upon the composition of the

2292 IEEE TRANSACTIONS ON ANTENNAS AND PROPAGATION, VOL. 51, NO. 9, SEPTEMBER 2003
(a)
(b)
Fig. 7. Predicted ocular heating in the head/eye model due to stimulator implant power in the presence of choroidal blood flow. (a) Temperature increase versustime. (b) Steady-state distribution after 60 min.
TABLE ITEMPERATUREELEVATIONS RESULTING FROM THE THERMAL SIMULATION OF
SAR, CORRESPONDING TOFIG. 1, IN THE ABSENCE OFCHOROIDAL
BLOOD FLOW
implant, and three-dimensional simulations should be employedto characterize these effects.
VII. EXPERIMENTAL VALIDATION
In supplement to the analytical validations of the numericalmethods presented in Part I, Section II [10], a further step hasbeen taken to gain additional confidence in the thermal sim-ulation results presented in Section IV and V. Researchers atthe University of Southern California (USC) [formerly at Johns
TABLE IITEMPERATUREELEVATIONS RESULTING FROM THE HSPICESIMULATED
POWER DISSIPATION ESTIMATES P FROM PART I, TABLE II,IN THE ABSENCE OFCHOROIDAL BLOOD FLOW
Hopkins University (JHU)] have experimentally measured thethermal response to power dissipation introduced into the eyesof dogs [11]. In one of several experiments in this work, 500 mW

LAZZI et al.: COMPUTED SAR AND THERMAL ELEVATION IN MODEL OF HUMAN EYE AND HEAD—PART II 2293
Fig. 8. A comparison of predicted ocular heating versus stimulator implant power while considering the absence and presence of choroidal blood flow.
of power dissipation introduced intraocularly for a duration oftwo hours at midvitreous via a ceramic-tipped resistive heatingelement led to a 2C increase in the temperature measured atthe retina surface. The simulated thermal elevations encounteredin the left eye versus the 12 power dissipations considered forthe stimulator IC, as shown in Fig. 8, represent the elevationthat occurred in the midvitreous of the eye, above the locationof the stimulator IC model in Part I, Fig. 8. In order to corre-late these data with this experimental measurement at USC/JHU[11], the simulated thermal elevation encountered at the retinasurface is plotted versus the power dissipation in the stimulatorIC, as shown in Fig. 9.
The upper line corresponds to the heating at the retinal sur-face in the absence of any choroidal blood flow. Conversely,the lower line is associated with retina heating where choroidal“infinite” blood flow is maintained. In the latter case, the fixedchoroidal temperature of 37C prevents the adjacent retina fromheating as greatly as in the former case where the choroidal tem-perature is not held fixed. As such, a maximum simulated tem-perature elevation of only 0.0038C is observed.
Based on the observed linear dependence of retinal heatingover the range of power dissipations shown here, extrapolatingthe 500-mW power dissipation used in the experiments atUSC/JHU back down to (thehighest power dissipation considered for the stimulator IC)would predict a thermal elevation of 0.1859C. From the dataassociated with the case of no choroidal blood flow plotted inFig. 9, the thermal elevation encountered at the retinal surfacefor is 0.1876 C. This is in goodagreement with the measured value [11]. Although the datawere obtained from live eyes with choroidal blood flow, nosignificant changes were measured when choroidal blood flowwas stopped partway through one of the experiments [11].
The lack of any observed variations in recorded temperaturesduring collection of experimental data appears to indicate thatthe model with no blood flow is closer to reality than the modelwith infinite blood flow, meaning that the blood vessels in thechoroid are not such to maintain the choroidal temperature at aconstant value of 37C.
VIII. C ONCLUSION
We have presented a numerical study of the thermal increasein the human eye and head associated with the operation of animplantable retinal prosthesis to recover limited sight in blindpatients affected by retinitis pigmentosa or age-related maculardegeneration. The prosthesis system intends to provide elec-trical stimulation to existing living ganglion and bipolar cells ofthe retina using an array of on-chip stimulus circuits and uses in-ductive telemetry over coils for power and data communication.The demonstration that direct electrical stimulation of retinalganglion cells can create visual sensation in patients has beenshown clinically [12], [13], and patients have been able to rec-ognize English characters and other simple forms when stimu-lated by a small array of retinal electrodes.
A new two-dimensional 0.25-mm resolution cross-section ofthe human head has been developed with a novel semiautomaticdiscretizer to account for the finest anatomical details of thehuman eye. While a D-H FDTD method with PML absorbingboundary conditions has been used to compute the electromag-netic fields induced in the human head by the external telemetrycoil, a discretized version of the bioheat equation accountingfor both induced SAR and dissipated power of the implantedmicrochip has been developed to compute the temperature el-evation in the human eye associated with the retinal prosthesissystem.

2294 IEEE TRANSACTIONS ON ANTENNAS AND PROPAGATION, VOL. 51, NO. 9, SEPTEMBER 2003
Fig. 9. A comparison of computed ocular heating over the left eye versus power dissipation in the stimulator IC while considering the absence and presence ofchoroidal blood flow. This heating occurs at the inner retinal surface near the fovea.
We have concluded that in the absence of choroidal bloodflow, which corresponds to the case of blood flow rates that arenot sufficient to carry away a significant amount of heat, a max-imum temperature rise of 0.0685C is induced by the externaltelemetry coil in the eye that does not contain the implantedmicrochip. Conversely, when considering choroidal blood flow,corresponding to the case of blood flow rates that are such tomaintain the temperature of the choroid at a steady 37C, a re-duced maximum rise induced by SAR of 0.0479C occurs.
The largest temperature increase associated with the opera-tion of the retinal prosthesis has been shown to be due to thepower dissipated by the stimulator IC, which has been evaluatedunder different operational conditions, corresponding to variousdegrees of damage of the patient’s retina, and different choroidalblood flow assumptions. A temperature rise of 0.6123C in theeye with the implant in the absence of blood flow and a re-duced increase of 0.4349C when accounting for blood flow hasbeen recorded when computing the temperature increase in themidvitreous above the implanted microchip. It should be noted,however, that temperature increase induced on the retina, themost delicate organ in the human eye, was lower than 0.2Cwhen the implanted microchip was collocated in the center ofthe eyeball.
Computed results appear to parallel recent experimental re-sults in animals, especially for the case of absence of choroidalblood flow. However, we should note that the proposed two-di-mensional methods and models can characterize the tempera-ture increase in the midvitreous above the implanted microchip,
which can be lower than the actual maximum temperature onthe surface of the microchip itself.
A complete and accurate characterization of the temperaturedistribution on the chip and in the eye can be achieved by usingthree-dimensional modeling. In this case, the disadvantages arethe extremely large computer memory requirements and com-putational times necessary to perform simulations characterizedby a suitable resolution of the computational mesh.
REFERENCES
[1] S. C. DeMarco, S. M. Clements, and W. Liu, “A 60 channel implantableneuro-stimulator for an epi-retinal visual prosthesis,”, unpublished.
[2] P. R. Troyk and M. A. K. Schwan, “Closed-loop class E transcutaneouspower and data link for microimplants,”IEEE Trans. Biomed. Eng., vol.39, pp. 589–599, June 1992.
[3] W. K. Noell, V. S. Walker, and B. S. Kanget al., “Retinal damage bylight in rats,” Inv. Ophthalmol. Visual Sci., vol. 5, p. 450, 1966.
[4] E. Friedman and T. Kuwubara, “The retinal pigment epithelium: IV. Thedamaging effects of radiant energy,”Arch. Ophthalmol., vol. 80, pp.265–279, 1968.
[5] L. M. Parver, C. Auker, and D. O. Carpenter, “Choroidal blood flow asa heat dissipating mechanism in the macula,”Amer. J. Ophthalmol., vol.89, pp. 641–646, 1980.
[6] J. T. Ernest, “Choroidal circulation,” inRetina, 2 ed, S. J. Ryan, Ed. St.Louis, MO: Mosby-Yearbook, 1994, vol. 1, Basic Science and InheritedRetina Disease, pp. 76–80.
[7] P. W. V.Peter W. V. Gurney, “Is our ‘inverted’ retina really a ‘bad de-sign’?,” Creation Ex Nihilo, vol. 13, no. 1, 1999.
[8] L. M. Parver, C. Auker, and D. O. Carpenter, “Choroidal blood flow: III.Reflexive control in the human,”Arch. Ophthalmol., vol. 101, p. 1604,1983.
[9] L. M. Parver, “Temperature modulating action of choroidal blood flow,”Eye, vol. 5, p. 181, 1991.

LAZZI et al.: COMPUTED SAR AND THERMAL ELEVATION IN MODEL OF HUMAN EYE AND HEAD—PART II 2295
[10] F. Bardati, G. Gerosa, and P. Lampariello, “Temperature distribution insimulated living tissues irradiated electromagnetically,”Alta Frequenza,vol. XLIX, no. 2, pp. 61–67, 1980.
[11] D. V. Piyathaisere, E. Margalit, S. J. Chen, J. S. Shyu, S. A. D’Anna, J. D.Weiland, R. R. Grebe, L. Grebe, G. Fujii, S. Y. Kim, R. J. Greenberg Jr.,E. De Juan, and M. S. Humayun, “Heat effects on the retina,”Ophthal.Surgery Lasers, July 3, 2001.
[12] M. S. Humayun, E. De Juan Jr., G. Dagnelie, R. J. Greenberg, R. H.Propst, and H. Phillips, “Visual perception elicited by electrical stimu-lation of the retina in blind humans,”Arch. Ophthalmol., vol. 114, pp.40–46, 1996.
[13] M. S. Humayun, E. De Juan Jr., J. D. Weiland, G. Dagnelie, S. Katona, R.Greenberg, and S. Suzuki, “Pattern electrical stimulation of the humanretina,”Vision Res., vol. 39, pp. 2569–2576, 1999.
Gianluca Lazzi (S’94–M’95–SM’99) was bornin Rome, Italy, on April 25, 1970. He received theDr.Eng. degree in electronics from the Universityof Rome La Sapienza, Rome, Italy, in 1994 andthe Ph.D. degree in electrical engineering from theUniversity of Utah, Salt Lake City, in 1998.
He has been a Consultant for several companies(1988–1994), Visiting Researcher at the ItalianNational Board for New Technologies, Energy, andEnvironment (ENEA) (1994), Visiting Researcher
at the University of Rome La Sapienza (1994–1995), and Research Associate(1995–1998) and Research Assistant Professor (1998–1999) at the Universityof Utah. He is presently an Assistant Professor at the Department of Electricaland Computer Engineering, North Carolina State University, Raleigh. He isauthor or coauthor of more than 70 international journal articles or conferencepresentations on FDTD modeling, dosimetry, and bioelectromagnetics.
Dr. Lazzi received a 2001 NSF CAREER Award, a 2001 Whitaker Foun-dation Biomedical Engineering Grant for Young Investigators, a 1996 Interna-tional Union of Radio Science (URSI) Young Scientist Award, and the 1996Curtis Carl Johnson Memorial Award for the best student paper presented atthe eighteenth annual technical meeting of the Bioelectromagnetics Society. Heis an Associate Editor for the IEEE ANTENNAS AND WIRELESSPROPAGATION
LETTERS. He is listed inWho’s Who in the World, Who’s Who in America, Who’sWho in Science and Engineering, Dictionary of International Biographies,and2000 Outstanding Scientists of the 20th Century.
Stephen C. DeMarcowas born in Fairmont, WV, in1971. He received the B.S.(summa cum laude)andM.S. degrees in computer engineering from NorthCarolina State University, Raleigh, in 1994 and1996, respectively, where he is currently pursuingthe Ph.D. degree in electrical engineering.
His research is in the areas of analog/dig-ital/mixed-mode circuit design, VLSI, FPGAs, andcomputer vision/image-processing applicable toretina prosthesis development.
Wentai Liu (S’78–M’81–SM’93) received the Ph.D.degree in computer engineering from the Universityof Michigan at Ann Arbor in 1983.
He has been since 1983 on the Faculty of NorthCarolina State University, Raleigh, where he iscurrently the Alcoa Professor of Electrical and Com-puter Engineering. His research focuses on retinalprosthesis to restore eyesight for the blind, molecularelectronics, analog and digital VLSI design andCAD, phase-locked-loop, noise characterization andmodeling, timing/clock optimization, high-speed
transceiver for communication network, digital CMOS camera, telemetrydesign, and microelectronic sensor design.
Prof. Liu received an IEEE Outstanding Paper Award in 1986 and the AlcoaFoundation’s Distinguished Engineering Research Award in 1999.
James D. Weiland(S’92–M’99) received the B.S.degree, the M.S. degree in biomedical engineeringand electrical engineering, and the Ph.D. degreein biomedical engineering from the University ofMichigan, Ann Arbor, in 1988, 1993, 1995, and1997, respectively.
From 1997 to 2001, he was with the WilmerOphthalmological Institute, Johns Hopkins Univer-sity, first as a Postdoctoral Fellow and then as anAssistant Professor. In 2001, he became an AssistantProfessor in the Department of Ophthalmology,
University of Southern California Keck School of Medicine, Doheny EyeInstitute, Los Angeles, CA. His interests include retinal prostheses, electrodetechnology, visual evoked responses, and implantable electrical systems.
Dr. Weiland is a member of the IEEE EMBS, the Biomedical EngineeringSociety, and the Association for Research in Vision and Ophthalmology.
Mark S. Humayun (M’97) received the M.D. de-gree from Duke University, Durham, NC, in 1989 andthe Ph.D. degree in biomedical engineering from theUniversity of North Carolina, Chapel Hill, in 1993.
He has been Assistant and Associate Professor atthe Department of Ophthalmology, Johns HopkinsHospital, Baltimore, MD. He is currently a Professorin the Department of Ophthalmology, Universityof Southern California Keck School of Medicine,Doheny Eye Institute, Los Angeles, CA.