Digital Economy Compass -...
192
Digital Economy Compass April 2017
Transcript of Digital Economy Compass -...

Digital EconomyCompassApril 2017

2
“At least 40% of all businesses will die in the next 10 years… if they don’t figure out how to change their entire company to accommodate new technologies.”
John Chambers, Chairman of Cisco System

Welcome to the Digital Economy Compass
3
Less talking, more facts – our idea behind creating the Digital Economy Compass. It contains facts, trends and key players, covering the entire digital economy.
We provide…› key essentials from our research,› actionable insights, › Statista’s exclusive forecasts.
This very first edition will provide everything you need to know about the digital economy.
Your Digital Market Outlook Team

Table of Contents
4
› Connectivity: Numbers behind the “always on” trend…………………………...
› Social Media: Love it, hate it, but accept that you need it…………………...
› Platform Economics: A story about White Sharks and Swordfish………
› Venture Capital: Feed for new Tech-Unicorns…………………………………......
› AI, AR and VR: The next big Technology Hype……………………………………….
Statista’s Digital Market Outlook
Global Trends
› e-Commerce……………………...
› eServices…………………………….
› eTravel ……………………………….
› Digital Media……………………...
› FinTech………………………………….
› Digital Advertising……………....
› Smart Home……………………......
› Connected Car……………………..
91
5
20
30
83
160
171
181
148
129
106
117
138

Connectivity

Source: internetlivestats.com
2,570,792e-mails per second
The global number of e-mails sent per second resultedin around 81 trillion e-mails sent during 2016.

The world is more connected than ever, a development which looks set to continue
Source: Statista Digital Market OutlookNote: Figures account for total world population using the internet / a smartphone within the last 12 months
7
Share of world population connected to the internet from 2016 to 2021
+5.7% p.a.
+3.7% p.a.
2021
50.5%
63.9%
2020
48.8%
61.8%
2019
46.9%
59.7%
2018
44.5%
57.5%
2017
41.6%
55.4%
2016
38.2%
53.2%
Mobile penetration
Internet penetration
Connectivity

Many people still lack internet access, particularly in the most populous countries
Source: Statista Digital Market OutlookNote: Only includes countries listed in the Digital Market Outlook
8
Internet penetration per country in 2016 (in % of total population)
Internet
penetration rate
> 80%
> 70%
> 60%
< 60%
Connectivity
Not included

Web consumption per user via Laptop or Desktop PC is highest in Brazil
Source: Statista Digital Market OutlookNote: Data is based on internet users aged 16+; non-internet users are excluded from averages
9
Time spent online via Laptop/Desktop PC (hours per day)
Spain
Germany
South Korea
China
Brazil
Canada
United Kingdom
Italy
France
United States
2012 2016
5:36
4:43
4:27
4:22
4:16
3:57
3:55
3:36
3:29
3:16
5:28
5:06
4:23
4:30
4:07
4:08
4:03
3:38
4:39
3:45
Connectivity

In a global comparison, broadband speed is fastest in East Asia and Scandinavia
Source: Akamai TechnologiesNote: Figure refers to Q3-2016; countries covered: broadband ranking – 1471: Megabits per second 10
Average broadband speed in Top10 and selected countries (in Mbps1)
South Korea 1
Hong Kong 2
Norway 3
23.6
18.2
Sweden 4
20.1
18.4
20.0
19.7
China 85
Switzerland 5
Singapore 6
Japan 7
Finland 8
Netherlands 9
Latvia 10
…
United States 12
United Kingdom 20
Germany 26
France 49
18.0
17.6
17.3
16.9
5.7
16.3
14.9
13.7
9.7
Connectivity

11
“Mobile is the future, and there is no such thing as communication overload.”
Eric Schmidt, Executive Chairman of Alphabet, Inc.

Smartphone sales reached almost 1.5 billion in 2016, with Samsung being the biggest vendor
Source: IDC, Gartner1: Original Equipment Manufacturer2: Shipment information not available for each year; if no information available, sales are included in “Other” Note: Estimated figures for Lenovo and Xiaomi in 2016; market shares may not sum up in 100% due to rounding
12
Global smartphone shipments (in million) and market shares per OEM1
4.0%
5.3%
2016
1,437
2014
1,302
2013
1,020
2012
725
2011
495
2010
305
9.5%
6.8%
14.6%
21.2%
3.1%
35.6%
2015
1,471
Samsung
Apple
Huawei
Oppo
Vivo
Lenovo
Xiaomi
Others2
2
2
2
2
Connectivity

Android has become the dominating mobile OS, while Apple’s iOS has maintained market share
Source: GartnerOS = Operating System1: based on worldwide unit sales
Worldwide smartphone operating system market share1
84.8%
14.4%
2016
100%
2013 20152014
14.4%
3.9%
2012201120102009
iOS AndroidWindowsSymbianOthers BlackBerry
13
Connectivity

Cross-device, Android even overtook Windows as the dominating OS for desktop and mobile
Source: StatCounter.com
14
Global operating system market share from Feb 2016 to Mar 2017
0
5
10
15
20
25
30
35
40
45
50
Mar-17Feb-17Jan-17Dec-16Nov-16Oct-16Sep-16Aug-16Jul-16Jun-16May-16Apr-16Mar-16Feb-16
OS XiOSAndroidWindows
Market share (in %)
Android37.93%
Windows37.91%
Connectivity

Advanced mobile devices and a growing number of apps increase time spent on mobile devices
Source: Statista Digital Market Outlook Note: Data is based on internet users aged 16+; non-internet users are excluded from averages
15
Time spent online via mobile device per user (hours per day)
Canada
United Kingdom
France
Germany
Brazil
United States
Spain
Italy
South Korea
China
2012 2016
4:48
3:03
2:37
2:34
2:11
2:10
2:10
2:09
1:37
1:32
1:54
1:48
1:35
1:37
1:52
1:35
1:14
1:16
1:20
1:01
Connectivity
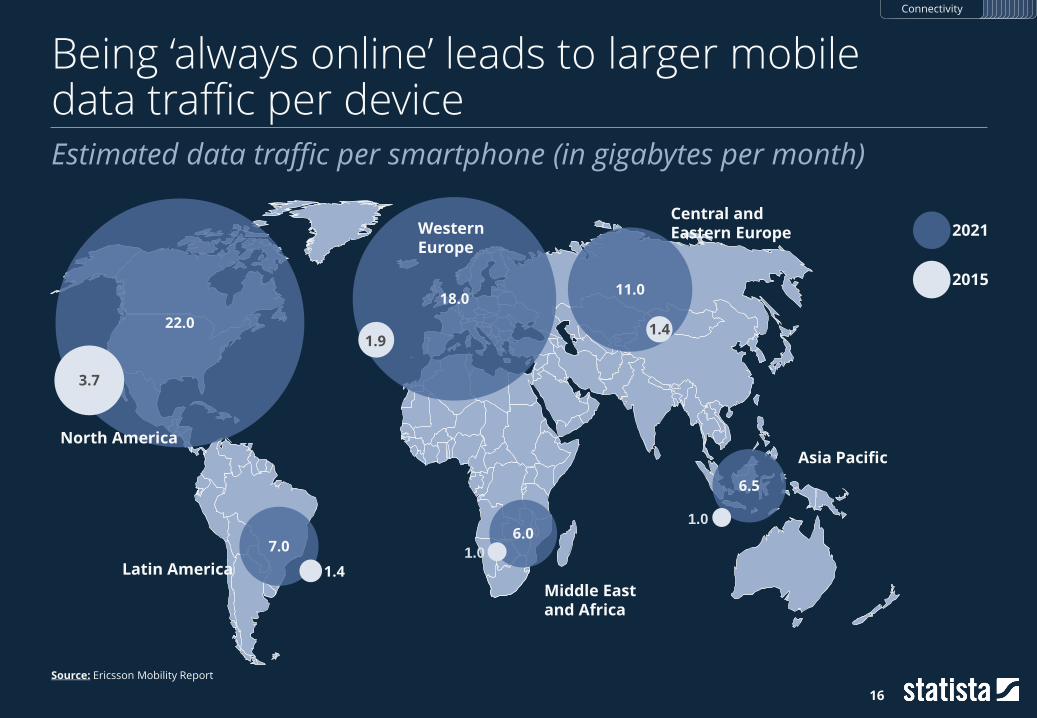
Being ‘always online’ leads to larger mobile data traffic per device
Source: Ericsson Mobility Report
16
Estimated data traffic per smartphone (in gigabytes per month)
22.0
7.06.0
18.011.0
6.5
3.7
North America
Latin America
Middle East and Africa
Asia Pacific
Central and Eastern EuropeWestern
Europe
1.91.4
1.4
1.0
1.0
2021
2015
Connectivity

The sevenfold increase in global mobile data traffic is mainly driven by online video streaming
Source: Cisco System; figures include only cellular mobile traffic (Wi-Fi or small cell from dual-mode devices are excluded)Note: Other mobile devices include Tablets, mobile PCs, M2M (incl. wearables), non-smartphone mobile phones, e-readers and portable gaming consoles
17
Global mobile traffic forecast per segment (in petabytes per month)
560
11,266
16,792
7,225
2,939
11,415
3,780
1,194
7,2412,154
4,375
2016 2017 2018 2019 2020 2021
843259 403
24,452
5921,621
17,565
4,675
34,531
8212,104
26,068
5,539
48,360
1,1032,674
38,148
6,435
152
Web, data, and VoIP
Video streaming
Audio streaming
File sharing
Consumed via smartphone
85.2%
85.8%
81.3%
82.8%
83.8%
84.7%
1 Petabyte = 1 million Gigabyte
Connectivity

Mobile connection speed varies a lot between countries, with disappointing speed in the U.S.
Source: Akamai TechnologiesFigure refers to Q3-2016; countries covered in mobile connection ranking – 61Note: Evaluation of mobile connection speed for each country is based on a minimum of 25,000 observed unique IPv4 addresses1: Megabits per second
18
Average mobile speed in Top10 and selected countries (in Mbps1)
United States 38
23.7
7.5
China 31 8.9
South Korea 18 11.2
Japan 16 11.6
France 13 12.4
…
United Kingdom 1
Australia 10 12.8
Austria 9 13.0
Germany 8 13.1
Ireland 7 13.2
UAE 6 13.3
Spain 5 13.4
Finland 4 16.9
Norway 3 17.4
Belgium 2 19.3
Connectivity

Pokémon Go was the most popular mobile game for iPhone users across the globe
In cooperation with
19
Most downloaded iPhone apps per category and country in 2016
Categories covered: Shopping, Music, News, Gaming, Social Networks
U.S.
PandoraAmazon CNN
Pokémon Go
Messenger
China
KugouMusic
Taobao Toutiao
WeChatKing of Glory
Germany
SpotifyKleinanzeigen
Spiegel Online
Pokémon Go
U.K.
SpotifyeBay BBC News
Pokémon Go
France
DeezerWish Le Monde
Pokémon Go
Messenger
Connectivity

Social Media

“If you make customers unhappy in the physical world, they might each tell 6 friends. If you make customers unhappy on the Internet, they can each tell 6,000 friends.”
Jeff Bezos, Founder and CEO of Amazon

In 2016, Social Media platforms connected 2.8bn people, more than 1/3 of the world population
Source: wearesocial, InternetWorldStats, Statista Digital Market Outlook1: MAU = Monthly active users
22
Selected countries in terms of Social Media MAU1 (in million)
16
23
25
31
33
36
42
42
48
56
64
122
191
214
India
2,789
Germany
Australia
France
China
Spain
787
Japan
1,059
Canada
Rest of the world
Russia
United Kingdom
Global
United States
Turkey
South Korea
Brazil
Italy
62%
of global Social Media
users
Social Media

Users in Brazil are connected to Social Media for more than 4 hours a day
Source: Statista Digital Market OutlookNote: Data is based on internet users aged 16+; non users are excluded from averages
23
Avg. time users spend on Social Media platforms (hours per day)
Germany
France
Spain
China
Australia
Canada
United Kingdom
Italy
United States
Brazil
2012 2016
4:183:03
2:331:49
2:211:55
2:081:35
2:021:33
2:011:42
2:001:31
1:571:47
1:491:31
1:271:26
Social Media

> 50,000,000,000
More than 50 billion messages are sent through WhatsApp every day.
Source: Facebook (February 2017)

Facebook has the biggest Social Media reach, followed by Chinese tech-company TencentMAU1 of selected social networks and messaging services (in million)
Source: We Are Social, Hootsuite, Techcrunch, 1: MAU = Monthly active users, as of January 2017; WhatsApp and Facebook Messenger as of March 20172: Estimation as Snapchat only reports daily active users
90
150
297
300
317
632
700
846
877
VK
Snapchat
Qzone
1,200Messenger
Facebook 1,871
1,200Whatsapp
Tencent Inc.Facebook Inc. Others
25
2
Social Media

Facebook and LinkedIn Social Media exits1 were the most expensive per user to investors
Source: Company Information, Yahoo! Finance, Business Insider, ForbesNote: Figures for monthly active users refer to the time of exit1: Acquisition or IPO2: MAU = monthly active user
26
Social Media exits (acquisition or IPO) in comparison
55
24
4
100
163
106
65
400
200
100
0
110,000105,000100,00025,000
800
20,00010,0005,0000 15,000
1,000
600
Monthly active users
(in m)
Tumblr
Exit (US$m )
Price per MAU2
(in US$)
Social Media
Snapchat

Q1-’12Q4-’11Q1-’11Q2-’10 Q4-’10Q3-’10 Q2-11 Q3-’11
1.14
1.38
1.26
0.90
1.26 1.24 1.21
0.94
0.18
0.50
Q4-’15
0.84
Q3-’16
0.32
Q2-’16 Q4-’16Q2-’15 Q1-’16
0.06
0.31
0.05
Q1-’15
1.05
Q3-’15
Snapchat pre-IPO revenue per user performed well compared to its biggest competitor
Sources: Snap Inc., Facebook Inc.
27
Global avg. revenue per user in the eight quarters before IPO (in US$)Snapchat Facebook
Social Media

Post-IPO development is nothing to worry about for Snapchat
Source: Yahoo! FinanceNote: Figures as per 4-19-2017; all stock prices are closing prices; dividends are not considered
28
Stock prices of Snap, Facebook and Twitter in the first 30 days after IPO
0 30
US$44.9
US$38.2
US$19.5
US$25.9
US$39.1
US$20.2
US$31.1
US$57.5
US$24.5
Snap Inc. Twitter Inc.Facebook Inc.
-17.5%
-18.7%
+28.0%
Low-point
IPO
1st 30 days change3/2/2017IPO: 5/18/2012 11/7/2013
Days after IPO
Social Media
IPO-to-date
-15.8%
- 67.6%
+272.1%
11 1213

If you are not Facebook, it remains challenging to transform Social Media into a profitable business
Source: Company Information, as of Mar 20171: Statista estimated financial results for Q4-2016
29
FY2016 results of listed U.S. Social Media platforms (in US$ million )
404
-515
-457
-162
Snapchat
2,530
3,868
10,217
27,638
Net profit / loss
Revenues
1
Social Media

Platform Economics
“A platform is a plug-and-play business model that allows multiple participants (producers and consumers) to connect to it, interact with each other and create and exchange value.”

The success of a digital platform is dependent on its external ecosystem
Source: Harvard Business Review
32
Factors determining successful platforms
Connection Gravity Flow
Simplicity for partners to plug in, share and transact
Capability to attract producers and consumers
Promotion of co-creation and exchange of value
Platform Economics

Digital platforms with varying business models can be found in multiple industries
Source: Statista Research
33
Platform examples and their business models
Repository Digital Media Infrastructure
Search engines Application stores
Social Media Ride sharing
Market places Classifieds
Advertising Transactions
Subscription Freemium Pay-as-you-go
Digital Platforms
store
Platform Economics
Didi Chuxing

Digital
White Sharks
- At the top of the food chain -
› (Very few) digital economy leaders
› Wide, diverse product portfolio
› Gigantic assets
Digital
Swordfish
- Big, fast, rarely get eaten -
› (Few) big industry shaping players
› Deep, vertical specific products
› Already near peak growth
Digital
Piranhas
- Small but aggressive for prey -
› (Many) product specific players
› Huge, product centric competition
› Peak growth not yet reached
The platform landscape consists of White Sharks, Swordfish, and Piranhas
Source: Statista Digital Market Outlook
34
Platform economics in nutshell
Platform Economics

Huge Chinese rivals are catching up on the big four U.S. platforms
Source: Yahoo! Finance as per 04-12-2017
35
Top 15 publicly listed platforms by market cap (in US$ billion)
10
14
24
37
45
46
51
60
62
270
276
404
431
574
743
Rank Company Country Market Cap
1
2
3
4
5
6
7
8
9
10
11
12
13
14
15
Apple
Amazon
Alibaba
Tencent
Netflix
Baidu
Paypal
JD.com
Yahoo!
Ebay
Snap
Rakuten
∑
US$3,047bn
Platform Economics

VC-backed platforms are vertically focused and 1/3 of the Top15 is located in China
Source: CB Insights as per 04-12-2017
36
Top 15 privately held, VC-backed platforms by market cap (in US$ billion)
7
7
9
9
10
10
11
11
17
18
19
29
34
46
68
Rank Company Country Market Cap
1
2
3
4
5
6
7
8
9
10
11
12
13
14
15
Uber
Xiaomi
Didi Chuxing
Airbnb
Lu.com
China Internet Plus
WeWork
Toutiao
Flipkart
Dropbox
Stripe
Spotify
Snapdeal
Lyft
∑
US$304bn
China Internet Plus
Platform Economics
Category
Ride Sharing
Consumer Electr.
Ride Sharing
Online Travel
E-Commerce
Financing/Lending
Collaboration
Social Media
Digital Media
E-Commerce
Collaboration
Online Payment
Digital Media
E-Commerce
Ride Sharing

Google Amazon FacebookApple

The biggest White Sharks in the digital economy: Google, Amazon, Facebook, and Apple
Source: Company Information, Yahoo Finance; Note: All figures refer to end of fiscal year 2016, except market cap which is as of 03-10-2017; figures related to Google correspond to Alphabet Inc. conglomerate1: Unaudited as per released financial results2: Full-time and part-time employees
38
Google, Amazon, Facebook and Apple key figures
Founded: 04-1976HQ: Cupertino, CaliforniaCEO: Tim Cook (since 08-2011)Revenues: US$215.64 billionNet income: US$45.69 billionEmployees: 116,000Market cap: US$727.4 billion
Founded: 09-1994HQ: Mountain View, CaliforniaCEO: Sundar Pichai (since 10-2015) Revenues1: US$90.23 billion Net income1: US$19.48 billionEmployees: 69,953Market cap: US$558.1 billion
Founded: 05-1994HQ: Seattle, WashingtonCEO: Jeff Bezos (since 05-1996)Revenues1: US$135.99 billionNet income1: US$2.37 billionEmployees2: 341,400Market cap: US$407.0 billion
Founded: 02-2004HQ: Menlo Park, CaliforniaCEO: Mark Zuckerberg (since 2004)Revenues1: US$27.64 billionNet income1: US$10.22 billionEmployees: 17,048Market cap: US$399.5 billion
Platform Economics

Revenues of the biggest four U.S. players show consistent growth
Source: Company InformationNote: FY2016 figures for Google, Amazon, Facebook are unaudited as per released financial results
39
Google, Amazon, Facebook and Apple global revenues (in US$ billion)
50.0
Apple
214.2
231.3
183.2170.9
156.0
27.617.9
12.57.95.1
Amazon
136.0
107.0
89.0
74.561.1
89.7
73.665.8
59.7
20162015201420132012
CAGR +15.8% CAGR +22.2% CAGR +52.7%
CAGR +8.3%
Platform Economics

Apple has the highest net income, while Facebook has just started to make big money
Source: Company InformationNote: The size of circles corresponds to net income; FY2016 figures for Google, Amazon and Facebook are unaudited financial results
40
Google, Amazon, Facebook and Apple global net income (in US$ billion)
20152011 20132012 20162014
0.05
12.7310.62 14.14
-0.04
2.94
16.35
2.370.27 -0.24
39.51 45.6941.73 37.04
10.22
0.60
1.50
19.48
3.69
53.39
Platform Economics

Relationships with their users are key to the biggest digital platforms’ successes
Source: Statista Research
41
Digital action fields of the “Big Four” – Google, Amazon, FB and Apple
IT & Infrastructure Aquila Apple SIM
Artificial Intelligence Google Assistant Jarvis Siri
Hardware Devices
Communication & Messaging
Digital Media & Entertainment
Connected Car & e-Mobility-Integration
(Transportation)CarPlay
E-Commerce & RetailFacebook
‘Buy-Button’
FinTech & Payment-Integration
(Friend-to-Friend Payment)
Navigation & Location servicesAmazon Maps API,
MAPS.ME integration-Integration
AdvertisingFacebook Business,Instagram Business
Apple Search Ads
Healthcare 1492 lab Genes for Good
Google+ Allo
Pixel
Chromecast
Home
Google Maps
AdExchange
Alexa integration
Whatsapp facebook
Messenger
etc.
etc.
iBeacon store
Apple Maps
facebook.com/gaming
‘Purchase on Google’
HomePod
HealthKit
Anytime

Source: internetlivestats.com
59,141
Every second Google receives 59,141 search requests. On a single day, this number totals over 5.1 billion.

Google’s extensive product portfolio covers nearly all aspects of the digital experience
Source: Google
43
Google product portfolio
Data Analysis
VR/AR
Office
Android System
Translate
Android Phones
Android Auto
Entertainment
Google Play Music
Youtube
Chrome-cast
Google Play Movies & TV
Google Play
Google Play Apps
Play Games
Play Newsstand
YouTube Kids
Social
Gmail
Google Allo
Google Duo
Google+Messenger
Hangouts
Inbox by Gmail
Voice
Docs
Sheets
Drive Slides
Android for Work
Forms
Analytics
Education
Google Classroom
Education Scholar
Internet Browser
Chrome Chromebook Chrome for Work
Chrome Web Store
Drawings
Google Expeditions
Blogger Google Cast
Google Cloud Print
Gboard
TangoTilt Brush
Sites
Search Engine
Search Google Search for Work
Search Console
Google Sync
Navigation
Maps Google Maps Business View
Google Maps for Work
Earth Waze
GoogleDomains
Google Surveys
Designing
Google Fonts
Nik Collection
Web Designer
Android OS
Android Pay
Google Alerts
News
YouTube Gaming
G Suite
Google Cloud Platform
Google Trends
Android One
Google Groups
Google Input Tools
Android Tablet
Life
Google Flights
Google One Today
Project Fi
Google Fit
Zagat Google Camera
E-Commerce
Google Express
Trusted Stores
Google Store
Business & Marketing
AdWords
AdSense
My Busines
Google Shopping Campaigns
Google+ Brands
Local Inventory Ads
Merchant Center
DoubleClick by Google
FinanceTag Manager
AdMob
Google Calendar
Hardware
Pixel Home Google Wifi
Smartbox
OnHub
Cardboard
Daydream View
Android Wear
Google Goggles
Nexus
Platform Economics

“Day 2 is stasis. Followed by irrelevance. Followed by excruciating, painful decline. Followed by death. And that is why it is always Day 1.”
Jeff Bezos, Founder and CEO of Amazon

The key to Amazon’s success is Jeff Bezos’ “Day 1” philosophy
Source: Amazon, Inc.
45
Amazon revenue development from foundation to 2016 (in US$ million)
61014816
135,987
2015
107,006
2014
88,988
2013
74,452
2012
61,093
2011
48,077
2010
34,204
2009
24,509
2008
19,166
2007
14,835
2006
10,711
2005
8,490
2004
6,921
2003
5,264
2002
3,933
2001 20162000
2,762
1999
1,640 3,122
199719961995
1
1998
Mission statement:
‘Earth’s biggest book store’
Vision statement:
‘Our vision is to be earth's most customer centric company […]’
Platform Economics

Source: Consumer Intelligence Research Partners, Statista Digital Market OutlookNote: 249 million e-Commerce users in the U.S. in 2016 (Statista estimates)
About 32% of U.S. e-Commerce customers subscribe to Amazon PrimeAmazon Prime subscribers in the United States (in million users)
63
54
44
40
2825
80
December 2015June 2015December 2014June 2014 Mar 2017June 2016December 2013
46
Platform Economics
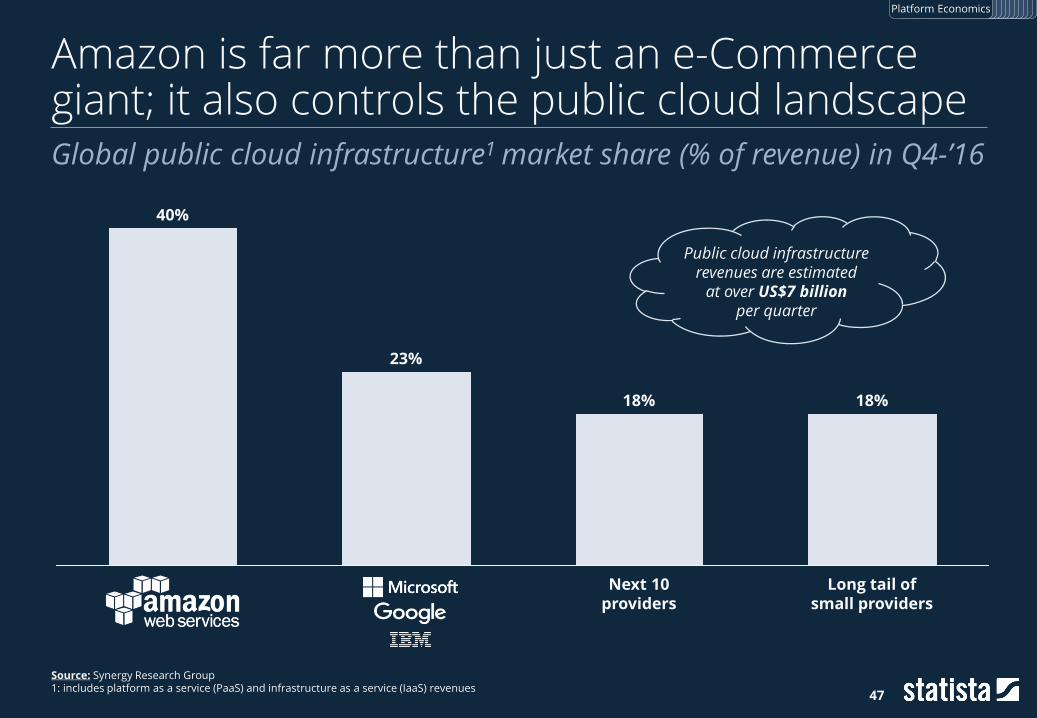
Amazon is far more than just an e-Commerce giant; it also controls the public cloud landscape
Source: Synergy Research Group1: includes platform as a service (PaaS) and infrastructure as a service (IaaS) revenues
Global public cloud infrastructure1 market share (% of revenue) in Q4-’16
23%
40%
Next 10providers
18% 18%
Long tail of small providers
Public cloud infrastructure revenues are estimated
at over US$7 billion per quarter
47
Platform Economics

48
300,000,000 gigabytes
Facebook stores more than 300 million gigabytes of user data. This data corresponds to 126 digital books about each active user.

Facebook has 1,860m MAU1 with 85.2% of them located outside of North America
Source: Facebook Inc.Note: all figures as of Q4 ’161: MAU = monthly active user 49
Facebook key facts
5mInstagram business
profiles
84%mobile share of
advertising revenues
101available
languages
85.2%daily active users
outside North America
Feb 2009invention of the
‘Like’ button
300,000translators
1,860mmonthly active users
65mbusiness pages
4mbusinesses directly
advertising
Platform Economics

Facebook’s active user base has been consistently growing
Source: Facebook Inc.
50
Global number of Facebook’s monthly active users (in million users)
197
955901
845800
739680
608550
482431
360305
242
1,1891,228
1,2761,317 1,350
1,3931,441
1,4901,545
1,5911,654
1,712
1,788
1,860
1,1551,110
1,0561,007
2009 2010 2011 2012 2013 2014 2015 2016
Platform Economics

Imagine if Facebook’s worldwide average revenue per user equaled that of North AmericaFacebook‘s average revenue per user, by user geography in US$
5.91
19.40
2.35
7.29
Europe
13.58
62.23
1.844.66 5.32
15.98
Asia-PacificU.S. and Canada Rest of the World Worldwide
2012 2016
358% 228% 200%153%210%
51
Source: Facebook Inc.
Platform Economics

52
“There is no chance that the iPhone is going to get any significant market share.”
Steve Ballmer in 2007, Former CEO of Microsoft

With nearly 70% revenue share in Q1-’17, the iPhone is the biggest success in Apple’s history
Source: Company Information1: Fiscal quarters; Apple’s fiscal year ends in September
iPhone revenue as percentage of Apple’s total revenue since 20071
0
10%
20%
30%
40%
50%
60%
70%
80%
90%
100%
69.4% 69.4%
2007 2008 2009 2010 2011 2012 2013 2014 2015 2016
53
Platform Economics
2017

Apple is the biggest vendor in a shrinking tablet market
Source: IDC
54
Global tablet shipments in 2016 in millions
2016
174.8
24.4%
15.2%
6.9%6.4%5.5%
41.6%
2015
207.2
2014
230.1
2013
219.9
2012
143.4
2011
71.4
2010
17.9
Apple
Samsung
Amazon
Lenovo
Huawei
Others
Platform Economics

The number of active Apps in Apple’s App Store is predicted to reach over 5 million by 2020
Source: SensorTower
55
Projected number of active apps in Apple’s App Store worldwide by 2020
0
1
2
3
4
5
6
2020201920182017201620152014201320122011201020092008
Forecast
million
Platform Economics

Stock market prices reflect the tech-giants’ development
Source: Yahoo! FinanceBaseline for stock prices are GE, T, WMT, XOM, GOOGL, AMZN, AAPL, FB 1: Figures as per 03-10-2017; all stock prices are closing prices; dividends are not considered 56
U.S. tech-giants vs. Top U.S. non-tech giants stock market development
0
50
100
150
200
250
300
350
400
450
500
550
600
650
700
750
800
850
900
01/1801/1701/1601/1501/1401/1301/12
Stock price in USD
+43.0%
-0.9%
+61.4%
+14.8%
0
50
100
150
200
250
300
350
400
450
500
550
600
650
700
750
800
850
900
01/12 01/13 01/14 01/15 01/16 01/17 01/18
Stock price in USD
+342%
+188%
+136%
+339%
Combined market cap1:US$1,070 billion
Combined market cap1:US$2,119 billion
Platform Economics

Only investing $1,000 in bitcoins would have been more profitable than in digital platforms
Source: Yahoo! Finance; Coindesk.comBaseline for stock prices are GE, T, WMT, XOM, GOOGL, AMZN, AAPL, FB (NASDAQ)Note: Dividends are not considered 57
Pay-off in Mar 2017 for a US$1,000 investment in Jan 2012
991
778
207,071
4,419
4,387
2,364
1,614
1,429
2,882
1,148
Gold
2,805NASDAQ
Platform Economics
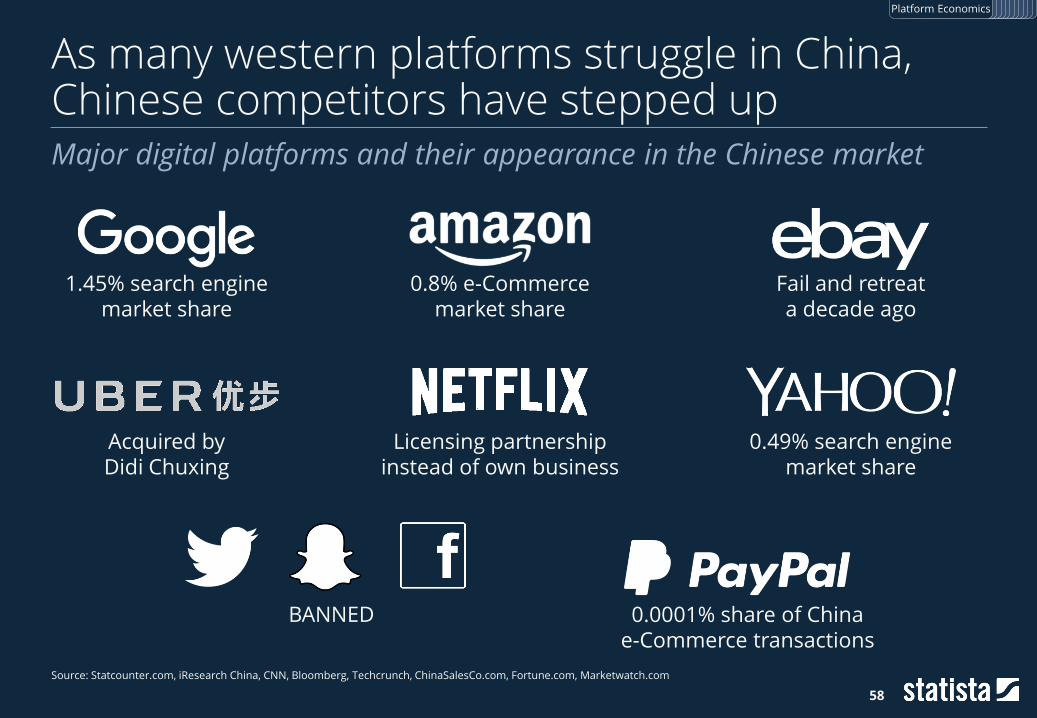
As many western platforms struggle in China, Chinese competitors have stepped up
Source: Statcounter.com, iResearch China, CNN, Bloomberg, Techcrunch, ChinaSalesCo.com, Fortune.com, Marketwatch.com
58
Major digital platforms and their appearance in the Chinese market
1.45% search engine market share
0.8% e-Commerce market share
BANNED
Fail and retreat a decade ago
0.0001% share of China e-Commerce transactions
Acquired by Didi Chuxing
Licensing partnership instead of own business
0.49% search engine market share
Platform Economics

BaiduAlibabaTencentHuawei

The untapped potential of 676m awakening digital customers makes China unique
Source: Statista Digital Market Outlook
60
Online vs. Offline population in China and the U.S. in 2016
Online population
Offline population(growth potential)
10,000,000 people
Platform Economics
264 million
59 million
676 million
702 million

Baidu, Alibaba, Tencent, and Huawei (BATHu) are China’s overlooked tech-giants
Source: Company Information; Yahoo! FinanceNote: Alibaba Group FY2016 ended on 03-31-2016; revenues converted from RMB to US$ as per annual reports respectively press releases1: Unaudited as per FY2016 released financial results 61
BATHu key figures
Founded: 1987HQ: ShenzhenCEO: Ren Zhengfei (since 1988)Revenues: US$75.10 billionNet income: US$5.34 millionEmployees: 180,000Market cap: not listed
Founded: 04-1999HQ: HangzhouCEO: Daniel Zhang (since 05-2015) Revenues: US$15.69 billion Net income: US$11.06 billionEmployees: 36,446Market Cap: US$258.47 billion
Founded: 01-2000HQ: PekingCEO: Robin Lu (since 01-2004)Revenues1: US$10.20 billionNet income1: US$1.68 billionEmployees: 45,887Market cap: US$60.04 billion
Founded: 11-1998 HQ: ShenzhenCEO: Ma Huateng (since 11-1998)Revenues1: US$21.97 billionNet income1: US$5.99 billionEmployees: 38,775Market cap: US$257.57 billion
Platform Economics
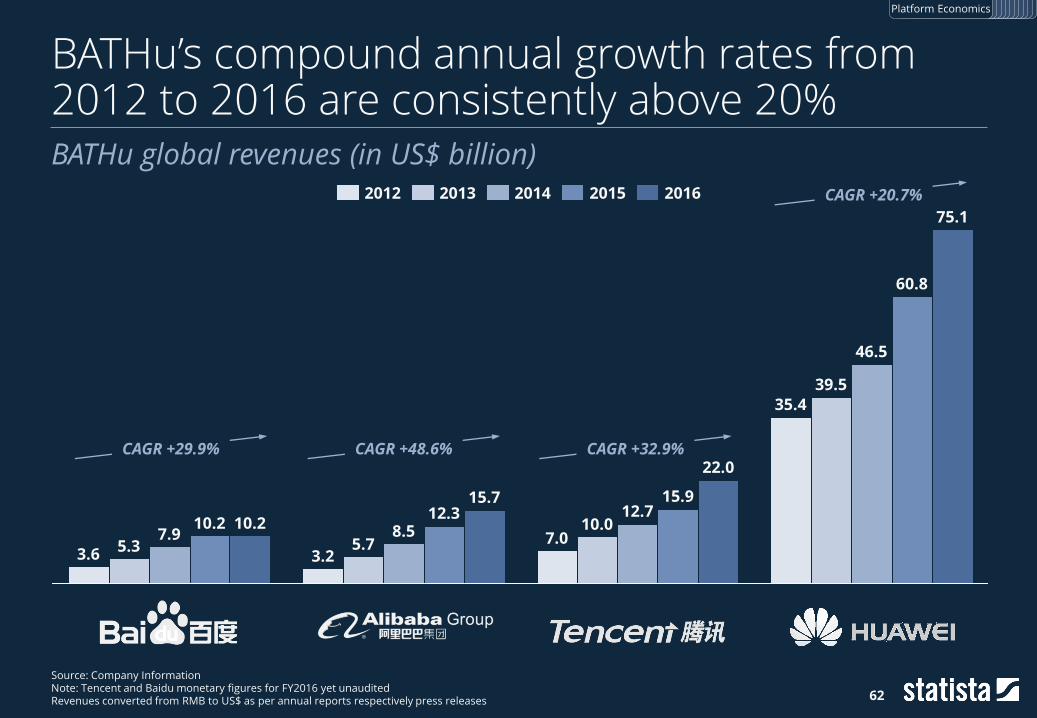
BATHu’s compound annual growth rates from 2012 to 2016 are consistently above 20%
Source: Company InformationNote: Tencent and Baidu monetary figures for FY2016 yet unauditedRevenues converted from RMB to US$ as per annual reports respectively press releases 62
BATHu global revenues (in US$ billion)
HuaweiAlibaba TencentBaidu
CAGR +20.7%
Huawei
75.1
60.8
46.5
39.535.4
Tencent
22.0
15.912.7
10.07.0
Alibaba
15.712.3
8.55.7
3.2
Baidu
10.210.27.9
5.33.6
20162015201420132012
CAGR +29.9% CAGR +48.6% CAGR +32.9%
Platform Economics

Alibaba’s FY16 net income was almost fifteen times higher than 5 years ago
Source: Company InformationNote: The size of circles corresponds to net income; Tencent and Baidu monetary figures for FY2016 not yet unauditedNet income converted from RMB to US$ as per annual reports respective press releases 63
BATHu global net income in US$ billion
201620152012 201420132011
1.97
11.06
4.503.47
5.992.05
3.77 3.92
2.47
1.71
0.75
2.57
1.685.011.67
1.43
3.85
5.69
4.49
5.34
Platform Economics

Accompanied by their financial prosperity, Chinese platforms invest in U.S. startups
Source: Crunchbase
64
VC-investments of Baidu, Alibaba and Tencent in the U.S.
2014 2015 2016
IndoorAtlas Cloudflare
IndoorAtlas
Taboola
GWC
Dynamic Yield
Velodyne LiDAR
ZestFinance
Peel
Kabam
Lyft
Tango
1stdibs
Lyft
Mei.com
Snap Inc.
Quixey
Barefoot Networks
Magic Leap
PlaceIQ
Playdots
Kamcord
Heirloom Technology
Tile
Heirloom, Inc.
Woqu.com
AltspaceVR
Moon Express, Inc.
Vurb
Women.com
Scaled Inference
TapZen
Whisper
Weebly
Circle Medical
Watsi
Artillery
FlightCar
Clinicloud
Nav
Nixie Labs
HomeHero
Tute Genomics
Tissue Analytics
Lyft
Pocket Gems
CloudMedx Inc
Scanadu
Skymind
VC Mobile Entertainment Inc.
Cyanogen
Satellogic
Robot Entertainment
Discord
SketchMe
Stae
Clear Labs
BarefootsNetworks
Petuum
Skymind
Nav
Payoff
Meta
Tile
Paradox Interactive
Planetary Resources
Kamcord
Diffbot
Discord
Platform Economics

Source: CNBC
Baidu was the first Chinese company to be listed in the NASDAQ 100 index.
1st

Although primarily operating in China, Baidu dips its toes into new markets
Source: Chinainternetwatch.com, StatCounter.com, Alexa.com 1: The rank is calculated using a combination of avg. daily visitors and pageviews over the past three months
66
Baidu key facts
Popularity
Chinese Rank1: 1Global Rank1: 4
Stock Market
1st Chinese company listed in NASDAQ 100
Performance
2nd largest search engine in the world
Request Origin
1) China: 91.5%2) Japan: 3.2%3) South Korea: 1.5%
Subsidiaries
Tokyo, Sunnyvale (CA), Jakarta, Bangkok, Cairo, Sao Paulo
Top Tech Keywords
1) VR2) Gravitational wave3) AlphaGo
Platform Economics

In China, Baidu has strong brand awareness, with a large domestic market share of over 75%
Source: StatCounter.com
67
Search engine market share in China (in percentage)
0
10
20
30
40
50
60
70
80
90
100
Dec ’13
69.8%
79.1%
Dec ’15
74.8%
54.4%
Dec ’14
Apr ’17
75.1%
Dec ’16
Dec ’12
70.3%
3.7%
7.8%
10.2%
1.4%
1.8% Others
Market share in %
Platform Economics

AI will further improve search engines; Baidu’s face recognition software is a good example
Source: Massachusetts Institute of TechnologyNote: Figures as of 2015, based on the Labeled Faces in the Wild (LFW) dataset
68
Face recognition software comparison as %-error in face recognition
Platform Economics
Human-Level: 0.80%
Baidu 0.23%
Google 0.37%
University of Hong Kong
0.53%
Facebook 1.65%
Microsoft 3.67%

Source: Alibaba Group
175,000
Chinese e-Commerce giant Alibaba processed 175,000 transactions per second on the peak time of “Singles’ Day” in 2016. At the end of the day the number of orders processed totaled 657 million.

The Alibaba Group has evolved to become a platform with multiple user touchpoints
Source: Alibaba Group
70
Alibaba Group Overview
E-Commerce
OthersDigital Media
Platform Economics
Core Business

Singles' Day is the largest shopping day in the world, and Alibaba benefits most of it
Sources: Fundivo, Adobe, Alibaba Group, Tech in Asia, Thomson Reuters, MarketWatch
71
U.S. Cyber Monday spending and Alibaba Single’s Day GMV (in US$bn)
2012
9.30
2011
14.30
2010
3.45
0.14
20152013 2016
17.79
3.04
5.80
2014
0.821.30
1.98
2.982.652.29
1.30
Cyber Monday Single’s Day
Platform Economics
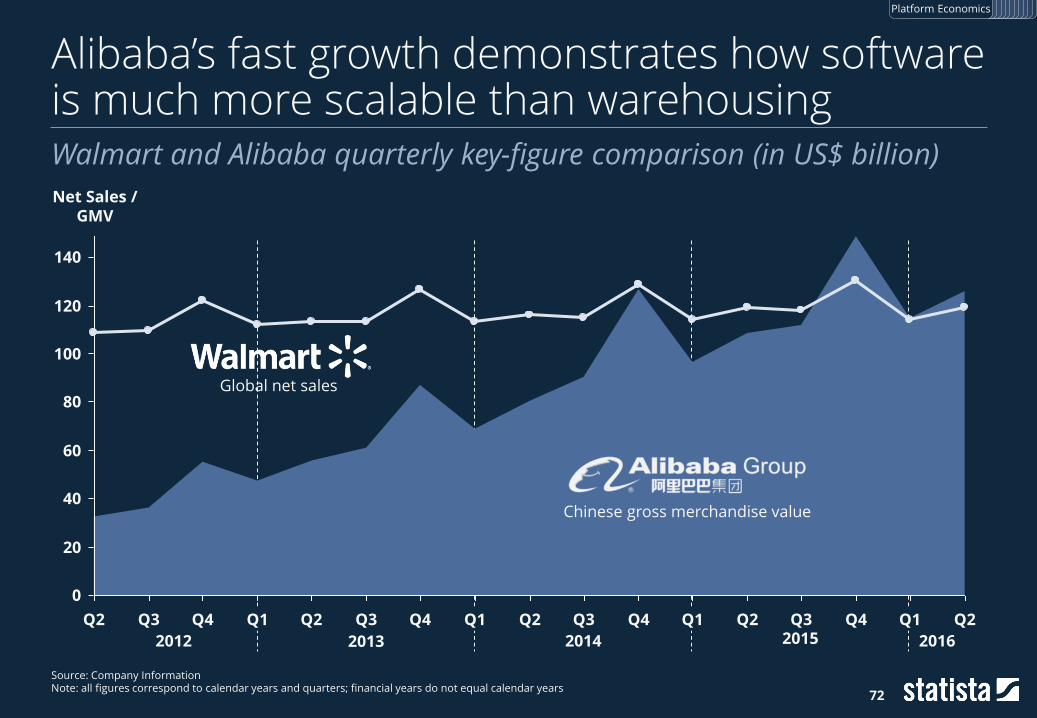
Alibaba’s fast growth demonstrates how software is much more scalable than warehousing
Source: Company InformationNote: all figures correspond to calendar years and quarters; financial years do not equal calendar years
72
Walmart and Alibaba quarterly key-figure comparison (in US$ billion)
20
140
100
0
40
120
60
80
Q4Q3 Q2Q2Q2 Q3Q4 Q3 Q1Q1 Q4 Q1 Q2Q1 Q3Q2 Q4
2012 2013 2014 2015 2016
Net Sales / GMV
Global net sales
Chinese gross merchandise value
Platform Economics

“Will Tencent join the likes of Amazon, Google, Facebook and Twitter? […] They already are in that league. The rest of the world just doesn’t know it.”
Aditya Rathnam, Co-Founder of Kamcord

China‘s largest tech company can be compared with its U.S. Social Media counterpartKey financial and operating metrics of Tencent and Facebook in 2016
Revenue
5.99
10.22
21.97
Net Profit
27.64
TencentFacebook
Source: Company Information, We Are Social, Hootsuite
Key Financials (in US$ billion)
Monthly Active Users (in million)
632
846
877
700
1,871
Qzone
1,200
74
Platform Economics

WeChat has a diverse business model with multiple revenue sources
Source: Company Information, OLMA Capital Management
75
Direct comparison of WeChat and WhatsApp
WeChat WhatsApp
Geographical focus China US Europe
Monthly active users 938 million 1,200 million
Price Free of Charge Free of Charge
Monetization Transaction Fees & Mobile Advertising
› Social & Communication
› Leisure & Commerce
› Media & Gaming
VideoPhoto-graphy
Voice Message
Location
Texting
Voice Chat
Photography Video
Moment Feeds
Group Chats
Video Chat
Group Chats
Video Chat
Translation
e-Commerce
Event Organization
Mobile Banking
Location
Official Accounts
Voice Message
Meet Strangers (Shake)
Taxi Reservation
Online Ticketing
Mobile Gaming Desktop Gaming
Texting
QR CodeReader
Newsfeeds
Price Checks
Music
Platform Economics

76
5G
Huawei aims at playing a central role in 5G mobile technology, the next big evolutionary step in mobile connectivity. Along with large R&D expenditures, Huawei also initiated a number
of collaborative research initiatives – widely known as Wireless X labs.

Huawei overtook Apple and became one of the most R&D-intensive tech companies
Source: Company InformationNote: Dell figures refer to FY2017 as this year ended on 01-31-2017
77
R&D spending of major global tech-companies in 2016 (in US$ billion)
Samsung
Intel
13.95
Microsoft
12.84
Amazon
Apple
12.70
Huawei
Oracle
IBM
Sony
Dell
12.59
12.00
11.00
10.05
5.92
5.79
5.75
4.32
2.64
Platform Economics

1,287%
909%
2009
1,027%
747%
2008
848%
653%
2007
580%
429%
2006
2,977%
336%
2005
281%242%
2004
180%144%
2003
127%108%
2002
100%100%
2,717%
2016
1,661%
4,029%
2011
1,522%
2012
2,859%
2013
2,186%
400%
3,192%
3,732%
2014 2015
3,529%
1,854%
1,885%
2010
Huawei and Apple show similar revenue growth
Source: Company Information, Statista Digital Market OutlookRevenues converted from RMB to US$ as per annual reports respectively press releases; years 2007-2011 are calculated with the avg. exchange rate of the specific year with exchange rates from www.oanda.com 78
Annual revenue comparison of Huawei and Apple from ’02-’16
2002 2003 2004 2005 2006 2007 2008 2009 2010 2011 2012 2013 2014 2015 2016
5.7 6.2 8.3 13.9 19.3 24.6 37.5 42.9 52.2 108.2 156.0 170.9 183.2 231.3 214.2
2.1 2.7 3.8 6.0 8.5 12.3 18.0 21.9 27.4 32.4 35.4 39.5 46.5 60.8 75.1
Annual revenue (in US$ billion)
Indexed revenue development (year 2002 = 100%)
Platform Economics

Baidu, Alibaba, Tencent and Huawei vs. Google, Amazon, Facebook and Apple –Who is taking the lead?
79

BATHu may catch up in the digital economy, but the big U.S. players remain the top innovators
Source: Company Information; YCharts.comNote: Revenues and R&D expenditures converted from RMB to US$ from annual reports respectively press releases
80
Research & Development expenditures (in percent of total revenues)
15%15%14%
13%14%
8%9%
10%8%
10%
2%2%2%2%2%
14%14%
14%13%
3%3%3%2%
21%21%
21%
27%
9%9%10%
9%10%
16%17%
15%14%
5%
10%
20152014 201620132012
12%
18%
Total Research & Development expenditures: US$141.4bn Total Research & Development expenditures: US$48.6bn
Platform Economics

Comparatively, U.S. tech-giants remain ahead of their Chinese competitors
Source: Company Information, IDC, WeAreSocial, comScoreNote: Monetary figures converted from RMB to US$ sourced from annual reports respectively press releases1: CAGR = Compound annual growth rate 2: Statista estimates3: MAU = Monthly active users; only take into account the biggest single Social Media Platforms Facebook and QQ
81
Key-figure comparison: GAFA vs. BATHu
Revenues US$bn 89.73 10.20
CAGR1 ’12-’16 % 15.77 29.92
Profit margin % 21.71 16.44
R&D expend. US$bn 13.95 1.47
Domestic market share
% 64.0 75.1
Revenues US$bn 135.99 15.69
CAGR1 ’12-’16 % 22.15 48.63
Profit margin % 1.74 70.5
R&D expend. US$bn 12.59 0.34
GMV US$bn 251.02 484.6
Revenues US$bn 27.64 21.97
CAGR1 ’12-’16 % 52.66 32.88
Profit margin % 36.97 27.3
R&D expend. US$bn 5.92 1.71
MAU3 m 1,871 877
Revenues US$bn 214.23 75.10
CAGR1 ’12-’16 % 8.26 20.73
Profit margin % 21.33 7.1
R&D expend. US$bn 10.05 11.00
Smartphone shipments
m 215.4 139.3
vs. vs.
vs. vs.
Platform Economics
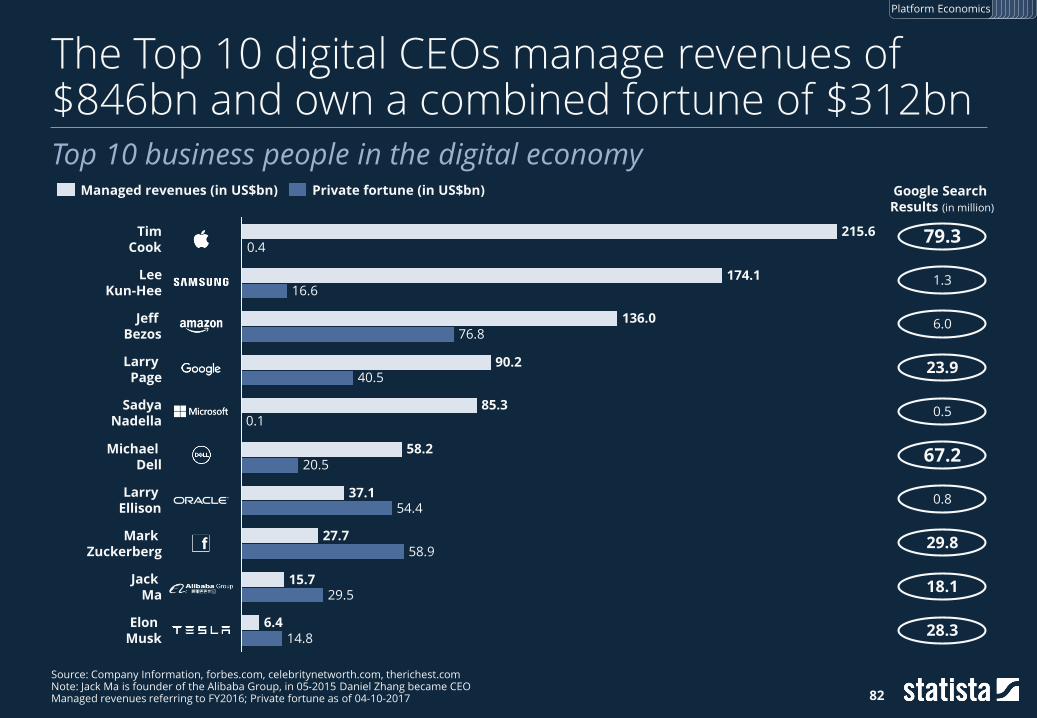
The Top 10 digital CEOs manage revenues of $846bn and own a combined fortune of $312bn
Source: Company Information, forbes.com, celebritynetworth.com, therichest.comNote: Jack Ma is founder of the Alibaba Group, in 05-2015 Daniel Zhang became CEOManaged revenues referring to FY2016; Private fortune as of 04-10-2017 82
Top 10 business people in the digital economy
Elon Musk 14.8
6.4
Jack Ma 29.5
15.7
Mark Zuckerberg 58.9
27.7
Larry Ellison 54.4
37.1
Michael Dell 20.5
58.2
Sadya Nadella 0.1
85.3
Larry Page 40.5
90.2
Jeff Bezos 76.8
136.0
Lee Kun-Hee 16.6
174.1
Tim Cook 0.4
215.6
Google Search Results (in million)
Private fortune (in US$bn)Managed revenues (in US$bn)
79.3
28.3
18.1
67.2
29.8
0.8
0.5
23.9
6.0
1.3
Platform Economics

Venture Capital

7,300,000,000US$
In 2016 Didi Chuxing, the Chinese ride sharing company and major competitor of Uber, collected fresh capital funding totaling US$7.3 billion in order to strengthen
its position in the Southeast Asian market
Source: PitchBook

More deals and greater capital invested, bar 2016, complement growing average deal size
Source: KPMG Enterprise, PitchBook
85
Global venture financing from 2010-2016 (in US$ billion)
21
39 39
910 10 11
15
1816
32
4643
47
72
82
72
68
2016
127
0
2015
141
2
2014
108
0
2013
65
1
2012
59
15
2011
64
0
2010
45
0 4
ROW
Asia
Europe
Americas
8,459
10,842
18,157 17,992
13,66513,006
15,800
Capital invested Deal count
Venture Capital

“Software is eating the world” – at least in the case of VC financing
Source: KPMG Enterprise, PitchBook
86
Software sector share in venture financing in a regional comparisonAmericas
Europe
Asia Pacific
18%21%
54%
22%
47%
2012
25%
13%
2010 2013
17%21%
42%
33%
39%
22%
2014
32%
40%36%
31%
2011
33%
2015 2016
33% 31%
24%
Venture Capital

10101010
3
8
5
2
Q1/2016 Q2/2016 Q4/2016Q3/2016
New Unicorns Exits > US$1 billion
The stereotype Unicorn1 in 2016: digital and most likely to be Chinese or American
Source: CB Insights1: Unicorn = Startup company with a company valuation of more than US$ 1.0 billion2: Company valuation as per 03-15-2017 87
New VC-backed Tech Unicorns and Exits in 2016
Skyscanner
became Unicornand exited in 2016
40 out of 41
new Unicorns were highly Tech-related
31 out of 40
Tech Unicorns were Chinese or American
US$66.4 billion
valuation2 of the 2016 Tech Unicorns
US$34.4 billion
value of the 18 Tech Unicorn Exits
Venture Capital

U.S. and Chinese players take the top spots in terms of global VC financing and funding
Source: PitchBook
88
Top 5 VC Financings and Funds in 2016 (in US$ billion)
Top 5 VC Financings Top 5 VC Funds
Snap Inc. 1.8
Meituan Dianping
3.3
Ant Financial
4.5
Uber 5.6
Didi Chuxing
7.3
Norwest Venture
Partners XII 1.2
Founders Fund VI
1.3
Andreessen Horowitz
1.5
TCV IX 2.5
Baidu Capital
Fund 3.0
Venture Capital
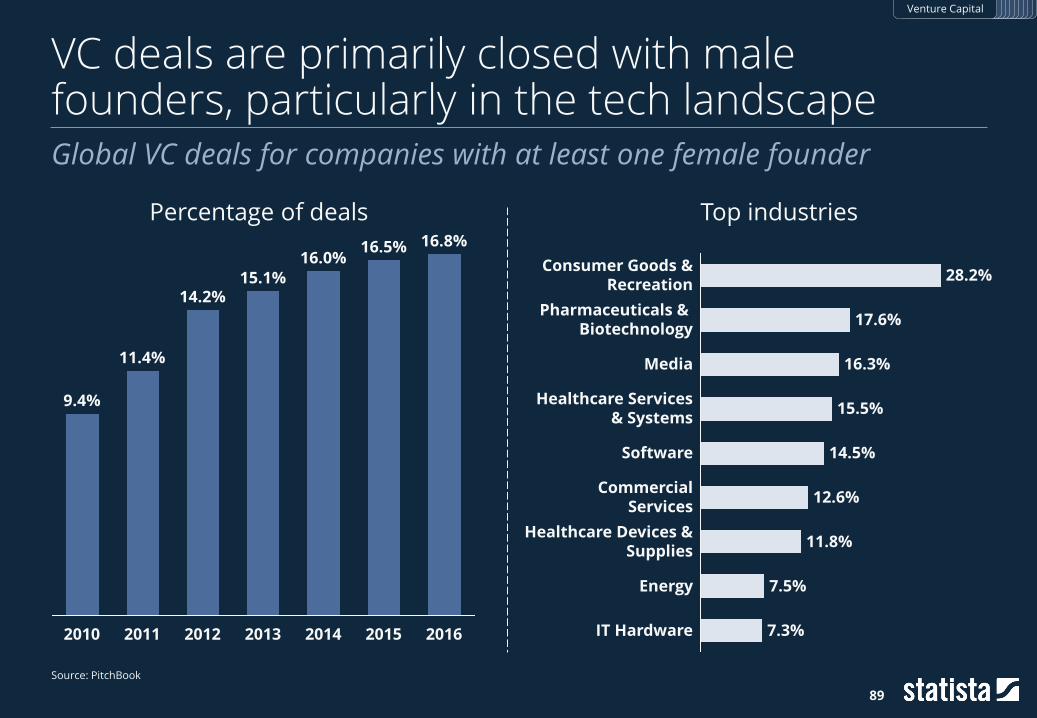
VC deals are primarily closed with male founders, particularly in the tech landscape
Source: PitchBook
89
Global VC deals for companies with at least one female founder
9.4%
20162014 20152010
11.4%
14.2%
2011 20132012
15.1%16.0%
16.5% 16.8%
Energy
CommercialServices
Consumer Goods &Recreation
Pharmaceuticals & Biotechnology
Media
Healthcare Devices &Supplies
Software
28.2%
14.5%
7.5%
17.6%
Healthcare Services& Systems
15.5%
11.8%
16.3%
IT Hardware
12.6%
7.3%
Percentage of deals Top industries
Venture Capital

The U.S. and China are home to the greatest number of Unicorns, with Europe lagging behind
Source: CB InsightsUnicorn = Startup company with a company valuation of more than US$ 1.0 billion1: countries with one ‘unicorn’: Argentina, Colombia, Czech Republic, Indonesia, Japan, Luxembourg, Netherlands, Nigeria, South Africa, United Arab Emirates 90
Private companies valued at one US$ billion or more as of 03-27-2017
1
2
2
2
2
2
3
4
7
9
45
99
Germany
South Korea
France
Israel
Singapore
Sweden
Switzerland
10 other countries
China
United States
United Kingdom
India
1
Venture Capital

AI, AR & VR

Source: MIT
Baidu has developed a facial recognition software that recognizes human faces with a 99.77% accuracy. This surpasses average human-level facial recognition and many Silicon Valley competitors.
99.77%

There is a lot of activity in the Artificial Intelligence and Data Mining startup scene
Source: CB Insights
93
VC-backed companies with certain words in their company description
2010 2011 2012 2013 2014 2015 2016
0.00%0.07%
0.00%
2.18%
0.25%
0.42%0.32%
0.61%
0.11%
1.96%
0.13%
0.31%
0.12%
0.74%
1.49%
0.33%
1.53%1.55%
0.94%
0.61%
0.34%
Deep LearningArtificial Intelligence Machine Learning
AI, AR & VR

VC-backed companies with the terms Machine Learning, VR & AI drastically increased since ‘10
Source: CB Insights
94
Change of VC-backed companies with given terms in their descriptionRank Word % in 2010 % in 2016 Change Rank Word % in 2010 % in 2016 Change
1 Virtual Reality 0.0% 1.0% - 21 Human 1.7% 3.5% 106%
2 Machine Learning 0.3% 2.0% 507% 22 Connected 1.0% 2.0% 102%
3 Natural Language 0.2% 1.0% 507% 23 Genetic 0.8% 1.5% 102%
4 Ingredients 0.3% 1.2% 385% 24 Videos 0.6% 1.1% 91%
5 Cyber 0.3% 1.5% 355% 25 Risk 2.4% 4.2% 78%
6 Artificial Intelligence 0.4% 1.8% 337% 26 Intelligent 1.7% 3.0% 76%
7 Reality 0.3% 1.4% 325% 27 Algorithms 0.8% 1.3% 75%
8 Automates 0.3% 1.0% 304% 28 Treatments 0.8% 1.3% 75%
9 Sensors 0.3% 1.3% 294% 29 Audio 0.6% 1.0% 73%
10 Feedback 0.4% 1.3% 215% 30 Culture 0.6% 1.0% 73%
11 Seconds 0.3% 1.0% 203% 31 Women 0.6% 1.0% 73%
12 Minutes 0.4% 1.2% 191% 32 Body 0.8% 1.4% 70%
13 Oncology 0.4% 1.2% 191% 33 Healthy 0.8% 1.4% 70%
14 Therapy 0.7% 1.9% 188% 34 Language 0.8% 1.4% 70%
15 Modern 0.5% 1.4% 183% 35 Stream 2.4% 4.1% 67%
16 Tumor 0.4% 1.1% 167% 36 Threat 0.4% 1.5% 65%
17 Stealth 1.3% 3.3% 143% 37 Hand 2.1% 3.5% 65%
18 Workflow 0.7% 1.6% 143% 38 Labs 1.7% 2.8% 64%
19 Insurance 0.8% 1.9% 130% 39 Bank 0.8% 1.3% 58%
20 Software Platform 0.5% 1.1% 122% 40 Measure 1.4% 2.2% 57%
AI, AR & VR

155
260
7760
3391
8365
121106
Startups in the machine learning / AI segment have benefited from the largest VC fundingFunding and number1 of startups working in the AI market, by category
120190220240
330390
490520660
Recommen-dation
engines
Speech recognition
Gesture control
Virtual personal
assistants
Computer vision
(applications)
Smartrobots
Machine learning (general)
Computer vision
(general)
Natural language
processing
Machine learning
(applications)
2,070
Number of companies
Total funding (in million US$)
95
Sources: Statista estimates, Medium1: as of March 2016
AI, AR & VR

AI will also enable human voices to become a new powerful communication layerNumber of third-party skills available for Amazon‘s virtual assistant
135
Q1 ’16 Q3 ’16
5,000
10,000
1,000
3,000
Q2 ’26 Q4 ’16 Q1 ’17
96
Sources: Amazon, Press reports
AI, AR & VR

Augmented & Virtual Reality may be the next big tech opportunityEstimated global virtual & augmented reality headset development
2021
72.0
27.3
2016
10.0
0.1
Augmented Reality Virtual Reality
Source: IDC
Unit Shipments (in million)
Revenue (in US$ billion)
97
2.1
48.7
0.2
18.6
2016 2021
AI, AR & VR

Global VR revenues are expected to increase to almost US$40 billion by 2020Forecasted VR hard- and software revenues by platform in US$ billion
2020
1.2
1.6
40.4
2019
2.6
0.8
22.7
2018
2.0
1.8
12.1
2017
4.5
4.6
6.4
2016
8.6
3.0
3.6
8.3
5.8
16.3
15.6
8.5
PC
Console
Mobile
Source: Superdata via VRFocus
98
AI, AR & VR

Table of Contents
99
› Connectivity: Numbers behind the “always on” trend…………………………..
› Social Media: Love it, hate it, but accept that you need it…………………...
› Platform Economics: A story about White Sharks and Swordfish………
› Venture Capital: Feed for new Tech-Unicorns…………………………………......
› AI, AR and VR: The next big Technology Hype……………………………………….
Statista’s Digital Market Outlook
Global Trends
› e-Commerce……………………...
› eServices…………………………….
› eTravel ……………………………….
› Digital Media……………………...
› FinTech………………………………….
› Digital Advertising……………....
› Smart Home……………………......
› Connected Car……………………..
91
83
30
20
5
181
171
160
148
138
129
117
106

The Digital Market Outlook (DMO) provides KPIs and insights for eight digital markets
100
Statista Digital Market Outlook coverage
FinTechDigital Payments, Business Finance, Personal Finance
Smart HomeHome Automation, Security, Home Entertain-ment, Ambient Assisted Living, Energy Mgmt.
eTravelOnline Travel Booking, Mobility Services
e-CommerceFashion, Electronics & Media, Food & Personal Care, Furniture & Appliances, Toys, Hobby & DIY
eServicesEvent Tickets, Fitness, Dating Services, Food Delivery
Digital AdvertisingBanner Ads, Video Ads, Search Ads, Social Media Ads, Classifieds
Connected CarConnected Hardware, Vehicle Services, Infotainment Services
Digital MediaVideo-on-Demand, Digital Music, Video Games, ePublishing
DMO

The DMO markets and forecasts cover a broad range of products and services
1: B2B and C2C markets are excluded2: Resale of used goods is not included
101
DMO scoping
B2C1 markets and revenues for… new2 products and services…
covering 7 years, from ’15 to ’21.in over 50 regions and countries...
DMO

Forecasts based on market-specific knowledge, enriched with macroeconomic developments
Source: Statista Digital Market Outlook1: only includes countries of the Digital Market Outlook
102
Macroeconomic overview 2016
United States Europe1 China
GDP / Capita: US$57,220 US$27,599 US$8,240
Population: 323.3 million 671.2 million 1,382.2 million
Households: 126.6 million 269.3 million 399.6 million
Internet penetration:
Mobile penetration:
Social Media penetration:
81.9% 85.8%
69.6%80.6%
20212016
60.5% 64.6%
72.2% 76.6%
60.2% 70.6%
20212016
48.5% 53.6%
50.9%67.9%
44.9%58.6%
20212016
37.3%48.5%
DMO

In 2018, China will overtake the U.S. and will become the biggest digital economy
Source: Statista Digital Market Outlook1: including all revenues generated within the e-Commerce, eTravel, eServices, Digital Media and Connected Car market2: including France, Germany, Italy, Spain and the United Kingdom 103
Digital market1 development of the three major regions (in US$bn)
874824
763
698
633575
901
765
626
500549
515476
434390
351
1,135
202120192016 2020
1,028
20182017
U.S. China EU 5 2
DMO

In 2016, digital expenditure in % of household consumption per capita are the biggest in China
Source: Statista Digital Market Outlook1: including all revenues generated within the e-Commerce, eTravel, eServices, Digital Media and Connected Car market2: including France, Germany, Italy, Spain and the United Kingdom 104
Digital expenditure1 as share of household consumption per capita in ‘16
U.S.
10.6%
4.5%5.0%
Euro EU 5China
EU 52
DMO

18
101
78
584
997
110
24
54
2731341
63
355
623
E-Commerce is by far the biggest digital market people spend their money on
Source: Statista Digital Market Outlook1: including France, Germany, Italy, Spain and the United Kingdom
105
Digital expenditure per capita in the major regions per category in ‘16Connected CarDigital MediaeServiceseTravele-Commerce
EU 51
US$1,777 US$362 US$1,096
DMO

E-Commerce

12,000,000
Chinese online retailer Tmall ships an incredible 12 million boxes per day

108
Global1 e-commerce revenue (in US$bn) and CAGR2 16-21 by segment
Global e-Commerce revenue is expected to almost double to US$2,108bn by 2021
Toys, Hobby & DIY
440.72
252.75
Furniture & Appliances
342.88
199.04
Food & Personal Care
218.35
104.67
Electronics & Media
472.62
290.61
Fashion
633.53
332.13
2016 2021
+13.8% p.a. +10.2% p.a. +15.8% p.a. +11.5% p.a. +11.8% p.a.
Source: Statista Digital Market Outlook1: only includes countries of the Digital Market Outlook2: CAGR: Compound Annual Growth Rate
E-Commerce

Source: Statista Digital Market Outlook1: CAGR: Compound Annual Growth Rate
109
The top e-Commerce markets exhibit growth and maintain their position in global rankingTotal e-Commerce revenue by region (in US$ billion)
Germany 56.25
81.01
Japan 74.40
111.80
United Kingdom 84.09
124.51
United States 322.17
485.27
China 376.18
839.54
2016 2021
E-Commerce
CAGR1 ’16-’21
+17.4% p.a.
+8.5% p.a.
+8.2% p.a.
+8.5% p.a.
+7.6% p.a.

There are many product-specific big players in addition to large all-encompassing platforms
Source: Statista Digital Market Outlook
110
Key players by segment and business model
FashionElectronics &
MediaFood &
Personal CareFurniture & Appliances
Toys, Hobby & DIY
Market Places
Online Retailer
Direct Seller
Key Player
E-Commerce

China will dominate the online fashion world with a turnover of more than US$285bn in 2021
Source: Statista Digital Market Outlook
111
Projected online turnover from fashion (in US$ billion)
228.0
140.5
96.4
221.2
285.3
90.3
236.9
260.5
203.1
83.9
184.5
76.8
130.8119.2
159.0
63.3
150.0
86.8
125.8
96.7
193.9
107.7
69.8
166.5
Europe
China
USA
2016 2017 2018 2019 2020 2021
E-Commerce

The Chinese B2C e-Commerce market outper-formed the U.S. both in size as well as in growth
Source: Statista Digital Market Outlook1: Prediction
112
B2C e-Commerce turnover from 2015 to 20171 in US$ billion
30.633.9
61.4
84.5
75.884.1
63.874.4
37.3
376.2
93.2
298.9
294.5322.2
470.1
353.7
51.656.2
16.1
12.114.2
20.0
12.916.1
16.919.121.4
16.918.320.2
2017
2015
2016
China
Russia
South Korea
Germany
India
U.S.
Canada
France
Japan
United Kingdom
E-Commerce

Transparency and simple processes are most important for online shopping delivery
Source: IPC online survey with 23,331 respondents (Sept. to Oct. 2016)
113
Most important aspects of online shopping delivery for customers
51%Possibility to select the delivery company
Possibility to select speed of delivery 64%
Possibility to place an order anytime, anywhere, on any device 64%
Variety of payment options 69%
Knowing which company will deliver goods 71%
Landed cost calculator at check-out 79%
Rapid response customer service 83%
Free returns 86%
Free delivery on purchases over a particular value 86%
Simple and reliable returns process 88%
Clear information about delivery charges before purchase 92%
E-Commerce

Amazon leverages loyalty from Prime members; thus, incentivizing them is an important strategyAmount spent by U.S. Amazon customers in the past 12 months
0%
3%
$20,000+$10,001 to $20.000
0%2%
$6,001 to $10,000
0%
3%
$4,001 to $6,000
1%
7%
$2,001 to $4,000
2%
10%
$1,001 to $2,000
5%
16%
$501 to $1,000
13%
24%
$100 to $500
46%
26%
Less than $100
34%
9%
Prime Members Non-Prime Members
Average spend per customer(past 12 months)
Non-Prime
$544
$2,486
114
Sources: Morgan Stanley Research, AlphaWise
E-Commerce
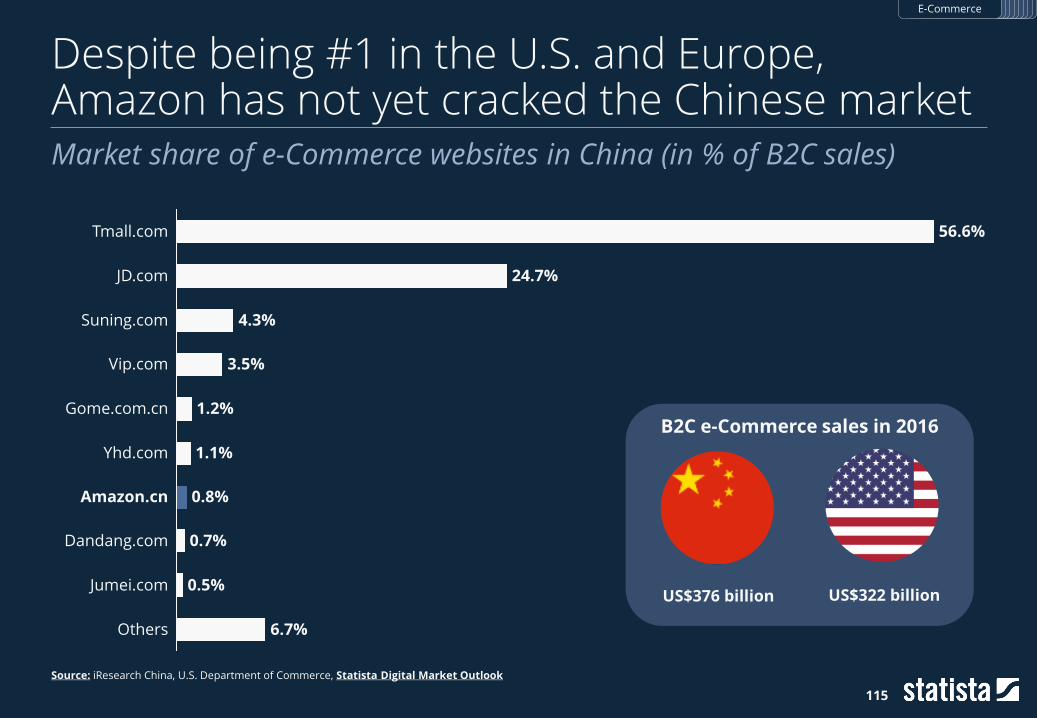
Despite being #1 in the U.S. and Europe, Amazon has not yet cracked the Chinese market
Source: iResearch China, U.S. Department of Commerce, Statista Digital Market Outlook
115
Market share of e-Commerce websites in China (in % of B2C sales)
Amazon.cn 0.8%
6.7%Others
Dandang.com 0.7%
Jumei.com 0.5%
Yhd.com 1.1%
Gome.com.cn 1.2%
Vip.com 3.5%
Suning.com 4.3%
JD.com 24.7%
Tmall.com 56.6%
B2C e-Commerce sales in 2016
US$376 billion US$322 billion
E-Commerce

Discover more
Online Shopping is not as profitable as you think
116
Discover more of our topic-related research for e-Commerce
Statista‘s point of view + exclusive country-specific forecasts about:
› Fashion
› Electronics & Media
› Food & Personal Care
› Furniture & Appliances
› Toys, Hobby & DIY
Get the study
Every topic in a nutshell – all relevant statistics in one single document:
E-Commerce

eServices

Source: Tinder
1,400,000,000
Online dating app Tinder registers a daily average of 1.4 billion swipes on its platform

119
Global1 eServices revenue (in US$ billion) and CAGR2 16-21 by segment
Food delivery is the most dynamic eServicesmarket, with revenues expected to triple by 2021
Food Delivery
210.32
72.86
Dating Services
5.874.60
Fitness
9.654.45
Event Tickets
50.81
25.06
2016 2021
+15.2% p.a. +16.7% p.a. +5.0% p.a.
+23.6% p.a.
Source: Statista Digital Market Outlook1: only includes countries of the Digital Market Outlook2: CAGR: Compound Annual Growth Rate
eServices

Source: Statista Digital Market Outlook1: CAGR: Compound Annual Growth Rate
120
An estimated eServices market value of US$86bn by 2021 will increase China’s lead over the U.S.Total eServices revenue by region (in US$ billion)
United States 61.18
25.28
China 85.99
33.10
Japan 10.02
3.81
Germany 11.29
5.01
United Kingdom 14.69
6.95
20212016
eServices
CAGR1 ’16-’21
+21.0% p.a.
+19.3% p.a.
+16.2% p.a.
+17.7% p.a.
+21.4% p.a.

Event Tickets Fitness Dating Services Food Delivery
Startups1
Established players
Market complexity2
New market entrants create competitive pressures in the eServices market
Source: Statista Digital Market Outlook1: Founded after or in 20072: Estimate; considers value chain complexity and competitor landscape
Selected key players by segment and market complexity
121
eServices

ElitePartner
Baihe
OurTime
In Dating Services, different offerings are targeted at various audiences and types of relationship
Source: Statista Digital Market OutlookCompany information
122
Dating portals/apps segmentation of selected players
Type of relationship
Au
die
nce
/ co
ve
rag
e
Casual Serious
Mass
Niche
AshleyMadison
Firstaffair
Zoosk
VictoriaMilan
C-Date
Badoo
OkCupid
ChristianMingle
JDate
BDSMSingles
WooPlus
Tinder
Whiplr
eDarling
Grindr
EuropeChinaUnited States
Headquarters:
Parship
Momo
Lovoo
Meetic
Chemistry
TanTan
Blued
NeuLoveScout24
Match
Plenty of Fish
eServices
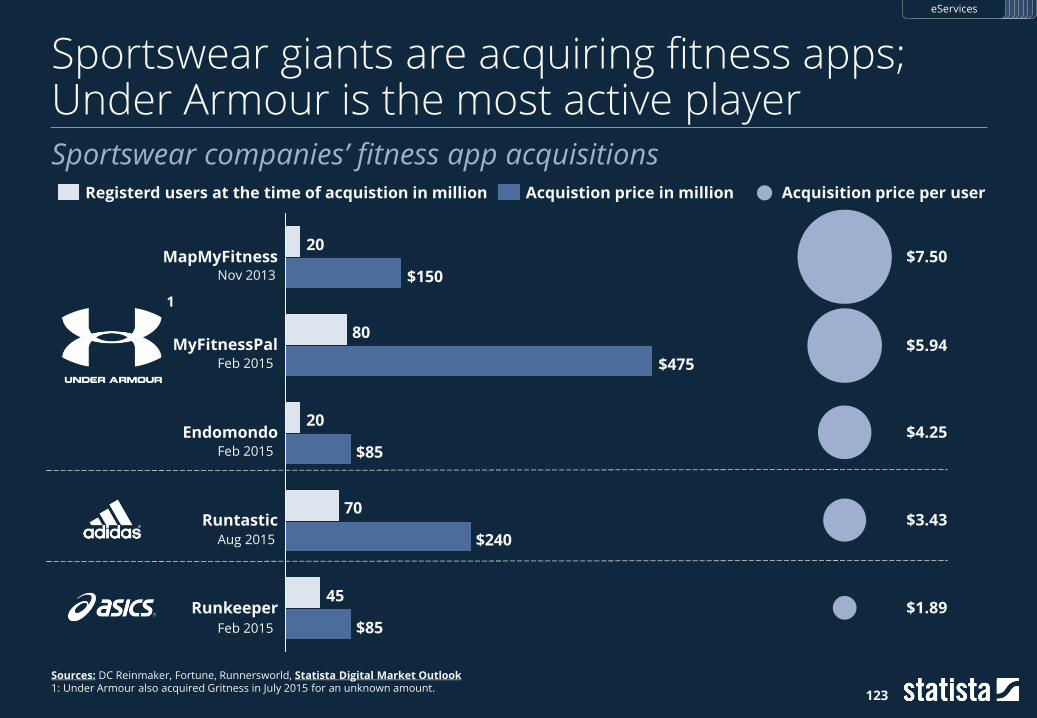
Sportswear giants are acquiring fitness apps; Under Armour is the most active player
Sources: DC Reinmaker, Fortune, Runnersworld, Statista Digital Market Outlook1: Under Armour also acquired Gritness in July 2015 for an unknown amount.
123
Sportswear companies’ fitness app acquisitions
45
70
20
80
20
$85
$240
$85
$475
$150
Endomondo
Runtastic
Runkeeper
MapMyFitness
MyFitnessPal
Registerd users at the time of acquistion in million Acquistion price in million Acquisition price per user
$7.50
$5.94
$4.25
$3.43
$1.89
1
Nov 2013
Feb 2015
Feb 2015
Aug 2015
Feb 2015
eServices

Fitbit leads the global wearables market; what can be expected from the Apple Watch?
Source: IDC
124
Worldwide wearable device shipments by the Top 5 vendors in million
4.4
3.2
6.15.8
10.711.6
15.7
12.0
22.522.0
20162015
81.9
Global wearable device shipments
2015 20162014
28.8
102.4
eServices

Tinder and Badoo are the top 2 dating apps in terms of global1 downloads
Sources: BBC News, App Aniie, Statista Digital Market Outlook1: only includes countries of the Digital Market Outlook
The most downloaded dating app by country 2015
Tinder
Badoo
Lovoo
Frim
Momo
Heartbeep
YYC
Paktor
WhosHere
eServices

Selling food online is a promising business –especially in the U.S.
Source: Statista Digital Market Outlook1: includes meals ordered online and delivered by restaurants, delivery services and online orders collected by the customer; does not include phone orders and grocery deliveries 126
Online food delivery1 revenue forecast (in US$ billion)
9.6
2.50.8
13.3
39.9
GermanyUSA UK SpainFrance
6.0
2.13.8 2.8
7.3
20212016
+24.6% p.a. +20.2% p.a. +20.8% p.a. +23.2% p.a. +24.8% p.a.
eServices

Despite not owning a single car, Uber’s market valuation is closing in on the big OEMs
Source: Yahoo! Finance, CB Insights, livemintNote: Market cap as of 04-20-2017
127
Market cap/valuation of selected companies in 2017 (in US$ billion)
3.0
Lyft Inc.
ANI Technologies Pte Ltd. (Ola)
3.0
Volkswagen AG 74.3
Toyota Motor Corp.
Daimler AG
68.0
75.3
GrabTaxi Holdings Pte Ltd.
Didi Chuxing
Tesla Motors Inc.
33.8
6.9
49.8
General Motors Co. 51.0
Uber Technologies Inc.
147.3
Ride sharing providersAutomobile manufactures
eServices

Discover more
Everyone is taking a stab at online food delivery
128
Discover more of our topic-related research for eServices
Statista‘s point of view + exclusive country-specific forecasts about:
› Event Tickets
› Fitness
› Dating Services
› Food Delivery
Get the study
Every topic in a nutshell – all relevant statistics in one single document:
eServices

eTravel

06-18-2016
The day online ride sharing company Uber reached a record breaking 2 billion users

131
Global1 e-commerce Revenue in US$ billion and CAGR2 16-21 by segment
The global eTravel market will almost double to around US$1 trillion by 2021
Mobility Services
288.11
Online Travel Booking
667.66
377.27
178.78
20212016
+12.09% p.a. +10.01% p.a.
Source: Statista Digital Market Outlook1: only includes countries of the Digital Market Outlook2: CAGR: Compound Annual Growth Rate
eTravel

Source: Statista Digital Market Outlook1: CAGR: Compound Annual Growth Rate
132
China displays the fastest growth in terms of eTravel revenuesTotal eTravel revenue by region (in US$ billion)
France 25.61
40.93
Germany 32.53
44.35
United Kingdom 38.81
53.56
China 75.04
170.89
Untied States 188.76
269.74
2016 2021
eTravel
+7.4% p.a.
+17.9% p.a.
+6.7% p.a.
+6.4% p.a.
+9.8% p.a.
CAGR1 ’16-’21

Online Travel Booking Mobility Services
Startups1
Established players
Market complexity2
Companies in the eTravel market can be grouped into startups and established players
Source: Statista Digital Market Outlook1: Companies founded in or after 20072: Estimate; considers value chain complexity and competitor landscape
Key players by segment and market complexity
133
eTravel

Four big players account for the major M&A activity within the Online Travel Booking industry
Source: Statista Digital Market Outlook, Dealroom.co
Selected players and selected acquisitions/ investments
Ctrip eDreams ODIGEO Expedia Priceline
2016 Skyscanner US$1700m 2013 Liligo.com N/A 2015 Homeaway US$3900m 2015 PriceMatch N/A
2016 MakeMyTripUS$180m
(27% stake)2011 Opodo N/A 2015 Orbitz, eBookers US$1600m 2014 Hotel Ninjas N/A
2015 Tuniu US$500m 2011 eDreams Merger 2015 Travelocity US$280m 2014 Buuteeq N/A
2015 eLongUS$400m
(38% stake)2011 GoVoyages Merger 2014 Wotif US$658m 2014 OpenTable US$2600m
2015 Travelfusion US$160m 2014 Auto Escape US$85m 2012 Kayak US$1800m
2015 Qunar 45% stake 2012 TrivagoUS$632m
(62% stake)2010 Rentalcars N/A
2015 Suanya US$16m 2008 CarRentals.com N/A 2010 Swoodoo N/A
2014 ToursForFun US$100m 2008 Venere N/A 2007 Agoda N/A
2014 Tujia US$100m 2001 Hotels.com N/A 2005 Booking.com US$135m
2013 Yongche US$60m
134
eTravel

Airbnb has reshaped the way we book accommodations
Source: Airbnb Data & Analytics1: Listings refer to entire flats, private rooms and shared rooms
135
Number of Airbnb listings in cities worldwide in 20161
23,000
26,000
20,000
23,000
33,000
46,000
Paris
London
17,000
20,000
Los Angeles
Barcelona
Rome
New York
Rio de Janeiro
78,000
Sydney
Copenhagen
Amsterdam
47,000
eTravel

Fair deal? In major cities, taxi drivers earn significantly less than Uber drivers
Source: Uber
136
Estimated hourly earnings of driver services in major U.S. cities
San Francisco
23.87
12.96
18.43
Washington D.C.
14.53
Boston
16.23
14.26
20.68
12.54
18.46
New York
13.92
Chicago
23.69
Los Angeles
15.74
Uber Drivers (Net Earings Per Hour)
Taxi Drivers & Chaufffeurs (Hourly Wages)vs.
eTravel

Discover more
Rethinking travel: Airbnb is just the beginning
137
Discover more of our topic-related research for eTravel
Statista‘s point of view + exclusive country-specific forecasts about:
› Online Travel Booking
› Mobility Services
Get the study
Every topic in a nutshell – all relevant statistics in one single document:
eTravel
https://www.statista.com/study/25576/online-travel-market-in-the-united-kingdom-uk-statista-dossier/

Digital Media

88,400,000
Virtual Reality is trending in Digital Media. In 2016 88.4 million Google Cardboards (Google’s budget VR solution) were shipped, demonstrating how big a trend it really is.
Source: SuperData Research

140
Global1 Digital Media revenue (in US$ billion) and CAGR2 16-21 by segment
Revenues generated by Video Games overshadow other Digital Media
50.52
Video Games
15.27
ePublishing
67.10
21.22
16.16
23.89
13.20
Video-on-Demand
9.14
Digital Music
20212016
+8.1% p.a. +7.6% p.a. +5.8% p.a. +6.8% p.a.
Source: Statista Digital Market Outlook1: only includes countries of the Digital Market Outlook2: CAGR: Compound Annual Growth Rate
Digital Media

Source: Statista Digital Market Outlook1: CAGR: Compound Annual Growth Rate
141
The U.S. has the largest Digital Media revenues, while China shows promising developmentTotal Digital Media revenue by region (in US$ billion)
South Korea 4.36
2.90
Germany 4.16
3.07
United Kingdom 7.10
5.54
Japan 15.13
12.76
China 31.38
13.35
United States 39.98
32.51
20212016
Digital Media
+8.5% p.a.
+6.3% p.a.
+5.1% p.a.
+3.5% p.a.
+18.6% p.a.
+4.2% p.a.
CAGR1 ’16-’21

In most Digital Media segments, very few players dominate the market
Source: Statista Digital Market Outlook
142
Selection of key players in Digital Media
Digital Music Video-on-Demand Video Games ePublishing
Digital Media

Youtube is the world’s largest music streaming service and at no charge to users
Source: YouTube, IFPI, Ipsos, Spotify, Apple, Pandora, Apple MusicYoutube has 1+ billion users. According to a survey among 10,552 YouTube users from 13 countries, 82 percent use it to listen to music
143
Largest services for online music consumption and their number of users
820m
81m
4m
100m
50m
20m
Total listeners
Paid subscribers
Digital Media

Spotify is the leading streaming service with the largest number of paying subscribers
Source: Company Announcements, MIDIA
144
Worldwide paid subscribers of music streaming services (in million)
’Apr 2016
1.1
Dec 2016
4.4
Dec 2016
4.5
’Jan 2017
6.9
Dec 2016
20.0
Mar 2017
50.0
Digital Media

51.3
In Q4-’16, Netflix had more paying subscribers in the U.S. than the top cable companies combined
Source: Company Information, MarketingCharts, Leichtman Research Group
145
Netflix subscribers vs. top cable companies customers in the U.S. (in m)
23.923.425.1
27.229.2 29.8
31.133.4
35.7 36.2 37.239.1
41.4 42.3 43.244.7
47.0 47.1 47.549.4
Q1 Q42012 Q1 Q42013 Q1 Q42014 Q1 Q42015 Q1 Q42016
17.2
4.60.80.43.1
48.7
Q4-2016
22.5
Charter
Comcast
Other major
CableOne
Mediacom
Altice
Paying U.S. Netflix subscribers Top Cable Companies
Digital Media

eBooks and hardcovers are most expensive in Germany
Source: Statista Digital Market OutlookAs of April 5, 2017
146
Avg. price of the Top 10 bestsellers on Amazon (in US$)
1.19
20.49
24.64
3.39
7.86
10.96
eBook Price (US$)
Hardcover Price (US$)
28%
17%
65%
NY Times Bestsellers
Spiegel Bestsellers
Open Book Bestsellers
eBook discount rate
Digital Media

Discover more
What comes after subscription in digital media?
147
Discover more of our topic-related research for Digital Media
Statista‘s point of view + exclusive country-specific forecasts about:
› Digital Music
› Video-on-Demand
› Video Games
› ePublishing
Get the study
Every topic in a nutshell – all relevant statistics in one single document:
Digital Media

FinTech

“If banks cannot truly be customer intimate, they are doomed to be just dumb commodities, acting behind the scenes, like utilities.”
JP Nicols,Bank innovation consulting expert

150
Global1 FinTech transaction value and Assets under Management (in US$ billion) and CAGR2 16-21 by segment
Global1 Digital Payments are expected to more than double by 2021
Source: Statista Digital Market Outlook1: only includes countries of the Digital Market Outlook2: CAGR: Compound Annual Growth Rate
260120
565
Personal Finance
1,753
Business FinanceDigital Payments
4,644
2,222
2016 2021
+15.9% p.a. +36.4% p.a. +46.5% p.a.
FinTech

Source: Statista Digital Market Outlook1: CAGR: Compound Annual Growth Rate
151
It's early days for FinTech markets; however, the U.S. and China have promising prospectsTotal FinTech transaction value by region (in US$ billion)
104
126
156
765
824
163
225
323
China
Germany
Japan
United Kingdom
United States
2,861
1,983
2016 2021
FinTech
+9.4% p.a.
+12.3% p.a.
+15.6% p.a.
+30.2% p.a.
+19.2% p.a.
CAGR1 ’16-’21

Most prominent FinTech players can be found in the Digital Payment segment
Source: Statista Digital Market Outlook
152
Representative FinTech key player by segment
Digital Payment Business Finance Personal Finance
Digital Commerce
P2P MoneyTransfers
Mobile Payments
Crowd-lending
Crowd-investing
Crowd-funding
Robo-Advisors
MarketplaceLending
FinTech

Profiteers in Marketplace Lending are Borrowers, Marketplaces, Banks and Investors alike
Source: Statista Digital Market Outlook1: Includes determination of loan interest rates, based on a prior credit scoring2: Including initially agreed interest rate3: Interest rate is based on credit worthiness of marketplace and therefor lower than for indivudual borrowers
153
Generic process overview and revenue streams
Personal Lending Marketplace
Loanapplication
Borrowerevaluation1
Loanlisting
Investmentpayout2
Loanissuing
Loanrepayment
Investorsfunding
Issuing Bank
Loanpurchasing
Investors
Loan granted Transaction fee from Bank, service fee from Investors
Interest rate fromloan issuance3
Return on investment from Marketplace
Borrowers
Borrower: Lending Market Place: Issuing Bank: Investor:
Financial Benefits for parties involved
FinTech

U.S. Mobile Payment transaction volume is expected to increase tenfold from ’16 to ‘21Estimated U.S Mobile Payment transaction volume (in US$ billion)
2015
8.6
55.0
2016
24.9
99.4
20182017 2020
214.7
154.4
2019 2021
274.4
Average annualgrowth rate 2016-2021
62%
154
Source: Statista Digital Market Outlook
FinTech

Robo-Advisors are most prevalent in the U.S.; only two of the biggest advisors are from EuropeTop Robo-Advisors by assets under management (in US$ million)
403
454
574
671
751
808
222Scalable Capital
Rebalance IRA
Financial Guard
Wealthsimple
AssetBuilder
Nutmeg
Futur Advisor (Blackrock)
Personal Capital 3,600
Wealthfront 5,010
Betterment 7,360
Schwab Intelligent Portfolios 10,200
Vanguard 47,000
155
Sources: Statista estimates based on company information, Press Releases, Graphiq, Nerdwallet, CNBC, Business InsiderInformation based on latest available data, as of February 2017. We do not claim that the information provided is complete.
FinTech

Bitcoin remains the largest crypto-currency with a market cap of more than US$14 billionMarket caps of the ten largest crypto-currency markets (in US$ million1)
Bitcoin
Steem 38.0
Augur 48.0
MaidSafeCoin 50.4
Dash 93.0
Ethereum Classic 109.3
Monero 148.3
Litecoin 203.4
14,003.7
Ripple 260.5
Ethereum 900.4
156
Source: CoinMarketCap1: as of January 16th, 2017
FinTech

In 5 years, Bitcoin & Blockchain start-up funding increased from US$1m to over US$570m
Source: CB Insights
157
Bitcoin & Blockchain funding and investment of start-ups (in US$ million)
572
501
343
90
1
20162015201420132012
FinTech

If you can‘t beat the FinTechs, join them
No. of major bank investments in VC-backed FinTechs (Q3-'15 – Q3-’16)
27.7%
65.3%
6.9%
Partner
Irrelevant
Competitor
Competitor, partner or irrelevant? How banking executive view Fintech firms1
8
8
7
5
3
3
Citigroup
Banco Santander
Goldman Sachs
Mitsubishi UFJ Financial Group
UBS AG
Sumitomo Mitsui Financial Group
158
Sources: KPMG, CB Insights, Capgemini1: Worldwide survey; 2016
FinTech

Discover more
How FinTech is reshaping the financial world
159
Discover more of our topic-related research for FinTech
Statista‘s point of view + exclusive country-specific forecasts about:
› Digital Payments
› Business Finance
› Personal Finance Get the study
Every topic in a nutshell – all relevant statistics in one single document:
FinTech

Digital Advertising

US$935.71
The most expensive keyword for Google AdSense (best mesothelioma lawyer) was closing in on a truly incredible cost of US$1,000 per click in March 2016.
Source: searchenginewatch; Semrush

Digital Ads are expected to grow across all categories, with Search Ads taking the top spot
Source: Statista Digital Market Outlook1: only includes countries of the Digital Market Outlook2: CAGR: Compound Annual Growth Rate
Global1 digital advertising revenue forecast (in US$ billion)
69.8
Social Media
142.5
43.3
90.7
27.1
48.9
Banner ClassifiedsVideo
25.6
16.5
45.4
20.7
Search
2016 2021
162
+9.5% p.a. +12.5% p.a. +17.0% p.a. +9.28% p.a.+10.0% p.a.
Digital Advertising

Digital Advertising revenues in China are expected to more than double by 2021
Source: Statista Digital Market Outlook1: CAGR: Compound Annual Growth Rate
163
Total Advertising revenue by region (in US$ billion)
Germany 6.78
8.65
Japan 8.67
12.60
United Kingdom 14.25
21.51
China 43.90
98.69
United States 80.18
116.08
2016 2021
Digital Advertising
+5.0% p.a.
+7.8% p.a.
+8.6% p.a.
+17.6% p.a.
+7.7% p.a.
CAGR1 ’16-’21

SSP/Ad Network
Trading Desk Ad Exchange Publisher
$0.15
$0.14
$0.29
$0.05
$0.10
$0.15
Advertising Client
Agency DSP
$0.12
DMP/Date Provider
$1.00
In programmatic advertising 60% of the budget can be allocated to service contractorsAllocation of US$1 in programmatic advertising
$0,61
164
Source: IHS Markit 2016, interviews with over 100 market playersNote: share of DMP/Date Provider and DSP might be slightly higher
Digital Advertising

There is a significant ‘ad spend gap’ for mobile
Percent of time spent by consumers with media & percent of ad spend allocate to media in the U.S. 2015 39%
Radio TV
36%
10%
13%
22%
Internet
4%
16%
23%
Mobile
25%
12%
Time spent
Ad spend
165
Source: KPCBNote: Print includes newspaper and magazine. Internet includes desk top, laptop & other connected devices;Excludes out of home, video games, and cinema advertising.
Digital Advertising

Mobile Ad spending will continue to boom over the next three yearsEstimated change in advertising spending between ’16 – ’19 in US$bn p.a.
-7.7
Radio
-3.7Magazines
-11.9Desktop Internet
Cinema 0.8
6.8
Newspapers
2.9
80.5
0.9
Television
Mobile Internet
Outdoor
166
Source: Zenith Optimedia
Digital Advertising

Social media & content marketing are top priorities for marketersDigital marketing budget plans for 2017 (in % of respondents)1
56%
55%
51%
50%
48%
46%
40%
34%
32%
29%
39%
42%
44%
43%
47%
47%
49%
53%
55%
63%
7%
11%
13%
13%
8%
7%
5%
5%
5%Social media marketing
3%
Video advertising
Content marketing
Personalization
Mobile marketing
E-Mail marketing
Webinars
Display advertising
Affiliate marketing
Paid search
Keep the sameIncrease Decrease
167
Source: Econsultancy, Adobe1: based on a survey of 3,347 marketing professionals around the world
Digital Advertising

There is a clear generational divide in news consumptionMain news source by age group
12%
8%
24%
8%7% 7%8%
29%
37%
46%
53%
25%
TVRadio
47%
36%
57%
64%
PrintOnline
5% 6%6%6%
35-4425-3418-24 45-54 55+
168
Source: Reuters Institute for the Study of JournalismNote: Based on a survey of 52,225 news consumers across 26 countries; numbers may not add up to 100% due to rounding
Digital Advertising

2019 will be a paradigm change: mobile/desktop internet ad spend is expected to overtake TV
Source: Zenith Advertising Expenditure Forecast
169
Share of global ad spend by medium (in percentage)
0.6%6.7%
6.4%
5.8%
10.9%
15.2%
18.9%
35.5%
0.7%6.4%
5.8%
4.4%
8.3%
27.0% 14.7%
32.6%
2016 2019
Cinema
Outdoor
Radio
Magazines
Newspapers
Mobile Internet
Desktop Internet
Televesion
Television: - 2.9% points
Desktop Internet: - 4.2% points
Mobile Internet: +11.8% points
Digital Advertising

Discover more
The future of advertising is 'fewer, better ads'
170
Discover more of our topic-related research for Digital Advertising
Statista‘s point of view + exclusive country-specific forecasts about:
› Banner Advertising
› Video Advertising
› Social Media Advertising
› Search Advertising
› Online Classifieds
Get the study
Every topic in a nutshell – all relevant statistics in one single document:
Digital Advertising

Smart Home

Source: Statista Digital Market Outlook
57%
of all Smart Homes in 2016 were located in the United States

The global Smart Home market will more than quadruple by 2021
173
Global1 Smart Home Revenue (in US$bn) and CAGR2 16-21 by segment
Source: Statista Digital Market Outlook1: only includes countries of the Digital Market Outlook2: CAGR: Compound Annual Growth Rate
3.11
Security
22.12
4.17
Home Automation
25.31
16.82
12.03
2.91
Ambient Assisted Living (AAL)
5.59
Energy Management
0.56
Home Entertainment
14.25
20212016
+33.1% p.a. +39.6% p.a. +35.6% p.a. +58.4% p.a. +32.6% p.a.
Smart Home

Smart Home market development is most dynamic in China and Germany
Source: Statista Digital Market Outlook1: CAGR: Compound Annual Growth Rate
174
Total Smart Home revenue by region (in US$ billion)
South Korea 0.64
2.84
United Kingdom
4.60
0.89
China 1.18
13.43
United States 10.43
32.19
Germany
0.93
3.76
2016 2021
Smart Home
+34.5% p.a.
+39.1% p.a.
+32.3% p.a.
+62.5% p.a.
+25.3% p.a.
CAGR1 ’16-’21

The Smart Home ecosystem consists of many intersections and entry points
Source: Statista Digital Market Outlook
175
Illustration of the Smart Home ecosystem and value chain
ManufacturerOffers devices
Service providerOffers control software/ platform, connectivity, additional services
Supply side Retail
WebsitesOwned or third party
StoresOwned or third party
TechniciansSells, installs and maintains system
data and/ or revenue
Devices and/ or services
Smart Home devicesSensors/ actuators to automate the home
Demand side/ Customer ecosystem
Control devicese.g. Smartphone, tablet or connected buttons
InternetEnables remote access
PlatformSoftware to control devices
GatewayProvides connectivity
: Data
Smart Home

The Smart Home company landscape comprises all kinds of origins
Source: Statista Digital Market Outlook1: Using the most relevant segment as most companies are active in multiple product segments2: Estimate; considers the potential for integration with devices from other segments 176
Key players by segment1 and integration potential
Generalists andHome
AutomationSecurity
HomeEntertainment
Ambient Assisted Living (AAL)
Energy Management
DedicatedSmart Home companies
Playersentering the market from foreign industries
Integration potential2
Smart Home

Digital Assistants will become increasingly more common in people’s homes
Source: Statista Digital Market Outlook; Tractica, 2015 to 3rd quarter 2016 1: Forecast, figures do not include business usage
177
Estimated global number of virtual digital assistant users (in m)
710
504
390
2021
1,831
2020
1,642
2019
1,376
2018
1,016
201720162015
Hi, how can I help?
1 1 1 1 1 1
Smart Home

Echo & Co. will enter the Home Automation market and increase revenues fivefold by 2021
178
Smart Home automation market revenue (in US$ billion)
0.36
2015 2020
20.78
4.10
2.10
Total home automation market Thereof VPA-enabled wireless speakers
Source: Statista Digital Market Outlook, Gartner
Smart bulbs
Traditional gateways/hubs
Window/door sensor
General control buttons/dimmers
Garage door controls
Shading devices
Other home automation solutions
VPA-enabled wireless speakers
Smart Home

Americans are keen on Smart Home Security; could it be due to the high burglary rate?
179
Domestic burglaries per 100,000 inhabitants
Smart Home security revenue per 100,000 inhabitants
Source: Statista Digital Market Outlook, UNODC
290 282 196
$275,000
United States
$209,000
$881,000
United Kingdom Germany
Smart Home

Discover more
Smart Home = Connected devices + integration
180
Discover more of our topic-related research for Smart Home
Statista‘s point of view + exclusive country-specific forecasts about:
› Home Automation
› Security
› Home Entertainment
› Ambient Assisted Living
› Energy Management
Get the study
Every topic in a nutshell – all relevant statistics in one single document:
Smart Home

Connected Car

Source: Statista Digital Market Outlook
190,850,000Connected Cars
The predicted global number of Connected Cars on the road in 2021

Widespread connectivity is a prerequisite for the development of self-driving cars
Source: Statista Digital Market Outlook1: Following Zuboff‘s Laws about the implications of information technologyNote: Width and height of bars does not correspond to the actual timeline ordigital maturity
183
Gradual automotive development towards autonomous vehicles
Mechnical devices replace manual actions
› Indicators
› etc.
Mechanization Technological im-provement of car parts
› Electric windows
› Power door locks
› etc.
Electrification
Introduction of embed-ded digital components
› Radio data system technology
› Parking cameras
› Working parts sensors
› etc.
Digitization
Interconnection of digital components
› Embedded in-car connectivity
› Connected working parts
› Monitoring Real-time operating car-data
› etc.
Connectivity
Incorporation of intelli-gent hard- and software
› Autonomous driving
› Vehicle-to-Everything communication
› Automatic self-diagnosis systems
› etc.
AutonomizationDigital Maturity
Time2017
“Every digital application that can be used for surveillance and control will be used
for surveillance and control.1”
ABC Mass market focus
Digital maturity level
Selected focus technologies per stage
Technological status quo in the mass market
Connected Car

Connected Car service subscription revenues are still falling short of OEM’s expectations
Source: Statista Digital Market Outlook1: Only includes countries listed in the Digital Market Outlook2: CAGR: Compound Annual Growth Rata/ average growth rate per year 184
Global1 Connected Car revenue (in US$ billion) and CAGR2 by segment
Infotainment Services
7.91
1.06
Vehicel Services
1.920.19
Connected Hardware
71.82
14.83
20212016
+37.1% p.a.
+58.5.4% p.a. +49.4% p.a.
Connected Car

A pioneer in integrated connectivity, the U.S. will stay the biggest Connected Car market by 2021
Source: Statista Digital Market Outlook1: CAGR: Compound Annual Growth Rate
185
United Kingdom 1.33
5.24
5.92
1.03Japan
China
Germany
16.92
1.84
1.91
United States 5.82
18.14
8.27
2016 2021
Total Connected Car revenue (in US$ billion) by region
Connected Car
+42.0% p.a.
+31.5% p.a.
+55.8% p.a.
+34.1% p.a.
+25.5% p.a.
CAGR1 ’16-’21

Connectivity-related service packages are now available from most OEMs
Source: Statista Digital Market Outlook
186
Key players and their digital service programs1
Europe North America Asia
Manufacturer
ConnectedDrive
Audi Connect
MercedesMe
Car-Net
R-Link
UConnect
Porsche Connect
InControl
OnStar
MyCitroën
Peugeot Connect
ŠkodaConnect
OnStar
SensusConnect
SYNC3
OnStar
OnStar OnStar
UConnect
EVE
MZD Connect
Mitsubishi Connect
Entune
Nissan Connect
Enform
UVOBlueLink
Honda Connect
Connect World
STARLINK
InTouch / Connection
UConnect
UConnect
Connect
Connected Car

Real-time traffic information is already widespread across the Western world and Asia
Source: Company Information, Statista Digital Market Outlook1: the four providers are Google (available in 61 countries), Here (52), TomTom (52) and Apple (46)
187
Availability of real-time traffic information by the four largest providers1
Covered by …
1 provider
2 providers
3 providers
4 providers
Connected Car

Operating data collected from connected cars generates both potential and challenges
Sources: AT&T, McKinsey, Verizon
188
Data generate per hour by Connected Cars compared to online activities
25,000 MB
Vehicle data generated
HD video streaming
Web browsing
Turn-by-turnnavigation
5 MB
15 MB
Music streaming
29 MB
869 MB
Connected Car

Tesla’s investment intensity in R&D is much bigger than that of VW and BMW
Sources: Company Information, Statista1: R&D intensity is defined as the ratio between a company’s investment in research and development and its revenue
R&D intensity of Tesla and selected car manufacturers in 20161
Toyota 3.7
Daimler 4.9
Ford 4.8
General Motors 4.9
BMW 5.5
VW 7.3
Tesla 11.9
Connected Car

Discover more
Monetizing vehicle data – the future for OEMs?
190
Discover more of our topic-related research for Connected Car
Statista‘s point of view + exclusive country-specific forecasts about:
› Connected Hardware
› Infotainment Services
› Vehicle Services Get the study
Every topic in a nutshell – all relevant statistics in one single document:
Connected Car

ImprintContacts and authors
Released:
ImprintStatista ▪ Johannes-Brahms-Platz 1 ▪ 20355 Hamburg ▪ +49 40 413 49 89 0 ▪ www.statista.com
DisclaimerThis study is based on survey and research data of the previously mentioned sources. The forecasts and market analysis presented were researched and prepared by Statista with greatcare.
For the presented survey data, estimations and forecasts Statista cannot assume any warranty of any kind. Surveys and forecasts contain information not naturally representing a reliablebasis for decisions in individual cases and may be in need of further interpretation. Therefore, Statista is not liable for any damage arising from the use of statistics and data provided in thisreport.
April 2017
Tobias BohnhoffFelix Wegener Philipp HuhnSebastian Buss Kathrin Schreiber
WEBstatista.com/outlook

About the Digital Market Outlook
192
FinTech
Digital Payments, Business Finance, Personal Finance
Smart Home
Home Automation, Security, Home Entertainment, Ambient Assisted Living, Energy Management
eTravel
Online Travel Booking, Mobility Services
e-Commerce
Fashion, Electronics & Media, Food & Personal Care, Furniture & Appliances, Toys, Hobby & DIY
eServices
Event Tickets, Fitness, Dating Services, Food Delivery
Digital Advertising
Banner Ads, Video Ads, Search Ads, Social Media Ads, Classifieds
Connected Car
Connected Hardware, VehicleServices, Infotainment Services
Digital Media
Video-on-Demand, Digital Music, Video Games, ePublishing
Exclusive part of the Statista Corporate Account
Access to more than 1,000,000 statistics and all digital marketsmore informationmore information
Details
› 50 countries
› Direct access & downloads
› 7-Year coverage: 2015 – 2021
› Revenue forecasts
› User count & penetration
› Comparable data
9 Markets, 34 segments & 85 sub-segments