Differential Sea Level Rise Lesson
15
© 2019 University of North Carolina at Chapel Hill Examining Sea Level Rise & Differential Shoreline Response DESCRIPTION The 2018 National Climate Assessment states that “America’s trillion-dollar coastal property market and public infrastructure are threatened by the ongoing increase in the frequency, depth, and extent of tidal flooding due to sea level rise, with cascading impacts to the larger economy. Higher storm surges due to sea level rise and the increased probability of heavy precipitation events exacerbate the risk.” Sea level rise projections vary greatly; according to global projections from the 2013 IPCC report, sea level rise between 0.26m and 0.82m (10 and 32 inches) can be expected by the end of this century but it will not occur uniformly across the globe. North Carolina is especially vulnerable to sea level rise because it has the third largest low-lying region in the United States, the nation’s second largest estuary system, as well as numerous barrier islands. In this activity, students make and manipulate physical shoreline models to discover the features of resilient shorelines and to critically evaluate various coastal adaptation strategies to prepare for rising seas. Students will use NOAA’s Sea Level Rise Viewer to observe a coastal area of interest and predict the consequences of sea level rise on people, the environment, and the economy. KEYWORDS Sea level rise, shoreline, erosion, estuaries, barrier islands, jetties, sea walls, freshwater, salt water, ocean, climate, weather, economy, climate adaptation, glacier, salt water intrusion EXTENSION KEYWORDS Infrastructure, storm surge, force, hurricane, energy LEARNING OUTCOMES During this lesson students will: • construct physical models of shorelines to examine how various shorelines--both natural and altered-- respond to sea level rise; • collaborate in small groups to assess the effect of sea level rise on their shoreline model; • compare their observations to current data available from NOAA and NASA; • use NOAA’s Sea Level Rise Viewer to explore impact of sea level rise on a coastal community; • communicate their findings to the class. CURRICULUM ALIGNMENT 2010 North Carolina Essential Standards for Earth/Environmental Science EEn.2.1.3 Explain how natural actions such as weathering, erosion (wind, water and gravity), and soil formation affect Earth’s surface. EEn.2.3.1 Explain how water is an energy agent (currents and heat transfer). EEn.2.4.2 Evaluate human influences on water quality in North Carolina’s river basins, wetlands and tidal environments. EEn.2.5.4 Predict the weather using available weather maps and data (including surface, upper atmospheric winds, and satellite imagery). EEn.2.6.1 Differentiate between weather and climate. EEn.2.6.2 Explain changes in global climate due to natural processes. EEn.2.6.3 Analyze the impacts that human activities have on global climate change (such as burning hydrocarbons, greenhouse effect, and deforestation).
Transcript of Differential Sea Level Rise Lesson

© 2019 University of North Carolina at Chapel Hill
Examining Sea Level Rise & Differential Shoreline Response
DESCRIPTION The 2018 National Climate Assessment states that “America’s trillion-dollar coastal property market and public infrastructure are threatened by the ongoing increase in the frequency, depth, and extent of tidal flooding due to sea level rise, with cascading impacts to the larger economy. Higher storm surges due to sea level rise and the increased probability of heavy precipitation events exacerbate the risk.” Sea level rise projections vary greatly; according to global projections from the 2013 IPCC report, sea level rise between 0.26m and 0.82m (10 and 32 inches) can be expected by the end of this century but it will not occur uniformly across the globe. North Carolina is especially vulnerable to sea level rise because it has the third largest low-lying region in the United States, the nation’s second largest estuary system, as well as numerous barrier islands. In this activity, students make and manipulate physical shoreline models to discover the features of resilient shorelines and to critically evaluate various coastal adaptation strategies to prepare for rising seas. Students will use NOAA’s Sea Level Rise Viewer to observe a coastal area of interest and predict the consequences of sea level rise on people, the environment, and the economy.
KEYWORDS Sea level rise, shoreline, erosion, estuaries, barrier islands, jetties, sea walls, freshwater, salt water, ocean, climate, weather, economy, climate adaptation, glacier, salt water intrusion
EXTENSION KEYWORDS Infrastructure, storm surge, force, hurricane, energy
LEARNING OUTCOMES During this lesson students will:
• construct physical models of shorelines to examine how various shorelines--both natural andaltered-- respond to sea level rise;
• collaborate in small groups to assess the effect of sea level rise on their shoreline model;• compare their observations to current data available from NOAA and NASA;• use NOAA’s Sea Level Rise Viewer to explore impact of sea level rise on a coastal community;• communicate their findings to the class.
CURRICULUM ALIGNMENT 2010 North Carolina Essential Standards for Earth/Environmental Science EEn.2.1.3 Explain how natural actions such as weathering, erosion (wind, water and gravity), and soil
formation affect Earth’s surface. EEn.2.3.1 Explain how water is an energy agent (currents and heat transfer). EEn.2.4.2 Evaluate human influences on water quality in North Carolina’s river basins, wetlands and
tidal environments. EEn.2.5.4 Predict the weather using available weather maps and data (including surface, upper
atmospheric winds, and satellite imagery). EEn.2.6.1 Differentiate between weather and climate. EEn.2.6.2 Explain changes in global climate due to natural processes. EEn.2.6.3 Analyze the impacts that human activities have on global climate change (such as burning
hydrocarbons, greenhouse effect, and deforestation).

© 2019 University of North Carolina at Chapel Hill
Next Generation Science Standards Developing and Using Models Modeling in 9–12 builds on K–8 experiences and progresses to using, synthesizing, and developing models to predict and show relationships among variables between systems and their components in the natural and designed world(s).
Develop a model based on evidence to illustrate the relationships between systems or between components of a system. (HS-ESS2-3), (HS-ESS2-6)
Planning and Carrying Out Investigations Planning and carrying out investigations in 9-12 builds on K-8 experiences and progresses to include investigations that provide evidence for and test conceptual, mathematical, physical, and empirical models.
· Plan and conduct an investigation individually and collaboratively to produce data to serve as thebasis for evidence, and in the design: decide on types, how much, and accuracy of data needed toproduce reliable measurements and consider limitations on the precision of the data (e.g., number oftrials, cost, risk, time), and refine the design accordingly. (HS-ESS2-5)
Analyzing and Interpreting Data Analyzing data in 9–12 builds on K–8 experiences and progresses to introducing more detailed statistical analysis, the comparison of data sets for consistency, and the use of models to generate and analyze data.
·Analyze data using tools, technologies, and/or models (e.g., computational, mathematical) in orderto make valid and reliable scientific claims or determine an optimal design solution. (HS-ESS2-2)
ESS2.C: The Roles of Water in Earth's Surface Processes · The abundance of liquid water on Earth’s surface and its unique combination of physical andchemical properties are central to the planet’s dynamics. These properties include water’sexceptional capacity to absorb, store, and release large amounts of energy, transmit sunlight, expandupon freezing, dissolve and transport materials, and lower the viscosities and melting points of rocks.(HS-ESS2-5)
ESS2.D: Weather and Climate · The foundation for Earth’s global climate systems is the electromagnetic radiation from the sun, aswell as its reflection, absorption, storage, and redistribution among the atmosphere, ocean, and landsystems, and this energy’s re-radiation into space. (HS-ESS2-2)· Gradual atmospheric changes were due to plants and other organisms that captured carbon dioxideand released oxygen. (HS-ESS2-6), (HS-ESS2-7)· Changes in the atmosphere due to human activity have increased carbon dioxide concentrationsand thus affect climate. (HS-ESS2-6)
Climate Literacy Framework Principle 2 Climate is regulated by complex interactions among components of the Earth’s system Principle 5 Our understanding of the climate system is improved through observations, theoretical
studies, and modeling Principle 6 Human activities are impacting the climate system Principle 7 Climate change will have consequences for the Earth System and human lives

© 2019 University of North Carolina at Chapel Hill
BACKGROUND INFORMATION FOR TEACHER According to the U.S. Climate Change Science Program 2009 report, Coastal Sensitivity to Sea-level Rise: A Focus on the Mid-Atlantic Region, “most coastal regions are currently managed under the premise that sea-level rise is not significant and that shorelines are static or can be fixed in place by engineering structures. The new reality of sea-level rise due to climate change requires new considerations in managing areas to protect resources and reduce risk to humans. Long-term climate change impact data are essential for adaptation plans to climate change and coastal zone plans are most useful if they have the premise that coasts are dynamic and highly variable.” Many climate models based on satellite data and observations have shown that sea level rise is not uniform, and this is partly due to the lack of uniformity of Earth’s surface. Some regions surpass the global mean, while in other areas, it is falling. This is more than likely due to the fact that Earth’s temperature changes are not uniform, nor are salinity changes, which impact ocean circulation. Furthermore, the 2014 National Climate Assessment stated that “in coastal areas, sea level rise may act in parallel with inland climate changes to intensify water-use impacts and challenges” such as flooding. Thus, the nature of a shoreline along with other factors will influence local sea level and how shorelines respond to rising seas. Other factors that influence local sea level include:
● land subsidence and/or land uplift ● heavier runoff from inland areas ● patterns of precipitation changes ● erosion and sediment migration ● wave action ● storm activity
TIME REQUIRED 90 MINUTE BLOCK or two, 50-60 MINUTE CLASS PERIODS
20 minute introduction 60 minutes for lab activity and small group collaboration 10 minutes for daily assessment and discussion
MATERIALS Per group of 4-5 students
• Transparent container* for shoreline model (*for comparison purposes all groups should have the same kind of container: Sterilite© container, stream table, clear takeout container, etc.)
• Beaker or cup for holding a set volume of water • Gravel (could include different sized gravels) and/or clay to model jetties and sea walls • Sand (fine, coarse, mixed) to model beach, sand dunes, and barrier islands • Paper towels • Water • Sponges (could include different types of sponges) to model estuaries, marshes, etc. • (optional) Monopoly homes, Lego blocks, straws, lincoln logs, toothpicks, popsicle sticks,
cardboard, toy cars, etc. • (optional) Block of wood and hair dryer (multiple speed) for Storm Surge Extension Activity • Permanent marker • Ruler (mm) • Paper for drawing shoreline representations (optional) • Colored pencils/wax pencils for drawing shoreline representations (optional) • Scissors for cutting sponges • Student Activity Sheet (included), one per student
© 2019 University of North Carolina at Chapel Hill
TECHNOLOGY ACCESS Students will need access to computers, smartphones, iPads or other approved electronic device for viewing the online resources & tools to complete the Student Activity Sheet. STUDENT PREPARATION FOR ACTIVITY Students should have knowledge of the following prior to completing this activity:
a. an understanding that thermal expansion of water, melting glaciers and loss of ice from the Greenland and Antarctic ice sheets contribute to rising seas;
b. an understanding that physical, geological and human forces shape shorelines; c. a general understanding of NC’s coastal ecology and geography. A nice overview can be found
in Chapter 1 of North Carolina National Estuarine Research Reserve’s A Field Guide to the North Carolina National Estuarine Research Reserve.
d. awareness of the different types of shorelines, especially those along the NC coast. This could be done by showing students images of different shorelines (photo examples of 15 major shoreline types from NOAA can be found here) and/or letting them look for/explore different shoreline types using Google Earth.
You may choose to show the NASA video Melting Ice, Rising Seas (4min 31seconds) prior to starting this lesson: http://pmm.nasa.gov/education/videos/melting-ice-rising-seas
ENGAGEMENT ACTIVITY
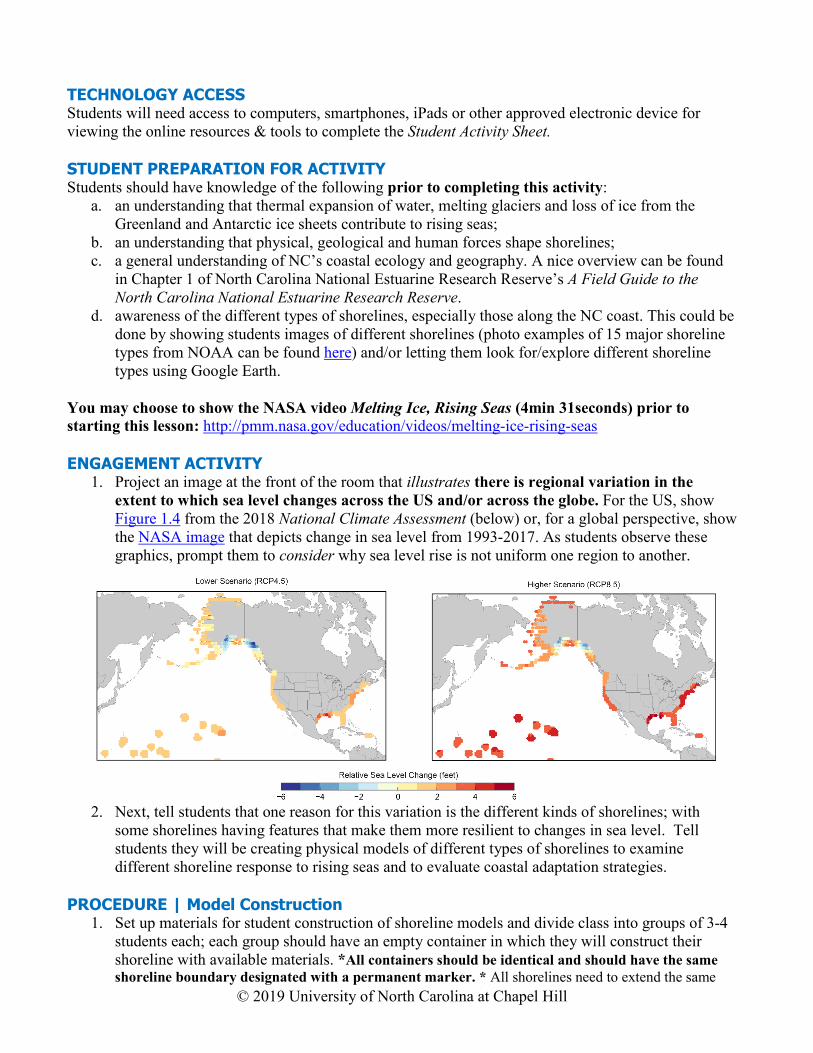
1. Project an image at the front of the room that illustrates there is regional variation in the extent to which sea level changes across the US and/or across the globe. For the US, show Figure 1.4 from the 2018 National Climate Assessment (below) or, for a global perspective, show the NASA image that depicts change in sea level from 1993-2017. As students observe these graphics, prompt them to consider why sea level rise is not uniform one region to another.
2. Next, tell students that one reason for this variation is the different kinds of shorelines; with some shorelines having features that make them more resilient to changes in sea level. Tell students they will be creating physical models of different types of shorelines to examine different shoreline response to rising seas and to evaluate coastal adaptation strategies.
PROCEDURE | Model Construction
1. Set up materials for student construction of shoreline models and divide class into groups of 3-4 students each; each group should have an empty container in which they will construct their shoreline with available materials. *All containers should be identical and should have the same shoreline boundary designated with a permanent marker. * All shorelines need to extend the same

© 2019 University of North Carolina at Chapel Hill
distance (e.g., 5”) into the container; a line needs to be drawn along the bottom and sides of the container (e.g., 5” from the edge of the container) indicating that students will build their shorelines within this area (see red line below). The bottom of the container will represent the current sea level.
2. Tell students that they are going to build a physical model of a shoreline out of sand, gravel, clay and sponges in order to predict and then observe the effect of sea level rise (SLR) on their shoreline. You could provide them with a description of a shoreline to build or let them design their own.
Example shoreline descriptions students could model are included below: Coastline #1: Barrier Island: Shoreline consists of a sandy beach on the ocean side and a wetland on the
sound side. Use sand, sponges and/or paper towels model this in the container provided. Coastline #2: Shoreline consists of a sandy beach and, as a result of coastal protection measures, also
includes a jetty (gravel) and/or a sea wall (clay). Use sand, gravel, and clay to model this shoreline in the container provided.
Coastline #3: Shoreline is a wetland located in an estuary where a river meets the sea. Use paper towels
and/or sponges model this coastline in the container provided. Coastline #4: Resilient shoreline – Use the materials provided to create the most resilient (least
vulnerable to sea level rise) shoreline.
3. Instruct students to follow the instructions on their activity sheet and construct their physical models; when the time comes to raise sea level, provide each group with the **same volume** of water to pour into their container so that groups can compare their results.
Figure 1 (left). Student pours specified volume of water to witness how "rising seas" will impact shoreline model. Figure 1 (right). Student measures height of water to quantify the amount of sea level rise observed.

© 2019 University of North Carolina at Chapel Hill
4. Once students have witnessed the impact of sea level rise on their shoreline model, invite them
to move around the room and observe other models to determine the features that make a shoreline more resilient to sea level rise (e.g., which model resulted in the least amount of sea level rise (smallest depth of water?)). Alternatively (time permitting), ask each group to take into consideration how they answered question 10 and repeat their experiment to see if they can reconstruct a shoreline that is less vulnerable to sea level rise.
5. Summarize current thinking about sea level rise for the class. Tell them that in general, rising seas will inundate wetlands and other low-lying lands, erode beaches, intensify flooding, and increase the salinity of rivers, bays, and groundwater tables. The 2013 IPCC report stated that by the end of the 21st century, “it is very likely that sea level will rise in more than about 95% of the ocean area. About 70% of the coastlines worldwide are projected to experience sea level change within 20% of the global mean sea level change.” This means that some areas will experience sea level rise greater than the projected mean and other areas will experience less.
6. Conclude this activity by asking the following questions and having students record their responses on the back of their worksheet:
A. How will rising seas impact people? • damage to homes, buildings (including schools), roads, etc. • loss of coastal cropland • displaces people from low-lying areas • salt water intrusion/groundwater supplies/municipal water supplies
B. How will rising seas impact coastal infrastructure? • salt water intrusion • loss of septic/sewage • damage to roads, electrical infrastructure (e.g. power lines), etc.
C. How will rising seas impact coastal ecosystems? (barrier island migration, breaching, segmentation)
• loss of coastal habitats and wetlands by inundation of low-lying lands or erosion • wetland accretion and migration • expansion of wetlands • saltwater intrusion
D. How will rising seas impact coastal storms? • increased storm waves/storm surge • flooding
E. How can coastal communities prepare for rising seas? • develop resilient shorelines and infrastructure • address homes and buildings in low-lying areas • educate citizens on individual and collective actions to help community adapt to
higher seas F. What role do local, state and federal policymakers play in helping communities prepare?
• answers will vary but may include policies related to development, preservation, etc. 7. Ask students to reflect on their model: how did it behave like an actual shoreline? How was it
different? Their models looked at sea level rise in isolation from other factors when shorelines are dynamic and shaped by physical, geological, and human factors. Discuss the value of constructing physical models. How could they supplement their model observations with real data?

© 2019 University of North Carolina at Chapel Hill
Assessment
• Student presentations of their shorelines and response to rising seas • Completion of Student Activity Sheet
Differentiation Students with Special Needs • Place students in mixed ability partners for activity completion; provide additional time for model
construction. AIG • Invite students to work individually to design and construct models. • Conduct one or more of the extension activities below. • Ask students to summarize their predictions and observations writing. • Ask students to investigate one or more coastal communities and research what the community is
doing to prepare for sea level rise; students can compare coastal adaptation strategies. AIG STUDENT EXTENSION ACTIVITIES PROCEDURE | Storm Surge Investigation 1. Introduce students to storm surge, perhaps by using resources from NOAA or the National Weather
Service (check out their Storm Surge Fast Draw video (97 seconds)). 2. Using the shoreline model they have already developed, students will replicate a storm surge event.
Ask students to use a wood block and hair dryer to replicate storm surge by using the Saffir-Simpson Hurricane Wind Scale:
Use wood block to softly tap surface of water - 1 Use wood block to make more forceful waves, submerging shoreline quickly - 2 Use hair dryer on low speed to direct water toward shoreline- 3 Use hair dryer on medium speed to direct water toward shoreline - 4 Use hair dryer on high speed and use wood block to create forceful waves – 5
3. Next, ask students to make observations and evaluate damages to their shoreline model either orally or in writing. They could take photos or use video to document their observations.
4. Time permitting, students could examine the Haiyan Tropical Storm that devastated the Philippines in
2013 or another storm of interest where storm surge was pronounced and post-storm effects are visible via satellite observations, etc.
PROCEDURE | Resilient Shoreline Investigation 1. Invite students to research building designs and building materials that can be used for constructing resilient shorelines and resilient infrastructure. 2. Allow students to revisit their shoreline model and use various materials/designs to construct a more resilient shoreline. 3. Perform the storm surge activity and make observations, estimate economic impact, environmental impact, social impact, etc.

© 2019 University of North Carolina at Chapel Hill
Resources A Field Guide to the North Carolina National Estuarine Research Reserve https://deq.nc.gov/about/divisions/coastal-management/nc-coastal-reserve/education/educator-resources Melting Ice, Rising Seas video (4min 31seconds) http://pmm.nasa.gov/education/videos/melting-ice-rising-seas NOAA Shoreline Types (Slideshow) https://response.restoration.noaa.gov/esi-shoreline-types#slideshow-0 Interactive Maps and Data Sea Level Rise Viewer (NOAA) https://coast.noaa.gov/slr/ Climate Change Vital Signs (NASA) http://climate.nasa.gov/vital-signs/sea-level/ Reports National Climate Assessment (2018), Coastal Effects (Chapter 8) https://nca2018.globalchange.gov/chapter/8/ Climate Change 2013: The Physical Science Basis. Contribution of Working Group I to the Fifth Assessment Report of the Intergovernmental Panel on Climate Change (IPCC) (Chapter 13) https://www.ipcc.ch/site/assets/uploads/2018/02/WG1AR5_Chapter13_FINAL.pdf U.S. Climate Change Science Program (2009), Coastal Sensitivity to Sea-level Rise: A Focus on the Mid-Atlantic Region https://www.globalchange.gov/sites/globalchange/files/sap4-1-final-report-all.pdf Author Information This lesson was written by Dana Haine, MS, K-12 Science Education Manager, Environmental Resource Program (ERP), UNC-Chapel Hill Institute for the Environment in collaboration with Jana Tasich, science teacher with Alamance Burlington Schools and Joe Moss, NBCT science teacher at Farmville Central High School. Jana and Joe both participated in the 2013-2014 NC CLIMATE Fellows Program, a NASA funded Innovations in Climate Education (NICE) Program. This lesson was reviewed by Lindsay Dubbs, PhD, Research Assistant Professor, Institute for the Environment and Associate Director, Outer Banks Field Site, UNC-Chapel Hill. This lesson was thoughtfully reviewed and piloted by the following science teachers:
Ruthann McComb, NBCT, Elkin High School Denise O’Gorman, Woods Charter School Linda Schmalbeck, PhD, NC School of Science and Math DeeDee Whitaker, MAT, NBCT, Southwest Guilford High School

© 2019 University of North Carolina at Chapel Hill
Examining Sea Level Rise and Differential Shoreline Response | Student Activity Sheet
Your name: Group members: Part I. Shoreline Model 1. Obtain a transparent container from your teacher and with a marker *mark the shoreline boundary* (with a
solid line) on the side and bottom of the container according to your teacher’s instructions. Your teacher may have already marked the container.
2. Notice that the shoreline boundary line divides your container into two sections. Within the smaller section (see shaded area in drawing to the right), use available materials (sand, gravel, sponges, clay, etc.) to create a shoreline- you get to decide the elevation and slope of your coastal structures. Alternatively, your teacher may tell you which materials you are allowed to use. You may also choose to construct one or more barrier islands opposite the shoreline using sand and/or gravel and/or one or more man-made structures such as a jetty or sea wall using clay or gravel.
3. Next, use a marker to draw the profile of your shoreline
on the sides of the container so that you can monitor how your shoreline responds once you add water to the container.
4. Draw a representative picture of your shoreline on the diagram above (or on another sheet of paper) and, using labels, indicate what each material represents. You may also choose to draw a cross-section of your shoreline, especially if you layered materials when constructing.
5. *Imagine that the bottom of the container represents the current sea level.* Predict what will happen to
your shoreline features if sea level rises.
6. On a scale of 1 to 10, with 10 being most vulnerable, predict the vulnerability of your shoreline to sea level
rise. 1 2 3 4 5 6 7 8 9 10
7. Now, SLOWLY pour a set volume of water (as determined by your teacher) into the empty section (“ocean”)
of the container so as to not disrupt any of your structures. 8. Then, use a ruler to measure the depth of the water (in mm). Depending on the materials you used, it might
take a few minutes for the water to infiltrate your shoreline. Record depth (mm) of water here ___________. This represents the amount of sea level rise. 9. Shade the portions of your shoreline drawing (Step 4 above) that are now underwater as a result of this
increase in sea level and describe your observations in the space below.
Shoreline boundary
View looking down into container
Build shoreline in this space
Ocean

© 2019 University of North Carolina at Chapel Hill
10. By completing the table below, indicate which coastal features were affected by this increase in sea level.
Coastal Feature Sea Level Rise Impact Economic Costs of Impact
Environmental Cost
i.e. Beach/Sand Erosion Loss of beach front property, tourism
Loss of dunes; habitats for plants and animals
11. On a scale of 1 to 10, with 10 being most vulnerable, estimate the observed vulnerability of your coastline to sea level rise. 1 2 3 4 5 6 7 8 9 10 12. How could your shoreline be altered to be less vulnerable to sea level rise?
13. On a notecard, write the depth of the water in mm and place next to your tray so others can evaluate the resulting sea level rise observed in your shoreline model. 14. When prompted by your teacher, move around the room to view other shoreline models and the extent of sea level rise in each and determine which shoreline was least vulnerable to sea level rise. What feature(s) did the least vulnerable shorelines have in common? What strategies should coastal communities use to best prepare for sea level rise? Describe your observations below:
15. How did your model behave like an actual coastline? How was it different? 16. In your own words, define what is meant by the phrase differential sea level rise.

© 2019 University of North Carolina at Chapel Hill
Part II. Impacts of Sea Level Rise 1. Use an approved electronic device with Internet access to launch NOAA’s Sea Level Rise Viewer by visiting https://coast.noaa.gov/slr/ and type in the name of a coastal county or city you want to explore. 2. Zoom into an area of interest such as a downtown or port area, or a tourist area with hotels/beach houses. Use the “water level” scale on the right to increase the water level by 1 or more feet. Based on your observations from using this tool, predict the impact that sea level rise will have on the people who live, work or recreate in this region as well as on the environment, and the economy. Record your predictions in the chart below. County or city of interest:
Impact on people
Impact on the Environment
Impact on the Economy
Part III. Sea Level Data Analysis 1. Go to https://climate.nasa.gov/vital-signs/sea-level/ and observe the graphical data presented. 2. Describe the trend in sea level observed as you view both satellite data and ground data (from coastal tide gauge records). 3. List two ways that global warming contributes to sea level to rise. a.
b.
4. Click on the Arctic Sea Ice Minimum and Ice Sheets tabs and observe the graphical data presented for each indicator.
a. Are there data to support your answers to question #3 above? Yes or no? Explain your answer.
b. Describe the trend(s) observed for each indicator. Describe how each indicator is connected to sea level rise.

© 2019 University of North Carolina at Chapel Hill
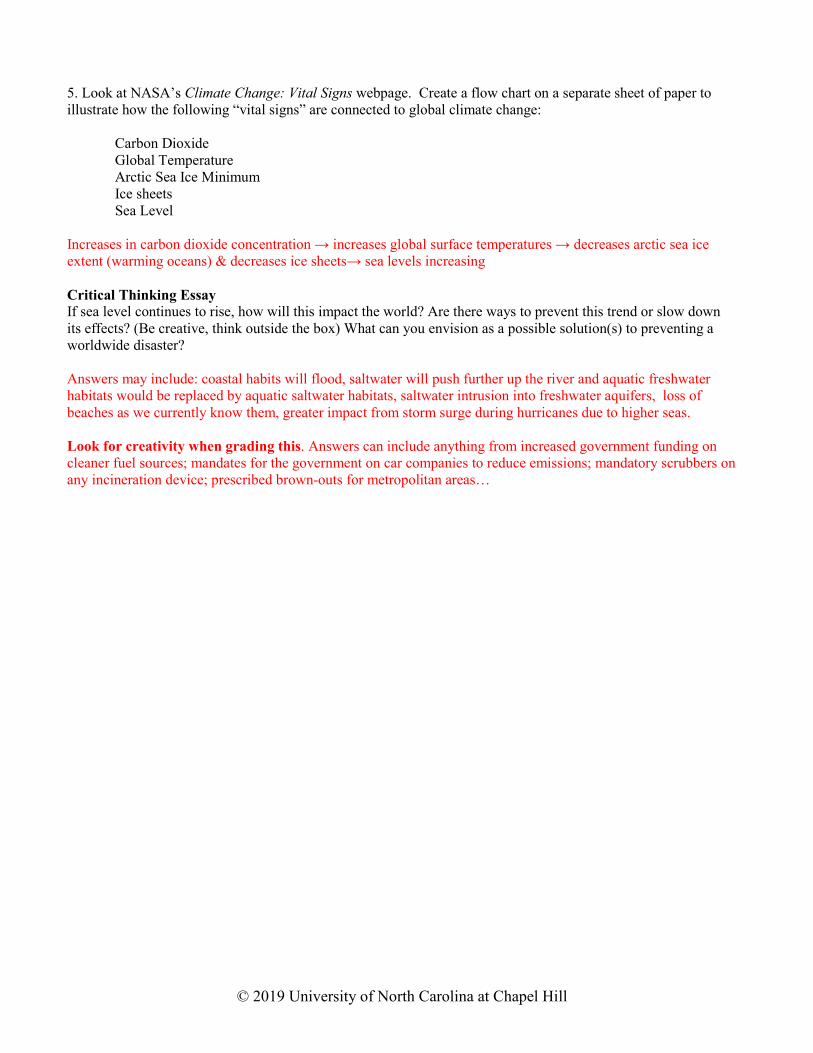
5. Look at all of the graphs on NASA’s Climate Change: Vital Signs webpage. Create a flow chart on a separate sheet of paper to illustrate how the following key indicators are connected to global climate change:
Carbon Dioxide Global Temperature Arctic Sea Ice Minimum Ice Sheets Sea Level
Critical Thinking Essay If sea level continues to rise, how will this impact the globe? Are there ways to prevent this trend or slow down its effects? (Be creative, think outside the box) What can you envision as a possible solution(s) to preventing a worldwide disaster?

© 2019 University of North Carolina at Chapel Hill
Examining Sea Level Rise and Differential Shoreline Response ANSWER KEY
10. By completing the table below, indicate which coastal features were affected by this increase in sea level. Answers will vary depending upon shoreline features modeled.
Coastal Feature Sea Level Rise Impact Economic Costs of Impact
Environmental Cost
i.e. Beach/Sand Erosion Loss of beach front property, tourism
Loss of dunes; habitats for plants and animals
Wetland/Sponge Increased salinity and potential loss of wetland; aquatic freshwater habitats could be replaced by saltwater habitats
Impact on fisheries and freshwater aquatic vegetation
Loss of wetlands and the ecosystem services they provide
Sea walls or jetties/ Gravel or Clay
Erosion North or South of the sea walls/jetties.
Continued beach remediation; upkeep of jetties/sea wall; tourism communities (i.e., surfing, wakeboarding, fishing); Water transport
Changing of intertidal zones, dune formation, reshaping native communities (i.e., turtle nesting/migration, sea grasses, shrimp etc.)
Homes, buildings and roads / development
Flooding, destruction of homes and buildings, road damage
Loss of homes, home insurance rates increase, saltwater damage. Loss of life, careers, etc.
Pollution, non-potable water, sewage treatment;
11. On a scale of 1 to 10, with 10 being most vulnerable, estimate the observed vulnerability of your shoreline to sea level rise. Answers will vary depending upon shoreline. 12. How could your shoreline be altered to be less vulnerable to sea level rise? Answers will vary: More wetland = more sponges; keep natural sea grasses/dune vegetation intact; maintain natural maritime forests; do not build homes on shorelines.
13. On a notecard, write the depth of the water in mm and place next to your tray so others can evaluate the resulting sea level rise observed in your shoreline model. 14. When prompted, move around the room to view other shoreline models and the extent of sea level rise in each and determine which shoreline was least vulnerable to sea level rise.
a. What feature(s) did the least vulnerable shorelines have in common? Describe your observations. Students should describe their observations but will likely observe that shorelines with sponges, sand, and minimal hardened structures (gravel, clay, etc.,) were more resilient. b. What strategies should coastal communities use to best prepare for sea level rise? Answers will vary but may include wetland restoration, living shorelines, dune preservation, etc.
15. How did your shoreline model behave like an actual coastline? How was it different? Answers will vary but students should address the limitations of a model… 16. In your own words, define what is meant by the phrase differential sea level rise. Answers will vary but should include the concept that sea level rise will not be uniform across the globe; some areas will experience more sea level rise than others due to factors such as land subsidence and/or land uplift, heavier runoff from inland areas, patterns of precipitation changes, erosion and sediment migration, wave action and storm activity.

© 2019 University of North Carolina at Chapel Hill
Part II. Impact of Sea Level Rise 1. Use an approved electronic device with Internet access to launch NOAA’s Sea Level Rise Viewer by visiting https://coast.noaa.gov/slr/ and type in the name of a coastal county or city you want to explore. 2. Zoom into an area of interest such as a downtown or port area, or a tourist area with hotels/beach houses. Use the “water level” scale on the right to increase the water level by 1 or more feet. Based on your observations from using this tool, predict the impact that sea level rise will have on the people who live, work or recreate in this region as well as on the environment, and the economy. Record your predictions in the chart below.
Impact on people
Answers will vary but are likely to include the following…..
• loss of jobs, decreased beach access, increased flash flooding during storm surge, increase damage to commercial and personal property
Impact on the Environment
Answers will vary but are likely to include the following…..
• loss of estuarine habitats in the interim of change (need time to be reconstructed); extinction of coastal species during competition for land
Impact on the Economy
Answers will vary but are likely to include the following…..
• increased taxes to pay for damages, increased flood insurance rates, loss of jobs, loss of small business economy along coastal areas, loss of vital wetland habitat for fisheries
Part III. Sea Level Data Analysis 1. Go to https://climate.nasa.gov/vital-signs/sea-level/ and observe the graphical data presented. 2. Describe the trend in sea level observed as you view both satellite data and ground data using coastal tide gauge records. Sea level is increasing. 3. List the two ways that global warming contributes to sea level to rise. a. Added water of melting glaciers and land ice (ice sheets)
b. Thermal expansion of water as it warms
4. Click on the Arctic Sea Ice Minimum and Ice Sheets tabs and observe the graphical data presented for each indicator.
a. Are there data to support your answers to question #3 above? Yes or no? YES
b. Describe the trend(s) observed for each indicator. Describe how each indicator is connected to sea level rise. Land ice (ice sheets) is decreasing which increases the amount of water in the oceans, causing sea level to rise. Arctic Sea Ice is also decreasing and while this doesn’t contribute to sea level rise, it indicates a warming ocean (thermal expansion).
© 2019 University of North Carolina at Chapel Hill
5. Look at NASA’s Climate Change: Vital Signs webpage. Create a flow chart on a separate sheet of paper to illustrate how the following “vital signs” are connected to global climate change:
Carbon Dioxide Global Temperature Arctic Sea Ice Minimum Ice sheets Sea Level
Increases in carbon dioxide concentration → increases global surface temperatures → decreases arctic sea ice extent (warming oceans) & decreases ice sheets→ sea levels increasing
Critical Thinking Essay If sea level continues to rise, how will this impact the world? Are there ways to prevent this trend or slow down its effects? (Be creative, think outside the box) What can you envision as a possible solution(s) to preventing a worldwide disaster? Answers may include: coastal habits will flood, saltwater will push further up the river and aquatic freshwater habitats would be replaced by aquatic saltwater habitats, saltwater intrusion into freshwater aquifers, loss of beaches as we currently know them, greater impact from storm surge during hurricanes due to higher seas. Look for creativity when grading this. Answers can include anything from increased government funding on cleaner fuel sources; mandates for the government on car companies to reduce emissions; mandatory scrubbers on any incineration device; prescribed brown-outs for metropolitan areas…