Differential distribution patterns of CRABP I and CRABP II...
15
Introduction Vitamin A (retinol) and its active metabolite retinoic acid (RA) play important roles during mammalian morpho- genesis. In mammals retinoids are well known to be potent teratogenic agents in both deficiency and excess (Lammer et al., 1985; Morriss, 1972; Rosa et al., 1986; Shenefelt, 1972; Warkany et al., 1943; Wilson et al., 1953). RA exerts its effects by binding to nuclear receptors (RARs) that mod- ulate the transcriptional activity of specific target genes (Benbrook et al., 1988; Brand et al., 1988; Giguère et al., 1987; Krust et al., 1989; Petkovich et al., 1987; Zelent et al., 1989). In addition to the nuclear receptors, there exist two cytosolic RA binding proteins, the cellular retinoic acid binding proteins I (CRABP I) and II (CRABP II) (Blomhoff et al., 1990; Giguère et al., 1990; Stoner and Gudas, 1989). The two CRABP proteins are structurally very similar, but the affinity of CRABP II for RA appears to be lower than that of CRABP I (for a review see Chytil and Stump, 1991). It has been proposed that the CRABPs could transport RA from the cytoplasm to the nucleus where it would be trans- ferred to the nuclear receptors (Takase et al., 1979, 1986). Alternatively, it has been suggested that the role of CRABPs could be controlling the actual concentration of free RA in a given cell (Boylan and Gudas, 1991; Maden et al., 1988; Robertson, 1987; Ruberte et al., 1991; Smith et al., 1989). Maden et al. (1988) have described a graded distribution of CRABP I in the chick limb bud, with the highest levels in the anterior margin of the limb, thus oppo- site to the putative concentration gradient of total RA, in such a way that the presence of CRABP may result in a steeper gradient of free RA available for binding to RARs. In agreement with this hypothesis, Boylan and Gudas (1991) have reported that overexpression of CRABP I in F9 cells results in reduced RA-induced activation of tran- scription by RARs, suggesting that the amount of RA that reaches the nucleus is decreased. We have previously described the pattern of distribution of CRABP I transcripts in mouse embryos (Dollé et al., 1989b, 1990; Ruberte et al., 1991). To investigate the role 973 Development 115, 973-987 (1992) Printed in Great Britain © The Company of Biologists Limited 1992 We have compared the transcript distribution of cellu- lar retinoic acid binding protein (CRABP) I and II genes in mouse embryos at various stages of development. Both CRABP transcripts are present in embryonic structures from the earliest stages studied and exhibit specific patterns of distribution, suggesting that the two retinoic acid (RA) binding proteins perform different functions during mouse embryogenesis. The CRABP I transcript distribution correlates well with structures known to be targets of excess retinoid-induced terato- genesis (e.g. neural crest cells and hindbrain), suggest- ing that cells expressing CRABP I are those that cannot tolerate high levels of RA for their normal develop- mental function. The embryonic structures expressing CRABP II transcripts include those structures that have been shown to be adversely affected by excess of retinoids, such as limbs and hindbrain, but CRABP II transcripts are also found in structures not known to be specifically vulnerable to raised RA levels. The CRABP II gene is coexpressed with retinoic acid receptor (RAR)- and cellular retinol binding protein (CRBP) I genes in a number of tissues such as the gut endoderm, hypophysis and interdigital mesenchyme, all of which are devoid of CRABP I transcripts. Interestingly, the expression of the three genes, RAR- , CRABP II and CRBP I, is induced by retinoic acid, which suggests a link between the synthesis of RA from retinol and the control of expression of subsets of RA-responsive genes. The transcript distribution of CRABP I and II is dis- cussed in relation to the teratogenic effects of RA, and compared to the RA-sensitive pattern of expression of other important developmental genes. Key words: cellular retinoic acid binding proteins, mouse embryo development, in situ hybridization, mRNA distribution. Summary Differential distribution patterns of CRABP I and CRABP II transcripts during mouse embryogenesis ESTHER RUBERTE 1, †, VALÉRIE FRIEDERICH 1 , GILLIAN MORRISS-KAY 2 and PIERRE CHAMBON 1, * 1 Laboratoire de Génétique Moléculaire des Eucaryotes, CNRS, U. 184 de Biologie Moléculaire et de Génie Génétique, INSERM, Institut de Chimie Biologique, Faculté de Médecine 11, rue Humann, 67085 Strasbourg Cédex, France 2 University of Oxford, Department of Human Anatomy, South Parks Road, Oxford, UK *To whom all correspondence should be addressed †Present address: University of Oxford, Department of Human Anatomy, South Parks Road, Oxford, UK
Transcript of Differential distribution patterns of CRABP I and CRABP II...
Introduction
Vitamin A (retinol) and its active metabolite retinoic acid(RA) play important roles during mammalian morpho-genesis. In mammals retinoids are well known to be potentteratogenic agents in both deficiency and excess (Lammeret al., 1985; Morriss, 1972; Rosa et al., 1986; Shenefelt,1972; Warkany et al., 1943; Wilson et al., 1953). RA exertsits effects by binding to nuclear receptors (RARs) that mod-ulate the transcriptional activity of specific target genes(Benbrook et al., 1988; Brand et al., 1988; Giguère et al.,1987; Krust et al., 1989; Petkovich et al., 1987; Zelent etal., 1989). In addition to the nuclear receptors, there existtwo cytosolic RA binding proteins, the cellular retinoic acidbinding proteins I (CRABP I) and II (CRABP II) (Blomhoffet al., 1990; Giguère et al., 1990; Stoner and Gudas, 1989).The two CRABP proteins are structurally very similar, butthe affinity of CRABP II for RA appears to be lower thanthat of CRABP I (for a review see Chytil and Stump, 1991).It has been proposed that the CRABPs could transport RA
from the cytoplasm to the nucleus where it would be trans-ferred to the nuclear receptors (Takase et al., 1979, 1986).Alternatively, it has been suggested that the role ofCRABPs could be controlling the actual concentration offree RA in a given cell (Boylan and Gudas, 1991; Madenet al., 1988; Robertson, 1987; Ruberte et al., 1991; Smithet al., 1989). Maden et al. (1988) have described a gradeddistribution of CRABP I in the chick limb bud, with thehighest levels in the anterior margin of the limb, thus oppo-site to the putative concentration gradient of total RA, insuch a way that the presence of CRABP may result in asteeper gradient of free RA available for binding to RARs.In agreement with this hypothesis, Boylan and Gudas(1991) have reported that overexpression of CRABP I inF9 cells results in reduced RA-induced activation of tran-scription by RARs, suggesting that the amount of RA thatreaches the nucleus is decreased.
We have previously described the pattern of distributionof CRABP I transcripts in mouse embryos (Dollé et al.,1989b, 1990; Ruberte et al., 1991). To investigate the role
973Development 115, 973-987 (1992)Printed in Great Britain © The Company of Biologists Limited 1992
We have compared the transcript distribution of cellu-lar retinoic acid binding protein (CRABP) I and II genesin mouse embryos at various stages of development.Both CRABP transcripts are present in embryonicstructures from the earliest stages studied and exhibitspecific patterns of distribution, suggesting that the tworetinoic acid (RA) binding proteins perform differentfunctions during mouse embryogenesis. The CRABP Itranscript distribution correlates well with structuresknown to be targets of excess retinoid-induced terato-genesis (e.g. neural crest cells and hindbrain), suggest-ing that cells expressing CRABP I are those that cannottolerate high levels of RA for their normal develop-mental function. The embryonic structures expressingCRABP II transcripts include those structures that havebeen shown to be adversely affected by excess ofretinoids, such as limbs and hindbrain, but CRABP IItranscripts are also found in structures not known to be
specifically vulnerable to raised RA levels. The CRABPII gene is coexpressed with retinoic acid receptor(RAR)- and cellular retinol binding protein (CRBP) Igenes in a number of tissues such as the gut endoderm,hypophysis and interdigital mesenchyme, all of whichare devoid of CRABP I transcripts. Interestingly, theexpression of the three genes, RAR- , CRABP II andCRBP I, is induced by retinoic acid, which suggests alink between the synthesis of RA from retinol and thecontrol of expression of subsets of RA-responsive genes.The transcript distribution of CRABP I and II is dis-cussed in relation to the teratogenic effects of RA, andcompared to the RA-sensitive pattern of expression ofother important developmental genes.
Key words: cellular retinoic acid binding proteins, mouse embryodevelopment, in situ hybridization, mRNA distribution.
Summary
Differential distribution patterns of CRABP I and CRABP II transcripts
during mouse embryogenesis
ESTHER RUBERTE1,†, VALÉRIE FRIEDERICH1, GILLIAN MORRISS-KAY2 and PIERRE CHAMBON1,*
1Laboratoire de Génétique Moléculaire des Eucaryotes, CNRS, U. 184 de Biologie Moléculaire et de Génie Génétique, INSERM, Institut de ChimieBiologique, Faculté de Médecine 11, rue Humann, 67085 Strasbourg Cédex, France 2University of Oxford, Department of Human Anatomy, South Parks Road, Oxford, UK
*To whom all correspondence should be addressed†Present address: University of Oxford, Department of Human Anatomy, South Parks Road, Oxford, UK
974
that the two binding proteins may play in the transductionof the RA signal, we have now compared the transcript dis-tribution of the two CRABPs at different stages of mousedevelopment. Both transcripts are present in embryonicstructures from the earliest stages studied, but they exhibitdifferent patterns of distribution. The results are discussedin relation to RA-induced abnormalities and to the patternsof expression of genes that appear to have an important rolein the transduction of the RA signal during normal devel-opment.
Materials and methods
35S-labelled RNA probes were synthesized using T7-polymerase(according to the suppliers directions, Promega Biotec) from fulllength cDNAs coding for CRABP I (Stoner and Gudas, 1989;Dollé et al., 1989b) and CRABP II (Giguère et al., 1990, a giftof Ph. Kastner) cloned in an antisense orientation into BluescriptSK+ after linearization with EcoRI. Probe length was reduced toan average of 150 nucleotides by limited alkaline hydrolysis, asdescribed by Ruberte et al. (1990).
The distribution of CRABP I and II transcripts was analyzedby in situ hybridization on mouse embryo sections from day 8 to14.5. Brains from 18.5-day foetuses were dissected out fromskulls.
Recovery and paraffin embedding of mouse embryos, in situhybridization, emulsion autoradiography and staining of histolog-ical sections were performed as previously described (Ruberte etal., 1990). The time of autoradiographic exposure was 7 days forthe CRABP I probe and 10-12 days for the CRABP II probe.
Results
At every stage analyzed, consecutive sections werehybridized with CRABP I and II probes in order to com-pare their transcript distribution. CRABP II transcriptsexhibited a wider distribution than CRABP I transcriptsamong the various embryonic tissues; however, within agiven tissue the relative amount of transcripts was in gen-eral higher for the CRABP I gene as reflected by the shortertime of autoradiographic exposure. The CRABP I transcriptdistribution has already been described in detail (Dollé etal., 1989b, 1990; Ruberte et al., 1991) and only some par-ticularly interesting and comparative aspects will be pre-sented here.
CRABP II transcripts at early morphogenetic stagesAt the 5-somite stage (early day 8), CRABP II transcriptswere detected in the neural epithelium at all levels of thecraniocaudal axis (Figs 1A, B and 2A to C). This is in con-trast to the distribution of CRABP I transcripts at this stagewhich were absent from the forebrain (Fig. 2A, C, see alsoRuberte et al., 1991). Only diffuse labelling was observedwith the CRABP II probe in the cranial mesenchyme,whereas a more intense signal was detected in the undif-ferentiated presomitic mesenchyme, where CRABP I tran-scripts were also present (Figs 1A, B and 2A, C, see alsoRuberte et al., 1991).
In 8.5-day embryos, the first pharyngeal arches arepresent. The major mesenchymal component of the pha-
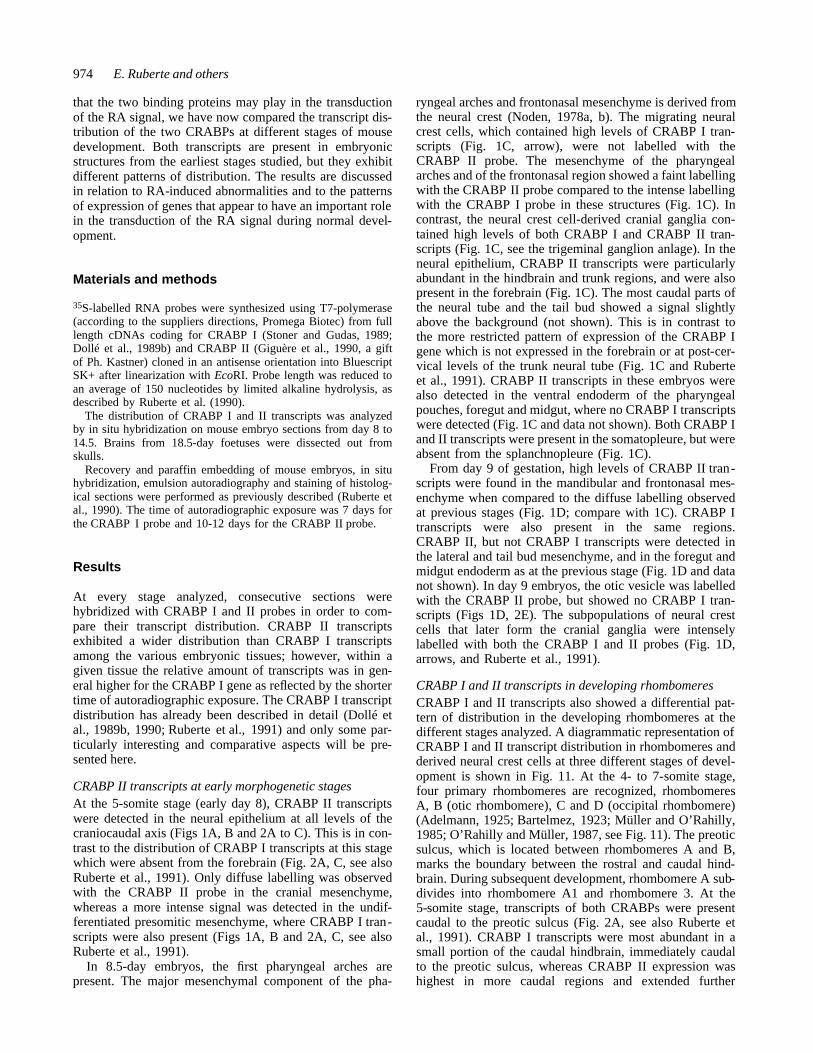
ryngeal arches and frontonasal mesenchyme is derived fromthe neural crest (Noden, 1978a, b). The migrating neuralcrest cells, which contained high levels of CRABP I tran-scripts (Fig. 1C, arrow), were not labelled with theCRABP II probe. The mesenchyme of the pharyngealarches and of the frontonasal region showed a faint labellingwith the CRABP II probe compared to the intense labellingwith the CRABP I probe in these structures (Fig. 1C). Incontrast, the neural crest cell-derived cranial ganglia con-tained high levels of both CRABP I and CRABP II tran-scripts (Fig. 1C, see the trigeminal ganglion anlage). In theneural epithelium, CRABP II transcripts were particularlyabundant in the hindbrain and trunk regions, and were alsopresent in the forebrain (Fig. 1C). The most caudal parts ofthe neural tube and the tail bud showed a signal slightlyabove the background (not shown). This is in contrast tothe more restricted pattern of expression of the CRABP Igene which is not expressed in the forebrain or at post-cer-vical levels of the trunk neural tube (Fig. 1C and Ruberteet al., 1991). CRABP II transcripts in these embryos werealso detected in the ventral endoderm of the pharyngealpouches, foregut and midgut, where no CRABP I transcriptswere detected (Fig. 1C and data not shown). Both CRABP Iand II transcripts were present in the somatopleure, but wereabsent from the splanchnopleure (Fig. 1C).
From day 9 of gestation, high levels of CRABP II tran-scripts were found in the mandibular and frontonasal mes-enchyme when compared to the diffuse labelling observedat previous stages (Fig. 1D; compare with 1C). CRABP Itranscripts were also present in the same regions.CRABP II, but not CRABP I transcripts were detected inthe lateral and tail bud mesenchyme, and in the foregut andmidgut endoderm as at the previous stage (Fig. 1D and datanot shown). In day 9 embryos, the otic vesicle was labelledwith the CRABP II probe, but showed no CRABP I tran-scripts (Figs 1D, 2E). The subpopulations of neural crestcells that later form the cranial ganglia were intenselylabelled with both the CRABP I and II probes (Fig. 1D,arrows, and Ruberte et al., 1991).
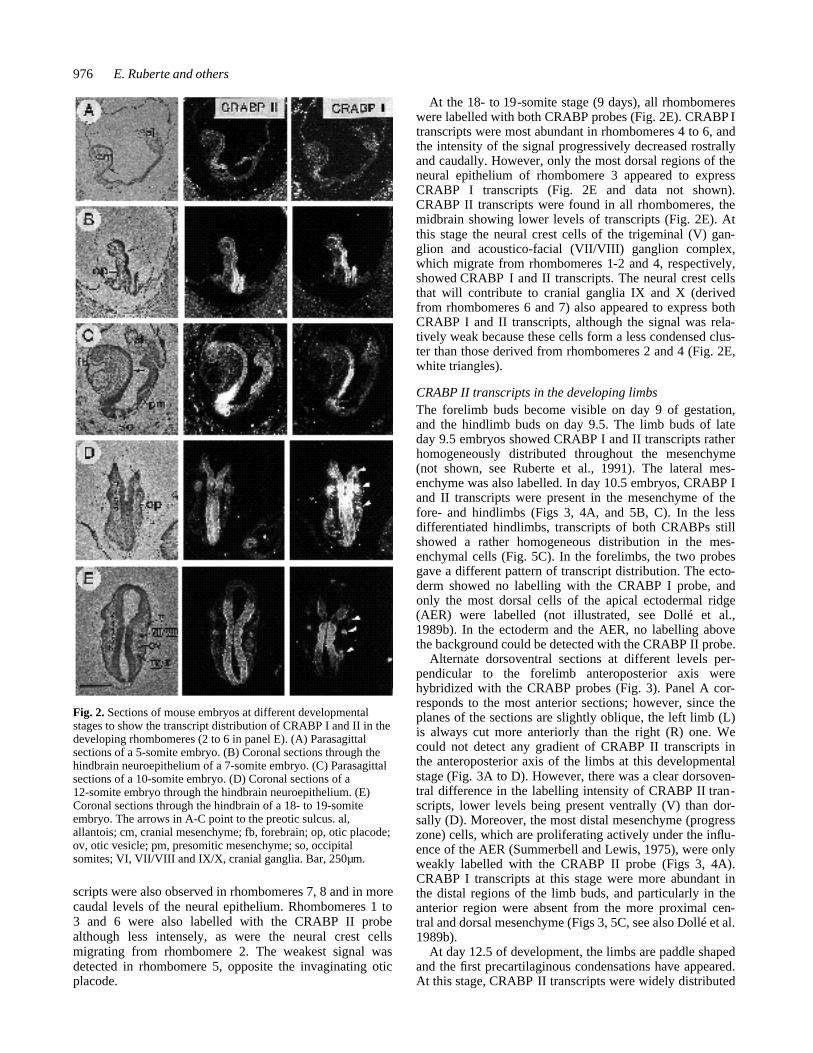
CRABP I and II transcripts in developing rhombomeresCRABP I and II transcripts also showed a differential pat-tern of distribution in the developing rhombomeres at thedifferent stages analyzed. A diagrammatic representation ofCRABP I and II transcript distribution in rhombomeres andderived neural crest cells at three different stages of devel-opment is shown in Fig. 11. At the 4- to 7-somite stage,four primary rhombomeres are recognized, rhombomeresA, B (otic rhombomere), C and D (occipital rhombomere)(Adelmann, 1925; Bartelmez, 1923; Müller and O’Rahilly,1985; O’Rahilly and Müller, 1987, see Fig. 11). The preoticsulcus, which is located between rhombomeres A and B,marks the boundary between the rostral and caudal hind-brain. During subsequent development, rhombomere A sub-divides into rhombomere A1 and rhombomere 3. At the5-somite stage, transcripts of both CRABPs were presentcaudal to the preotic sulcus (Fig. 2A, see also Ruberte etal., 1991). CRABP I transcripts were most abundant in asmall portion of the caudal hindbrain, immediately caudalto the preotic sulcus, whereas CRABP II expression washighest in more caudal regions and extended further
E. Ruberte and others
975CRABPI and II expression in mouse embryos
caudally (Fig. 2A). At the 7- to 10-somite stage, CRABP Itranscripts were found most abundantly expressed in rhom-bomere B (the otic rhombomere), and levels of transcriptsprogressively decreased towards more rostral levels of theneuroepithelium, being lowest in the midbrain and absentfrom the forebrain regions (Fig. 2B and C). Neural crestcells containing high levels of CRABP I transcripts wereseen migrating from levels immediately rostral to the oticplacode (not shown, see Ruberte et al., 1991). A relativelyintense signal was also observed at the basal side of theneuroepithelium rostral to the preotic sulcus (Fig. 2B).CRABP I-labelled neural crest cells were seen migratingfrom neuroepithelium rostral to the preotic sulcus to invadethe first pharyngeal arch (not illustrated, see Ruberte et al.,1991). Caudal to the otic rhombomere, CRABP I transcriptswere found up to the level of the first occipital somites,including undifferentiated epiblast (Fig. 2C, see alsoRuberte et al., 1991). CRABP II expression at 7- to10-somite stage was highest in the neuroepithelium imme-diately caudal to the otic placode (rhombomere C), and incontrast to CRABP I expression, transcripts were presentat all levels in the cranial neuroepithelium, including fore-brain, as well as in levels caudal to the occipital somites(Fig. 2B and C). Only a faint signal was detected in the
migrating neural crest cells (not shown). The otic placodeswere labelled with both probes at these stages (Fig. 2B).
At later stages rhombomere A1 subdivides into rhom-bomeres 1 and 2, rhombomere B gives rise to rhombomeres4 and 5, rhombomere C gives rise to rhombomeres 6 and7, and rhombomere D, which corresponds to the occipitalregion and lies opposite to the first four pairs of somites,is then called rhombomere 8 (Müller and O’Rahilly, 1985;O’Rahilly and Müller, 1987). At the 12- to 14-somite stage,six rhombomeres are easily recognizable in the embryonichindbrain. At this stage, CRABP I was detected in all therhombomeres (Fig. 2D). Rhombomeres 1 to 3 showed thelowest levels of CRABP I transcripts, the levels being high-est in rhombomere 4 from which neural crest cells haveemigrated (Fig. 2D). Rhombomeres 5 and 6 also expressedhigh levels of CRABP I and the intensity of the signal pro-gressively decreased in more caudal levels of the neuralepithelium. Neural crest cells adjacent to rhombomeres 1,2 and 6 to 8 were also observed to express CRABP I tran-scripts (Fig. 2D, white triangles). CRABP II transcripts atthis stage were also abundant, but less than for CRABP I,in rhombomere 4 and its derived neural crest cells (Fig.2D), but not in the crest cells adjacent to rhombomeres 6-8(Fig. 2D, white triangles). High levels of CRABP II tran-
Fig. 1. (A and B) Transversesections through a day-8 embryo(10-somite stage) showing the dis-tribution of CRABP II transcripts atforebrain/midbrain (A) andhindbrain (B) levels. The verybright spots on the right uppercorner of A are due to the refractionof blood cells and are not ahybridization signal. (C)Consecutive transverse sectionsthrough forebrain, hindbrain andtrunk levels of a 8.5-day embryohybridized with the CRABP I andCRABP II probes. Note thedifferences in labelling of themigrating neural crest cells (whitearrows), the pharyngeal arch andfrontonasal mesenchyme, and theforebrain neuroepithelium. (D)Parasagittal section of a day 9embryo. Note the differences in thestaining of the brain vesicles,mandibular arch and otic vesicle.The cranial ganglia are labelledwith both CRABP I and II probes(white and black arrows). am,amnion; cm, cranial mesenchyme;fb, forebrain; fg, foregut; fn,frontonasal mesenchyme; hb,hindbrain; he, heart; md,mandibular arch; me, presomiticmesenchyme; nt, neural tube; ov,otic vesicle; sm, somatopleure; sp,splanchnopleure; tb, tail bud; ys,yolk sac; V, trigeminal ganglion.Bar, 250µm.
976
scripts were also observed in rhombomeres 7, 8 and in morecaudal levels of the neural epithelium. Rhombomeres 1 to3 and 6 were also labelled with the CRABP II probealthough less intensely, as were the neural crest cellsmigrating from rhombomere 2. The weakest signal wasdetected in rhombomere 5, opposite the invaginating oticplacode.
At the 18- to 19-somite stage (9 days), all rhombomereswere labelled with both CRABP probes (Fig. 2E). CRABP Itranscripts were most abundant in rhombomeres 4 to 6, andthe intensity of the signal progressively decreased rostrallyand caudally. However, only the most dorsal regions of theneural epithelium of rhombomere 3 appeared to expressCRABP I transcripts (Fig. 2E and data not shown).CRABP II transcripts were found in all rhombomeres, themidbrain showing lower levels of transcripts (Fig. 2E). Atthis stage the neural crest cells of the trigeminal (V) gan-glion and acoustico-facial (VII/VIII) ganglion complex,which migrate from rhombomeres 1-2 and 4, respectively,showed CRABP I and II transcripts. The neural crest cellsthat will contribute to cranial ganglia IX and X (derivedfrom rhombomeres 6 and 7) also appeared to express bothCRABP I and II transcripts, although the signal was rela-tively weak because these cells form a less condensed clus-ter than those derived from rhombomeres 2 and 4 (Fig. 2E,white triangles).
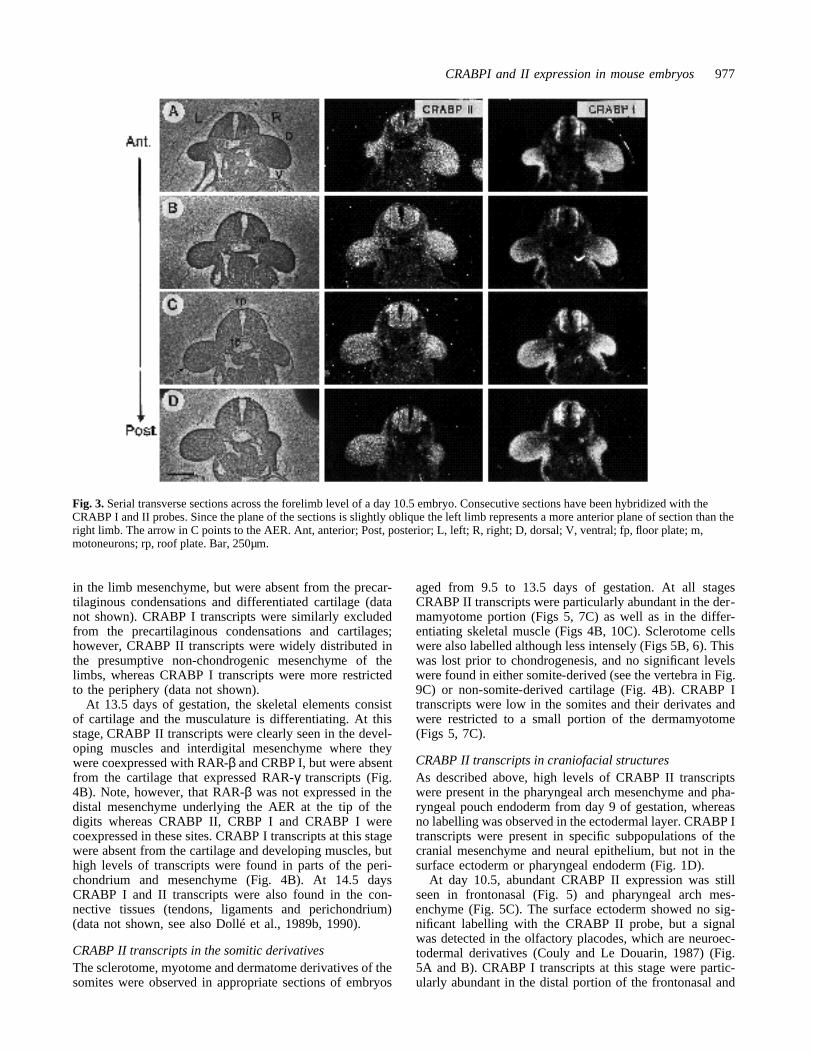
CRABP II transcripts in the developing limbsThe forelimb buds become visible on day 9 of gestation,and the hindlimb buds on day 9.5. The limb buds of lateday 9.5 embryos showed CRABP I and II transcripts ratherhomogeneously distributed throughout the mesenchyme(not shown, see Ruberte et al., 1991). The lateral mes-enchyme was also labelled. In day 10.5 embryos, CRABP Iand II transcripts were present in the mesenchyme of thefore- and hindlimbs (Figs 3, 4A, and 5B, C). In the lessdifferentiated hindlimbs, transcripts of both CRABPs stillshowed a rather homogeneous distribution in the mes-enchymal cells (Fig. 5C). In the forelimbs, the two probesgave a different pattern of transcript distribution. The ecto-derm showed no labelling with the CRABP I probe, andonly the most dorsal cells of the apical ectodermal ridge(AER) were labelled (not illustrated, see Dollé et al.,1989b). In the ectoderm and the AER, no labelling abovethe background could be detected with the CRABP II probe.
Alternate dorsoventral sections at different levels per-pendicular to the forelimb anteroposterior axis werehybridized with the CRABP probes (Fig. 3). Panel A cor-responds to the most anterior sections; however, since theplanes of the sections are slightly oblique, the left limb (L)is always cut more anteriorly than the right (R) one. Wecould not detect any gradient of CRABP II transcripts inthe anteroposterior axis of the limbs at this developmentalstage (Fig. 3A to D). However, there was a clear dorsoven-tral difference in the labelling intensity of CRABP II tran-scripts, lower levels being present ventrally (V) than dor-sally (D). Moreover, the most distal mesenchyme (progresszone) cells, which are proliferating actively under the influ-ence of the AER (Summerbell and Lewis, 1975), were onlyweakly labelled with the CRABP II probe (Figs 3, 4A).CRABP I transcripts at this stage were more abundant inthe distal regions of the limb buds, and particularly in theanterior region were absent from the more proximal cen-tral and dorsal mesenchyme (Figs 3, 5C, see also Dollé et al.1989b).
At day 12.5 of development, the limbs are paddle shapedand the first precartilaginous condensations have appeared.At this stage, CRABP II transcripts were widely distributed
E. Ruberte and others
Fig. 2. Sections of mouse embryos at different developmentalstages to show the transcript distribution of CRABP I and II in thedeveloping rhombomeres (2 to 6 in panel E). (A) Parasagittalsections of a 5-somite embryo. (B) Coronal sections through thehindbrain neuroepithelium of a 7-somite embryo. (C) Parasagittalsections of a 10-somite embryo. (D) Coronal sections of a12-somite embryo through the hindbrain neuroepithelium. (E)Coronal sections through the hindbrain of a 18- to 19-somiteembryo. The arrows in A-C point to the preotic sulcus. al,allantois; cm, cranial mesenchyme; fb, forebrain; op, otic placode;ov, otic vesicle; pm, presomitic mesenchyme; so, occipitalsomites; VI, VII/VIII and IX/X, cranial ganglia. Bar, 250µm.
977CRABPI and II expression in mouse embryos
in the limb mesenchyme, but were absent from the precar-tilaginous condensations and differentiated cartilage (datanot shown). CRABP I transcripts were similarly excludedfrom the precartilaginous condensations and cartilages;however, CRABP II transcripts were widely distributed inthe presumptive non-chondrogenic mesenchyme of thelimbs, whereas CRABP I transcripts were more restrictedto the periphery (data not shown).
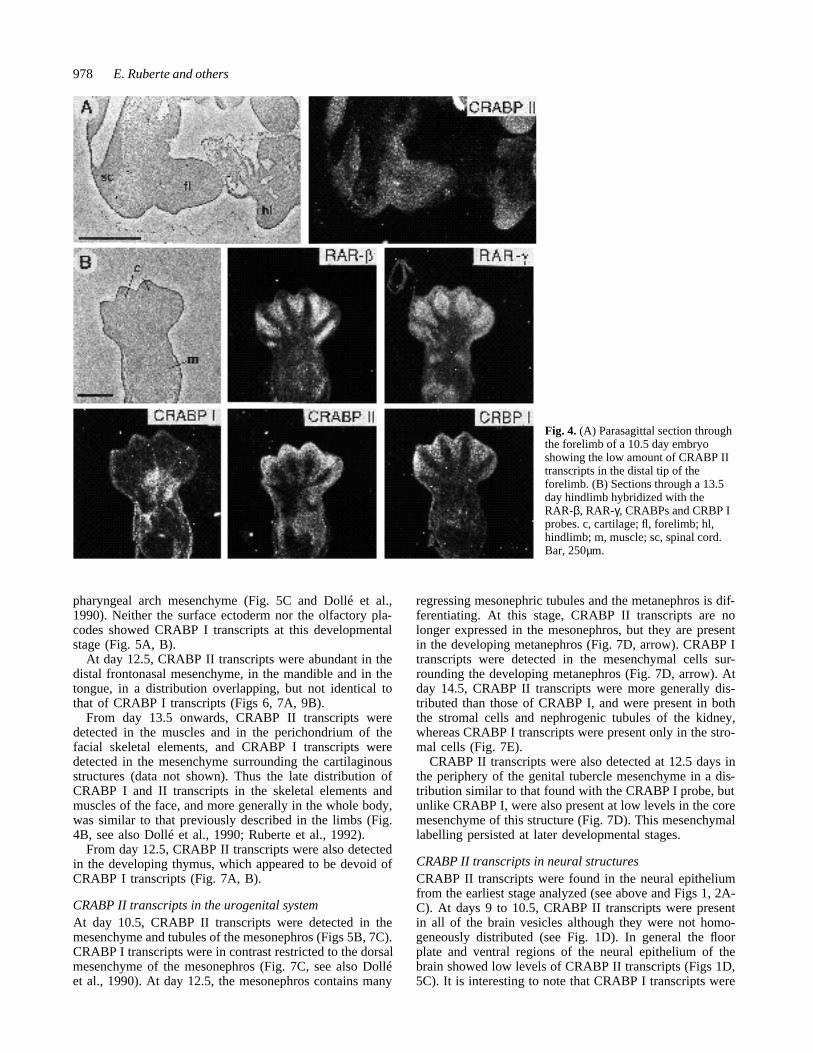
At 13.5 days of gestation, the skeletal elements consistof cartilage and the musculature is differentiating. At thisstage, CRABP II transcripts were clearly seen in the devel-oping muscles and interdigital mesenchyme where theywere coexpressed with RAR-β and CRBP I, but were absentfrom the cartilage that expressed RAR-γ transcripts (Fig.4B). Note, however, that RAR-β was not expressed in thedistal mesenchyme underlying the AER at the tip of thedigits whereas CRABP II, CRBP I and CRABP I werecoexpressed in these sites. CRABP I transcripts at this stagewere absent from the cartilage and developing muscles, buthigh levels of transcripts were found in parts of the peri-chondrium and mesenchyme (Fig. 4B). At 14.5 daysCRABP I and II transcripts were also found in the con-nective tissues (tendons, ligaments and perichondrium)(data not shown, see also Dollé et al., 1989b, 1990).
CRABP II transcripts in the somitic derivativesThe sclerotome, myotome and dermatome derivatives of thesomites were observed in appropriate sections of embryos
aged from 9.5 to 13.5 days of gestation. At all stagesCRABP II transcripts were particularly abundant in the der-mamyotome portion (Figs 5, 7C) as well as in the differ-entiating skeletal muscle (Figs 4B, 10C). Sclerotome cellswere also labelled although less intensely (Figs 5B, 6). Thiswas lost prior to chondrogenesis, and no significant levelswere found in either somite-derived (see the vertebra in Fig.9C) or non-somite-derived cartilage (Fig. 4B). CRABP Itranscripts were low in the somites and their derivates andwere restricted to a small portion of the dermamyotome(Figs 5, 7C).
CRABP II transcripts in craniofacial structuresAs described above, high levels of CRABP II transcriptswere present in the pharyngeal arch mesenchyme and pha-ryngeal pouch endoderm from day 9 of gestation, whereasno labelling was observed in the ectodermal layer. CRABP Itranscripts were present in specific subpopulations of thecranial mesenchyme and neural epithelium, but not in thesurface ectoderm or pharyngeal endoderm (Fig. 1D).
At day 10.5, abundant CRABP II expression was stillseen in frontonasal (Fig. 5) and pharyngeal arch mes-enchyme (Fig. 5C). The surface ectoderm showed no sig-nificant labelling with the CRABP II probe, but a signalwas detected in the olfactory placodes, which are neuroec-todermal derivatives (Couly and Le Douarin, 1987) (Fig.5A and B). CRABP I transcripts at this stage were partic-ularly abundant in the distal portion of the frontonasal and
Fig. 3. Serial transverse sections across the forelimb level of a day 10.5 embryo. Consecutive sections have been hybridized with theCRABP I and II probes. Since the plane of the sections is slightly oblique the left limb represents a more anterior plane of section than theright limb. The arrow in C points to the AER. Ant, anterior; Post, posterior; L, left; R, right; D, dorsal; V, ventral; fp, floor plate; m,motoneurons; rp, roof plate. Bar, 250µm.
978
pharyngeal arch mesenchyme (Fig. 5C and Dollé et al.,1990). Neither the surface ectoderm nor the olfactory pla-codes showed CRABP I transcripts at this developmentalstage (Fig. 5A, B).
At day 12.5, CRABP II transcripts were abundant in thedistal frontonasal mesenchyme, in the mandible and in thetongue, in a distribution overlapping, but not identical tothat of CRABP I transcripts (Figs 6, 7A, 9B).
From day 13.5 onwards, CRABP II transcripts weredetected in the muscles and in the perichondrium of thefacial skeletal elements, and CRABP I transcripts weredetected in the mesenchyme surrounding the cartilaginousstructures (data not shown). Thus the late distribution ofCRABP I and II transcripts in the skeletal elements andmuscles of the face, and more generally in the whole body,was similar to that previously described in the limbs (Fig.4B, see also Dollé et al., 1990; Ruberte et al., 1992).
From day 12.5, CRABP II transcripts were also detectedin the developing thymus, which appeared to be devoid ofCRABP I transcripts (Fig. 7A, B).
CRABP II transcripts in the urogenital systemAt day 10.5, CRABP II transcripts were detected in themesenchyme and tubules of the mesonephros (Figs 5B, 7C).CRABP I transcripts were in contrast restricted to the dorsalmesenchyme of the mesonephros (Fig. 7C, see also Dolléet al., 1990). At day 12.5, the mesonephros contains many
regressing mesonephric tubules and the metanephros is dif-ferentiating. At this stage, CRABP II transcripts are nolonger expressed in the mesonephros, but they are presentin the developing metanephros (Fig. 7D, arrow). CRABP Itranscripts were detected in the mesenchymal cells sur-rounding the developing metanephros (Fig. 7D, arrow). Atday 14.5, CRABP II transcripts were more generally dis-tributed than those of CRABP I, and were present in boththe stromal cells and nephrogenic tubules of the kidney,whereas CRABP I transcripts were present only in the stro-mal cells (Fig. 7E).
CRABP II transcripts were also detected at 12.5 days inthe periphery of the genital tubercle mesenchyme in a dis-tribution similar to that found with the CRABP I probe, butunlike CRABP I, were also present at low levels in the coremesenchyme of this structure (Fig. 7D). This mesenchymallabelling persisted at later developmental stages.
CRABP II transcripts in neural structuresCRABP II transcripts were found in the neural epitheliumfrom the earliest stage analyzed (see above and Figs 1, 2A-C). At days 9 to 10.5, CRABP II transcripts were presentin all of the brain vesicles although they were not homo-geneously distributed (see Fig. 1D). In general the floorplate and ventral regions of the neural epithelium of thebrain showed low levels of CRABP II transcripts (Figs 1D,5C). It is interesting to note that CRABP I transcripts were
E. Ruberte and others
Fig. 4. (A) Parasagittal section throughthe forelimb of a 10.5 day embryoshowing the low amount of CRABP IItranscripts in the distal tip of theforelimb. (B) Sections through a 13.5day hindlimb hybridized with theRAR-β, RAR-γ, CRABPs and CRBP Iprobes. c, cartilage; fl, forelimb; hl,hindlimb; m, muscle; sc, spinal cord.Bar, 250µm.

979CRABPI and II expression in mouse embryos
absent from the telencephalon and diencephalon at thesedevelopmental stages (Fig. 5A, B), and no transcripts weredetected in the floor and roof plates of the neural tube (Figs3, 5). As at previous stages, CRABP I transcripts wereabsent from the forebrain, and labelling of the mesen-cephalon was restricted to the outermost cells (Fig. 5A, B).
At days 12.5 and 13.5, CRABP II transcripts were widelydistributed in the brain, but several regions showed a par-ticularly intense signal (Figs 6, 7A, 9B). CRABP II tran-scripts were present in the telencephalic regions (Figs 6,9B) and around the optic stalk (Fig. 6). The lateral wallsand the mantle layer of the diencephalon were also labelled(data not shown). Homogeneous labelling was observed in
the mesencephalon with the CRABP II probe, whereas onlythe outermost cells appeared to contain CRABP I transcripts(Fig. 6). In the metencephalon and myelencephalon, thecells in the mantle layer were more intensely labelled withthe CRABP II probe than those of the neuroepithelial andmarginal layers, and also showed some labelling with theCRABP I probe (Figs 6, 7A and data not shown). At 13.5days, CRABP I transcripts were also detected in the stria-tum where no CRABP II transcripts were found (data notshown).
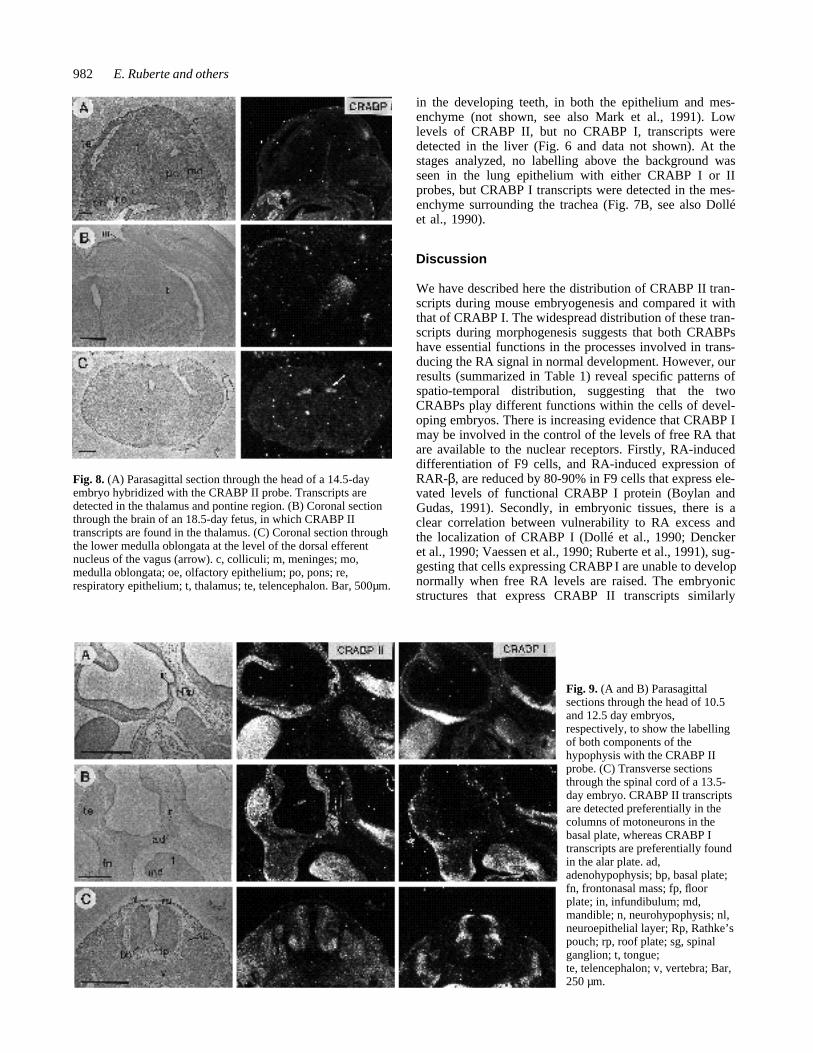
From 14.5 days, CRABP II transcripts were detected inthe cerebral hemispheres, in the thalamus (Fig. 8A, B), inthe motor nuclei of the trigeminal and facial nerves, in the
Fig. 5. Serial frontal sections through a 10.5-day embryo. Consecutive sections have beenhybridized with the CRABP I and II probes.(A and B) The myotomic portions of thesomites are more intensely labelled with bothCRABP probes (arrowheads). Note that onlyCRABP II transcripts are detected in theforebrain and in the olfactory placodes. (Band C) These sections show the differentialintensity of the signal between the ventraland dorsal portions of the forelimb buds withthe CRABP II probe, compared with themore homogeneous distribution of transcriptsin the less differentiated hindlimb buds, andthe different pattern of transcript distributionof the CRABP I gene. di, diencephalon; fl,forelimb; fn, frontonasal mesenchyme; he,heart; hl, hindlimb; lm, lateral mesenchyme;md, mandibular arch; ml, mantle layer; mn,mesonephros; ms, mesencephalon; mt,metencephalon; nt, neural tube; olp,olfactory placode; sg, spinal ganglia; so,somite; st, stomach; te, telencephalon; V,trigeminal ganglion. Bar, 500µm.
980
pontine region (Fig. 8A and data not shown) and in thedorsal efferent nucleus of the vagus nerve (Fig. 8C).CRABP I transcripts were detected in the striatum, hip-pocampus, medulla oblongata and pons (not shown).
In the spinal cord, CRABP II transcripts were first homo-geneously distributed in the trunk neural tube (Fig. 1C).After differentiation into basal (motor) and alar (sensory)plates, the transcript distribution became more restricted. Atday 10.5, slightly higher levels of CRABP II transcriptswere detected in the presumptive motor columns whencompared to the rest of the neural tube (Fig. 3 and data notshown). CRABP I transcript distribution was morerestricted and transcripts were preferentially found in themarginal and mantle layers (Figs 3, 5). At day 13.5,CRABP II transcripts were detected in the presumptivemotor columns of the basal plate and in the newly formedneuroblasts in the alar plate. CRABP I transcripts, in con-trast, were preferentially expressed in the alar plate of thespinal cord (Fig. 9C). The neuroepithelial layer and the floorand roof plates showed neither CRABP II nor CRABP Itranscripts at this stage (Fig. 9C).
CRABP II transcripts were detected in the cranial andspinal ganglia at every stage analysed (e.g. Figs 1, 5, 6,9C). The cranial ganglia also showed CRABP I transcriptsthroughout this period (Fig 1C, D, and 2E), but, in contrast,the spinal ganglia were labelled from their appearance untilday 11.5 (see Figs 5, 7C, compare to Figs 6, 9C) and thenagain at day 14.5 (data not shown).
CRABP II, but not CRABP I, transcripts were detectedin the meninges covering the brainstem from day 14.5 ofgestation (Fig. 8B).
CRABP II transcripts in the hypophysisFrom day 12, the anterior hypophysis (adenohypophysis)develops from Rathke’s pouch, a dorsal diverticulum of thestomodeal ectoderm, whereas the posterior lobe (neurohy-pophysis) is derived from the infundibulum of the hypo-thalamus. CRABP II, but not CRABP I, transcripts weredetected in 10.5 day embryos in both Rathke’s pouch and
in the infundibulum (Fig. 9A). In older embryos, CRABP IItranscripts were detected in both neural and endocrine com-ponents of the hypophysis at every developmental stageanalyzed, whereas no CRABP I transcripts were detectedin this structure at any stage (Fig. 9B).
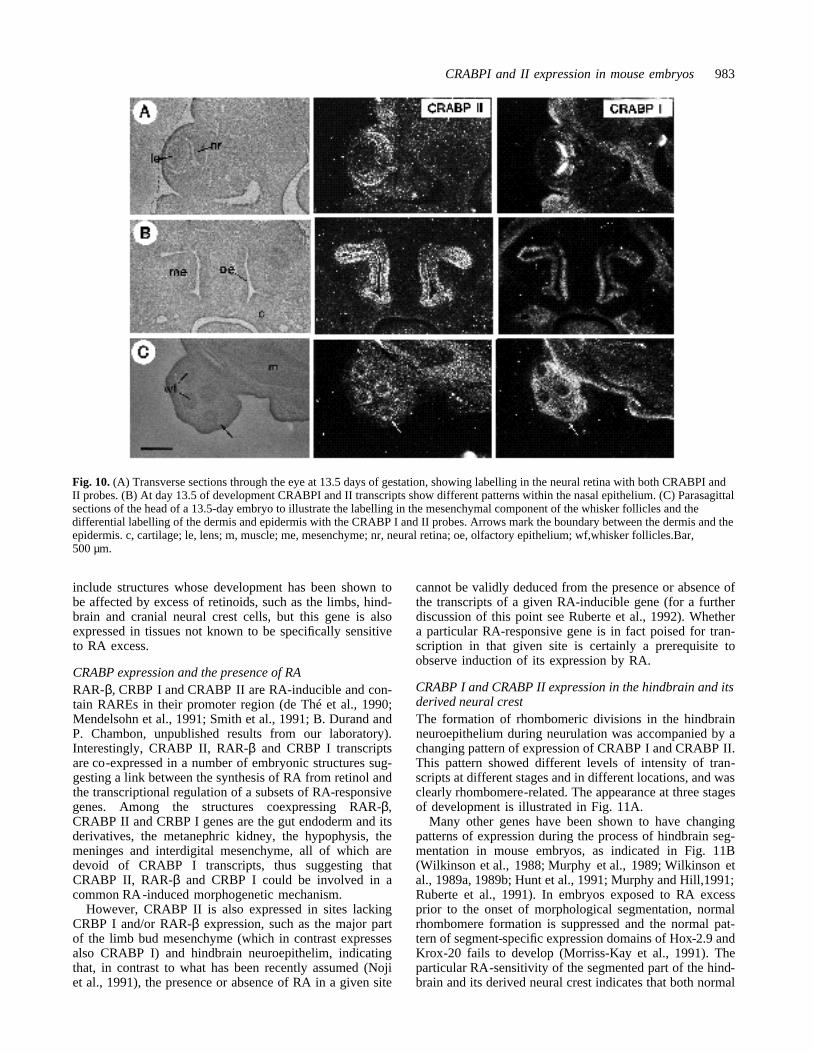
CRABP II transcripts in developing sense organsAt day 9.5, only CRABP II transcripts were detected in theoptic vesicles (data not shown). At later stages of devel-opment, labelling with both CRABP I and II probes wasseen in the neural retina; however, CRABP I transcriptswere restricted to the central area of the retina, whereasCRABP II transcripts were homogeneously distributed (Fig.10A).
The olfactory placodes showed CRABP II, but notCRABP I, transcripts from day 10.5 of development (Fig.5A, B). At later stages (days 13.5 and 14.5), both the olfac-tory (oe) and respiratory (re) epithelia still showed abun-dant CRABP II transcripts (Figs 8A, 10B), whereasCRABP I transcripts were restricted to the olfactory epithe-lium (Fig. 10B and data not shown, see Dollé et al., 1990).However, the distribution of CRABP I and II transcripts inthe olfactory epithelium was different. CRABP II tran-scripts were detected in both the apical and basal layers ofthe epithelium, while CRABP I transcripts were preferen-tially expressed in the middle layer (Fig. 10B). Such a dif-ferential labelling could reflect a cell type-specificexpression, since at this developmental stage the nuclei ofthe developing olfactory receptor cells are located medially,while the apical and basal cells are stem cells (Cuschieriand Bannister, 1975).
The internal ear develops from the surfaceectoderm-derived otic vesicle or otocyst. CRABP II tran-scripts were detected in the otocyst from day 9 of devel-opment (Fig. 1D). At 13.5 and 14.5 days, transcripts weredetected in the inner ear sensory epithelium (data notshown). CRABP I transcripts were transiently expressed inthe otic placodes at day 8 of gestation, but no CRABP Itranscripts were detected in the otocyst or otocyst-derived
E. Ruberte and others
Fig. 6. Parasagittal sections of a 12.5-day embryo. All the brain vesicles and the spinal cord show CRABP II transcripts, whereasCRABP I transcripts are absent from the telencephalon and diencephalon. Labelling is also seen in the spinal ganglia with the CRABPIIprobe. CRABP I and II transcripts are detected in the genital tubercle as well as in the developing metanephros. Diffuse labelling with theCRABP II probe is detected in the liver. gt, genital tubercle; li, liver; m, metanephros; ms, mesencephalon; mt, metencephalon; my,myelencephalon; os, optic stalk; s, sclerotomes; sc, spinal cord; sg, spinal ganglia; t, tongue; te, telencephalon. Bar, 1mm.

981CRABPI and II expression in mouse embryos
structures in subsequent stages of development (see alsoDollé et al., 1990).
Other sites of CRABP II expressionCRABP II transcripts were also detected in the dermal com-ponent of the whisker follicles from day 13.5 as well as indermal component of the skin, which also containedCRABP I transcripts (Fig. 10C, in which the arrows indi-cate the boundary between the dermis and the epidermis;see also Dollé et al., 1989b, 1990). No CRABP I or II tran-scripts were seen in the epidermis (Fig.10C and data notshown).
As indicated above, CRABP II transcripts were presentin the foregut endoderm from day 8.5 of development (Fig.1C). From day 10.5 of development a faint signal wasdetected in the epithelium of the developing stomach (Fig.5C). Transcripts in the oesophagus (Fig. 7B) and in thestomach epithelium (data not shown) were still found at day13.5 of development. The gut epithelium showed noCRABP transcripts at any stage analyzed (Fig. 7D and datanot shown); in contrast, CRABP I, but not CRABP II,labelling was observed in the mesenchyme of the stomachclose to the dorsal mesentery from day 10.5 of gestation(Fig. 5C). CRABP I and II transcripts were also detected
Fig. 7. (A) Parasagittal sections through the head of a 12.5-day embryo to show the signal in the developing thymus with the CRABPIIprobe. (B) Transverse sections through the thymus of a 13.5-day embryo; only CRABP II transcripts are present. The epithelium of theoesophagus is also labelled with the CRABPII probe, while CRABP I labelling is present in the tracheal mesenchyme. (C) Transversesections through the nephrotomic region of a 10.5-day embryo. Whereas CRABPII transcripts are detected widely distributed in themesenchyme and tubules of the mesonephros, CRABPI transcripts are more restricted to the dorsal mesonephric mesenchyme. (D)Parasagittal sections through the developing metanephros at day 12.5 of gestation. The mesonephros is no longer labelled, whereasCRABP II transcripts are now abundant in the metanephric kidney (arrow). Note also the labelling in the periphery of the genital tuberclemesenchyme with both CRABP I and II probes. (E) Sections through the metanephric kidney of a 14.5-day embryo. e, oesophagus; gt,genital tubercle; in, intestine; lm, lateral mesenchyme; md, mandible; mn, mesonephros; ms, mesencephalon; mt, metanephros; ne, nasalepithelium; sc, spinal cord; sg, spinal ganglia; sr, suprarenal gland; t, tongue; te, telencephalon; th, thymus; tr, trachea. Bar, 250µm.
982
in the developing teeth, in both the epithelium and mes-enchyme (not shown, see also Mark et al., 1991). Lowlevels of CRABP II, but no CRABP I, transcripts weredetected in the liver (Fig. 6 and data not shown). At thestages analyzed, no labelling above the background wasseen in the lung epithelium with either CRABP I or IIprobes, but CRABP I transcripts were detected in the mes-enchyme surrounding the trachea (Fig. 7B, see also Dolléet al., 1990).
Discussion
We have described here the distribution of CRABP II tran-scripts during mouse embryogenesis and compared it withthat of CRABP I. The widespread distribution of these tran-scripts during morphogenesis suggests that both CRABPshave essential functions in the processes involved in trans-ducing the RA signal in normal development. However, ourresults (summarized in Table 1) reveal specific patterns ofspatio-temporal distribution, suggesting that the twoCRABPs play different functions within the cells of devel-oping embryos. There is increasing evidence that CRABP Imay be involved in the control of the levels of free RA thatare available to the nuclear receptors. Firstly, RA-induceddifferentiation of F9 cells, and RA-induced expression ofRAR-β, are reduced by 80-90% in F9 cells that express ele-vated levels of functional CRABP I protein (Boylan andGudas, 1991). Secondly, in embryonic tissues, there is aclear correlation between vulnerability to RA excess andthe localization of CRABP I (Dollé et al., 1990; Denckeret al., 1990; Vaessen et al., 1990; Ruberte et al., 1991), sug-gesting that cells expressing CRABP I are unable to developnormally when free RA levels are raised. The embryonicstructures that express CRABP II transcripts similarly
E. Ruberte and others
Fig. 8. (A) Parasagittal section through the head of a 14.5-dayembryo hybridized with the CRABP II probe. Transcripts aredetected in the thalamus and pontine region. (B) Coronal sectionthrough the brain of an 18.5-day fetus, in which CRABP IItranscripts are found in the thalamus. (C) Coronal section throughthe lower medulla oblongata at the level of the dorsal efferentnucleus of the vagus (arrow). c, colliculi; m, meninges; mo,medulla oblongata; oe, olfactory epithelium; po, pons; re,respiratory epithelium; t, thalamus; te, telencephalon. Bar, 500µm.
Fig. 9. (A and B) Parasagittalsections through the head of 10.5and 12.5 day embryos,respectively, to show the labellingof both components of thehypophysis with the CRABP IIprobe. (C) Transverse sectionsthrough the spinal cord of a 13.5-day embryo. CRABP II transcriptsare detected preferentially in thecolumns of motoneurons in thebasal plate, whereas CRABP Itranscripts are preferentially foundin the alar plate. ad,adenohypophysis; bp, basal plate;fn, frontonasal mass; fp, floorplate; in, infundibulum; md,mandible; n, neurohypophysis; nl,neuroepithelial layer; Rp, Rathke’spouch; rp, roof plate; sg, spinalganglion; t, tongue;te, telencephalon; v, vertebra; Bar,250 µm.
983CRABPI and II expression in mouse embryos
include structures whose development has been shown tobe affected by excess of retinoids, such as the limbs, hind-brain and cranial neural crest cells, but this gene is alsoexpressed in tissues not known to be specifically sensitiveto RA excess.
CRABP expression and the presence of RARAR-β, CRBP I and CRABP II are RA-inducible and con-tain RAREs in their promoter region (de Thé et al., 1990;Mendelsohn et al., 1991; Smith et al., 1991; B. Durand andP. Chambon, unpublished results from our laboratory).Interestingly, CRABP II, RAR-β and CRBP I transcriptsare co-expressed in a number of embryonic structures sug-gesting a link between the synthesis of RA from retinol andthe transcriptional regulation of a subsets of RA-responsivegenes. Among the structures coexpressing RAR-β,CRABP II and CRBP I genes are the gut endoderm and itsderivatives, the metanephric kidney, the hypophysis, themeninges and interdigital mesenchyme, all of which aredevoid of CRABP I transcripts, thus suggesting thatCRABP II, RAR-β and CRBP I could be involved in acommon RA-induced morphogenetic mechanism.
However, CRABP II is also expressed in sites lackingCRBP I and/or RAR-β expression, such as the major partof the limb bud mesenchyme (which in contrast expressesalso CRABP I) and hindbrain neuroepithelim, indicatingthat, in contrast to what has been recently assumed (Nojiet al., 1991), the presence or absence of RA in a given site
cannot be validly deduced from the presence or absence ofthe transcripts of a given RA-inducible gene (for a furtherdiscussion of this point see Ruberte et al., 1992). Whethera particular RA-responsive gene is in fact poised for tran-scription in that given site is certainly a prerequisite toobserve induction of its expression by RA.
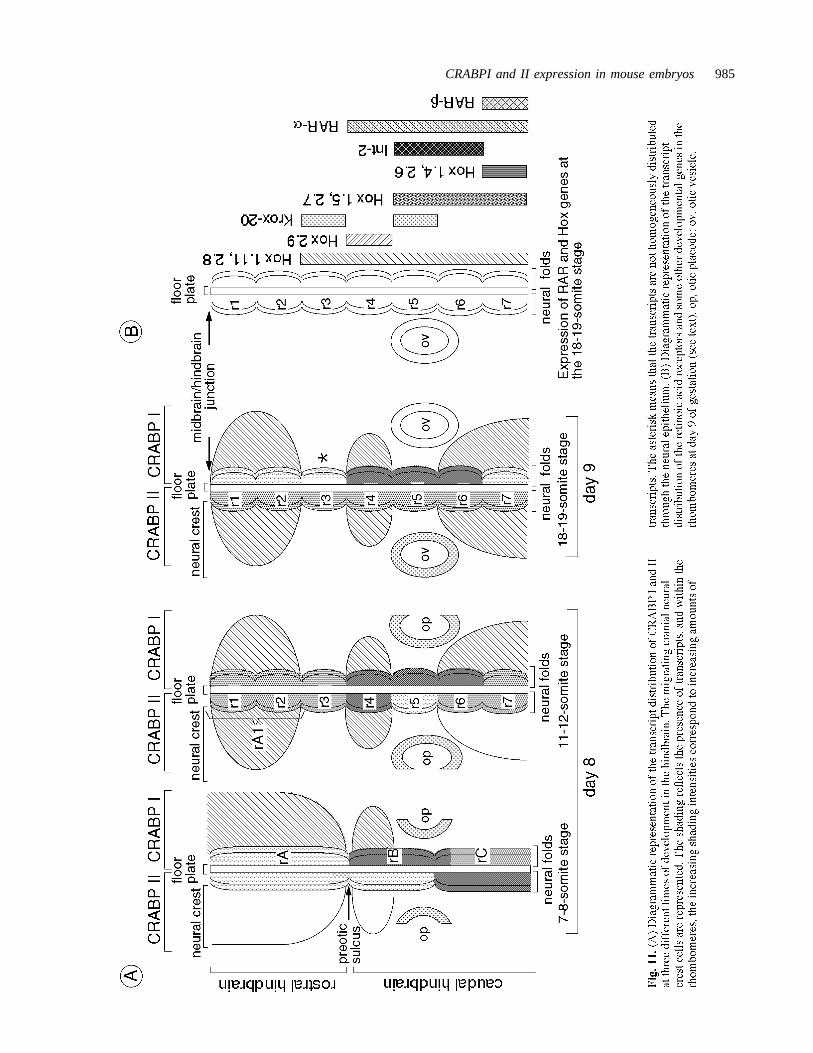
CRABP I and CRABP II expression in the hindbrain and itsderived neural crestThe formation of rhombomeric divisions in the hindbrainneuroepithelium during neurulation was accompanied by achanging pattern of expression of CRABP I and CRABP II.This pattern showed different levels of intensity of tran-scripts at different stages and in different locations, and wasclearly rhombomere-related. The appearance at three stagesof development is illustrated in Fig. 11A.
Many other genes have been shown to have changingpatterns of expression during the process of hindbrain seg-mentation in mouse embryos, as indicated in Fig. 11B(Wilkinson et al., 1988; Murphy et al., 1989; Wilkinson etal., 1989a, 1989b; Hunt et al., 1991; Murphy and Hill,1991;Ruberte et al., 1991). In embryos exposed to RA excessprior to the onset of morphological segmentation, normalrhombomere formation is suppressed and the normal pat-tern of segment-specific expression domains of Hox-2.9 andKrox-20 fails to develop (Morriss-Kay et al., 1991). Theparticular RA-sensitivity of the segmented part of the hind-brain and its derived neural crest indicates that both normal
Fig. 10. (A) Transverse sections through the eye at 13.5 days of gestation, showing labelling in the neural retina with both CRABPI andII probes. (B) At day 13.5 of development CRABPI and II transcripts show different patterns within the nasal epithelium. (C) Parasagittalsections of the head of a 13.5-day embryo to illustrate the labelling in the mesenchymal component of the whisker follicles and thedifferential labelling of the dermis and epidermis with the CRABP I and II probes. Arrows mark the boundary between the dermis and theepidermis. c, cartilage; le, lens; m, muscle; me, mesenchyme; nr, neural retina; oe, olfactory epithelium; wf,whisker follicles.Bar,500 µm.
984
rhombomere formation and the normal pattern of segmen-tal gene expression in this region depend on restriction ofthe access of free RA to the nuclear receptors. We havealready proposed that RA binding to CRABP I is involvedin this regulation (Dollé et al., 1990; Ruberte et al., 1991).The present observations, and those previously reported forthe hindbrain domain of expression of CRABP I (Ruberteet al., 1991), indicate that CRABP I is expressed in appro-priate positions and at appropriate stages in order to playthis role. Furthermore, the present observations stronglysuggest that CRABP II is also involved in the process ofhindbrain segmentation, since it is expressed in a changingsegment-related pattern. Both CRABPs continue to beexpressed in a segment-related pattern when rhombomereformation is complete, so may be important for the main-tenance of segmentation.
The differential pattern of CRABP transcription in thehindbrain is also relevant to rhombomere-specific contri-butions to the neural crest. In mammalian embryos, cranialneural crest cell migration begins at the prerhombomerestage when the neural cranial folds are widely open andconvex in form (Müller and O’Rahilly, 1985; Nichols,
1981; Tan and Morriss-Kay, 1986). These early crest cells,which migrate into the pharyngeal arches (Tan and Mor-riss-Kay, 1986), show strong labelling with the CRABP Iprobe, but are only faintly labelled for CRABP II. After theformation of rhombomeres, a second population of crestcells emigrates to form the cranial ganglia; unlike the mes-enchymal cells, the preganglionic crest cells show highlevels of both CRABP I and II transcripts. They emigratefrom the hindbrain neuroepithelium in a rostrocaudalsequence as three populations separated by rhombomeres 3and 5, from which crest cells do not migrate (except per-haps for a small Krox-20-expressing group from the caudaledge of rhombomere 5; see Morriss-Kay et al., 1991). It istherefore interesting to note that the lowest level ofexpression of CRABP I is in rhombomere 3 (18-19 somitestage), while that of CRABP II is in rhombomere 5 (11-12somite stage). It is also noteworthy that rhombomere 4,which displays the highest levels of CRABP I and II tran-scripts, is the site of origin of the cranial facial (VII) nerve,the development of which is adversely affected by an excessof retinoids, both in human (Lammer et al., 1985) andmouse (unpublished results from our laboratory).
CRABP I and II in the limbsRA appears to play an important role in vertebrate limbmorphogenesis. Two mechanisms of action have beensuggested: according to the first one, RA is released by thezone of polarizing activity (ZPA) and acts as a diffusiblemorphogen conferring positional values through the antero-posterior axis of the limb; alternatively, RA may act as alocal inducer of the morphogen (for references and areview, see Tabin, 1991; Brockes, 1991).
We have studied the distribution of CRABP I and II tran-scripts in serial sections of the developing limbs and foundthat they are not homogeneously distributed through thelimb bud mesenchyme. At day 10.5, CRABP I transcriptsare more abundant in the posterior region, and almost absentfrom the proximal dorsal anterior region, whereasCRABP II transcripts appear more abundant in the dorsalthan in the ventral part of the limb mesenchyme. Moreoverthe rapidly proliferating cells located at the tip of the limbbuds (progress zone, Summerbell and Lewis, 1975), whichcontain high levels of CRABP I transcripts (see also Dolléet al., 1989b), show only a weak signal with the CRABP IIprobe. If the role of these binding proteins is, as has beensuggested, to control the levels of RA available to bind tothe nuclear receptors, it is interesting to note that the over-lapping of the two patterns of transcript distribution wouldnot result in a gradient of free retinoic acid, but in a com-plicated pattern of local RA levels along the three axes ofthe limb bud. Interpretation of the roles of the two RA bind-ing proteins in the progress zone is further complicated bythe observation that their relative labelling intensities arereversed by day 13.5.
Homeogenes are likely candidates for the interpretationof RA signals in the limb, since at least some homeogeneshave been shown to respond to RA both in cultured ECcells in vitro (Mavilio et al., 1988; Simeone et al., 1990,1991; Papalopulu et al., 1991) and in vivo (Izpisúa-Bel-monte et al., 1991; Nohno et al., 1991). A number of Hox-4 genes have a uniquely restricted expression domain in the
E. Ruberte and others
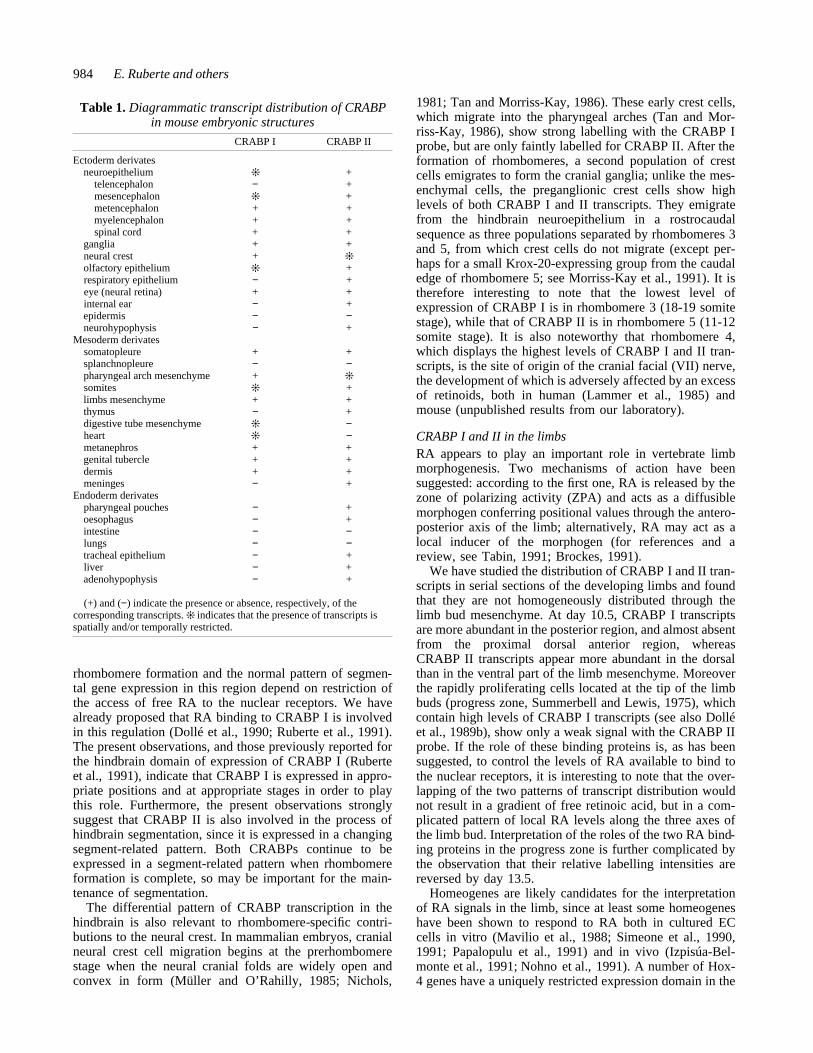
Table 1. Diagrammatic transcript distribution of CRABPin mouse embryonic structures
CRABP I CRABP II
Ectoderm derivatesneuroepithelium ❊ +
telencephalon − +mesencephalon ❊ +metencephalon + +myelencephalon + +spinal cord + +
ganglia + +neural crest + ❊olfactory epithelium ❊ +respiratory epithelium − +eye (neural retina) + +internal ear − +epidermis − −neurohypophysis − +
Mesoderm derivatessomatopleure + +splanchnopleure − −pharyngeal arch mesenchyme + ❊somites ❊ +limbs mesenchyme + +thymus − +digestive tube mesenchyme ❊ −heart ❊ −metanephros + +genital tubercle + +dermis + +meninges − +
Endoderm derivatespharyngeal pouches − +oesophagus − +intestine − −lungs − −tracheal epithelium − +liver − +adenohypophysis − +
(+) and (−) indicate the presence or absence, respectively, of thecorresponding transcripts. ❊ indicates that the presence of transcripts isspatially and/or temporally restricted.
985CRABPI and II expression in mouse embryos
986
posterior part of the developing mouse (Dollé et al., 1989a)and chick (Nohno et al., 1991) limb, which is related totheir position in the Hox-4 complex. Moreover, there is asequential triggering of expression of these Hox-4 genesfrom the postero-dorsal region of the limb, which appar-ently coincides with the ZPA. There is also a gradedexpression of each gene along the anteroposterior axis,which is highest in the posterior region and decreases ante-riorly. Strikingly, grafting a ZPA in, or a local applicationof RA to the anterior margin of chick wing buds, results inmirror-image patterns of Hox-4 gene expression which cor-relate with the subsequent appearence of mirror-imageduplications of digits (Izpisúa-Belmonte et al., 1991; Nohnoet al., 1991). These results are consistent with the idea thatRA is involved in controlling the expression of the Hox-4complex. Interestingly, there is a maximal overlap ofexpression of the two CRABP genes in the postero-dorsalregion which corresponds to the region of appearance ofHox-4 gene expression. Recently some of the Hox-1 geneshave also been shown to have colinear spatial and tempo-ral patterns of transcription along the proximo-distal axisof the limbs (Yokouchi et al., 1991). The site of appear-ance of their expression in the distal portion of the limbscorresponds to the region of highest CRABP I expressionand lowest CRABP II expression.
Whether and how the RA binding proteins are involvedin RA-induced expression of the Hox-4 and Hox-1 com-plex genes during limb development will require the gen-eration of mice in which the expression of CRABP I andII has been altered. Their continuous expression at stagesafter the skeletal pattern is established suggests that theyare also important for differentiation and histogenesis of thenon-skeletal tissues of the limb, as well as elsewhere in thebody.
We are grateful to Drs P. Kastner, C. Stoner, L. Gudas, A. Krustand P. Leroy for generous gifts of probes. We thank all the mem-bers of the retinoic acid receptor group for useful discussions, C.Werlé, A. Landmann, B. Boulay and J.M. Lafontaine for illustra-tions, and the secretarial staff. This work was supported by theINSERM, the CNRS, the Centre Hospitalier UniversitaireRégional, the Human Frontier Science Program, the Fondationpour la Recherche Médicale and the Association pour laRecherche sur le Cancer. E.R. was supported by a fellowship fromthe Université Louis Pasteur.
References
Adelmann, H. B. (1925). The development of the neural folds and cranialganglia of the rat. J.comp. Embryol. 39, 19-171.
Bartelmez, G. W. (1923). The subdivisions of the neural folds in man. J.Comp. Neurol. 35, 231-247.
Benbrook, D., Lernhardt, E. and Pfahl, M. (1988). A new retinoic acidreceptor from a hepatocellular carcinoma. Nature 333, 669-672.
Blomhoff, R., Gree, M. H., Berg, T. and Norum, K. R. (1990).Transport and storage of vitamin A. Science 250, 339-404.
Boylan, J. F. and Gudas, L. J. (1991). Overexpression of the cellularretinoic acid binding protein-I (CRABP-I) results in a reduction indifferentiation-specific gene expression in F9 teratocarcinoma cells.J.Cell Biol. 112, 965-979.
Brand, N., Petkovich, M., Krust, A., Chambon, P., de Thé, H.,Marchio, A., Tiollais, P. and Dejean, A. (1988). Identification of asecond human retinoic acid receptor. Nature 332, 850-853.
Brockes, J. (1991). We may not have a morphogen. Nature 350, 15.
Chytil, F. and Stump, D. G. (1991). Cellular retinoic acid- and retinol-binding proteins.In Retinoids: 10 years on., (ed. J. H. Saurat), pp.38-45.Basel : Karger.
Couly, G. and Le Douarin, N. M. (1987). Mapping of the early neuralprimordium in quail-chick chimeras. II. The prosencephalic neural plateand neural folds: implications for the genesis of cephalic humancongenital abnormalities. Devl. Biol. 120, 198-214.
Cuschieri, A. and Bannister, L. H. (1975). The development of theolfactory mucosa in the mouse: light microscopy. J. Anat. 119, 277-286.
Dencker, L., Annerwall, E., Busch, C. and Eriksson, U. (1990).Localization of specific retinoid-binding sites and expression of cellularretinoic-acid binding protein (CRABP) in the early mouse embryo.Development 110, 343-352.
de Thé, H., Vivanco Ruiz, M. M., Tiollais, P., Stunnenberg, H. andDejean, A. (1990). Identification of a retinoic acid responsive elementin the retinoic acid receptor β gene. Nature 343, 177-180.
Dollé, P., Izpisua-Belmonte, J. C., Falkenstein, H., Renucci, A. andDuboule, D. (1989a). Coordinate expression of the murine Hox-5complex homeobox-containing genes during limb pattern formation.Nature 342, 767-772.
Dollé, P., Ruberte, E., Kastner, P., Petkovich, M., Stoner, C. M.,Gudas, L. J. and Chambon, P. (1989b). Differential expression of thegenes encoding the retinoic acid receptors α, β, γ and CRABP I in thedeveloping limbs of the mouse. Nature 342, 702-705.
Dollé, P., Ruberte, E., Leroy, P., Morriss-Kay, G. M. and Chambon,P. (1990). Retinoic acid receptors and cellular retinoid binding proteins.I. A systematic study of their differential pattern of transcription duringmouse organogenesis. Development 110, 1133-1151.
Giguère, V., Lyn, S., Yip, P., Siu, C. H. and Evans, R. M. (1990).Molecular cloning of cDNA encoding a second cellular retinoic acid-binding protein. Proc. Natl. Acad. Sci. USA 87, 6233-6237.
Giguère, V., Ong, E. S., Segui, P. and Evans, R. M. (1987).Identification of a receptor for the morphogen retinoic acid. Nature 330,624-629.
Hunt, P., Faiella, A., Cook, M., Sham, M-H., Gulisano, M., Wilkinson,D., Boncinelli, E. and Krumlauf, R. (1991). A distinct Hox code forthe branchial region of the head. Nature 353, 861-864.
Izpisúa-Belmonte, J.-C., Tickle, C., Dollé, P., Wolpert, L. andDuboule, D. (1991). Expression of the homeobox Hox-4 genes andspecification of position in chick wing development. Nature 350, 585-589.
Krust, A., Kastner, P., Petkovich, M., Zelent, A. and Chambon, P.(1989). A third human retinoic acid receptor, h RAR-γ. Proc. Natl.Acad. Sci. USA 86, 5310-5314.
Lammer, G. J., Chen, D. T., Hoar, R. M., Agnish, N. D., Benke, P. J.,Braun, J. T., Curry, C. J., Fernhoff, P. M., Grix, A. W., Lott, I. T.,Richard, J. M. and Sun, S. C. (1985). Retinoic acid embryopathy.New England J. Med. 333, 837-841.
Maden, M., Ong, D. E., Summerbell, D. and Chytil, F. (1988). Spatialdistribution of cellular protein binding to retinoic acid in the chick limbbud. Nature 335, 733-735.
Mark, M. P., Bloch-Zupan, A., Wolf, C., Ruberte, E. and Ruch, J. V.(1991). Involvement of cellular retinoic acid-binding proteins I and II(CRABP I and CRABP II) and of the cellular retinol-binding protein I(CRBP) in odontogenesis in the mouse. Differentiation 48, 89-98.
Mavilio, F., Simeone, A., Boncinelli, E. and Andrews, P. W. (1988).Activation of four homeobox gene clusters in human embryonalcarcinoma cells induced to differentiate by retinoic acid. Differentiation37, 73-79.
Mendelsohn, C., Ruberte, E., LeMeur, M., Morriss-Kay, G. andChambon, P. (1991). Developmental analysis of the retinoic acidinducible RAR-β2 promoter in transgenic animals. Development 723-734.
Morriss, G. M. (1972). Morphogenesis of the malformations induced inrat embryos by maternal hypervitaminosis A. J. Anat. 113, 241-250.
Morriss-Kay, G. M., Murphy, P., Davidson, D. R. and Hill, R. E.(1991). Effects of retinoic acid excess on expression of Hox-2.9 andKrox-20 and on morphological segmentation in the hindbrain of mouseembryos. EMBO J. 10, 2985-2995
Müller, F. and O’Rahilly, R. (1985). The first appearance of the neuraltube and optic primordium in the human embryo at stage 10. Anat.Embryol. 172, 157-169.
Murphy, P., Davidson, D. R. and Hill, R. E. (1989). Segment-specific
E. Ruberte and others

987CRABPI and II expression in mouse embryos
expression of a homeobox-containing gene in the mouse hindbrain.Nature 341, 156-159.
Murphy, P. and Hill, R. E. (1991). Expression of the mouse labial-likehomeobox containing genes, Hox 2.9 and Hox 1.6, during segmentationof the hindbrain. Development 111, 61-74.
Nichols, D. H. (1981). Neural crest formation in the head of the mouseembryo as observed using a new histological technique. J. Embryol.exp. Morph. 64, 105-120.
Noden, D. M. (1978a). The control of avian cephalic neural crestcytodifferentiation. I. Skeletal and connective tissues. Dev. Biol. 67,296-312.
Noden, D. M. (1978b). The control of avian cephalic neural crestcytodifferentiation. II. Neural tissues. Dev. Biol. 67, 313-329.
Nohno, T., Noji, S., Koyama, E., Ohyama, K., Myokai, F., Kuroiwa,A., Saito, T. and Taniguchi, S. (1991). Involvement of the Chox-4chicken homeobox genes in determination of anteroposterior axialpolarity during limb development. Cell 64, 1197-1205.
Noji, S., Nohno, T., Koyama, E., Muto, K., Ohyama, K., Aoki, Y.,Tamura, K., Ohsugi, K., Ide, H., Taniguchi, S. and Saito, T. (1991).Retinoic acid induces polarising activity but is unlikely to be amorphogen in the chick limb bud. Nature 350, 83-86.
O’Rahilly, R. and Müller, F. (1987). In Developmental Stages in HumanEmbryos, Publication 637. (ed. Carnegie Institution of Washington).
Papalopulu, N., Lovell-Badge, R., and Krumlauf, R. (1991). Theexpression of murine Hox-2 genes is dependent on the differentiationpathway and displays a collinear sensitivity to retinoic acid in F9 cellsand Xenopus embryos. Nucl. Acids Res. 19, 5497-5506.
Petkovich, M., Brand, N. J., Krust, A. and Chambon, P. (1987). Ahuman retinoic acid receptor which belongs to the family of nuclearreceptors. Nature 330, 444-450.
Robertson, M. (1987). Towards a biochemistry of morphogenesis. Nature330, 420-421.
Rosa, F. W., Wilk, A. L. and Kelsey, F. O. (1986). Teratogen update:vitamin A congeners. Teratology 33, 355-364.
Ruberte, E., Dollé, P., Chambon, P. and Morriss-Kay, G. (1991).Retinoic acid receptors and cellular retinoid binding proteins II. Theirdifferential pattern of transcription during early morphogenesis inmouse embryos. Development 111, 45-60.
Ruberte, E., Dollé, P., Krust, A., Zelent, A., Morriss-Kay, G. andChambon, P. (1990). Specific spatial and temporal distribution ofretinoic acid receptor gamma transcripts during mouse embryogenesis.Development 108, 213-222.
Ruberte, E., Nakshatri, H., Kastner, Ph. and Chambon, P. (1992).Retinoic acid receptors and binding proteins in mouse limbdevelopment. In Retinoids in Normal Development and Teratogenesis.(ed. G. M. Morriss-Kay) pp. 99-111. Oxford: Oxford University Press.
Shenefelt, R. E. (1972). Morphogenesis of malformations in hamstercaused by retinoic acid, relation to dose and stage at treatment.Teratology 5, 103-108.
Simeone, A., Acampora, D., Arcioni, L., Andrews, P. W., Boncinelli,E. and Mavilio, F. (1990). Sequential activation of human HOX-2homeobox genes by retinoic acid in embryonal carcinoma cells. Nature346, 763-766.
Simeone, D., Acampora, V., Nigro, A., Faiella, M., D’Esposito, A.,Stornaiuolo, F., Mavilio, F. and Boncinelli, E. (1991). Differential
regulation by retinoic acid of the homeobox genes of the four HOX lociin human embryonal carcinoma cells. Mech. of Dev. 33, 215-227.
Smith, S. M., Pang, K., Sundin, O., Wedden, S. E., Thaller, C. andEichele, G. (1989). Molecular approaches to vertebrate limbmorphogenesis. Development 107 (suppl.), 121-131.
Smith, W. C., Nakshatri, H., Leroy, P., Rees, J. and Chambon, P.(1991). A retinoic acid response element is present in the mouse cellularretinol binding protein I (mCRBP I) promoter. EMBO J 10, 2223-2230
Stoner, C. M. and Gudas, L. J. (1989). Mouse cellular retinoic acidbinding protein: cloning, complementary DNA sequence, andmessenger RNA expression during the retinoic acid induceddifferentiation of F9 wild type and RA-3-10 mutant teratocarcinoma.Cancer Research 49, 1497-1504.
Summerbell, D. and Lewis, J. H. (1975). Time, place and positionalvalue in the chick limb-bud. J. Embryol. exp. Morph. 33, 621-643.
Tabin, C. J. (1991). Retinoids, homeoboxes, and growth factors: towardsmolecular models for limb development. Cell 66, 199-217.
Takase, S., Ong, D. E. and Chytil, F. (1979). Cellular retinol-bindingprotein allows specific interaction of retinol with the nucleus in vitro.Proc. Natl. Acad. Sci. USA., 76, 2204-2208.
Takase, S., Ong, D. E. and Chytil, F. (1986). Transfer of RA from itscomplex with cellular retinoic acid binding protein to the nucleus. Arch.Biochem. Biophys. 247, 328.
Tan, S. S. and Morriss-Kay, G. M. (1986). Analysis of cranial neuralcrest cell migration and early fates in postimplantation rat chimeras. J.Embryol. exp. Morph. 98, 21-58.
Vaessen, M. J., Meijers, J. H. C., Bootsma, D. and van Kessel, A. G.(1990). The cellular retinoid binding protein is expressed in tissuesassociated with retinoic acid induced malformations. Development 110,371-378.
Warkany, J., Nelson, R. C. and Schraffenberger, E. (1943). Congenitalmalformations induced in rats by maternal nutritional deficiency. III.The malformations of the extremities. J. Bone and Joint Surg. 5, 261-270.
Wilkinson, D. G., Bhatt, S., Chavrier, P., Bravo, R. and Charnay, P.(1989a). Segment-specific expression of a zinc-finger gene in thedeveloping nervous system of the mouse. Nature 337, 461-464.
Wilkinson, D. G., Bhatt, S., Cook, M., Boncinelli, E. and Krumlauf, R.(1989b). Segmental expression of Hox-2 homeobox containing genes inthe developing mouse hindbrain. Nature 341, 405-409.
Wilkinson, D. G., Peters, G., Dickson, C. and MacMahon, A. P.(1988). Expression of the FGF-related proto-oncogene int-2 duringgastrulation and neurulation in the mouse. EMBO J. 7, 691-695.
Wilson, J. G., Roth, C. B. and Warkany, J. (1953). An analysis of thesyndrome of malformations induced by maternal vitamin A deficiency.Effects of restoration at various times during gestation. Am. J. Anat. 92,189-217.
Yokouchi, Y., Sasaki, H. and Kuroiwa, A. (1991). Homeoboxexpression correlated with the bifurcation process of limb cartilagedevelopment. Nature 353, 443-445.
Zelent, A., Krust, A., Petkovich, M., Kastner, P. and Chambon, P.(1989). Cloning of murine α and β retinoic acid receptors and a novelreceptor γ predominantly expressed in the skin. Nature 339, 714-717.
(Accepted 24 April 1992)

![TECHNICAL PRODUCTS CO. Tel. 973-227-7635 Fax. 973-227 …technicalproductsco.com/ps-2003-01.pdftechnical products co. tel. 973-227-7635 fax. 973-227-7636 [1] size 000 00 0 1 2 3 w](https://static.fdocuments.us/doc/165x107/5e43a0c3156f000cc125cf84/technical-products-co-tel-973-227-7635-fax-973-227-technical-products-co-tel.jpg)