Diego Andrés Romo Estrella - COnnecting REpositories · 2018-02-09 · Diego Andrés Romo Estrella...
25
UNIVERSIDAD SAN FRANCISCO DE QUITO AMINO ACID COMPOSITION AND NITROGEN TO PROTEIN CONVERSION FACTORS FOR THREE LEGUMES AND TWO PSEUDO-CEREALS Diego Andrés Romo Estrella Tesis de grado presentada como requisito para la obtención del título de Ingeniería de Alimentos Quito, Mayo de 2008
Transcript of Diego Andrés Romo Estrella - COnnecting REpositories · 2018-02-09 · Diego Andrés Romo Estrella...

UNIVERSIDAD SAN FRANCISCO DE QUITO
AMINO ACID COMPOSITION AND NITROGEN TO PROTEIN
CONVERSION FACTORS FOR THREE LEGUMES
AND TWO PSEUDO-CEREALS
Diego Andrés Romo Estrella
Tesis de grado presentada como requisito para la obtención del título de Ingeniería de Alimentos
Quito, Mayo de 2008

UNIVERSIDAD SAN FRANCISCO DE QUITO
COLEGIO DE AGRICULTURA, ALIMENTOS Y NUTRICION
HOJA DE APROBACION DE TESIS
AMINO ACID COMPOSITION AND NITROGEN TO PROTEIN
CONVERSION FACTORS FOR THREE LEGUMES
AND TWO PSEUDO-CEREALS
Diego Andrés Romo Estrella
Michael Koziol, DPhil Decano del Colegio de Agricultura, Alimentos y Nutrición Director de tesis y Miembro del Comité de Tesis
____________________
Javier Garrido, MSc Miembro del Comité de Tesis
____________________
Yamila Alvarez, MSc Miembro del Comité de Tesis
____________________
Lucía de los Angeles Ramírez, PhD Miembro del Comité de Tesis
____________________
Stalin Santacruz, PhD Miembro del Comité de Tesis
____________________
Miguel Vásconez, MSc Miembro del Comité de Tesis
____________________
Quito, Mayo de 2008

© Derechos de autor
Diego Andrés Romo Estrella
2008

DEDICATORIA
A mi familia entera, especialmente a mis padres y hermana; en esta etapa final de mi
vida universitaria, teniéndoles siempre presente por dedicarme su cuidado, afecto y
respaldo a lo largo de mi carrera estudiantil. Con mucho cariño, el esfuerzo de este trabajo,
para ustedes.

AGRADECIMIENTOS
A todas aquellas personas que de alguna u otra manera contribuyeron conmigo para
llevar a cabo esta investigación, a quienes confiaron en mí y me brindaron su apoyo de
manera incondicional; especialmente a mi Director de Tesis, profesor y amigo, Mike.

RESUMEN
Cowpea (caupi), chocho y fréjol mung demostraron cómputos químicos de 64, 62, y
60, respectivamente; con los aminoácidos azufrados siendo los limitantes. Amaranto y
quinua demostraron cómputos químicos de 74 y 90, respectivamente; con leucina siendo
limitante en amaranto y valina en quinua. El contenido en histidina de todos los cultivos
supera al requerimiento establecido por la FAO/WHO para niños. Los factores de
conversión nitrógeno a proteína corregidos para el contenido en nitrógeno no proteico, son
6.01 para cowpea, 6.00 para chocho, 6.40 para fréjol mung, 5.52 para amaranto y 5.93
para la quinua.
Palabras claves: aminoácidos, nitrógeno, nitrógeno no proteico, proteína, leguminosa,
pseudocereal, cowpea, caupi, chocho, lupino, fréjol mung, amaranto, quinua.

ABSTRACT
The results of a meta-analysis gave chemical scores for cowpea, lupine and mung bean
of 64, 62, and 60, respectively, with the sulphur containing amino acids being limiting in
these legumes. Amaranth and quinoa had chemical scores of 74 and 90, respectively, with
leucine being limiting in amaranth and valine in quinoa. All species contain substantially
more histidine than the FAO/WHO requirement for infants. The nitrogen to protein
conversion factors corrected for nonprotein nitrogen content are: 6.01 for cowpea, 6.00 for
lupine, 6.40 for mung bean, 5.52 for amaranth, and 5.93 for quinua.
Key words: amino acids, nitrogen, nonprotein nitrogen, protein, legume, pseudo-cereal,
cowpea, lupine, mung bean, amaranth, quinoa.
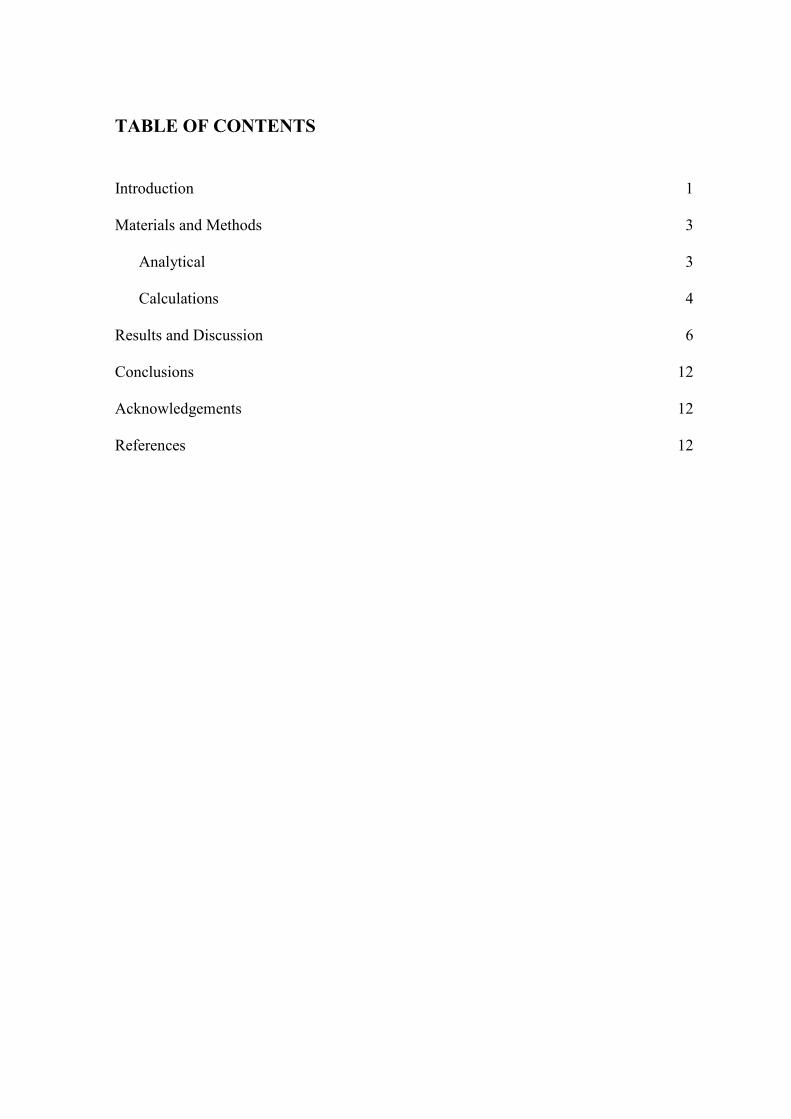
TABLE OF CONTENTS
Introduction 1
Materials and Methods 3
Analytical 3
Calculations 4
Results and Discussion 6
Conclusions 12
Acknowledgements 12
References 12

LIST OF TABLES
Table 1. Essential amino acid composition (mg AA/g N) and chemical scores 7
Table 2. Comparison of chemical scores of different sources 8
Table 3. Amino acid composition and nitrogen distribution (mg AA/g N), total,
nonprotein and protein nitrogen (%), and nitrogen to protein correction
factors 11
Table 4. Comparison of nitrogen to protein conversion factors 12

INTRODUCTION
Protein content of foods and feeds is calculated by multiplying the value determined for
Kjeldahl nitrogen by a nitrogen to protein (N:P) conversion factor. Protein content is
usually estimated by using 6.25 or 5.7 as default factors. The use of 6.25 as a nitrogen to
protein conversion factor derives from early research on animal proteins which showed
these to contain about 16% N (100 ÷ 16 = 6.25), while 5.7 derives from work on the
gliadin and glutenin content of wheat as well as the nitrogen content of these protein
fractions (Tkachuk 1969). Jones (1931) criticized the use of these two factors on the basis
that they did not take into consideration the different nitrogen content of different protein
sources and subsequently calculated nitrogen to protein factors ranging from 5.18 to 6.25
for various foodstuffs. Jones (1931) recognized that his calculations were also flawed
because they did not take into consideration nonprotein nitrogen, but was unable to correct
for this because of the limited information then available on such compounds. Foods may
contain various other nitrogenous compounds including, but not limited to, nucleic acids,
nitrate, nitrite, amines, vitamins, alkaloids, nitrogenous glycosides (Fujihara et al. 2008),
amides and free amino acids (Ezeagu et al. 2002), and polyamines (Koziol 1992). The use
of the default factor of 6.25 for foods containing appreciable amounts of these compounds
will result in an overestimation of their protein content.
An accurate estimation of protein content is essential in nutritional research and in the
formulation of foods and feedstuffs. In animal nutrition, protein excess as well as deficit
can be detrimental. An excess of protein in feedstuffs is both uneconomical and, in the
case of the feces of monogastric animals, harmful to the environment (Mossé 1990). In
human nutrition, the IDF (2006) emphasized the importance of specific nitrogen to protein
conversion factors to ensure compliance with established protein contents in infant
formulas in response to a suggestion by the Codex Committee on Nutrition and Foods for
Special Dietary Uses (CCNFSDU) that protein content be assessed using the default N:P
factor of 6.25. For example, Boisen et al. (1986) showed that using this default
conversion factor when replacing dietary protein from skim milk powder with protein
from grass meal would result in a formulation with 25% less protein. A similar error will
be introduced in the assessment of protein quality by standard methods such as Protein
Efficiency Ratio (PER), Biological Value (BV), and Net Protein Utilization (NPU), which

all require diets to be formulated with determined protein contents (Brody 1994). In such
studies, the use of N:P conversion factors less than 6.25 will result in an underestimation
of protein quality while values in excess in 6.25 will result in overestimation.
Of equal importance to protein content is protein quality, specifically as regards the
profile of the essential amino acids and the identification of the limiting essential amino
acid, which influences the chemical score of the protein (Brody 1994).
Legumes, cereals, and pseudo-cereals represent important sources of protein in human
and animal nutrition. Annual production of quinoa is estimated at 48, 000 metric tonnes,
with Bolivia producing 45% of the world’s production, Peru 42%, the United States of
America 6%, Canada 3%, and Ecuador 2%, with a minimum production in Europe
(http://campocoop.cl/docs/ProductionQuinoa.). World lupine production for human and
animal consumption in 2004 was estimated at one million metric tonnes: Australia
produced 78% of this total (780,000 tonnes, primarily Lupinus angustifolius), 25 European
countries produced 15% (220,000 tonnes) and the remainder produced in Africa, Russia
and South America. France and South Africa produce white lupine, Lupinus albus,
Central Europe produces the yellow lupine, Lupinus luteus, while South America
primarily produces the bitter pearl lupine, Lupinus mutabilis (http://www.ifi-
online.com/Tmpl_Article_Overview.asp).
World production of mung bean in 2005 was 122,882 million metric tones (MT), with
China producing 100,214 (MT), Nigeria producing 3,025 (MT), and Uganda 2,604 MT
(http://www.pcarrd.dost.gov.ph/commodities/velero/index.php). In 1997, world cowpea
production was estimated at three million metric tonnes, with West and Central Africa
accounting for 64% of this production (http://www.hort.purdue.edu/newcrop.html). There
is little data on the world production and consumption of amaranth. The principal producer
is China, with 150,000 hectares under cultivation, followed by India and Peru with 1800
hectares, Mexico with 900 hectares, and finally the United States of America with 500
hectares (http://www.cofecyt.mincyt.gov.ar.pdf).
The purpose of this study was to present a review of published information concerning
the amino acid profiles of lupine (Lupinus mutabilis L.), mung bean (Vigna radiata (L.)

Wilcz.), cowpea (Vigna unguiculata (L.) Walp.), amaranth (Amaranthus caudatus L.), and
quinoa (Chenopodium quinoa Willd.), and to combine these data with estimations of total
and nonprotein nitrogen to calculate specific N:P factors for these species.
MATERIALS AND METHODS
Pseudo-cereal and legume seeds were obtained from the local market for analysis of
total and nonprotein nitrogen content. Chemicals were provided by the Department of
Food Engineering of the College of Agriculture, Foods and Nutrition, USFQ.
A meta-analysis approach was applied for compiling data on the amino acid
compositions of these five species. Such data will thus reflect differences in crop
varieties, climatic and edaphic factors, and will therefore represent a more comprehensive
data set than that which would result from performing analyses on single samples from
single sources. Where necessary, values reported for the amino acids by the various
authors were converted to mg amino acid/gN. This obviates the need to convert data to a
dry weight basis for although relative protein content may change with sample moisture
content, the protein composition in terms of the constituent amino acid residues remains
constant.
ANALYTICAL
Preparation of samples
Pseudo-cereal and legume seed were finely ground with a Straub Model 4E Grinding
Mill to pass a 40 mesh screen (USA standard, 425 µm). Samples were stored in tightly
sealed polypropylene bags until analysis.
Determination of total nitrogen
Total nitrogen content was determined in duplicate by the Kjeldahl method (AOAC
1990). Using a Mettler-Toledo balance (Model AB204-S), approximately 0.5 g of ground

sample was weighed into a Kjeldahl digestion flask to which was added 20 mL of
analytical grade concentrated sulphuric acid (96.1% or 95.7%), a Kjeldahl digestion tablet,
and boiling chips. The sample was placed on a Labconco Digestion Unit and digested for
3-4 hours, according to the sample being analyzed. Cooled samples were then distilled
using a Büchi Model 320 distillation apparatus. The distillate was collected in 50 mL of
standardized 0.1N H2SO4, then titrated with 0.1 N NaOH using methyl red as the
indicator.
Determination of nonprotein nitrogen
The nonprotein nitrogen content (NPN) of the pseudo-cereal and legume seeds was
determined in duplicate by method of Lees (1982). Using a Mettler-Toledo balance
(Model AB204-S), 2.5 g of sample and 5 g of water were weighed into a centrifugation
tube. To this mixture were added 1.25 g of 50% trichloroacetic acid and the contents of the
tube mixed. Four repetitions were performed to achieve an extraction of 10 g of sample.
The tubes were then centrifuged at 850×g for 15 minutes. In toto, 10 mL supernatant were
collected from the four tubes and transferred to a Kjeldahl digestion tube for determination
of nitrogen content according the Kjeldahl method described above.
Protein nitrogen
Protein nitrogen was calculated simply as the difference between total and nonprotein
nitrogen:
Protein N = Total N – Nonprotein N
CALCULATIONS
Chemical Score
The chemical score was calculated according to Brody (1994) by comparing the
essential amino acids of the protein in question to the amino acid scoring pattern reported
by Harper (1981), using the formula [(AAx)×100] ÷ AAe, where “x” represents the
essential amino acid in the protein in question and “e” the amino acid in the reference
pattern. The chemical score is the minimal value and the corresponding amino acid is the
limiting amino acid. Histidine was included as it has been shown to be essential for infants
(Harper 1981).

N:P Conversion Factors
The values reported in the literature represent amino acids in their free base form. To
reflect the state in which the amino acids occur in proteins the values for the individual
amino acids were corrected for the water lost during the formation of peptide bonds. The
correction factors for expressing the concentrations of each amino acid residue (AAres) in
its anhydrous form were calculated by:
AAres correction factor = (MWt AA) – (MWt H2O) (MWt AA)
Thus for glycine, the correction factor is:
(75.1 – 18) ÷ 75.1 = 0.76
The application of such correction factors to all amino acid residues introduces an
insignificant error as the N and C terminal amino acids in a protein are not present in an
anhydrous form. However, the relative number of end groups is small compared with the
total number of amino acid residues in proteins and Tkachuk (1969) has estimated this
error to be on the magnitude of 0.035%.
Amino acid nitrogen (AAN) was calculated by multiplying the anhydrous AAres
content by a factor derived by dividing the molecular weight of the total number of
nitrogen atoms present in amino acid by its anhydrous molecular weight.
AAN factor = [(Nº N)(MWt N)] ÷ [(MWt AA) – (MWt H2O)]
Thus, for glycine the factor for determining amino acid nitrogen is determined as:
[(1)(14)] ÷ [75.1 – 18] = 0.25

and for arginine:
[(4)(14)] ÷ [174.2 – 18] = 0.36
Preliminary N:P conversion factors, uncorrected for nonprotein nitrogen content, can now
be calculated as:
Preliminary N:P conversion factor = ΣAAres ÷ ΣAAN
The presence of nonprotein nitrogen will reduce the values of the N:P conversion
calculated solely on the basis ΣAAres ÷ ΣAAN (Tkachuk 1969). The true N:P conversion
factor can be calculated as:
N:P conversion factor = [(ΣAAres)(Total N – Nonprotein N)] ÷ [(ΣAAN)( Total N)]
RESULTS AND DISCUSSION
The total content of the essential amino acids in the five species analyzed exceeded the
pattern established by the FAO/WHO (Harper 1981) and chemical scores ranged from 60
for mung bean to 90 for quinoa (Table 1). The sulphur-containing amino acids were
limiting in cowpea, lupine, and mung bean, with respective chemical scores of 64, 62, and
60, consistent with what would be expected for legumes (Sosulski and Holt 1980).

Table 1. Essential amino acid composition (mg AA/g N) and chemical scores.
Cowpea1 Lupine2 Mung bean3 Amaranth4 Quinoa5 FAO/WHO6
AA Score AA Score AA Score AA Score AA Score AA Pattern
Histidine 207 230 175 194 191 212 145 161 188 209 90
Isoleucine 342 137 274 110 278 111 247 99 269 108 250
Leucine 494 112 449 102 478 109 326 74 411 93 440
Lysine 443 130 363 107 427 126 377 111 367 108 340
Methionine + Cystine 141 64 136 62 131 60 237 108 250 114 220
Phenylalanine + Tyrosine 542 143 469 123 586 154 423 111 471 124 380
Threonine 250 100 238 95 225 90 247 99 232 93 250
Tryptophan 68 113 67 112 70 117 77 128 69 115 60
Valine 310 100 269 87 320 103 270 87 280 90 310
Total 2797 —— 2440 —— 2706 —— 2349 —— 2537 —— 2340
Chemical score 64 62 60 74 90
1 Madamba et al. (2006), Khan and Baker (1957), Lambot (2002), Amjad et al. (2006), Devarajan (2004), Vijayaraghavan and Srinivasan (1953), Elias et al. (1964), Phillips and Baker (1987), Rangel et al. (2004), FAO (1970).
2 Feldheim (1998), Freire (1984), Hung (1993), Schoeneberger et al. (1982), Tapia (1997), Villacrés et al. (2003), FAO (1970).
3 Badshah Khattak and Klopfenstein (1989), Bagchi et al. (1955), Vijayaraghavan and Srinivasan (1953), Bhatty et al. (2000), Khalil (2005), Mogotsi (2006), Wills et al. (1984), Lambot (2002), Mubarak (2005), Khader and Venkat Rao (1996), FAO (1970).
4 Tapia (2000), PÍSAŘIKOVÁ et al.(2005), Saunders and Becker (1984), Gamel et al (2004), Mujica y Jacobsen (2006), FAO (1970)
5 Wright et al. (2002), Koziol, (1992), Cusack (1984), Ruales et al. (1992), Tellería et al. (1978), Mujica and Jacobsen (2006), Fujihara et al. (2008), FAO (1970)
6 Harper (1981). The scoring pattern reflects adequacy for young children, plus the histidine requirement for infants.

Cereals are generally deficient in lysine (Fujihara et al. 2008), but this is not the case
with the pseudo-cereals amaranth and quinoa. Leucine, with a chemical score of 74, was
limiting in amaranth and valine, with a chemical score of 90, was limiting in quinoa. All
species contained substantially more histidine than the FAO/WHO pattern, which makes
them suitable protein sources for use in infant formulas. All species also contained
substantially more of the aromatic amino acids phenylalanine and tyrosine.
With the exception of a deficiency in the sulphur containing amino acids, cowpea is
more than adequate as regards the remaining essential amino acids, lupine adequate in all
but threonine and valine, and mung bean in all but threonine. The lysine (280 mg
lysine/gN) and tryptophan (34 mg tryptophan/gN) concentrations in lupine reported by
Sosulski and Holt (1980) are substantially less than found in this study. This may be
attributed to the fact that their study is based on the analysis of only one sample of an
unidentified variety of lupine (Lupinus sp.) whereas the sample base for the current study
is more ample. The values for mung bean closely approximate those of Sosulski and Holt
(1980).
In comparison with other vegetable protein sources, amaranth and quinoa have the
highest chemical scores (Table 2). Cowpea, lupine, and mung bean are similar to oats in
chemical score and superior to wheat, maize, lima beans, and lentils. In amaranth, quinoa,
cowpea, lupine, and mung bean, total protein content is as important as the chemical score
and profiles of the essential amino acids are factors which should be taken into
consideration when formulating foods and feedstuffs with these species.
Table 2. Comparison of chemical scores of different protein sources.
Protein source1 Chemical score1 Protein source1 Chemical score1
Egg 100 Rice 56
Quinoa 90 Peanuts 55
Amaranth 74 Soybeans 47
Cowpea 64 Wheat 43
Lupine 62 Maize 41
Mung bean 60 Lima beans 41
Oats 57 Lentils 31
1 Data from Brody (1994), with the exception of quinoa, amaranth, cowpea, lupine, and mung bean.

Total nitrogen content ranged from 2.75% for amaranth to 6.85% for lupine (Table 3),
well within published values. For example, the value for amaranth (2.75%) is close to the
2.56% reported by Fujihara et al. (2008). For quinoa, the value of 3.09% is higher than
the 2.12% reported by Fujihara et al. (2008), but is still within the range of values
expected for quinoa (Koziol, 1992). Sosulski and Holt (1980) reported values of 6.17%
and 4.25% for lupine and mung bean, respectively, which compare favorably to the values
obtained in this study, namely 6.85% and 4.05%, respectively.
Several problems are inherent to the determination of nitrogen to protein conversion
factors. Firstly, few investigators have reported amino acid profiles for several varieties of
one species sampled over multiple harvest periods. As it is tenuous to base a conversion
factor on such limited analytical data a meta-analysis approach has been used in this study.
Secondly, very few studies have included hydroxyproline, asparagine, and glutamine in
the amino acid profiles (vanEtten et al. 1963; Tkachuk, 1969; Koziol 1992; Fujihara et al.
2008). Asparagine and glutamine, the amide derivatives of aspartic and glutamic acids,
can represent important sources of amino acid nitrogen; for example Tkachuk (1969)
reported 108 µM asparagine, 299 µM aspartic acid, 2172 µM glutamine, and 299 µM
glutamic acid per gram of protein in Manitou wheat, and Fujihara et al. (2008) reported
263 mg asparagine, 319 mg aspartic acid, 484 mg glutamine, and 586 mg glutamic acid
per gram of nitrogen on a dry weight basis in brown rice. The exclusion of these amino
acids in the calculation of nitrogen to protein conversion factors is a serious omission.
Another source of error is the determination of nonprotein nitrogen (NPN). Bell (1963)
published a comprehensive critical review of twenty methods then available and
concluded that “The progress of studies on NPN fractions depends largely on the
availability of reliable methods for the primary separation of protein from nonprotein
nitrogen… even the simplest procedure for removing protein does not achieve separation
purely on molecular size… sources of error inherent in different methods include the
hydrolysis of nitrogen-containing polymers, the absorption of NPN compounds onto
protein, and the anomalous behavior of some compounds with different protein
precipitants.” Of the methods investigated, minimum binding of NPN to proteins was
found when proteins were precipitated with trichloroacetic acid, which also resulted in a
better extraction of NPN than with other methods (Bell 1963).

Various authors have analyzed specific nonprotein nitrogen fractions. Amide N was
analyzed separately in field peas (Holt & Sosulski 1979) and for grain legumes (Sosulski
& Holt 1980) and then classified as “other nitrogen”. Without a specific distinction
between amide N and the carbamide N deriving from asparagine and glutamine (de Rham
1982), this procedure is questionable as it would attribute amino acid nitrogen to the
nonprotein fraction, thus introducing an important error in the determination of nitrogen to
protein conversion factors. Other special cases exist. For example, in the case of
mushrooms and common Japanese vegetables with high nitrate concentrations, Fujihara et
al. (1995, 2001) applied a modification of the Kjeldahl procedure for samples with high
nitrate concentrations, as well as analytical methods designed to quantify nitrate N,
ammonia N, and nucleic acid N. Given the chemistry of grain legumes and pseudo-cereals
the determination of nonprotein nitrogen can be simplified by using the trichloroacetic
acid method (Bell 1963; Lees 1982).
Total amino acid concentrations for lupine and mung bean were close to the values
reported by Sosulski and Holt (1980), namely 5720 and 6240 mg/gN, respectively, versus
5914 and 6001 mg/gN (Table 3). Other values cannot be compared for lack of available
data.
The nitrogen to protein conversion factors corrected for nonprotein nitrogen content
are: 6.01 for cowpea, 6.00 for lupine, 6.40 for mung bean, 5.52 for amaranth, and 5.93 for
quinoa (Table 3). These values are compared with those reported in the literature (Table
4). The values published by Sosulski and Holt (1980) for lupine and mung bean are low,
and were supposedly calculated according to Tkachuk (1969). However, recalculating
their data according to the method of Tkachuk (1969) gave values closer to those reported
in this study. The nitrogen to protein conversion factors for amaranth and quinoa are
higher than those reported by Fujihara et al. (2008), but they analyzed only one sample of
each pseudo-cereal. No data was found with which to compare the nitrogen to protein
conversion factor for cowpea.

Table 3. Amino acid composition and nitrogen distribution (mg AA/g N), total, nonprotein and protein nitrogen (%), and nitrogen to protein conversion factors.
Cowpea1 Lupine1 Mung bean1 Amaranth1 Quinoa1
Cystine 57 ±31 73 ±21 44 ±14 105 ±29 106 ±36
Histidine 207 ±13 175 ±22 191 ±46 145 ±29 188 ±19
Isoleucine 342 ±158 274 ±23 278 ±63 247 ±67 269 ±61
Leucine 494 ±87 449 ±30 478 ±56 326 ±25 411 ±39
Lysine 443 ±35 363 ±47 427 ±78 377 ±54 367 ±40
Methionine 84 ±25 63 ±39 87 ±33 132 ±33 144 ±37
Phenylalanine 363 ±66 243 ±20 337 ±75 244 ±21 277 ±34
Threonine 250 ±40 238 ±10 225 ±46 247 ±56 232 ±35
Tryptophan 68 ±18 67 ±23 70 ±24 77 ±17 69 ±9
Tyrosine 179 ±43 226 ±71 249 ±204 179 ±95 194 ±36
Valine 310 ±39 269 ±32 320 ±58 270 ±18 280 ±39
Alanine 220 ±70 226 ±12 238 ±58 300 ±71 282 ±26
Arginine 541 ±241 542 ±55 372 ±91 559 ±141 493 ±77
Aspartic acid 634 ±126 603 ±124 783 ±89 486 ±125 461 ±31
Glutamic acid 921 ±237 1261 ±154 1051 ±223 924 ±150 816 ±51
Glycine 216 ±49 266 ±8 213 ±57 594 ±170 348 ±46
Proline 254 ±19 241 ±16 330 ±142 206 ±34 224 ±34
Serine 262 ±69 337 ±38 307 ±6 405 ±130 235 ±21
Total Essential Amino Acids 2797 2440 2706 2349 2537
Total Amino Acids 5845 5914 6001 5823 5398
AAres2 5049 5108 5182 4986 4642
AAN3 815 817 793 846 764
N:P Factor 6.20 6.25 6.54 5.89 6.08
% Total Nitrogen 3.88 6.85 4.05 2.75 3.09
% Nonprotein Nitrogen 0.12 0.27 0.08 0.17 0.08
% Protein Nitrogen 3.76 6.58 3.97 2.58 3.01
Corrected N:P Factor 6.01 6.00 6.40 5.52 5.93
1 Data from same references as given for these species in Table 1, ± standard deviations of the means. 2 Anhydrous weight of the amino acid residues (mgAA/gN). 3 Nitrogen content of the anhydrous amino acid residues (mgAAN/gN).

Table 4. Comparison of nitrogen to protein conversion factors. Reference Lupine Mung bean Amaranth Quinoa
This study 6.00 6.40 5.52 5.93
Sosulski and Holt (1980) 4.94 5.38 —— ——
Sosulski and Holt (1980), recalculated1 5.98 6.02 —— ——
Fujihara et al. (2008) —— —— 4.74 5.39
1 Nitrogen to protein conversion factors recalculated according to the method of Tkachuk (1969).
CONCLUSION
Use of the accepted nitrogen to protein conversion factor of 5.7 for legumes (de Rham
1982) will underestimate the protein content of cowpea, lupine, and mung bean, while the
use of the default value of 6.25 will overestimate the protein content of amaranth and
quinoa. A more precise determination of the nitrogen to protein conversion factors will
allow a more exact evaluation of protein quality through standard methods such as protein
efficiency ratio, biological value or net protein utilization.
ACKNOWLEDGEMENTS
This research was partially funded by a small research grant from the Universidad San
Francisco de Quito, which is gratefully acknowledged.
REFERENCES AOAC. 1990.Official Methods of Analysis, 15
th Edition, Volume 2. Association of Official
Analytical Chemists, Arlington, VA, USA. Method 920.87, pp 781-782. Bagchi S.P. (1955). Vigna radiata (L.). Annals of Biochemistry and Experimental
Medicine 15: 149. Bell, P. 1963. A critical study of methods for the determination of nonprotein nitrogen. Analytical Biochemistry 5, 443-451.

Bhatty, N., Gilani, A.H. & Saeed, A.N.. (2000). Nutritional value of mung bean (Vigna
radiata) as effected by cooking and supplementation. Archivos Latinoamericanos de
Nutrición 50: 374-379. Boisen, S., Bech-Andersen, S. & Eggum, B.O. (1987). A critical review on the conversion factor 6.25 from total nitrogen to protein. Acta Agriculturae Scandinavica 37: 299-304. Brody, T. (1994). Nutritional Biochemistry. Academic Press, New York, USA. pp 340-342. Cusack, D. (1984). Quinua: grain of the Incas. The Ecologist 14: (1): 21-31. de Rham, O. (1982). La proportion d’azote dan les protéines et le facteur de calcul protéine/azote. Lebensmittel-Wissenschaft und-Technologie 15: 226-231. Devarajan T. (2003). Chemical composition and nutritional potencial of Vigna
unguiculata ssp. cilíndrica (Fabaceae). Journal of Food Biochemistry 29: 88-98. Elias, L.G., Colindres R. & Bressani R. (1964). The nutritive value of eight varieties of cowpea (Vigna sinensis). Journal of Food Science 29: 118. Ezeagu, I.E., Petzke, J.J., Metges, C.C., Akinsoyinu, A.O. & Ologhobo, A.D. (2002). Seed protein contents and nitrogen-to-protein conversion factors for some uncultivated tropical plant seeds. Food Chemistry 78: 105-109. FAO. (1970). Amino-acid Content of Foods. Food and Agricultural Organization of the United Nations. Rome, Italy. Feldheim, W. (1998). Sweet lupine flour: a healthy asset. International Food Ingredientes
No. 5.
Freire, A. (1984). Determinación cualitativa y cuantitativa de varios aminoácidos del chocho por electroforesis y cromatografía de papel. Bases de datos del INIAP Estación Experimental Santa Catalina. Quito, Ecuador. Fujihara, S., Kasuga, A., & Aoyagi, Y. (1995). Nitrogen-to-protein conversion factors for some common edible mushrooms. Journal of Food Science 60: 1045-1047. Fujihara, S., Kasuga, A., & Aoyagi, Y. (2001). Nitrogen-to-protein conversion factors for common vegetables in Japan. Journal of Food Science 66: 412-415. Fujihara, S., Sasaki, H., Aoyagi, Y. & Sugahara, T. (2008). Nitrogen to protein conversión factors for some cereal products in Japan. Journal of Food Science 73: C204-209. Gamel, T., Linssen, J., Alink, G., Mosallen, A. & Shekib, L. (2004). Nutritional study of raw and popped seed proteins of Amaranthus caudatus L. and Amaranthus cruentus L. Journal of the Science and Food Agriculture 84: 1153-1158.

Harper, A. (1981). Amino acid scoring patterns. Joint FAO/WHO/UNU Expert
Consultation on Energy and Protein Requirements. Provisional Agenda Item 3.2.3. Rome
5-17 October 1981.
Hung T.V. (1993). Characterisation of yeasts and bacteria in lupin-soy sauce fermentation. ASEAN Food Journal 8: 99-104. IDF. (2006). Comprehensive review of scientific literature pertaining to nitrogen protein conversion factors. Bulletin of the International Dairy Federation 405/2006. International Dairy Federation, Brussels, Belgium. 11 pp. Iqbal, A., Iqtidar A.K., Ateeq, N. & Khan, M.S.. (2006). Nutritional quality of important food legumes. Journal of Food Chemistry 97: 331-335 Jones, D.B. (1931). Factors for converting percentages of nitrogen in foods and feeds into percentages of protein. United States Department of Agriculture Circular No. 183, USDA, Washington DC, USA. 21 pp. Khan, N.A. & Baker, B.E. (1957). Amino acid composition of cowpea (Vigna unguiculta)
Journal of the Science of Food and Agriculture 8: 301. Khalil, A.A. (2006). Nutritional improvement of an Egyptian breed of mung bean by probiotic lactobacilli. African Journal of Biotechnology 5: 206-212. Khader, V. & Rao, V.S. (1996). Studies on protein quality of green gram (Phaseolus
aureus). Plant Foods for Human Nutrition 49: 127-132. Khattak, A.V. & Klopfenstein C.F. (1989). Effect of gamma irradiation on the nutritional quality of grains and legumes. II. Changes en amino acid profiles and available lysine. Journal of Cereal Chemistry 66 (3): 171-172. Koziol, M.J. (1992). Chemical composition and nutritional evaluation of quinoa (Chenopodium quinoa Willd.). Journal of Food Composition and Analysis 5: 35-68. Koziol, M.J. (1993). Quinoa: A potential new oil crop. In: New Crops, J. Janick & J.E. Simon (eds). John Wiley & Sons, Inc., New York, USA. pp 328-336. Lambot, C. (2002). Industrial Potential of Cowpea. Agriculture Raw Materia. Nestlé Research Center, Abidjan, Côte d’Ivoire. pp. 367-375. Lees, R. 1982. Análisis de los Alimentos. Métodos Analíticos y de Control de Calidad. Editorial Acribia, Zaragoza, España. P. 179. Madamba, R., Grubben, G.J.H., Asante, I.K.& Akromah, R., (2006). Vigna unguiculata
(L.) Walp. In: Cereals and Pulses. Brink, M. & Belay, G. (eds). Prota 1, Wageningen, Netherlands. Mogotsi, K.K. (2006). Vigna radiata (L.) Wilcz. In: Cereals and Pulses. Brink, M. & Belay, G. (eds). Prota 1, Wageningen, Netherlands.
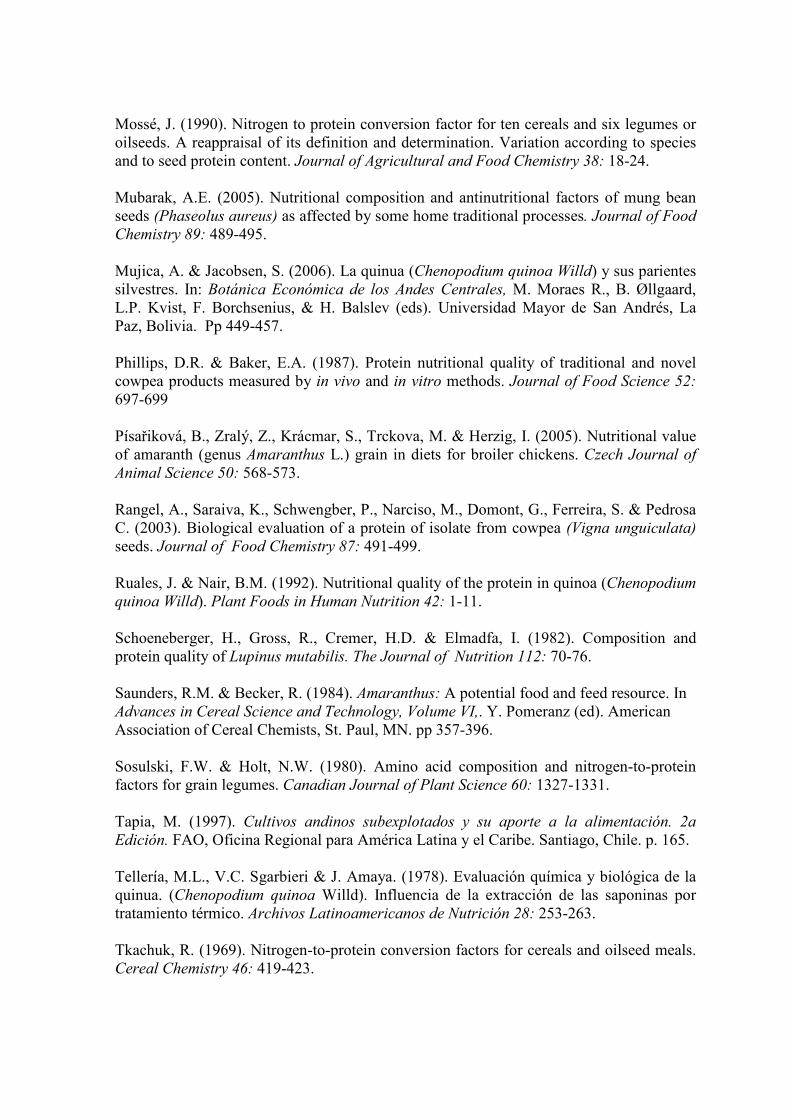
Mossé, J. (1990). Nitrogen to protein conversion factor for ten cereals and six legumes or oilseeds. A reappraisal of its definition and determination. Variation according to species and to seed protein content. Journal of Agricultural and Food Chemistry 38: 18-24. Mubarak, A.E. (2005). Nutritional composition and antinutritional factors of mung bean seeds (Phaseolus aureus) as affected by some home traditional processes. Journal of Food
Chemistry 89: 489-495. Mujica, A. & Jacobsen, S. (2006). La quinua (Chenopodium quinoa Willd) y sus parientes silvestres. In: Botánica Económica de los Andes Centrales, M. Moraes R., B. Øllgaard, L.P. Kvist, F. Borchsenius, & H. Balslev (eds). Universidad Mayor de San Andrés, La Paz, Bolivia. Pp 449-457. Phillips, D.R. & Baker, E.A. (1987). Protein nutritional quality of traditional and novel cowpea products measured by in vivo and in vitro methods. Journal of Food Science 52:
697-699 Písařiková, B., Zralý, Z., Krácmar, S., Trckova, M. & Herzig, I. (2005). Nutritional value of amaranth (genus Amaranthus L.) grain in diets for broiler chickens. Czech Journal of
Animal Science 50: 568-573. Rangel, A., Saraiva, K., Schwengber, P., Narciso, M., Domont, G., Ferreira, S. & Pedrosa C. (2003). Biological evaluation of a protein of isolate from cowpea (Vigna unguiculata) seeds. Journal of Food Chemistry 87: 491-499. Ruales, J. & Nair, B.M. (1992). Nutritional quality of the protein in quinoa (Chenopodium
quinoa Willd). Plant Foods in Human Nutrition 42: 1-11. Schoeneberger, H., Gross, R., Cremer, H.D. & Elmadfa, I. (1982). Composition and protein quality of Lupinus mutabilis. The Journal of Nutrition 112: 70-76. Saunders, R.M. & Becker, R. (1984). Amaranthus: A potential food and feed resource. In Advances in Cereal Science and Technology, Volume VI,. Y. Pomeranz (ed). American Association of Cereal Chemists, St. Paul, MN. pp 357-396. Sosulski, F.W. & Holt, N.W. (1980). Amino acid composition and nitrogen-to-protein factors for grain legumes. Canadian Journal of Plant Science 60: 1327-1331. Tapia, M. (1997). Cultivos andinos subexplotados y su aporte a la alimentación. 2a
Edición. FAO, Oficina Regional para América Latina y el Caribe. Santiago, Chile. p. 165. Tellería, M.L., V.C. Sgarbieri & J. Amaya. (1978). Evaluación química y biológica de la quinua. (Chenopodium quinoa Willd). Influencia de la extracción de las saponinas por tratamiento térmico. Archivos Latinoamericanos de Nutrición 28: 253-263. Tkachuk, R. (1969). Nitrogen-to-protein conversion factors for cereals and oilseed meals. Cereal Chemistry 46: 419-423.

Van Etten, C.H., Miller, R., Wolff, I.A. & Jones, Q. 1963. Amino acid composition of seeds from 200 angiospermous plant species. Agricultural and Food Chemistry 11, 399-410. Vijayaraghavan, P.K. & Srinivasan, P.R. (1953). Essential amino acid composition of some common Indian pulses. The Journal of the Nutrition 51: 261-271. Villacrés P., E., Peralta I., E. & Álvarez, MdC. (2003). Chochos en su punto. Recetario.
Publicación Miscelanea No 118. INIAP, Estación Experimental Santa Catalina. Quito, Ecuador. 43 pp. WHO. 1973. Energy and Protein Requirements. WHO Technical Report Series N° 522. A Report of a Joint FAO/WHO ad hoc Expert Committee. World Health Organization, Geneva, Switzerland. Wills, R.B.H., Wong, A.W.K., Scriven, F.M. & Greenfield, H. (1984). Nutrient composition of Chinese vegetables. Journal of Agriculture and Food Chemistry 32: 413-416. Wright, K.H., Pike, O.A., Fairbanks, D.J. & Huber, C.S. (2002). Composition of Atriplex
hortensis, sweet and bitter Chenopodium quinoa seeds. Journal of Food Science 67: 1383-1385. INTERNET REFERENCES
Amaranth production: http://www.cofecyt.mincyt.gov.ar.pdf Cowpea production: http://www.hort.purdue.edu/newcrop.html Lupine production: http://www.ifi-online.com/Tmpl_Article_Overview.asp Mung bean production: http://www.pcarrd.dost.gov.ph/commodities/velero/index.php Quinoa production: http://campocoop.cl/docs/ProductionQuinoa