Diapositive 1 - Gameloft* Source: Gartner – Oct 2014 ** PWC Global Entertainment and Media outlook...
29
Transcript of Diapositive 1 - Gameloft* Source: Gartner – Oct 2014 ** PWC Global Entertainment and Media outlook...


* Source: Gartner – Oct 2014 ** PWC Global Entertainment and Media outlook 2014-2018 ***eMarketer – Jan 2015
A growing installed base : 1.9 billion smartphones (+4% YoY) and 273 million tablets (+8% YoY) are
expected to ship in 2015*
More than 1 billion people will use a tablet in 2015. representing 15% of world population*
Mobile gaming revenues are expected to reach US$15bn in 2018. growing at a CAGR of 9.6%**
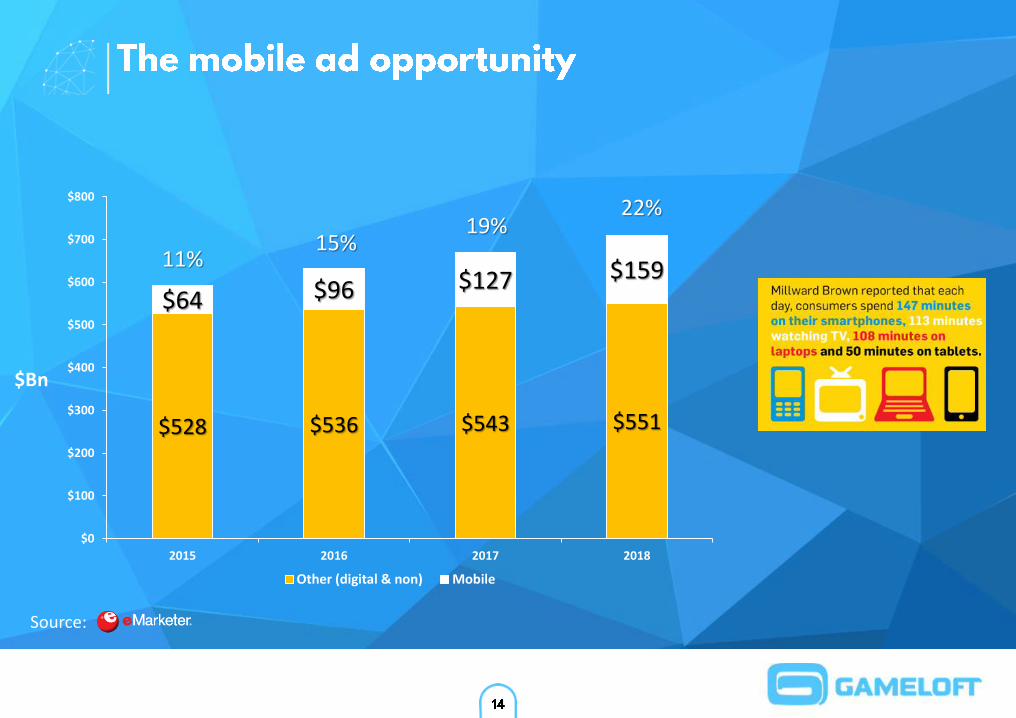
Advertisers will spend $64.5 billions on mobile phones in 2015 (+60% YoY)***

DEVICES
STORE OS
* Source: Consumer Electronic Association – January 2014
Gameloft develops its games on 7000 smartphone & 350 feature phone models in 16 languages and on
multiple operating systems (iOS. Android. WP8. etc.)
Flood of 50$-100$ smartphones & tablets: Average smartphone retail price expected at 297$ in 2014 vs.
345$ in 2013*


All Gameloft games are developed in-house. World class product
development and deployment on smartphones. feature phones. tablets.
smart TVs. Quality comes first.
Gameloft was the #2 publisher by combined iOS and Google Play games
downloads according to the 2014 App Annie Index. 700 million Gameloft
games were downloaded in 2014 on the AppStore and Google Play.
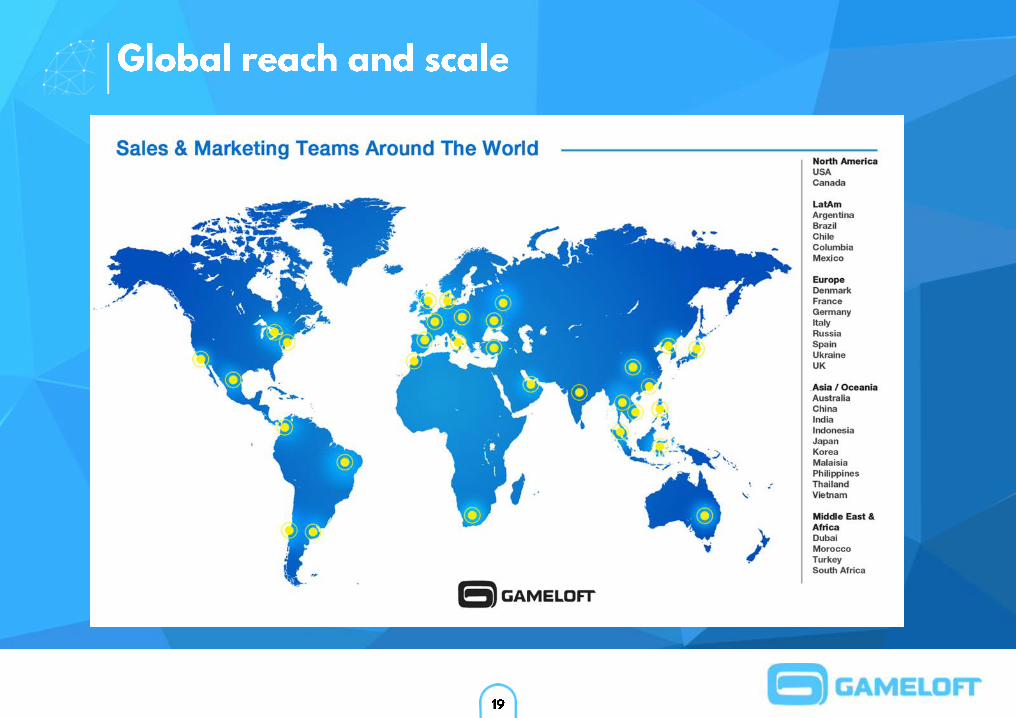
Our 28 studios are spread all over the world in America. Europe and Asia.
allowing Gameloft to benefit from cultural diversity and competitive
development costs. Gameloft releases ~20 smartphone and tablet games
every year thanks to its 5 400 developers.
Unique portfolio of in-house franchises and third party IPs.
Unique worldwide network of sales. marketing and PR people.
Partnerships with all major digital stores and social networks: App Store.
Google Play. Amazon. Microsoft Market Place. etc. and direct
agreements including billing agreements with over 200 carriers in more
than 80 countries.

Order & Chaos Online – monthly sales since launch Uno & Friends – monthly sales since launch
Despicable Me 2 – monthly sales since launch World at Arms – monthly sales since launch
avr.
-20
11
juil.
-20
11
oct
.-2
01
1
jan
v.-2
01
2
avr.
-20
12
juil.
-20
12
oct
.-2
01
2
jan
v.-2
01
3
avr.
-20
13
juil.
-20
13
oct
.-2
01
3
jan
v.-2
01
4
avr.
-20
14
juil.
-20
14
oct
.-2
01
4
jan
v.-2
01
5
juin
-20
13
juil.
-20
13
aoû
t-2
01
3
sep
t.-2
01
3
oct
.-2
01
3
no
v.-2
01
3
déc
.-2
01
3
jan
v.-2
01
4
févr
.-2
01
4
mar
s-2
01
4
avr.
-20
14
mai
-20
14
juin
-20
14
juil.
-20
14
aoû
t-2
01
4
sep
t.-2
01
4
oct
.-2
01
4
no
v.-2
01
4
déc
.-2
01
4
jan
v.-2
01
5
févr
.-2
01
5
juin
-20
13
juil.
-20
13
aoû
t-2
01
3
sep
t.-2
01
3
oct
.-2
01
3
no
v.-2
01
3
déc
.-2
01
3
jan
v.-2
01
4
févr
.-2
01
4
mar
s-2
01
4
avr.
-20
14
mai
-20
14
juin
-20
14
juil.
-20
14
aoû
t-2
01
4
sep
t.-2
01
4
oct
.-2
01
4
no
v.-2
01
4
déc
.-2
01
4
jan
v.-2
01
5
févr
.-2
01
5
no
v.-2
01
2
jan
v.-2
01
3
mar
s-2
01
3
mai
-20
13
juil.
-20
13
sep
t.-2
01
3
no
v.-2
01
3
jan
v.-2
01
4
mar
s-2
01
4
mai
-20
14
juil.
-20
14
sep
t.-2
01
4
no
v.-2
01
4
jan
v.-2
01
5

mai
-20
13
juil.
-20
13
sep
t.-2
01
3
no
v.-2
01
3
jan
v.-2
01
4
mar
s-2
01
4
mai
-20
14
juil.
-20
14
sep
t.-2
01
4
no
v.-2
01
4
jan
v.-2
01
5
déc
.-2
01
2
févr
.-2
01
3
avr.
-20
13
juin
-20
13
aoû
t-2
01
3
oct
.-2
01
3
déc
.-2
01
3
févr
.-2
01
4
avr.
-20
14
juin
-20
14
aoû
t-2
01
4
oct
.-2
01
4
déc
.-2
01
4
févr
.-2
01
5
Asphalt 8 – monthly sales since launch Six Guns – monthly sales since launch
Blitz Brigade – monthly sales since launch Heroes of Order & Chaos – monthly sales since launch
déc
.-2
01
1
févr
.-2
01
2
avr.
-20
12
juin
-20
12
aoû
t-2
01
2
oct
.-2
01
2
déc
.-2
01
2
févr
.-2
01
3
avr.
-20
13
juin
-20
13
aoû
t-2
01
3
oct
.-2
01
3
déc
.-2
01
3
févr
.-2
01
4
avr.
-20
14
juin
-20
14
aoû
t-2
01
4
oct
.-2
01
4
déc
.-2
01
4
févr
.-2
01
5
aoû
t-2
01
3
sep
t.-2
01
3
oct
.-2
01
3
no
v.-2
01
3
déc
.-2
01
3
jan
v.-2
01
4
févr
.-2
01
4
mar
s-2
01
4
avr.
-20
14
mai
-20
14
juin
-20
14
juil.
-20
14
aoû
t-2
01
4
sep
t.-2
01
4
oct
.-2
01
4
no
v.-2
01
4
déc
.-2
01
4
jan
v.-2
01
5
févr
.-2
01
5

Third party IPs
In house franchises

124m installs
23m installs
500m installs
100m installs
26m installs 43m installs
37m installs
52m installs
13m installs 40m installs
real
18m installs
68m installs 40 m installs
7m installs
36m installs 110m installs


Source:
22% 19%
11%
$528 $536 $543 $551
$64 $96 $127 $159
$0
$100
$200
$300
$400
$500
$600
$700
$800
2015 2016 2017 2018
Other (digital & non) Mobile
$Bn
15%
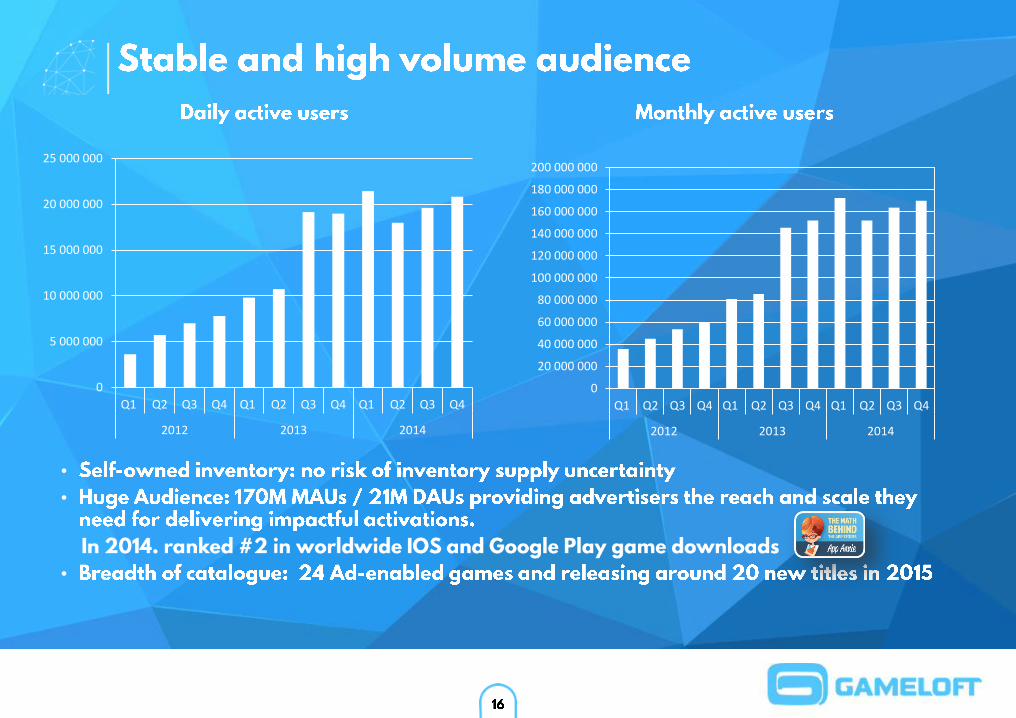
0
5 000 000
10 000 000
15 000 000
20 000 000
25 000 000
Q1 Q2 Q3 Q4 Q1 Q2 Q3 Q4 Q1 Q2 Q3 Q4
2012 2013 2014
0
20 000 000
40 000 000
60 000 000
80 000 000
100 000 000
120 000 000
140 000 000
160 000 000
180 000 000
200 000 000
Q1 Q2 Q3 Q4 Q1 Q2 Q3 Q4 Q1 Q2 Q3 Q4
2012 2013 2014
•
•
•

•
•
•
•
•
•
•


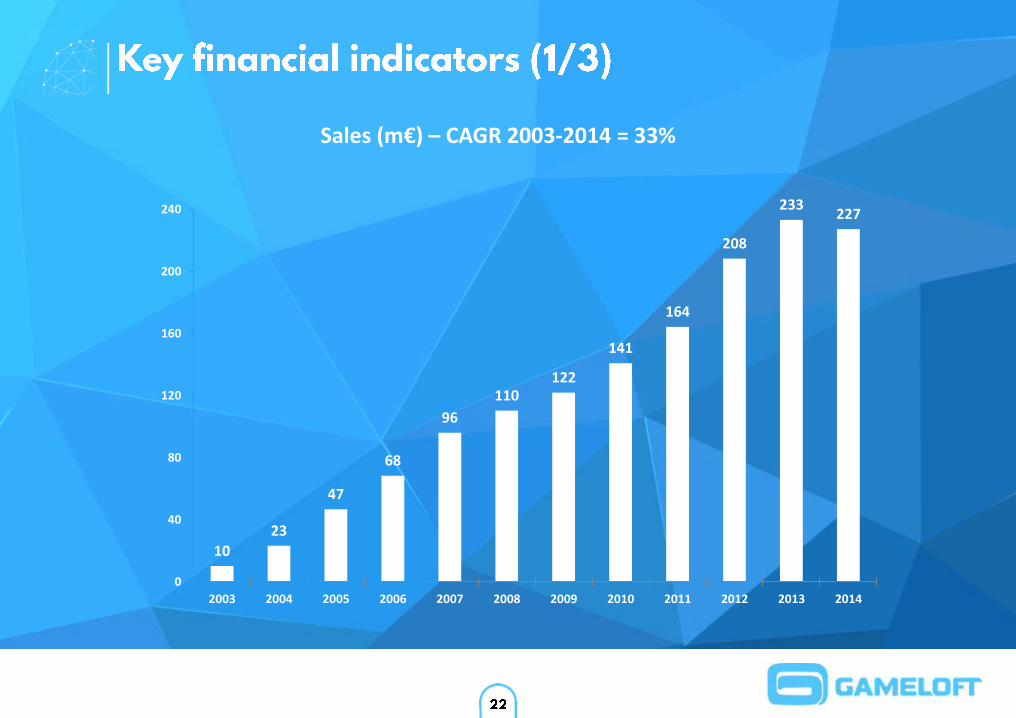
10
23
47
68
96
110 122
141
164
208
233 227
0
40
80
120
160
200
240
2003 2004 2005 2006 2007 2008 2009 2010 2011 2012 2013 2014
Sales (m€) – CAGR 2003-2014 = 33%

APAC 22%
North America 28%
EMEA 33%
LATAM 18%
2014 sales per region

154
486
1 197
694
1 388
-21
263
546 650
760
170
326
-200
0
200
400
600
800
1 000
1 200
1 400
1 600
2003 2004 2005 2006 2007 2008 2009 2010 2011 2012 2013 2014
Additional headcount
1,2 2,4 2,3 2,5 2,9 3,3
10,4
17,1
22,0 20,4
28,4
-1,1 -5,0
0,0
5,0
10,0
15,0
20,0
25,0
30,0
2003 2004 2005 2006 2007 2008 2009 2010 2011 2012 2013 2014
EBIT (m€)
2,4 1,9 1,4
16,3
-4,1 -1.8
6.0
13,6
18,2
9,3 7,5
-6,4 -10,0
-5,0
0,0
5,0
10,0
15,0
20,0
2003 2004 2005 2006 2007 2008 2009 2010 2011 2012 2013 2014
Net Profit (m€)
2,5 2,5
8,8
18,7 13,9
10,7
19,7 25,1
36,9
55,6 60,3
52,7
0,0
10,0
20,0
30,0
40,0
50,0
60,0
70,0
2003 2004 2005 2006 2007 2008 2009 2010 2011 2012 2013 2014
Net Cash (m€)

M€ 2014 % of sales 2013 % of sales
Sales 227.3 100% 233.3 100%
Cost of sales -40.1 -18% -40.5 -17%
Gross margin 187.2 82% 192.8 83%
R&D -118.5 -52% -106.8 -46%
Sales & Marketing -40.9 -18% -36.1 -15%
Administration -28.2 -12% -20.9 -9%
Other expenses -0.7 0% -0.4 0%
Current operating income -1.1 0% 28.4 12%
Stock-based compensation -3.1 -1% -3.5 -2%
Other operating revenues & expenses -0.7 0% -1.3 -1%
Operating income -4.9 -2% 23.6 10%
Net financial income 6.7 3% -7.5 -3%
Net income before tax 1.8 1% 16.1 7%
Income tax -8.1 -4% -8.5 -4%
Net income (group share) -6.4 -3% 7.5 3%

ASSETS (M€) 31/12/14 31/12/13
Intangible assets 8.5 8.1
Tangible assets 22.9 16.4
Non-current financial assets 5.9 6.7
Tax assets 16.5 11.2
Total non-current assets 53.7 42.5
Client receivables 63.9 62.8
Other receivables 27.3 20.6
Cash 56.3 61.8
Total current assets 147.4 145.2
TOTAL 201.1 187.7
LIABILITIES (M€)
Capital 95.4 92.8
Reserves 48.7 36.0
Net profit -6.4 7.5
Shareholders’ equity 137.8 136.3
Non-current liabilities 8.6 4.3
Current liabilities 54.7 47.1
TOTAL 201.1 187.7
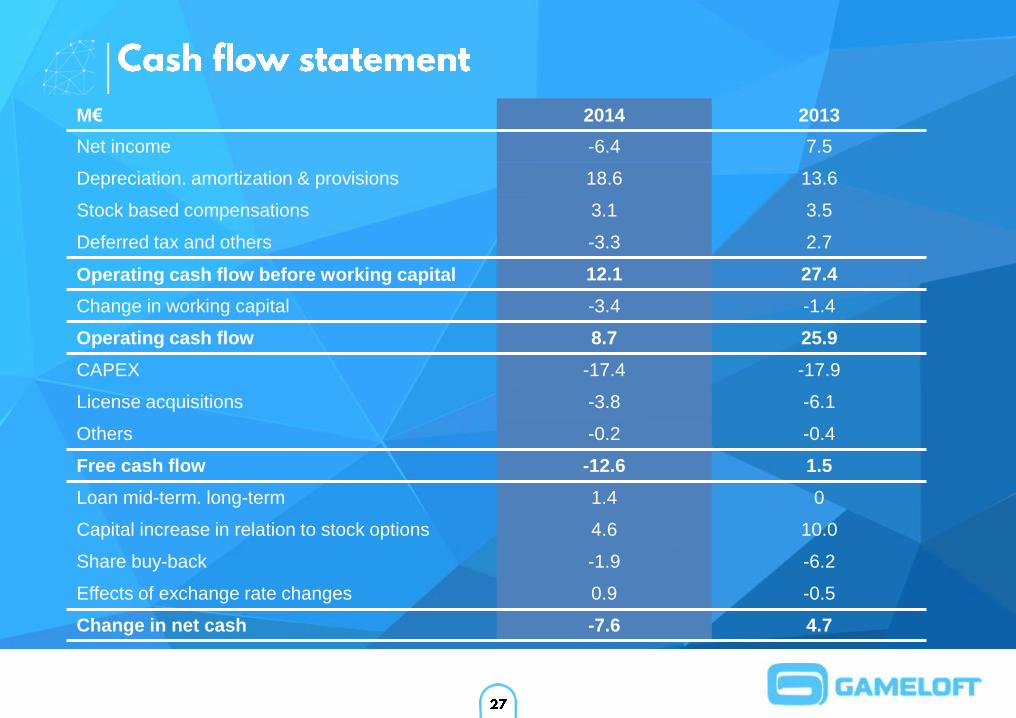
M€ 2014 2013
Net income -6.4 7.5
Depreciation. amortization & provisions 18.6 13.6
Stock based compensations 3.1 3.5
Deferred tax and others -3.3 2.7
Operating cash flow before working capital 12.1 27.4
Change in working capital -3.4 -1.4
Operating cash flow 8.7 25.9
CAPEX -17.4 -17.9
License acquisitions -3.8 -6.1
Others -0.2 -0.4
Free cash flow -12.6 1.5
Loan mid-term. long-term 1.4 0
Capital increase in relation to stock options 4.6 10.0
Share buy-back -1.9 -6.2
Effects of exchange rate changes 0.9 -0.5
Change in net cash -7.6 4.7

www.gameloft.com
Stock market Information
Listed on NYSE Euronext Paris
Level 1 ADR traded OTC in the US
Shares outstanding 85.625.097 (as of 31/12/2014)
Sector: Software
Identification Codes
ISIN: FR0000079600
Ordinary shares Mnemo: GFT
ADR ticker: GLOFY
Investor Contact
Laure d’Hauteville
Deputy CFO
Email: [email protected]

This statement may contain financial data evaluated. information
on future projects and transactions and on future economic results/performance.
Such valuations are provided for estimation purposes only.
They are subject to market risks and uncertainties and may vary significantly with
the actual results that shall be published.
The financial data evaluated have been presented to the Board of Directors
and have not been audited by the Auditors.