DEVELOPMENT OF MICROENCAPSULATION … Development of Microencapsulation-based Technologies for...
228
DEVELOPMENT OF MICROENCAPSULATION-BASED TECHNOLOGIES FOR MICRONUTRIENT FORTIFICATION IN STAPLE FOODS FOR DEVELOPING COUNTRIES By Yao Olive Li A dissertation submitted in conformity with the requirements for the degree of DOCTOR OF PHILOSOPHY Graduate Department of Chemical Engineering and Applied Chemistry University of Toronto © Copyright by Yao Olive Li 2009
Transcript of DEVELOPMENT OF MICROENCAPSULATION … Development of Microencapsulation-based Technologies for...

DEVELOPMENT OF MICROENCAPSULATION-BASED
TECHNOLOGIES FOR MICRONUTRIENT
FORTIFICATION IN STAPLE FOODS
FOR DEVELOPING COUNTRIES
By
Yao Olive Li
A dissertation submitted in conformity with the requirements
for the degree of DOCTOR OF PHILOSOPHY
Graduate Department of Chemical Engineering and Applied Chemistry
University of Toronto
© Copyright by Yao Olive Li 2009

ii
Development of Microencapsulation-based Technologies for Micronutrient
Fortification in Staple Foods for Developing Countries
Yao Olive Li
Doctor of Philosophy, 2009
Graduate Department of Chemical Engineering and Applied Chemistry
University of Toronto
ABSTRACT
A microencapsulation-based technology platform for effective delivery of multiple
micronutrients for food fortification has been developed. The technology, consisting of
extrusion agglomeration followed by encapsulation through surface coating, has been
successfully tested on three size scales in typical staple foods: as a surface treatment on salt
and sugar, on 20-100µm scale; in salt on a 300-1200 µm scale; and on reconstituted rice on
the 5-10 mm scale. The process results in effective delivery systems for one or more active
ingredients with organoleptic properties that are unnoticeable to the average consumer.
Particularly, salt double fortified with iodine and iron using the microencapsulated ferrous
fumarate premix made by the extrusion-based agglomeration process had acceptable sensory
properties and stability when stored at 40oC and 60% relative humidity (RH) for up to a year.
In these tests >85% of iodine and >90% of ferrous iron were retained.
Reconstituted Ultra Rice® grains made by extrusion stabilized by internal gelation has
resulted in improved grain integrity and a much simplified process, compared to the original,
patented surface crosslinking technique. The most effective internal gelation system is
composed of alginate, calcium sulphate (CaSO4), and sodium tripolyphosphate (STPP) at a
best ratio of 3%:3%:0.6% (w/w).
It is feasible to incorporate folic acid into the existing fortification programs using the

iii
technology platform developed in this study. The results indicate that the potential
interactions of folic acid with other added micronutrients or with the food vehicles could be
prevented by incorporating folic acid as a premix made by the extrusion-based technology.
Virtually no folic acid was lost after 9 months storage at 40oC and 60% RH when the folic
acid premix was added into salt or sugar samples.
The technical feasibility of the microencapsulation-based technology platform has been
successfully demonstrated for micronutrient delivery in food vehicles of different size
ranges, resulting in fortified staple foods with desired physical, chemical, nutritional, and
organoleptic properties. The technology should be adaptable to formulating customized
delivery systems of active ingredients for broader applications, and promises to bring
immediate benefits in combatting micronutrient deficiencies, that will have far reaching
effects in health and social development.

iv
DEDICATIONS
I dedicate the culmination of my formal studies to my parents:
Drs. Wentong Li & Shukun Chen
I dedicate this thesis
to my husband, Shujun, and my daughter, Grace
for their love, patience, support, accommodation…
to myself
as a great fortieth birthday gift
and as a new start of my academic career in Canada
v
ACKNOWLEDGEMENTS
The over six years that I have spent here at University of Toronto in pursuit my Master’s and
doctorate degrees will always be a remarkable period of time in my life. There are so many
people that I would like to express my appreciation for their helps in making my learning
journey here such a great experience.
First of all, I would like to express my greatest gratitude to my supervisor, Dr. L. L. Diosady,
for his continuous guidance and support. His faith in my capability and the research freedom
he gave to me enabled me to develop my professional skills over the course. The appreciable
influence from him, a widely respected professor, has inspired me to re-start my dreamed
career in academia in Canada. I am honoured to be your student!
I am very grateful to my reading committee members, Dr. E. Acosta and Dr. B. Saville, who
have imparted their knowledge, visions, and critical thinking onto me throughout my
dissertation process. Your generous support and invaluable advices are well appreciated!
I am also thankful to my oral committee members, Dr. Y. L. Cheng and Dr. E. Edwards, who
provided me invaluable suggestions from my thesis structure to the technical contents; Dr. V.
Rao and Dr. T. Oshinowo as my chairs of the two oral defenses, who initiated insightful
discussions between me and the exam committees; Dr. D. Rousseau from Ryerson
University as my external appraiser, who reviewed my thesis carefully and provided me
constructive criticisms in helping me improve my thesis. I surely learned a lot from all of
you during the two oral exams, which made me truly understand the meaning of the title of a

vi
doctorate.
Parts of the research work were financially sponsored by the Micronutrient Initiative (MI)
and the Program for Appropriate Technology in Health (PATH). I would then acknowledge
the financial and technical support from the organizations and the staffs, particularly with Mr.
Venkatesh Mannar and Dr. Annie Wesley from MI, and Dr. Ted Greiner and Ms. Shirley
Jankowski from PATH.
During my six years research many people from U of T or other academic institutions have
kindly offered me the technical assistances in conducting certain analyses and measurements.
I have to say thank you to: Mr. Dan Mathers and Ms. Ying Lei Wania from the ANALEST in
the Department of Chemistry, Mr. Sal Boccia from the Microanalysis Centre of the
Department of Material Science and Engineering, Dr. Rana Sodhi from the Surface Interface
Ontario in the Department of Chemical Engineering and Applied Chemistry, Mr. Dave Sohn
from Professor Yu-ling Cheng’s research group, Dr. Supratim Ghosh and Dr. Misael
Miranda from Professor Derick Rousseau’s research group at the University of Ryerson.
Over the course many undergraduate students and visiting scholars have involved in my
research projects, and it was great experience to work together with them. Special thanks go
to Adrew Barquin, Pauline Rabier, and Haeyeon Lee for their contributions to my
experimental work.
I am especially thankful to the members of the Food Engineering Group, in particular

vii
Professor Toks Oshinowo and Mr. Bih King Chen, for their great support and suggestions. I
value the friendship of Judy Ue, Jessica Yuan, Katarina Rutkowski, Narongechai
Prapakorenwerzya, Crystal Lo, and Divya Yadava. Thank you for the insightful discussions
between us, and the joy and sadness that we experienced together over the past years.
Finally, I would dedicate all I have achieved to my family – my parents, my husband and my
daughter. Without your unconditional love, support, and patience, I could not have come to
thus far.

viii
TABLE OF CONTENTS
ABSTRACT……………………………………….………………………………….....…...ii
ACKNOWLEDGEMENTS……………………..……………………………….…………...v
TABLE OF CONTENTS……………………….……………………….………..………viii
LIST OF FIGURES……………………………………………………..….…………...xii
LIST OF TABLES……………………………………………………………………....….xv
LIST OF APPENDICES …………………………………………………………………xvii
1 INTRODUCTION………………………………………………………………………1
2 RESEARCH OBJECTIVES, SCOPE & APPROACHES…………………………...1
2.1 Research Objectives…………………………………………………………………7
2.2 Research Scope………………………………………………………………………8
2.3 Research Approaches & Anticipated Outcomes……………………………………..9
3 RESEARCH BACKGROUND………………………………………………………..13
3.1 Micronutrient Deficiencies…………………………………………………………13
3.2 Food Fortification…………………………………………………………………..14
3.2.1 Food Vehicle Selection………………………………………………………15
3.2.2 Fortification Techniques Used in Existing Programs………………………..16
3.2.3 Current Challenges in Food Fortification Programs…………………………17
3.3 Microencapsulation…………………………………………………………………18
3.3.1 Microencapsulation Techniques……………………………………………..20
3.3.2 Microencapsulation in the Food Industry……………………………………27
3.3.3 Coating Materials Used For Microencapsulation in the Food Industry……..30
3.3.4 Microencapsulation of Vitamins and Minerals………………………………32
3.3.5 Microencapsulation Techniques Used in This Research Group……………..33
4 RESEARCH APPROACH 1 - SALT GRAIN-SIZED IRON PREMIX MADE BY
EXTRUSION & POLYMER COATING FOR SALT DOUBLE FORTIFICATION…36
4.1 Research Incentive and Hypothesis………………………………………………...36
4.2 Experimental Materials & Methods………………………………………………..39
4.2.1 Materials……………………………………………………………………..39
4.2.2 Equipment……………………………………………………………………40

ix
4.2.3 Experimental Procedures…………………………………………………….43
4.2.4 Analytical Methods…………………………………………………………..45
4.3 Results & Discussion……………………………………………………………….47
4.3.1 Investigation on Extrusion…………………………………………………...47
4.3.1.1 Binder selection……………………………………………………….48
4.3.1.2 Optimization of the extrusion operation………………………………52
4.3.2 Investigation on Colour-Masking Process…………………………………...54
4.3.2.1 Different techniques for applying TiO2……………………………….56
4.3.2.2 Alternative colour-masking agents……………………………………58
4.3.3 Investigation on Encapsulation Using Glassy Polymer Coatings……………59
4.3.3.1 Comparison between MethocelTM and Kollicoat®……………………61
4.3.3.2 Comparison between pan coating and fluidized bed coating…………61
4.3.4 Formulation Optimization…………………………………………………...62
4.3.4.1 Iron content in optimized formulations……………………………….64
4.3.4.2 In vitro iron bioavailability in optimized formulations ……………….65
4.3.4.3 Iron premix integrity in pH 4 HCl solution…………………………...67
4.3.4.4 Effect of formulation ingredients & processing techniques on density.70
4.3.4.5 Physical characteristics of the microencapsulated iron premixes……..71
4.3.5 Stability Test in DFS Samples……………………………………………….72
4.3.5.1 Iodine stability………………………………………………………...72
4.3.5.2 Ferrous iron stability…………………………………………………..76
4.3.6 Iodine and Iron Interaction in DFS…………………………………………..78
4.3.7 Iodine Degradation Kinetics in DFS…………………………………………80
4.4 Summary of Research Approach 1…………………………………………………82
5 RESEARCH APPROACH 2 - ULTRA RICE®
AS MICRONUTRIENT DELIVERY
VEHICLE USING LARGE PARTICLES………………………………………………..83
5.1 Project Background & Research Incentive…………………………………………83
5.2 Literature Review on Alginate Chemistry & Internal Gelation…………………….85
5.3 Experimental Strategy Towards Formulation Design………………………………88
5.4 Experimental Materials & Methods ………………………………………………..89
5.4.1 Materials……………………………………………………………………..89
x
5.4.2 Experimental Methods……………………………………………………….90
5.5 Results & Discussion……………………………………………………………….93
5.5.1 Preliminary Investigations…………………………………………………...93
5.5.1.1 Effect of different alginate sources on the internal gelation…………..94
5.5.1.2 Effect of different calcium salts on the internal gelation……………...95
5.5.1.3 Effect of different sequestrants on the internal gelation………………97
5.5.1.4 Effect of different calcium-sequestrant ratios on the internal gelation..98
5.5.1.5 Investigation of other ingredients & procedures for dough mixing…..98
5.5.2 Formulation Optimization………………………………………………….100
5.5.2.1 Orthogonal experiment………………………………………………100
5.5.2.2 Verification of the optimal ratios…………………………………….103
5.5.3 Test of the Optimized Gelation Systems in Nutrient Fortified Formulations110
5.5.4 Texture Measurements on the Best Formulations…………………………..112
5.5.5 Mechanism of Alginate-Calcium Interaction in the Ultra Rice® System…..115
5.6 Summary of Research Approach 2………………………………………………..117
6 RESEARCH APPROACH 3 - FOLIC ACID TESTS……………………………...120
6.1 Research Incentive – Folate Deficiency…………………………………………..120
6.2 Literature Review on Folic Acid Chemistry………………………………………122
6.2.1 Physiochemical Properties………………………………………………….122
6.2.2 Biological Functions………………………………………………………..123
6.2.3 Food Fortification with Folic Acid…………………………………………123
6.2.4 Concerns Related to Folic Acid Fortification………………………………125
6.2.5 Issues of Folate Bioavailability…………………………………………….125
6.2.6 Stability of Folic Acid………………………………………………………127
6.3 Project Goals & Anticipated Challenges ………………………………………….130
6.4 Experimental Materials & Methods ………………………………………………131
6.4.1 Materials……………………………………………………………………131
6.4.2 Experimental Design……………………………………………………….132
6.4.3 Analytical Methods…………………………………………………………136
6.5 Results & Discussion……………………………………………………………...138
6.5.1 Folic Acid Fortification in Guatemalan Salt and Sugar…………………….138

xi
6.5.1.1. Folic acid stability…………………………………………………...139
6.5.1.2. Iodine stability in Guatemalan iodized salt...……………………….140
6.5.1.3. Vitamin A stability in Guatemalan vitamin A fortified sugar..………141
6.5.1.4. Colour Stability……………………………………………………...142
6.5.2 Folic Acid Fortification in Multiple Fortified Ultra Rice®………………....143
6.5.2.1 Ultra Rice® appearance and colour stability………………………....143
6.5.2.2 Folic acid stability …………………………………………………...147
6.5.3 Interactions of Folic Acid with Other Micronutrients……………………...148
6.6 Summary of Research Approach 3 ………………….……………………………150
7 CONCLUSIONS……………………………………………………………………...152
8 RECOMMENDATIONS …………………………………………………………….154
9 REFERENCES……………………………………………………………………….157
10 NOMENCLATURE…………………………………………………………………168
11 APPENDICES……………………………………………………………………….172

xii
LIST OF FIGURES
Figure 2.1 Overview of the project scope 9
Figure 3.1 Schematic relationship between the core material, the wall material, and the required technique used in microencapsulation systems
19
Figure 3.2 Microcapsules and microspheres 21
Figure 3.3 Molecular structure and microstructure of beta-cyclodextrin 26
Figure 4.0 Surface defects on encapsulated ferrous fumarate using fluidized-bed agglomeration and soy stearine as the coating material
36
Figure 4.1 Schematic process flow for making microencapsulated FeFum 37
Figure 4.2 Ultra Power® Series KitchenAidTM Stand Mixer 40
Figure 4.3 La Monferrina P12 Pasta Extruder and other components: die and cutter
40
Figure 4.4 Schematic diagram for Uni-Glatt top spray fluidized bed assembly 42
Figure 4.5 Laboratory pan coating assembly 42
Figure 4.6 Effect of binder materials on iron digestibility of the extruded particles
65
Figure 4.7 Effect of different coating materials on iron digestibility of the microencapsulated premixes
66
Figure 4.8 Effect of each step of the encapsulation process on iron digestibility 67
Figure 4.9 Effect of binders on particle integrity when dissolved in pH 4 HCl solution
68
Figure 4.10 Effect of each step of the encapsulation process on iron premix integrity in pH 4 HCl solution
69
Figure 4.11 Iodine stability in DFS samples containing various FeFum forms – powder, extruded and colour-masked particles, as well as encapsulated premixes, after one-year storage at 40oC and 60% RH
74
Figure 4.12 Relative iodine retention in the DFS samples containing different sources of FePP during 6 months storage at 40oC and 60% RH
75
Figure 4.13 Ferrous iron stability in various FeFum forms and in DFS samples, after 10 months storage at the ambient condition and one-year storage under 40oC and 60%RH, respectively
77
Figure 4.14 Iodine-iron interaction in DFS – correlation analysis between iodine and ferrous iron losses in the DFS samples containing various iron particles after one year storage under 40oC and 60% RH
79

xiii
Figure 4.15 Correlation of iodine degradation in the DFS samples with a first-order degradation pattern
80
Figure 4.16 Apparent first order degradation kinetics of iodine in the DFS samples made with various iron particles during one-year storage under 40oC and 60% RH
81
Figure 5.1 Schematic process flow of Ultra Rice® 83
Figure 5.2 Structural characteristics of alginate and the egg-box structure formed by alginate-Ca gelation
86
Figure 5.3 Factors affecting alginate-Ca reaction 88
Figure 5.4 Statistical analyses of the best level for each factor 103
Figure 5.5 Comparison of grain appearance made with glutinous flour in place of regular rice flour
107
Figure 5.6 Comparison between glutinous flour and regular rice flour using the best ratio and addition of HPMC
107
Figure 5.7 Colour measurements of the four new formulations made with the optimized internal gelation systems
111
Figure 5.8 Micronutrient fortified Ultra Rice® formulations made with the optimized internal gelation systems
111
Figure 5.9 Two proposed models for alginate-calcium gelation in Ultra Rice®: “fish-net” model for external/diffusion setting (left) and “inter-lock” model for internal setting (right)
116
Figure 5.10 Alginate-calcium gel structure made with external (left) and internal (right) gelation processes
116
Figure 6.1 Chemical structure of folic acid 122
Figure 6.2 Chemical structure of folate 122
Figure 6.3 Oxidative cleavage products of folates 128
Figure 6.4 Cleavage products of folic acid under acidic and alkaline conditions 128
Figure 6.5 Folic acid retentions in the fortified Guatemalan salt samples during 9 months storage at 40oC and 60% RH
139
Figure 6.6 Folic acid retentions in the fortified Guatemalan sugar samples during 9 months storage at 40oC and 60% RH
140
Figure 6.7 Iodine retentions in the fortified Guatemalan salt samples during 9 months storage at 40oC and 60% RH
141
Figure 6.8 Vitamin A retentions in the fortified Guatemalan sugar samples during 9 months storage at 40oC and 60% RH
142
Figure 6.9 Colour stability of the Ultra Rice® grains made with various FePP sources
144
xiv
Figure 6.10 Colour stability in the Ultra Rice® grains made with Dr Lohmann FePP at different addition levels
144
Figure 6.11 Colour stability of Ultra Rice® grains with addition of TiO2 as the colour-masking agent at different levels
145
Figure 6.12 Colour stability of Ultra Rice® grains made with higher levels of folic acid and FePP
145
Figure 8.1 Model premix system for salt fortification made by the extrusion agglomeration followed by polymer coatings
155
Figure 8.2 Model Ultra Rice® premix made by extrusion using internal gelation and followed by polymer coatings for delivering multiple micronutrients
155
Figure 8.3 Model Ultra Rice® premix made by extrusion using internal gelation, containing sub-capsules of microencapsulated premixes of iron and vitamin A made by extrusion-based technology platform
156

xv
LIST OF TABLES
Table 3.1 Applications of microencapsulation technology 19
Table 3.2 Microencapsulated food ingredients 29
Table 3.3 Commonly used coating materials for microencapsulation of food ingredients
31
Table 4.1 List of chemicals used in the research approach 1 39
Table 4.2 Effect of water content on extrusion operability 52
Table 4.3 Surface defects on the final products caused by the loss of TiO2 during coating
56
Table 4.4 Comparison of particle colour when TiO2 was incorporated in the dough formulation before extrusion
56
Table 4.5 Comparison of different colour-masking agents 59
Table 4.6 Formulation variables investigated in the optimization study 63
Table 4.7 Formulation design of microencapsulated FeFum premixes made by extrusion and polymer coatings
63
Table 4.8 Total iron and ferrous iron contents in the 12 final formulations 64
Table 4.9 Effect of coating materials on premix integrity in pH 4 HCl solution 68
Table 4.10 Bulk density changes in iron particles after each processing step 70
Table 4.11 Comparison of particle densities of various premixes and raw ingredients
71
Table 4.12 Iodine first order degradation rate constant (k) and the storage half-life estimated for the DFS samples containing various FeFum particles when stored at 40oC and 60% RH
81
Table 5.1 List of materials used in the formulations of Ultra Rice® 89
Table 5.2 Effects of different alginate sources on extrusion operability 94
Table 5.3 Grain integrity and sensory properties of the simulated rice made with different alginate sources
95
Table 5.4 Effects of different Ca sources on extrusion operability and grain integrity using the internal gelation process in the absence of sequestrants
96
Table 5.5 Comparison of different Ca sources using the internal gelation process in the presence of STPP as a sequestrant
97
Table 5.6 Comparison of different sequestrants in the internal gelation process using same alginate and Ca sources
97
Table 5.7 Effect of different CaSO4 to sequestrant ratios on grain integrity 98
xvi
Table 5.8 A 3x3 orthogonal design for formulation optimization 101
Table 5.9 Detailed experimental trials for orthogonal study 101
Table 5.10 Results of the grain integrity tests in the formulations prepared by the orthogonal design
102
Table 5.11 Statistical analyses of orthogonal study results 102
Table 5.12 Comparison of two best ratios of alginate/CaSO4/STPP using alternative alginate sources
103
Table 5.13 Verification of the best ratio (alginate/CaSO4/STPP = 3/3/0.6) using various alginate sources
104
Table 5.14 Investigation on increased concentration levels of alginate and CaSO4
105
Table 5.15 Verification of the best ratio with various calcium compounds 105
Table 5.16 Verification of the best ratio with various sequestrant compounds 106
Table 5.17 Effect of using glutinous rice flour on the grain properties 108
Table 5.18 Effect of HPMC on enhanced grain integrity with the best gelation ratio used
108
Table 5.19 Comparison of alternative blending processes on grain integrity with the best ratio used
109
Table 5.20 Micronutrient retentions in the four new formulations made with the optimized internal gelation systems
112
Table 5.21 Texture measurements on the Ultra Rice® grains made in the optimization study
113
Table 6.1 List of chemicals used in the study of folic acid fortification 131
Table 6.2 Experimental design for incorporating folic acid in Guatemalan salt and sugar
133
Table 6.3 Experimental design for preparing folic acid fortified Ultra Rice® formulations
135
Table 6.4 Folic acid concentration in the final formulations of the Guatemalan fortified salt and sugar samples for storage stability test under 40oC and 60% RH
138
Table 6.5 Folic acid retention in the Ultra Rice® samples made with various FePP sources and at different addition levels
147

xvii
LIST OF APPENDICES
Appendix 11.1.1 Analytical methods used in research approach 1 172
Appendix 11.1.2 Preliminary observations on suitability of different binder materials
174
Appendix 11.1.3 Specifications of the three cereal flours used as binders in the study
175
Appendix 11.1.4 Preliminary investigation of dextrin and HPMC as secondary binders
176
Appendix 11.1.5 Comparison of extrudability and product characteristics between three cereal flours used in the study as binders
177
Appendix 11.1.6 Comparison on the effectiveness of TiO2 adhesion before and after drying
178
Appendix 11.1.7 Comparison of surface morphology in the premixes made by different coating materials
178
Appendix 11.1.8 Development of standard protocols for encapsulation operation using the fluidized bed and the pan coater
179
Appendix 11.1.9 Detailed composition of the 12 final microencapsulated FeFum premixes
183
Appendix 11.1.10 Iron in vitro bioavailability test results of the optimized formulations of microencapsulated FeFum premixes
185
Appendix 11.1.11 Particle integrity dissolution test results of the optimized formulations of microencapsulated FeFum premixes
186
Appendix 11.1.12 Physical characteristics of the final premixes 187
Appendix 11.1.13 SEM images of the final FeFum premixes (at ~5000 magnification)
188
Appendix 11.1.14 Relative iodine retention in DFS samples containing various FeFum particles during one year storage under 40oC and 60% RH
189
Appendix 11.1.15 Ferrous iron retention in formulated FeFum particles and in DFS samples, when stored at the ambient condition and the higher conditions of 40oC & 60% RH, respectively
190
Appendix 11.1.16 Detailed data processing for analysing iodine-iron interaction in DFS
191
Appendix 11.2.1 Ranking scheme for measurement of grain integrity during soaking and cooking
192
Appendix 11.2.2 Texture measurement on cooked Ultra Rice® grains for grain integrity
196

xviii
Appendix 11.2.3 Detailed compositions of the final 4 formulations used for verifying the optimal internal gelation systems in the actual nutrient-fortified formulations
197
Appendix 11.2.4 XPS and ToF-SIMS measurements on Ultra Rice® 199
Appendix 11.3.1 Folic acid determination protocols 203
Appendix 11.3.2 Colour stability of the double or triple fortified Guatemalan salt or sugar samples after 3 months storage under 40oC and 60% RH
209
Appendix 11.3.3 Folic acid-containing multiple fortified Ultra Rice® appearance 210

1
1 INTRODUCTION
Micronutrient deficiencies are widespread health problems, especially in developing
countries. The deficiencies in vitamin A, iron, and iodine have been identified as the greatest
concern, as they affect over one third of the world’s population (WHO, 1995). In addition,
these micronutrients interact with each other, i.e., synergistic effects between iodine
deficiency disorder (IDD) and iron deficiency anemia (IDA), or between vitamin A
deficiency (VAD) and IDA to deepen their negative impacts (Clydesdale & Weimer, 1985;
Lonnerdal, 2004; Lynch, 1997; Zimmermann et al., 2004). Deficiencies typically coexist in
children in developing countries (Zimmermann et al., 2000). Due to the beneficial metabolic
interactions of iron, iodine and vitamin A (IVACG, 1998), it would be beneficial to develop a
multiple nutrient delivery system to attack the problems simultaneously.
Micronutrient deficiencies can be addressed by changes in the diet, supplementation, and the
fortification of food with selected nutrients. While dietary modification is desirable, it is a
long-range solution and may require changes in food preparation practices and social
customs. Supplementation is an effective and rapid approach, but it requires appropriate
medical infrastructure/administration and thus it is costly. Food fortification is a
cost-effective intervention that does not require any conscious action by the consumer, and
needs no changes in the dietary habits of the target populations. Moreover, it is readily
adapted into existing food production and distribution systems.
Food fortification has been extensively used for many years as a cost-effective strategy for
combating micronutrient deficiencies. Many fortification programs have been implemented
worldwide, including universal iodization of salt and enrichment of B vitamins in wheat
flour. Iodized salt now reaches some 70% of the world's population, significantly reducing
the incidence of iodine deficiency disorders (IDD) over the past two decades (United
Nations, 2008). The introduction of folic acid into cereal-grain products in over 40 countries
has resulted in dramatically increased folate status and significant reduction in the risk of
neural tube defects in newborns (Buttriss, 2005). Successful fortification programs may
involve different social, technical, and political challenges, yet they all have some common

2
features, i.e., they are effective in reducing the prevalence of specific micronutrient
deficiencies, they are economically viable, and the fortified products enjoy consumer
acceptance.
To meet these criteria, several technical factors need to be considered, including the
selection of appropriate food vehicles and fortificant forms, as well as determination of
fortification levels and appropriate quality assurance and quality control of the fortified food
products. Among these, food vehicle selection is the primary factor that plays a key role in
determining whether food fortification programs could be more beneficial compared to the
other two strategies – supplementation and dietary diversification. Obviously, the selection
of an ideal carrier guarantees that the micronutrients reach the largest number of people and
the fortification strategy remains as the best long-term approach and the cheapest way to
initiate and maintain the desired micronutrient levels in the diet.
Many foods or food ingredients have been considered for fortification, including cereal and
grain products, milk and dairy products, fats and oils, infant formula and weaning foods,
condiments such as salt, sugar, and monosodium glutamate (MSG), as well as a range of
processed foods (Lofti et al., 1996). It is generally accepted that staple foods, such as salt,
sugar, wheat flour, and rice, are good carriers for fortification, since they are regularly
consumed by all of the target population at a fairly constant rate, and are relatively
inexpensive so that all segments of the target population could afford them. The global salt
iodization is an example of effective programs that improve human nutrition, mainly due to
the attributes of the food vehicle – salt. It is universally consumed and is open to a simple
fortification technique, which makes the program affordable.
Another important technical factor is the selection of appropriate forms of fortificants. Some
vitamins and minerals could be simply added into selected food carriers in powder form,
which involves solid-solid blending or solid-liquid mixing. These methods are
straightforward and low in cost, but usually ineffective in protecting the micronutrients
within the fortified foods. Moreover, the incorporation of these minor ingredients often
causes undesirable sensory changes in the fortified foods, such as off-flavours or colours
3
caused either by the additives themselves or the interactions between the additives and the
food vehicles. Ignoring sensory effects and physical/chemical properties leads to major
concerns regarding product stability and consumer acceptance that may jeopardize the
success of a fortification program. Therefore, appropriate technology must be used in
delivering fortificants into fortified foods.
A major challenge for food fortification programs is the development of stable forms of
micronutrients that overcome the instability of vitamins and the reactivity of minerals. For
instance, vitamin A is sensitive to almost all environmental factors, including light, heat,
oxygen, and chemical interactions. The difficulty with iron is in finding an appropriate
chemical form which is adequately absorbed and yet does not alter the appearance or taste of
the food vehicle (Mannar & Gallego, 2002). In addition, the presence of reactive iron
compounds significantly affects the stability of other vitamins added in the same food matrix.
This makes it even more difficult to develop a multiple-fortified food, particularly with
vitamin A and iron. Appropriate technologies are thus required to prevent possible
interactions between added micronutrients and the food system, and subsequently ensure the
stability, bioavailability, and desired sensory properties of the fortified food through
production, distribution, retail, and food preparation.
Previous experience in our research group with double-fortified salt and multiple-fortified
rice has revealed that the best approach for delivering two or more micronutrients
simultaneously in a stable and bioavailable form without interaction and degradation, is to
microencapsulate them in an inert, but digestible matrix. Appropriate microencapsulation
technology will maintain the active ingredients in a stable environment, separated from other
food components and other added micronutrients.
Under the direction of Professor L. L. Diosady, the Food Engineering Group at the
University of Toronto developed microencapsulation-based technology for the double
fortification of salt with iron and iodine. Initially, selected iodine compounds were
encapsulated in modified starches, gelatin, and sodium hexametaphosphate (SHMP) by
spray drying and fluidized bed coating. The encapsulation process was later adapted to
4
produce a coated iron premix, consisting of encapsulated ferrous fumarate (Canadian Patent
2238925). R. Yusufali (2002) developed a two-step encapsulation process, starting with
particle agglomeration followed by pan coating. Dextrin was used to mix with the selected
iron or iodine compounds and the mixture was agglomerated into fine particles, which were
then encapsulated by a colour-masking agent and a lipid coating. The double-fortified salt
(DFS) prepared by this approach demonstrated good iodine stability (Yusufali, 2002).
The process was tested on different scales in several countries under the sponsorship of the
Micronutrient Initiative (MI). The field tests have shown that the DFS is effective in
reducing the incidence of iron deficiency anemia (IDA) and iodine deficiency disorder
(IDD); also it is acceptable in terms of organoleptic properties (Oshinowo et al., 2004 &
2007).
Another research activity in this research group is related to rice fortification via the
so-called Ultra Rice® technology, which involves producing reconstituted rice grains by
extrusion. Specifically, the selected micronutrients, either vitamin A or iron-containing
multiple nutrients are added into rice flour, blended with other components, including
antioxidants, stabilizers, sodium alginate, water and shortening, to form rice dough, which is
then extruded to form rice-shaped kernels. After extrusion, CaCl2 solution is sprayed on the
extruded rice grains, and the crosslinking reaction between calcium and alginate form the
hard surface of the simulated rice, which is the core of the Ultra Rice® technology. The rice
grains thus produced, which have high concentrations of selected micronutrients, are then
blended with normal market rice to achieve desired dietary intake levels.
So far, two successful formulations of Ultra Rice® grains have been developed, one fortified
with vitamin A and the other containing multiple micronutrients including iron, zinc and
several B vitamins. This technology has also been field tested in several countries, and
demonstrated acceptable results in terms of product stability, sensory properties, and clinical
effectiveness (PATH, 2007).
The Ultra Rice® grains made by extrusion are actually encapsulated forms of the selected
5
micronutrients with high concentrations, which are similar to those of microencapsulated
iron premix added into iodized salt. These processes, compared to basic fortification
techniques which involve mainly a powder-mixing process, have introduced a new concept,
where the selected micronutrients are added as concentrated, encapsulated premixes with
modified physical and chemical properties, favourable for adding into selected food carriers.
This research experience has revealed that microencapsulation could protect the stability of
micronutrients without greatly reducing their bioavailability when absorbed in the body.
Microencapsulation can also improve the sensory properties of the fortified foods by hiding
the undesirable colours and tastes from the fortificants and by preventing the interactions
between the fortificants and the food carrier. The microencapsulation-based technology
allows the fortificants to be delivered in appropriate forms that resemble the physical
characteristics of the selected food vehicles, in terms of shape, size, colour, and appearance.
We then hypothesize that microencapsulation-based approach is a feasible solution for
multiple micronutrient fortification of a wide variety of staple foods. Staple foods are
typically presented to the consumer as solids with particle sizes ranging from several
hundred microns to several millimeters. To prevent particle segragation, which may result in
potential under- or over-dosing, micronutrients must be added in forms that either stick to
the food particles, or in agglomerated premixes that match the particle size, and if possible,
the particle density of the food. Succesful food fortification processes require that the added
micronutrients are evenly distributed and are unnoticeable to the consumer. Thus the
complete delivery system must match the food in colour and appearance, and must not alter
the food flavour. Therefore, the added micronutrients must be introduced in a form that
achieves these criteria.
Based on the above considerations, a two-step process based on extrusion agglomeration
followed by surface coating was proposed as the basis of a flexible technology platform for
effective delivery of multiple micronutrients. Specifically, the selected micronutrients could
be agglomerated first to form particles with sizes matching that of the selected staple foods
to ensure stable distribution, without segregation. The appropriately sized micronutrient
particles could then be coated with appropriate polymer materials to obtain modified

6
physical/chemical properties, including improved organoleptic properties and enhanced
stability, suitable for adding into the selected food matrices. The goal of the program,
therefore, is to develop a technology platform and to demonstrate its feasibility for effective
delivery of multiple micronutrients in the selected staple foods by using premixes on
different size scales to suit a wide variety of food matrices.

7
2 RESEARCH OBJECTIVES, SCOPE & APPROACHES
2.1 Research Objectives
As discussed earlier, the technologies of double fortified salt (DFS) and Ultra Rice® have
been field-tested in several countries and achieved acceptable results in terms of product
stability, sensory properties for consumer acceptance, as well as clinical efficacy in reducing
the prevalence of certain micronutrient deficiencies. However, there are several problems
remaining in the current systems. In the case of microencapsulated ferrous fumarate for salt
fortification, the iron premix has a porous texture and surface defects, which may result in
unwanted interactions and sensory changes in the double fortified salt (DFS). Also the low
density of the premix causes the iron particles to float on the surface of water, and then may
be unintentionally removed by the cook as impurities during salt washing.
The problems with Ultra Rice® grains are related to the marginally acceptable colour and
somewhat brittle texture that is probably due to the imperfect crosslinking of
alginate-calcium at the grain surface. The distribution of alginate during extrusion and
calcium during the over-spraying process may not be uniform, which then directly affects
their crosslinking at the grain surface and subsequently the grain integrity during washing
and cooking.
As indicated earlier, the overall objective of the research program is to develop a technology
platform for the delivery of multiple micronutrients in a variety of staple foods. To achieve
this goal, I proposed that processes based on extrusion agglomeration followed by polymer
coating could form the basis of a flexible microencapsulation technology platform for
effective delivery of reactive minor components in a variety of applications including not
only food fortification but also in drug delivery, nutraceutical delivery in functional foods,
and active ingredient delivery in agro-chemicals and cosmetic products. This assumption
was based on the fact that extrusion has several advantages over the currently
commercialized technique of fluidized-bed agglomeration, including high throughput and
low operating cost. It was expected that extrusion could produce agglomerates with better
physical properties, including denser texture and smoother surface, which would make the

8
ensuing encapsulation process more effective and efficient by better coverage with less
coating material. Extrusion is flexible and can readily form particles with different particle
sizes, ranging from several hundred microns to several millimeters, which ensures the
premix particles can match the size of a wide variety of staple foods.
The immediate objective of my research project was to improve the current systems, for
producing microencapsulated ferrous fumarate premix and Ultra Rice®, by developing
alternate processing techniques to achieve better physical/organoleptic properties of the
microencapsulated fortificants and to simplify the current procedures. In addition, these two
systems could be used as models for testing the proposed technology platform for food
fortification.
2.2 Research Scope
As depicted in Figure 2.1, the project scope was to explore the feasibility of using several
staple foods and/or food ingredients as effective micronutrient carriers. This included salt,
sugar, and rice. Salt is commonly consumed by all societies in the world, and it is almost
always processed. Rice is the primary staple food in some 40 countries and nearly half of the
world’s population (Juliano, 1993). Sugar is a commonly used staple in Latin America.
Clearly, these foods are good choices for fortification.
Micronutrients, including vitamin A, thiamine, folic acid, iron, zinc, and iodine, were
selected on the basis of the prevalence of their deficiencies. These micronutrients were
encapsulated individually and in combinations to attain desirable stability, release properties,
and appearance when incorporated into various foods.
To achieve the goal of the project, the potential interactions between the added ingredients
and the delivery systems had to be identified before designing effective food fortification
processes. The program targeted the development of a broadly applicable technology that
would not only be useful in developing countries, but would be also applicable in typical
Canadian processed food products, and thus prove to be of economic value in the
marketplace.

9
Figure 2.1 Overview of the project scope
2.3 Research Approaches & Anticipated Outcomes
As indicated in Figure 2.1, many micronutrients and several staple foods were considered in
the research scope. To develop a broadly applicable technology for effective delivery of
these micronutrients by different food carriers, it was believed that the best approach would
be to start with specific designs for individual applications. Therefore, three specific
research projects were proposed in the study:
1. Microencapsulation of ferrous fumarate (FeFum) premix for double fortification of
salt, after agglomeration by extrusion to match the size of salt grains by polymer
coating;
2. Production of Ultra Rice® grains as carriers of micronutrients by controlled
reactions to form a stable alginate-calcium structure incorporating and protecting
the added micronutrients;
APPROACHES
Microencapsulation: converting the selected vitamins and minerals to appropriate forms which fit into the selected food vehicles; Multiple Fortification: incorporating several micronutrients in their proper forms into the selected food vehicles.
FOOD CARRIERS
Staple foods or food ingredients: Salt, sugar, rice
MICRONUTRIENTS
Vitamins: A, B1, niacin, folic acid Minerals: iodine, iron, zinc
OBJECTIVE
To develop microencapsulation-based technologies for multiple nutrient fortification in staple foods

10
3. Folic acid fortification by incorporation into existing programs of salt iodization,
vitamin A fortification of sugar, and iron fortification of Ultra Rice®.
The detailed experimental design for each approach and the anticipated outcomes are
discussed in the following.
Research approach 1 – microencapsulated FeFum premix made by the extrusion-based
technology platform
Previously, microencapsulated FeFum premix was made by fluidized-bed agglomeration
followed by a lipid coating. To overcome the shortcomings of the current process and
premix product, I proposed to investigate alternate techniques and materials. Specifically,
extrusion technology was proposed to replace the fluidized-bed agglomeration, and
hydrophilic glassy polymers were proposed as improved coating materials. Extrusion is
extensively used in the food industry and has several advantages over fluidized-bed
agglomeration, as it could produce denser particles with fewer pores, regular shape, and
better surface morphology. These improved particle properties could collectively make the
following encapsulation step easier by allowing more uniform coverage with less coating
material used. Hydrophilic glassy polymers have been widely used in oral drug delivery
systems. They can provide excellent physical barriers in the dehydrated, glassy state, while
upon water penetration they can achieve controlled release of the core ingredients by a
swelling mechanism. Therefore, it seemed logical to apply this advance in drug delivery
systems into food applications.
Successful development of a microencapsulated FeFum premix using the proposed
techniques could not only result in a stable salt double fortified with iodine and iron, but
could also provide an effective model system for making microencapsulated particles
ranging in size from two hundred microns to several millimeters that can incorporate one or
more active ingredients simultaneously. Since the current procedure involves several steps,
including granulation, colour-masking, and encapsulation, additional micronutrients could
be added at different stages of processing to different particle layers to prevent direct
interactions between incompatible micronutrients.
11
Research approach 2 – Extending the extrusion-based technology platform for making
reconstituted rice premix, Ultra Rice®
, using alginate-calcium internal gelation
Ultra Rice® is a product which agglomerates rice flour and added micronutrients to form
reconstituted rice grains that will be indistinguishable from market rice by the average
consumers. Currently the grains contain sodium alginate, which, when sprayed with calcium
chloride, form a stable shell around the grain. We realized that if we could convert all of the
alginate into the cross-linked Ca form, we could, in effect, form a large microencapsulating
structure capable of carrying micronutrients, expanding the technology platform to a larger
size scale. If we could control this reaction and combine it with the extrusion, we could
greatly simplify the existing process and achieve better grain integrity and sensory
properties. The objective of this phase of the work was to understand the Ca-alginate
formation, and to develop a formulation and process that would form the desired
cross-linked structure in the Ultra Rice® extrusion process.
Research approach 3 –Testing of the developed technology platform using folic acid
fortification incorporated into the existing programs
Folic acid has been identified as the cause of harmful deficiency diseases that could be
prevented by food fortification. Many dietary/nutrition surveys have revealed that most
adults had inadequate serum folate levels, and folate deficiency was common particularly in
elderly populations (Buttriss, 2005). Folate deficiency is clearly linked with the development
of birth defects, several chronic diseases, certain cancers, and reduced cognitive functions in
elderly (Cho et al., 2002; Rampersaud et al., 2002; Choi & Manson, 2000; Miller, 2004).
Prior to mandated supplementation/fortification, it was estimated that folate deficiency
would result in up to 5 neural tube defects (NTD) out of every 1000 pregnancies (Caudill,
2004). Since mandated folic acid fortification of flour in North America, there has been a
dramatic decrease in the incidence of this type of birth defects and of some types of cancer
(Grosse et al., 2006). Folic acid fortification would be relatively inexpensive in developing
countries if the fortification could be combined with existing technologies for the ongoing
fortification programs that have universal coverage in affected areas: salt iodization, sugar
fortification with vitamin A, salt double fortification with iron and iodine, and Ultra Rice®

12
fortification with iron or other nutrients. Development of folic acid fortification of these
food vehicles using the technology platform was another focus of my research program.
Folic acid could be incorporated into the selected food vehicles either directly or using
microencapsulated premixes made by techniques developed for salt or rice fortification. The
study was to examine different fortification techniques and to identify appropriate
approaches. While it is preferable to use the simplest techniques to keep cost low and make
implementation easy, encapsulation processes may be needed to maintain vitamin stability
and consumer acceptability. To successfully combine folic acid addition with the delivery of
other nutrients, the understanding of the potential interactions between folic acid and other
micronutrients added in the same delivery systems had to be developed prior to designing an
effective fortification strategy.
The proposed research approaches will be discussed in the following chapters with relevant
results (Chapters 4 to 6).
In addition to the anticipated contributions to the scientific field, successful completion of
this program will lead to effective micronutrient delivery technologies for food fortification
for the world. The importance of alleviating micronutrient deficiencies would lead to the
improvement in the health and working capacity of some 2 billion people in developing
countries, so a significant advance in technology will have far reaching effects in health and
social development. The specific results of this program will also have immediate field
application in the delivery of micronutrients through rice to the urban poor in both
developing and developed countries.

13
3 RESEARCH BACKGROUND
3.1 Micronutrient Deficiencies
Micronutrients are essential substances required by the body in small amounts to maintain
its normal functions. Deficiencies in micronutrients have serious health consequences, such
as learning disability, impaired work capability, reduced resistance to infection, illness, or
even death. Various micronutrient deficiencies have occurred due to poor nutrition in many
different regions and populations. Three micronutrients, vitamin A, iron, and iodine, have
been identified as major concerns (WHO, 1995), as over one third of the world’s population
is affected by the deficiencies of these three nutrients. Women and young children in
developing countries are most vulnerable.
Vitamin A deficiency (VAD) is a serious problem in developing countries, and can lead to
partial or total blindness. It is also associated with increased risk of infectious morbidity and
mortality (Levin et al., 1993). It is estimated that over one hundred million children in
developing countries (nearly 40% of the developing world’s children) suffer from a sub
clinical deficiency in vitamin A, and about one million such children would die each year
due to complications arising from VAD (MI, 2004).
Iron deficiency is the most common nutritional deficiency in the world (WHO, 2000). It has
profound negative effects on human health and development, and it is the primary cause of
anemia. Nearly two billion people suffer from iron deficiency anemia (IDA); among these,
over 90% live in developing countries. IDA lowers work capacity and impairs immune
response, which results in reduced resistance to infection and increased risk of maternal and
fetal morbidity (Clydesdale & Weimer, 1985).
Iodine deficiency disorder (IDD) is the world’s single most significant cause of
preventable brain damage and mental retardation (WHO, 2000). It is responsible for
impaired physical and mental development, resulting in significant reduction of intellectual
capability in those affected during childhood. Nearly 20% of the developing world’s
population is iodine deficient and more than 830 million people have goiter – a visible
14
symptom of iodine deficiency due to swollen thyroid glands (Lotfi et al., 1996).
There is evidence showing that the three deficiencies interact with each other. Clydesdale &
Weimer (1985) reported that IDD and IDA have synergistic effects which lead to severe
retardation of physical, mental, and social development. IDA interferes with thyroidal
metabolism of iodine and may reduce the efficacy of iodine treatment for IDD by
supplementation or fortification (Lonnerdal, 2004). Lynch (1997) reported there was a direct
correlation between serum retinol and hemoglobin levels in several surveys. VAD may
impair iron metabolism and aggravate iron deficiency anemia (IDA) (Zimmermann et al.,
2004). In addition, Zimmermann et al. (2000) indicated that the three deficiencies often
coexist in children in many developing countries. Due to the detrimental interactions of iron,
iodine, and vitamin A deficiencies, a simultaneous attack by an effective multiple-nutrient
delivery system will be required.
In addition to the three key micronutrient deficiencies, significant populations are deficient
in other micronutrients, including vitamin B1 (thiamine), B2 (riboflavin), B12
(cyanocobalamin), folate, and zinc. These problems are more prevalent in rice-consuming
populations (OMNI/USAID, 1998). Recently folate deficiency was recognized as a serious
but readily treatable problem. Abundant evidence has linked this vitamin deficiency to
severe birth defects and several chronic diseases. It is reported that folate deficiency was
responsible for approximately 250,000 severe birth defects – neural tube defects (NTD) -
each year prior to mandated supplementation and/or fortification programs (Berry et al.,
1999).
3.2 Food Fortification
Several interventions can be used to alleviate micronutrient deficiencies, including
supplementation, dietary education/diversification, and food fortification. The uptake of
essential micronutrients through a healthy, balanced diet is a desirable and sustainable
approach for prevention of micronutrient deficiencies, but may not be sufficient to cure
severe deficiency syndromes. It requires intensive cooperation and individual compliance,
and depends on adequate supply of nutrient-rich foodstuffs and sufficient income to obtain

15
them. Direct supplementation is an effective, rapid strategy to combat micronutrient
deficiencies, but it requires consistent, well-educated participation from individuals and
well-established medical infrastructure from the governments. Due to its relatively high cost,
it is usually used only as a short-term medical intervention. Food fortification is recognized
as the most cost-effective measure to overcome micronutrient deficiencies. It is relatively
simple and does not require active cooperation from the consumers.
Food fortification has been used for over a century (Bonner et al., 1999). Many programs
have been successfully implemented worldwide. It is well known that wheat flour has been
fortified with B vitamins and minerals in North America, and salt has been used worldwide
to provide iodine in the normal diet for more than two decades (Salt Institute Website).
Despite these examples, the development and implementation of a successful food
fortification program is generally constrained by technical, socio-economic, infrastructural,
and political factors (Lofti et al., 1996). The major technical issues are 1) selection of
appropriate food vehicles and micronutrient forms to be added, 2) determination of the
appropriate addition levels and the methods/techniques to be used, and 3) ensuring product
stability and bioavailability (Wirakartakusumah & Hariyadi, 1998). A successful
fortification program should integrate all these technical considerations and ensure the final
product meets the following three criteria:
� Clinical effectiveness: which requires that the fortified foods maintain the desirable
micronutrient stability and bioavailability,
� Consumer acceptance: which requires that the final products be acceptable to the
consumers, through education about its benefits, or more desirably through the food’s
attractive appearance and taste,
� Technical feasibility: which requires that the fortification technology can be
implemented and maintained economically.
3.2.1 Food Vehicle Selection
Among the technical factors, the selection of the food vehicle is the key factor in developing
an effective fortification program. An ideal food vehicle is regularly consumed by all of the
target population at a relatively constant rate. Appropriate food vehicles will deliver the
16
selected micronutrients in such way that the added micronutrients retain their activity and
bioavailability without adversely affecting the sensory properties of the final products during
food production, distribution, retail, food preparation and consumption. Staple foods are
most likely to meet these criteria. Salt is the ideal carrier as it is universally consumed and
industrially processed. In urban settings rice is a good carrier, as it forms the basis of the diet
of the urban poor. Other population-specific staple foods have been identified earlier,
including noodles, sugar, oil, and monosodium glutamate (MSG).
Numerous foods have been tested for fortification by a single nutrient and achieved
desirable results, including iodine fortification of salt; vitamin A fortification of oils/fats,
sugar, milk and dairy products; and iron fortification for wheat flour, breakfast cereals, bread,
and weaning foods. Unfortunately, vehicles for multiple micronutrient fortification are more
limited. A few acceptable examples include soy or fish sauce fortified with iron and iodine
in the Philippines and Thailand, and commercially produced breakfast cereals fortified with
iron and multi-B vitamins (Lofti et al., 1996; Wirakartakusumah & Hariyadi, 1998). Due to
the complex nature of food systems and the many variables involved in the fortification
processes, the selection of effective food vehicles for delivering multiple micronutrients
needs to be carefully examined, with consideration of chemical and technical factors to
prevent nutritional degradation.
3.2.2 Fortification Techniques Used in Existing Programs
Typically the techniques used in food fortification are rather simple, involving mainly
mixing processes (Lofti et al., 1996). For example, solid-solid mixing is used for fortifying
dry foods with small quantities of micronutrients in powder form, such as in the process of
fortifying B vitamins and iron powder into wheat flour. For delivering fortificant to a liquid
food matrix, such as milk and oil, solid-liquid mixing is used through dissolution or
dispersion. Other techniques include liquid-liquid mixing, solid-solid adhesion, and coating
by spraying the liquid fortificant on the dry food vehicle. Water-soluble fortificant may be
carried by aqueous solutions, while fat-soluble ingredients by organic solvents. For example,
salt iodization is achieved by spraying an aqueous solution containing iodine compounds,
either potassium iodate or iodide, onto salt grains (Salt Institute website).

17
These basic methods work well for single fortification; however, when multiple
micronutrients consist of fortificants with greatly different physical characteristics from the
selected food carrier, the fortificants or food vehicle must be treated to ensure an acceptable
product. For example, the selected micronutrients in powder forms may need to be
granulated first to match the particle size of a granular food matrix to avoid particle
segregation (Diosady et al., 2002). Processes may be required to hide the undesirable colour
or taste of some vitamins and minerals. Moreover, there are potential interactions between
the added fortificants and the food vehicle, which subsequently results in loss of the
micronutrients and altered sensory properties of the end products (Hurrell, 2002; Rutkowski,
2003; Li, 2005). Technical solutions are thus required to overcome or prevent these
problems.
3.2.3 Current Challenges in Food Fortification Programs
As discussed earlier, the scope of the current program involves development of technology
for delivering several vitamins and minerals in at least three typical staple foods – salt, sugar,
and rice. The selected food vehicles are all solids, where directly added powder ingredients
would cause segregation during production and distribution, resulting in uneven distribution
of the added micronutrients (Johnson et al., 2004). This may lead to potential under- or
over-dosing when consumed. Therefore, proper modifications to the fortificants’ particle
size distribution are required.
The studied micronutrients present chemical challenges in the form of instability of vitamins
and reactivity of minerals. Most vitamins, particularly vitamin A, are unstable under a
number of chemical and physical conditions, such as presence of oxygen, acids, and
reducing agents as well as humidity, heat, and light. The problem with minerals, particularly
iron, is the difficulty in selecting an appropriate form which is adequately absorbed and yet
does not alter the appearance or taste of the food vehicle (Manner & Gallego, 2002).
Water-soluble iron compounds, mostly in the ferrous form, are more bioavailable, but they
are also more reactive, often causing unacceptable colour and flavour changes in the food
matrices. In contrast, insoluble iron compounds may not cause sensory changes but are often

18
so poorly absorbed as to be of little or no nutritional benefit (Hurrell, 2002). Therefore, iron
bioavailability and organoleptic properties must be balanced in designing/developing iron
fortified foods.
Previous research revealed that reactive iron compounds significantly affect the stability of
other micronutrients present in the same food matrix (Hurrell, 1999; Diosady et al., 2002;
Rutkowski, 2003). This makes it even harder to develop iron-containing multiple
fortification systems.
3.3 Microencapsulation
A promising approach to multiple fortification is to microencapsulate the selected
micronutrients, especially iron, in an inert but digestible coating system to ensure that the
micronutrients are effectively delivered in a stable and bioavailable manner without altering
the organoleptic properties of the food vehicle. Proper microencapsulation techniques could
also integrate colour/flavour masking and size enlargement to convert the selected powder
materials into proper granular forms with desirable appearance and size.
Generally, microencapsulation is defined as a technology of enveloping small solid particles,
liquid droplets or gases in a coating matrix (Benita, 1996). The coated or entrapped material,
also know as the core, fill, internal phase or payload, is usually the active ingredient which
needs to be protected from the environment and/or released at a controlled rate. The coating
material is called the capsule, wall, shell, membrane, carrier, encapsulant, or matrix (Benita,
1996).
Microencapsulation was originally developed by Barrett K. Green of the National Cash
Register Corp. (NCR) in 1950’s, with a process called coacervation to create carbonless
paper (Benita, 1996). The process involved a soluble polymer, such as gelatin, induced to
come out of solution and form a shell around dispersed droplets of an oil at the interface
with a water medium. The gelatin shell is hardened by the addition of glutaraldehyde, and
the microscopic beads are collected and dried (Clark, 2002). Since then, many technologies
for preparing microparticles have been developed for applications (Table 3.1) in
19
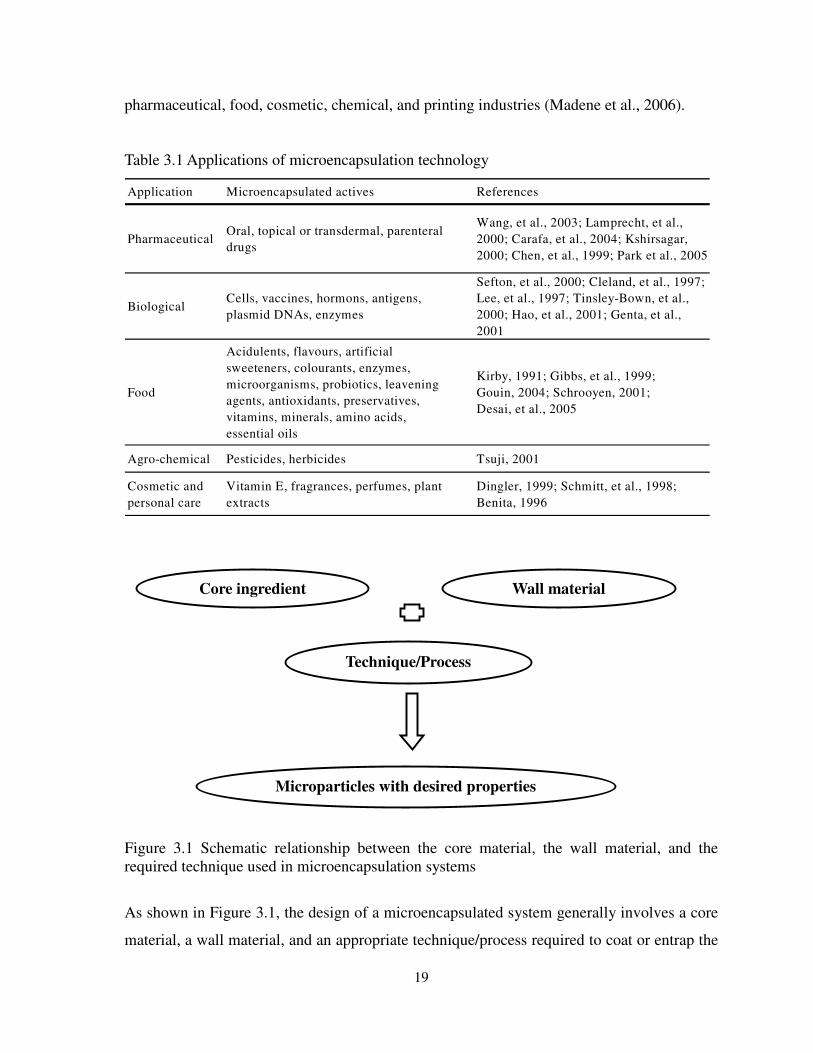
pharmaceutical, food, cosmetic, chemical, and printing industries (Madene et al., 2006).
Table 3.1 Applications of microencapsulation technology
Figure 3.1 Schematic relationship between the core material, the wall material, and the required technique used in microencapsulation systems
As shown in Figure 3.1, the design of a microencapsulated system generally involves a core
material, a wall material, and an appropriate technique/process required to coat or entrap the
Wall material Core ingredient
Microparticles with desired properties
Technique/Process
Application Microencapsulated actives References
PharmaceuticalOral, topical or transdermal, parenteral
drugs
Wang, et al., 2003; Lamprecht, et al.,
2000; Carafa, et al., 2004; Kshirsagar,
2000; Chen, et al., 1999; Park et al., 2005
BiologicalCells, vaccines, hormons, antigens,
plasmid DNAs, enzymes
Sefton, et al., 2000; Cleland, et al., 1997;
Lee, et al., 1997; Tinsley-Bown, et al.,
2000; Hao, et al., 2001; Genta, et al.,
2001
Food
Acidulents, flavours, artificial
sweeteners, colourants, enzymes,
microorganisms, probiotics, leavening
agents, antioxidants, preservatives,
vitamins, minerals, amino acids,
essential oils
Kirby, 1991; Gibbs, et al., 1999;
Gouin, 2004; Schrooyen, 2001;
Desai, et al., 2005
Agro-chemical Pesticides, herbicides Tsuji, 2001
Cosmetic and
personal care
Vitamin E, fragrances, perfumes, plant
extracts
Dingler, 1999; Schmitt, et al., 1998;
Benita, 1996

20
core by the wall material. The core material is the key factor that needs to be protected or
released at a defined rate, while the wall material and process/technique play an important
role in the physical and chemical properties of the formed microparticles, such as particle
size, permeability, porosity, density (bulk and particle density), flowability, integrity,
reactivity/stability, release properties, and bioavailability. For each active ingredient, the
appropriate choice of process and wall materials depends on the end use of the
microencapsulated particles. For example, microencapsulated flavours for extrusion-based
processed foods should be heat resistant and insoluble while in the barrel so the flavour is
protected against thermal degradation and flash-off at the exit of the die (Bhandari et al.,
2001).
In the current project, various vitamins and minerals were selected as core ingredients. The
goal of the development program for a microencapsulation system is to find an effective
combination of appropriate wall materials and encapsulation techniques, which could
present the selected micronutrients in stable, bioavailable, and organoleptically desirable
forms suitable for food fortification. In the following sections the literature on available
techniques of microencapsulation and coating materials is discussed.
3.3.1 Microencapsulation Techniques
Current microencapsulation techniques can be classified based on the microparticle
formation mechanism. These include physical or mechanical processes (such as spray drying,
spray chilling/cooling, extrusion, and fluidized bed coating), and chemical processes (such
as coacervation, co-crystallization, molecular inclusion, and interfacial or in-situ
polymerization). In some cases, a combination of processes is used, for example in
formation of a single or double emulsion followed by spray drying (Madene et al., 2006).
The formed microparticles are categorized as either microcapsules or microspheres (Figure
3.2), based on the structure, or more precisely, the mutual position of the core and the shell.
In a microcapsule, the active ingredient is a continuous, concentrated phase and enveloped
by a protective layer of coating material. Usually a two-step process will be needed to
produce microcapsules, including the formation of the core particles followed by a coating

21
process. In contrast, in a microsphere, the active substance is dispersed in the structure and
entrapped within the matrix material, which sometimes only involves a single-step of
entrapment (Adamiec et al., 2004). Microcapsules or microspheres may have diameters
ranging from a few microns to a few millimeters.
Figure 3.2 Microcapsules and microspheres (adapted from Gibbs et al., 1999)
Physical/mechanical processes
Spray drying is a commonly used method of drying a liquid feed through a hot gas. The
liquid feed is pumped through an atomiser device that produces fine droplets into the main
drying chamber. Typically, the hot gas is air, but when sensitive materials are processed or
oxygen-free drying is required, nitrogen gas is used instead. It is a well-established
technology involving commercially available equipment. It is extensively used to produce
powdery particles ranging in size from 1 µm to 150 µm, which contain value-added
ingredients, such as fragrances or flavours. The advantages of this process are relatively low
in cost and ease of scale up. The microparticles prepared by the technique can quickly
release the core ingredients without leaving any shell debris, due mainly to the high water
solubility of the shell materials used. However, the suitable shell materials for this process
are limited. Also, the concerns of solvent flammability and toxicity severely restrict the use
of organic solvents for conventional spray drying operations. Other limitations of this
technique include a generally low payload (<40%) and problems with heat-sensitive
materials (Gouin, 2004; Madene et al., 2006; Yuliani et al., 2004; Benita, 1996; SwRI
website).
Spray chilling/cooling is similar to spray drying, where the core material is emulsified in a
molten wall material then atomized to disperse droplets, which are immediately mixed with
Matrix Simple Multi-wall Multi-core Irregular
Microcapsules
Microsphere
22
a cooling medium and subsequently solidified into powder form (Madene et al., 2006). This
is probably the least expensive process, which can be used to convert liquid hydrophilic
ingredients into free flowing powders with improved heat stability and delayed release in
wet environments. However, as a “matrix encapsulation” process, rather a “true” core/shell
encapsulation, it leads to a significant proportion of unprotected active ingredients on the
particle surface or sticking out of the wall material, which subsequently affects the
effectiveness of the encapsulation.
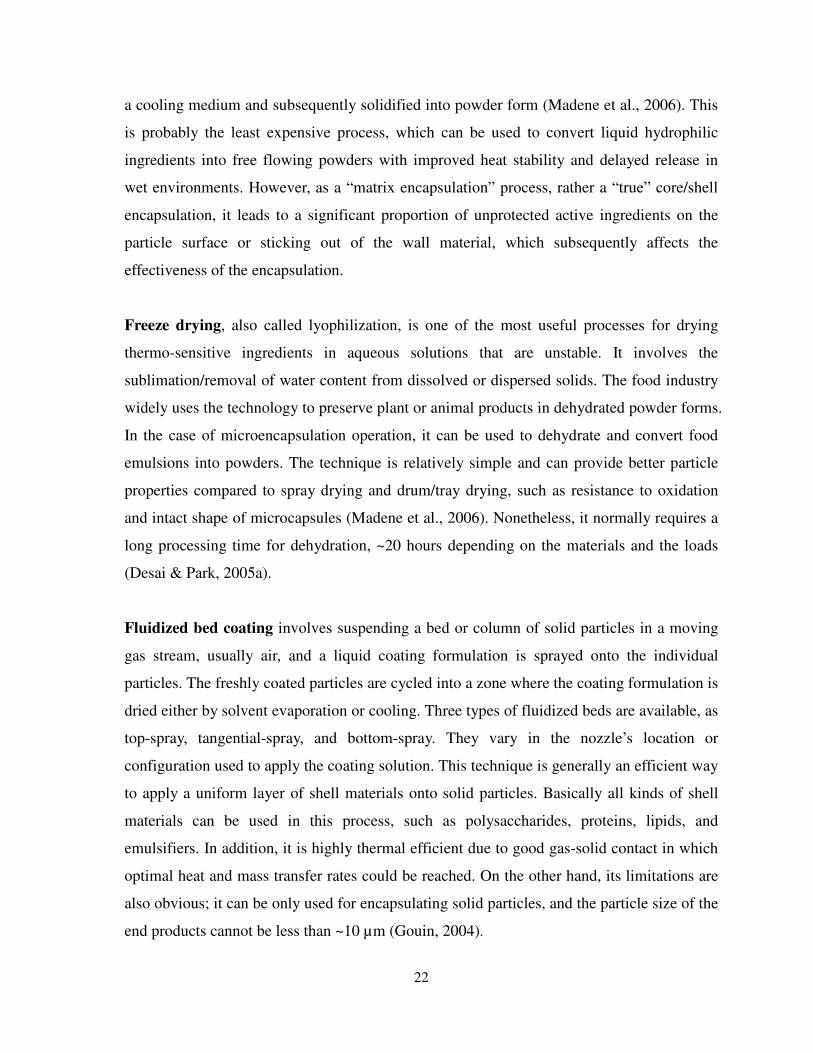
Freeze drying, also called lyophilization, is one of the most useful processes for drying
thermo-sensitive ingredients in aqueous solutions that are unstable. It involves the
sublimation/removal of water content from dissolved or dispersed solids. The food industry
widely uses the technology to preserve plant or animal products in dehydrated powder forms.
In the case of microencapsulation operation, it can be used to dehydrate and convert food
emulsions into powders. The technique is relatively simple and can provide better particle
properties compared to spray drying and drum/tray drying, such as resistance to oxidation
and intact shape of microcapsules (Madene et al., 2006). Nonetheless, it normally requires a
long processing time for dehydration, ~20 hours depending on the materials and the loads
(Desai & Park, 2005a).
Fluidized bed coating involves suspending a bed or column of solid particles in a moving
gas stream, usually air, and a liquid coating formulation is sprayed onto the individual
particles. The freshly coated particles are cycled into a zone where the coating formulation is
dried either by solvent evaporation or cooling. Three types of fluidized beds are available, as
top-spray, tangential-spray, and bottom-spray. They vary in the nozzle’s location or
configuration used to apply the coating solution. This technique is generally an efficient way
to apply a uniform layer of shell materials onto solid particles. Basically all kinds of shell
materials can be used in this process, such as polysaccharides, proteins, lipids, and
emulsifiers. In addition, it is highly thermal efficient due to good gas-solid contact in which
optimal heat and mass transfer rates could be reached. On the other hand, its limitations are
also obvious; it can be only used for encapsulating solid particles, and the particle size of the
end products cannot be less than ~10 µm (Gouin, 2004).

23
Extrusion was first introduced as an encapsulation process by Swisher in 1957 to coat
volatile and unstable flavours (Madene et al., 2006; Gibbs et al., 1999). Essential oils were
dispersed in glassy carbohydrate matrices (such as corn syrup solids and glycerin) at >100oC,
and then extruded into a dehydrating liquid such as isopropyl alcohol. The solidified
material was then separated into small pieces and vacuum-dried. This process was later
modified to encapsulate microorganisms and enzymes at low temperatures (Gouin, 2004).
The active ingredients were mixed with plasticized composite matrices, such as starch/fat or
starch/polyethylene glycol. The dry mixture was converted to a wet paste by incorporating
~20% (w/w) water and then extruded. The exiting rope was cut into pieces between 500 µm
to 1000 µm and air-dried. This technique can provide virtually full protection to the core
ingredients by the surrounding wall materials. Also, the use of glassy polymers can provide
an essentially impermeable barrier against oxygen, which enables prolonged shelf life of the
end product. However, this process can only produce large particles, typically >500 µm,
which greatly limits its applications. In addition, the suitable shell materials or binders are
limited to glassy carbohydrates and carbohydrate derivatives (Gibbs et al., 1999).
Coextrusion is a relatively new technique for encapsulation. It creates fibers consisting of
active ingredients within fluid, high-viscosity, glassy shell materials. These fibers can be
chopped to form microcylinders, or when the viscosity is low and the surface tension of the
fluid is high these extrudates would thermodynamically break up into tiny droplets, forming
microcapsules. The typical coextrusion systems include stationary nozzle coextrusion,
centrifugal coextrusion, or slightly altered spinning disk coextrusion. In the former two
processes, concentric nozzles are used to pump the core material through the inner nozzle
and the shell formulation through the annulus, allowing “true core-shell” morphologies.
Spinning disk coextrusion involves a suspension of the core material dispersed in the carrier
material. The mixture is then extruded through the rotating disc in such a way that the excess
coating fluid is atomized and separated from the coated particles (SwRI website).
This technique can be treated as “true” encapsulation, which gives the microcapsules unique
properties allowing release of the core ingredients at a defined rate (Gouin, 2004). The high

24
operating cost and specific requirements of the equipment greatly limit the application of
this technique. In addition, the core and shell materials must be mutually immiscible liquids,
(i.e., polar liquids like aqueous solutions in the core require hot melt shell materials like
waxes; whereas with water-immiscible oils as the core, an aqueous polymer solution that can
gel rapidly is required for the shell) (SwRI website).
Chemical processes
Coacervation is a separation process involving two liquid phases in a colloidal system
(IUPAC, 1997). It starts with an aqueous colloid solution in an appropriate solvent.
According to the nature of the colloid, when the environmental conditions changes, such as
pH change, the solubility of the colloid is reduced and a large part of the colloid can be
separated out into a new phase. The original one phase system becomes two phases, one is
rich and the other is poor in colloid concentration. The colloid-rich phase in a dispersed state
appears as amorphous liquid droplets called coacervate droplets, which form the wall
material of the resultant capsules. This concept initiated the development of
microencapsulation technology by B. K. Green in 1957.
The first coacervative capsules developed by B.K. Green for carbonless paper were made
using gelatin as a wall in an "oil-in-water" system. Later developments could produce
"water-in-oil" systems for highly polar and water soluble cores. The process involves three
steps: particle or droplet formation, coacervative wall formation, and capsule isolation. It is
considered as a “true” microencapsulation technique, as the core material is completely
entrapped by the matrix.
Although this technique has a very high payload, >99% (Gouin, 2004), and the formed
particles are able to achieve sustained or controlled release of the core ingredients, its high
operating cost and complexity restrict its commercial utilization.
Gelation involves the formation of gelled microcapsules or microspheres using techniques
such as cooling, crosslinking, or a chemical reaction. A well-known system is
alginate-calcium crosslinked beads, which were initially developed for immobilization of
25
live cells and enzymes. It has been rapidly adapted to many other applications due mainly to
its extreme ease of preparation on a lab-scale and mild processing conditions. Unfortunately,
the process is difficult to scale up and the operation is costly. In addition, the obtained
microcapsules are very porous and allow fast and easy diffusion of water and other fluids in
and out of the matrix. Such good permeability is desired for carrying live cells or enzymes
but is not suitable for protecting most active ingredients.
Liposome entrapment was originally used in the pharmaceutical industry, and in recent
years it has been used in many other applications, such as food-based delivery systems. The
process can be achieved by dispersing a bilayer-forming polar lipid, such as lecithin, in an
aqueous medium containing dissolved active ingredients. The formed particles are typically
spherical in shape with a relatively narrow size range from several nanometers to several
hundreds nanometers. Liposomes may contain a single or multiple layers of amphiphilic
polymolecular membranes, which closely resemble the natural structure of cell membranes.
Generally, liposomes are “kinetically stable”, i.e., they are only stable for a short period of
time, similarly to emulsions. Because of this, many principles and techniques of emulsion
formation can be also applied to the development of liposomes (Taylor & Davidson, 2005).
Other technical issues with this technique include that the process is hard to scale up.
Moreover, liposomes are usually in aqueous forms, which impart great stability of
water-soluble materials in high water activity applications, but limit their usefulness when
the coated ingredients need to be in a dry state.
Molecular inclusion is an advanced technique that is highly specific. It generally refers to
the supra-molecular association of a ligand (the core material) into a cavity-bearing substrate
(the shell material) (Gouin, 2004). Particularly, beta-cyclodextrin, an enzymatically
modified starch molecule, is used in this molecular-level technique. Cyclodextrins are
hollow truncated cone-shaped molecules with an inner diameter of approximately 5-8 A
(Figure 3.3), sufficient for inclusion of one or more volatile flavour molecules or essential
oil compounds (Desai & Park, 2005a). The guest molecules, which are apolar, can be

26
entrapped within the hydrophobic internal cavity by hydrogen bonding, van der Waals forces,
or entropy-driven hydrophobic effect. In contrast, its hydrophilic external part requires water
as the suspension medium. When the water molecules in the center of the cyclodextrin are
replaced by less polar molecules, the complex is precipitated (Gibbs et al., 1999).
Figure 3.3 Molecular structure and microstructure of beta-cyclodextrin (adapted from Yuliani et al., 2004)
The microparticles obtained from this technique have unique, sustained release properties
and thermal/chemical stability of the active ingredients entrapped. However, the relatively
high cost of the shell material, cyclodextrin, and the low yield of the end product greatly
restrict its current commercial applications (Gouin, 2004).
Other chemical techniques include co-crystallization, solvent evaporation/extraction from
emulsions, and interfacial or in-situ polymerization. These methods have been reported in a
small number of studies with limited applications. Co-crystallization has been used to
incorporate aroma compounds into supersaturated sucrose syrup at the time of spontaneous
crystallization under the condition of high temperature (>120oC) and low moisture (95-97 o
Brix). Due to its relative simplicity, co-crystallization may evolve into an economical and
flexible process in the future (Madene et al., 2006). Solvent evaporation/extraction is
applied to convert droplets formed by emulsification to solid particles. The mechanism of
solvent elimination from the emulsion droplets is not well known, but considered to have
great influence on the particle morphology and release behaviour (Rosca et al., 2004). These
techniques are primarily used in the development of drug delivery systems, but attract some
interest from food scientists and technologists recently. Interfacial or in-situ
polymerization involves the formation of capsule shell on the emulsion droplet/particle
surface by indirect or direct polymerization. Interfacial polymerization occurs based on the
27
classical Schotten-Baumann reaction between an acid chloride and a compound containing
an active hydrogen atom, such as an amine or alcohol, esters, urea, and urethane. In-situ
polymerization, without the presence of reactants in the core material happens when
monomers are directly added to the system. Both polymerization methods are used for the
encapsulation of herbicides and pesticides with rare applications in food (Gibbs et al., 1999;
Benita, 1996).
As discussed above, all techniques have pros and cons. Generally, physical techniques are
less expensive and easy to scale-up, but have the drawbacks of relatively low payloads and
imperfect particle properties. In contrast, chemical processes are costly and involve
complicated concepts, but typically can provide well-defined particle structures and desired
controlled release properties. Chemical processes are often reported in formulating drug
delivery systems or for making value-added products. For most applications in the food
industry, physical processes are used.
As our program is focused on developing countries, technical/economic feasibility becomes
the main consideration, i.e., low cost of the process, availability of equipment, and ease of
implementation into existing production lines. It would be preferable therefore to
concentrate on physical/mechanical processes. In some cases chemical methods will be
required, as in making Ultra Rice® grains using internal gelation.
3.3.2 Microencapsulation in the Food Industry
Many well developed microencapsulation techniques and numerous wall materials have
been used in food since the 1980s, which results in many food ingredients being
microencapsulated, as shown in Table 3.2. Different techniques and shell materials will be
reviewed in the following sections.
There are a number of reasons for the food industry’s use of microencapsulation
technologies, including:
� Encapsulation or entrapment can protect the active ingredients from degradation due to
environmental conditions, such as heat, moisture, air, and light;

28
� The physical properties of original core materials can be modified to make it easy for
handling, e.g., liquid ingredients can be converted to free-flowing powders;
� Evaporation or leakage of the core material to the outside environment can be reduced
or controlled, with components such as the volatile flavouring agents;
� The unpleasant taste or appearance of some food ingredients can be masked;
� Several active ingredients can be segregated within a food matrix in separate forms,
which prevents undesirable interactions between them;
� The food ingredients can be tailored to either release slowly or at a certain point within
the process of the digestive system.
Many of these approaches are applicable to our program.

29
Table 3.2 Microencapsulated food ingredients (Kirby, 1991; Gibbs et al. 1999, Gouin, 2004; Schrooyen et al. 2001; Desai, 2005)
Food ingredients Examples Functions or properties Purposes for microencapsulation Applications
Acidulants
Adipic, fumaric,
citric, lactic and
ascorbic acids
Active agents used as
preservation aids, flavour
modifiers
Prevent interactions with other
components and self-degradation
Bread, tea, cured meats,
desserts, baking mixes, and pet
foods
Flavours
Citrus, mint, onion,
garlic oils, spices,
menthol,
peppermint
Volatile, reactive, susceptible
to heat and moisture
Enhance stability, convert to free
flowing powder, control release
Microwavable and extruded
foods, chewing-gums, instant
beverages/desserts,
confectionery, toothpaste
Sweeteners
Sugar, artificial
sweeteners such as
aspartame,
Susceptible to heat, moisture,
and other components
Prevent degradation by
temperature and moisture, reduce
hygroscopicity, improve
flowability, control release
Chewing-gum, confectionery,
baking foods, mouthwash and
toothpaste
Colourants
Beta-carotene,
turmeric, annatto,
natural colours
Less water soluble, less stable
to oxidation
Convert to free flowing form for
easy-handling, improve solubility
and stability
All sorts of processed foods
Enzymes and
microorganisms
Neutrase, lipase,
lysozyme, pepsin,
amylases, proteases
Taste modification, texture
control, aroma formation,
spoilage prevention
Control release, improve stability,
enhance effectiveness by reducing
amount used or ripening time
Cheese, fermented foods,
water treatment
Nutritional
ingredients
Vitamins, minerals,
amino acids,
essential oils
Unstable, reactive, causing
off-flavour and discoloration,
Improve stability, mask off-
flavour, prevent interaction with
other components, control release
Fortified foods, breakfast
cereals, dairy products, infant
foods
Miscellaneous
additives
Preservatives,
antioxidants,
levening agents
Functional food additives
which are preferred to add in
small amount but with
uniform distribution
Improve solubility, enhance
functionality, control release,
reduce amount used
Canned foods, package foods,
baked foods and baking mixes

30
3.3.3 Coating Materials Used For Microencapsulation in the Food Industry
As important as the choice of microencapsulation technique is, the selection of wall material
also plays a crucial role in the development of particle properties of microencapsulated food
ingredients. Generally, shell materials are required to have some of the following
characteristics: film-forming, pliable, tasteless, non-hygroscopic, soluble in an aqueous
media or solvent, and/or able to exhibit a phase transition, like melting or gelling.
Specifically, for food use the coating material should also:
� be easily digested by the body,
� have no interaction with the core material,
� be non-sticky,
� be impervious to water,
� be inexpensive,
� should not impart sensory changes,
� comply with food regulations and local customs.
(Gouin, 2004; Schrooyen et al., 2001; Kirby, 1991; Gibbs et al., 1999, SwRI website)
Numerous coating materials have been used in food ingredient microencapsulation. Most of
them are natural or are derivatives of plant or animal food products, which have been
approved by FDA as GRAS (generally recognized as safe) materials. Table 3.3 lists some
commonly used coating materials for microencapsulation of food ingredients and their
applicable techniques.
In developing a microencapsulation system, the techniques and coating materials need to be
considered together, as they usually influence each other. In the current study, we decided to
investigate glassy carbohydrates, including cellulose derivatives, as coating materials for
encapsulating iron extrudates in a fluidized-bed process. As shown in Table 3.3, these
materials are suitable for fluidized-bed operation. Also, due to their unique film-forming
properties and phase transition, they are expected to protect the stability of the core
ingredients (i.e., micronutrients) in dried forms while achieving desirable bioavailability
through instant release when the iron particles are released in the digestive system. More
importantly, these materials are relatively inexpensive and widely available even in
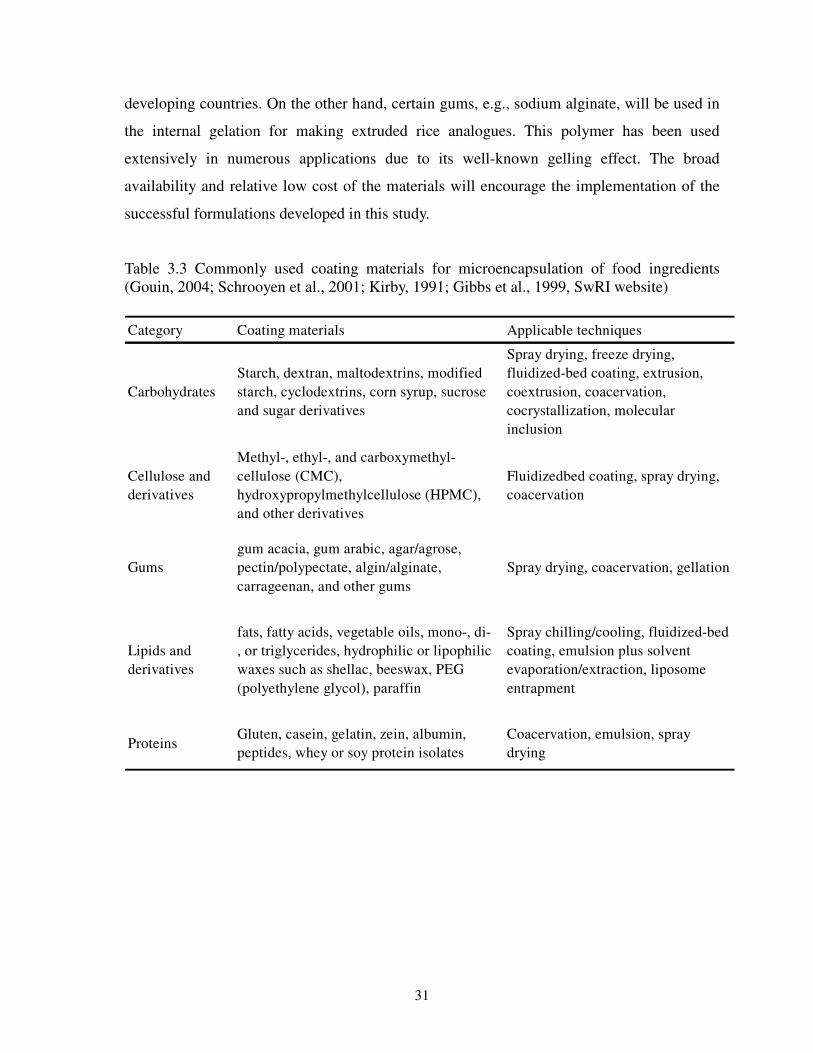
31
developing countries. On the other hand, certain gums, e.g., sodium alginate, will be used in
the internal gelation for making extruded rice analogues. This polymer has been used
extensively in numerous applications due to its well-known gelling effect. The broad
availability and relative low cost of the materials will encourage the implementation of the
successful formulations developed in this study.
Table 3.3 Commonly used coating materials for microencapsulation of food ingredients (Gouin, 2004; Schrooyen et al., 2001; Kirby, 1991; Gibbs et al., 1999, SwRI website)
Category Coating materials Applicable techniques
Carbohydrates
Starch, dextran, maltodextrins, modified
starch, cyclodextrins, corn syrup, sucrose
and sugar derivatives
Spray drying, freeze drying,
fluidized-bed coating, extrusion,
coextrusion, coacervation,
cocrystallization, molecular
inclusion
Cellulose and
derivatives
Methyl-, ethyl-, and carboxymethyl-
cellulose (CMC),
hydroxypropylmethylcellulose (HPMC),
and other derivatives
Fluidizedbed coating, spray drying,
coacervation
Gums
gum acacia, gum arabic, agar/agrose,
pectin/polypectate, algin/alginate,
carrageenan, and other gums
Spray drying, coacervation, gellation
Lipids and
derivatives
fats, fatty acids, vegetable oils, mono-, di-
, or triglycerides, hydrophilic or lipophilic
waxes such as shellac, beeswax, PEG
(polyethylene glycol), paraffin
Spray chilling/cooling, fluidized-bed
coating, emulsion plus solvent
evaporation/extraction, liposome
entrapment
ProteinsGluten, casein, gelatin, zein, albumin,
peptides, whey or soy protein isolates
Coacervation, emulsion, spray
drying

32
3.3.4 Microencapsulation of Vitamins and Minerals
The technologies of microencapsulation of vitamins and minerals have been reviewed by
Schrooyen et al. (2001). For example, vitamin C can be dispersed in a molten fat or wax and
spray-cooled/chilled. They described fluidized-bed coating of dry water-soluble vitamins
suspended in an upward-moving stream of air with molten fat or wax sprayed onto the bed.
In a totally different approach, liposomes were used to incorporate ascorbic acid in liquid
food systems, where a dehydration-rehydration procedure was used instead of organic
solvent to form liposomes.
Taylor & Davidson (2005) reviewed the applications of liposomes in the food industry and
indicated the potential ability of liposomes to stabilize and protect vitamins in food systems.
For example, liposome-entrapped vitamin A (retinal) demonstrated great stability in terms of
decreased light- or heat-induced degradation rates. Liposomes can be also used to
microencapsulate minerals, such as ferrous sulphate and calcium lactate. Lecithin liposomes
containing iron and calcium have been applied in the fortification of liquid foods, such as
milk (Schrooyen et al., 2001). The high cost of the formulated nutrients made liposomes
economically viable only in high-valued food products, rather than in inexpensive staples.
Several research groups published on microencapsulation of vitamins and minerals. Desai
and Park (2005b) reported the microencapsulation of vitamin C in tripolyphosphate (TPP)
cross-linked chitosan by spray drying. Vitamin C solution (1% w/v) was well mixed with 1%
w/v chitosan solution, followed by homogenization with 1% w/v TPP solution. The prepared
microspheres were spherical in shape and had smooth surface, with a mean particle size of 6
to 10 µm. The volume of crosslinking agent solution (TPP) added in the system had great
impact on the particle properties, encapsulation efficiency, and release properties.
Madziva et al. (2005) reported using a combination of alginate and pectin to
microencapsulate folic acid for food use. Folic acid was dispersed in the gel polymer matrix
combining alginate and pectin, and the mixture was then pumped through a nozzle with a
continuous flow of nitrogen into a gently agitated aqueous solution of calcium chloride,
where microcapsules formed, which were then air-dried or freeze-dried.

33
The research group headed by Hurrell and Zimmermann at ETH (Swiss Federal Institute of
Technology Zürich) has been working on iron delivery systems based primarily on ferric
pyrophosphate for years. They have also investigated simultaneous delivery of vitamin A,
iron, and iodine through fortified salt (Windhab et al., 2005). Recently, they proposed a
novel concept, Multi Microcapsule (MULMICAP), for food fortification, especially in salt.
The capsules were produced by continuous microprocessing, including multi-step milling,
dispersing/emulsification, cold spraying, and powder mixing operations. Hydrogenated palm
oil was used to pack iodine, micronized ferric pyrophosphate, and retinyl palmitate, and
form sub-capsules which were then integrated into spherical Multi Microcapsules with a
diameter of 20 to 100 microns. Such microcapsules were applied to African salt by
attachment to the surfaces of 1-2 mm salt crystals. The triple fortified salt (TFS) made this
way was reported to have excellent colour stability and relatively high stability of vitamin A
and iodine (87% and 84% retained, respectively) after 6 months’ storage. The clinical trials
showed that iron status and vitamin A status in the body were significantly improved in
goitrous children in Morocco after consumption of this TFS for 10 months (Windhab et al.,
2005).
3.3.5 Microencapsulation Techniques Used in This Research Group
The Food Engineering Group at the University of Toronto, under the direction of Professor L.
L. Diosady, developed microencapsulation-based technology for the double fortification of
salt with iron and iodine. Initially, iodine compounds, i.e., potassium iodate or iodide, were
encapsulated in a number of selected coating materials by spray drying and fluidized bed
coating. The double-fortified salt (DFS), prepared with the encapsulated iodine sources and
one of the iron compounds, either ferrous sulphate or ferrous fumarate, showed good
stability of iodine under high temperature and high relative humidity (Diosady et al., 2002).
The encapsulation process was later used to produce a coated iron premix, specifically
encapsulated ferrous fumarate (FeFum). A two-step encapsulation process was developed
(Yusufali, 2001), starting with particle agglomeration using a fluidized-bed followed by
pan-coating. Appropriate binders, encapsulants, and solvents for carrying the encapsulants
were carefully investigated. Dextrin was finally selected to mix with the iron compound and
34
the mixture was agglomerated into fine particles, which were then encapsulated by a
colour-masking agent, titanium dioxide, and a thin layer of soy stearine using methylene
chloride as the solvent carrier. The double-fortified salt prepared by such encapsulated iron
premix presented good stability (Yusufali, 2001).
The process was then tested on different scales in several countries under the sponsorship of
the Micronutrient Initiative (MI). The field tests have shown that the DFS is effective in
reducing the incidence of iron deficiency anemia (IDA) and iodine deficiency disorder
(IDD); also it is acceptable in terms of the organoleptic properties (Oshinowo et al., 2004 &
2007). The encapsulated iron and iodine premixes were then scaled up at Glatt Air
Techniques, NJ, from 5 kg to 60 kg, 120 kg, and finally to large commercial batches of 600+
kg using a 1200 L Wurster type agglomerator/coater (Diosady et al., 2004).
The encapsulated ferrous fumarate has also been tested in Ultra Rice®. Improved colour and
unaffected iron bioavailability were observed (Li, 2005). The idea of microencapsulated
premix was also extended for making triple fortified salt with vitamin A, iron, and iodine.
Three Master’s graduates attempted to develop formulations for delivering the three
micronutrients simultaneously in salt (Raileanu, 2002; Tay, 2002; Rutkowski, 2003). Single
and multiple premixes consisting of one or more selected nutrients were made by
microencapsulation and incorporated into blank or iodized salt to produce triple fortified salt
(TFS). Unfortunately, storage stability tests have revealed significant losses of vitamin A and
altered sensory properties of the TFS products. This approach will require more work before
it becomes commercially viable. Novel technical solutions are then required to make the
microencapsulation process more effective in terms of protecting the three active ingredients
and preventing their interactions.
Another research activity in our research group focused on rice fortification via Ultra Rice®
technology. In this process, rice flour is extruded, producing reconstituted rice grains that
can be used as a carrier for micronutrients. It holds great promise for alleviating
micronutrient deficiencies in populations that consume rice-based diets. A unique advantage
of this technology is of its ability to protect the added micronutrients within the matrix.

35
So far, two stable formulations have been developed within our research group; one is
fortified with vitamin A (Lam, 2006) and the other contains iron, zinc, and several B
vitamins (Li, 2005). Technical feasibility, clinical effectiveness, and consumer acceptability
for the two formulations have been field-tested and achieved acceptable results (PATH,
2007).
In spite of the successes, we are also aware of problems remaining in the current systems of
double fortified salt (DFS) and Ultra Rice®, which will be discussed in detail in the later
chapters. However, the research experience in salt and rice fortification projects has
confirmed that microencapsulation is a promising solution for ensuring the effectiveness of
food fortification in combating micronutrient deficiencies. The development of novel
technologies is always ongoing, and it is therefore desirable to adopt the recent advances in
other research fields into this area to make fortified foods better - with desired stability,
bioavailability, and sensory properties while maintaining low cost. This leads to another goal
of this study - to improve the current processes by incorporating new advances in other fields.
The improvements may result in advanced technologies for food fortification based on the
broad concept of microencapsulation. Ultimately, these efforts would extend the benefits of
the two successful interventions, double fortified salt (DFS) and Ultra Rice®, in combating
global micronutrient deficiencies.
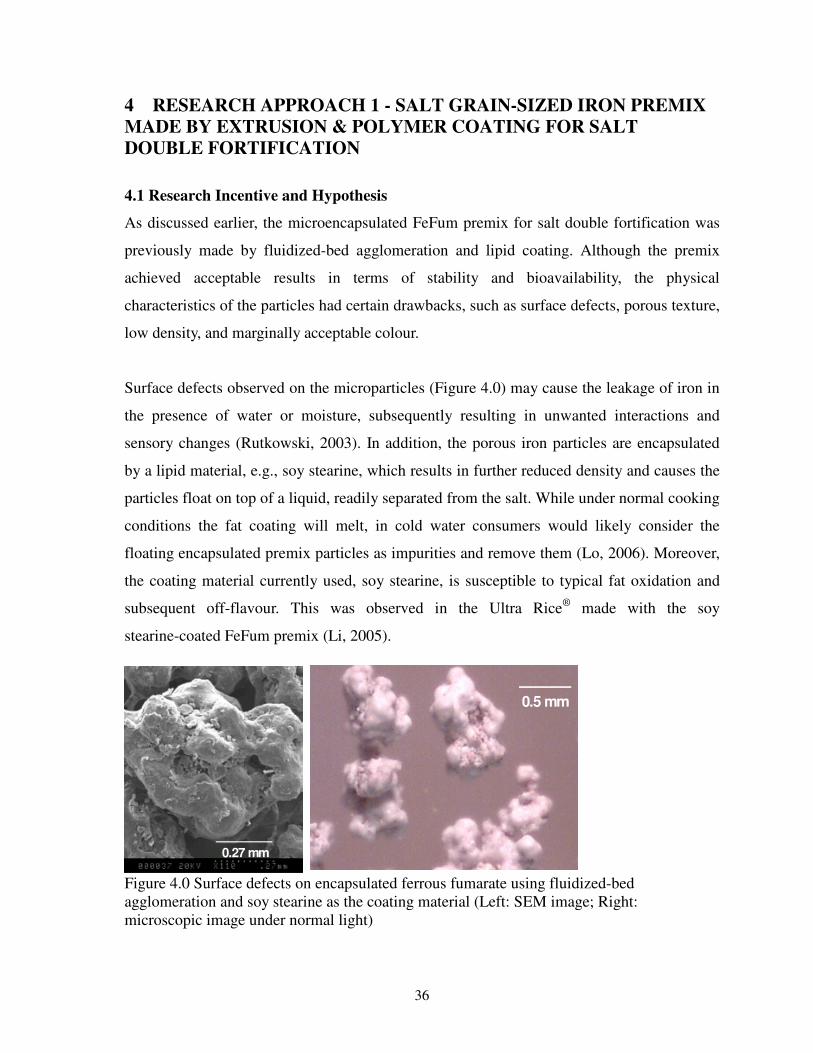
36
4 RESEARCH APPROACH 1 - SALT GRAIN-SIZED IRON PREMIX
MADE BY EXTRUSION & POLYMER COATING FOR SALT
DOUBLE FORTIFICATION
4.1 Research Incentive and Hypothesis
As discussed earlier, the microencapsulated FeFum premix for salt double fortification was
previously made by fluidized-bed agglomeration and lipid coating. Although the premix
achieved acceptable results in terms of stability and bioavailability, the physical
characteristics of the particles had certain drawbacks, such as surface defects, porous texture,
low density, and marginally acceptable colour.
Surface defects observed on the microparticles (Figure 4.0) may cause the leakage of iron in
the presence of water or moisture, subsequently resulting in unwanted interactions and
sensory changes (Rutkowski, 2003). In addition, the porous iron particles are encapsulated
by a lipid material, e.g., soy stearine, which results in further reduced density and causes the
particles float on top of a liquid, readily separated from the salt. While under normal cooking
conditions the fat coating will melt, in cold water consumers would likely consider the
floating encapsulated premix particles as impurities and remove them (Lo, 2006). Moreover,
the coating material currently used, soy stearine, is susceptible to typical fat oxidation and
subsequent off-flavour. This was observed in the Ultra Rice® made with the soy
stearine-coated FeFum premix (Li, 2005).
Figure 4.0 Surface defects on encapsulated ferrous fumarate using fluidized-bed agglomeration and soy stearine as the coating material (Left: SEM image; Right: microscopic image under normal light)
0.27 mm0.27 mm
0.5 mm0.5 mm
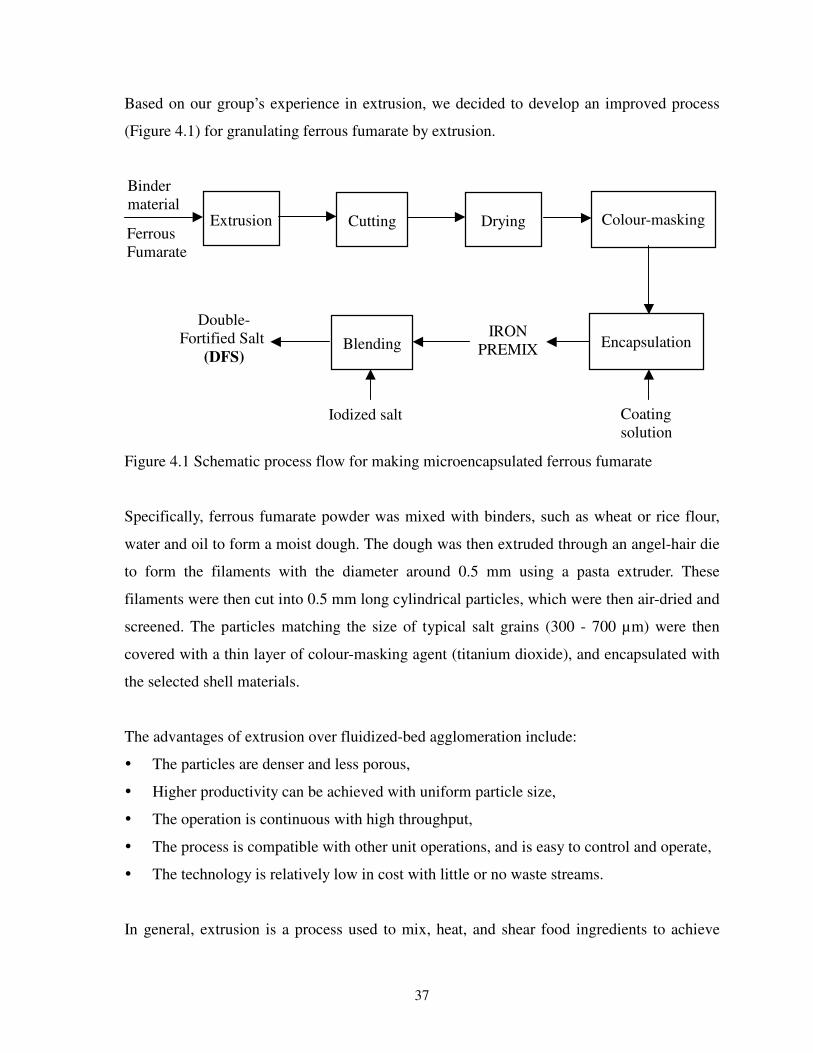
37
Based on our group’s experience in extrusion, we decided to develop an improved process
(Figure 4.1) for granulating ferrous fumarate by extrusion.
Figure 4.1 Schematic process flow for making microencapsulated ferrous fumarate
Specifically, ferrous fumarate powder was mixed with binders, such as wheat or rice flour,
water and oil to form a moist dough. The dough was then extruded through an angel-hair die
to form the filaments with the diameter around 0.5 mm using a pasta extruder. These
filaments were then cut into 0.5 mm long cylindrical particles, which were then air-dried and
screened. The particles matching the size of typical salt grains (300 - 700 µm) were then
covered with a thin layer of colour-masking agent (titanium dioxide), and encapsulated with
the selected shell materials.
The advantages of extrusion over fluidized-bed agglomeration include:
� The particles are denser and less porous,
� Higher productivity can be achieved with uniform particle size,
� The operation is continuous with high throughput,
� The process is compatible with other unit operations, and is easy to control and operate,
� The technology is relatively low in cost with little or no waste streams.
In general, extrusion is a process used to mix, heat, and shear food ingredients to achieve
Cutting
Extrusion
Drying
Binder material
Ferrous Fumarate
Encapsulation
Coating solution
IRON PREMIX
Blending
Double- Fortified Salt
(DFS)
Iodized salt Coating solution
Colour-masking

38
desired shape and texture. In our case, extrusion can agglomerate particles through effects of
compression and/or compaction. During the process, small particles are pressed close
together by mechanical means. The particle-particle adhesion is usually enhanced by the
addition of binders. Thus, the selection of appropriate binder materials was a key factor
considered in this study.
Extruders can be classified in terms of geometry as single- or twin-screw extruders, or by
process conditions as cold-forming or cooking extruders. As our agglomeration process
requires no chemical transformation, a simple single-screw, cold-forming extruder was
thought to be adequate. Accordingly, a commercial pasta extruder (La Monferrina P12) was
tested in this study. As pasta extruders perform no chemical changes, they are relatively
simple and readily scalable, so the data obtained in the lab scale could be readily translated
into commercial scale operations.
After extrusion the agglomerated particles must be coated to impart the desired chemical and
physical resistance. As discussed before, hydrophilic glassy polymers are extensively used in
oral drug delivery systems to achieve sustained or controlled release. Many hydrophilic
polymers have a high glass transition temperature and are glassy in appearance in their
dehydrated states. These glassy polymers provide an excellent physical barrier to the
diffusional transport of oxygen and small molecular-weight molecules. Upon water
penetration, a slow macromolecular relaxation process at the glass/rubbery swelling front
provides a swelling-controlled mechanism that can be used to regulate the drug release
kinetics (Pham & Lee, 1994). We planned to apply this concept to microencapsulating
micronutrients.
Hypothesis: By using extrusion to agglomerate the selected micronutrients to form dense
microparticles, which can be further encapsulated using hydrophilic glassy polymers, it is
possible to produce stable microcapsules with reduced diffusional mobility of oxygen and
useful release properties for the entrapped micronutrients. The generated microcapsules can
be designed to have a relatively large size ranging from 300 µm to 700 µm, suitable for salt
fortification.

39
4.2 Experimental Materials & Methods
4.2.1 Materials
Table 4.1 List of chemicals used in the study of microencapsulated FeFum premix for salt
double fortification
Material / Chemical Name Supplier Description
Materials for extrusion
Rice flour Local supermarket
Durum flour Local supermarket
Wheat flour Local supermarket
Shortening Crisco
TM (Procter & Gamble,
Canada)Corn flour Local supermarket
Potato starch Local supermarket
Dextrin Casco, Canada Food grade
Ferrous fumarate Almat Pharmachem Inc. R&D use
Butylated hydroxyanisole (BHA) Sigma Chemicals, Canada R&D use
Butylated hydroxytoluene (BHT) Sigma Chemicals, Canada R&D use
Sodium hexametaphosphate (SHMP) EM Sciences R&D use
Ascorbic acid Sigma-Aldrich Chemicals ACS grade
MethocelTM
E3 (HPMC) Dow Chemicals Co. R&D use
Materials for coating
Titanium dioxide Sigma Chemicals, Canada R&D use
Kollicoat® IR White BASF, Canada Pharmaceutical grade
MethocelTM
E3 (HPMC) Dow Chemicals Co. R&D use
Ethanol EM Sciences ACS grade
Dichloromethane EMD Chemicals Inc. R&D use
Soy stearine Casco, Toronto, Canada Food grade
Chemicals for analysis
Potassium iodate Sigma Chemicals, Canada ACS grade
Potassium iodide Fisher Scientific Co. ACS grade
Sulphuric acid EMD Chemicals Inc. USA R&D use
Hydrochloric acid EMD Chemicals Inc. USA R&D use
Nitric acid EMD Chemicals Inc. USA R&D use
1, 10-phenanthroline Sigma Chemicals, Canada R&D use
Sodium thiosulphate BDH Inc. 0.1 N solution, ACS grade
Potassium hydrophatalate Sigma Chemicals, Canada R&D use
Starch (soluble) Sigma-Aldrich Chemicals, USA ACS grade
Hydroxylamine hydrochloride Sigma Chemicals, Canada Reagent grade

40
4.2.2 Equipment
A KitchenAidTM Mixer, Ultra Power® Series, Tilt-Head Stand (Figure 4.2), is used for
forming and pre-conditioning of the iron-containing mixture prior to extrusion. The mixer
produces a homogeneous dough-mass consisting of ferrous fumarate, the selected binder,
vegetable shortening, and water.
Figure 4.2 Ultra Power® Series KitchenAidTM Stand Mixer
A La Monferrina P12 (Figure 4.3) pasta extruder was used. The machine is a single-screw,
cold-forming pasta extruder composed of several elements: a motor to drive the screw, two
tanks for dough preparation and extrusion, respectively, a screw, extruder barrel, and an
assembly of an angel-hair die and a four-blade cutter driven by a separate variable-speed
motor. The machine operates at low screw speed and low shear. The die and cutter assembly
defines the shape and size of the iron particles. The angel-hair die forms fine filaments with
a diameter of 0.5 mm, which are then cut longitudinally to form cylindrical particles with a
length of ~0.5 mm by controlling the flow rate and the cutter speed.
Figure 4.3 La Monferrina P12 Pasta Extruder - die and cutter

41
The detailed machine configurations include:
� A smooth barrel,
� Deep screw flight,
� Constant flight heights,
� Constant root diameter with decreased pitch at the exit,
� A screw length-to-diameter ratio (L/D) of 15:1,
� A breaker plate at the exit as part of the die assembly.
After extrusion the iron agglomerates are dried to ~8% moisture content using a forced air
oven. The dried particles are screened through the Canadian Standard Sieve Series, to
remove fines and larger dough lumps. Particles with the size range of 300-700 µm are
retained for coating.
An Intel® PlayTM QX3 Computer Microscope was used to examine the surface characteristics
of the iron premix, while a Hitachi Scanning Electron Microscope (Model S-2500) was used
to examine the particle morphology at various scales.
A Uni-Glatt top-spray fluidized bed apparatus was used to apply glassy polymer coatings to
the extruded iron particles. As depicted in Figure 4.4, the aqueous coating solution was
pneumatically sprayed over the extruded iron particles, which were fluidized by pre-heated
air blown from the bottom of the bed. The detailed operating procedure is presented in
section 4.2.3 and Appendix 11.1.6.

42
Figure 4.4 Schematic diagram for Uni-Glatt top spray fluidized bed assembly
Figure 4.5 Laboratory pan coating assembly
A laboratory pan coating assembly (Figure 4.5) was used to coat extruded particles with
hydrophobic coating materials, e.g., soy stearine, and Kollicoat® IR, where pharmaceutical-
grade dichloromethane was used as the solvent carrier. The coater consists of a rotating pan
Exhaust Air
Expansion chamber with a filter bag
Column
Entry for pressurized air
Entry for coating solution
Support
Coating chamber with a bed and an air distribution plate
Heater and air blower Heated air
Extruded particles
Coating solution
Rotating pan
Connection to compressed air
Spray nozzle

43
(12 cm in diameter x 6 cm in depth) and an atomizer connected to a compressed air supply.
The stainless steel rotating pan was assembled at an inclination angle of ~45o and the
rotation speed was adjusted to 60-70 rpm, so that the iron particles loaded in the pan could
freely fall from the top rim of the pan. While the particles rotate within the pan, the coating
solution is sprayed on the particles with mild agitation to ensure uniform distribution.
A CSZ model Z8 environmental chamber (Cincinnati Sub-Zero Co., USA) was used for
storage stability tests to obtain a controlled temperature (40oC) and relative humidity (60%
RH).
4.2.3 Experimental Procedures
Ferrous Fumarate Agglomeration Extrusion
The dry ingredients, including ferrous fumarate powder and the selected binder (typically at
a ratio of 7:3), as well as optionally water-soluble antioxidants, were first blended in the
KitchenAidTM Mixer. Water and melted shortening which may contain fat-soluble
antioxidants were added to the dry mixture and blended for 5~10 minutes to ensure
homogeneity. The wet mixture was then extruded. After the flow stabilized the face-cutter
was installed. The cutter speed was adjusted to generate particles with the appropriate length.
The extruded particles were oven-dried for several hours at 50oC.
Particle Screening
Dried iron agglomerates were screened through a series of Canadian Standard Sieves with
sieve sizes of 1000, 710 and 300 µm. Oversize particles and particles <300µm in diameter
were discarded. Particles in the size range of 300 - 710 µm were used for coating.
Colour-masking with TiO2
A 20 g sample of these particles was placed in a glass beaker and shaken with 5 g of titanium
dioxide powder, resulting in a 25% (w/w) coating which was sufficient to fully cover the
dark-brown colour of the core. Typically the blending aided by a plastic spatula was
continued for ~10 minutes until all the TiO2 powder uniformly distributed on the iron
particles and no dark spots could be visually observed on the surface. The resulting particles

44
were off-white in colour with a greyish tint. Colour masking was followed by coating in
either a fluidized bed or drum (rotating pan) coater.
Pan Coating
The colour-masked sample was then placed in the tilted rotating pan. A motor drives the pan
to rotate in a counter-clockwise direction, while the coating solution contained in a Thin
Layer Chromatography (TLC) flask was sprayed over the tumbling particles by compressed
air at 5-6 psig. The detailed operating protocol is attached as Appendix 11.1.6.
Fluidized Bed Coating
The coating chamber of the fluidized bed coater was warmed up to ~60oC by the pre-heated
air circulation for ~10 minutes prior to loading the colour-masked iron agglomerates. The
coating solution was prepared by dispersing the hydrophilic polymers, i.e., MethocelTM and
Kollicoat®, in warm water pre-heated to 60–80oC. The concentration of the aqueous coating
solution was kept at 2-5% (w/v) to ensure a proper viscosity (3-10 mPa·s), as this was crucial
for avoiding clogging of the spray nozzle. The air flow rate was varied by the air-flap to
maintain fluidization. While the fluidized particles circulated, the coating solution was
delivered by compressed air at ~2 bars as fine droplets sprayed over the fluidized particles.
The coating chamber temperature was maintained at 70-80oC to ensure a rapid evaporation
of the solvent water from the fluidized particles, resulting in a thin polymer film on the
particle surface. The detailed operating protocol is presented in Appendix 11.1.6.
Sampling and Storage Test
The iron premix was blended manually with commercial iodized salt from Kenya at a ratio
of 1:150 to obtain double fortified salt (DFS) with ~1000 ppm of iron and ~100 ppm of
iodine. Batches of 750 g DFS were made with each iron premix formulation, and packed in
Zip-LockTM polyethylene bags. The DFS samples were then stored in the environmental
chamber at 40oC and 60% RH. The iodine and iron content and sensory properties of each
DFS sample were determined initially then after 3, 6, 12 months.

45
4.2.4 Analytical Methods
Bulk Density (DB) and Particle Density (DP) of each iron premix formulation were measured.
The detailed procedures are presented in Appendix 11.1.1.
Particle Size Distribution
Particle size distribution was obtained using the Canadian Standard Sieve series.
Moisture Content of each sample was determined gravimetrically.
Particle Colour and Other Characteristics were observed visually and using an Intel® PlayTM
QX3 Computer Microscope at a 60x magnification, and recorded as digital pictures.
Particle Surface Morphology
The detailed surface morphology of the iron premix was examined using a Hitachi Scanning
Electron Microscope (Model S-2500). Samples were first coated with a thin layer of gold
using a gold sputter coater (SEM Coating Unit P3S). Images of the prepared samples were
obtained at various magnifications.
Iron Analysis
Total iron was measured by atomic absorption spectrophotometry (AAS) using AOAC
method 3.6.1.2 (Fourteenth Edition, 1984). Details are presented in Appendix 11.1.1.
Ferrous iron content in the premix was determined by spectrophotometry (Harvey, Smart, &
Amis, 1955), as a complex with 1,10-phenanthroline. Details are presented in Appendix
11.1.1.
Iron in-vitro Bioavailability Approximation
Iron digestibility was approximated with an in vitro bioavailability test, based on the rate of
dissolution of iron in 0.1 N HCl, which closely approximates the acid in the gastric juice
(USP General Chapter 711; Swain et al., 2003; Forbes et al., 1989). Details can be found in
Appendix 11.1.1.
46
Iron particle integrity in pH 4 HCl solution
The iron particle integrity was evaluated using a dissolution test, based on the fact that
FeFum has high solubility in acid, and the fat coating will not be solubilized at pH≥4.
Specifically, ~400 mg of the iron premix were weighed and dispersed in 1L of pH 4 HCl
solution, and the dissolved iron was measured by AAS for 2 h. If there were any surface
defects in the coating layer, the iron in the core would be released into the dilute acid
solution. The rate of dissolution gives an indication of the efficiency of the film coating. The
test is only applicable to coating materials that are insoluble at pH 4.
Iodine Analysis
Iodine content in the DFS samples was determined by iodometric titration (AOAC method
33.149). Details can be found in Appendix 11.1.1.
Iodine Degradation Kinetics
Iodate loss from the DFS samples, due to the formation of elemental iodine that readily
sublimes to the atmosphere, was expected to follow the first order rate law (Winger et al.,
2005). The loss of iodine during storage at 40oC and 60% RH was approximated by plotting
linear regression of ln (% remaining) versus the time (months) using the Origin Pro 7.5
program package. The first order rate constant (k), the correlation coefficient (R), and
half-life (t1/2) (time required for 50% of the iodine to disappear) were calculated for each
formulation.
Statistical Analysis
Data from chemical assays were obtained from three to four replicates, and reported as the
mean value ± standard deviation (SD). One-way ANOVA was used to examine the statistical
significance between the sample performances, using the Origin Pro 7.5 Program Package.

47
4.3 Results & Discussion
As indicated in the process flow schematic (Figure 4.1), the tested process involved three
main steps: extrusion, colour-masking, and encapsulation. In order to find the optimized
systems of microencapsulated FeFum made by this process, the formulation ingredients and
techniques used in each individual step were examined carefully. A preliminary investigation
explored the selected formulating materials and techniques for each step, as well as the most
effective operating conditions for the selected techniques.
Based on the results of the preliminary study, the best parameters for each step were
followed to prepare 12 formulations, which involved 7 process variables at 2 or 3 different
levels for each parameter. These formulations were then examined in terms of physical and
chemical properties.
Finally, the optimized formulations were added into iodized salt to form double fortified salt
(DFS). The DFS samples were subjected to a one-year stability test at 40oC and 60% RH.
During the storage test, iodine and ferrous iron retention were followed. The iodine
degradation kinetics and the interaction between iodine and ferrous iron in DFS samples
were analysed.
The initial phase of the study was aimed at proving the technical feasibility of using the
extrusion-based microencapsulation process for making FeFum premix for salt double
fortification and identifying operational parameters for detailed tests.
4.3.1 Investigation on Extrusion
Ferrous fumarate (FeFum) was the iron compound selected for this study due to its excellent
bioavailability and bland taste. It is an odorless and tasteless reddish brown powder, with an
average particle size of 50~100 µm. Its solubility in water is very low, about 0.14g in 100 ml
of water, up to 0.6g in 100 ml of 0.1N HCl (Merck Index). On its own, ferrous fumarate
cannot be extruded. Even at very high pressures, it would be simply pumped through the
extruder as a fine powder. The addition of water to the FeFum powder resulted in clumps of
incompressible cakes; with more water, a slurry-like mixture was formed with the
48
consistency of oil paint, which was not extrudable at all (Trueman, 2005; Lo, 2006). Clearly
some binding materials are required for forming a dough-like mass, which can be extruded.
The pasta extruder requires a feed that is plastic and uniform, since there is very little mixing
or shear in the barrel itself. The available power and the backpressure through the fine die
greatly limit the viscosity of the dough that can be extruded. Therefore the selection of
dough ingredients is critical for both the extrudability of the dough and the consistency of
the extrudate. The formulation requires a binder, water and a lubricant (shortening) in
addition to the active ingredient - ferrous fumarate. The required properties of the binder –
edibility (accepted, non-toxic, safe food additive), wide availability, and low cost limited the
selection of acceptable binders to grain flours, proteins and starch derivatives.
4.3.1.1 Binder selection
Two structure-forming materials are commonly used in food extrusion: starches and proteins.
Starch-based materials have more applications due to the relatively low cost and the
chemical simplicity of starch, which permits the formation of a large number of derivatives.
Accordingly, a number of starch derivatives and cereal flours were tested, including wheat
flour, rice flour, durum wheat flour, corn meal, potato starch, and dextrin. The results were
evaluated based on the ease of extrusion, throughput, extrudate characteristics including
appearance, surface smoothness, and consistency in texture. The preliminary observations on
these materials are presented in Appendix 11.1.2.
In these preliminary investigations, we found that only natural grain flours were able to form
extrudable dough containing the iron compound in terms of ease of extrusion and desired
particle properties. Specifically, rice flour could be used on its own, but worked better with a
secondary binder such as dextrin. The maximum amount of FeFum in the dough was 60%
with careful adjustment of lipid and water content. Wheat flour could be used to form
perfectly extrudable dough on its own. The maximum amount of FeFum in the dough was
70%. The dough was harder to extrude than rice flour dough and the extrudates were bigger
in size. Dough prepared with durum wheat flour had a maximum FeFum content of 75%.
The dough was the easiest to extrude and the extrudates were of uniform size.

49
Potato starch, dextrin, and corm meal failed to bind the FeFum irrespective of the amounts
of water and oil added in the dough. This was likely due to the fact that the starch was not
gelatinized in this process. In industrial practice, wheat flour and rice flour are used to make
pasta or Asian noodle products by using cold-forming extruders, whereas corn meal\flour
and potato starch must be cooked during extrusion in high-shear cooking extruders. Without
heating externally or through shear, the ungelatinized starch from any source is inert like
sand, without any binding capacity.
It is clear that ungelatinized starch in itself was unsuitable for dough formation, and the
binding ability of the cereal flours was dependent, to a great extent, on their protein (gluten)
content. The mixture of pure vital gluten and starch with varied proportions were tested and
mostly resulted in too strong or too weak doughs (Yadava, 2008). The extruder used in the
study was a single-screw, cold-forming pasta extruder, with no controls for screw speed, feed
rate, and external heat input. Only two independent variables, the feed ingredient
composition and moisture content, could be adjusted for effective extrusion. With the limited
mixing and shear in the extruder, the mixture of gluten and starch could not form a
functional dough mass with the binding capacity of the natural combination of the two
biopolymers in grain flours.
Three common cereal flours, i.e., rice, wheat, and durum wheat flours, were further
investigated. The specifications of the materials are presented in Appendix 11.1.3.
We had extensive experience in extruding rice flour to produce re-formed rice grains using
the patented Ultra Rice® technology. Therefore it was logical to initially use rice flour as the
binder for granulating FeFum. However, rice flour formed a relatively weak dough due to its
low gluten content (<7%). Accordingly, secondary binders were required to improve the
dough mass for extrusion. Dextrin and HPMC were investigated for this purpose, and the
observations are reported in Appendix 11.1.4.
Dextrin and hydroxypropyl methylcellulose (HPMC) are polymers derived from natural
carbohydrates - starch and cellulose - with relatively smaller molecular weights and simpler

50
chemical structures than their starting biopolymers. This in turns leaves dextrin and HPMC
with limited capability to bind small molecules, e.g., ferrous fumarate, to form an extrudable
dough mass. However, they can be used as secondary binders with small amounts added to
the primary binders, e.g., rice flour, to generate a dough mass with modified properties, such
as lower viscosity, greater strength, and better consistency.
The addition of dextrin or HPMC to rice flour-based FeFum mixture resulted in improved
dough texture. Dextrin made the extruded filaments smoother on both the axial and radial
surfaces, but the particles were brittle. HPMC provided extra strength to the original dough,
which in turn resulted in harder extrudates that were tough to cut, resulting in a rough
surface at the axial cut. Finally, a combination of rice flour and dextrin at the ratio of 80:20
was the most effective in terms of extrudability and particle properties (Appendix 11.1.4).
As indicated earlier, wheat flour and durum flour could be used on their own due to their
higher gluten content. The three cereal flours were used at a level of 25-30% of the total
weight of the dry mixture, which was the minimum range to form an extrudable dough with
the highest amount of FeFum. The detailed observations are presented in Appendix 11.1.5.
In general, durum wheat flour was the best in terms of making the extrusion easy with a
relatively fast production rate. Also, it was capable of carrying more active ingredient, up to
80% (w/w) FeFum in the dry mixture. In addition, the batches made with durum flour had
higher yields of particles with relatively uniform size distribution (300-710 µm). However,
SEM images of surface morphology (Appendix 11.1.5) showed that the extrudates made
with durum flour had a more porous texture and rougher surface. This was probably due to
the relatively bigger particle size and higher protein content of durum flour, compared to rice
flour and soft wheat flour used in the study (Appendix 11.1.3).
Apparently, the difference in the particle size of the three raw materials had an impact on the
texture and density of the extrudates. The coarser durum flour was expected to require longer
mixing time, more moisture, and higher shear to be melted in forming a firm agglomerate
texture. As a result, under similar moisture content, mixing time, and extrusion temperature
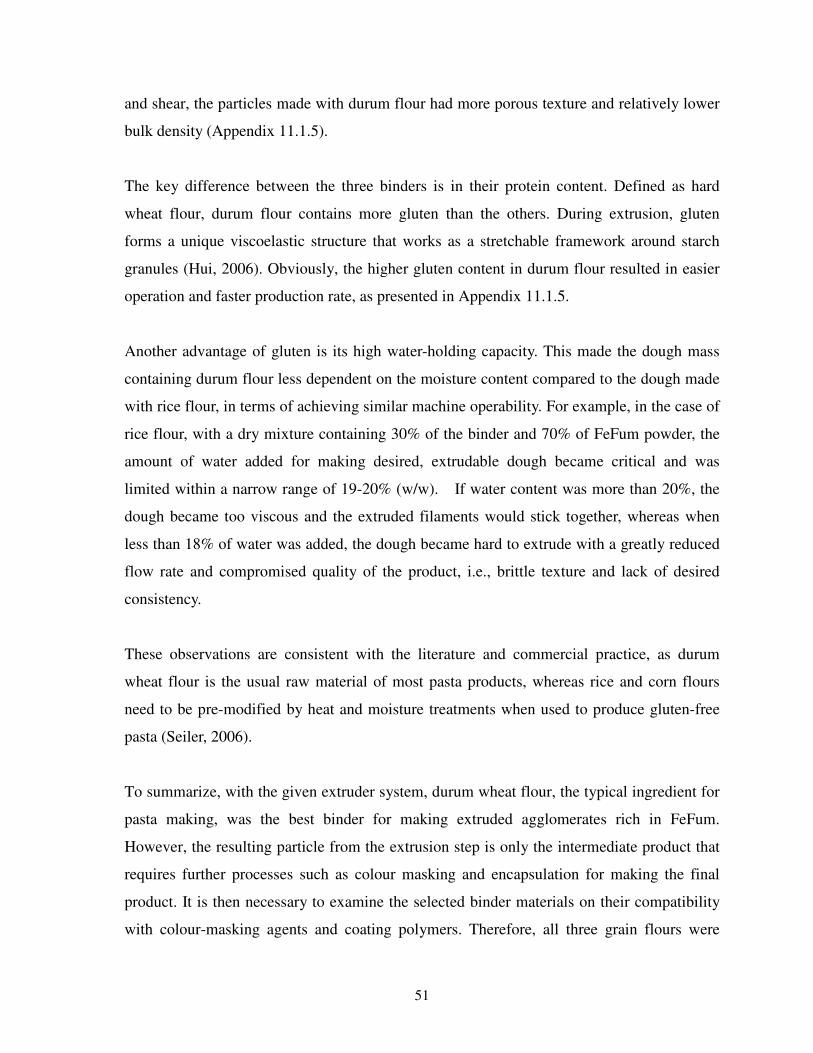
51
and shear, the particles made with durum flour had more porous texture and relatively lower
bulk density (Appendix 11.1.5).
The key difference between the three binders is in their protein content. Defined as hard
wheat flour, durum flour contains more gluten than the others. During extrusion, gluten
forms a unique viscoelastic structure that works as a stretchable framework around starch
granules (Hui, 2006). Obviously, the higher gluten content in durum flour resulted in easier
operation and faster production rate, as presented in Appendix 11.1.5.
Another advantage of gluten is its high water-holding capacity. This made the dough mass
containing durum flour less dependent on the moisture content compared to the dough made
with rice flour, in terms of achieving similar machine operability. For example, in the case of
rice flour, with a dry mixture containing 30% of the binder and 70% of FeFum powder, the
amount of water added for making desired, extrudable dough became critical and was
limited within a narrow range of 19-20% (w/w). If water content was more than 20%, the
dough became too viscous and the extruded filaments would stick together, whereas when
less than 18% of water was added, the dough became hard to extrude with a greatly reduced
flow rate and compromised quality of the product, i.e., brittle texture and lack of desired
consistency.
These observations are consistent with the literature and commercial practice, as durum
wheat flour is the usual raw material of most pasta products, whereas rice and corn flours
need to be pre-modified by heat and moisture treatments when used to produce gluten-free
pasta (Seiler, 2006).
To summarize, with the given extruder system, durum wheat flour, the typical ingredient for
pasta making, was the best binder for making extruded agglomerates rich in FeFum.
However, the resulting particle from the extrusion step is only the intermediate product that
requires further processes such as colour masking and encapsulation for making the final
product. It is then necessary to examine the selected binder materials on their compatibility
with colour-masking agents and coating polymers. Therefore, all three grain flours were
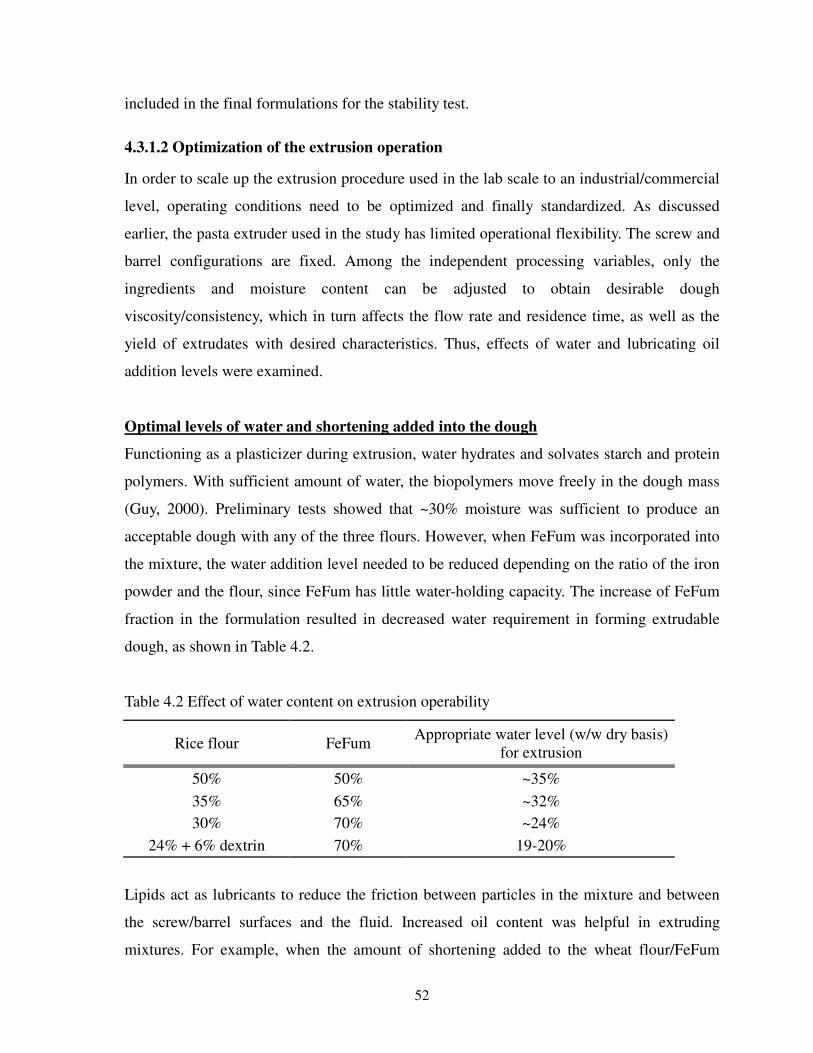
52
included in the final formulations for the stability test.
4.3.1.2 Optimization of the extrusion operation
In order to scale up the extrusion procedure used in the lab scale to an industrial/commercial
level, operating conditions need to be optimized and finally standardized. As discussed
earlier, the pasta extruder used in the study has limited operational flexibility. The screw and
barrel configurations are fixed. Among the independent processing variables, only the
ingredients and moisture content can be adjusted to obtain desirable dough
viscosity/consistency, which in turn affects the flow rate and residence time, as well as the
yield of extrudates with desired characteristics. Thus, effects of water and lubricating oil
addition levels were examined.
Optimal levels of water and shortening added into the dough
Functioning as a plasticizer during extrusion, water hydrates and solvates starch and protein
polymers. With sufficient amount of water, the biopolymers move freely in the dough mass
(Guy, 2000). Preliminary tests showed that ~30% moisture was sufficient to produce an
acceptable dough with any of the three flours. However, when FeFum was incorporated into
the mixture, the water addition level needed to be reduced depending on the ratio of the iron
powder and the flour, since FeFum has little water-holding capacity. The increase of FeFum
fraction in the formulation resulted in decreased water requirement in forming extrudable
dough, as shown in Table 4.2.
Table 4.2 Effect of water content on extrusion operability
Rice flour FeFum Appropriate water level (w/w dry basis)
for extrusion
50% 50% ~35%
35% 65% ~32%
30% 70% ~24%
24% + 6% dextrin 70% 19-20%
Lipids act as lubricants to reduce the friction between particles in the mixture and between
the screw/barrel surfaces and the fluid. Increased oil content was helpful in extruding
mixtures. For example, when the amount of shortening added to the wheat flour/FeFum

53
(70:30) formulation was increased from 2.5% to 5%, the extrusion flow rate dramatically
increased from 60 g/min to 100 g/min. However, this effect was not observed when rice flour
was used as the binder. When the shortening amount doubled from 2.5% to 5%, the wet
mixture of rice flour and FeFum (at the same ratio of 70:30) became non-extrudable with an
oily, slippery texture. This could be explained by the higher gluten content in wheat - the
protein imparted a higher tensile strength to the dough mass, which then required more
lubricant to reduce the friction in the barrel.
The shortening used in the study was semi-solid, hydrogenated soybean oil with a melting
point of 40-50oC. Typical 2.5% (w/w) shortening was added into the formulation together
with the appropriate amount of water. This idea was adopted from our previous study on
Ultra Rice®. The pre-melt shortening added in the formulation could remain in its liquid
form during extrusion where a typical extrusion temperature of 50-55oC was attained. Once
the fluid passed through the die, the extrudates quickly cooled to room temperature. This
resulted in a rapid solidification of the lipid dispersed in the particles and a relatively dense
particle texture.
Pre-conditioning prior to extrusion
It is preferable to make extrudates rich in iron to reduce the amount of premix required in
fortification. Typically binder:FeFum ratio of 30:70 was used. Unlike common extrusion
operations with a bulk formulation composed of natural biopolymers, in our system cereal
flour was a minor ingredient with the bulk of the mass consisting of low molecular-weight
FeFum powder. This required extra blending (for dry ingredients) and mixing (for wet dough
mass) to achieve uniform distribution and hydration of ingredients, which in turn played an
important role in production rate and product quality. Proper dough development by careful
mixing of dry and wet ingredients made the extrusion process much easier. For a typical 1
kg batch, a minimum of five-minute dry blending and ten-minute wet mixing was desirable
for proper dough development.
Effect of cutter speed
The cutter speed at the exit of the die controlled the particle size. Formulations made with

54
different cereal flours had different viscosities and consistencies, which in turn resulted in
different extrusion rates or residence times at the given extruder setting (~50 rpm screw
speed). For example, the formulation made with durum flour had about twice the flow rate
(~150 g/min) of that made with the combination of rice flour and dextrin (~80 g/min). Thus,
a faster cutter speed was required for durum flour formulations, i.e., at the level 4 of the
ten-position speed regulator or ~600 rpm, whereas level 3 (~400 rpm) was sufficient for rice
flour formulations. For a typical 1 kg batch approximately 15-20 minutes would be enough
for completing the extrusion including start-up and shutdown, while the period of time with
a relatively constant flow rate was only about 5 minutes. Close attention had to be paid to the
start-up and shutdown in order to obtain an acceptable yield of desired particles.
Post-extrusion drying
The FeFum dough normally contained ~20% moisture. After extrusion, this value dropped to
16-18% due to slight water evaporation at the die (at a dough temperature of 50-55oC). The
extruded agglomerates were dried in a forced air oven at 50oC for a few hours. Due to the
large surface area, the moisture content in the small particles dropped quickly to ~2% in 5
hours (Rabier, 2006). During the drying process, the bulk density of the particles remained
constant, while the particle density increased by >10%, which was expected as the particles
became denser when the entrapped water was evaporated.
Low residual moisture in the particles is preferred for a stable system and prolonged shelf
life. However, the colour-masking agents, e.g., TiO2, did not adhere well to particles made
with durum wheat flour with <2% moisture content. Apparently, the drying process had a
great impact on the particle surface properties that affected TiO2 adhesion. A drying test was
then carried to determine the optimal residual moisture in the extruded particles for proper
TiO2 adhesion, which will be discussed in the next section.
4.3.2 Investigation on Colour-Masking Process
The FeFum agglomerates made by extrusion were dark brown in colour due to the original
colour of the iron compound. A colour-masking process was necessary to ensure
acceptability of DFS. Titanium dioxide (TiO2) has been used in previous studies for this
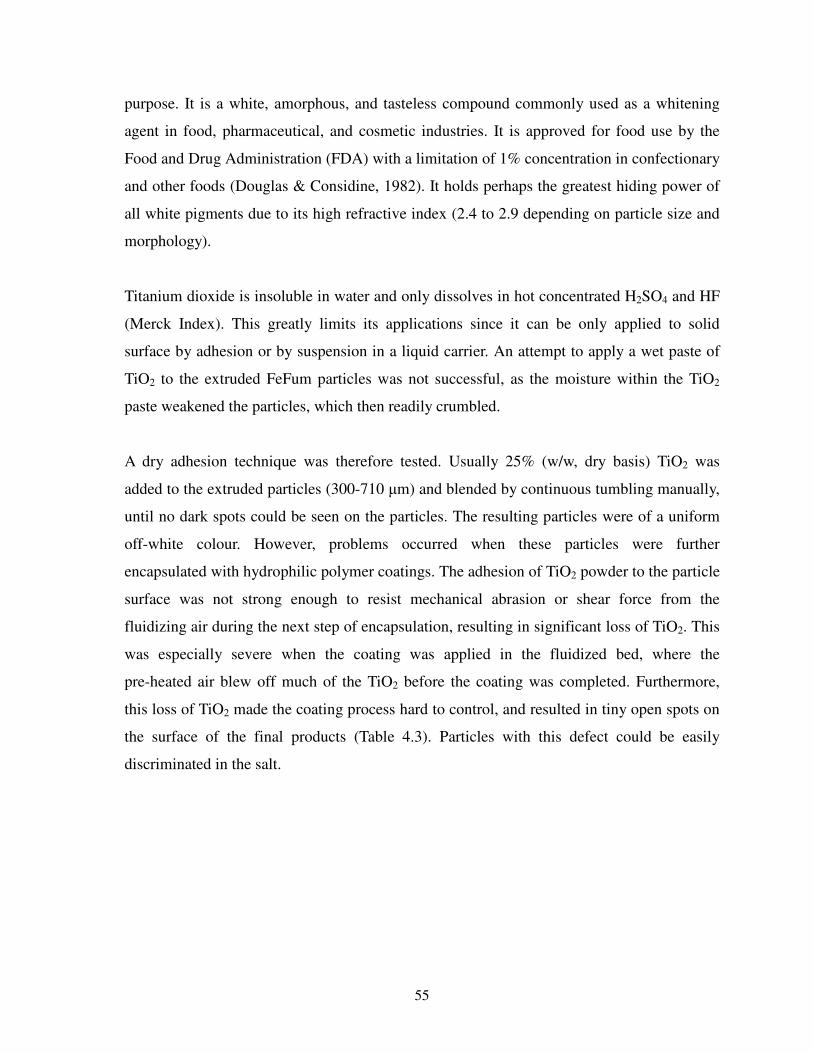
55
purpose. It is a white, amorphous, and tasteless compound commonly used as a whitening
agent in food, pharmaceutical, and cosmetic industries. It is approved for food use by the
Food and Drug Administration (FDA) with a limitation of 1% concentration in confectionary
and other foods (Douglas & Considine, 1982). It holds perhaps the greatest hiding power of
all white pigments due to its high refractive index (2.4 to 2.9 depending on particle size and
morphology).
Titanium dioxide is insoluble in water and only dissolves in hot concentrated H2SO4 and HF
(Merck Index). This greatly limits its applications since it can be only applied to solid
surface by adhesion or by suspension in a liquid carrier. An attempt to apply a wet paste of
TiO2 to the extruded FeFum particles was not successful, as the moisture within the TiO2
paste weakened the particles, which then readily crumbled.
A dry adhesion technique was therefore tested. Usually 25% (w/w, dry basis) TiO2 was
added to the extruded particles (300-710 µm) and blended by continuous tumbling manually,
until no dark spots could be seen on the particles. The resulting particles were of a uniform
off-white colour. However, problems occurred when these particles were further
encapsulated with hydrophilic polymer coatings. The adhesion of TiO2 powder to the particle
surface was not strong enough to resist mechanical abrasion or shear force from the
fluidizing air during the next step of encapsulation, resulting in significant loss of TiO2. This
was especially severe when the coating was applied in the fluidized bed, where the
pre-heated air blew off much of the TiO2 before the coating was completed. Furthermore,
this loss of TiO2 made the coating process hard to control, and resulted in tiny open spots on
the surface of the final products (Table 4.3). Particles with this defect could be easily
discriminated in the salt.
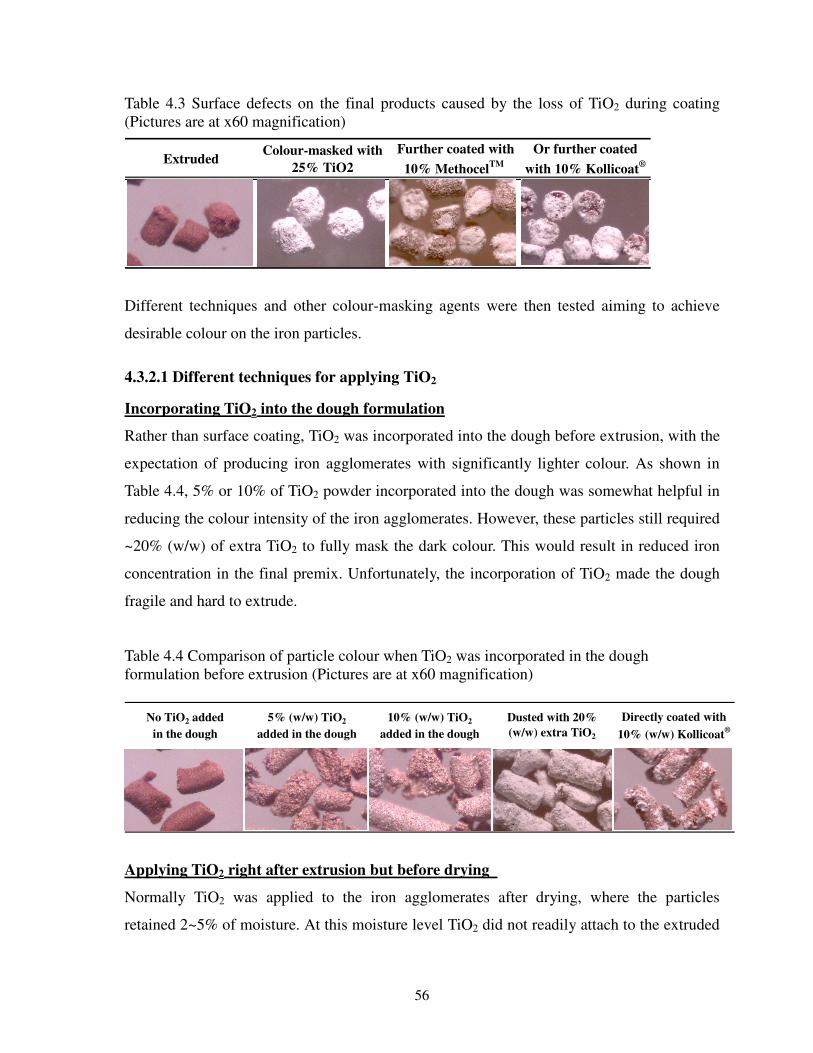
56
Table 4.3 Surface defects on the final products caused by the loss of TiO2 during coating (Pictures are at x60 magnification)
Different techniques and other colour-masking agents were then tested aiming to achieve
desirable colour on the iron particles.
4.3.2.1 Different techniques for applying TiO2
Incorporating TiO2 into the dough formulation
Rather than surface coating, TiO2 was incorporated into the dough before extrusion, with the
expectation of producing iron agglomerates with significantly lighter colour. As shown in
Table 4.4, 5% or 10% of TiO2 powder incorporated into the dough was somewhat helpful in
reducing the colour intensity of the iron agglomerates. However, these particles still required
~20% (w/w) of extra TiO2 to fully mask the dark colour. This would result in reduced iron
concentration in the final premix. Unfortunately, the incorporation of TiO2 made the dough
fragile and hard to extrude.
Table 4.4 Comparison of particle colour when TiO2 was incorporated in the dough formulation before extrusion (Pictures are at x60 magnification)
Applying TiO2 right after extrusion but before drying
Normally TiO2 was applied to the iron agglomerates after drying, where the particles
retained 2~5% of moisture. At this moisture level TiO2 did not readily attach to the extruded
No TiO2 added
in the dough
5% (w/w) TiO2
added in the dough
10% (w/w) TiO2
added in the dough
Dusted with 20%
(w/w) extra TiO2
Directly coated with
10% (w/w) Kollicoat®
ExtrudedColour-masked with
25% TiO2
Further coated with
10% MethocelTM
Or further coated
with 10% Kollicoat®

57
particles, especially to those made with durum flour. The effect of residual moisture level on
TiO2 adhesion was investigated. The results suggested that moisture was required for proper
coverage by TiO2. For the particles made with durum flour a minimum of 8% moisture was
required (Rabier, 2006). The effect of TiO2 dusting prior to drying the particles at 50oC was
investigated (Appendix 11.1.6).
TiO2 dusting after drying generally formed a thick, uniform layer on the extruded particles.
However, when the colour-masked particles were soaked in water, some of the TiO2 layer
peeled off, exposing the dark cores. Although much of the TiO2 powder dusted onto the
moist iron particles peeled off after drying, leaving only 10~20% on the particle surface,
which formed a thin film, that could survive the water washing. This was more pronounced
in the particles made with durum flour, which had a more porous texture and rougher surface
than those made with rice or wheat flour (Appendix 11.1.5, section 4.3.1.1). This may be due
to the significantly smaller particle size of the pigment (<10µm) than the agglomerated
particles (~500 µm), which allowed the tiny whitener particles to embed in the bumpy areas.
A small amount of TiO2 would be sufficient to fully cover the dark colour of the
agglomerates, due to the huge surface area of the colour-masking agent.
Since the tiny particles of TiO2 tended to aggregate, it was hard for the fine powder to spread
evenly onto the surface, which in turn required more materials to achieve proper coverage by
forming a thick layer. When subjected to external mechanical forces such as abrasion, this
thick layer of whitener powder tended to peel off.
A number of mechanisms may interact in TiO2 adhesion, including van der Waals force,
formation of solid or liquid bridges, electrostatic force, and mechanical interlocking due
mainly to the surface roughness (Yadava, 2008). By dusting the TiO2 powder onto moist iron
particles prior to drying could form liquid bridges by the interaction between the surface
moisture on the agglomerates and the TiO2 particles (Onwulata, 2005). When the
colour-masked iron particles were subjected to further drying, the liquid bridges (due to
capillary force) formed earlier could be solidified to form solid bridges, which might be even
stronger (Hanus & Langrish, 2007). In addition, there might be mechanical interlocking

58
between the fine pigment particles and the rough surface of the iron agglomerates. The
combined effects of these forces resulted in better TiO2 adhesion to the extrudates made with
durum flour when TiO2 was applied to the moist particles right after extrusion but before
drying. On the other hand, dusting the TiO2 powder onto the dried agglomerates mainly
involved electrostatic forces, which were weaker than other surface binding forces. Still, this
approach seemed to result in better TiO2 adhesion on particles made with rice flour when
~10% of dextrin was used in the extrusion formulation. Dextrin was reported to interact with
titanium dioxide, enhancing the retention of TiO2 on paper coated with dextrin-based
adhesives (Rogols & Hyldon, 1963). In addition, the scientific literature indicated that many
polysaccharides, including starch, have strong interactions with titanium dioxide (rutile) at
pH range of 5~6, which is the isoelectric point of rutile (Liu et al. 2000). Our previous study
of simulated Ultra Rice® by extrusion showed that the extruded rice grains had a pH range of
5~6 in the 1% (w/v) solution made of ground grain powder (Li, 2005). Based on these
considerations, one possible explanation would be that the residual moisture at the surface of
the iron extrudates made with the rice flour-dextrin formulation might enhance the titanium
atom hydroxylation at pH 5~6 (also its isoelectric point), which in turn interacted with starch
through an acid/base-like reaction. This interaction model has been used to explain several
metal solid-polymer adsorption and adhesion processes (Liu et al. 2000)
In general, TiO2 dusting before drying was better in forming a stronger, thin film of TiO2 on
the iron particles made with durum flour, which was confirmed by a later study (Yadava,
2008); whereas TiO2 adhesion to the dried agglomerates resulted in better coverage in the
iron extrudates made of rice flour and wheat flour. This was taken into account when
designing the final formulations for storage stability test.
4.3.2.2 Alternative colour-masking agents
Zinc oxide and talc were compared to TiO2 as colour masking agents. Zinc oxide is also
commonly used in the food industry as white pigment; while talc is a common inert filler
and food whitening agent. The results (Table 4.5) showed that more materials were required
when ZnO and Talc were used for proper coverage. This is mainly due to their relatively
lower refractive indices compared to TiO2. Nevertheless, ZnO formed better films featuring
a uniformly thin layer compared to the rough surface produced by Talc.

59
Table 4.5 Comparison of different colour-masking agents
In consideration of the scarcity of Zn in many diets, it seemed worthwhile to investigate the
possibility of using ZnO as both fortificant and colourant for the extruded iron premix. A
quick encapsulation test showed that the ZnO layer covering the iron extrudates was easily
blown off when hydrophilic polymer coatings were applied by fluidized bed coating,
resulting in unacceptable particle appearance. In addition, the incorporation level of ZnO for
acceptable colour-masking would result in an excessively high zinc concentration in the final
premix. When the premix is added into salt at a ratio of 1:150 or 1:200 according to the
current practice for preparing double or triple fortified salt, this will lead to a salt product
containing ~1000 ppm of zinc. Based on an average daily intake of 10 g of salt, it is
expected that such salt product would provide ~10 mg of the mineral, which is at the higher
end of the RDA (Recommended Dietary Allowance) range, i.e., 2~10 mg per day from
infants to male adults. This is somewhat risky as fortified foods are normally designed to
provide only 1/2 to 1/3 of the RDA. Therefore, until an effective adhesion method could be
identified for proper coverage of the iron agglomerates using less ZnO, this approach is
impractical.
4.3.3 Investigation on Encapsulation Using Glassy Polymer Coatings
Hydrophilic polymer coatings were proposed in the study to replace soy stearine. As
discussed earlier, coatings with soy stearine caused several problems in the current system of
microencapsulated FeFum premix, including surface defects, low density, potential rancidity,
and reduced iron bioavailability due to the insoluble fat layer. On the other hand, hydrophilic
TiO2 ZnOTalc (hydrous
magnesium silicate)
Refractive index 2.4-2.9 2.02 1.59-1.60
Minimal amount needed to fully cover
the dark colour of the core with a size
of 300-710 µm
25% 35% 30%
Surface morphology
(x60 magnification)

60
polymers are extensively used in oral drug delivery systems to achieve sustained or
controlled release. The glassy polymers provide excellent physical barriers to protect the
core ingredient and regulate its release in a swelling-controlled mechanism upon water
penetration. This part of the work was then aimed to investigate the applicability of the
pharmaceutical concept in developing a stable, bioavailable microencapsulated iron premix
for food fortification. It was anticipated that the resulting product would have improved
physical characteristics, desired stability and subsequently reduced interactions with other
food components and/or added micronutrients, as well as desirable release properties when
absorbed in the body.
Two typical glassy polymers were chosen in this study, MethocelTM E3 from Dow Chemicals
Co. and Kollicoat® IR White from BASF, due to their availability and success in film coating
of oral drug tablets. MethocelTM is a brand name for hydroxypropyl methylcellulose
(HPMC), which is a cellulose derivative formed by the reaction of propylene oxide and
methyl chloride with alkali cellulose. Depending on the different ratios of hydroxypropyl
and methyl substitution, HPMC is available as various commercial products with different
physical/chemical properties, such as water or organic solubility, viscosity, and thermal
gelation temperature. Variations in the structure and properties make HPMC suitable for a
broad range of applications in drug formulations, food and beverages, household cleaners
and paints, paper and textile products, etc. In these applications, HPMC plays various
functions such as film former, filler/excipient, thickener, lubricant, and emulsifier. In this
study, MethocelTM E3 made by Dow Chemicals Co. was used as encapsulant. It contains
28-30% methyl substitution, 7-12% hydroxypropyl substitution, and has an average viscosity
of 2.4-3.6 mPa.s (in a 2% water solution). MethocelTM E3 was selected because it has been
successfully used as a film-forming agent in the application of oral tablet coatings.
Kollicoat® is a brand name of BASF for a full range of excipients used for instant release,
sustained release, and enteric coatings, which share polyvinylalcohol-polyethylene glycol
(PVA-PEG) graft-copolymer as the major polymer component. Kollicoat® IR white was
chosen specifically due to its rapid dispersibility in water and low viscosity of the resulting
solution even at polymer concentrations of up to 25%. In addition, it contains a white

61
pigment and a surfactant that enables the embedding of the pigment within the polymer
without segregation or precipitation, which is a drawback of simpler mixtures. Kollicoat® IR
White is composed of 45-74% PVA-PEG copolymer, 5-10% polyvinylpyrrolidone, 10-20%
TiO2, 10-20% kaolin, and 1-5% sodium lauryl sulphate. It was expected to enhance
colour-masking of particles during the encapsulation process.
4.3.3.1 Comparison between MethocelTM
and Kollicoat®
Both MethocelTM and Kollicoat® could form uniform, smooth films on the premix particles.
Premixes coated with 10% (w/w) of either MethocelTM E3 or Kollicoat® IR White had a
desirable surface morphology, which was similar to a premix coated with 24% (w/w) of soy
stearine (Appendix 11.1.7).
However, some operating difficulties occurred with both polymers. MethocelTM solution
seemed more viscous than that of Kollicoat®. In order to prevent clogging of the spray
nozzle, MethocelTM solution concentration had to be kept at or below 3% (w/v). In contrast,
Kollicoat® could be used at much higher concentration levels (5-10% w/v). As a result,
MethocelTM required much longer coating time than Kollicoat®. On the other hand,
Kollicoat® tended to precipitate during the spraying, which would occasionally clog the
nozzle.
4.3.3.2 Comparison between pan coating and fluidized bed coating
While a typical commercial fluidized bed coater could use any solvent for spray coating, the
small laboratory unit used in this study could not handle volatile organic solvents well,
primarily due to problems with ventilation. The pan coating assembly was set up within a
fume hood, so that the emission of the encapsulant carrier – dichloromethane - into the lab
environment was minimized. Even though it required dexterity to operate manually, the pan
coater provided more flexibility and reliable coating in some circumstances. For example,
this unit was more suitable for Kollicoat®, since occasionally manual shaking of the spray
bottle could re-disperse the solids without clogging the nozzle. Accordingly, the disc or pan
coating method was also used with hydrophilic coating materials.
62
The preliminary results showed that both techniques were viable for making encapsulated
products with desired physical characteristics, regardless of the coating materials used. The
resulting iron premixes using either equipment were reproducible even with varied coating
material levels and particle loads. In general, the pan coater was more suitable for coating
with Kollicoat® and soy stearine, while the fluidized bed could produce uniform distribution
of MethocelTM forming a viscous, transparent film.
Nonetheless, both techniques had some drawbacks. The agglomerated particles experienced
a great loss of TiO2 within the fluidized bed. This whitener layer was readily blown off by
the fluidizing air stream, and some TiO2 powder was then lodged in the filter bag at the top
of the coating column and could not be recycled to the fluidized bed. This loss of TiO2
resulted in exposed dark spots on the finished products, which further darkened the overall
appearance of the DFS. In the disc coater, the TiO2 powder rubbed off at the beginning of a
typical batch could be eventually reattached to the particles by continuous tumbling.
However, due to the simplicity of this open apparatus, some finished or partially finished
products could fly off the rotating pan, resulting in particle loss as high as 20%. In addition,
when aqueous solutions for hydrophilic polymers were used, the slow evaporation rate at
room temperature caused the coated particles to stick together and form big clumps. Based
on these observations, standardized operation protocols for achieving acceptable,
reproducible results were developed for both machines (Appendix 11.1.8). These standard
protocols were carefully followed later in the preparation of the 12 final formulations for the
stability test.
4.3.4 Formulation Optimization
In the preliminary studies, the required settings of several important variables were identified
(Table 4.6) and used for further quantitative examinations of the performance of the iron
premixes, in terms of physical characteristics, surface morphology, particle integrity, iron
content and in-vitro bioavailability, stability in double fortified salt with respect to
interaction with iodine. Several antioxidants were added into the final formulations (Table
4.7). The types and the amounts of the antioxidants were adopted from the most stable Ultra
Rice® formulation obtained from previous studies, where appropriate combinations of both

63
fat-soluble and water-soluble antioxidants proved to be effective in stabilizing the extruded
rice grains and in retarding fat oxidation (Lam, 2006).
Table 4.6 Formulation variables investigated in the optimization study
Parameters Options
Binder material Rice/dextrin, durum flour, wheat flour
FeFum content (w/w on dry basis) 70% & 75%
Antioxidants None, BHA/BHT, BHA/BHT/SHMP/ascorbic acid
TiO2 adhesion
(25% of the extrudates) After drying, before drying
Coating material Soy stearine, MethocelTM
E3, Kollicoat®
IR White
Coating technique Pan coater, fluidized bed
Coating level (w/w on dry basis) 5%, 10%, 15%
Table 4.7 Formulation design of microencapsulated FeFum premixes made by extrusion and polymer coatings
As shown in Table 4.7, the tested formulations included 6 iron extrudates, 8 colour-masked
particles, and 12 iron premixes. While the 12 premixes were the end products for preparing
double fortified salt, the other iron particles were intermediate products which could also
provide important information with respect to the effects of the selected materials/techniques
on the particle properties. The detailed composition of the 12 final formulations is presented
in Appendix 11.1.9.

64
4.3.4.1 Iron content in optimized formulations
As shown in Table 4.8, the extruded iron particles were rich in FeFum with total iron content
of over 20% (w/w), irrespective of the binders used. It is clear that the extrudates with high
iron content resulted in encapsulated premixes also high in iron. Coating with 25% (w/w on
dry basis of extrudates) of TiO2 resulted in general reduction of total iron content in the
colour-masked particles. However, the further encapsulation with 5~15% (w/w on dry basis
of colour-masked particles) of polymers caused an increase of iron concentration in some
final iron premixes. This may be due to the significant loss of TiO2 layer in the premixes
during the encapsulation process. Nonetheless, all encapsulated premixes contained over
16% of total iron, specifically reaching >20% in formulation P-6. This was generally better
than the premixes prepared by the previous fluidized bed agglomeration technique, where an
average iron content of 15% was obtained. This improved iron content would then result in a
reduced amount of premix required for making double fortified salt (DFS) with target iron
concentration of 1000 ppm (w/w).
Table 4.8 Total iron and ferrous iron contents in the 12 final formulations
Extruded
formulation
Total Fe (% w/w)
Colour-masked
formulation
Total Fe (% w/w)
Encapsulated
premix
Total Fe (% w/w)
Ferrous Fe (% Fe
2+/Fe
Total)
P-1 19.0 ± 0.4 94.0 ± 0.3 E-1 21.5 ± 1.1 C-1 16.9 ± 0.6
P-2 - -
E-2 21.4 ± 0.9 C-2 - P-3 17.7 ± 0.6 96.2 ± 1.1
P-4 19.2 ± 0.8 96.5 ± 1.2 C-3 16.7 ± 0.8
P-5 16.8 ± 0.4 90.9 ± 1.0
P-6 20.1 ± 0.8 95.8 ± 0.6 E-3 21.3 ± 0.4
C-4 17.7 ± 0.5 P-7 17.0 ± 0.5 94.7 ± 0.6
C-5 17.2 ± 0.1 P-8 18.4 ± 0.5 97.9 ± 1.4
C-6 17.7 ± 0.1 P-9 16.7 ± 0.7 95.8 ± 1.3 E-4 21.4 ± 1.8
C-5 17.2 ± 0.1 P-10 16.9 ± 0.4 95.9 ± 1.4
E-5 20.9 ± 1.1 C-7 - P-11 17.3 ± 0.4 95.5 ± 0.6
E-6 20.8 ± 0.6 C-8 17.9 ± 0.9 P-12 16.7 ± 0.7 93.9 ± 0.8
Note: the results are mean ± standard deviation, which were obtained from three or four replicates. Some formulation data were missing due to the loss of the samples or the analytical errors.
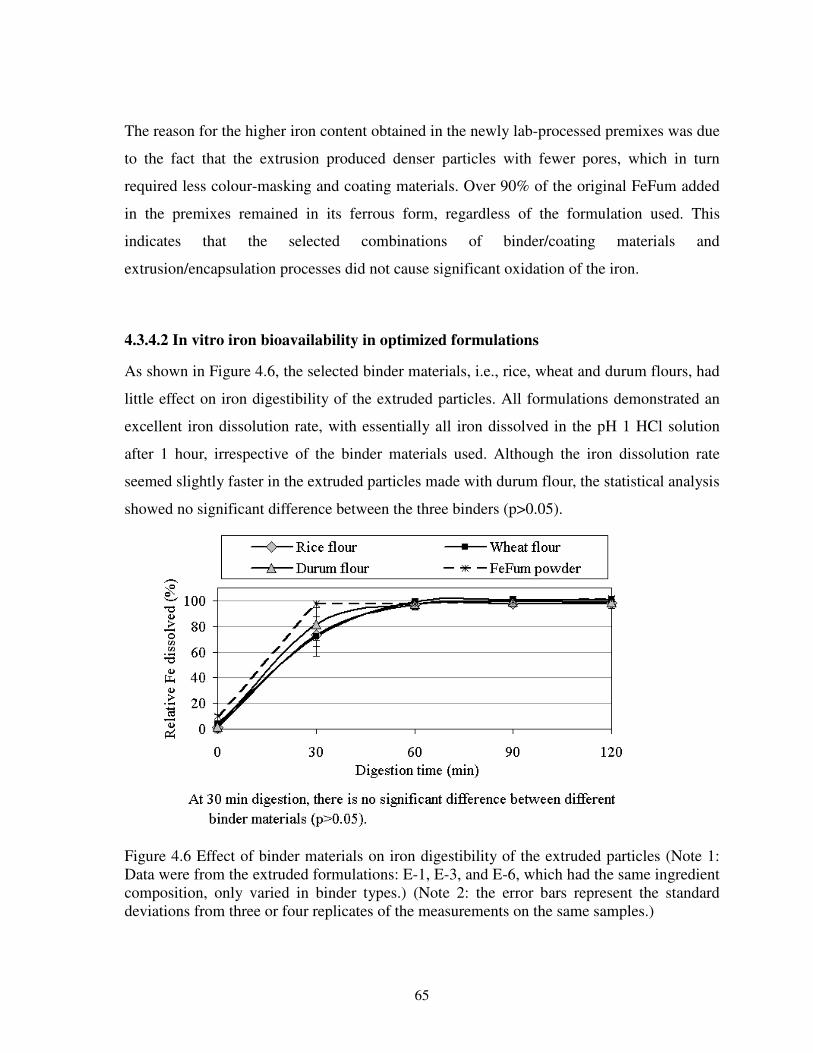
65
The reason for the higher iron content obtained in the newly lab-processed premixes was due
to the fact that the extrusion produced denser particles with fewer pores, which in turn
required less colour-masking and coating materials. Over 90% of the original FeFum added
in the premixes remained in its ferrous form, regardless of the formulation used. This
indicates that the selected combinations of binder/coating materials and
extrusion/encapsulation processes did not cause significant oxidation of the iron.
4.3.4.2 In vitro iron bioavailability in optimized formulations
As shown in Figure 4.6, the selected binder materials, i.e., rice, wheat and durum flours, had
little effect on iron digestibility of the extruded particles. All formulations demonstrated an
excellent iron dissolution rate, with essentially all iron dissolved in the pH 1 HCl solution
after 1 hour, irrespective of the binder materials used. Although the iron dissolution rate
seemed slightly faster in the extruded particles made with durum flour, the statistical analysis
showed no significant difference between the three binders (p>0.05).
Figure 4.6 Effect of binder materials on iron digestibility of the extruded particles (Note 1: Data were from the extruded formulations: E-1, E-3, and E-6, which had the same ingredient composition, only varied in binder types.) (Note 2: the error bars represent the standard deviations from three or four replicates of the measurements on the same samples.)

66
As shown in Figure 4.7, the coating materials used in the study had a more pronounced
effect on iron digestibility. The premixes coated with Kollicoat® seemed to have a relatively
faster dissolution rate, over 85% of the iron dissolved within the first half hour, whereas
<80% of iron was released from the formulations made with MethocelTM. This may be due
to the fact that Kollicoat®, made by BASF, contained some emulsifiers, which likely resulted
in a quicker coating disintegration and iron dissolution. On the other hand, Formulation P-5,
which was coated with 10% of soy stearine, showed retarded iron release. The dissolution
rate for this formulation was significantly slower than that of other premixes coated with
hydrophilic polymers (p<0.05).
Figure 4.7 Effect of different coating materials on iron digestibility of the microencapsulated premixes (Note 1: data were from the encapsulated premixes: P-4, P-5, and P-12, which had the same ingredient composition and used the same colour-masking/coating methods, but varied in binder and coating materials.) (Note 2: the error bars represent the standard deviations from three or four replicates of the measurements on same samples.)
Nonetheless, all 12 formulations released essentially all iron within 2 hours. The detailed
dissolution profiles for all 12 formulations are presented in Appendix 11.1.10. This was
expected, as the coating materials used for most formulations were hydrophilic with high
water solubility.

67
As expected, each step of the encapsulation process had a cumulative effect against iron
dissolution. As shown in Figure 4.8, the amount of iron dissolved in 2 hours was not affected
by any of the processing steps, while the dissolution rate was slowed somewhat with each
processing step. The extrusion formed the particles which were sufficiently porous not to
impede the rate of iron release. Both the TiO2 colour-masking step and the encapsulation
process seemed to slow down the initial iron dissolution rate, but this difference was not
statistically significant (p>0.05) after 2 h when essentially all of the iron in the premixes was
released.
Figure 4.8 Effect of each step of the encapsulation process on iron digestibility (Iron dissolution profiles in the formulations made with 30% of durum flour as the binder and coated with 25% of TiO2 and 15% of MethocelTM, specifically with the data from the formulations of E-3, C-3, and P-4, respectively.) (Note 2: the error bars represent the standard deviations from three or four replicates of the measurements on same samples.)
4.3.4.3 Iron premix integrity in pH 4 HCl solution
As shown in Figure 4.9, the extruded particles showed good integrity with 30% of any
binders used in the formulations. Less than 10% of the embedded iron leaked out into the

68
weak acid solution after 2 hours. However, when the binder content was reduced to 25% in
the durum formulation, the leakage of iron increased. This suggested that a minimum of 30%
binder material might be required to form agglomerates with acceptable integrity.
Figure 4.9 Effect of binders on particle integrity when dissolved in pH 4 HCl solution (Data from formulations E-1, E-3, E-4, E-6)
Table 4.9 Effect of coating materials on premix integrity in pH 4 HCl solution
Formulation Binder Coating material % Iron dissolved after 30 minutes
% Iron dissolved after 2 hours
P-1 30% rice/dextrin 10% Methocel 5 13
P-2 30% rice/dextrin 15% Kollicoat - -
P-3 30% durum 15% Methocel 4 19
P-4 30% durum 10% Methocel 3 12
P-5 30% durum 10% soy stearine 3 20
P-6 30% durum 10% Methocel 4 17
P-7 30% durum 15% Kollicoat 5 22
P-8 25% durum 5% Methocel 8 23
P-9 25% durum 15% Kollicoat 10 24
P-10 25% durum 5% Kollicoat 9 27
P-11 30% wheat 15% Methocel 6 15
P-12 30% wheat 10% Kollicoat 8 21
The detailed dissolution profiles for all 12 formulations are presented in Appendix 11.1.11.

69
As seen in Table 4.9, the hydrophilic coatings seemed to enhance iron release at pH 4. After
2 h, the majority of formulations released over 20% of the original iron, compared to only
~10% in uncoated agglomerates (Figure 4.9). This suggested that encapsulation with the
hydrophilic polymers accelerated the iron leakage. Conversely, the insoluble TiO2 layer
seemed to make the particles more resistant to water penetration, as shown in Figure 4.10.
Figure 4.10 Effect of each step of the encapsulation process on iron premix integrity in pH 4 HCl solution (Data from the formulations starting with the same extrudates, followed by same TiO2 colour-masking, but varied in coating materials, specifically E-3, C-3, P-4, P-5, P-7)
Compared to MethocelTM, Kollicoat® coatings seemed to make the premixes less resistant to
water penetration when dispersed in the weak acid solution (Figure 4.10). This was
consistent with the results from iron in-vitro bioavailability tests, where the premixes coated
with Kollicoat® had a relatively faster dissolution rate in the pH 1 HCl solution. Again, the
small amount of emulsifier contained in the Kollicoat® formulation made the polymer film
(PVA-PEG) formed on the iron particle surface more “water-friendly”. On the other hand,
the film of soy stearine protected the core well at the beginning, due to its hydrophobic
nature, while after 2 h the premix coated with 10% of the lipid still released ~20% of iron
content. This may be due to poor film-forming by the lipid. Clearly, the coating level (10%)
in this formulation (P-5) was not enough for the lipid to form a continuous
water-impermeable film around the iron extrudates.
0
10
20
30
40
50
0 30 60 90 120
Dissolution time (min)
% F
e dis
solv
ed
E-3: 30% durumextrudate
C-3: 30% durumextrudate + TiO2
P-4: 30% durum + TiO2+ 10% Methocel
P-5: 30% durum + TiO2+ 10% soy stearine
P-7: 30% durum + TiO2+ 15% Kollicoat

70
4.3.4.4 Effect of formulation ingredients and processing techniques on density
As shown in Table 4.10, the extruded iron agglomerates had an average bulk density of ~1
g/mL. This value increased by 10~18% when TiO2 was attached to the particles, mainly due
to the much greater density of TiO2 (4.23 g/mL). After encapsulation by different polymers
with varied coating levels, the density of the final premixes dropped back to the same range
as the extruded ones. This was due to the loss of TiO2 during coating and the relatively low
density of coating polymers (Table 4.11).
Table 4.10 Bulk density changes in iron particles after each processing step
Extruded
formulation
Bulk density (g/mL)
Colour-masked
formulation
Bulk density (g/mL)
Density gained by covering
with TiO2 (%)
Encapsulated
premix
Bulk density (g/mL)
Density reduced after coating (%)
P-1 1.024 -13.4 E-1 1.054 C-1 1.182 +12.1
P-2 - -
E-2 C-2 P-3 1.005 -9.6
P-4 1.005 -9.6 C-3
1.112 +18.0
P-5 0.937 -15.7
P-6 0.986 -8.0 E-3
0.942
C-4 1.072 +13.8 P-7 0.962 -10.3
C-5 1.232 +16.7 P-8 1.134 -8.0
C-6 1.161 +9.9 P-9 1.065 -8.3 E-4 1.056
C-5 1.232 +16.7 P-10 1.155 -6.3
E-5 C-7 P-11 1.102 -5.7
E-6 1.042
C-8 1.169 +12.2
P-12 1.019 -12.8
It is worth noting that formulations P-6 and P-7 were prepared with TiO2 adhesion before
drying. The colour-masked particles were further dried and the extra, loose TiO2 powder was
removed prior to coating with hydrophilic polymers. Thus, these two formulations showed a
lower bulk density of <1 g/mL. Except these two, all formulations using hydrophilic
polymers had a bulk density of >1 g/mL, which was one of the goals for improved premix
properties. Soy stearine coated particles had the lowest density (the formulation P-5), which
was consistent with previous observations (Lo, 2005).
The results for particle density were even better. As seen in Table 4.11, premixes prepared

71
with the new process, i.e., extrusion followed by hydrophilic polymer coating, had much
higher particle densities than the premix made using fluidized-bed agglomeration and lipid
coating. At 1.70 to 1.85 g/mL, the particle density of the extrusion-based premixes was
similar to that of Kenyan iodized salt. This would ensure uniform distribution of the
encapsulated iron premix in the iodized salt when making DFS samples. Therefore,
high-quality DFS samples could be prepared with minimal subsequent particle segregation.
Table 4.11 Comparison of particle densities of various premixes and raw ingredients
4.3.4.5 Physical characteristics of the microencapsulated iron premixes
Physical characteristics of the developed premixes were observed and are presented as
Appendix 11.1.12.
Most premixes had desirable particle characteristics: spherical or cylindrical shape
depending on coating material and process used, an average size of 500-710 µm, and
off-white colour with a grayish tint. In general, the formulations coated with Kollicoat® had
better appearance than those made with MethocelTM. Premixes coated with 10% MethocelTM
using the fluidized bed had some visible dark areas on the surface, specifically, in
Formulations P-1, P-4, and P-6. On the other hand, the small amount of TiO2 (5~10%)
contained in the original Kollicoat® formulation seemed to compensate for some of the loss
of pigment dusted on the extrudates, which ensured the complete masking of the dark core.
This was further confirmed by SEM images (Appendix 11.1.13). Kollicoat®-coated premixes

72
shared a similar surface morphology showing fine TiO2 particles fully or partially embedded
in the gelled polymer. Conversely, in the case of MethocelTM, when some TiO2 was blown
away during the fluidized bed coating, the exposed areas were later covered with a
transparent film of gelled HPMC polymer, leaving dark spots on the particles.
4.3.5 Stability Test in DFS Samples
As mentioned earlier, the formulated iron particles (Table 4.7), including 6 extruded, 8
colour-masked, and 12 encapsulated, were blended in Kenyan iodized salt to produce double
fortified salt (DFS) samples with the target iodine concentration of ~100 ppm and iron
concentration of ~1000 ppm. These DFS samples were then subjected to a one-year stability
test under the controlled storage conditions of 40oC and 60% RH. During the storage, iodine
and ferrous iron retentions were followed. The results were normalized as relative
percentages of the original contents, and are presented in Appendices 11.1.14 and 11.1.15.
4.3.5.1 Iodine stability
Iodine (in the form of potassium iodate) was generally stable in the original iodized Kenyan
salt, retaining ~80% of iodine after one year storage at high T and RH. However, the direct
addition of FeFum powder to the salt sample caused ~100% of iodine loss after 1 year. This
is not surprising considering the large surface area of the FeFum powder (50~100 µm
particle size).
The uncoated, extruded particles also caused significant iodine loss, varying from ~50% to
75%, depending on the binder materials and the amounts used. There was a slight difference
between binder materials; however, the amount of the binder used in the extrusion
formulation had a greater impact. When less binder was used, the iron was more exposed in
the particles, which resulted in more iodine loss in the fortified salt samples. For example,
E-3 and E-4 containing 30% and 25% durum flour, respectively, the iodine retention in the
DFS made with E-4 was approximately half of that made with E-3 (~25% vs ~50% iodine
retained). Clearly, an effective coating is needed to prevent iodine loss.
Colour-masking by TiO2 provided a physical barrier surrounding the extruded particles,
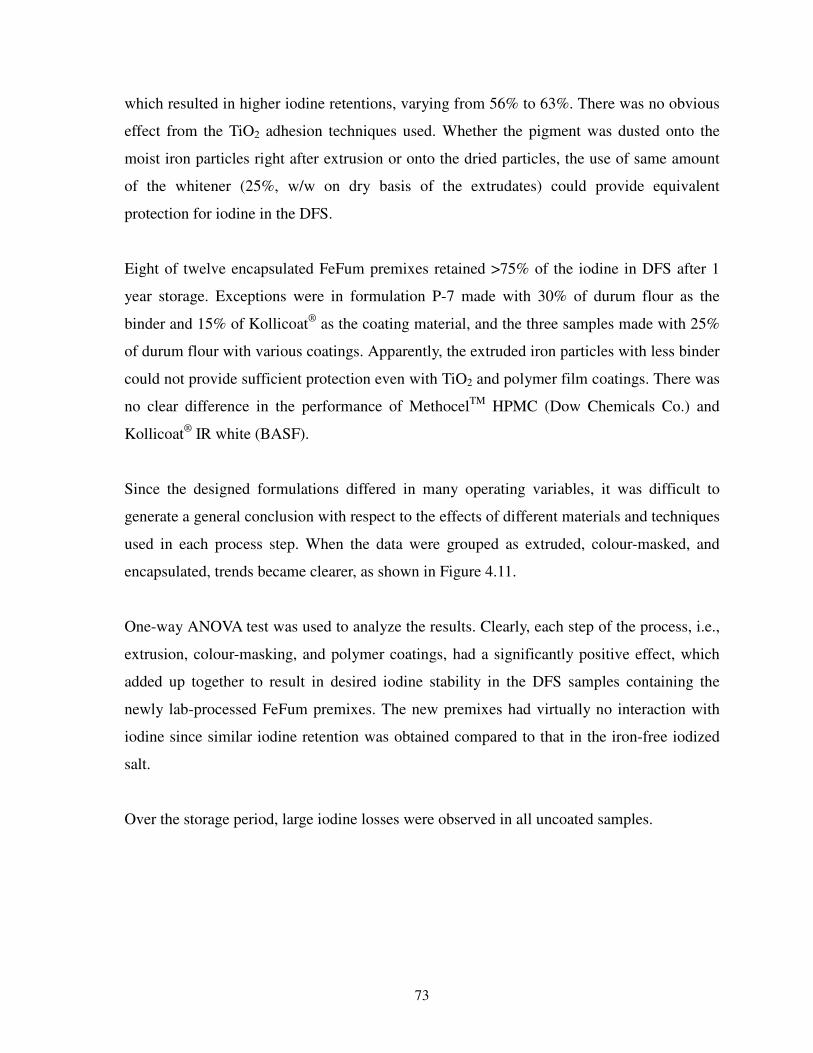
73
which resulted in higher iodine retentions, varying from 56% to 63%. There was no obvious
effect from the TiO2 adhesion techniques used. Whether the pigment was dusted onto the
moist iron particles right after extrusion or onto the dried particles, the use of same amount
of the whitener (25%, w/w on dry basis of the extrudates) could provide equivalent
protection for iodine in the DFS.
Eight of twelve encapsulated FeFum premixes retained >75% of the iodine in DFS after 1
year storage. Exceptions were in formulation P-7 made with 30% of durum flour as the
binder and 15% of Kollicoat® as the coating material, and the three samples made with 25%
of durum flour with various coatings. Apparently, the extruded iron particles with less binder
could not provide sufficient protection even with TiO2 and polymer film coatings. There was
no clear difference in the performance of MethocelTM HPMC (Dow Chemicals Co.) and
Kollicoat® IR white (BASF).
Since the designed formulations differed in many operating variables, it was difficult to
generate a general conclusion with respect to the effects of different materials and techniques
used in each process step. When the data were grouped as extruded, colour-masked, and
encapsulated, trends became clearer, as shown in Figure 4.11.
One-way ANOVA test was used to analyze the results. Clearly, each step of the process, i.e.,
extrusion, colour-masking, and polymer coatings, had a significantly positive effect, which
added up together to result in desired iodine stability in the DFS samples containing the
newly lab-processed FeFum premixes. The new premixes had virtually no interaction with
iodine since similar iodine retention was obtained compared to that in the iron-free iodized
salt.
Over the storage period, large iodine losses were observed in all uncoated samples.
74
Figure 4.11 Iodine stability in DFS samples containing various FeFum forms – powder, extruded, and colour-masked particles, as well as encapsulated premixes, after one-year storage at 40oC and 60% RH. (Note: the results are the mean values obtained from three or four replicates, and the error bars represent the standard deviations.)
A parallel experiment was performed to compare microencapsulated FeFum premix with
other iron sources in DFS. So far, the two most successful approaches to the development of
DFS, one has focused on increasing the bioavailability of less reactive iron compounds, such
as ferric pyrophosphate (FePP), and the other on microencapsulation of reactive,
bioavailable iron compounds, such as ferrous sulphate and ferrous fumarate.
The iron bioavailability of the chemically very stable ferric pyrophosphate can be enhanced
by reducing its particle size, i.e., micronization. It is reported that the bioavailability (RBV)
of micronized ferric pyrophosphate (FePP) increased from 50% to 95% when the average
particle size was reduced from 21 µm to 0.5 µm (Wegmüller et al., 2004). Several studies
have been conducted using micronized FePP for salt dual fortification, and improved iron
status was achieved in African children (Zimmermann et al. 2004; Wegmüller et al. 2006).
However, micronization dramatically increases the surface area available for reaction, and
thus the increased reactivity of micronized FePP with iodine causes substantial iodine loss
when added into iodized salt (Andersson et al. 2008).

75
On the other hand, encapsulation of reactive iron compounds in an inert but digestible
coating material results in effectively fortified foods with high iron bioavailability, while
reducing chemical interactions with other micronutrients and minimizing sensory changes
(Hurrell, 2002; Zimmermann et al., 2004; Andersson et al., 2008). With careful formulation
design, the encapsulated iron fortificants could achieve a good balance between reactivity
and functionality in fortified foods.
To compare the performance of micronization and microencapsulation, three sources of
ferric pyrophosphate (FePP) were also tested for the DFS stability when blended into the
iodized salt directly.
As shown in Figure 4.12, the sample containing FeFum powder retained only 46% of iodine
after 6 months, which was still better than any of the FePP containing samples. This was
somewhat surprising since FeFum was supposed to be more reactive than FePP.
Nevertheless, the micronized pyrophosphates (25, 2.5, and 0.5 µm in particle size for
Fortitech, Dr. Paul Lohmann, and SunActive, respectively) had larger surface area than
FeFum (50~100 µm), which resulted in increased interaction between iron and iodine, and
subsequently higher iodine losses.
Figure 4.12 Relative iodine retention in the DFS samples containing different sources of FePP during 6 months storage at 40oC and 60% RH (Note: the results are the mean values obtained from three or four replicates, and the error bars represent the standard deviations.)

76
In contrast, microencapsulation could effectively prevent loss of iodine. Specifically, >90%
of iodine was retained after 6 months and ~80% retained after 1 year in the samples
containing the microencapsulated FeFum premix made by extrusion and polymer coating
(Figure 4.11).
4.3.5.2 Ferrous iron stability
Ferrous fumarate was chosen as the iron source in DFS mainly due to its high bioavailability
and bland taste. The retention of its reduced form is the key to maintaining its high
bioavailability. Therefore, it is still a concern to retain as much ferrous iron as possible
during production of DFS. The conversion of ferrous to ferric iron is due to oxidation by
oxidants, such as potassium iodate and oxygen. Thus, the encapsulation process is also
needed for protecting the ferrous iron from oxidation as well as preventing iodine loss in
DFS.
As presented in Appendix 11.1.15, the extrusion, colour-masking, and polymer coatings, had
little impact on ferrous oxidation, with >90% of the iron retained in its ferrous form at the
beginning of the storage test. After 10 months storage at ambient conditions, little ferrous
loss occurred in the absence of iodine, with up to 5% of loss in extruded particles, 1-4% of
loss in colour-masked particles, and <2% of loss in most of the encapsulated samples.
However, when these iron particles were added into iodized salt and stored at higher T and
RH, the ferrous iron losses were more pronounced: up to ~6% in the encapsulated premixes,
~11% in the colour-masked particles, and 13% in the extruded particles. Again, it is clear
that each process step had cumulative effect in the protection of not only iodine, but also
ferrous iron. The results confirmed that interaction between iodine and ferrous iron occurred
in the DFS samples during storage, which will be discussed further in a later section.
To better understand the effects of the key parameters of the process, the data were grouped
by process stages – extruded, colour-masked, and encapsulated - and analyzed using
one-way ANOVA test, as shown in Figure 4.13. Not surprisingly, the two encapsulated forms,
newly lab-processed premixes coated with hydrophilic polymers and the Glatt premix made
by pilot scale fluidized bed agglomeration and soy stearine coating, had significantly higher
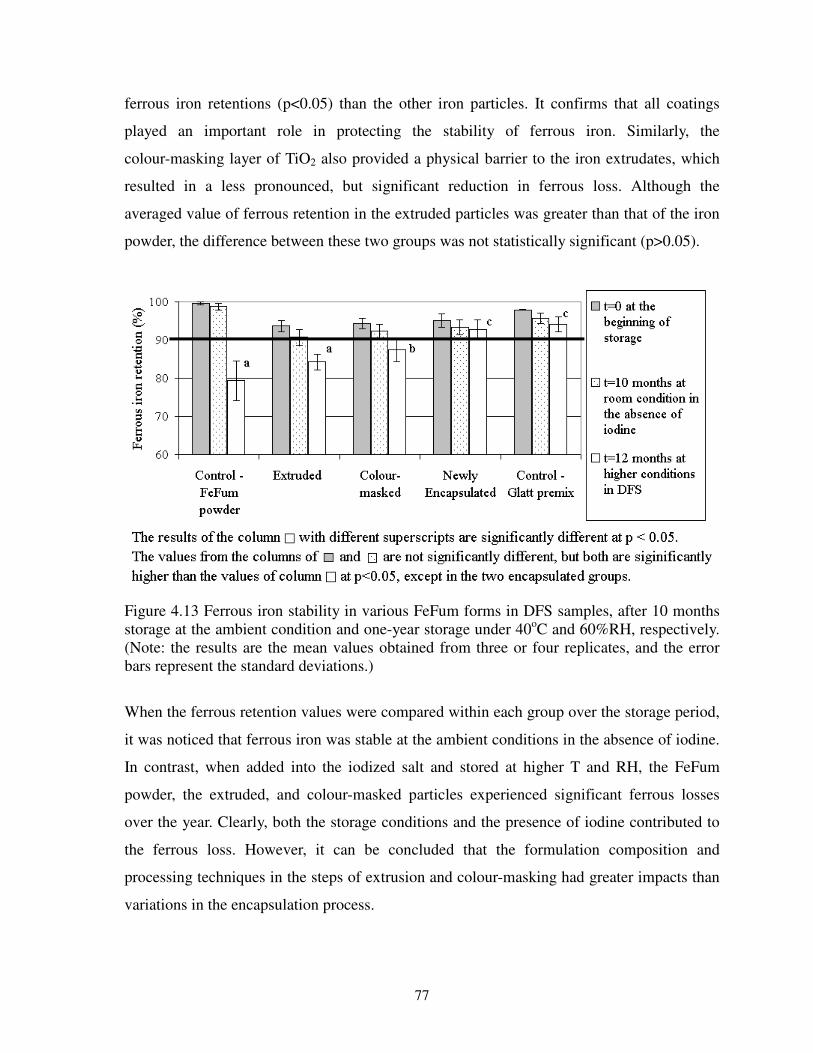
77
ferrous iron retentions (p<0.05) than the other iron particles. It confirms that all coatings
played an important role in protecting the stability of ferrous iron. Similarly, the
colour-masking layer of TiO2 also provided a physical barrier to the iron extrudates, which
resulted in a less pronounced, but significant reduction in ferrous loss. Although the
averaged value of ferrous retention in the extruded particles was greater than that of the iron
powder, the difference between these two groups was not statistically significant (p>0.05).
Figure 4.13 Ferrous iron stability in various FeFum forms in DFS samples, after 10 months storage at the ambient condition and one-year storage under 40oC and 60%RH, respectively. (Note: the results are the mean values obtained from three or four replicates, and the error bars represent the standard deviations.)
When the ferrous retention values were compared within each group over the storage period,
it was noticed that ferrous iron was stable at the ambient conditions in the absence of iodine.
In contrast, when added into the iodized salt and stored at higher T and RH, the FeFum
powder, the extruded, and colour-masked particles experienced significant ferrous losses
over the year. Clearly, both the storage conditions and the presence of iodine contributed to
the ferrous loss. However, it can be concluded that the formulation composition and
processing techniques in the steps of extrusion and colour-masking had greater impacts than
variations in the encapsulation process.
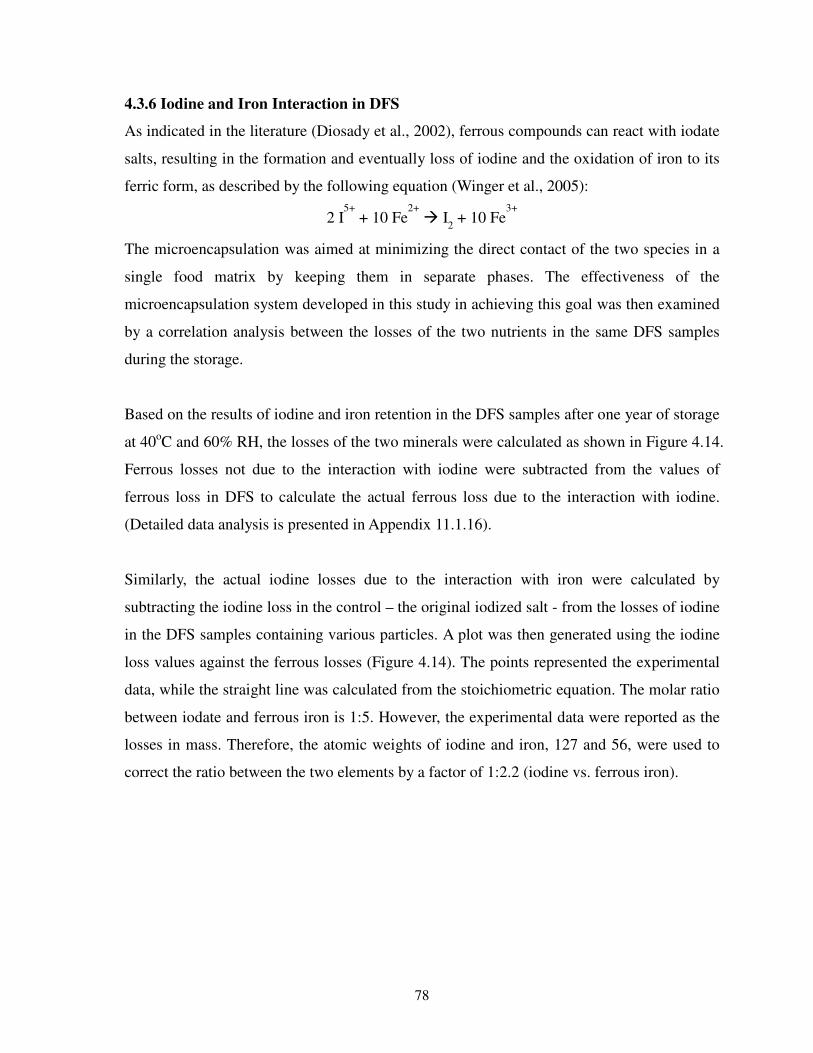
78
4.3.6 Iodine and Iron Interaction in DFS
As indicated in the literature (Diosady et al., 2002), ferrous compounds can react with iodate
salts, resulting in the formation and eventually loss of iodine and the oxidation of iron to its
ferric form, as described by the following equation (Winger et al., 2005):
2 I5+
+ 10 Fe2+
� I2 + 10 Fe
3+
The microencapsulation was aimed at minimizing the direct contact of the two species in a
single food matrix by keeping them in separate phases. The effectiveness of the
microencapsulation system developed in this study in achieving this goal was then examined
by a correlation analysis between the losses of the two nutrients in the same DFS samples
during the storage.
Based on the results of iodine and iron retention in the DFS samples after one year of storage
at 40oC and 60% RH, the losses of the two minerals were calculated as shown in Figure 4.14.
Ferrous losses not due to the interaction with iodine were subtracted from the values of
ferrous loss in DFS to calculate the actual ferrous loss due to the interaction with iodine.
(Detailed data analysis is presented in Appendix 11.1.16).
Similarly, the actual iodine losses due to the interaction with iron were calculated by
subtracting the iodine loss in the control – the original iodized salt - from the losses of iodine
in the DFS samples containing various particles. A plot was then generated using the iodine
loss values against the ferrous losses (Figure 4.14). The points represented the experimental
data, while the straight line was calculated from the stoichiometric equation. The molar ratio
between iodate and ferrous iron is 1:5. However, the experimental data were reported as the
losses in mass. Therefore, the atomic weights of iodine and iron, 127 and 56, were used to
correct the ratio between the two elements by a factor of 1:2.2 (iodine vs. ferrous iron).
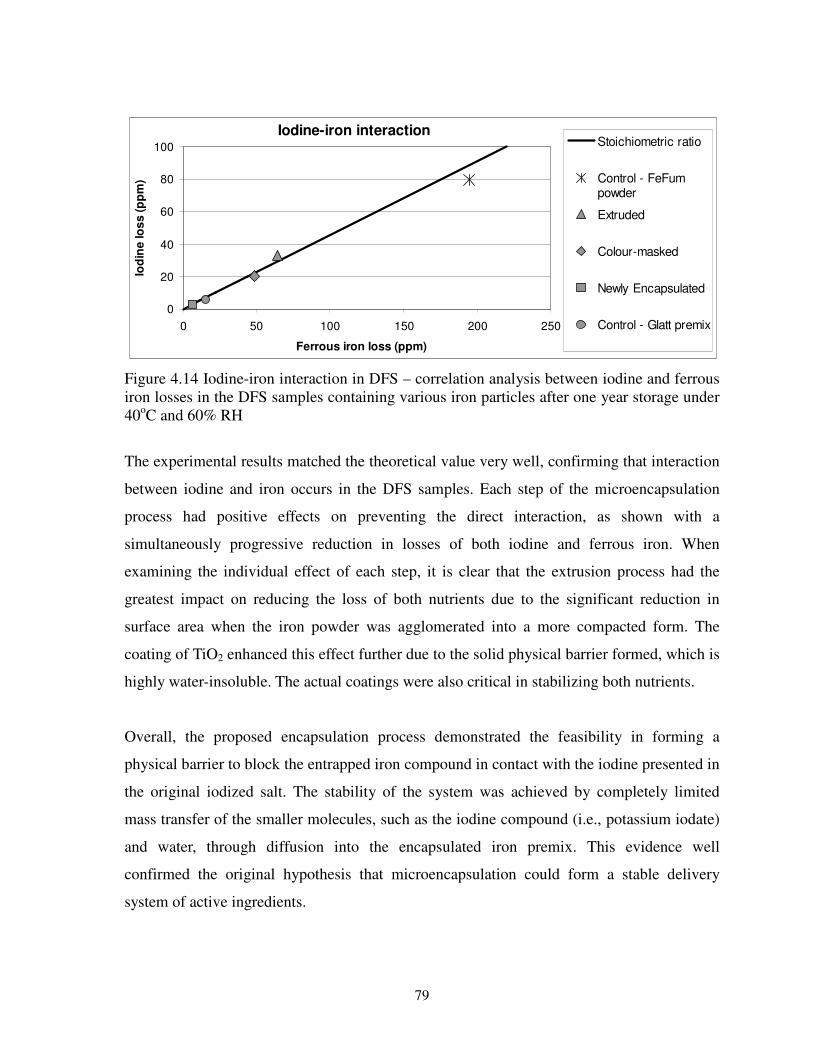
79
Figure 4.14 Iodine-iron interaction in DFS – correlation analysis between iodine and ferrous iron losses in the DFS samples containing various iron particles after one year storage under 40oC and 60% RH
The experimental results matched the theoretical value very well, confirming that interaction
between iodine and iron occurs in the DFS samples. Each step of the microencapsulation
process had positive effects on preventing the direct interaction, as shown with a
simultaneously progressive reduction in losses of both iodine and ferrous iron. When
examining the individual effect of each step, it is clear that the extrusion process had the
greatest impact on reducing the loss of both nutrients due to the significant reduction in
surface area when the iron powder was agglomerated into a more compacted form. The
coating of TiO2 enhanced this effect further due to the solid physical barrier formed, which is
highly water-insoluble. The actual coatings were also critical in stabilizing both nutrients.
Overall, the proposed encapsulation process demonstrated the feasibility in forming a
physical barrier to block the entrapped iron compound in contact with the iodine presented in
the original iodized salt. The stability of the system was achieved by completely limited
mass transfer of the smaller molecules, such as the iodine compound (i.e., potassium iodate)
and water, through diffusion into the encapsulated iron premix. This evidence well
confirmed the original hypothesis that microencapsulation could form a stable delivery
system of active ingredients.
Iodine-iron interaction
0
20
40
60
80
100
0 50 100 150 200 250
Ferrous iron loss (ppm)
Iod
ine
lo
ss
(p
pm
)Stoichiometric ratio
Control - FeFumpowder
Extruded
Colour-masked
Newly Encapsulated
Control - Glatt premix

80
4.3.7 Iodine Degradation Kinetics in DFS
The iodine retention in the DFS was plotted over the one-year storage period, as shown in
Figure 4.15. Regression analysis using Origin Pro 7.5 showed that the experimental data
were consistent with both first-order and second-order degradation kinetics, but the first
order had a higher correlation coefficient.
The experimental data were then plotted as ln (% iodine retention) vs. the storage time, as
shown in Figure 4.16. A generally good correlation between the data and the linear
regression lines (with the correlation coefficients >0.9 for all sample groups) confirmed that
the iodine degradation in DFS followed apparent first-order kinetics.
0 3 6 9 12 15
0
20
40
60
80
100 Corr. Coef.
Control - blank iodized salt 0.9974
Newly encapsulated 0.9871
Control - Glatt premix 0.9996
Colour-masked 0.9720
Extruded 0.9951
Control - FeFum powder 0.9930d
b
c
aa
Rela
tive i
od
ine
rete
nti
on
(%
)
Storage period (months)
a
Figure 4.15 Correlation of iodine degradation in the DFS samples with a first-order degradation pattern. (Note 1: the values of the regression lines with different superscripts are statistically significant at p<0.05). (Note 2: the results are the mean values obtained from three or four replicates, and the error bars represent the standard deviations.)
The statistical analysis on the degradation trend lines suggested there was no significant
difference (p>0.05) between the two encapsulated groups and the control – the original
iodized salt. It indicated the incorporation of well-coated iron premixes in the iodized salt
did not cause changes to iodine degradation kinetics. However, the incorporation of uncoated
and partially processed FeFum had significant impacts on iodine degradation parameters,
with progressively increased first order rates and decreased half-lives, as shown in Table
4.12.

81
Figure 4.16 Apparent first order degradation kinetics of iodine in the DFS samples made with various iron particles during one-year storage under 40oC and 60% RH
Table 4.12 Iodine first order degradation rate constant (k) and the storage half-life estimated for the DFS samples containing various FeFum particles when stored at 40oC and 60% RH
DFS samples Iodine degradation rate constant (k) (month-1)
Half-life (months)
Blank iodized salt 0.0185 38
Encapsulated FeFum premixes 0.0202 35
Glatt premix made by previous technique 0.0228 31
Colour-masked with TiO2 0.0376 19
Extruded FeFum agglomerates 0.0567 12
FeFum powder 0.1202 6

82
4.4 Summary of Research Approach 1
1. The microencapsulated FeFum premix produced by extrusion followed by polymer
coating resulted in much improved physical characteristics in terms of shape, size, colour,
texture, and density compared to FeFum premix produced by fluidized bed
agglomeration and lipid coating.
2. The extruded premix had excellent bioavailability in the simulated digestibility test and
good particle integrity in the weak acidic solution, as well as excellent stability of ferrous
iron and iodine when blended into iodized salt to form double fortified salt (DFS),
specifically with >85% of iodine and >90% of ferrous iron retained, respectively, in the
DFS samples made with the best iron premix formulations (P-1, P-2, P-11, and P-12)
after one year storage at 40oC and 60% RH.
3. Direct interaction between ferrous iron and iodine was demonstrated in the DFS samples;
however, the encapsulation process could effectively prevent this (section 4.3.6). Each
step of the premix forming process had significant impact on stabilizing the system
through reduction of exposed FeFum surface area by extrusion and TiO2 coating, and
reduced mobility of smaller molecules (such as water) by the polymer coating, which
collectively resulted in significantly reduced losses of both iodine and ferrous iron in the
DFS. The evidence well affirmed the original hypothesis.
4. The iodine loss in the salt samples followed apparent first-order kinetics, irrespective of
the presence of iron. The presence of iron without sufficient coatings accelerated the
iodine loss, as expected. However, the DFS made with well encapsulated FeFum premix
was estimated to have similar shelf-life to the iodized salt, which means a stable salt
product double fortified with iodine and iron could be prepared using this approach.
Recommended future work:
1. The optimized formulation and process generated from this study should be scaled up
and field tested.
2. Economic analysis should be carried out after pilot scale tests to evaluate the cost
advantages of the proposed process compared to the previous technology.
3. The process should be investigated for multiple micronutrient and nutraceutical delivery
in food fortification, drug delivery, and in protection and delivery of other active
ingredients in agro-chemicals.

83
5 RESEARCH APPROACH 2 - ULTRA RICE® AS MICRONUTRIENT
DELIVERY VEHICLE USING LARGE PARTICLES
5.1 Project Background & Research Incentive
The Ultra Rice® technology (Figure 5.1) was initially designed by Bon Dente International,
Inc. (US Patent 5609896), to address vitamin A deficiency in rice-consuming populations.
The idea was extended later to deliver multiple micronutrients including iron. Commercial
development of the process is pursued by PATH (Program for Appropriate Technology in
Health) through royalty-free licensing agreements with commercial partners in Colombia,
Brazil, India, and China.
Figure 5.1 Schematic process flow of Ultra Rice®
The process starts with blending the selected micronutrients into rice flour and other
components, including alginate, shortening, and antioxidants. The homogeneous wet mixture
is formed into a dough mass, which is then extruded to produce rice-shaped kernels. After
extrusion, calcium chloride solution is sprayed on the extruded rice grains so that a
Dough formation
Mixing rice flour with a binding matrix including micronutrients, antioxidants,
moisture barrier agents, binding agents, cross-linking agents
Extrusion to form rice-shaped grains
Coating / hardening and drying
Sizing and packaging
At this point the Ultra Rice® premix is successfully made
Blending with normal local rice
At a specific ratio between 1:100 and 1:200 for commercial use

84
crosslinking reaction between calcium and alginate would occur to harden the surface of the
simulated rice grains. This crosslinking/hardening process is the core of the Ultra Rice®
technology.
Ultra Rice® grains consist of highly fortified, reconstituted rice grains manufactured by
extrusion, which are then blended into market rice. It is a promising novel technology for
rice fortification, which has the unique advantage of protecting the added micronutrients
within the manufactured grains (PATH, 2007). Previously, two stable formulations
containing selected micronutrients have been developed within our research group under the
sponsorship of PATH. These formulations have been field-tested and achieved acceptable
results in terms of production feasibility and product stability.
However, the process created some problems: although the reconstituted grains have the
shape and size of actual rice, they can crack and disintegrate during washing, soaking, and
cooking. This may be caused by the failure of the rigid surface structure, which is too weak
or too rigid to resist or stretch with the rice flour core when the starch absorbs water and
gelatinizes under high temperature and pressure. The formation of the thin Ca-alginate
surface network is highly dependent on the sufficient, uniform covering of the surface with
calcium chloride spray. This coating process is hard to control and rather unreliable, as
demonstrated in recent large-scale field tests in Brazil (PATH report, 2008). These
constraints have greatly hindered the commercialization of the technology. Therefore, it is
necessary to explore other techniques for making the reformed rice grains with improved
structural strength.
Converting all of the Na alginate to the cross-linked Ca alginate would provide a complete
three-dimensional cage structure that would enclose and protect the flour and the added
micronutrients. To achieve this, the Ca alginate structure must be developed throughout the
grain after extrusion forming. The objective of this phase of the program was to investigate
techniques for forming the cross-linked alginate structure in-situ after extrusion, and to
develop viable commercial technology for the production of Ultra Rice® based on internal
gelation. This approach required that both the alginate (as Na salt) and Ca be present in the

85
dough in an inactive form, which would be released to allow the reaction to proceed under
controlled conditions – preferably right after the extrusion step. I proposed to incorporate
calcium in the form of a salt into the dough mixture before extrusion, which could be
released by either heat or by a chemical reaction. However, it was anticipated that premature
internal gelation would make extrusion difficult due to the high viscosity of the system, or
would result in the destruction of the newly formed cross-linked structure by shear in the
extruder. Thus, the initial objective of the work was to find techniques for the slow,
controlled release of calcium and completion of the crosslinking reaction.
A literature survey was useful in designing experimental approaches.
5.2 Literature Review on Alginate Chemistry & Internal Gelation
Alginate or algin is a natural biopolymer derived from brown seaweeds. Its monovalent salts,
e.g., sodium and potassium alginates, are hydrophilic colloids, which are soluble in water.
On the other hand, some of its divalent salts are water insoluble, especially calcium alginate.
Many applications of alginates are based on this property. Alginates have been widely used
in foods, drug delivery systems, and biotechnological applications such as cell and enzyme
immobilization. In the food applications, alginate has been used as thickener, stabilizer, and
gelling agent. The well-known alginate-Ca interaction forms the strong technical base for
developing products, such as re-structured fruits/vegetables, meat/fish, potato products, and
dessert gels (FMC Technical Brochure).
Alginate is a linear co-polymer composed of two monomeric units, D-mannuronic acid and
L-guluronic acid. The D-mannuronic acid in the polymer is connected in the β-configuration
through 1,4 linkages, while the L-guluronic acid is α-1,4- linked (Draget et al., 2005). The
monomers form different regions, which are made up exclusively of one unit or the other
(M-blocks or G-blocks), or regions with two monomers in an alternating sequence (Figure
5.2). Because of the particular shapes of the monomers and their modes of linkage in the
polymer, the geometries of the G-block, M-block, and alternating regions are substantially
different. Specifically, the G-blocks are buckled whereas the M-blocks have a ribbon shape.
When two G-blocks are aligned side by side, a diamond shaped hole will form, which has
86
dimensions ideal for the cooperative binding of calcium ions. As depicted in Figure 5.2,
when calcium ions are added into an alginate solution, a Ca-induced G-block alignment
occurs, and the calcium ions are bound between two polymer chains like eggs in an egg box,
resulting in a so-called egg-box structure (Draget et al., 2005).
Figure 5.2 Structural characteristics of alginate (on the left, adapted from ISP Product User Guide) and the egg-box structure formed by alginate-Ca gelation (on the right, adapted from FMC Technical Brochure)
The overall composition of M/G residues and their distribution patterns vary with seaweed
species. Together with the length of the blocks, these factors determine the physical and
chemical properties of the alginate molecules. Specifically, G-blocks provide gel-forming
capacity, while MM and MG provide flexibility to the uronic acid chains with flexibility
increasing in the order GG<MM<MG (FMC Technical Brochure). In terms of gel formation,
high G alginates (with an M/G ratio <1) provide strong, brittle gels that are heat stable, while
high M alginates (M/G ratio >1) form weaker, more elastic gels that have less heat stability
(ISP Product User Guide).
The Ca/G-block stoichiometric ratios for egg-box dimers and multimers are estimated as 1/4
and 1/2, respectively (Fang et al., 2007). The stoichiometry of the gelation process can be
expressed by the following ion exchange reaction (Khairou et al. 2002):
2(Na - Alg)n + Ca2+ = (Ca− Alg2)n + 2Na+
where Na-Alg denotes the sodium alginate (C5H7O4COONa), Ca-Alg2 is the Ca-alginate gel
complex. Based on the molecular weights of 216 g/mol and 110.98 g/mol for sodium
alginate and CaCl2, the amounts of CaCl2 and alginate used in the original formulation of
Alginate monomers Chain conformation Block distribution

87
Ultra Rice® (0.5 wt% and 1.5 wt%, respectively) provide a molecular ratio of 1/1.54, which
is sufficient for the complete conversion of Na-alginate in the system to its cross-linked Ca
form.
In practice, alginate-Ca gelation is obtained through two approaches: diffusion setting and
internal setting (Draget et al., 2005). The diffusion method is characterized by letting a
crosslinking ion (e.g. Ca2+) diffuse from an outer reservoir into an alginate solution. Internal
setting (sometimes also referred to as in situ gelation) differs from the former process, as the
Ca2+ ions are released in a controlled fashion from an inert calcium source within the
alginate solution. The rate of release is usually controlled by pH change and/or through the
limited solubility of the calcium salt source (Draget, 2000).
In the case of internal setting, Ca salts including the insoluble CaCO3 or the slightly soluble
CaSO4 may be used as a Ca2+ source. Alternately the Ca2+ ions may be complexed in a
chelating agent (EDTA, citrate, etc.). The activation of the crosslinking ions is usually linked
to a change in pH caused by the addition of organic acids or lactones (Poncelet, 2001).
Lowering of the pH readily releases Ca2+ from CaCO3 or other complexing compounds.
Generally, the rate at which the calcium is made available to the alginate molecules depends
primarily on pH in addition to the amount, particle size, and intrinsic solubility
characteristics of the calcium salt (Draget et al., 1991; ISP Product User Guide).
In most situations, the release of Ca during the ingredient mixing is so rapid that a
sequestrant is required to control the reaction by competing with the alginate for binding Ca
ions (Draget et al., 2005). Commonly used food-approved sequestrants include sodium
hexametaphosphate (SHMP), sodium tripolyphosphate (STPP), tetrasodium pyrophosphate
(TSPP), ethylenediaminetetraacetic acid (EDTA), and sodium citrate. Since the ultimate
distribution of the Ca ions between the alginate and the sequestrant favours the latter
progressively, an optimum level of sequestrant in the system needs to be carefully
investigated (McHugh, 1987).
As suggested by Figure 5.3, several factors play important roles in alginate-Ca gel formation
and its properties. Potential strategies for internal setting thus include using different Ca

88
sources with limited solubility; using appropriate sequestrants to compete with alginate for
binding Ca ions; changing some environmental factors such as pH and temperature to alter
the solubility of selected Ca sources and/or the activity of the sequestrants.
Figure 5.3 Factors affecting alginate-Ca reaction (adapted from ISP Product User Guide)
5.3 Experimental Strategy Towards Formulation Design
Based on the literature review, three mechanisms of controlled or delayed gelation of
alginate and calcium were proposed, including 1) the use of calcium salts with limited
solubility and appropriate sequestrants at a desired ratio, 2) changing the pH of the system to
trigger slowed release of calcium from an insoluble salt, and 3) changing the temperature to
alter the activity of added sequestrants in the system so as to free some bound calcium ions
slowly.
A preliminary investigation was then performed to examine the three mechanisms in a
simple rice flour system, which contained only basic structural components, i.e., rice flour,
water, shortening, and alginate-calcium gelling system. The antioxidants and certain
micronutrients present in the previously developed, stable Ultra Rice® formulations were not
included at this point, since a simplified system would be more helpful in understanding the
gelation mechanisms. A working strategy was then selected for more detailed study. The best
formulations for effective internal gelation systems were investigated for incorporation of
micronutrients leading to commercially viable formulations.

89
5.4 Experimental Materials & Methods
5.4.1 Materials
Table 5.1 List of materials used in the formulations of Ultra Rice®
Material / Chemical Name Supplier Description
Alginate sources
Danisco FD170 Food grade
Danisco FD175 Food grade
Danisco FD120 Food grade
Danisco FD155
Danisco, Denmark
Food grade
FMC RF6650 Food grade
FMC LF20/40 FMC Biopolymers, USA
Food grade
TIC HG600F Food grade
TIC 900 TIC Gums, USA
Food grade
ISP DMF Food grade
ISP GMB ISP Co., USA
Food grade
Calcium sources
Calcium chloride Sigma-Aldrich Chemicals R&D use
Calcium sulphate dihydrate (gypsum) Dr. Paul Lohmann, Germany Food grade
Calcium carbonate Dr. Paul Lohmann, Germany Food grade
Calcium iodate Sigma-Aldrich Chemicals R&D use
Calcium lactate Dr. Paul Lohmann, Germany Food grade
Sequestrant sources
Sodium tripolyphosphate (STPP) Sigma-Aldrich Chemicals R&D use
Sodium hexametaphosphate (SHMP) Sigma-Aldrich Chemicals R&D use
Sodium citrate Sigma-Aldrich Chemicals R&D use
Sodium EDTA Sigma-Aldrich Chemicals R&D use
Tetra sodium pyrophosphate (TSPP) Sigma-Aldrich Chemicals R&D use
Other additives for making Ultra Rice®
Rice flour Local supermarket
Glutinous rice flour Local supermarket
Shortening Crisco
TM (Procter & Gamble,
Canada)
Butylated hydroxyanisole (BHA) Sigma-Aldrich Chemicals R&D use
Butylated hydroxytoluene (BHT) Sigma-Aldrich Chemicals R&D use
Citric acid Sigma-Aldrich Chemicals R&D use
Ascorbic acid BASF, Canada Pharmaceutical grade
Sodium ascorbate Sigma-Aldrich Chemicals R&D use
Erythorbic acid Sigma-Aldrich Chemicals R&D use

90
Sodium erythorbate Sigma-Aldrich Chemicals R&D use
Vitamin A palmitate (VAP 250,000 IU) BASF, Canada Pharmaceutical grade
Thiamin mononitrate BASF, Canada Pharmaceutical grade
Folic acid BASF, Canada Pharmaceutical grade
Ferric pyrophosphate (FePP) Dr. Paul Lohmann, Germany R&D use
Zinc oxide Dr. Paul Lohmann, Germany R&D use
MethocelTM
HPMC Dow Chemicals, USA Model E3, E6, K3
Rice flour and soybean shortening were procured from local markets. Sodium alginates were
obtained through PATH from 4 suppliers, Danisco, ISP, FMC Biopolymers, and TIC Gums.
They vary in particle size, viscosity, and M/G composition. Their detailed specifications are
discussed in the results section. Several calcium salts were obtained from Sigma-Aldrich and
Dr. Paul Lohmann as food-grade, including CaCl2, CaSO4 dihydrate, calcium lactate, CaCO3,
and Ca(IO3)2. Metal chelating agents including TSPP, STPP, SHMP, EDTA, and sodium
citrate were obtained from Sigma-Aldrich.
5.4.2 Experimental Methods
Reconstituted rice grain production through extrusion
Rice flour was blended with the selected amounts of sodium alginate (most formulations
used 1.5%wt) and the selected calcium source and a sequestrant. To the dry mixture, water
and melted shortening were added and mixed to form an extrudable dough. For some trials,
either sodium alginate or the combination of Ca source and sequestrant were brought into the
dough mixture through dispersion in the melted shortening. The rice dough was then
kneaded and extruded to form rice-shaped kernels, which were then dried at 40-45oC using a
forced-air oven.
Extrusion rate measurement
At the beginning of each extrusion run, recycling of the extruded filaments were necessary to
reach steady state. Once a steady extrusion rate was reached with the desired consistency of
extruded filament and surface appearance, the face cutter was attached and rice grains were
collected. The time required to complete the extrusion run was recorded and the extrusion
rate was then calculated as:
Extrusion rate (g/min) = weight of the collected rice grains (g) / the time required (min)
91
Grain size distribution and yield
After drying, the extruded rice grains were screened through a series of Tyler Standard
Sieves with the sieve size of 3.35 mm and 2 mm respectively. The weight of each size
fraction was measured and calculated as the percentage of the overall sample weight. Grains
within 2-3.35 mm size range (Tyler mesh 6 and 9, respectively) were desired.
Moisture content
Residual moisture content in the finished grains was determined gravimetrically after drying
at 105oC to constant weight.
Grain integrity during soaking and cooking
The grain soaking test was adapted from the measurement of alkaline spreading index (Little
et al., 1958), which is a standard analysis for starchy cereal integrity. ~5 g of the Ultra Rice®
grains were placed in a beaker with plenty of water. The grain integrity was observed in 5
minute intervals for up to 30 minutes, and ranked using a 0-5 scale, in which 0 represents
complete disintegration of the grains and 5 means individual grain intactness was obtained
without obvious grain cracking or clumping (grains sticking together).
The determination of grain cooking integrity was done by a similar measurement. ~5 g of the
grain sample was placed in a small aluminum bakery dish with 10 mL of water added,
resulting in a rice/water ratio of 1:2. The container was then placed in the steaming basket on
a rice cooker and steamed for 10 min after boiling. With 10 min cooling, the cooked rice was
observed and ranked on the scale described above. The microscope pictures of all
formulations were also taken to permit unbiased comparisons between different formulations
later.
The detailed ranking scheme is presented in Appendix 11.2.1, with relevant microscopic
pictures as references.
Grain appearance and colour measurements
Ultra Rice® grain appearance was determined visually using an Intel® PlayTM QX3

92
Computer Microscope, and the colour was measured using the Hunter L*a*b*
spectrophotometric system. In the system, L* stands for the lightness (black=0, white=100),
a* stands for the gradation from red (+) to green (-), and b* stands for the gradation from
yellow (+) to blue (-). During the measurement, a beaker containing a sample of
approximately 100 g with a constant depth of 100 mm was placed under the light source of
the Hunter colorimeter, and the L*, a*, and b* values were measured. The integrated colour
difference (∆E*) was then calculated as the sum of the differences of the L*, a* and b*
values of the sample from those of the reference, e.g., the native rice, based on the following
equation:
222 **** baLE ∆+∆+∆=∆
Texture measurement on cooked rice grains
A single compression test was used to measure the texture of cooked rice grains (Sesmat &
Meullenet, 2001). This instrumental measurement was used to complement visual
observations of grain integrity. Specifically, a Texture Analyzer (model TA-XT2i, Texture
Technologies Corp., Scarsdale, N.Y., U.S.A.) was used to perform compression tests,
courtesy of Professor Dérick Rousseau’s Food Research Group at Ryerson University,
Toronto, Canada. The detailed procedure is presented in Appendix 11.2.2

93
5.5 Results & Discussion
Ultra Rice® research was carried out in two phases. The first phase consisted of the
preliminary screening of internal gelation strategies. Phase two was aimed at developing an
effective gelation system within the simple rice flour formulation and testing it in complete
formulations containing antioxidants and selected micronutrients with the ultimate goal of
developing one or more commercially viable formulations.
5.5.1 Preliminary Investigations
Based on the proposed three mechanisms for internal gelation, a preliminary screening test
was performed first to select the working strategy. Specifically, D-glucono-alpha-lactone
(GDL) was used in combination with an inactivated calcium compound, CaCO3. It was
expected that slow hydrolysis of GDL would result in a progressive reduction in pH (Draget
et al., 2005), thus liberating calcium ions, which in turn would induce slow alginate gelation.
The second approach was based on changing the temperature of the extruded,
sequestrant-containing rice grains and hoping that some calcium ions bound with the
sequestrant would be freed slowly (ISP Product User Guide), resulting in slow completion of
alginate gelation. Unfortunately, both of these two approaches were unsuccessful.
Release of Ca by changing either pH or temperature is used more commonly in simple
aqueous systems, as reported in many publications (Fang et al., 2007; Liu et al., 2002;
Poncelet, 2001). Diffusional mobility of the calcium ions within the system is required to
induce the slow internal gelation, which requires the presence of water. However, our system
is rather complex with many ingredients and in a relatively dry matrix. The system
undergoes complex reactions during extrusion due to changes in temperature, pressure and
shear stress. Despite the initial addition of 32% (w/w) water, the extruded rice grains had a
relatively dry, rigid structure, which greatly limited the mass transfer within the system and
prevented the precise control of pH or temperature.
The use of sparingly soluble calcium salts, such as CaSO4, and appropriate sequestrants
seemed more promising for our purpose. This strategy was investigated with respect to the
effects of individual components on the internal gelation process.

94
5.5.1.1 Effect of different alginate sources on the internal gelation
Ten sources of sodium alginate obtained from 4 suppliers were first tested using the original
procedure with calcium solution over-spray on the extruded grains. This was to find better
sources with desired gelling properties for the crosslinking reaction. As shown in Tables 5.2
and 5.3, similar results were obtained in terms of extruder operability and grain integrity
after cooking. Particle size of the added alginate (varying from 100 µm to 620 µm) had no
apparent effect on these parameters, whereas the viscosity of the studied alginates (varying
from 20 to 600 mPa.s) had an impact on extrusion and also played an important role in the
hardness/stickiness of the cooked grains. Specifically, the alginate sources with medium to
high viscosity (~350 mPa.s) produced cooked grains with hardness, stickiness, and
cohesiveness similar to actual rice.
Based on these observations, the best choices of alginates were Danisco FD 175 and ISP
DMF, which were used for further tests on internal gelation.
Table 5.2 Effects of different alginate sources on extrusion operability
Alginate Properties Extrusion performance
Alginate Viscosity (mPa.s)
Particle size (µm)
Extrusion rate (g/min)
Yield of grains with desired size
(%)
Residual moisture after
drying (%)
1 Danisco FD170 20-50 100 ~200 87 9.3
2 Danisco FD120 20-50 620 ~230 87 11.9
3 Danisco FD175 350-550 100 ~235 89 7.7
4 Danisco FD155 350-550 200 ~265 87 10.1
5 FMC RF6650 400-600 100 ~206 88 10.1
6 FMC LF20/40 100-200 400 ~240 88 9.7
7 TIC HG600F Medium 200 ~200 85 11.3
8 TIC 900 High 100 ~240 86 12.9
9 ISP DMF (high M) 200-350 100-150 ~307 80 7.7
10 ISP GMB (High G) 110-270 200-355 ~278 85 7.5
No alginate - - ~210 92 13

95
Table 5.3 Grain integrity and sensory properties of the reconstituted rice made with different alginate sources
Alginate
Rinsing/Cooking integrity (ranking
with 0-5 scale) Sensory test on cooked grains
1 Danisco FD170 5 Soft, brittle
2 Danisco FD120 5 Soft, chewy
3 Danisco FD175 5 Desired hardness and stickiness
4 Danisco FD155 5 Slightly stickier than 3
5 FMC RF6650 5 Chewy, less cohesive
6 FMC LF20/40 5 Desired hardness, less cohesive
7 TIC HG600F 5 Slightly harder, loose texture
8 TIC 900 5 Similar to 7, better cohesion
9 ISP DMF (high M) 5 Desired hardness, cohesion, stickiness
10 ISP GMB (High G) 5 Harder core
Control No alginate 0 Totally disintegrated
5.5.1.2 Effect of different calcium salts on the internal gelation
Incorporating both alginate and one of the selected calcium salts into the wet dough before
extrusion did not cause obvious difficulty in extrusion. As shown in Table 5.4, all extrusion
trials were completed without too much difficulty. However, the grain integrity during
soaking/cooking was greatly dependent on the Ca source used. Specifically, CaCl2, the
compound with the highest solubility, lead to a spontaneous gelation, and the resulting
crosslinkage seemed to be completely destroyed during extrusion, subsequently resulting in
slightly benefited extrusion operation with faster flow rates and better filament consistency.
Citric acid was added at the level of 0.5% (w/w) in the trial of CaCO3, since it was originally
used in stable Ultra Rice® formulations as an antioxidant. In this case, it was expected to
alter the pH of the wet mixture, which in turn should result in an increased release of the free
calcium ions from the insoluble salt. The idea of using calcium iodate was based on a unique
property of this salt: it has an increased solubility at increased temperature, i.e., 0.17 wt% at
room temperature and 1.38 wt% at 60oC. It was expected the salt would release more free Ca
ions during the extrusion as the temperature of the operation varied from ~35oC at the
beginning of mixing to ~55oC at the exit of the die.

96
Unfortunately, none of the trials could produce the desired grain integrity, although the
results were slightly better in trials using CaSO4. An attempt to incorporate some
sequestrants in the internal gelation system was then made.
Table 5.4 Effects of different Ca sources on extrusion operability and grain integrity using the internal gelation process in the absence of sequestrants
Solubility at 25oC
Ca/Alginate ratio
Extrusion rate
(g/min)
Yield of grains with desired size
(%)
Residual moisture after
drying (%)
Grain integrity
(ranking with 0-5 scale)
CaCl2 74.5 g/100 mL 1:3 ~240 87 7.1 0
1:3 ~200 85 7.8 2 CaSO4 0.24 g/100 mL
1:1 ~325 72 6.3 2
CaCO3 (+ citric acid)
Insoluble 1:3 ~288 81 7.4 1
Ca(IO3)2 0.17 g/100 mL 1:1 ~244 71 5.2 1
As shown in Table 5.5, the use of STPP resulted in improved grain integrity, probably due to
the potentially delayed alginate-Ca gelation in the system. Specifically, the combination of
CaSO4 with appropriate amounts of sequestrants resulted in much better grain integrity
during soaking/cooking.
The chosen ratio between of the three components for the internal gelation was based on the
composition of the current Ultra Rice® formulations, in which alginate was added at 1.5%
(w/w), calcium chloride was sprayed at 0.5% (w/w) on the surface of the extruded grains,
and STPP was used in a combined antioxidant system at the level of 0.3% (w/w).
Among the selected Ca sources, CaSO4 dihydrate (gypsum) was the best in terms of
providing delayed gelation and subsequently resulting in better grain integrity. Clearly, this
is due to its limited solubility (0.24g/100 mL), whereas CaCO3 is water insoluble and CaCl2
has a high solubility (74.5 g/100 mL). Ca lactate also has moderate solubility (3.9~6.4 wt%
at 25oC) and gave acceptable results, which were worth further investigation.

97
Table 5.5 Comparison of different Ca sources using the internal setting process in the presence of STPP as a sequestrant
Alginate/Ca/STPP ratio
Extrusion rate (g/min)
Yield of grains with desired size
(%)
Residual moisture
after drying (%)
Grain integrity (ranking with
0-5 scale)
CaCl2 3:1:0.6 ~227 88 10 1
3:1:0.6 ~305 80 6.2 3 CaSO4
3:1:0.6 ~335 81 6.3 3
CaCO3 (+ citric acid) 3:1:0.6 ~225 83 8.9 1
3:1:0.6 ~318 78 4.4 3 Ca lactate
3:1:0.6 ~300 81 6.5 3
5.5.1.3 Effect of different sequestrants on the internal gelation
Four sequestrant compounds, STPP, SHMP, EDTA, and sodium citrate, were compared in
internal setting tests using the alginate (ISP DMF) and CaSO4 in different ratios. As shown
in Table 5.6, STPP and EDTA seemed to be the best choices of sequestrants with better grain
integrity potentially due to delayed alginate/Ca gelation.
Table 5.6 Comparison of different sequestrants in the internal setting process using same alginate and Ca sources (i.e., ISP DMF alginate and CaSO4)
Alginate/CaSO4
/sequestrant ratio
Extrusion rate (g/min)
Yield of grains with desired
size (%)
Residual moisture after
drying (%)
Grain integrity (ranking with
0-5 scale)
3:1:0.4 ~305 82 8.3 4
3:1:0.6 ~335 75 6.4 3 STPP
3:1:0.8 ~302 85 7.1 3
SHMP 3:1:0.8 ~271 82 6.4 2
Na citrate 3:1:0.8 ~291 86 4.1 2
EDTA 3:1:0.4 ~312 77 9.5 4

98
5.5.1.4 Effect of different calcium-sequestrant ratios on the internal gelation
Also shown in Table 5.6, not only the type of sequestrants used but also the ratio of
sequestrant to CaSO4 seemed to be a critical factor affecting the extrusion process and grain
integrity. A test was carried out with ratios of CaSO4 to STPP varying at 1:0, 1:0.2, 1:0.4,
1:0.6, 1:0.8, and 1:1.
As shown in Table 5.7, no STPP or too much of the sequestrant had negative impacts on the
grain integrity. The best results were obtained with the ratios of 1:0.2 and 1:0.4. This result
was confirmed by repeated trials using EDTA.
Table 5.7 Effect of different CaSO4 to sequestrant ratios on grain integrity
CaSO4/STPP ratio Extrusion rate
(g/min)
Yield of grains with desired size
(%)
Residual moisture after
drying (%)
Grain integrity (ranking with
0-5 scale)
1:0 ~200 85 7.8 2
1:0.2 ~338 76 5.5 4-5
1:0.4 ~305 82 8.3 4
1:0.6 ~335 75 6.4 3
1:0.8 ~302 85 7.1 2
1:1 ~287 79 8.1 1
CaSO4/EDTA ratio
1:0.2 ~290 77 4.3 4-5
1:0.4 ~311 77 9.5 4
5.5.1.5 Investigation of other ingredients and procedures for dough mixing
Alternative ingredient mixing procedures
Several dough-mixing procedures were investigated. Originally, all dry ingredients were
blended together before shortening and water were added to form the wet dough for
extrusion. Attempts to disperse either alginate or the CaSO4/STPP combination into the
melted shortening and adding them into the wet mixture resulted in better grain integrity.
99
This might be because that alginate dispersion in the melted shortening could slow down its
hydration, while the dispersion of CaSO4/STPP in the oil could result in fewer free Ca ions
available for interaction at the beginning of extrusion. Thus, the separate addition of these
ingredients would be effective in delaying the spontaneous interaction between alginate and
free Ca ions in the system.
Pregelatinization of rice starch
Attempts were made to partially gelatinize the rice flour before extrusion. Half of the rice
flour for one batch of extrusion formulation was steamed on the top of a rice cooker for over
30 min and then blended into the rest of the ingredients. Alternatively, boiled water was used
to make wet dough. These thermal treatments to rice starch resulted in puffed rice grains
after extrusion with relatively bigger grain size, lighter density, and porous texture. Although
the cooking integrity of the grains made by this approach was improved with less cracking
and sticking problems, the overall appearance of the grains was obviously different from the
native rice, which was not acceptable when blended into the actual rice.
Incorporation of gluten and other dough modifiers
Pure vital gluten and Indian noodle stabilizers were used to alter the properties of the dough
for better extrusion operability and grain integrity. The Indian noodle stabilizers consist of
xanthan and guar gum. The presence of gluten and/or other hydrocolloids enhanced the
effect of alginate to some extent. However, other raw materials, such as hard wheat flour and
durum flour, could not replace the function of rice flour.
Other metal ions – iron and zinc
Based on literature indications (Draget et al., 2005), many divalent metal ions can crosslink
with alginate, while calcium gives the fastest gelation rate and the best gel properties.
However, other metal ions, such as ferrous, ferric, zinc, and copper, can also react with
alginate to form soft gels at a relatively slow rate (Berner & Hood, 1983). This was
confirmed by a preliminary test using ferrous fumarate in an aqueous system. When 5% (w/v)
of ferrous fumarate was added into 1% (w/v) alginate solution, a soft gel was formed after
20-30 min setting. Attempts were then made to incorporate ferrous fumarate and zinc oxide
100
together with alginate into the rice flour dough. The addition levels of these ingredients were
based on the stable formulation of the multiple-fortified Ultra Rice®. It was found that the
iron/zinc formulation produced acceptable core and surface integrity without further CaCl2
over spray after extrusion. This suggested that a soft gel might be slowly formed during
extrusion between ferrous/zinc ions and alginate. However, the incorporation of ferrous
fumarate powder resulted in an unacceptable dark brownish colour. This may restraint the
use of this approach.
Based on the preliminary investigation, it seemed feasible to incorporate both alginate and
calcium into rice flour mixtures in the presence of sequestrant prior to extrusion, wherein a
calcium salt with limited solubility, such as CaSO4, was used. The internal gelation actually
enhanced the extrusion operation to some extent with a faster flow rate. The newly prepared
grains also had a better core integrity as no grain cracking was observed during soaking and
cooking tests. However, these grains had not yet achieved the surface integrity of grains
made with the original diffusion setting method. During the soaking test the newly prepared
grains were likely to exude starch from the core into the water, resulting in a cloudy solution,
which subsequently caused the grains to stick together during cooking. Clearly, fine-tuning
of the system was required prior to generating useful formulations.
5.5.2 Formulation Optimization
5.5.2.1 Orthogonal experiment
Based on the results of the preliminary study, an orthogonal experimental design, also called
Taguchi method (Roy, 1990; Rao et al., 2008), was proposed to find the best formulation
ratios between alginate, Ca compound, and sequestrant. The best ratios obtained from this
experiment were further verified with more trials by altering formulation ingredients and
process variables. An alginate with relatively high viscosity - ISP DMF from ISP Co. - was
used with CaSO4 and STPP, according to the preliminary investigation.
The experimental design parameters are presented in Table 5.8. The three key ingredients,
alginate, CaSO4, and the sequestrant STPP, were treated as three factors. For each factor,
three concentration levels were tested based on the results of preliminary screening tests, in

101
which the ratio of CaSO4/STPP = 1%:0.2% gave the best grain integrity. The maximum
concentration of alginate tested previously was 3%, which did not adversely affect the
extrusion process. The objective of the design was to determine the ranking of the factors in
terms of their impact on extrusion and grain integrity, as well as to find the best
concentration level for each factor. The results could ultimately enable us to find the best
formulation using these ingredients.
Table 5.8 A 3x3 orthogonal design for formulation optimization
Factor
A B C Level
Alginate (ISP DMF) CaSO4 STPP
1 3.0% 3.0% 0.6%
2 1.5% 1.5% 0.3%
3 0.5% 0.5% 0.1%
Table 5.9 Detailed experimental trials for orthogonal study
Trial Formula Alginate ISP DMF
CaSO4 STPP
1 A1 B1 C1 3.0% 3.0% 0.6%
2 A1 B2 C2 3.0% 1.5% 0.3%
3 A1 B3 C3 3.0% 0.5% 0.1%
4 A2 B1 C2 1.5% 3.0% 0.3%
5 A2 B2 C3 1.5% 1.5% 0.1%
6 A2 B3 C1 1.5% 0.5% 0.6%
7 A3 B1 C3 0.5% 3.0% 0.1%
8 A3 B2 C1 0.5% 1.5% 0.6%
9 A3 B3 C2 0.5% 0.5% 0.3%
Nine batches (Table 5.9) of grains were produced by extrusion. In all cases, the same basic
formulation was used, including rice flour, shortening, and water at the same concentrations.
Other operating variables, such as the blending sequence and extrusion parameters, were
also kept the same. The samples produced were tested for grain integrity during soaking and
cooking.

102
The results (Table 5.10) from the integrity tests were analysed based on the statistical
concept of orthogonal experiment, as shown in Table 5.11. The analysis indicated that the
calcium compound was the most important factor among the three ingredients, while the
sequestrant had the least impact on grain integrity. Further analyses on the best level for each
ingredient (Figure 5.4) showed that the highest addition level (3%) for both alginate and
CaSO4 resulted in better grains, whereas the addition level of STPP was best at the
intermediate level, i.e., 0.3%.
Table 5.10 Results of the grain integrity tests in the formulations prepared by the orthogonal design
Trial Cooking integrity
(1-5) Soaking integrity
(1-5) Total ranking
(1-10) Extrusion rate
(g/min)
1 5 5 10 234
2 4 4 8 260
3 1 0 1 267
4 2 4 6 250
5 1 3 4 260
6 0 0 0 219
7 0 2 2 309
8 1 1 2 279
9 1 1 2 355
Table 5.11 Statistical analysis of orthogonal study results
Alginate Trial Formula
ISP DMF CaSO4 STPP
1 A1 B1 C1 3.0% 3.0% 0.6%
2 A1 B2 C2 3.0% 1.5% 0.3%
3 A1 B3 C3 3.0% 0.5% 0.1%
4 A2 B1 C2 1.5% 3.0% 0.3%
5 A2 B2 C3 1.5% 1.5% 0.1%
6 A2 B3 C1 1.5% 0.5% 0.6%
7 A3 B1 C3 0.5% 3.0% 0.1%
8 A3 B2 C1 0.5% 1.5% 0.6%
9 A3 B3 C2 0.5% 0.5% 0.3%
Tj1 (level 1) 19 18 12
Tj2 (level 2) 10 14 16
Tj3 (level 3)
Calculated from the integrity test results in the
above table 6 3 7
Rj (difference) Between the best and worst
cases of Tji 13 15 9

103
Figure 5.4 Statistical analysis of the best level for each factor
Therefore, the best ratio deduced from the orthogonal experiment would be
alginate/CaSO4/STPP (3%:3%:0.3%). This formulation was not tested in the original 9 trials,
in which the best formulation was trial #1 with the ratio of 3%:3%:0.6%. Both formulations
were re-tested using alternative sources of the three ingredients.
5.5.2.2 Verification of the optimal ratios
5.5.2.2.1 Comparison of the optimal ratios using various alginate sources
As shown in Table 5.12, the 3%:3%:0.6% formulation gave slightly better results than the
best predicted ratio, i.e., 3%:3%:0.3%. Accordingly, 3%:3%:0.6% was used in comparing
different alginates (Table 5.13).
Table 5.12 Comparison of two optimal ratios of alginate/CaSO4/STPP using alternative alginate sources
Alginate Alginate/CaSO4/STPP = 3/3/0.3
(The best ratio deducted statistically from the orthogonal experiment)
Alginate/CaSO4/STPP = 3/3/0.6 (The optimal ratio chosen from the 9 trials of the orthogonal experiment)
Cooking integrity
(Ranking 0-5) Cooking integrity
(Ranking 0-5)
ISP DMF 4 5
Danisco 175 4 4.5
Danisco 155 4 4.5

104
Table 5.13 Verification of the optimal ratio (alginate/CaSO4/STPP = 3/3/0.6) using various alginate sources
Alginates Extrusion rate
(g/min) Cooking integrity
(Ranking 0-5)
ISP DMF 234 5
Danisco 175 288 4
Danisco 155 312 4
FMC RF6650 265 5
FMC LF20/40 335 5
TIC HG600F 296 4.5
TIC 900 249 4.5
ISP GMB (high G) 309 4.5
All samples had equally good grain integrity, which confirmed the best formulation was
viable. In addition, the results confirmed that the alginate was not as important as the
calcium compound in the internal gelation system. Variations in the physical/chemical
properties of the alginate sources did not have an obvious impact on grain integrity, as long
as the best concentration level (3%) was used.
5.5.2.2.2 Effect of increased alginate and calcium concentrations
As indicated earlier in the orthogonal study, the best levels for both alginate and CaSO4 were
the highest concentrations tested in the 9 trials, i.e., 3%. This indicated that the use of higher
concentrations of both ingredients could improve grain integrity. Thus, it would be useful to
explore higher addition levels.
As shown in Table 5.14, when the addition levels of both ingredients were increased to 5%
and 8%, respectively, the grains retained the similar cooking integrity to that of the sample
made with 3% of both materials. On the other hand, the increased amounts of both
ingredients caused obvious difficulty in the extrusion process, slowing the extrusion rates.
Considering the increased product cost associated with the higher addition levels, the
optimal ratio determined in the orthogonal study was followed in all later tests.

105
Table 5.14 Investigation on increased concentration levels of alginate and CaSO4
Alginate/CaSO4/STPP ratio Extrusion rate (g/min) Cooking integrity (ranking at 0-5)
3/3/0.6 234 5
5/5/1.0 228 5
8/8/1.6 198 4
5.5.2.2.3 Comparison of calcium compounds
With the optimal ratio (alginate/Ca/STPP=3%:3%:0.6%), the effect of other Ca compounds
was tested again. The results are shown in Table 5.15. Clearly, only CaSO4 resulted in the
desired grain integrity when the internal gelation process was used. Other Ca compounds
were released either too fast or too slowly during processing, so that the desired alginate-Ca
crosslinking was not achieved. Again, it was confirmed that the Ca compound was the most
important factor among the three ingredients - both the type of Ca salt and the addition level
played important roles in controlling the gelation process.
Table 5.15 Verification of the optimal ratio with various calcium compounds
Ca compound Extrusion rate (g/min) Cooking integrity
(Ranking 0-5)
CaSO4 234 5
Ca lactate 267 1
CaCl2 310 0
CaCO3 298 0
Ca(IO3)2 336 0
CaO Not extrudable, the strong alkali tended to break down rice flour
and formed a yellowish dough.
5.5.2.2.4 Comparison of various sequestrants
Several other sequestrants were tested at the optimal ratio. The results shown in Table 5.16
confirmed that STPP performed best in controlling the release of Ca ions during the internal
gelation process. Nevertheless, all sequestrants at the addition level of 0.6% resulted in
similar grain integrity. Even in the sample without sequestrant, alginate and CaSO4 at the
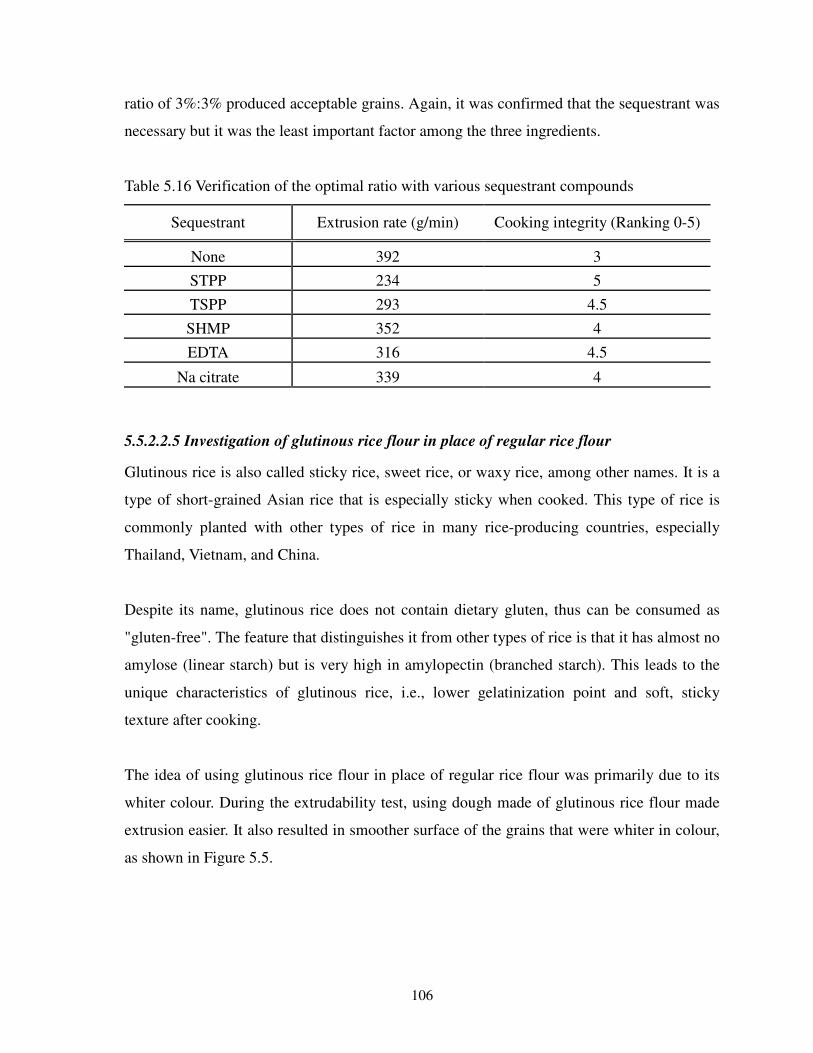
106
ratio of 3%:3% produced acceptable grains. Again, it was confirmed that the sequestrant was
necessary but it was the least important factor among the three ingredients.
Table 5.16 Verification of the optimal ratio with various sequestrant compounds
Sequestrant Extrusion rate (g/min) Cooking integrity (Ranking 0-5)
None 392 3
STPP 234 5
TSPP 293 4.5
SHMP 352 4
EDTA 316 4.5
Na citrate 339 4
5.5.2.2.5 Investigation of glutinous rice flour in place of regular rice flour
Glutinous rice is also called sticky rice, sweet rice, or waxy rice, among other names. It is a
type of short-grained Asian rice that is especially sticky when cooked. This type of rice is
commonly planted with other types of rice in many rice-producing countries, especially
Thailand, Vietnam, and China.
Despite its name, glutinous rice does not contain dietary gluten, thus can be consumed as
"gluten-free". The feature that distinguishes it from other types of rice is that it has almost no
amylose (linear starch) but is very high in amylopectin (branched starch). This leads to the
unique characteristics of glutinous rice, i.e., lower gelatinization point and soft, sticky
texture after cooking.
The idea of using glutinous rice flour in place of regular rice flour was primarily due to its
whiter colour. During the extrudability test, using dough made of glutinous rice flour made
extrusion easier. It also resulted in smoother surface of the grains that were whiter in colour,
as shown in Figure 5.5.

107
Figure 5.5 Comparison of grain appearance made with glutinous rice flour in place of regular rice flour
During the soaking and cooking tests, no cracking or checkering was noted on the grains
made with glutinous flour, but the grains were likely to allow some starch to seep out,
resulting in cloudy water. Not surprisingly, without addition of any alginate/Ca, the cooked
grains had much softer and stickier texture; however, with the addition of the three
ingredients at the best ratio, the cooked grains showed much better texture, resembling
polished rice, as shown in Figure 5.6 and Table 5.17. With further addition of HPMC (5%wt
of MethocelTM E3 from Dow Chemical Co.), the grains showed enhanced hardness and
cohesiveness, producing the best formulation this far.
Figure 5.6 Comparison between glutinous rice flour and regular rice flour using the best ratio and addition of HPMC
Rice flour-based
Vit A formula
Rice flour-based
Multi-Fe formulaGlutinous flour-based
Multi-Fe formula
Glutinous flour-based
Vit A formula
With the best ratio of alginate/CaSO4/STPP used and addition of HPMC (5%)
Glutinous flour Native long grain Regular rice flour
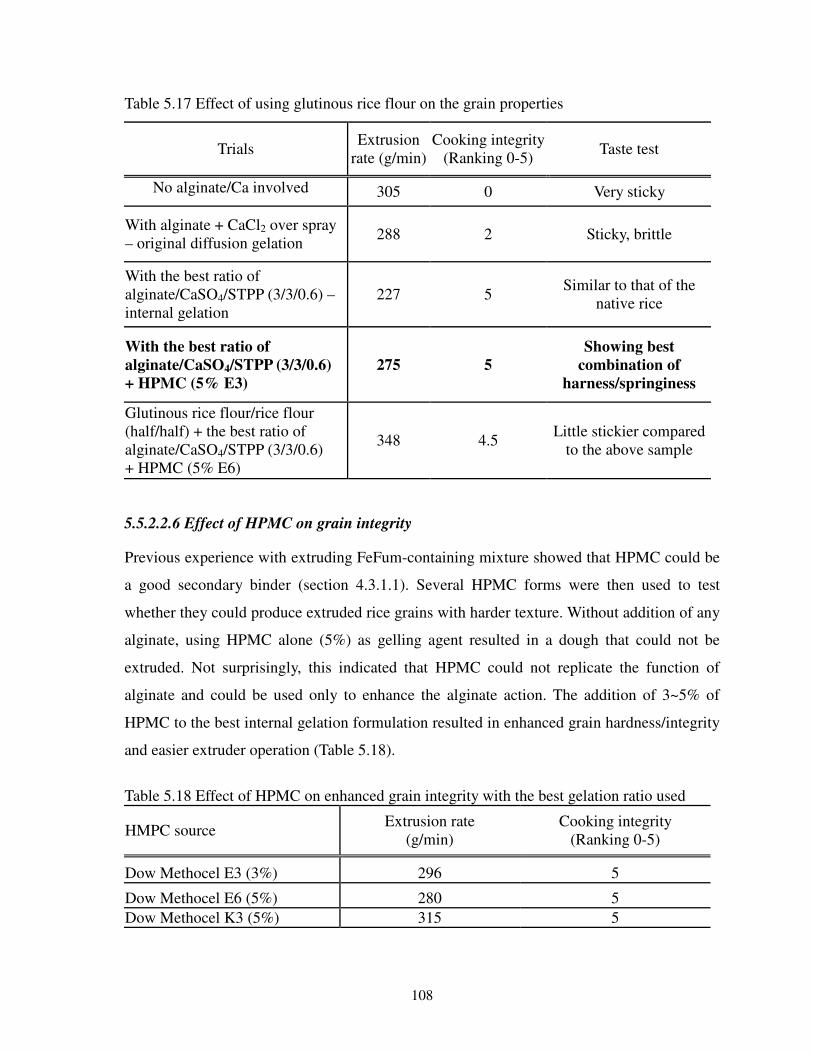
108
Table 5.17 Effect of using glutinous rice flour on the grain properties
Trials Extrusion
rate (g/min) Cooking integrity
(Ranking 0-5) Taste test
No alginate/Ca involved 305 0 Very sticky
With alginate + CaCl2 over spray – original diffusion gelation
288 2 Sticky, brittle
With the best ratio of alginate/CaSO4/STPP (3/3/0.6) – internal gelation
227 5 Similar to that of the
native rice
With the best ratio of
alginate/CaSO4/STPP (3/3/0.6)
+ HPMC (5% E3)
275 5
Showing best
combination of
harness/springiness
Glutinous rice flour/rice flour (half/half) + the best ratio of alginate/CaSO4/STPP (3/3/0.6) + HPMC (5% E6)
348 4.5 Little stickier compared
to the above sample
5.5.2.2.6 Effect of HPMC on grain integrity
Previous experience with extruding FeFum-containing mixture showed that HPMC could be
a good secondary binder (section 4.3.1.1). Several HPMC forms were then used to test
whether they could produce extruded rice grains with harder texture. Without addition of any
alginate, using HPMC alone (5%) as gelling agent resulted in a dough that could not be
extruded. Not surprisingly, this indicated that HPMC could not replicate the function of
alginate and could be used only to enhance the alginate action. The addition of 3~5% of
HPMC to the best internal gelation formulation resulted in enhanced grain hardness/integrity
and easier extruder operation (Table 5.18).
Table 5.18 Effect of HPMC on enhanced grain integrity with the best gelation ratio used
HMPC source Extrusion rate
(g/min) Cooking integrity
(Ranking 0-5)
Dow Methocel E3 (3%) 296 5
Dow Methocel E6 (5%) 280 5
Dow Methocel K3 (5%) 315 5
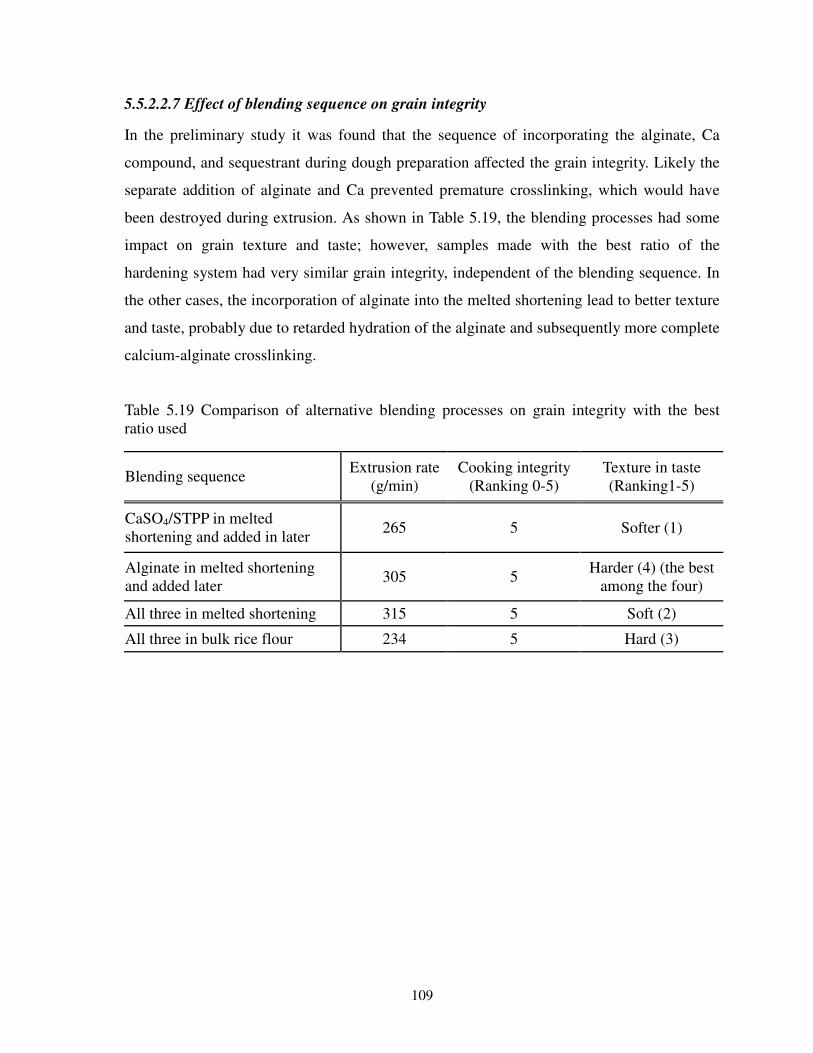
109
5.5.2.2.7 Effect of blending sequence on grain integrity
In the preliminary study it was found that the sequence of incorporating the alginate, Ca
compound, and sequestrant during dough preparation affected the grain integrity. Likely the
separate addition of alginate and Ca prevented premature crosslinking, which would have
been destroyed during extrusion. As shown in Table 5.19, the blending processes had some
impact on grain texture and taste; however, samples made with the best ratio of the
hardening system had very similar grain integrity, independent of the blending sequence. In
the other cases, the incorporation of alginate into the melted shortening lead to better texture
and taste, probably due to retarded hydration of the alginate and subsequently more complete
calcium-alginate crosslinking.
Table 5.19 Comparison of alternative blending processes on grain integrity with the best ratio used
Blending sequence Extrusion rate
(g/min) Cooking integrity
(Ranking 0-5) Texture in taste (Ranking1-5)
CaSO4/STPP in melted shortening and added in later
265 5 Softer (1)
Alginate in melted shortening and added later
305 5 Harder (4) (the best
among the four)
All three in melted shortening 315 5 Soft (2)
All three in bulk rice flour 234 5 Hard (3)

110
5.5.3 Test of the Optimized Gelation Systems in Nutrient Fortified Formulations
Next, the successful internal gelation systems were used in preparing reconstituted rice
containing vitamin A and the previously optimized antioxidant system and in a multiple-
fortified formulation containing iron and B vitamins.
The detailed formulation compositions are presented in Appendix 11.2.3. In addition to the
internal gelation system, 1% TiO2 was added to the multiple-fortified formulation since we
have found, in a parallel study (section 6.5.2.1), that TiO2 improved grain colour. Sodium
erythorbate was used in the vitamin A formulation in place of the original antioxidant,
ascorbic acid, since the use of sodium erythorbate prevented the formation of a yellowish
hue observed with the use of ascorbic acid (Diosady & Li, 2008). All other components were
kept the same as in the original commercial formulations.
Two other formulations were also produced by replacing regular rice flour with glutinous
flour and with addition of HPMC at the level of 3%, since this combination had enhanced
the grain integrity. The detailed compositions of these two batches are also presented in
Appendix 11.2.3. After the four formulations were prepared, the physical properties, grain
integrity, and the retentions of the added micronutrients were measured.
The measurements of grain colour using Hunter L*a*b* system showed that the four
formulations made with the best gelation systems had much improved colour over the
original formulations (Figure 5.7). However, this improvement was probably not the
contribution of the gelation system, but rather it was due to the other formulation
refinements described above. These improvements resulted in a closer match to the
appearance of actual rice.
The grain integrity test results are presented in Figure 5.8. It is clear that the use of glutinous
rice flour and HPMC made the extrusion process easier, resulting in higher extrusion rates.
However, during the cooking test, the grains in the two samples made with glutinous flour
completely stuck together. In contrast, the grains made with regular rice flour could retain
their shape/intactness reasonably well after cooking; still, the grain integrity was not as good

111
as that of the grains made without the active ingredients. Clearly, the other components,
especially the antioxidants (acidic materials), weakened the gelation structure to some extent.
A better understanding of the potential interactions between the gelation materials and other
ingredients in the system is required for the development of industrially viable formulations.
L* a* b* L* a* b*
Rice flour-based 76.0 0.7 21.3 77.1 0.6 16.8
Glutinous flour-based 83.0 -1.1 19.2 72.5 3.5 20.1
L* a* b* L* a* b*
72.9 4.7 15.6 67.4 1.8 21.4
L* a* b* L* a* b*
77.4 2.0 17.6 75.8 0.5 14.9
ControlsNative grains Blank Ultra Rice
With the best internal
gelation systems
Multi-Fe formulaVitamin A formula
Original Vit A formula Original Multi-Fe formula
With TiO2 added
in rice flour-based
multi-Fe formula,
and HPMC (3%)
added in both
glutinous flour-
based
formulations
4.1
1.6
3.5
5.6
10.7
6.75.7
0
3
6
9
12
Internal gelation
Vit A
Internal gelation
Multi-Fe
Blank simulated
rice
Original Vit A Original multi-Fe
Inte
gra
ted
co
lou
r d
iffe
ren
ce
fro
m t
he
refe
ren
ce -
Nat
ive
rice Rice flour-based Glutinous flour-based
Figure 5.7 Colour measurements of the four new formulations made with the best internal gelation systems
Figure 5.8 Micronutrient fortified Ultra Rice® formulations made with the best internal gelation systems

112
The potential interactions of the gelation system with the added micronutrients were
investigated using four new formulations. As shown in Table 5.20, folic acid seemed stable
in the new formulations made with the internal gelation systems, with ~95% retained after
the extrusion process. This was comparable to the formulations made with the original
external calcium diffusion setting, where an average folic acid retention of 96% was
observed (results from the later chapter work). In contrast, vitamin A stability was greatly
reduced by the internal gelation systems, with ~40% of the vitamin lost during processing.
Conversely, the original surface crosslinking technique could retain >90% of the added
vitamin A (Lam, 2006). Clearly, technical challenges still remain in the application of the
best gelation systems, particularly in obtaining appropriate grain integrity and nutrient
stability.
Table 5.20 Micronutrient retentions in the four new formulations made with the best internal gelation systems
Note: mean ± standard deviation, which were obtained from three or four replicates for each sample measurement.
5.5.4 Texture Measurements on the Best Formulations
As indicated earlier, the visual observations of grain integrity during soaking and after
cooking were used as a reasonably consistent and reliable qualitative measurement to assess
the formulations. Ideally a standardized analytical method should be adapted for quantitative
measurement of grain integrity. Attempts were made to use an instrumental texture
measurement for quantifying grain integrity.
Although texture measurement is commonly used in the food industry for determination of
sensory properties of food products, little information was found in the literature relevant to
reconstituted rice grains. There are two types of methods available - instrumental methods
and sensory methods. Particularly in the research area of rice quality and sensory properties,
numerous studies have shown instrumental methods could generate equally reliable data as
With the best gelation system
Vitamin A retention (Designed target - 1800 IU/g)
Folic acid retention (Designed target - 300 ppm)
Rice flour-based 1046.5 ± 34.1 284.6 ± 4.9
Glutinous flour-based 1108.2 ± 45.7 292.0 ± 3.7

113
sensory tests (Deshpande & Bhattacharya 1982; Juliano et al., 1981; Okadome, 2005). Also,
the instrumental methods on texture measurement have many advantages over sensory
methods, not the least of which is the fact that a group of well trained panelists is not
required as in sensory tests.
Therefore, instrumental measurement of cooked grain texture was made on selected
formulations. It was hoped that the instrumental measurements could be correlated with
visual observations. Specifically, a single compression test was adapted and used to measure
the texture of cooked rice grains (Sesmat & Meullenet, 2001). The detailed procedure is
described in the method section and in Appendix 11.2.2.
Table 5.21 Texture measurements on the Ultra Rice® grains made in the optimization study
Hardness (the peak force, N)
Springiness (the initial slope)
Ratio of hardness and springiness
Reference - natural grain 0.73 ± 0.19 0.12 ± 0.04 6.08
Control - vit A formula (original process)
0.78 ± 0.08 0.15 ± 0.04 5.20
Control - multi-Fe formula (original process)
0.97 ± 0.08 0.15 ± 0.03 6.47
Negative control - Blank rice flour extrudate (no active ingredients)
0.97 ± 0.15 0.12 ± 0.07 8.08
Orthogonal study 1 (best ratio) 0.92 ± 0.06 0.14 ± 0.08 6.57
Orthogonal study 2 0.99 ± 0.18 0.12 ± 0.04 8.25
Orthogonal study 3 1.32 ± 0.27 0.15 ± 0.04 8.80
Orthogonal study 4 0.92 ± 0.13 0.10 ± 0.03 8.82
Orthogonal study 5 1.12 ± 0.16 0.14 ± 0.04 8.01
Orthogonal study 6 0.84 ± 0.07 0.19 ± 0.03 4.42
Orthogonal study 7 0.83 ± 0.15 0.22 ± 0.06 3.77
Orthogonal study 8 0.91 ± 0.25 0.19 ± 0.05 4.79
Orthogonal study 9 0.74 ± 0.08 0.14 ± 0.07 5.29
The best ratio verification with Danisco alginate
1.25 ± 0.10 0.20 ± 0.03 6.24
The best ratio + HPMC E3 1.33 ± 0.31 0.21 ± 0.11 6.32
The best ratio + HPMC E6 + glutinous flour
0.35 ± 0.07 0.06 ± 0.01 5.83
Vit A formula with the best system based on regular rice flour
0.56 ± 0.08 0.09 ± 0.01 6.53

114
Multi-Fe formula with the best system based on regular rice flour
0.78 ± 0.07 0.095 ± 0.01 8.16
Vit A formula with the best gelation system based on glutinous flour
0.28 ± 0.02 0.03 ± 0.003 9.33
Multi-Fe formula with the best gelation system based on glutinous flour
0.35 ± 0.05 0.03 ± 0.002 11.67
Note: the experimental data are presented as mean value ± standard deviation, which were obtained from three or four replicates for each sample measurement.
As shown in Table 5.21, the Ultra Rice® grains made with the original process had similar
hardness and springiness to the native rice. This is in good agreement with the previous
observation of the grain integrity of the two formulations, which retained reasonable
shape/intactness after cooking. The multiple-fortified formulation was slightly harder than
the vitamin A containing sample, which may be related to the presence of the iron compound
in the matrix.
The results for reconstituted rice without any alginate or calcium also gave similar hardness
and springiness values as the native rice grains. However, the previous grain integrity test
indicated that the alginate-free sample did not retain its integrity after cooking. Clearly, the
values of hardness and springiness on their own may result in misleading assessment.
Therefore, the ratio of hardness over springiness may be considered as a more valuable
parameter. Based on the literature (Perez et al., 1996), a higher value in hardness means the
material is probably hard and brittle, while greater values of springiness may suggest the
material is softer and/or stickier. An optimal combination of both could represent desirable
texture, such as a hardness-springiness (H-S) ratio of 6 calculated for cooked native rice.
Based on this consideration, the results of the alginate-free control was re-examined and it
was found that the sample had a higher value for hardness and lower number for springiness,
which means the cooked grain was harder but stickier. This seems in agreement with the
visual observations, wherein the grains disintegrated to some extent during soaking with
some starch seeping out, forming a sticky rice-cake like texture after cooking. Moreover, the
calculation of the H-S ratio showed that the sample had a value of >8, much higher than that
of the native rice.

115
The H-S ratio of all tested samples was then calculated. The ratios had a good correlation
with visual observations. The formulations made with the best gelation systems had H-S
ratios close to 6, while the samples with poor grain integrity had H-S ratios either much
smaller or greater than 6. Particularly in the sample made with the best glutinous flour
system, even though the values of hardness and springiness were much different from those
of the native rice, the H-S ratio was in the similar range, which was in agreement with the
visual observation that this sample had the best grain integrity/intactness after cooking.
Clearly the single compression test could be used to obtain valuable quantitative information
that correlates well with qualitative sensory assessments of grain integrity.
5.5.5 Mechanism of Alginate-Calcium Interaction in the Ultra Rice®
System
As discussed earlier, alginate-calcium gelation can be expressed by the following ion
exchange reaction:
2(Na - Alg)n + Ca2+
= (Ca− Alg2)n + 2Na+
The gelation would normally form an “egg-carton”-like network, as follows, in which the
calcium ions are embedded in the two chains of the alginate polymer.
Practically, alginate-calcium gelation is obtained through either diffusion setting or internal
setting. Two models were proposed to explain the two systems developed in the Ultra Rice®
production, i.e., a “fish-net” model for the diffusion setting or external gelation used in the
original process (as depicted in Figure 5.9 on the left), and an “inter-lock” model for the
internal setting developed in this study (as depicted in Figure 5.9 on the right).
Specifically, the original technique of calcium over-spray on the extruded rice grains
resulted in a network at the grain surface similar to a “fish-net” with a pore size of ~ 1 µm
(Liu et al., 2002), which could prevent the bigger starch granules leaking out. However, this
rigid structure could not resist, or stretch with, the core expansion when rice starch absorbed
water and gelatinized during cooking, resulting in grain cracking. In contrast, the internal

116
gelation system could form a uniform inter-connected network, similar in function to
hydrated gluten in pasta and bread (Hart, 1997). This inter-locked network could entrap the
starch granules and retain them during cooking. However, the formation of this network was
adversely affected by other components, such as acidic antioxidants. As indicated in the
literature (Draget et al., 2005), alginate polymer stability is strongly affected by solution pH,
where at pH<5, a proton-catalyzed hydrolysis may occur, resulting in depolymeration. In
addition, it is reported that the crosslinking reaction between alginate and free calcium ion
and the calcium-chelating effect of certain sequestrants, e.g., EDTA, are pH-dependent (Bu
et al., 2005; Oldfield, 2004). With the addition of extra acidic components in the formulation
matrix, the desired balance of the gelation system was destroyed, which adversely affected
the grain integrity.
Figure 5.9 Two proposed models for alginate-calcium gelation in Ultra Rice®: “fish-net” model for external/diffusion setting (left) and “inter-lock” model for internal setting (right)
Figure 5.10 Alginate-calcium gel structure made with external (left) and internal (right) gelation processes (from Liu et al., 2002 with permission)
Other studies also found similar effects during the preparation of alginate-calcium beads in
Rice starch granule (~5 µm)
Alginate-calcium network at the
surface with pore size ~1 µm
Extruded Rice Grain
Alginate-calcium network
throughout the grain
Rice starch granule (~5 µm)

117
an aqueous system (Hills et al., 2000). As shown in Figure 5.10, external gelation resulted in
a denser network at the surface of the bead, with decreasing calcium concentration towards
the core, while internal or in-situ gelation resulted in a looser, porous network with
apparently constant calcium concentration throughout the bead (Liu et al. 2002).
Quick examinations of Ultra Rice® grains using XPS (X-ray Photoelectron Spectroscopy)
and ToF-SIMS (Time-of-Flight Secondary Ion Mass Spectroscopy) confirmed that the grains
made by the external crosslinking method had a higher Ca concentration at the grain surface,
while the grains made by internal gelation had a similar Ca distribution in both the core and
the surface layer. Detailed results are presented in Appendix 11.2.4.
Overall, the best ratio between alginate, CaSO4, and STPP obtained in the orthogonal
experiment could result in controlled in-situ gelation through extrusion process, which was
mainly due to the competitive effect between alginate and the sequestrant in binding free
Ca2+ slowly released from CaSO4, which has limited solubility.
5.6 Summary of Research Approach 2
1. The original process for making reconstituted rice grains by Ca-alginate external
crosslinking led to grain cracking during cooking, due to the weak, rigid surface
structure.
2. To overcome this problem, I tried to develop a Ca-alginate network throughout the
extruded grains by incorporating both calcium and sodium alginate into formulation.
3. The crosslinking between Ca and alginate was attempted by slowly releasing Ca2+ ions
based on increasing temperature or decreasing pH. This approach was not successful.
Using calcium salts with limited solubility in combination with sequestrants has proven
to be promising. The competition between the sequestrant and the alginate for the free
calcium ions in the system delayed internal gelation until the extrusion process was
almost completed, producing reconstituted rice grains with acceptable core integrity and
appearance. CaSO4 was an effective Ca2+ source. This approach actually enhanced the
extrusion operation to some extent with a faster flow rate.
4. It has been determined, using an orthogonal experimental design, that the calcium salt

118
plays the most important role in the internal gelation process. The appropriate ratio of
the three key components, i.e., alginate, calcium, and sequestrant, is critical for forming
an effective internal gelation system. The best results were obtained with DMF alginate
from ISP, CaSO4, and STPP.
5. Reconstituted rice with grain properties similar to those of the native rice could be
consistently produced with formulations in which the alginate, CaSO4 and STPP
concentration was maintained at 3%, 3%, and 0.6%, respectively.
6. When active ingredients were added to the rice matrix, the integrity of the extruded
grains deteriorated somewhat. This was especially noticeable with acidic antioxidants.
Still, the fortified grains prepared by internal setting were superior in appearance to
those made by calcium overspray.
7. The Ultra Rice® production could be greatly simplified by adapting the internal gelation
system, and based on the laboratory tests pilot tests and commercialization should be
investigated.
8. The gelation system developed in this study provides a robust structural platform for
delivering minor active components in matrices on a 1-10mm scale, not only in
micronutrient fortification, but also potentially for other applications, such as drug,
nutraceuticals, and active ingredient delivery in functional foods, animal feeds, and
agro-chemicals.
Recommended future work
1. Further improvements to either the internal gelation system or the antioxidant system
should be attempted in order to generate robust systems which are unaffected by the
added active ingredient systems.
2. Quantitative analytical methods need to be established for measuring physical properties
of the reconstituted rice grains, including grain integrity after soaking and cooking,
overall hardness and surface hardness. In addition, it would be better to develop a valid
method for characterizing gel formation and/or gel strength during all stages of the
process.
3. It may be prudent to re-examine the other approaches for achieving controlled or delayed
internal gelation in the presence of the antioxidant systems and the selected

119
micronutrients. Specifically altering environmental factors, including pH and
temperature, to trigger slow release of calcium ions from an insoluble calcium salt or to
deactivate sequestrants could be used to induce gelation at a desired rate.

120
6 RESEARCH APPROACH 3 - FOLIC ACID TESTS
6.1 Research Incentive – Folate Deficiency
To maximize the value of the current food fortification interventions aimed at eliminating
micronutrient deficiencies in poor populations of developing countries, it seems logical to
incorporate other micronutrients into existing or planned programs for the fortification of
sugar, salt and rice. Folic acid was chosen in this study due to the increased awareness
worldwide of the dietary deficiency of this vitamin.
Previously, folate deficiency was considered rare due to the adequate presence of folate in a
wide variety of foods. However, dietary/nutrition surveys had revealed that most adults had
inadequate serum folate levels, and folate deficiency was common, particularly in elderly
populations (Buttriss, 2005). Poor dietary habits such as those of chronic alcoholics can lead
to folate deficiency. The predominant causes of folate deficiency in non-alcoholics are
impaired absorption or metabolism caused by certain diseases or medications (including
kidney and liver diseases and/or interference of drugs), or an increased need for the vitamin,
e.g., during pregnancy and lactation.
With more focused studies, inadequate folate intake has been linked with development of
birth defects, several chronic diseases including vascular disease and certain cancers, and
brain disorders such as depression, reduced cognition, and Alzheimer’s disease (Cho et al.,
2002; Rampersaud et al., 2002; Choi & Manson, 2000; Miller, 2004). The most widely
known problems related to folate insufficiency are neural tube defects (NTD), characterized
by abnormal neural tube closure, which is estimated to affect about 1~5 pregnancies/1000
(Caudill, 2004). In the early 1990s, it was demonstrated that periconceptional consumption
of folic acid supplements (400 µg/day) could dramatically reduce the risk of NTD by up to
72%. Other symptoms of folate deficiency are megaloblastic anemia in adults (a condition
characterized by fewer, and enlarged red blood cells with a decreased ability to carry oxygen)
and slow growth rate in infants and children. More subtle signs include digestive disorders
(such as diarrhea and loss of appetite), weight loss, weakness, sore tongue, headaches, heart
palpitations, irritability, forgetfulness, and behaviour disorders. The understanding of the role

121
of folates in birth defects led to a series of public health policy changes worldwide, aimed at
reducing folic acid deficiency (Bailey et al., 2003).
Based on the fact that folate is a cofactor in the regulation of normal plasma homocysteine
concentrations through a key remethylation reaction, sub-optimal folate status was linked to
hyperhomocysteinemia, which is considered to be a significant risk factor for atherosclerotic
vascular disease in the coronary, cerebral and peripheral vessels (Bailey et al., 2003). More
intervention trials are ongoing to further understand the mechanisms behind these
correlations and determine whether increased folic acid intake through either
supplementation or food fortification could result in a reduction of disease incidence and
morbidity.
Many developed countries have introduced mandatory folic acid fortification of wheat flour.
This intervention has been highly successful (Grosse et al., 2006). Thus, it would be
worthwhile to investigate the possibility of incorporating folic acid within a broader
intervention that could provide other critical micronutrients simultaneously. There is a need
for other vehicles as poor people in developing countries do not have access to industrially
processed food ingredients, such as wheat flour. Depending on the dietary habits specific to a
region, other food carriers, such as salt, sugar or rice could be considered as folic acid
vehicles. Particularly, iodized salt has been successfully implemented in many countries, and
vitamin A fortified sugar has long been available in many Latin American countries.
Previously our research group has developed a stable Ultra Rice® formulation that could
effectively deliver iron, zinc, and several B vitamins in a fortified rice product. It was then
logical to test the incorporation of folic acid into this stable rice formulation.
Folic acid could be incorporated directly into the selected food vehicles or added in a
protected form, alone or in combination with other micronutrients. In this study I examined
different fortification techniques. While it would be preferable to apply folic acid directly,
encapsulation processes may be needed to protect the vitamin in food. The objective of this
phase of the work was to identify potential, undesirable interactions between folic acid and
other micronutrients. It was hoped that folic acid fortification could be incorporated into the
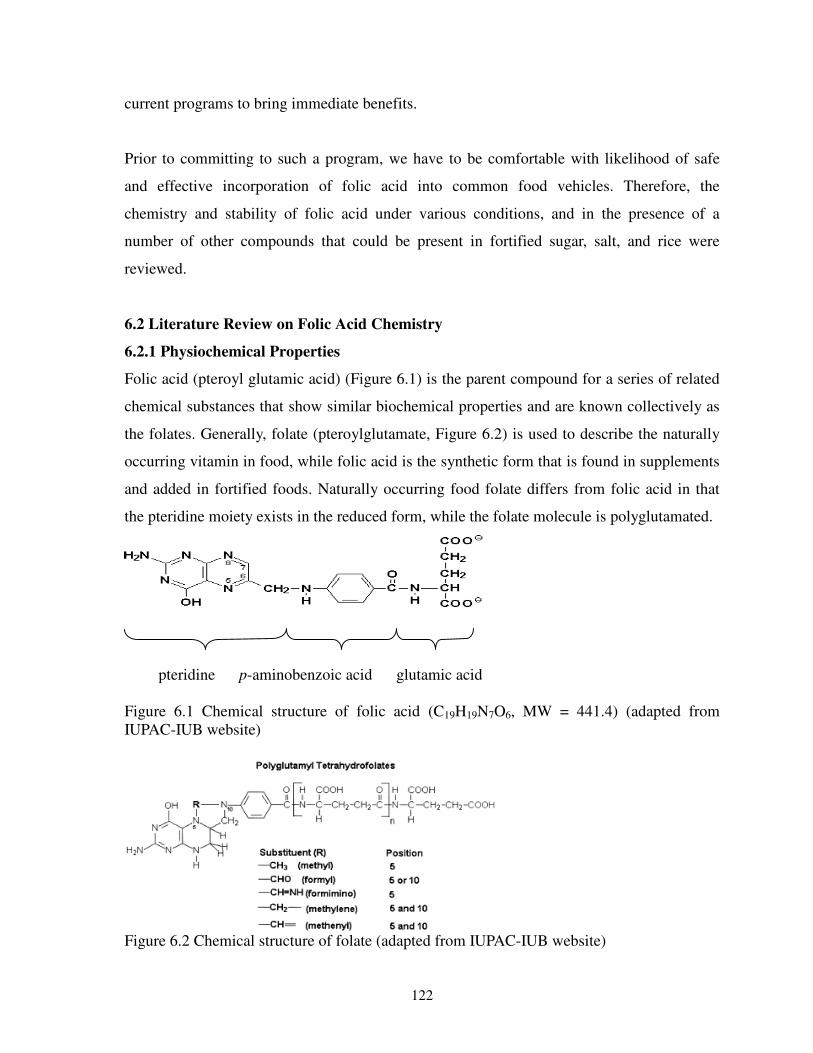
122
current programs to bring immediate benefits.
Prior to committing to such a program, we have to be comfortable with likelihood of safe
and effective incorporation of folic acid into common food vehicles. Therefore, the
chemistry and stability of folic acid under various conditions, and in the presence of a
number of other compounds that could be present in fortified sugar, salt, and rice were
reviewed.
6.2 Literature Review on Folic Acid Chemistry
6.2.1 Physiochemical Properties
Folic acid (pteroyl glutamic acid) (Figure 6.1) is the parent compound for a series of related
chemical substances that show similar biochemical properties and are known collectively as
the folates. Generally, folate (pteroylglutamate, Figure 6.2) is used to describe the naturally
occurring vitamin in food, while folic acid is the synthetic form that is found in supplements
and added in fortified foods. Naturally occurring food folate differs from folic acid in that
the pteridine moiety exists in the reduced form, while the folate molecule is polyglutamated.
Figure 6.1 Chemical structure of folic acid (C19H19N7O6, MW = 441.4) (adapted from IUPAC-IUB website)
Figure 6.2 Chemical structure of folate (adapted from IUPAC-IUB website)
pteridine p-aminobenzoic acid glutamic acid

123
Natural folates found in foods are in a conjugated form, which reduces their bioavailability
by as much as 50% (Gregory, 1997). In addition, they are much less stable, with rapid loss of
activity over periods of days or weeks. In contrast, the synthetic folic acid is stable for
months or even years in fortified foods (Ball, 2006). Chemically pure folic acid is a
yellow/orange, odourless, tasteless microcrystalline substance (MW 441.41) (Ball, 2006),
which chars above 250°C. The UV spectrum of L-folic acid at pH 13 shows absorptions at
256 nm (e = 30,000), 282 nm (e=26,000), and 365 nm (e=9800) (Francis, 1999). It is
practically insoluble in cold water and sparingly soluble in boiling water (20 mg/100ml). It
is moderately stable to heat, humidity and atmospheric oxygen, but it will lose its activity in
the presence of light, oxidizing or reducing agents, and acidic or alkaline environments
(Roche brochure).
6.2.2 Biological Functions
Dietary folates are usually converted during absorption from the intestinal tract so that only
tetrahydrofolic acid (THF) enters the blood and is subsequently transported to the tissues.
The function of THF is to carry and transfer various forms of one-carbon units during
biosynthetic reactions. Folate helps produce and maintain new cells, which is especially
important during periods of rapid cell division and growth such as infancy and pregnancy
(Kamen, 1997). Folate is needed to make DNA and RNA, the building blocks of cells. It also
helps prevent changes to DNA that may lead to cancer (Fenech et al., 1998). Both adults and
children need folate to make normal red blood cells and prevent anemia. In addition, folate is
essential for the metabolism of homocysteine, and helps maintain normal levels of this
amino acid. Elevated blood levels of homocysteine are associated with coronary heart
disease and stroke (Bailey et al., 2003). The study of folate deficiency has pointed to a
number of critical functions of folates in the development of serious birth defects and
chronic diseases.
6.2.3 Food Fortification with Folic Acid
Leafy green vegetables such as spinach and turnip greens, citrus fruits and juices, dried
beans and peas, are all natural sources of folate, but most of these are rare or absent in the
diet of the poor in developing countries. Liver is also rich in folate. Folic acid fortification of

124
flour in many developed countries made fortified cereals important contributors to the folate
intake of their general population.
In response to the overwhelming body of evidence suggesting that adequate folate
consumption in pregnant women reduced the risk of NTD in their offspring, the U.S. Public
Health Service recommended in 1992 that all women of childbearing age should consume
400 µg folic acid/day (DHHS/PHS, 1992). In an attempt to increase folate consumption in
women who did not take supplements, the U.S. Food and Drug Administrative (FDA)
mandated addition of folic acid (1.4 µg/g) to enriched grain products by January 1, 1998
(FDA, 1996). This level of fortification was estimated to increase daily folate intake by 100
µg.
Numerous studies (Cho et al., 2002; Caudill et al., 2001; Choumenkovitch et al., 2001;
Cuskelly et al., 1999; Dietrich et al., 2005; Grosse et al., 2006; Quinlivan & Gregory, 2003;
Rader, 2002 & 2005; Rader et al., 2000; Yetley & Rader, 2004) have demonstrated that
mandatory fortification of enriched cereal-grain products with folic acid within the U.S. led
to a significant improvement of blood folate status of the overall adult, non-supplement
using U.S. population. After fortification, the category “bread, rolls, and crackers” became
the single largest contributor of folate to the American diet, accounting for >15% of total
intake, surpassing vegetables, which were the number one folate food source prior to
fortification (Grosse et al., 2006).
In compliance with Canada's mandatory fortification regulations, most Canadian cereal
grains (e.g., white flour) are fortified with folic acid since January 1998. Many publications
have indicated a dramatically increased folate status and a 50% reduction in the risk of open
NTD (De Wals et al., 2003; French et al., 2003; Persad et al., 2002; Quinlivan & Gregory,
2003; Ray, 2004; Ray et al., 2002a & 2002b; Reisch & Flynn, 2002;). The Chilean Ministry
of Health legislated the addition of folic acid to wheat flour (2.2 mg/kg) starting in January
2000. Early results demonstrated a reduction of 40% in the rates on NTD from the
pre-fortification period (1999-2000) to post-fortification period (2001-2002). Since then,
other studies confirmed that fortification of wheat flour with folic acid in Chile continues to

125
be effective in preventing NTD (Castilla et al., 2003; Hertrampf & Cortes, 2004; Hertrampf
et al., 2003).
As of September 2003, 38 other countries, including Australia and New Zealand, had
introduced or agreed to introduce folic acid fortification of flour, at a levels of 140-220
µg/100 g. Interestingly, no countries in the EU are among these (Buttriss, 2005). Most EU
countries still rely on folic acid supplementation to address the issue of NTD, despite
suggestions to introduce compulsory fortification to balance the requirements of increasing
folic acid intake in certain populations and avoiding adverse effects in other groups of the
population (Buttriss, 2005).
6.2.4 Concerns Related to Folic Acid Fortification
There has been some concern that levels of folic acid in the diet exceed the mandated target
levels (Gregory, 2004; Quinlivan & Gregory, 2003a; Choumenkovitch et al., 2002). This is
due to the underestimation of naturally occurring folate in the current food composition
database, higher bioavailability of folic acid than most naturally occurring forms of food
folate, and the addition of excess folic acid by manufacturers under good manufacturing
practice (GMP) to ensure that the mandated levels be achieved despite losses during
processing (Gregory, 2004; Rader et al., 2000; Whittaker et al., 2001).
The primary concern related to excessive folic acid intake from either fortified foods or
supplements is the possibility of masking B12 deficiency anemia in the elderly. Folic acid
prevents megaloblastic anemia and potentially masks the diagnosis of vitamin B12 deficiency
by correcting the anemia while allowing neurological damage to continue (Quinlivan &
Gregory, 2003a). The only study to date focused on this problem provides some reassurance
that no measurable harm has occurred from this phenomenon at the current levels of folic
acid intake (Mills et al., 2003).
6.2.5 Issues of Folate Bioavailability
There is still a high degree of uncertainty in the bioavailability of food folates and folic acid,
which is needed to calculate the desired fortification level. To address folate insufficiency,

126
the U.S. Institute of Medicine (IOM) has identified an Estimated Average Requirement
(EAR) of 320 µg/day, which is expressed in a novel unit, Dietary Folate Equivalent (DFE). It
is defined as:
DFE = µg natural food folate + 1.7 x µg synthetic folic acid
where the multiplier of 1.7 was determined from the ratio of the experimentally determined
bioavailability of added folic acid (85% available) and natural dietary folate (50% available)
(Caudill, 2004).
Based on these figures, the IOM has developed the Dietary Reference Intakes (DRIs) for
folic acid, which is a set of reference values used for planning and assessing the vitamin
intake for healthy people. DRIs consist of three important parameters, including
Recommended Dietary Allowances (RDA), Adequate Intakes (AI), and Tolerable Upper
Intake Levels (UL). The RDAs for folate are suggested by the IOM to be 150 to 300 µg/day
for children depending on age, 400 µg/day for adults, but increased amounts, 600 µg/day and
500 µg/day for women during pregnancy and lactation, respectively.
An AI is set when there is insufficient scientific data available to establish a RDA, and it
meets or exceeds the amount required to maintain a nutritional state of adequacy in nearly all
members of a specific age and gender group. Thus, the AI for folate has been set at 65
µg/day for infants aged 0-6 months and 80 µg/day for those 7-12 months in age.
The UL is the maximum daily intake unlikely to result in adverse health effects. The IOM
has established the ULs for synthetic folic acid for all age groups as 1000 µg/day. There
appears to be no health risk associated with possible levels of natural food folate, thus no UL
has been set for folates naturally present in food.
The bioavailability of naturally occurring folate is still debated, as results reported in the
literature are highly variable (Finglas et al., 2006). The bioavailability of synthetic folic acid
(both supplemental and in fortified foods) is accepted to be higher than that of natural dietary
folate. However, the exact ratio of the bioavailabilities of these two forms remains debatable,
mainly due to the limitations in existing analytical methods for accurately determining folic

127
acid and natural dietary folate (Rader et al., 2000). Therefore, further studies are required in
terms of gaining a better understanding of the factors governing folate bioavailability and
improving protocols for its determination in humans. This will lead to a better food
composition database with more accurate values for natural folates and their bioavailabilities
in individual foods and representative mixed diets (Finglas et al., 2006). These data will be
critical in refining the optimal fortification levels.
6.2.6 Stability of Folic Acid
Unlike synthetic folic acid, which is a fully oxidized, naturally occurring food folates are
reduced at the 5, 6, 7, and 8 positions of the pteridine ring and so are prone to oxidative
cleavage. The breakdown at the C9-N10 bond results in two degradation products, which are
inactive and cannot be biologically converted to any active folate form (Figure 6.3)
(McKillop et al., 2002; Suh et al., 2001). Generally, native folate is unstable during cooking
and food preparation. The vitamin losses are the result of a combination of thermal
degradation and leaching into the cooking water (Ball, 2006). The degree of loss can be
influenced by environmental factors, such as pH, oxygen, metal ion concentrations,
antioxidant levels, cooking duration, and product/water ratio (McKillop et al., 2002).
Extensive losses of dietary folate have been reported in boiled vegetables and baked meats,
ranging from 55% to 85% (Ball, 2006; McKillop et al., 2002).
On the other hand, synthetic folic acid is more stable. In its monoglutamate form, folic acid
is stable to heat, but becomes heat labile in acid solution. In aqueous solution, folic acid is
stable at 100oC for 10 h at pH range 5.0-12.0 when protected from light, but becomes
increasingly unstable as the pH decreases below 5.0 (Ball, 2006). Treatment of folic acid
with alkaline potassium permanganate cleaves the molecule at the C9-N10 bond, yielding
p-aminobenzoylglutamic acid (pABG) and pterin-6-carboxylic acid (Figure 6.4). Aerobic
hydrolysis of folic acid under acid conditions gives pABG and 6-methylpterin (Saxby et al.,
1983). In addition, metal ions such as copper, air, and sunlight in the presence of riboflavin
accelerate its destruction (Nisha et al., 2005).

128
Figure 6.3 Oxidative cleavage products of folates (adapted from McKillop et al., 2002)
Figure 6.4 Cleavage products of folic acid under acidic and alkaline conditions (adapted from Saxby et al., 1983)
Folic acid is photosensitive, and is degraded in aqueous solution to various products by
visible or ultraviolet light. Akhtar et al. (2003) have reported that when folic acid is
irradiated with ultraviolet light, it is first converted to 2-amino-4-hydroxy-6-formyl pteridine
(pterine-6-carboxaldehyde) and a diazotizable amine (p-aminobenzoyl-L-glutamic acid). On
further irradiation, the aldehyde is converted to the corresponding 6-carboxylic acid
129
(pterine-6-carboxylic acid) that is fluorescent and finally to the decarboxylated
2-amino-4-hydroxy pteridine. Photolysis of folic acid follows first-order kinetics, and the
logk-pH profile shows a gradual decrease in rate in the pH range of 2.0-10.0. The profile
indicates the appearance of three steps that reflect the participation of different ionic species
of folic acid (pKal 2.3, pKa2 8.3) in the photolysis reaction. The rate of photodegradation
varies from 0.155 x 10⁻³ min-l (pH 10.0) to 5.04 x 10⁻³ min-l (pH 2.5) (Akhtar et al. 1999).
Besides the relatively high stability of pure, synthetic folic acid under normal storage
conditions, numerous studies have demonstrated the acceptable stability of added folic acid
in fortified breads, vitamin-mineral premixes, fortified flours and grains, during typical
storage and baking conditions, as well as in high moisture environments (Ball, 2006; Rader
et al., 2000; Gujska & Majewska, 2005; Albala-Hurtado et al., 2000; de Jong et al., 2005).
An acceptable average loss during processing of 10-20% of added folic acid has been
reported.
As the vitamin is heat sensitive in acid, it has been suggested that high pressure treatments
are better for native folate retention in vegetables, fruit juices, soups, and beverages than
traditional sterilization processes (Finglas et al., 2006). The addition of proper antioxidants is
also helpful in stabilizing added folic acid (Ball, 2006). Another possible way to increase the
bioavailability of naturally occurring food folates is through processing, e.g., by breaking the
matrix or deconjugating glutamate residues from the polyglutamate chain (Finglas et al.,
2006).
Potential interactions of folic acid with other vitamins and minerals
Ascorbic acid and folic acid
Cleavage of folic acid can occur in solutions containing both ascorbic and folic acids, due to
the reducing effect of ascorbic acid. The breakdown of folic acid is most rapid in the pH
range 3.0 to 3.3 and slowest at pH 6.5 to 6.7 (Ottaway, 1993).
Thiamin and folic acid
Thiamin has been shown to have a significant effect on the stability of folic acid, particularly
in the pH range 5.9 to 7. Its degradation products can accelerate the degradation of folic acid

130
(FAO, 1995).
Riboflavin and folic acid
The stability of folic acid is affected by the combined actions of riboflavin and light, which
produce an oxidative reaction resulting in the cleavage of folic acid. This effect occurs more
rapidly at pH 6.5 (Ottaway, 1993).
6.3 Project Goals & Anticipated Challenges
Food fortification is clearly a highly effective intervention in the prevention of health
problems related to folate deficiency. The mandated fortification of cereal-grain products has
markedly improved folate status and reduced the risks of NTD and other chronic diseases in
the populations participating the fortification programs.
The review of the vitamin chemistry shows that folic acid is reasonably robust, and under
appropriate environmental conditions remains stable and effective. Based on the available
literature, application of folic acid to sugar should result in a stable system. However,
addition in combination with vitamin A is not clearly predictable, as antioxidants such as
vitamin A can rapidly degrade folic acid, and be degraded also as a consequence. Whether
this is a significant problem had to be determined by experimentation.
The addition of folic acid to salt is not addressed by the literature. While it is expected that
folate should be stable in a dry refined salt, this may not be the case in impure salt, or where
the carrier for attaching folic acid to the salt adversely influences pH or ionic composition.
Salt creates a highly corrosive environment, and the presence of metallic impurities can lead
to significant folic acid loss. As folic acid is sensitive to pH in several pH regions (either <5
or >12), depending on the composition of the system, it would be prudent to do a simple
experimental confirmation of the vitamin stability in specific salts to be used in the field.
The case of rice is similar. On its own, folic acid will be stable on or in rice. The stability in
the presence of iron is unclear. It may be necessary to encapsulate the iron compound, adjust
the pH or add an antioxidant. Ultimately this should not be a major problem, but fortification
technology may have a major effect on the success of fortification. Our previous work with

131
Ultra Rice® indicated that thiamine is stable in the presence of iron. We also expect that
folate would be equally resistant to degradation. Ultimately, the fortification of rice will
require a confirmatory test.
Fortification of sugar, salt or rice seems feasible, perhaps requiring fine-tuning of the system
in terms of stabilizers or binders. The simple experimental series initially proposed in this
program was expected to confirm the suitability of this approach at least in sugar and salt, by
testing the effect for a limited number of simple stabilizers.
6.4 Experimental Materials & Methods
6.4.1 Materials
Guatemalan iodized salt and vitamin A fortified sugar used in this study were obtained
through the Micronutrient Initiative (MI). Four commercial forms of food grade FePP used
in the Ultra Rice® formulations were obtained through the Program for Appropriate
Technology in Health (PATH). The other formulation materials and analytical reagents for
the determination of folic acid, vitamin A, and iodine are listed in Table 6.1.
Table 6.1 List of Chemicals used in the study of folic acid fortification
Material / Chemical Name Supplier Description
Materials for sample preparation
Guatemalan iodized salt through MI
Guatemalan vit A fortified sugar through MI
Rice flour for making extruded premix
Local supermarket
Shortening CriscoTM (Procter & Gamble, Canada)
Soy bean oil (for making folic acid oil suspension)
Local supermarket
Glatt microencapsulated ferrous fumarate premix
Glatt Air Techniques, NJ, USA
Ferrous fumarate Almat Pharmachem Inc. R&D use
Colombian ferric pyrophosphate through PATH Food grade
Fortitech ferric pyrophosphate through PATH Food grade
Micronized ferric pyrophosphate Dr. Paul Lohmann GmbH KG, Germany
Food grade

132
SunActive ferric pyrophosphate Taiyo Kagaku Co. Ltd., Japan Food grade
Titanium dioxide Sigma-Aldrich Chemicals R&D use
Folic acid BASF, Canada Pharmaceutical grade
Thiamine BASF, Canada Pharmaceutical grade
Zinc oxide Sigma-Aldrich Chemicals R&D use
Chemicals for analysis
Potassium iodate Sigma Chemicals, Canada ACS grade
Potassium iodide Fisher Scientific Co. ACS grade
Sulphuric acid EMD Chemicals Inc. USA R&D use
Hydrochloric acid EMD Chemicals Inc. USA R&D use
Sodium thiosulphate BDH Inc. 0.1 N solution, ACS grade
Starch (soluble) Sigma-Aldrich Chemicals, USA ACS grade
Potassium hydroxide Sigma Chemicals, Canada ACS grade
Pyrogallol Sigma Chemicals, Canada ACS grade
Hexane Sigma Chemicals, Canada Spectrophotometric grade
p-Aminobenzoylglutamic acid (p-ABGA)
Sigma Chemicals, Canada ACS grade
3-Aminophenol Sigma Chemicals, Canada ACS grade
Sodium nitrite Hermann Laue Spice Co. Inc., CA
Food grade
Sodium hydroxide Sigma Chemicals, Canada ACS grade
Sulfamic acid Sigma Chemicals, Canada ACS grade
Zinc (granule) Sigma Chemicals, Canada Reagent grade
6.4.2 Experimental Design
Folic acid fortified salt and sugar
Folic acid was incorporated into the Guatemalan iodized salt and vitamin A fortified sugar
by various addition methods, as listed in Table 6.2.
The salt or sugar samples containing folic acid powder were prepared by directly blending
the desired amounts of folic acid into the samples. Each mixture was placed in a capped
glass bottle and shaken for ~5 min, and then transferred to plastic “zipbags” for storage
testing.
The samples made by spraying folic acid in either water solution or oil suspension were
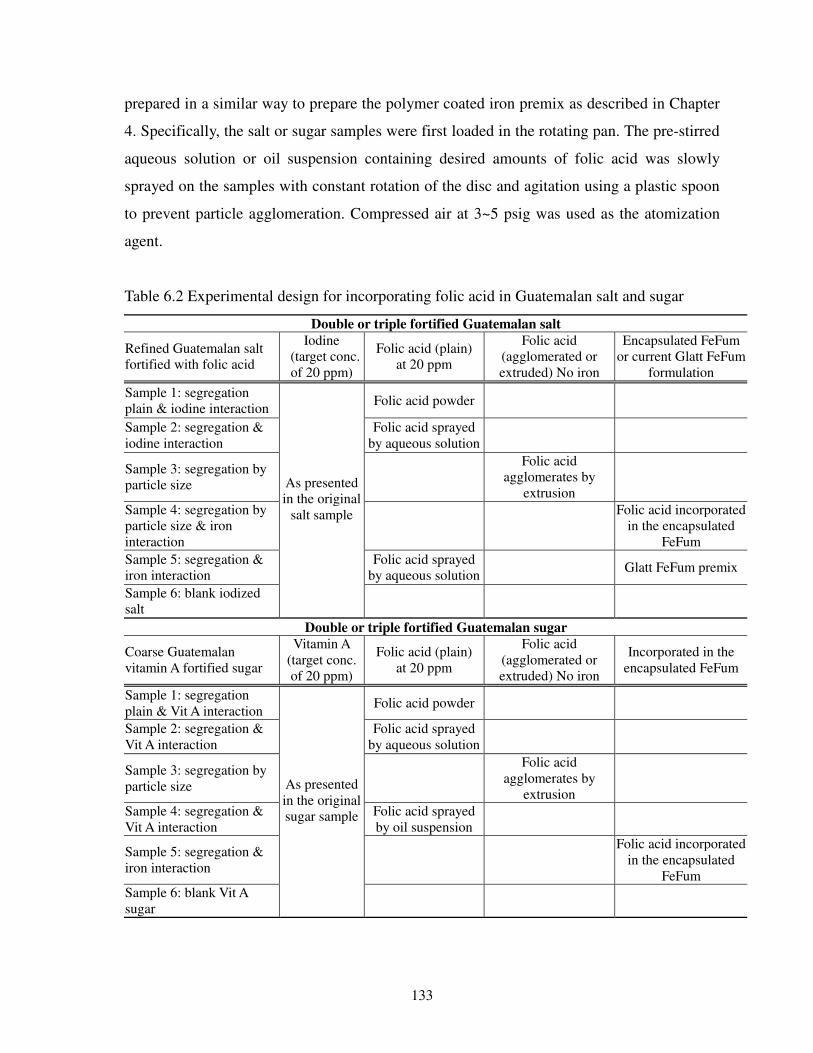
133
prepared in a similar way to prepare the polymer coated iron premix as described in Chapter
4. Specifically, the salt or sugar samples were first loaded in the rotating pan. The pre-stirred
aqueous solution or oil suspension containing desired amounts of folic acid was slowly
sprayed on the samples with constant rotation of the disc and agitation using a plastic spoon
to prevent particle agglomeration. Compressed air at 3~5 psig was used as the atomization
agent.
Table 6.2 Experimental design for incorporating folic acid in Guatemalan salt and sugar
Double or triple fortified Guatemalan salt
Refined Guatemalan salt fortified with folic acid
Iodine (target conc.
of 20 ppm)
Folic acid (plain) at 20 ppm
Folic acid (agglomerated or extruded) No iron
Encapsulated FeFum or current Glatt FeFum
formulation
Sample 1: segregation plain & iodine interaction
Folic acid powder
Sample 2: segregation & iodine interaction
Folic acid sprayed by aqueous solution
Sample 3: segregation by particle size
Folic acid
agglomerates by extrusion
Sample 4: segregation by particle size & iron interaction
Folic acid incorporated
in the encapsulated FeFum
Sample 5: segregation & iron interaction
Folic acid sprayed by aqueous solution
Glatt FeFum premix
Sample 6: blank iodized salt
As presented in the original
salt sample
Double or triple fortified Guatemalan sugar
Coarse Guatemalan vitamin A fortified sugar
Vitamin A (target conc. of 20 ppm)
Folic acid (plain) at 20 ppm
Folic acid (agglomerated or extruded) No iron
Incorporated in the encapsulated FeFum
Sample 1: segregation plain & Vit A interaction
Folic acid powder
Sample 2: segregation & Vit A interaction
Folic acid sprayed by aqueous solution
Sample 3: segregation by particle size
Folic acid
agglomerates by extrusion
Sample 4: segregation & Vit A interaction
Folic acid sprayed by oil suspension
Sample 5: segregation & iron interaction
Folic acid incorporated
in the encapsulated FeFum
Sample 6: blank Vit A sugar
As presented in the original sugar sample

134
The folic acid premix was prepared using the similar extrusion protocol for making
microencapsulated FeFum premix. The desired amount of folic acid was blended into rice
flour and converted to extrudable dough by adding melted shortening and water. The wet
dough mixture was then extruded to form tiny cylindrical particles with a diameter and a
length of ~0.5 mm. The particles were then air-dried at 40oC and screened to collect with the
desired size ranging from 500 µm to 700 µm. The folic acid premix was then blended into
the salt or sugar samples with the desired target concentrations.
The folic acid/FeFum premix was prepared by using the extruded FeFum premix and
incorporating folic acid through the colour-masking process. Specifically, folic acid powder
was pre-blended with TiO2 and then used as the colour-masking agent for the extruded
FeFum particles. The colour-masked particles containing both folic acid and FeFum were
further encapsulated with desirable amount of hydrophilic polymer, i.e., HPMC. The premix
was then added into the salt or sugar samples to meet the target concentrations.
Six salt and six sugar samples were prepared and then stored at 40oC and 60% RH. The
retentions of added micronutrients, i.e., iodine, vitamin A, and folic acid, were measured
after 1, 2, 3, and 9 months storage and reported as the percentage of the original levels.
Folic acid fortified Ultra Rice®
In parallel with the project of folic acid fortification of salt and sugar, the feasibility of
incorporating folic acid into Ultra Rice® was also investigated.
As shown in Table 6.3, ten formulations were prepared using the standard laboratory
protocol for making the extruded Ultra Rice®. The detailed procedure is reported in the
previous chapter. The samples were designed to test the effects of various FePP forms at
different addition levels on folic acid stability as well as on grain appearance. These samples
were then subjected to a 3 month storage test at 40oC and 60% RH.
Four commercial forms of food grade FePP were tested. The Colombian sample and the
sample from Fortitech had average particle sizes of ~25 µm, while FePP supplied by Dr.

135
Paul Lohmann A.G. and the SunActive products were micronized with particle sizes ranging
from 1 to 10 µm. The three regular FePPs have an average iron content of 25%, while the
SunActive FePP contains much lower iron, i.e., 8.16% or one third of the iron presented in
the other sources, due mainly to the incorporation of large amount of emulsifiers in this
commercial formulation. The designed addition level of the iron forms (e.g., 3.68 wt% of the
three regular FePPs and 11.04% of the SunActive) would result in an iron concentration of
~9 mg/g of rice premix. When the extruded rice is diluted with market rice at a ratio of 1:200,
this would lead to a daily iron intake of ~9 mg based on a daily consumption of 200g of rice.
TiO2 was added as colour-masking agent for improved grain appearance, i.e., whiter colour.
The design of formulation 10 was aimed to explore whether high concentrations of folic acid
and iron could be added into the system without adverse effects on grain properties and
nutrient stability.
Table 6.3 Experimental design for preparing folic acid fortified Ultra Rice® formulations
FePP sources FePP (%) TiO2 (%)
Folic acid
(ppm)
Thiamine
(ppm) ZnO (%)
1 Fortitech 3.68
2 Colombian 3.68
3 SunActive 11.04
4 Dr. Paul Lohmann 3.68
5 Dr. Paul Lohmann 2
6 Dr. Paul Lohmann 1
None
7 Dr. Paul Lohmann 3.68 1
8 Dr. Paul Lohmann 3.68 2
300
9 Dr. Paul Lohmann (lower overage)
3.68 300
10 Dr. Paul Lohmann (higher overage)
8.82
None
600
700 0.42
136
6.4.3 Analytical Methods
Folic acid analysis
Before the formulations were developed, viable analytical methods for folic acid were
standardized. The standardized analytical protocols are reported in Appendix 11.3.1.
Two spectrophotometric methods were adapted for folic acid determination. The direct
extraction method was used for salt and sugar samples, while the coupling reaction method
was used for Ultra Rice® samples.
Vitamin A analysis
Vitamin A determination method was adapted from our previous protocol for Ultra Rice®
(Lam, 2006). The Association of Official Analytical Chemists method 43.003 (AOAC
Fourteenth Edition), and Methods of Vitamin A Assays (Parrish, et al., 1985) were used to
develop the extraction procedure of vitamin A from the samples. The vitamin A
concentration in the extract was then determined by spectrofluorometry using an excitation
wavelength of 330 nm, and an emission wavelength of 480 nm. USP Vitamin A Reference
Solutions were used to calibrate the method.
Specifically, ~5 g of the fortified Guatemalan sugar was weighed and saponified in a
solution containing 10 mL of distilled water, 2 mL of potassium hydroxide (50% w/w) and 8
mL of pyrogallol (1%, w/v of 95% ethanol). The process was carried out for 30 minutes at
60°C in a water bath. After cooling, 25 mL of spectrophotometric grade hexane were added
to extract vitamin A from the aqueous solution. The hexane extract was then diluted as
required and the vitamin A was quantitated using a Perkin Elmer Spectrofluorometer in 10
mm matched quartz cuvettes.
Iodine analysis
Iodine content in the Guatemalan double or triple fortified salt was measured using the
titration method described in the previous chapter.
Measurements of physical properties and colour stability

137
Physical properties, e.g., colour stability, of prepared samples were measured visually using
an Intel® PlayTM QX3 Computer Microscope, and using Hunter L*a*b* spectrophotometric
system, as described in the previous chapter.

138
6.5 Results & Discussion
6.5.1 Folic Acid Fortification in Guatemalan Salt and Sugar
Efficiency of various addition methods for sample preparation
Table 6.4 Folic acid (FA) concentration in the final formulations of the Guatemalan fortified salt and sugar samples for storage stability test under 40oC and 60% RH
Guatemalan salt samples
Iodine 42.9 +1.95 ppm
Target FA Conc. (µg/g)
Experimental FA Conc. (µg/g)
Spraying efficiency (%)
FA powder blended in 20 20.4 + 0.2
FA sprayed on – batch 1 20 6.2 + 0.4 31
FA sprayed on – batch 2 100 34.1 + 0.2 34
FA extruded premix 20 19.1 + 1.0
FA spray + Glatt Fe premix 20 10.4 + 0.2 50
FeFum/FA premix 40 37.6 + 0.6
FA sprayed on Canadian blank salt
20 8.0 + 0.2 40
Guatemalan sugar
samples
Vitamin A 16.44 +1.09 ppm
Target FA Conc. (µg/g)
Experimental FA Conc. (µg/g)
Spraying efficiency (%)
FA powder blended in 20 19.1 + 0.3
FA aqueous spray on – batch 1
20 12.5 + 0.6 62
FA aqueous spray on – batch 2
200 111.5 + 1.7 55
FA extruded premix 20 25.1 + 1.9
FA oil spray on – batch 1 20 4.3 + 1.2 23
FA oil spray on – batch 2 200 88.3 + 2.9 44
FeFum/FA premix 40 66.7 + 6.6
FA powder blended in Canadian sugar
200 183.0 + 0.7
Note: the experimental data are mean value ± standard deviation, which were obtained from three or four replicates for each sample measurement.
As shown in Table 6.4, all addition methods except spraying were able to incorporate folic

139
acid into the samples at the expected fortification levels. Several batches of salt and sugar
samples made by the spraying process gained only one third to one half of the originally
designed amount of folic acid, which indicated that the process with the lab-scale rotating
pan lost 40% to 70% of the added folic acid into the atmosphere or on the surface of the pan.
Stability Tests
Six samples of either salt or sugar were prepared and stored at 40oC and 60% RH. Originally
the stability test was designed for 3 months; however, after 3 months storage, the trends of
some nutrient loss were unclear, and the test was thus extended to 9 months.
6.5.1.1. Folic acid stability
As shown in Figures 6.5 and 6.6, folic acid was generally stable in the fortified samples after
9 months storage at high T and RH, with >80% retained in all salt samples and ~75%
retained in all sugar samples except the sample made by spraying folic acid in oil suspension.
Fat oxidation as indicated by rancid smell in this particular sample would have produced
peroxy radicals that could have resulted in folic acid degradation.
Figure 6.5 Folic acid retentions in the fortified Guatemalan salt samples during 9 months storage at 40oC and 60% RH. (Note: the results are the mean values obtained from three or four replicates, and the error bars represent the standard deviations.)
Folic acid stability in Guatemalan iodized salt
0
20
40
60
80
100
1
FA powder
2
FA spray
3
FA premix
4
FA spray +
Glatt Fe
premix
5
FA/FeFum
premix
Control -
Canadian salt
FA spray (no
iodine)
Rel
ativ
e fo
lic
acid
ret
enti
on (
%)
1 month 2 months 3 months 9 months

140
In the control samples, blank Canadian salt and sugar, loss of folic acid was observed only in
sugar (>10%). This suggested that there might be interaction between folic acid and the
sugar grains. This is consistent with the results of Verlinde et al. (2006), who proposed a
non-enzymatic glycation reaction between folic acid and reducing sugars.
Figure 6.6 Folic acid retentions in the fortified Guatemalan sugar samples during 9 months storage at 40oC and 60% RH. (Note: the results are the mean values obtained from three or four replicates, and the error bars represent the standard deviations.)
Among the different incorporation techniques, the addition of folic acid premix prepared by
extrusion showed the best results, with virtually no vitamin loss in either salt or sugar
samples. The direct addition of folic acid either in its powder form or by spraying in water
solution or oil suspension resulted in the most losses of the vitamin, regardless of the food
vehicles used. When incorporated into the encapsulated iron premix and then added into the
food vehicles, the stability of folic acid was affected to some extent, probably due to the
interaction of the active iron compound and/or the colour-masking agent, TiO2, with the
vitamin.
6.5.1.2. Iodine stability in Guatemalan iodized salt
As shown in Figure 6.7, iodine in the original Guatemalan salt was very stable, with ~95%
retained after 9 months storage. The incorporation of folic acid, regardless of the techniques
used, resulted in extra losses of iodine, up to 40%. The best result was obtained in the
Folic acid in Guatemalan vitamin A fortified sugar
0
20
40
60
80
100
1
FA powder
2
FA water spray
3
FA premix
4
FA oil spray
5
FA/FeFum
premix
Control -
Canadian sugar
+ FA powder
(no vit A)
Rel
ativ
e fo
lic
acid
ret
enti
on
(%
)
1 month 2 months 3 months 9 months
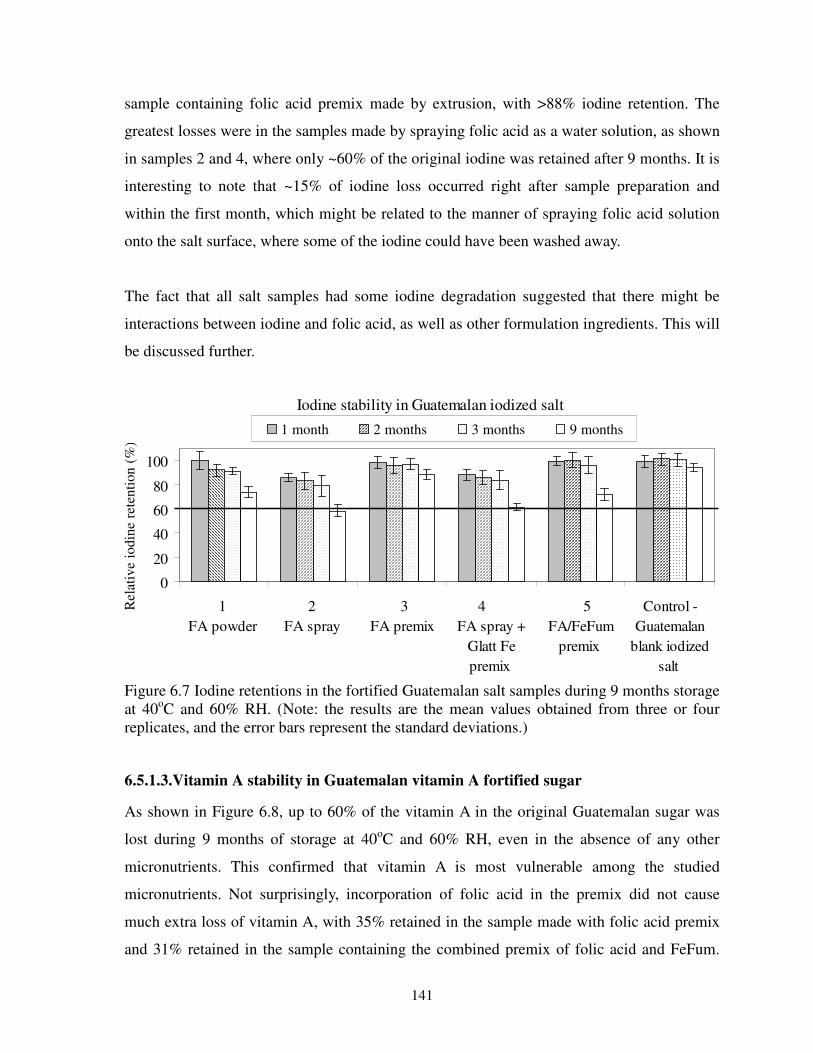
141
sample containing folic acid premix made by extrusion, with >88% iodine retention. The
greatest losses were in the samples made by spraying folic acid as a water solution, as shown
in samples 2 and 4, where only ~60% of the original iodine was retained after 9 months. It is
interesting to note that ~15% of iodine loss occurred right after sample preparation and
within the first month, which might be related to the manner of spraying folic acid solution
onto the salt surface, where some of the iodine could have been washed away.
The fact that all salt samples had some iodine degradation suggested that there might be
interactions between iodine and folic acid, as well as other formulation ingredients. This will
be discussed further.
Figure 6.7 Iodine retentions in the fortified Guatemalan salt samples during 9 months storage at 40oC and 60% RH. (Note: the results are the mean values obtained from three or four replicates, and the error bars represent the standard deviations.)
6.5.1.3.Vitamin A stability in Guatemalan vitamin A fortified sugar
As shown in Figure 6.8, up to 60% of the vitamin A in the original Guatemalan sugar was
lost during 9 months of storage at 40oC and 60% RH, even in the absence of any other
micronutrients. This confirmed that vitamin A is most vulnerable among the studied
micronutrients. Not surprisingly, incorporation of folic acid in the premix did not cause
much extra loss of vitamin A, with 35% retained in the sample made with folic acid premix
and 31% retained in the sample containing the combined premix of folic acid and FeFum.
Iodine stability in Guatemalan iodized salt
0
20
40
60
80
100
1
FA powder
2
FA spray
3
FA premix
4
FA spray +
Glatt Fe
premix
5
FA/FeFum
premix
Control -
Guatemalan
blank iodized
salt
Rel
ativ
e io
din
e re
tenti
on (
%)
1 month 2 months 3 months 9 months

142
The other three samples made by direct addition either as powder or as sprayed solution or
suspension lost additional vitamin A. Particularly, the sample containing folic acid powder
experienced rapid vitamin A degradation within the first three months. It indicated that
reactions might occur between folic acid and vitamin A. The addition of active ingredients,
such as folic acid, accelerated the vitamin A degradation rate to some extent, whereas the
inert agents, including the encapsulated premixes, had little impact on vitamin A stability.
Figure 6.8 Vitamin A retentions in the fortified Guatemalan sugar samples during 9 months storage at 40oC and 60% RH. (Note: the results are the mean values obtained from three or four replicates, and the error bars represent the standard deviations.)
6.5.1.4 Colour Stability
Digital pictures of the salt and sugar samples before and after 3 months storage are presented
in Appendix 11.3.2.
Most salt and sugar samples retained their colour, except the two sugar samples made by
either water spray or oil spray of folic acid, in which the sugar grains became irregular and
tended to stick to each other with rough surface. Both salt and sugar are very hygroscopic.
However, the Guatemalan salt had a smaller particle size than the sugar; thus, it had a much
larger surface area and required higher moisture content to reach the flow moisture point.
When the samples were prepared by spraying the same amount of water solution of folic
acid, the sugar sample was more likely to turn to lumps.
Vitamin A stability in Guatemalan sugar
0
20
40
60
80
100
1
FA powder
2
FA water
spray
3
FA premix
4
FA oil spray
5
FA/FeFum
premix
Control -
Guatemalan
blank vit A
fortified sugar
Rel
ativ
e vit
amin
A r
eten
tio
n (
%)
1 month 2 months 3 months 9 months
143
It is worth noting that folic acid premixes – either made with folic acid alone or incorporated
in the FeFum premix using the process as described before, presented a similar physical
appearance to the salt and sugar grains, which enabled the premixes to fit into the carrier
foods well. This also confirmed that the microencapsulation process discussed in Chapter 4
could be also used for developing other micronutrient delivery systems for food fortification.
6.5.2 Folic Acid Fortification in Multiple Fortified Ultra Rice®
6.5.2.1 Ultra Rice®
appearance and colour stability
The digital pictures of the multiple fortified Ultra Rice® samples are presented in Appendix
11.3.3.
The Ultra Rice® grains made by extrusion could resemble the native rice in terms of shape
and grain size, but lacked the translucent and shiny appearance, subsequently resulting in
darker colour. The addition of folic acid and FePP imparted a yellowish hue to the grains. On
the other hand, the incorporation of TiO2 gave the grains a bright white colour and opaque
texture, due to its very high refractive index.
The visually observed colour differences were also confirmed by the Hunter L*a*b*
measurements. As shown in the Figures 6.9 to 6.12, all samples made with FePP and folic
acid had greater positive b* values, ranging from 18 to 22, than the native rice (17). With the
addition of TiO2 at different levels, this b* value decreased to 12~16, which indicated the
whitener could cover the yellow shade.
Various sources of FePP imparted slightly different colour to the Ultra Rice® grains. As
shown in Figure 6.9, the Colombian FePP gave the lightest colour with the greatest L*
and/or the smallest ∆E*. The sample made with Fortitech FePP had the second lightest
colour. Both micronized FePP forms, from Dr. Paul Lohmann and SunActive, imparted a
greenish hue (smaller a* values) and darker shade (smaller L* values and greater ∆E*) to the
Ultra Rice® grains. After 3 months storage at high T and RH, not surprisingly, all samples
were darker, as indicated by the reduced L* values or increased ∆E* numbers.

144
L* a* b* L* a* b*
Dr. Paul Lohmann 3.68 67.35 1.76 21.42 66.69 1.06 23.92
Fortitech 3.68 68.10 2.11 21.78 68.08 1.66 23.38
Colombian 3.68 68.82 3.18 18.88 67.60 2.60 22.58
SunActive 11.75 65.87 1.21 18.78 65.92 -0.04 20.92
Original t=0 t= 3 monthsFePP source FePP (%)
10.7 10.28.7
11.6
3.5
12.410.9 11.0
12.1
0
3
6
9
12
Dr. Paul
Lohmann
Fortitech Colombian SunActive Blank simulated
rice Inte
gra
ted
co
lou
r d
iffe
ren
ce f
rom
th
e
refe
ren
ce -
nat
ive
rice
t=0 t=3 months
Figure 6.9 Colour stability of the Ultra Rice® grains made with various FePP sources
L* a* b* L* a* b*
1 71.97 0.96 19.71 70.38 0.78 21.00
2 70.93 2.23 21.14 70.80 1.79 21.16
3.68 67.35 1.76 21.42 66.69 1.06 23.92
Control - Native rice 77.37 2.03 17.06
Control - Blank
simulated rice 75.76 0.51 14.87
Original t=0
Dr. Paul Lohmann
t= 3 months
None
FePP source FePP (%)
5.97.4
10.7
3.5
7.9 7.5
12.4
0
3
6
9
12
FePP 1% FePP 2% FePP 3.68% Blank simulated
riceInte
gra
ted
colo
ur
dif
fere
nce
fro
m
the
refe
ren
ce -
Nati
ve
rice
t=0 t=3 months
Figure 6.10 Colour stability in the Ultra Rice® grains made with Dr. Paul Lohmann FePP at different addition levels

145
L* a* b* L* a* b*
None 67.35 1.76 21.42 66.69 1.06 23.92
1 74.97 0.36 15.92 78.70 0.05 16.72
2 78.24 -0.06 14.12 79.86 -0.33 14.66
3 78.55 -0.36 12.80 79.92 -0.58 12.98
Control - Native rice 77.37 2.03 17.06
Control - Blank
simulated rice 75.76 0.51 14.87
None
t= 3 monthsOriginal t=0
Dr. Paul Lohmann
3.68%
FePP source TiO2 (%)
10.7
3.44.2
5.5
3.5
12.4
2.5
4.55.9
0
3
6
9
12
None TiO2 1% TiO2 2% TiO2 3% Blank simulated
rice
Inte
grate
d c
olo
ur d
iffe
ren
ce
fro
m t
he
ref
ere
nce
- N
ati
ve r
ice t=0 t=3 months
Figure 6.11 Colour stability of Ultra Rice® grains with addition of TiO2 as the colour-masking agent at different levels
L* a* b* L* a* b*
Higher overage 300 3.68 60.91 2.99 22.38 59.37 2.66 22.53
Lower overage 600 8.82 66.22 2.24 21.73 66.30 2.01 22.57
Control - Native rice 77.37 2.03 17.06
Control - Blank
simulated rice 75.76 0.51 14.87
None None
Original t=0 t= 3 monthsFolic acid
(ppm)
Lohmann
FePP (%)
17.2
11.9
3.5
18.7
12.1
0
5
10
15
20
Higher overage Lower overage Control - blank simulated
rice
Inte
grate
d c
olo
ur
dif
feren
ce
fro
m t
he
refe
ren
ce -
Nati
ve
rice t=0 t=3 months
Figure 6.12 Colour stability of Ultra Rice® grains made with higher levels of folic acid and FePP

146
As indicated by Figure 6.10, increased addition levels of FePP resulted in more pronounced
colour changes in the Ultra Rice® grains. With 1% FePP from Dr. Paul Lohmann in the
formulation the Ultra Rice® grains were closer in colour to rice, while an increase in iron
content caused darker colours to develop, especially the sample containing 3.68% of the iron
compound had a greatly reduced L* value and/or increased ∆E* value. Again, storage over 3
months darkened the grains.
The effect of TiO2 on colour was promising. As shown in Figure 6.11, improvements in the
lightness were observed in the samples containing different levels of TiO2, as indicated by
greatly increased L* values. Also, the grain chromaticity was likely to shift from red to green
(with reduced a* values) and from yellow to blue (with reduced b* values). This trend was
further enhanced by the increase in the addition level of TiO2 up to 3%. However, when
looking into the integrated colour difference - ∆E* value, it is found that the increase in the
TiO2 addition level did not always cause positive effects. Actually the addition of 3% TiO2 in
the formulation resulted in a sample with much higher ∆E* value from the reference – the
native rice, compared to the sample made with 1% TiO2. This was confirmed by visual
observation (Appendix 11.3.3): the sample containing 3% TiO2 was totally opaque and
eliminated the semi-translucent pearlescence seen in the native rice and the original Ultra
Rice® grains. Overall, grains with 1% of TiO2 had the smallest difference ∆E* value.
Interestingly, this ∆E* value was further improved after storage, indicating the sample
looked more natural after storage, in contrast to the observations of all other samples in the
study.
As seen in Figure 6.12, increased additions of both FePP and folic acid resulted in much
darker grain colours, which deteriorated further during storage.

147
6.5.2.2 Folic acid stability
Folic acid retention in these samples was followed for three months. As indicated in Table
6.5, the vitamin was stable with >80% folic acid retained in all rice formulations. The
samples made with the two micronized FePPs retained slightly more folic acid. The addition
levels of the iron compound had the expected effect of reducing folic acid stability - with
more vitamin retained in the formulation containing less iron. Nevertheless, all samples
containing 1% to 3.68% of the iron could retain >90% of the original folic acid, regardless of
the iron source used. Surprisingly, the incorporation of TiO2 at 2% in the formulation seemed
to have an adverse impact on folic acid stability, resulting in >13% loss of the vitamin after 3
months storage. This may be related to the light sensitivity of folic acid. TiO2, as indicated in
the literature with a photocatalytic effect (Hashimoto, et al., 2005), might speed up the
vitamin degradation.
Table 6.5 Folic acid retention in the Ultra Rice® samples made with various FePP sources and at different addition levels
Folic acid relative retention (%) Formulation variations
1 month 2 months 3 months
1 Fortitech 3.68% 98.8 ± 1.4 93.4 ± 1.8 93.1 ± 1.5
2 Colombian 3.68% 101.6 ± 2.2 99.8 ± 4.5 93.1 ± 4.8
3 SunActive 11.04% 101.5 ± 1.2 96.9 ± 2.2 98.2 ± 1.6
4 Dr. Paul Lohmann 3.68% 97.9 ± 3.1 95.7 ± 1.9 96.6 ± 2.0
5 Dr. Paul Lohmann 2% 96.3 ± 1.6 98.0 ± 2.3 96.4 ± 4.2
6 Dr. Paul Lohmann 1% 99.7 ± 2.9 101.3 ± 2.4 100.2 ± 1.6
7 Dr. Paul Lohmann 3.68% + TiO2 1% 98.5 ± 2.5 95.3 ± 1.9 93.5 ± 4.3
8 Dr. Paul Lohmann 3.68% + TiO2 2% 94.3 ± 1.4 92.8 ± 1.8 87.4 ± 2.5
9 Dr. Paul Lohmann (lower overage) 102.1 ± 2.4 93.9 ± 2.1 91.8 ± 6.0
10 Dr. Paul Lohmann (higher overage) 92.1 ± 2.0 90.7 ± 1.1 82.3 ± 8.9
Note: the results are reported as mean value ± standard deviation, which were obtained from three or four replicates for each sample measurement.

148
6.5.3 Interactions of Folic Acid with Other Micronutrients
As discussed earlier in reference to Guatemalan salt and sugar samples, folic acid was
generally stable when incorporated into salt, and there was no apparent interaction between
folic acid and salt. The early results from an ongoing study in our research group seemed to
confirm this observation. When folic acid was added into potassium iodate solution and
sprayed together onto iodized salt, there was no obvious loss of folic acid after one month
(Zheng & Saunders, 2008). However, when folic acid was sprayed on sugar, it seemed less
stable, perhaps due to non-enzymatic glycation of folic acid by reducing sugars as reported
by Verlinde et al. (2006).
The potential interactions between added micronutrients were examined. In salt samples,
increased iodine losses were associated with greater losses of folic acid, particularly in the
samples made with folic acid added as a powder or by sprayed on. However, there was no
clear trend attributable to the different addition techniques. The data were inconclusive and
we will not have a clear understanding of the nature and extent of interactions until a current
parallel study is completed.
A clearer picture of interaction between vitamin A and folic acid in the sugar samples was
observed. Vitamin A losses were correlated with losses of folic acid, irrespective of the
techniques used to prepare the samples. However, this correlation was not strong enough to
establish a casual relationship. The literature indicates that vitamin A degradation products
may react with amino acids (Kim, et al. 2000), whereas folic acid contains a glutamate
moiety. However, there has been no explanation as to how this reaction may affect vitamin A
stability.
Based on these results, it seems prudent to incorporate folic acid into salt or sugar as a
separate premix, since this resulted in improved folic acid stability and unaffected iodine and
vitamin A stability. The addition of folic acid by incorporating it into the encapsulated
FeFum premix to achieve triple fortified foods, such as salt simultaneously fortified with
iodine, iron, and folic acid is also promising. In this series of tests, folic acid was added to
TiO2 in the colour-masking step. The vitamin stability was decreased somewhat by TiO2

149
possibly due to the photocatalytic effect.
Folic acid was generally stable in multiple fortified Ultra Rice®. There were no apparent
interactions between folic acid and other formulation ingredients, including FePP and
antioxidants. However, the addition of the colour-masking agent, TiO2, at 2%, seemed to
interfere with the vitamin. Again, this may be due to the light instability of folic acid and the
photocatalytic effect of TiO2. At 1% TiO2, the sample retained folic acid well and the grain
colour was improved.

150
6.6 Summary of Research Approach 3
1. The storage tests have shown that folic acid was generally stable in the three fortified
foods studied: iodized salt, vitamin A fortified sugar, and iron fortified Ultra Rice®. After
3 months storage, >90% of the added vitamin was retained in most rice samples, >80%
were retained in most salt samples, and ~75% in most sugar samples after 9 months
storage at high T and RH.
2. The incorporation technique had a pronounced impact on the stability of folic acid as
well as the other added micronutrients. The best results were obtained when folic acid
was incorporated as a separate premix, which protected the vitamin and prevented the
interactions with other micronutrients present in the systems. Specifically, there was
virtually no folic acid loss when the vitamin was added to the salt and sugar samples in
the form of a single extruded premix even after 9 months storage at 40oC and 60% RH.
3. Examination of interactions between folic acid and the delivery systems revealed that
salt and rice flour-based matrices did not react with the vitamin, while it may have
reacted with reducing sugars through a non-enzymatic glycation in sugar samples.
Therefore, salt and rice were confirmed as suitable food vehicles for folic acid
fortification.
4. In some salt samples, folic acid might react with iodine, resulting in losses of both
nutrients. A parallel study in our research group will explore this further. Some
interaction between folic acid and vitamin A was observed in sugar samples as well as
between folic acid and TiO2 in the rice system.
5. This part of work has also confirmed that extrusion followed by polymer coating is a
feasible microencapsulation technology for making various delivery systems containing
selected micronutrients. In addition, it backs up the hypothesis that proper encapsulation
may be needed to ensure the stability in foods fortified with multiple nutrients.
Recommended future work:
1. Based on the promising results from this part of work, it is recommended that detailed
studies on formulation design and process development for salt double or triple fortified
with iodine, iron, and folic acid should be initiated.
2. The interactions between the added micronutrients should be explored further.

151
3. Adding folic acid through the industrial salt iodization process seems promising and
should be pilot tested. As no extra equipment or salt processing is required, the effective
formulation and process developed could be readily incorporated into the universal salt
iodization program to bring immediate human health benefits.
152
7 CONCLUSIONS
A microencapsualtion-based technology platform for the effective delivery of micronutrients
has been developed. The applicability of the technology has been demonstarted in typical
staple foods: salt, sugar, and rice. The process is comprised of agglomeration by extrusion
followed by colour-masking and encapsulation by polymer coating. With appropriate
combinations of different unit operations, this flexible technology platform is adaptable to
broader applications, not only in food fortification, but also in active ingredient delivery in
functional foods, oral drugs, and agrochemicals.
As summarized in the individual chapters, the developed micronutrient delivery systems
based on this technology platform was effective in multiple fortification of staple foods on
three size scales, fulfilling the overall objective of the program. The demonstrated delivery
systems - microencapsulated folic acid, iron premix, and Ultra Rice® - could be used as
model systems for delivering other active ingredients, which could preserve micronutrients
and deliver them to the body in a form that is organoleptically acceptable, and is essentially
transparent to the consumer.
1. Processes based on extrusion agglomeration and surface coatings could produce
premixes containing one or more active ingredients in a wide range of particle sizes,
with surface appearance and organoleptic properties that will be indistinguishable to the
average consumer. This microencapsulation-based approach was found to be effective in
retaining the nutritional value or bioavailability of the added micronutrients,
independently of their reactivity or sensitivity to environmental effects such as light,
heat, oxygen.
2. Salt double fortified with iodine and iron using the microencapsulated FeFum premix
made by the extrusion-based agglomeration process had the desired sensory properties
and was stable for up to a year.
3. Reconstituted Ultra Rice® grains made by extrusion incorporating internal gelation
resulted in improved grain integrity and a much simplified process. Extrusion and

153
internal gelation of Ca and alginate promises to be a suitable technology for protecting
micronutrients and other active ingredients on a 1-10 mm scale.
4. It is feasible to incorporate folic acid into the existing fortification programs using the
microencapsulation technology platform developed in this study. The results indicate
that folic acid fortification in conjunction with industrial salt iodization processes should
be readily commercialized.
The positive results warrant further examination of this approach, with a vision to achieve
commercially viable solutions to active ingredient delivery. Specific opportunities are
presented in the following recommendations.
Specific contributions to the scientific field include:
1. The study confirms that microencapsulation is a promising technology in developing
stable delivery systems of active ingredients, in principle, by the formation of physical
barriers and further blocking mass transfer of the added components within the system.
This was demonstrated with the reduced interaction between iodine and iron in the stable
DFS samples made with optimized, microencapsulated FeFum premix.
2. The study suggests that controlled in-situ gelation between alginate and calcium can be
achieved within a semi-solid rice starch matrix through extrusion. This evidence greatly
advances the knowledge in this field and opens up opportunities for broader applications.
3. Through investigating the developed microencapsulation-based technology platform in
the application of food fortification, the study enhances understandings of the
interactions between the added components and the food carriers, which will allow us to
develop more stable delivery systems for food fortification.
4. A quick measurement for assessing the reconstituted rice grain integrity during soaking
and cooking was developed. This method can be used as an indirect assessment of the
gel formation within the semi-solid starch matrix.
In addition to the above contributions to the scientific field, the study resulted in the
development of successful technologies/processes for food fortification, which are expected
to bring immediate benefits in human health and social development.

154
8 RECOMMENDATIONS
The processes and stable formulations developed in this program are ready for testing on a
larger scale. On our suggestion, PATH initiated a commercial scale test using our
recommended internal gelation systems for producing Ultra Rice® in Brazil.
The incorporation of folic acid fortification into current salt iodization technology seems
feasible and should be tested in a small salt plant, once the current long-term stability tests
are completed.
The field tests of microencapsulating ferrous fumarate using the optimized process and
formulation obtained from the study have been initiated in India. The initial results were
inconclusive, due to the unavailability of the right equipment (Diosady, 2008). The
economical feasibility of using the advanced technologies in the current fortification
programs should be examined once the pilot-scale trials are completed.
The microencapsulation-based technology platform developed in the study should be
extended to other applications. To extend current fortification programs, vitamin A should be
incorporated into the existing stable formulations for both salt and rice fortification. Previous
attempts to make a single premix containing both vitamin A and iron for salt triple
fortification should be re-examined using the advances made in this study. Specifically,
vitamin A could be incorporated by mixing it into either hydrophilic glassy polymers or lipid
coating materials. As depicted in Figure 8.1, an extruded ferrous fumarate core should be
partially or completely colour masked with ZnO. Vitamin A should be incorporated into
selected coating materials and sprayed on the core. With careful formulation design, the
resulting particles are expected to effectively deliver two or three micronutrients, which then
can be blended into iodized salt to form triple or multiple fortified salt.
Ultra Rice® premix which contains vitamin A, iron, and B vitamins should be tested. As
depicted in Figure 8.2, the internal gelation system can be used to carry the iron (e.g., FePP)
and B vitamins. The grains can be further encapsulated using either hydrophilic polymers or
lipids for delivering vitamin A and antioxidants. Alternatively, as shown in Figure 8.3, the

155
potential interactions between the acidic antioxidants with the internal gelation system could
be prevented through the use of the salt forms of the acidic antioxidants or through
microencapsulating one or more of the active ingredients prior to extrusion and Ca/alginate
cross-linking. This approach should be explored further.
Figure 8.1 Model premix system for salt fortification made by the extrusion agglomeration followed by polymer coating, containing multiple micronutrients such as iron, zinc, and vitamin A
Figure 8.2 Model Ultra Rice® premix made by extrusion using internal gelation and followed by polymer coatings for delivering multiple micronutrients including iron and vitamin A
Ferrous fumarate particle
Binders
Polymer coatings with vitamin A
Colour-masking layer with
TiO2 or ZnO
Alginate-calcium network throughout the
grain
Rice starch granule
Polymer coatings with
vitamin A and
antioxidants
Iron particles

156
Figure 8.3 Model Ultra Rice® premix made by extrusion using internal gelation, containing sub-capsules of microencapsulated premixes of iron and vitamin A made by extrusion-based technology platform
In summary, the results of this thesis work are very promising, and should be tested on a
series of systems used to deliver one or more reactive ingredients through food and other
matrices.
7~10 mm
Iron premix made by extrusion & coating (300~500 µm)
Alginate-calcium network throughout the grain
Rice starch granule (5 µm)
Vitamin A premix made by extrusion (300~500 µm) containing antioxidants
2 mm
157
9 REFERENCES
1. Adamiec, J., Marciniak, E., (2004) Microencapsulation of oil/matrix/water system during spray drying process, Drying 2004-Proceedings of the 14th International Drying Symposium, Sao Paulo, Brazil, vol. C, pp 2043-2050.
2. Akhtar, M. J., Khan, M. A., Ahmad, I. (1999) Photodegradation of folic acid in aqueous solution. Journal of Pharmaceutical and Biomedical Analysis, 25: 269–275.
3. Akhtar, M. J., Khan, M. A., Ahmad, I. (2003) Identification of photoproducts of folic acid and its degradation pathways in aqueous solution. Journal of Pharmaceutical and
Biomedical Analysis, 31: 579-588. 4. Albala-Hurtado, S., Veciana-Nogues, M. T., Vidal-Carou, M. C., Marine-Font, A. (2000)
Stability of vitamins A, E, and B complex in infant milks claimed to have equal final composition in liquid and powdered form. Journal of Food Science, 65(6): 1052-1055.
5. Andersson, M., Thankachan, P., Muthayya, S., Goud, B. R., Kurpad, A. V., Hurrell, R. F., Zimmermann, M. B. (2008) Dual fortification of salt with iodine and iron: a randomized, double blind, controlled trial in southern India of micronized ferric pyrophosphate and encapsulated ferrous fumarate. Manuscript under review by American Journal of
Clinical Nutrition. 6. Bailey, L. B., Rampersaud, G. C., Kauwell, G. P. (2003) Folic acid supplements and
fortification affect the risk for neural tube defects, vascular disease and cancer: Evolving science. Journal of Nutrition, 133: 1961S-1968S.
7. Ball, G. F. M. (2006) Vitamins in foods: Analysis, bioavailability, and stability. CRC Taylor & Francis Group, Boca Raton, FL.
8. Barquin, A. (2006) Investigation of MethocelTM E3 and KollicoatTM IR White as iron premix microencapsulants. Internal report, University of Toronto, unpublished.
9. Benita, S. (1996) (editor) Microencapsulation methods and industrial applications. Marcel Dekker, Inc., New York.
10. Berner, L. A., Hood, L. F. (1983) Iron binding by sodium alginate. Journal of Food
Science, 48:755-758. 11. Berry, R. J., Li, Z., Erickson, J. D., Li, S., Moore, C. A., Wang, H., Mulinare, J. (1999)
Prevention of neural tube defects with folic acid in China. In: China-U.S. Collaborative Project for Neural Tube Defect Prevention. New England Journal of Medicine, 341: 1485-1490.
12. Bhandari, B., D’Arcy, B. R., Young, G. (2001) Flavour retention during high temperature short time extrusion cooking process: a review. International Journal of
Food Science & Technology, 36: 453-461. 13. Bonner, G., Warwick, H., Barnardo, M., Lobstein, T. (1999) Fortification examined,
How added nutrients can undermine good nutrition, A survey of 260 food products with added vitamins and minerals. The Food Commission Ltd., UK.
14. Bu, H., Anna-Lena, K., Bo, N. (2005) Effects of pH on dynamics and rheology during association and gelation via the Ugi reaction of aqueous alginate. European Polymer
Journal, 41(8):1708-1717. 15. Buttriss, J. (2005) Strategies designed to increase awareness about folates and health,
and to increase folate intake: A review. Trends in Food Science and Technology, 16: 246-252.
16. Carafa, M., Marianecci, C., Lucania, G., Marchei, E., Santucci, E. (2004) New vesicular

158
ampicillin-loaded delivery systems for topical application: characterization, in vitro permeation experiments and antimicrobial activity. Journal of Controlled Release, 95: 67– 74.
17. Castilla, E. E., Orioli, I. M., Lopez-Camelo, J. S., Dutra, M. D., Nazer-Herrera, J. (2003) Preliminary data on changes in neural tube defect prevalence rates after folic acid fortification in south America. American Journal of Medical Genetics Part A, 123A(2): 123-128.
18. Caudill, M. A., Le, T., Moonie, S. A., Esfahani, S. T., Cogger, E. A. (2001) Folate status in women of childbearing age residing in Southern California after folic acid fortification. Journal of the American College of Nutrition, 20(2): 129-134.
19. Caudill, M. (2004) The role of folate in reducing chronic and developmental disease risk: An overview. Journal of Food Science, 69(1): SNQ55-59.
20. Chen, W., Lu, D.R. (1999) Carboplatin-loaded PLGA microspheres for intracerebral injection: formulation and characterization. Journal of Microencapsulation, 16: 551-563.
21. Cho, S., Johnson, G., Song, W. O. (2002) Folate Content of Foods: Comparison between databases complied before and after new FDA fortification requirements. Journal of
Food Composition and Analysis, 15: 293-307. 22. Choi, S-W., Manson, J. B. (2002) Folate and carcinogenesis: an integrated scheme.
Journal of Nutrition, 130: 129-132. 23. Choumenkovitch, S. F., Selhub, J., Wilson, P. W. F., Rader, J. I., Rosenberg, I. H.,
Jacques, P. F. (2002) Folic acid intake from fortification in United States exceeds predictions. Journal of Nutrition, 132: 2792-8.
24. Choumenkovitch, S. F., Jacques, P. F., Nadeau, M. R., Wilson, P. W. F., Rosenberg, I. H., Selhub, J. (2001) Folic acid fortification increases red blood cell folate concentrations in the Framingham Study. Journal of Nutrition, 131 (12): 3277-3280.
25. Clark, J. P. (2002) Food encapsulation: capturing one substance by another. Food
Technology, 56(11): 63-64, IFT Institute of Food Technologists. 26. Cleland, J. L., Lim, A., Barron, L., Duenas, E. T., Powell, M. F. (1997) Development of
a single-shot subunit vaccine for HIV-1: part 4. Optimizing microencapsulation and pilsatile release of MN rgp120 from biodegradable microspheres. Journal of Controlled
Release, 47: 135-150. 27. Clydesdale, F. M., Weimer, K. L. (1995) (editors), Food Science and Technology: A
Series of Monographs, Iron Fortification of Foods. Academic Press Inc., Harcourt brace Jovanovich, Pub, 1985, pp 1-176.
28. Cuskelly, G. J., McNulty, H., Scott, J. M. (1999) Fortification with low amounts of folic acid makes a significant difference in folate status in young women: implications for the prevention of neural tube defects. American Journal of Clinical Nutrition, 70(2): 234-239.
29. de Jong, R. J., Verwei, M., West, C. E., van Vliet, T., Siebelink, E., van den Berg, H., Castenmiller, J. J. M. (2005) Bioavailability of folic acid from fortified pasteurised and UHT-treated milk in humans. European Journal of Clinical Nutrition, 59: 906-913.
30. Deshpande, S. S., Bhattacharya, K. R. (1982) Research note – The texture of cooked rice. Journal of Texture Studies, 13:31-42.
31. De Wals, P.; Rusen, I. D.; Lee, N. S.; Morin, P.; Niyonsenga, T. (2003) Trend in prevalence of neural tube defects in Quebec. Birth Defects Research Part A-Clinical and
Molecular Teratology, 67(11): 919-923.

159
32. Department of Health and Human Service, Public Health Service (DHHS/PHS), (1992) Recommendations for the use of folic acid to reduce the number of cases of spina bifida and other neural tube defects. M. M. W. R. 41 (No. RR-14), 1-7.
33. Desai, K.G. H. (2005) Preparation and characteristics of high-amylose corn starch/pectin blend microparticles: a technical note. AAPS PharmaSciTech, 6(2):E202-E208.
34. Desai, K.G. H., Park, H. J. (2005a) Recent developments in microencapsulation of food ingredients. Drying Technology, 23:1361-1394.
35. Desai, K.G. H., Park, H. J. (2005b) Encapsulation of vitamin C in tripolyphosphate cross-linked chitosan microspheres by spray drying. Journal of Microencapsulation, 22: 179-192.
36. Dietrich, M., Brown, C. J. P., Block, G. (2005) The effect of folate fortification of cereal-grain products on blood folate status, dietary folate intake, and dietary folate sources among adult non-supplement users in the United States. Journal of the American
College of Nutrition, 24(4): 266-274. 37. Dingler, A., Blum, R. P., Niehus, H., Muller, R. H., Gohla, S. (1999) Solid lipid
nanoparticles (SLNTM/LipopearlsTM) a pharmaceutical and cosmetic carrier for the application of vitamin E in dermal products. Journal of Microencapsulation, 16: 751-767.
38. Diosady, L. L., Alberti, J. O., Ramcharan, K., Venkatesh Mannar, M.G. (2002) Iodine stability in salt double fortified with iron and iodine. Food and Nutrition Bulletin, 23: 196-207.
39. Diosady, L. L., Oshinowo, T., Venkatesh, M. G. V. (2004) Scale-up of production of salt double fortified with iodine and iron. Presentation abstract Th45, In Report of the
2004 international nutritional anemia consultative group symposium - Iron deficiency in early life: challenges and progress, Lima, Peru, 18 Nov 2004.
40. Diosady, L. L. (2008) Preliminary report on pilot testing of extrusion-based iron premix production for double fortified salt. Unpublished report to MI.
41. Diosady, L. L., Li, O. Y. (2008) Ultra Rice® process and product refinement - Phase II Interim Report. Unpublished report to PATH.
42. Douglas, M., Considine, P. E. (1982) Colourants in Food and Food Production Encyclopedia. Van Nostrand Reinhold Co., US.
43. Dowling, D., Atmospheric plasma research at UCD, website: www.cvdireland.com/members/Dowling.pdf
44. Draget, K. I. (2000) Alginates. In: Handbook of hydrocolloids, Edited by Phillips, G. O., and Williams, P. A. CRC Press, Boca Raton, FL. pp. 379–395.
45. Draget, K.I., Estgaard, K., Smidsrød, O. (1991) Homogeneous alginate gels; a technical approach. Carbohydrate Polymers, 14:159-178.
46. Draget, K. I., Smidsrød, O., Skjak-Bræk, G. (2005) Alginates from Algae. In: Polysaccharides and polyamides in the food industry – Properties, production, and patents. Edited by Steinbüchel, A., and Rhee, S. K. Wiley-VCH Verlag GmbH & Co. KgaA, Weinheim. Pp. 1-22.
47. Fang, Y., Al-Assaf, S., Phillips, G. O., Funami, K. T., Williams, P. A., Li, L. (2007) Multiple steps and critical behaviours of the binding of calcium to alginate. Journal of
Physical Chemistry B, 111: 2456-2462. 48. Fenech, M., Aitken, C., Rinaldi, J. (1998) Folate, vitamin B12, homocysteine status and
DNA damage in young Australian adults. Carcinogenesis, 19(7): 1163-71. 49. Finglas, P. M., de Meer, K., Molloy, A., Verhoef, P., Pietrzik, K., Powers, H. J., van der

160
Straeten, D., Jagerstad, M., Varela-Moreiras, G., van Vliet, T., Havenaar, R., Buttriss, J., Wright, A. J. A. (2006) Research goals for folate and related B vitamin in Europe. European Journal of Clinical Nutrition, 60: 287-294.
50. FMC Technical Brochure: Alginates. FMC Biopolymer Corporation, 2003. 51. Food and Drug Administrative (FDA), USA (1996) Food Standards: Amendment of
standards of identity for enriched grain products to require addition of folic acid. Fed
Register 61(44): 8781-97. 52. FAO (1995) Food and Nutrition Paper, Food fortification: Technology and quality
control. Report of an FAO technical meeting, Rome, Italy, Nov. 1995. 53. Forbes, A. L., Adams, C. E., Arnaud, M. J., Chichester, C. O., Cook, J. D., Harrison, B.
N., Hurrell, R. F., Kahn, S. G., Morris, E. R., Tanner, J. T., Whittaker, P. (1989) Comparison of In vitro, Animal, and Clinical Determinations of Iron Bioavailability - International-Nutritional-Anemia Consultative-Group-Task-Force Report on Iron Bioavailability. American Journal of Clinical Nutrition, 49: 225–38.
54. Francis, F. J. (1999) (Editor): Wiley Encyclopedia of Food Science and Technology (2nd Edition) Volumes 1-4, John Wiley & Sons, pp 2478-2486.
55. French, M. R.; Barr, S. I.; Levy-Milne, Y. (2003) Folate intakes and awareness of folate to prevent neural tube defects: A survey of women living in Vancouver, Canada. Journal
of the American Dietetic Association, 103(2): 181-185. 56. Genta, I., Perugini, P., Pavanetto, F., Maculotti, K., Modena., T., Casado, B., Lupi, A.,
Iadarola, P., Conita, B. (2001) Enzyme loaded biodegradable microspheres in vitro ex vivo evaluation. Journal of Controlled Release, 77: 287-295.
57. Ghasemi, J., Vosough, M. (2002) Simultaneous spectrophotometric determination of folic acid, thiamin, riboflavin, and pyridoxal using partial least-squares regression method. Spectroscopy Letters, 35(2): 153-169.
58. Gibbs, B. F., Kermasha, S., Alli, I., Mulligan, C. N. (1999) Encapsulation in the food industry: a review. International Journal of Food Science and Nutrition, 50: 213-224.
59. Glatt website < http://www.glatt-weimar.de/e/01_technologien/01_04_08.htm>. 60. Gouin, S. (2004) Microencapsulation: industrial appraisal of existing technologies and
trends. Trends in Food Science and Technology, 15: 330-347. 61. Gregory J. F. (2004) Dietary folate in a changing environment: Bioavailability,
fortification, and requirements. Journal of Food Science, 69(1): SNQ59-60. 62. Gregory, J. F. (1997) Bioavailability of folate. European Journal of Clinical Nutrition,
51: 554-559. 63. Grosse, S. D., Hopkins, D. P., Mulinare, J., Llanos, A., Hertrampf, E. (2006) Folic acid
fortification and birth defects prevention: lessons from the Americas. Agro Food
Industry Hi-Tech, 17(2): 50-52. 64. Guignon, B., Duquenoy, A., Dumoulin, E. D. (2002) Fluid bed encapsulation of
particles: Principles and practice, Drying Technology, 20(2): 419-447. 65. Gujska, E., Majewska, K. (2005) Effect of baking process on added folic acid and
endogenous folates stability in wheat and rye breads. Plant Foods for Human Nutrition, 60: 37-42.
66. Guy, R. (2002) (Editor), Extrusion Cooking. Technologies and Applications, CRC Press Inc., Woodhead Publishing Limited, Cambridge, England.
67. Hanus, M. J., Langrish, T. A. G. (2007) Resuspension of wall deposites in spray dryers. Journal of Zhejiang University SCIENCE A, 8(11): 1762-1774.
68. Hao, T., McKeever, U., Hedley, M.L. (2001) Biological potency of microsphere

161
encapsulated plasmid DNA. Journal of Controlled Release, 69: 249-259. 69. Hart, B. (1997) Technology and food production. Nutrition and Food Science, 2:53-57. 70. Harvey, A. E. Jr., Smart, J. A., Amis, E. S. (1955) Simultaneous spectrophotometric
determination of Iron (II) and total iron with 1, 10-phenanthroline. Analytical Chemistry, 27: 1-8.
71. Hashimoto, K., Irie, H., Fujishima, A. (2005) TiO2 Photocatalysis: A historical overview and future prospects. Japanese Journal of Applied Physics, 44: 8269-8285.
72. Hertrampf, E., Cortes, F. (2004) Folic acid fortification of wheat flour: Chile. Nutrition
Reviews, 62(6): S44-S48. 73. Hertrampf, E., Cortes, F., Erickson, J. D., Cayazzo, M., Freire, W., Bailey, L. B.,
Howson, C., Kauwell, G. P. A., Pfeiffer, C. (2003) Consumption of folic acid-fortified bread improves folate status in women of reproductive age in Chile. Journal of Nutrition, 133(10): 3166-3169.
74. Hills, B. P., Godward, J., Debatty, M., Barras, L., Saturio, C. P., Ouwerx, C. (2000) NMR studies of calcium induced alginate gelation, Part II, The internal bead structure. Magnetic Resonance in Chemistry, 38:719-728.
75. Hui, Y. H. (2006) Handbook of Food Science, Technology and Engineering. Boca Raton: CRC Press, 2006.
76. Hurrell, R. F. (1999) (Editor) Iron. In: The Mineral Fortification of Foods. Leatherhead Publishing, Surrey, UK, pp 54-93.
77. Hurrell, R. F. (2002) Fortification: overcoming technical and practical barriers. Journal
of Nutrition, 132: 806S-812S. 78. Hutchings, B. L., Stokstad, E. L. R., Boothe, J. H., Mowat, J. H., Waller, C. W., Angier,
R. B., Semb, J., Subbarow, Y. (1947) A chemical method for the determination of pteroylglutamic acid and related compounds. The Journal of Biological Chemistry, 168: 705-710.
79. IVACG (1998) International Vitamin A Consultative Group - statement: vitamin A and iron interactions. Washington DC: ILSI Research Foundation.
80. ISP Technical User Guide: Alginates in Foods, International Specialty Products (ISP), 2006.
81. IUPAC (1997), International Union of Pure and Applied Chemistry, access online through <http://www.iupac.org/publications/compendium/> on Oct 9, 2008.
82. IUPAC-IUB Joint Commission on Biochemical Nomenclature (JCBN), International Union of Pure and Applied Chemistry and International Union of Biochemistry and Molecular Biology, Nomenclature and symbols for folic acid and related compounds, accessed through <http://www.chem.qmul.ac.uk/iupac/misc/folic.html> on Oct 13, 2008.
83. Jimenez-Alvarado, R. (2005) Iron double emulsion stabilization, 2005 IFT (Institute of Food Technologists) Annual Meeting, New Orleans, Louisiana, USA.
84. Johnson, Q., Mannar, V., Ranum, P. (2004) Fortification handbook – vitamin and mineral fortification of wheat flour and maize meal. MI manual, accessed on Nov. 10, 2008 at <http://www.sph.emory.edu/wheatflour/KEYDOCS/MI_Fort_handbook.pdf>.
85. Juliano, B. O. (1993) Rice in Human Nutrition. FAO/IRRI, FAO Food and Nutrition Series No. 26, FAO, Rome.
86. Juliano, B. O., Perez, C. M., Barber, S. R., Blakeney, A. B., Iwasaki, T. A., Ya, N. S., Keneaster, K. K., Chung, S. M., Laignelet, B., Launay, B., Delmundo, A. M., Suzuki, H., Shiki, J., Tsuji, S., Tokoyama, J., Tatsumi, K., Webb, B. D. (1981) International

162
cooperative comparison of instrument methods for cooked rice texture. Journal of
Texture Studies, 12:17-38. 87. Kamen, B. (1997) Folate and antifolate pharmacology. Seminars in oncology, 24(5
Suppl 18): S18-30-S18-39. 88. Khairou, K. S., Al-Gethami, W. M., Hassan, R. M. (2002) Kinetics and mechanism of
sol–gel transformation between sodium alginate polyelectrolyte and some heavy divalent metal ions with formation of capillary structure polymembranes ionotropic gels. Journal of Membrane Science 209: 445–456.
89. Kim Y-S, Strand E, Dickmann R, Warthesen J. (2000) Degradation of vitamin A palmitate in corn flakes during storage. Journal of Food Science, 65(7): 1216–1219.
90. Kirby, C.J. (1991) Microencapsulation and controlled delivery of food ingredients. Food
Science and Technology, 5: 74-78. 91. Kshirsagar, N. A. (2000) Drug delivery systems. Indian Journal of Pharmacology, 32:
S54-S61. 92. Kulp, K., Ponte, J. G. Jr. (2002) (Editor), Handbook of Cereal Science and Technology,
2nd edition, Marcel Dekker Inc., New York. 93. Lam, J. (2006) Development of an antioxidant system on fortified Ultra RiceTM to
promote vitamin A stability alone and in the presence if iron. M. A. Sc. Thesis, University of Toronto.
94. Lamprecht, A., Torres, H.R., Schafer, U., Lehr, C. (2000) Biodegradable microparticles as a two-drug controlled release formulation: a potential treatment of inflammatory bowel disease. Journal of Controlled Release, 69: 445–454.
95. Lee, H. K., Park, J. H., Kwon, K. C. (1997) Double-walled microparticles for single shot vaccine. Journal of Controlled Release, 44: 283-293.
96. Levin, H. M., Pollit, E., Galloway, R., McGuire, J. (1993) Micronutrient deficiency disorders. In: Disease control priorities in developing countries, Edited by Jamison, D. T. pp 421-451. Oxford Press, New York, NY, USA.
97. Li, Y. (2005) Development and stability study of multiple-fortified Ultra RiceTM formulations containing iron, zinc, and B vitamins. M. A. Sc., Thesis. University of Toronto.
98. Little, R. R., Hilder, G. B., Dawson, E. H. (1958) Differential effect of dilute alkali on 25 varieties of milled white rice. Cereal Chemistry, 35: 111-126.
99. Liu, Q., Zhang, Y., Laskowski, J. S. (2000) The adsorption of polysaccharides onto mineral surfaces: an acid/base interaction. International Journal of Mineral Process, 60: 229-245.
100.Liu, X. D., Yu, W. Y., Zhang, Y., Xue, W. M., Yu, W. T., Xiong, Y., Ma, X. J., Chen, Y., Yuan, Q. (2002) Characterization of structure and diffusion behaviour of Ca-alginate beads prepared with external or internal calcium sources. Journal of Microencapsulation, 19(6): 775-782.
101.Lo, K. L. (2006) Development of appropriate technologies for the production of double fortification of salt with iron and iodine. M. A. Sc. Thesis, University of Toronto.
102.Lonnerdal, B. (2004) Interactions between micronutrients: Synergies and antagonisms. In: Micronutrient Deficiencies during the Weaning Period and the First Years of Life. Edited by Pettifor, J. M., Zlotkin, S., Nestle Nutrition Workshop Series Pedatric Program, Vol. 54, pp 67-81, Nestec Ltd., Basel.
103.Lotfi, M., Manner, M. G. V., Merx, R. J. H. M., Naber-van den Heuvel, P. (1996) Micronutrient fortification of foods: current practices, research, and opportunities.
163
Ottawa: Micronutrient Initiative/International Development Research Centre/International Agriculture Centre.
104.Lynch, S. R. (1997) Interaction of Iron with Other Nutrients. Nutrition Reviews, 55: 102-110.
105.Madene, A., Jacquot, M., Scher, J., Desobry, S. (2006) Flavour encapsulation and controlled release – a review. International Journal of Food Science and Technology, 41: 1-21.
106.Madziva, H., Kailasapathy, K., Phillips, M. (2005) Alginate-pectin microcapsules as a potential for folic acid delivery in foods. Journal of Microencapsulation, 22(4): 343-351.
107.Mannar, V. and Gallego, E. B. (2002) Iron fortification: Country level experiences and lessons learned - Supplement: Forging Effective Strategies to Combat Iron Deficiency, The American Society for Nutritional Science. Journal of Nutrition, 132: 856S-858S.
108.McHugh, D. J. (1987) Chapter 2 – Production, properties, and uses of alginates. In: Production and Utilization of Products from Commercial Seaweeds. Edited by McHugh, D. J. FAO Fisheries Technical Paper 288. FAO, Rome, 1987.
109.McKillop, D. J., Pentieva, K., Daly, D., McPattlin, J. M., Hughes, J., Strain, J. J., Scott, J. M., McNulty, H. (2002) The effect of different cooking methods on folate retention in various foods that are amongst the major contributors to folate intake in the UK diet. British Journal of Nutrition, 88: 681-688.
110.Merck Index, Tenth Edition, the Merck Publishing Co. 111.MI (2004) Micronutrient Initiative Report: vitamin and mineral deficiency: a global
progress report. Access online through <http://www.micronutrient.org/reports/default.asp> on Oct 21, 2008.
112.Miller, J. W. (2004) Folate, cognition, and depression in the era of folic acid Fortification. Journal of Food Science, 69(1): SNQ61-64.
113.Mills, J., Von Kohorn, I., Conley, M. R., Zeller, J. A., Cox, C., Williamson, R. E., Dufour, D. R. (2003) Low vitamin B12 concentrations in patients without anemia: the effect of folic acid fortification of grain. American Journal of Clinical Nutrition, 77: 1474-1477.
114.Mourret, C. (2006) Double fortification of salt with iron and iodine, Internship report, University of Toronto, unpublished.
115.Nagaraja, P., Vasantha, R. A., Yathirajan, H. S. (2002) Spectrophotometric determination of folic acid in pharmaceutical preparations by coupling reactions with iminodibenzyl or 3-aminophenol or sodium molybdate-pyrocatechol. Analytical Biochemistry, 307: 316-321.
116.Nisha, P., Singhal, R. S., Pandit, A. B. (2005) Degradation kinetics of folic acid in cowpea (Vigna catjang L.) during cooking. International Journal of Food Sciences, 56(6): 389-397.
117.Okadome, H. (2005) Review - Application of instrument-based multiple texture measurement of cooked milled-rice grains to rice quality evaluation. Japan Agricultural Research Quarterly, 39(4):261-268.
118.Oldfield, C. (2004) Method, apparatus, and use of chelating agents for the purification of calcium sulphate, United States Patent 6827914.
119.OMNI/USAID (1998) Rice fortification for developing countries. OMNI/USAID, Dexter, P. B.
120.Onwulata, C. (2005) Edited, Encapsulated and powdered foods. Boca Raton: CRC Press.

164
Pp. 60. 121.Oshinowo, T., Diosady, L. L., Yusufali, R., Laleye, L. (2004) Stability of salt
double-fortified with ferrous fumarate and potassium iodate or iodide under storage and distribution conditions in Kenya. Food Nutrition Bulletin, 25: 264–70.
122.Oshinowo, T., Diosady, L. L., Yusufali, R., Wesley, A. (2007) An Investigation of the Stability of Double Fortified Salt during Storage and Distribution in Nigeria. International Journal of Food Engineering, 2007(3): Article 13, pp1-14.
123.Ottaway, P. B. (1993) The technology of vitamins in foods. Blackie Academic & Professional, pp 101-103.
124.Park, J. H., Ye, M., Park, K. (2005) Biodegradable polymers for microencapsulation of drugs. Molecules, 10:146-161.
125.Parrish, D. B., Moffitt, R. A., Noel, R. J., Thompson, J. N. (1985) Vitamin A. In: Methods of Vitamin Assay. Edited by Augustin, J., Klein, B. P., Becker, D. A. and Venugopal, P. B., Fourth Edition, John Wiley and Sons, New York, pp. 153-184.
126.PATH (2007) The research behind the Ultra Rice® technology. Information brochure, PATH (Program for Appropriate Technology in Health).
127.PATH (2008) Report of technology transfer in Brazil, collective work of Ultra Rice® team, unpublished.
128.Perez, C. M., Bourne, M. C., Juliano, B. O. (1996) Measuring hardness distribution of cooked rice by single-grain puncture. Journal of Texture Studies, 27:1-13.
129.Persad, V. L., Van den Hof, M. C., Dube, J. A., Zimmer, P. (2002) Incidence of open neural tube defects in Nova Scotia after folic acid fortification. Canadian Medical
Association Journal, 167(3): 241-245. 130.Pham, A.T., Lee, P. I. (1994) Probing the mechanisms of drug release from
hydroxypropylmethyl cellulose matrices. Pharmaceutical Research, 11:1379-1384. 131.Poncelet, D. (2001) Production of alginate beads by emulsification/internal
gelation. Annals of New York Academy of Sciences. 944:74-82. 132.Quinlivan, E. P., Gregory, J. F. (2003) Effect of food fortification on folic acid intake in
the United States. American Journal of Clinical Nutrition, 77(1): 221-225. 133.Quinlivan, E. P., Gregory, J. F. (2003a) The impact of food fortification on folic acid
intake in Canada. Canadian Journal of Public Health-Revue Canadienne De Sante
Publique, 94(2): 154-154. 134.Rabier, P. (2006) Investigation on appropriate binder materials for producing extruded
iron premix for salt fortification and standardization of extrusion process. Internship report, University of Toronto, unpublished.
135.Rader, J. I. (2005) Folic acid fortification of enriched cereal-grain products in the United States. Agro Food Industry Hi-Tech, 16(2): 28-30.
136.Rader, J. I. (2002) Folic acid fortification, folate status and plasma homocysteine. Journal of Nutrition, 132(8): 2466S-2470S.
137.Rader, J. I., Weaver, C. M., Angyal, G. (2000) Total folate in enriched cereal-grain products in the United States following fortification. Food Chemistry, 70(3): 275-289.
138.Raileanu, I. (2002) Triple fortification of salt with iodine, iron, and vitamin A. M. A. Sc. Thesis, University of Toronto.
139.Rampersaud, G. C., Bailey, L. B., Kauwell, G. P. A. (2002) Relationship of folate to colorectal and cervical cancer: review and recommendations for practitioners. Journal of
American Dietician Association, 102: 1273-83. 140.Rao, R. S., Kumar, C. G., Prakasham, R. S., Hobbs, P. J. (2008) The Taguchi

165
methodology as a statistical tool for biotechnological applications: A critical appraisal. Biotechnology Journal, 3:510–523.
141.Ray, J. G. (2004) Folic acid food fortification in Canada. Nutrition Reviews, 62(6): S35-S39.
142.Ray, J. G., Meier, C., Vermeulen, M. J., Boss, S., Wyatt, P. R., Cole, D. E. C. (2002a) Association of neural tube defects and folic acid food fortification in Canada. Lancet, 360(9350): 2047-2048.
143.Ray, J. G., Vermeulen, M. J., Boss, S. C., Cole, D. E. C. (2002b) Declining rate of folate insufficiency among adults following increased folic acid food fortification in Canada. Canadian Journal of Public Health-Revue Canadienne De Sante Publique, 93(4): 249-253.
144.Reisch, H. S., Flynn, M. A. T. (2002) Folic acid and the prevention of Neural Tube Defects (NTDs) - Challenges and recommendations for public health. Canadian Journal
of Public Health-Revue Canadienne De Sante Publique, 93(4): 254-258. 145.Roche brochure, Fortification Basic: Stability. OMNI/Roche/USAID. 146.Rogols, S., Hyldon, R. G. (1963), Enzymic Hydrolysis of Wheat Starch II. The effect of
pH on the degradation products of wheat and corn starch substrates and their role in titanium dioxide retention. Starch, 15(10): 364-367.
147.Rosca, I. D., Watari, F., Uo, M. (2004) Microparticle formation and its mechanism in single and double emulsion solvent evaporation. Journal of Controlled Release, 99: 271-280.
148.Roy, R. K. (1990) A Primer on the Taguchi Method, Van Nostrand Reinhold, New York 1990.
149.Rutkowski, K. (2003) Preparation of salt triple fortified with vitamin A, iron, and iodine. M. A. Sc. Thesis, University of Toronto.
150.Salt Institute Website: <http://www.saltinstitute.org/37.html>, accessed online on Oct. 13, 2008
151.Saxby, M. J., Smith, P. R., Blake, C. J., Coveney, L. V. (1983) The degradation of folic acid in a model food system and in beer. Food Chemistry, 12: 115-126.
152.Schmitt, C., Sanchez, C., Desobry-Banon, S., Hardy, J. (1998) Structure and technofunctional properties of protein-polysaccharide complexes: A review. Critical
Reviews in Food Science and Nutrition, 38: 689-753. 153.Schrooyen, P. M. M., van der Meer, R., De Kruif, C. G. (2001) Microencapsulation: its
application in nutrition. Proceedings of the Nutrition Society, 60: 475-479. 154.Sefton, M. V., Maya, M. H., Lahootia, S., Babenseeb, J. E. (2002) Making
microencapsulation work: conformal coating, immobilization gels and in vivo performance. Journal of Controlled Release, 65: 173-186.
155.Seiler, W. (2006) Gluten-free pasta made from corn and rice. Food Marketing &
Technology, August 2006, pp 22-24. 156.Sesmat, A., Meullenet, J. F. (2001) Prediction of rice sensory texture attributes from a
single compression test, multivariate regression, and a stepwise model optimization method. Journal of Food Science, 66(1):124-131.
157.Shrestha, A. K., Arcot, J., Paterson, J. L. (2003) Edible coating materials – their properties and use in the fortification of rice with folic acid. Food Research
International, 36: 921-928. 158.Suh, J. R., Herbig, A. K., Stover, P. J. (2001) New perspectives on folate catabolism.
Annual Review of Nutrition, 21: 255-282.

166
159.Swain, J. H., Newman, S. M., Hunt, J. R. (2003) Bioavailability of elemental iron powders to rats is less than bakery-grade ferrous sulfate and predicted by iron solubility and particle surface area. The Journal of Nutrition, 133(11): 3546-3552.
160.SwRI website: Southwest Research Institute (SwRI®). Access online through <http://www.swri.org/4org/d01/microenc/microen/default.htm>
161.Tay, C. L. (2002) Salt triple fortification with iodine, iron, and vitamin A. M. A. Sc. Thesis, University of Toronto.
162.Taylor, T. M., Davidson, P. M. (2005) Liposomal nanocapsules in food science and agriculture. Critical Reviews in Food Science and Nutrition, 45: 587-605.
163.Tinsley-Bown, A. M., Fretwell, R., Dowsett, A. B., Davis S. L., Farrar, G. H. (2000) Formulation of poly (D, L-lactic-co-glycolic acid) microparticles for rapid plasmid DNA delivery. Journal of Controlled Release, 66: 229-241.
164.Trueman, R. E. (2005) Development of an extrusion method for iron premix preparation. B.A.Sc. Thesis, University of Toronto.
165.Tsuji, K. (2001) Microencapsulation of pesticides and their improved handling safety. Journal of Microencapsulation, 18: 137-47.
166.United Nation (2008) “Special Session on Children: Issues and Information Immunization Plus”. Access online through <http://www.unicef.org/specialsession/press/pkimmunization.htm> on March 28, 2008.
167.Verlinde, P., Zulueta Albelda, A., Oey, I., Temme, E., Hendrickx, M., Van Loey. A. (2006) Nonenzymatic glycation reaction of folate with reducing sugars: A case study on [6S]-5-methyltetrahydrofolate and fructose. IUFoST World Congress -13th World Congress of Food Science & Technology, iufost, DOI: 10.1051/IUFoST: 20060424.
168.Wang, J., Ng, C. W., Win, K. Y., Shoemakers, P., Lee, T. K. Y., Feng, S. S., Wang, C. H. (2003) Release of paclitaxel from polylactide-co-glucolide (PLGA) microparticles and discs under irradiation. Journal of Microencapsulation, 20: 317-327.
169.Wegmüller, R., Zimmermann, M.B., Moretti, D., Arnold, M., Langhans, W., and Hurrell, R.F. (2004) Nutrient Metabolism: Particle Size Reduction and Encapsulation Affect the Bioavailability of Ferric Pyrophosphate in Rats, The American Society for Nutritional Sciences. Journal of Nutrition, 134: 3301-3304.
170.145.Wegmüller, R., Camara, F., Zimmermann, M. B., Adou, P., Hurrell, R. F. (2006). Salt dual-fortified with iodine and micronized ground ferric pyrophosphate affects iron status but not hemoglobin in children in Coˆte d’Ivoire. The Journal of Nutrition, 136: 1814-1820.
171.Whittaker, P., Tufaro, P. R., Rader, J. I. (2001) Iron and folate in fortified cereals. Journal of the American College of Nutrition, 20: 247-54.
172.Windhab, E.J., Wagner, T., Zimmermann, M., Hurrell, R.F. (2005) Processing and application of multi-fortified food systems. Chemie Ingenieur Technik, 77: 1180.
173.Winger, R. J., Koenig, J., Lee, S. J., Wham, C., House, D. A. (2005) Technological issues with iodine fortification of foods. Available online at <http://www.nzfsa.govt.nz/science/research-projects/iodine-fort/iodine-fort-foods.pdf>, accessed on Dec. 3, 2008.
174.Wirakartakusumah, M. A. and Hariyadi, P. (1998) Technical aspects of food fortification. Food and Nutrition Bulletin, vol. 19, no. 2. Access online on Nov. 11, 2008 at <http://www.unu.edu/unupress/food/v192e/ch03.htm#Technical%20aspects%20of%20food%20fortification>.
175.World Health Organization (WHO, 2000) – Malnutrition: The global picture. In:

167
Nutrition for health and development, A global agenda for combating malnutrition. 176.World Health Organization (WHO, 1995) - Highlights of recent activities in the context
of the World Declaration and Plan of Action for Nutrition, Nutrition Program, Geneva: WHO.
177.Yadava, D. (2008) Microencapsulation-based technologies for the double fortification of salt with iron and iodine. M. A. Sc. Thesis, University of Toronto.
178.Yetley, E. A.; Rader, J. I. (2004) Modeling the level of fortification and post-fortification assessments: US experience. Nutrition Reviews, 62(6): S50-S59.
179.Yuliani, S., Bhandari, B., Rutgers, R., D’Arcy, B. (2004) Application of microencapsulated flavour to extrusion product. Food Reviews International, 20: 163-185.
180.Yusufali, R. (2002) Appropriate technologies for double fortification of salt. M. A. Sc. Thesis, University of Toronto.
181.Zheng, L., Saunders, A. (2008) The stability of double fortified salt with potassium iodate and folic acid. Summer Project Report, unpublished, University of Toronto.
182.Zimmermann, M. B., Adou, P., Zeder, C., Torresani, T., Hurrell, R. F. (2000) Persistence of goiter despite oral iodine supplementation in goitrous children with iron deficiency anemia in Cote d’ivoire. American Journal of Clinical Nutrition, 71: 88-93.
183.Zimmermann, M. B., Wegmueller, R., Zeder, C., Chaouki, N., Biebinger, R., Hurrell, R. F., Windhab, E. (2004) Triple fortification of salt with microcapsules of iodine, iron, and vitamin A. American Journal of Clinical Nutrition, 80: 1283-1290.

168
10 NOMENCLATURE
µm Micrometer
AAS Atomic absorption spectrophotometry
AI Adequate Intakes
AOAC The Association of Official Analytical Chemists
BHA Butylated hydroxyanisole
BHT Butylated hydroxytoluene
DFE Dietary Folate Equivalent
DFS Double-fortified salt
DRI Dietary Reference Intake
EAR Estimated Average Requirements
EDTA Ethylenediaminetetraacetic acid
FAO Food and Agriculture Organization
FDA Food and Drug Administration
FeFum Ferrous fumarate
FePP Ferric pyrophosphate
GDL Glucono-delta-lactone
GMP Good Manufacturing Practice
GRAS Generally Recognized As Safe
HPMC Hydroxypropyl Methylcellulose
IDA Iron Deficiency Anaemia
IDD Iodine Deficiency Disorder
MI Micronutrient Initiative
MSG Monosodium glutamate
NTD Neural tube defects
pABG p-aminobenzoylglutamic acid
PATH Program for Appropriate Technology in Health
PEG Poly(ethylene glycol)
ppm Parts per million
PVA Poly (vinyl alcohol)

169
RBV Relative bioavailability value
RDA Recommended Dietary Allowance
RH Relative Humidity
RSD Relative Standard Deviation
SEM Scanning Electron Microscope
SHMP Sodium hexametaphosphate
STPP Sodium tripolyphosphate
T Temperature
TFS Triple fortified salt
THF Tetrahydrofolic acid
ToF-SIMS Time-of-Flight Second Ion Mass Spectrometry
TPP Tripolyphosphate
TSPP Tetrasodium pyrophosphate
VAD Vitamin A deficiency
WHO World Health Organization
XPS X-ray Photoelectron Spectroscopy

170
LIST OF APPENDICES
Appendix 11.1.1 Analytical methods used in research approach 1 172
Appendix 11.1.2 Preliminary observations on suitability of different binder materials
174
Appendix 11.1.3 Specifications of the three cereal flours used as binders in the study
175
Appendix 11.1.4 Preliminary investigation of dextrin and HPMC as secondary binders
176
Appendix 11.1.5 Comparison of extrudability and product characteristics between three cereal flours used in the study as binders
177
Appendix 11.1.6 Comparison on the effectiveness of TiO2 adhesion before and after drying
178
Appendix 11.1.7 Comparison of surface morphology in the premixes made by different coating materials
178
Appendix 11.1.8 Development of standard protocols for encapsulation operation using the fluidized bed and the pan coater
179
Appendix 11.1.9 Detailed composition of the 12 final microencapsulated FeFum premixes
182
Appendix 11.1.10 Iron in vitro bioavailability test results of the optimized formulations of microencapsulated FeFum premixes
185
Appendix 11.1.11 Particle integrity dissolution test results of the optimized formulations of microencapsulated FeFum premixes
186
Appendix 11.1.12 Physical characteristics of the final premixes 187
Appendix 11.1.13 SEM images of the final FeFum premixes (at ~5000 magnification)
188
Appendix 11.1.14 Relative iodine retention in DFS samples containing various FeFum particles during one year storage under 40oC and 60% RH
189
Appendix 11.1.15 Ferrous iron retention in formulated FeFum particles and in DFS samples, when stored at the ambient condition and the higher conditions of 40oC & 60% RH, respectively
190
Appendix 11.1.16 Detailed data processing for analysing iodine-iron interaction in DFS
191
Appendix 11.2.1 Ranking scheme for measurement of grain integrity during soaking and cooking
192
Appendix 11.2.2 Texture measurement on cooked Ultra Rice® grains for grain integrity
196

171
Appendix 11.2.3 Detailed compositions of the final 4 formulations used for verifying the optimal internal gelation systems in the actual nutrient-fortified formulations
197
Appendix 11.2.4 XPS and ToF-SIMS measurements on Ultra Rice® 199
Appendix 11.3.1 Folic acid determination protocols 203
Appendix 11.3.2 Colour stability of the double or triple fortified Guatemalan salt or sugar samples after 3 months storage under 40oC and 60% RH
209
Appendix 11.3.3 Folic acid-containing multiple fortified Ultra Rice® appearance 210

172
11 APPENDICES
Appendix 11.1 Detailed Analytical Methods and Results from the Study of
Microencapsulated FeFum Premix for Salt Double Fortification
Appendix 11.1.1 Analytical methods used
Bulk Density (DB) was measured by weighing a known volume of iron particles in a graduated cylinder and compacted by gently tapping the flask. The weights of the empty flask and sample-filled flask were recorded. The same operation was repeated by filling the flask with distilled water. The bulk density of the sample was then calculated by the following equation, for an average of four replicates:
Particle Density (DP) was measured by the weight of the mass per unit volume of the solid only. Specifically, after the measurement of the bulk density as described before, the void volume in the sample-filled flask was determined by dropwise addition of hexane. The weight of the flask was recorded as W4, and the particle density of the sample was calculated by the following equation:
Iron Analysis
Total iron was measured by atomic absorption spectrophotometry (AAS) using AOAC method 3.6.1.2 (Fourteenth Edition, 1984). Approximately 60 mg iron premix is accurately weighed and digested in 20 mL concentrated HNO3 and HCl (1:1, v/v) until approximately 25% of the liquid retained. The digested samples were cooled and then diluted to 100 mL with distilled water. The absorbance at 248.3 nm was measured with a Perkin-Elmer AA100 atomic absorption spectrophotometer, and the concentration of iron was calculated based on a calibration curve obtained using standard iron reference solution. Ferrous iron content in the premix was determined by spectrophotometry (Harvey, Smart, & Amis, 1955), as a complex with 1,10-phenanthroline. Approximately 300 mg of iron premix was accurately weighed and dispersed in ~40 mL of distilled water, followed by acidifying with 1 mL of concentrated sulphuric acid. The sample solution was boiled for 5 minutes for digestion. After cooling, the digested sample was diluted to 100 mL with distilled water. A
DB =(W2-W1)/(W3-W1) x Dw,
W1 is the weight of the empty flask; W2 is the weight of the sample-filled flask; W3 is the
weight of water-filled flask; Dw is water density.
DP = (W2-W1)/[(W3-W1)/Dw – (W4-W2)/DH],
W1, W2, W3, and DW are defined as above; W4 is the weight of the flask filled with both
the sample and hexane; DH is hexane density.

173
10 mL aliquot was reacted with 1,10-phenanthroline and diluted to 25mL to develop an orange-coloured complex. The absorbance at 512 nm was measured using a Cary 50 Bio UV/Vis spectrophotometer. Iron in-vitro Bioavailability Approximation
Iron digestibility was approximated with an in vitro bioavailability test, based on the rate of dissolution of iron in 0.1 N HCl, which closely approximates the acid in the gastric juice (USP General Chapter 711; Swain et al. 2003; Forbes et al. 1989). Approximately 100 mg of the iron premix was accurately weighed and dispersed in exactly 1 L of 0.1 N HCl solution
and then placed in a water bath held at 36-37°C for 2 hours. Five-mL samples of the solution were taken at 0, 30, 60, 90, and 120 minutes, and diluted to 25 mL with distilled water. The iron content in the diluted sample solution was analyzed by AAS as above. The results were reported as the percentages of initial iron that was dissolved.
Iodine Analysis
Iodine content in the DFS samples was determined by iodometric titration (AOAC method 33.149). ~5 g of the DFS sample was accurately weighed and dissolved in ~100 mL of distilled water. The sample solution was then filtered to remove the iron particles and other impurities. To the filtered sample solution 1 mL of 0.2N sulphuric acid and 1 mL of 2% KI solution are added and mixed by gently shaking. The sample solution was then left in a dark, cool place until a light yellow colour due to freed iodine was developed. Sodium thiosulphate solution (0.002N) was used to titrate the free iodine released in the sample solution, using starch as indicator. The iodine content in the DFS sample was then calculated by the following equation:
Iodine content (ppm or µg/g)
= [Na2S2O3] (µg iodine equivalent/mL) x consumption of Na2S2O3 (mL) / weight of sample (g)

174
Appendix 11.1.2
Preliminary observations on suitability of different binder materials
Binder Observations Comments
Dextrin
could form an extrudable dough by itself with addition of ~5% lipid and ~40% water; the extrudates were crumble; the addition of 50% FeFum could form a sticky dough which made extrusion hard to proceed and the extrudates were very rough in surface.
could not be used as the primary binder; might be used as a secondary binder.
HPMC
could form a sticky dough by itself, yet hard to extrude; could not form an extrudable dough with the addition of FeFum regardless of the ratios between the binder and FeFum, and the amounts of water and lipid added.
could not be used solely as a binder; might be used as a texture modifier due to its stickiness and strength.
Potato starch
could not form an extrudable dough by itself or by a combination with FeFum, regardless of water and lipid contents.
could not be used as binder for the cold-forming pasta extruder.
Corn meal
could not form an extrudable dough by itself or by a combination with FeFum, regardless of water and lipid contents
could not be used as binder for the cold-forming pasta extruder.
Rice flour
a perfectly extrudable dough could be formed by itself; with the addition of FeFum up to 70% (w/w) an extrudable dough could be formed, while lipid and water contents needed to be carefully adjusted; the extrudates were sticky and rough in the surface when cut at the axial direction.
could be used as a binder for our purpose, while some modifications of the dough were required, i.e., a secondary binder might be needed.
Wheat flour
a perfectly extrudable dough could be formed by itself; with the addition of FeFum up to 70% (w/w) an extrudable dough could be formed with optimal lipid and water contents added in the mixture; the dough was harder to extrude compared to the dough made with rice flour; the extrudates were relatively bigger in size.
could be used as a binder for our purpose, while an increase of lipid content in the mixture from 2.5% to 5% significantly made the extrusion easier and faster to proceed, also the extrudates showed better characteristics.
Durum flour
a perfectly extrudable dough could be formed by itself; with the addition of FeFum up to 80% (w/w) an extrudable dough could be formed with optimal lipid and water contents added in the mixture; the dough was the easiest to extrude and the extrudates were perfect with uniform size distribution and smooth surface at cut.
could be used as a binder for our purpose, and was the best candidate over others.
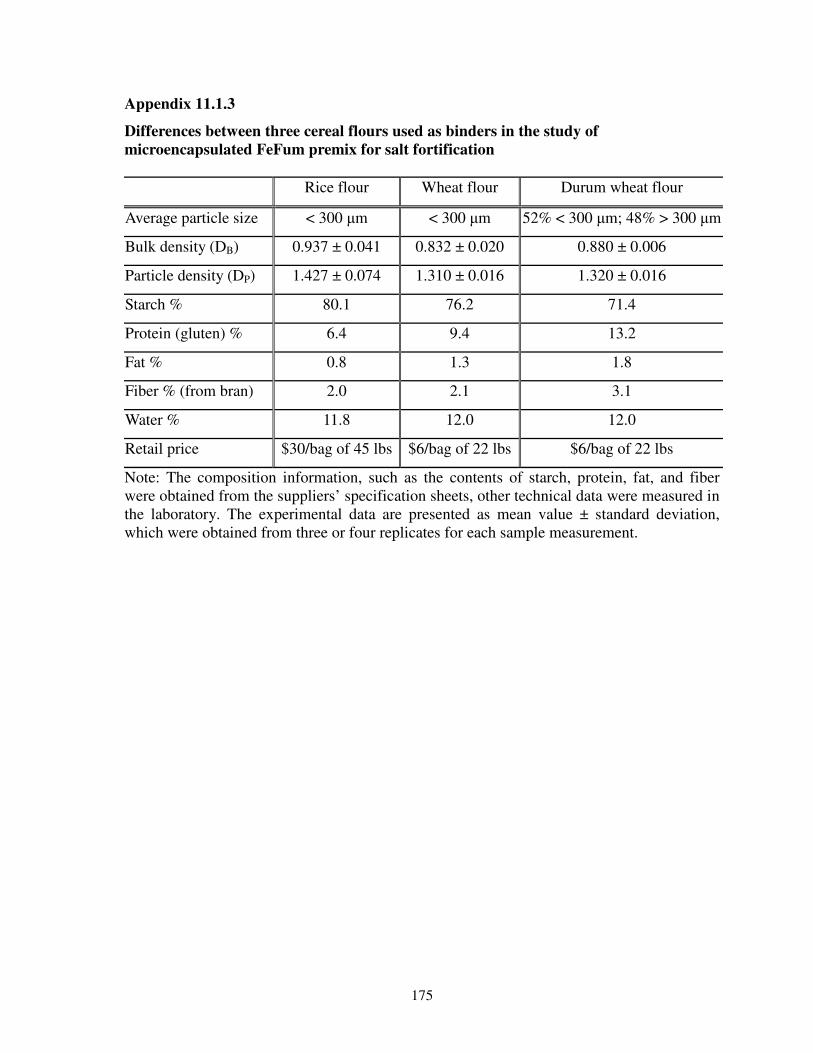
175
Appendix 11.1.3
Differences between three cereal flours used as binders in the study of
microencapsulated FeFum premix for salt fortification
Rice flour Wheat flour Durum wheat flour
Average particle size < 300 µm < 300 µm 52% < 300 µm; 48% > 300 µm
Bulk density (DB) 0.937 ± 0.041 0.832 ± 0.020 0.880 ± 0.006
Particle density (DP) 1.427 ± 0.074 1.310 ± 0.016 1.320 ± 0.016
Starch % 80.1 76.2 71.4
Protein (gluten) % 6.4 9.4 13.2
Fat % 0.8 1.3 1.8
Fiber % (from bran) 2.0 2.1 3.1
Water % 11.8 12.0 12.0
Retail price $30/bag of 45 lbs $6/bag of 22 lbs $6/bag of 22 lbs
Note: The composition information, such as the contents of starch, protein, fat, and fiber were obtained from the suppliers’ specification sheets, other technical data were measured in the laboratory. The experimental data are presented as mean value ± standard deviation, which were obtained from three or four replicates for each sample measurement.

176
Appendix 11.1.4
Preliminary investigation of dextrin and HPMC as secondary binders
(Lo, 2006; Mourret, 2006)
Formulation Observations Ranking on extrudability
(0-3)
70% FeFum, 30% rice flour Hard to extrude, and the extrudates also stuck together
1
70% FeFum, 30% rice flour:dextrin (80:20)
Extrudable, with non-sticky extrudates, the best combination so far
3
70% FeFum, 30% rice flour:dextrin (70:30)
Extrudable, but the extrudates were stickier than the above formulation
2
70% FeFum, 30% rice flour:dextrin (50:50)
Not extrudable 0
70% FeFum, 30% rice flour:HPMC (90:10)
Extrudable, but the extrudates were rough at the both longitudinal and axial surfaces
2
80% FeFum, 20% rice flour:HPMC (85:15)
Hard to extrude 1
80% FeFum, 20% rice flour:HPMC (75:25)
Not extrudable 0
Note: the ranking scales are: 0 – not extrudable at all; 1 – hard to extrude with very low flow rate; 2 – extrudable but the particles collected were not of desired properties in appearance and/or surface smoothness; 3 – easy for extrusion with desired particle properties.

177
Appendix 11.1.5
Comparison of extrudability and product characteristics between three cereal flours
used in the study as binders

178
Appendix 11.1.6
Comparison on the effectiveness of TiO2 adhesion before and after drying (pictures
were taken from optical microscopy at x60 magnification)
Appendix 11.1.7
Comparison of surface morphology in the premixes made by different coating
materials
Formulation After extrusionTiO2 dusted
after drying
Washed and
filtered
TiO2 dusted
before drying
Washed and
filtered
70% FeFum
30% rice/dextrin
70% FeFum
30% wheat flour
70% FeFum
30% durum flour
75% FeFum
25% durum flour

179
Appendix 11.1.8
Development of standard protocols for encapsulation operation using the fluidized bed
and the pan coater
A Uni-Glatt laboratory fluidized bed coater was used for hydrophilic polymer coating. It was observed that the quality of developed polymer film could be greatly affected by the operation conditions (Table 11.1.8.1). Thus, it was necessary to examine the operation parameters and find the optimal combinations. Table 11.1.8.1 Examples of unsuccessful coatings with different materials and techniques
There are several parameters in the fluidized bed system which greatly affect the process and quality of the final products, including flow-rate and pressure of the spraying liquid, composition and rheology of the coating solution, flow-rate and temperature of the fluidizing air. These parameters could be controlled and adjusted on the machine. The results from a preliminary investigation showed that the coating chamber needed to be pre-heated and the temperature of the process air had to be high enough to ensure a rapid evaporation of the coating solution, thus preventing the coated particles sticking together. The flow rate of the fluidizing air was dependent on the particle size/density and the loaded weight, where proper fluidization and recirculation of the loaded particles were the key requirements. Air flap of the instrument, which has five positions from 15% to 75%, was used to control the air flow rate. The concentration of the spray solution was crucial to the ease of operation and time consumed. High concentrations made the polymer solution too viscous and caused difficulties in operation, whereas too diluted solutions would take prolonged time for the operation. The optimal concentration of the coating solution was 2% for MethocelTM and 5% for Kollicoat®. The flow rate of the spray solution was controlled by a peristaltic pump attached to a variable speed regulator. It was adjusted in accordance with solvent evaporation rate (controlled by the system temperature) and the degree of particle fluidization (controlled by the air flap opening). The desired flow rate of the spray solution should be as fast as possible to minimize the operation time and provide sufficient wetting effect on the particles, but not so much that the suspended particles would stick together (Figure 11.1.8.1). The nozzle opening and the air pressure for the spray nozzle jointly formed the atomization angle, which integrated with the spray flow rate and the nozzle position in the bed to generate the dynamic air/water/coating contact angle (Figure 11.1.8.2), which played the most important role in coating efficiency.
10% Methocel - Fluidized bed 5% Kollicoat - Pan coating

180
Overall, an optimal combination of the parameters was obtained from the preliminary study as shown below (Barquin, 2006):
– Temperature of the fluidizing air: 70-85oC – Air flow rate for the fluidizing air: 37-45% of flap opening – Flow rate of coating solution: < 60 mL/hour or <1mL/min – Air pressure for the spray nozzle: 1.5 – 2 bars – Vertical position of the spray nozzle: at 1/3 to the top of the coating chamber
Figure 11.1.8.1 Flow rate of the spray solution for proper wetting that ensures the process turn to coating rather than particle agglomeration (adapted from Guignon, et al. 2002)
Figure 11.1.8.2 Dynamic air/water/coating contact angle that is responsible for effective coating within fluidized beds (adapted from Glatt website; Guignon, et al. 2002; Dowling website)
Coating solution + compressed air
Iron particles
Hot fluidizing air
Air Coating solution
Spray droplet
Atomization angle
Spray droplet / fluidized particle contact angle

181
Standard protocol for the fluidized bed operation
1. Weigh 25 grams of colour-masked particles and set aside. 2. Weigh 3.75 grams of HPMC (15 wt%) into the 100 mL glass beaker. 3. Add 75 mL of water to the 100 mL beaker and place a magnetic stir bar in it. Place the beaker on a magnetic plate and stir for 10 minutes until the HPMC completely dissolves. 4. Tie the filter bag to the top compartment of the fluidized bed machine. 5. Assemble the fluidized bed machine as instructed in the technical manual. Set the temperature at 80o C. Set the inlet air flap at the opening position of 40. 6. Assemble the displacement pump and plug in the transformer. The pump should deliver 60 mL/hr. Ensure that the tubing of the pump is sufficiently long. The inlet end will be placed in the coating solution and the outlet end should be connected to the nozzle of the fluidized bed machine. 7. Turn on the air compressor connected to the fluidized bed. The nozzle pressure to be delivered should be between 1 to 1.5 bar. Remove the nozzle from operating position and check to see if it is clean and the air passes through. Turn off the compressor after checking the nozzle. 8. Assemble the nozzle back in its position for operation. 9. Ensure that the chamber is also in operating position (should be air-tight). 10. Place the inlet end of the tube (connected to the pump) into the coating solution beaker. 11.Turn on the air compressor, fluidized bed equipment and displacement pump sequentially. Note: The displacement pump should always be turned on last so that there is sufficient nozzle pressure to atomize the liquid, otherwise large drops will fall into the chamber. 12. Allow the equipment to run until the coating solution is pumped till the nozzle and the liquid spray is visible from the glass window of the fluidized bed chamber. In this time, the chamber should heat up to the desired temperature of 80oC. Note: The equipment is initially operated without the particles in the chamber. This is done to ensure that the particles do not spend any extra time in the chamber. This would result in loss of titanium dioxide due to air flow from the bottom of the chamber. The particles are placed in the chamber when it is at the right temperature and the coating solution has been pumped up to the nozzle. This ensures that coating can immediately begin. 13. Turn off the displacement pump and then turn off the air compressor and fluidized bed machine. This sequence ensures that no large drops of coating solution enter the fluidized bed chamber after the nozzle pressure decreases. 14. Remove the chamber and check if the bottom is dry. Then place the colour-masked particles at the bottom on the wire mesh. 15. Re-assemble the chamber and turn on the air compressor, fluidized bed machine and displacement pump sequentially. 16. Allow the equipment to run until all of the coating solution is used up. Note: Monitor the coating operation carefully. The nozzle may clog up at times and may need to be cleaned in the middle of operation. Also ensure that the particles do not stick to the side of the chamber. In this case, the pump speed should be decreased. 17. After operation, disassemble the fluidized bed machine and clean the nozzle immediately to prevent clogging. The filter bag should be cleaned after every two operations.

182
Standard protocol for the pan coater operation
1. Weigh 25 grams of colour-masked particles and set aside. 2. Weigh 3.75 grams of soy stearine (15% w/w) into the 50 mL glass beaker. 3. Heat the soy stearine on a hot plate on low heat until completely melted. Cover the beaker with aluminum foil while heating to reduce oxidation of fatty acids. 4. Measure 48 mL of dichloromethane and 12 mL of water into the 250 mL glass beaker. This step should be done in a fume hood due to release of dichloromethane vapours.
Note: Wear a mask and gloves while working with dichloromethane. It is a possible carcinogen. 5. Mix the melted soy stearine with dichloromethane and water in the 250 mL beaker in a fume hood. Ensure the mixture is uniform. 6. Transfer the contents of the 250 mL beaker into the TLC flask. 7. Attach the nozzle attachment to the TLC flask. 8. Place the glass flask on a hot plate at around 50oC so that the soy stearine does not solidify. 9. Set up the pan coating apparatus. This apparatus must be placed in a fume hood to remove the dichloromethane vapours. Set the rotating pan at a 45o angle and set the rotation speed to be approximately 50 rpm. 10. Place the colour-masked particles in the rotating pan and test if the particles move freely across the pan. 11. Attach the hose connected to the compressed air supply to the nozzle of the TLC flask. Turn on the air supply to about 3 psig. 12. Take the flask off the hot plate and start spraying the coating solution onto the particles in the rotating pan. Keep the flask at least 30 cm away from the pan and make sure the spraying occurs uniformly. The spray should be fine so that a uniform layer of coating is formed on the particles. Note: To spray, place your thumb on the small hole at the bottom of the nozzle attachment. To stop spraying, remove your thumb. CAUTION: Wear protective equipment while spraying dichloromethane. Wear a mask, gloves and face shield. Keep the TLC flask at arm's length under the fume hood. 13. Once the particles start to become coated, they may stick to each other. In this case, use a plastic spoon to ensure agglomeration of particles does not occur. Place the spoon at the top of the pan at the 90o angle to the pan while it is rotating. The spoon will gently scrape the surface of the pan and remove any stuck particles. Note: If the coating solution seems to be solidifying, place it on the hot plate and let it melt before continuing the spraying process. If the nozzle is clogged, remove the nozzle attachment and lay it on the hot plate to melt the soy stearine. 14. Continue spraying until all of the coating solution is used.

183
Appendix 11.1.9
Detailed composition of the 12 final microencapsulated FeFum premixes
Extrusion Colour
masking Encapsulation
Formulation
Binder FeFum Shortening Antioxidant TiO2 Polymer
1 17.09%
rice flour 4.27% dextrin
49.83% (16.61% Fe)
1.78% 0.07% BHA, 0.07% BHT
17.80% Methocel
9.09%
2 16.34%
rice flour 4.09% dextrin
47.67% (15.89% Fe)
1.70% 0.07% BHA, 0.07% BHT
17.02% Kollicoat 13.04%
3 20.46%
durum flour 47.74%
(15.91% Fe) 1.71% None 17.05%
Methocel 13.04%
4 21.36%
durum flour 49.83%
(16.61% Fe) 1.78%
0.07% BHA, 0.07% BHT
17.80% Methocel
9.09%
5 21.36%
durum flour 49.83%
(16.61% Fe) 1.78%
0.07% BHA, 0.07% BHT
17.80% Soy stearine
9.09%
6 21.36%
durum flour 49.83%
(16.61% Fe) 1.78%
0.78% BHA, 0.07% BHT
17.80% Methocel
9.09%
7 20.43%
durum flour 47.67%
(15.89% Fe) 1.70%
0.07% BHA, 0.07% BHT
17.02% Kollicoat 13.04%
8 18.53%
durum flour 55.59%
(18.53% Fe) 1.85%
0.07% BHA, 0.07% BHT, 0.22% SHMP, 0.37% ascorbic acid
18.53% Methocel
4.76%
9 16.92%
durum flour 50.75%
(16.92% Fe) 1.69%
0.07% BHA, 0.07% BHT, 0.22% SHMP, 0.37% ascorbic acid
16.88% Kollicoat 13.04%
10 18.53%
durum flour 55.59%
(18.53% Fe) 1.85%
0.07% BHA, 0.07% BHT, 0.22% SHMP, 0.37% ascorbic acid
18.53% Kollicoat
4.76%
11 20.46%
wheat flour 47.74%
(15.91% Fe) 1.71% None 17.05%
Methocel 13.04%
12 21.36%
wheat flour 49.83%
(16.61% Fe) 1.78%
0.07% BHA, 0.07% BHT
17.80% Kollicoat
9.09%

184
Calculation example for formulation composition:
The actual composition of the premix formulations is calculated as follows: EXAMPLE: Premix P-1 Extrusion Dry mass: 70 % ferrous fumarate & 30 % combination of rice flour and dextrin (with a ratio of 8:2) � On the basis of 100 g dry mass, this would result in 70 g of ferrous fumarate and 30 g of
binders. Liquid mass: on the basis of the dry mass, 2.5% of shortening and 18% of water were added
to make wet dough mass for extrusion. 0.1% of each BHA and BHT were added as antioxidants.
� Therefore 2.5 g of shortening, 0.01g of BHA, 0.01g of BHT, and 18 g of water were added to the dry ingredients.
Drying During drying, the extrudates were dried until the moisture content could be assumed to be zero. Therefore, the amount of water was not taken into consideration when calculating the final premix composition. Colour-masking Mass of titanium dioxide: 25% (w/w) of the dried extrudates The total mass of the colour-masked extrudates was 127.52 grams. Microencapsulation Mass of encapsulants: 10% (w/w) of the colour-masked iron particles
� 100 grams of the above colour-masked particles were used for encapsulation, and 10 grams of the coating material was applied to the particles, assuming no coating loss. The final mass is 110 grams.
The final premix composition was calculated based on the final mass as follows. % ferrous fumarate = 70 / 127.52*100/110*100 = 49.83% % rice flour = 24 / 127.52*100/110*100 = 17.09% % dextrin = 6 / 127.52*100/110*100 = 4.27% % shortening = 2.5 / 127.52*100/110*100 = 1.78% % titanium dioxide = 25 / 127.52*100/110*100 = 17.80% % encapsulants = 10 / 110*100 = 9.09% The percentage of iron could be calculated using the equation below. Iron content = % ferrous fumarate *0.333 =49.9*0.333 = 16.61%

185
Appendix 11.1.10
Iron in vitro bioavailability test results of the optimized formulations of
microencapsulated FeFum premixes
Formulation 0 min 30 min 60 min 90 min 120 min
Extruded iron particles
E-1 1.8 69.1 99.9 101.0 100.9
E-2 0.7 33.3 93.1 96.6 101.2
E-3 2.1 89.3 101.1 101.9 100.4
E-4 0.1 81.7 102.2 102.7 102.8
E-6 2.0 56.3 101.1 102.8 103.4
Colour-masked iron particles
C-1 0.5 73.8 89.9 90.2 90.5
C-3 0.6 60.6 87.2 87.7 89.6
C-4 0.9 75.0 86.1 86.5 86.7
C-5 0.5 86.6 94.0 94.1 95.1
C-6 0.6 66.2 85.6 88.2 88.3
C-8 0.7 74.7 84.3 85.2 85.7
Encapsulated iron premix
P-1 2.9 69.3 94.8 95.3 94.9
P-2 1.03 69.0 87.2 87.3 96.5
P-3 1.9 62.3 94.1 97.9 97.4
P-4 1.36 70.4 101.1 99.2 97.5
P-5 4.83 69.1 96.4 97.6 98.9
P-6 3.63 84.7 96.0 101.1 99.6
P-7 0.5 93.0 96.2 95.6 95.7
P-8 1.79 93.9 94.3 96.2 96.5
P-9 0.67 86.8 100.9 101.8 102.6
P-10 4.01 86.9 87.8 88.6 90.3
P-11 12.42 72.8 97.8 100.7 100.4
P-12 0.56 87.1 99.8 98.8 98.6
Note: the values are % of the iron dissolved in the digestion solution (pH1 HCl) at different time points during the 2h dissolution test
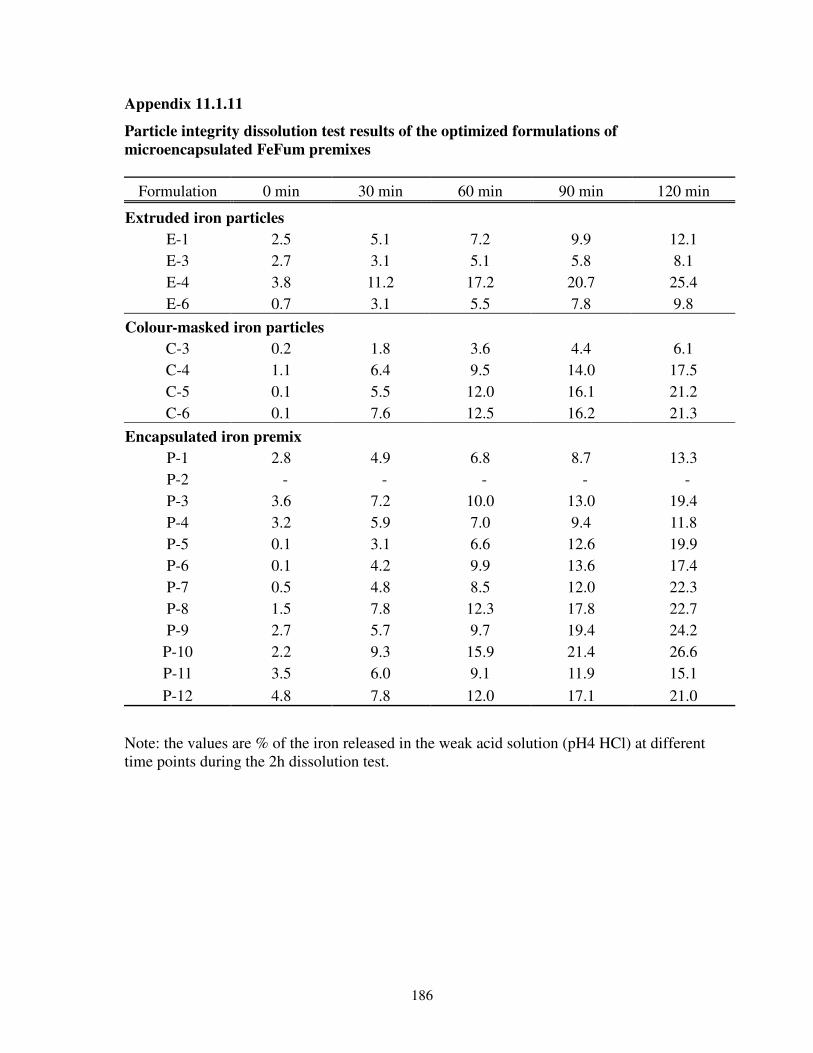
186
Appendix 11.1.11
Particle integrity dissolution test results of the optimized formulations of
microencapsulated FeFum premixes
Formulation 0 min 30 min 60 min 90 min 120 min
Extruded iron particles
E-1 2.5 5.1 7.2 9.9 12.1
E-3 2.7 3.1 5.1 5.8 8.1
E-4 3.8 11.2 17.2 20.7 25.4
E-6 0.7 3.1 5.5 7.8 9.8
Colour-masked iron particles
C-3 0.2 1.8 3.6 4.4 6.1
C-4 1.1 6.4 9.5 14.0 17.5
C-5 0.1 5.5 12.0 16.1 21.2
C-6 0.1 7.6 12.5 16.2 21.3
Encapsulated iron premix
P-1 2.8 4.9 6.8 8.7 13.3
P-2 - - - - -
P-3 3.6 7.2 10.0 13.0 19.4
P-4 3.2 5.9 7.0 9.4 11.8
P-5 0.1 3.1 6.6 12.6 19.9
P-6 0.1 4.2 9.9 13.6 17.4
P-7 0.5 4.8 8.5 12.0 22.3
P-8 1.5 7.8 12.3 17.8 22.7
P-9 2.7 5.7 9.7 19.4 24.2
P-10 2.2 9.3 15.9 21.4 26.6
P-11 3.5 6.0 9.1 11.9 15.1
P-12 4.8 7.8 12.0 17.1 21.0
Note: the values are % of the iron released in the weak acid solution (pH4 HCl) at different time points during the 2h dissolution test.
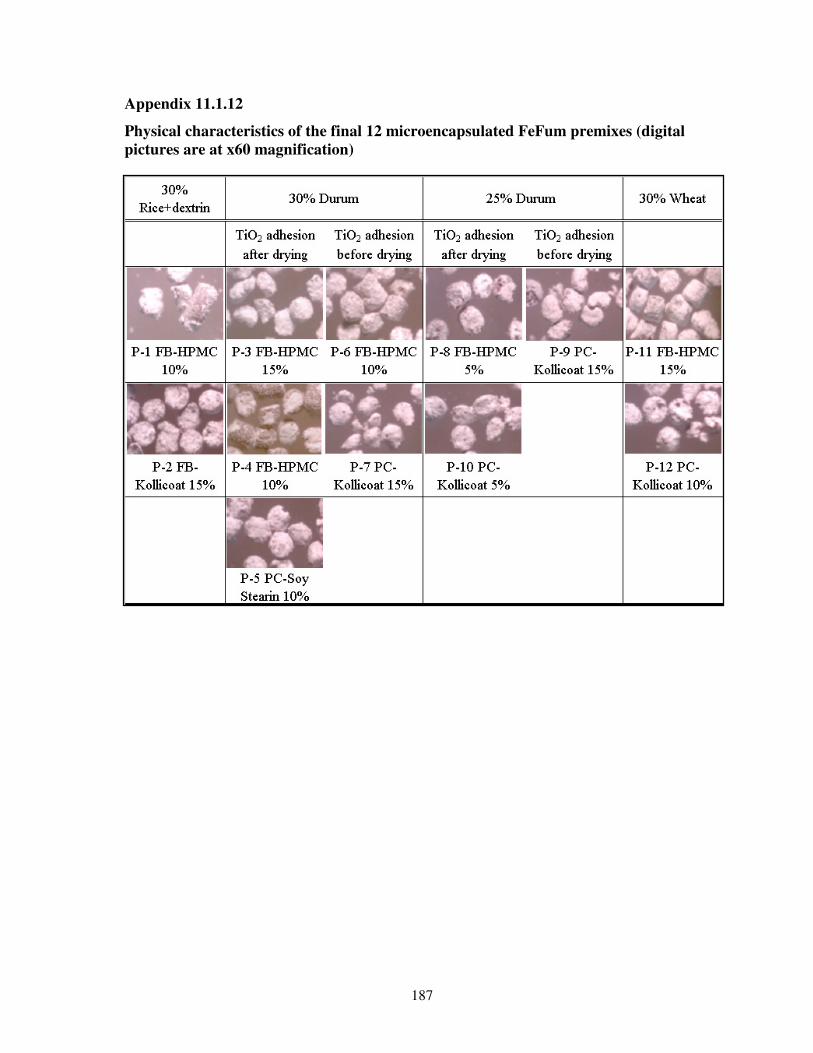
187
Appendix 11.1.12
Physical characteristics of the final 12 microencapsulated FeFum premixes (digital
pictures are at x60 magnification)

188
Appendix 11.1.13
SEM images of the final 12 microencapsulated FeFum premixes (at ~5000
magnification)
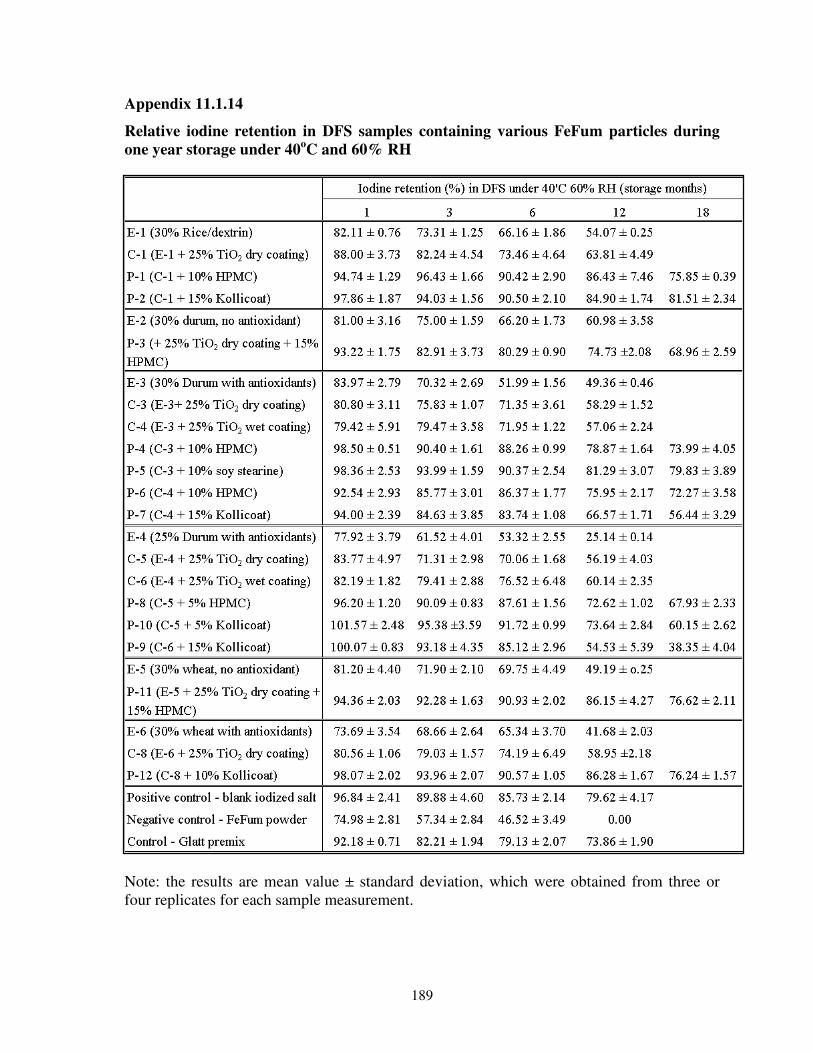
189
Appendix 11.1.14
Relative iodine retention in DFS samples containing various FeFum particles during
one year storage under 40oC and 60% RH
Note: the results are mean value ± standard deviation, which were obtained from three or four replicates for each sample measurement.

190
Appendix 11.1.15
Ferrous iron retention in formulated FeFum particles and in DFS samples, when
stored at the ambient condition and the higher conditions of 40oC & 60% RH,
respectively
Ferrous iron retention (%)
t=0 at the beginning of storage
t=10 months at room condition in the
absence of iodine
t=12 months at higher storage conditions in
DFS in the presence of iodine
E-1 (30% Rice/dextrin) 93.04 ± 0.71 89.54 ± 2.55 84.69 ± 1.42
C-1 (E-1 + 25% TiO2 dry coating) 92.90 ± 1.56 91.86 ± 1.42 91.38 ± 0.81
P-1 (C-1 + 10% HPMC) 94.02 ± 0.34 93.53 ± 2.97 89.01 ± 0.95
P-2 (C-1 + 15% Kollicoat) 94.18 ± 3.06 93.66 ± 2.61 92.77 ± 2.18
E-2 (30% durum, no antioxidant) 95.32 ± 1.92 94.12 ± 4.07 86.05 ± 2.52
P-3 (+ 25% TiO2 dry coating + 15% HPMC)
96.17 ± 1.09 95.37 ± 5.74 94.29 ± 1.58
E-3 (30% Durum with antioxidants) 91.79 ± 0.76 88.56 ± 5.05 85.69 ± 2.96
C-3 (E-3+ 25% TiO2 dry coating) 93.28 ± 1.23 89.29 ± 1.46 83.47 ± 0.45
C-4 (E-3 + 25% TiO2 wet coating) 94.46 ± 1.82 92.09 ± 2.62 87.89 ± 1.85
P-4 (C-3 + 10% HPMC) 96.53 ± 1.20 95.23 ± 2.87 93.83 ± 0.79
P-5 (C-3 + 10% soy stearine) 90.88 ± 1.04 90.86 ± 1.05 88.66 ± 2.74
P-6 (C-4 + 10% HPMC) 95.77 ± 0.64 93.72 ± 1.72 90.19 ± 1.35
P-7 (C-4 + 15% Kollicoat) 94.73 ± 0.59 92.03 ± 3.08 92.86 ± 1.96
E-4 (25% Durum with antioxidants) 95.43 ± 0.32 90.03 ± 6.51 82.43 ± 1.89
C-5 (E-4 + 25% TiO2 dry coating) 96.44 ± 0.44 93.58 ± 1.15 85.44 ± 4.56
C-6 (E-4 + 25% TiO2 wet coating) 95.34 ± 0.31 94.89 ± 3.39 85.74 ± 2.52
P-8 (C-5 + 5% HPMC) 97.92 ± 1.44 96.15 ± 2.84 97.69 ± 7.24
P-10 (C-5 + 5% Kollicoat) 95.93 ± 1.39 91.84 ± 1.29 95.30 ± 1.15
P-9 (C-6 + 15% Kollicoat) 95.76 ± 1.25 94.21 ± 2.64 94.62 ± 1.07
E-5 (30% wheat, no antioxidant) 92.50 ± 1.02 92.15 ± 2.05 85.82 ± 1.29
P-11 (E-5 + 25% TiO2 dry coating + 15% HPMC)
95.52 ± 0.55 93.83 ± 4.52 91.93 ± 1.33
E-6 (30% wheat with antioxidants) 93.77 ± 2.08 90.01 ± 1.84 81.08 ± 0.53
C-8 (E-6 + 25% TiO2 dry coating) 93.45 ± 3.15 92.15 ± 2.43 90.84 ± 1.41
P-12 (C-8 + 10% Kollicoat) 93.86 ± 0.81 89.63 ± 0.87 91.05 ± 1.61
Control - Glatt premix 97.88 ± 0.11 95.69 ± 1.31 94.13 ± 2.02
Control - FeFum powder 99.58 ± 0.42 98.81 ± 0.87 79.35 ± 5.16
Note: the results are mean value ± standard deviation, which were obtained from three or four replicates for each sample measurement.

191
Appendix 11.1.16
Detailed data processing for analysing iodine-iron interaction in DFS

192
Appendix 11.2 Detailed Analytical Methods and Results in Ultra Rice®
Study
Appendix 11.2.1 Ranking scheme for measurement of grain integrity during soaking
and cooking
Grain
integrity
during
soaking
(Ranking)
Observation (after 10 minutes)
or
Evaluation criteria
Microscopic pictures
(x10 magnification)
0
All grains are completely disintegrated,
and it is hard to identify individual
grains.
1 Most grains are disintegrated with
further loss of the shape.
2 Most cracked grains start to
disintegrate and lose the original shape.
3 All grains crack but still retain
individual shape.

193
4 Most grains just start to crack.
5 Almost all grain retain intactness
with rare cracking.
Reference
- natural
rice
All grains retain perfect shape and
surface morphology.

194
Grain
integrity
after
cooking
(ranking)
Observation
or
Evaluation criteria
Microscopic pictures (x10
magnification)
0
Individual grains lose their shape
completely, forming a one-piece rice
cake after cooking.
1 Most grains lose their shape and stick
together.
2 Most grains stick together,
still individual grains can be identified.
3 Individual grain retains its shape
but sticks to some of other grains.

195
4 Most grains retain individual shape
with rare sticking.
5 All grains retain individual shape and
intactness, similar to the natural rice.
Reference -
natural rice
All grains retain perfect shape and
surface morphology.
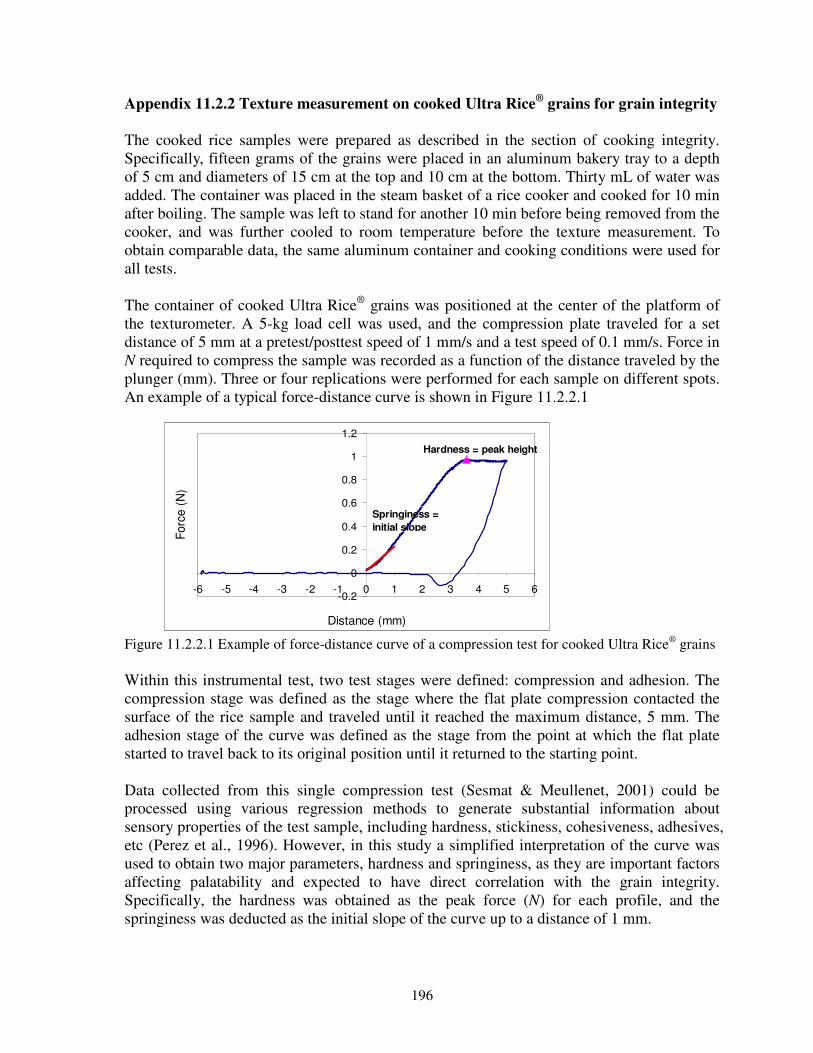
196
Appendix 11.2.2 Texture measurement on cooked Ultra Rice®
grains for grain integrity
The cooked rice samples were prepared as described in the section of cooking integrity. Specifically, fifteen grams of the grains were placed in an aluminum bakery tray to a depth of 5 cm and diameters of 15 cm at the top and 10 cm at the bottom. Thirty mL of water was added. The container was placed in the steam basket of a rice cooker and cooked for 10 min after boiling. The sample was left to stand for another 10 min before being removed from the cooker, and was further cooled to room temperature before the texture measurement. To obtain comparable data, the same aluminum container and cooking conditions were used for all tests. The container of cooked Ultra Rice® grains was positioned at the center of the platform of the texturometer. A 5-kg load cell was used, and the compression plate traveled for a set distance of 5 mm at a pretest/posttest speed of 1 mm/s and a test speed of 0.1 mm/s. Force in N required to compress the sample was recorded as a function of the distance traveled by the plunger (mm). Three or four replications were performed for each sample on different spots. An example of a typical force-distance curve is shown in Figure 11.2.2.1
Figure 11.2.2.1 Example of force-distance curve of a compression test for cooked Ultra Rice® grains
Within this instrumental test, two test stages were defined: compression and adhesion. The compression stage was defined as the stage where the flat plate compression contacted the surface of the rice sample and traveled until it reached the maximum distance, 5 mm. The adhesion stage of the curve was defined as the stage from the point at which the flat plate started to travel back to its original position until it returned to the starting point. Data collected from this single compression test (Sesmat & Meullenet, 2001) could be processed using various regression methods to generate substantial information about sensory properties of the test sample, including hardness, stickiness, cohesiveness, adhesives, etc (Perez et al., 1996). However, in this study a simplified interpretation of the curve was used to obtain two major parameters, hardness and springiness, as they are important factors affecting palatability and expected to have direct correlation with the grain integrity. Specifically, the hardness was obtained as the peak force (N) for each profile, and the springiness was deducted as the initial slope of the curve up to a distance of 1 mm.
-0.2
0
0.2
0.4
0.6
0.8
1
1.2
-6 -5 -4 -3 -2 -1 0 1 2 3 4 5 6
Distance (mm)
Forc
e (
N)
Springiness =
initial slope
Hardness = peak height

197
Appendix 11.2.3
Detailed compositions of the final 4 formulations used for verifying the optimal internal
gelation systems in the actual nutrient-fortified formulations
Table 11.2.3.1 Formulation composition with the best ratio of the internal gelation system used in the vitamin A fortified Ultra Rice® formula
Vitamin A formula using the optimal ratio of
alginate/CaSO4/STPP (%) Note
Vitamin A palmitate (VAP) 250,000 IU 0.72 Selected nutrient
BHA 0.01
BHT 0.01
Sodium erythorbate (replacing vitamin C) 0.52
Citric acid 0.50
Antioxidant system
STPP (sodium tripolyphosphate) 0.60
Alginate (Danisco FD175) 3.00
CaSO4 3.00
Internal gelation system
Shortening 2.50
Rice flour 89.14
Water (on the weight basis of all dry ingredients) 32
Structural ingredients
Total (dry ingredients) 100
Table 11.2.3.2 Formulation composition with the best ratio of the internal gelation system used in the multi-iron Ultra Rice
® formula
Multiple-iron formula using the optimal ratio of
alginate/CaSO4/STPP (%) Note
Thiamine mononitrate 0.07
Folic acid 0.03
Ferric pyrophosphate (FePP) 3.68
Zinc oxide (ZnO) 0.42
Selected nutrients
BHA 0.01
BHT 0.01
Citric acid 0.50
Antioxidant system
STPP (sodium tripolyphosphate) 0.60
Alginate (Danisco FD175) 3.00
CaSO4 3.00
Internal gelation system
Titanium dioxide (TiO2) 1.00 Colour-masking agent
Shortening 2.50
Rice flour 85.18
Water (on the weight basis of all dry ingredients) 32
Structural ingredients
Total (dry ingredients) 100

198
Table 11.2.3.3 Formulation composition with the best ratio of the internal gelation system used in the vitamin A fortified formula with addition of HPMC as the texture enhancer and glutinous rice flour in place of regular rice flour
Vitamin A formula using the optimal ratio of
alginate/CaSO4/STPP and glutinous flour (%) Note
Vitamin A palmitate (VAP) 250,000 IU 0.72 Selected nutrient
BHA 0.01
BHT 0.01
Sodium erythorbate (replacing vitamin C) 0.52
Citric acid 0.50
Antioxidant system
STPP (sodium tripolyphosphate) 0.60
Alginate (ISP DMF) 3.00
CaSO4 3.00
Internal gelation system
HPMC (Methocel E3) 3.00 Extra binding agent
Shortening 2.50
Glutinous rice flour 86.14
Water (on the weight basis of all dry ingredients) 32
Structural ingredients
Total (dry ingredients) 100
Table 11.2.3.4 Formulation composition with the best ratio of the internal gelation system used in the multi-iron formula with addition of HPMC as the texture enhancer and glutinous rice flour in place of regular rice flour
Multi-iron formula using the optimal ratio of
alginate/CaSO4/STPP and glutinous flour (%) Note
Thiamine mononitrate 0.07
Folic acid 0.03
Ferric pyrophosphate (FePP) 3.68
Zinc oxide (ZnO) 0.42
Selected nutrients
BHA 0.01
BHT 0.01
Citric acid 0.50
Antioxidant system
STPP (sodium tripolyphosphate) 0.60
Alginate (ISP DMF) 3.00
CaSO4 3.00
Internal gelation system
HPMC (Methocel E6) 3.00 Extra binding agent
Shortening 2.50
Glutinous rice flour 83.18
Water (on the weight basis of all dry ingredients) 32
Structural ingredients
Total (dry ingredients) 100

199
Appendix 11.2.4 XPS and ToF-SIMS Measurements on Ultra Rice®
Figure 11.2.4.1a XPS profile of Ca-free reconstituted grains - outside
Figure 11.2.4.1b XPS profile of Ca-free reconstituted grains – cross-section
0.00E+00
1.00E+04
2.00E+04
3.00E+04
4.00E+04
5.00E+04
6.00E+04
7.00E+04
8.00E+04
9.00E+04
1.00E+05
010020030040050060070080090010001100
Counts
/ s
Binding Energy (eV)
Survey1 Scan, 58.1 s, 400µm, CAE 200.0, 1.00 eV
C1s
Ca2p
O1s
Elemental ID and Quantification
Name Peak BE FWHM eV Area (P) CPS.eV At. % SF
C1s 285.03 2.50 337978.72 87.42 1.000
Ca2p 346.14 0.00 -165.05 0.00 5.070
O1s 532.78 3.03 124012.23 12.58 2.930
0.00E+00
1.00E+04
2.00E+04
3.00E+04
4.00E+04
5.00E+04
6.00E+04
7.00E+04
010020030040050060070080090010001100
Counts
/ s
Binding Energy (eV)
Survey1 Scan, 58.1 s, 400µm, CAE 200.0, 1.00 eV
C1s
Ca2p
O1s
Elemental ID and Quantification
Name Peak BE FWHM eV Area (P) CPS.eV At. % SF
C1s 285.03 2.50 241154.11 87.36 1.000
Ca2p 346.93 3.32 2681.98 0.20 5.070
O1s 532.58 3.12 87596.30 12.44 2.930

200
Figure 11.2.4.2a XPS profile of the reconstituted grains made with CaCl2 over-spray process - outside layer
Figure 11.2.4.2b XPS profile of the reconstituted grains made with CaCl2 over-spray process
- cross-section
0.00E+00
2.00E+04
4.00E+04
6.00E+04
8.00E+04
1.00E+05
1.20E+05
1.40E+05
1.60E+05
010020030040050060070080090010001100
Coun
ts / s
Binding Energy (eV)
Survey1 Scan, 58.1 s, 400µm, CAE 200.0, 1.00 eV
C1s
Ca2p
O1s
Elemental ID and Quantification
Name Peak BE FWHM eV Area (P) CPS.eV At. % SF
C1s 284.93 2.51 423687.31 89.13 1.000
Ca2p 348.09 1.28 1950.11 0.08 5.070
O1s 532.63 3.13 130769.21 10.78 2.930
0.00E+00
1.00E+04
2.00E+04
3.00E+04
4.00E+04
5.00E+04
6.00E+04
010020030040050060070080090010001100
Coun
ts / s
Binding Energy (eV)
Survey1 Scan, 58.1 s, 400µm, CAE 200.0, 1.00 eV
C1s
Ca2p
O1s
Elemental ID and Quantification
Name Peak BE FWHM eV Area (P) CPS.eV At. % SF
C1s 284.97 2.74 223073.24 84.07 1.000
Ca2p 348.44 0.00 1223.70 0.09 5.070
O1s 532.68 3.04 107203.13 15.84 2.930

201
Figure 11.2.4.3a XPS profile of the reconstituted grains made with internal gelation - outside
Figure 11.2.4.3b XPS profile of the reconstituted grains made with internal gelation - cross-section
0.00E+00
1.00E+04
2.00E+04
3.00E+04
4.00E+04
5.00E+04
6.00E+04
7.00E+04
8.00E+04
9.00E+04
1.00E+05
010020030040050060070080090010001100
Coun
ts / s
Binding Energy (eV)
Survey1 Scan, 58.1 s, 400µm, CAE 200.0, 1.00 eV
C1s
Ca2p
O1s
Elemental ID and Quantification
Name Peak BE FWHM eV Area (P) CPS.eV At. % SF
C1s 285.04 2.52 307129.94 88.58 1.000
Ca2p 347.71 1.32 4157.97 0.24 5.070
O1s 533.21 3.29 98867.76 11.18 2.930
0.00E+00
1.00E+04
2.00E+04
3.00E+04
4.00E+04
5.00E+04
6.00E+04
010020030040050060070080090010001100
Counts
/ s
Binding Energy (eV)
Survey1 Scan, 58.1 s, 400µm, CAE 200.0, 1.00 eV
C1s
Ca2p
O1s
Elemental ID and Quantification
Name Peak BE FWHM eV Area (P) CPS.eV At. % SF
C1s 285.01 2.49 178356.87 87.86 1.000
Ca2p 347.03 1.70 1836.69 0.18 5.070
O1s 533.14 3.41 61878.55 11.95 2.930

202
Figure 11.2.4.4 ToF-SIMS profile of the Ca-free grains (left: outside layer; right: cross-section)
Figure 11.2.4.5 ToF-SIMS profile of the grains made with CaCl2 overspray (left: outside layer; right: cross-section)
Figure 11.2.4.6 ToF-SIMS profile of the grains made with internal gelation (left: outside layer; right: cross-section)
Sample Parameter:
Sample:
Origin:
sample A
File: A-XS_2P.dat
Spectrum Parameter:
Polarity:
Area / µm²:
Time / s:
PI dose:
Comments:
positive
100x100
30
0.00E+000
30sec Ar #kv 1000µm 85nA;bi3 hc;
Ca
C3H4
mass / u39.6 39.7 39.8 39.9 40.0 40.1 40.2 40.3 40.4
1x10
1.0
2.0
3.0
4.0
5.0
6.0
Inte
nsity
Sample Parameter:
Sample:
Origin:
Sample B - outer surface
File: B-OS_2P.dat
Spectrum Parameter:
Polarity:
Area / µm²:
Time / s:
PI dose:
Comments:
positive
100x100
30
0.00E+000
after brief sputter clean;;
Ca
C3H4
mass / u39.6 39.7 39.8 39.9 40.0 40.1 40.2 40.3 40.4
1x10
1.0
2.0
3.0
4.0
5.0
6.0
Inte
nsity
Sample Parameter:
Sample:
Origin:
sampleB
File: B-XS_2P.dat
Spectrum Parameter:
Polarity:
Area / µm²:
Time / s:
PI dose:
Comments:
positive
100x100
30
0.00E+000
ar 3kb 100µm 30sec 85nA;bi3 hc;
C3H4
mass / u39.6 39.7 39.8 39.9 40.0 40.1 40.2 40.3 40.4
1x10
1.0
2.0
3.0
4.0
5.0
6.0In
tensity
Sample Parameter:
Sample:
Origin:
Sample A - outer surface
File: A-OS_2P.dat
Spectrum Parameter:
Polarity:
Area / µm²:
Time / s:
PI dose:
Comments:
positive
100x100
30
0.00E+000
after brief sputter clean;;
Ca
C3H4
mass / u39.6 39.7 39.8 39.9 40.0 40.1 40.2 40.3 40.4
1x10
0.2
0.4
0.6
0.8
1.0
Inte
nsity
Sample Parameter:
Sample:
Origin:
Sample C - outer surface
File: C-OS_2P.dat
Spectrum Parameter:
Polarity:
Area / µm²:
Time / s:
PI dose:
Comments:
positive
100x100
30
0.00E+000
after brief sputter clean;;
Ca
C3H4
mass / u39.6 39.7 39.8 39.9 40.0 40.1 40.2 40.3 40.4
2x10
0.5
1.0
1.5
Inte
nsity
Sample Parameter:
Sample:
Origin:
sampleC
File: C-XS_2P.dat
Spectrum Parameter:
Polarity:
Area / µm²:
Time / s:
PI dose:
Comments:
positive
100x100
30
0.00E+000
Ar 3kv 1000µm 30sec 85nA;bi3 hc;
Ca
C3H4
mass / u39.6 39.7 39.8 39.9 40.0 40.1 40.2 40.3 40.4
2x10
0.2
0.4
0.6
0.8
1.0
1.2
1.4
Inte
nsity
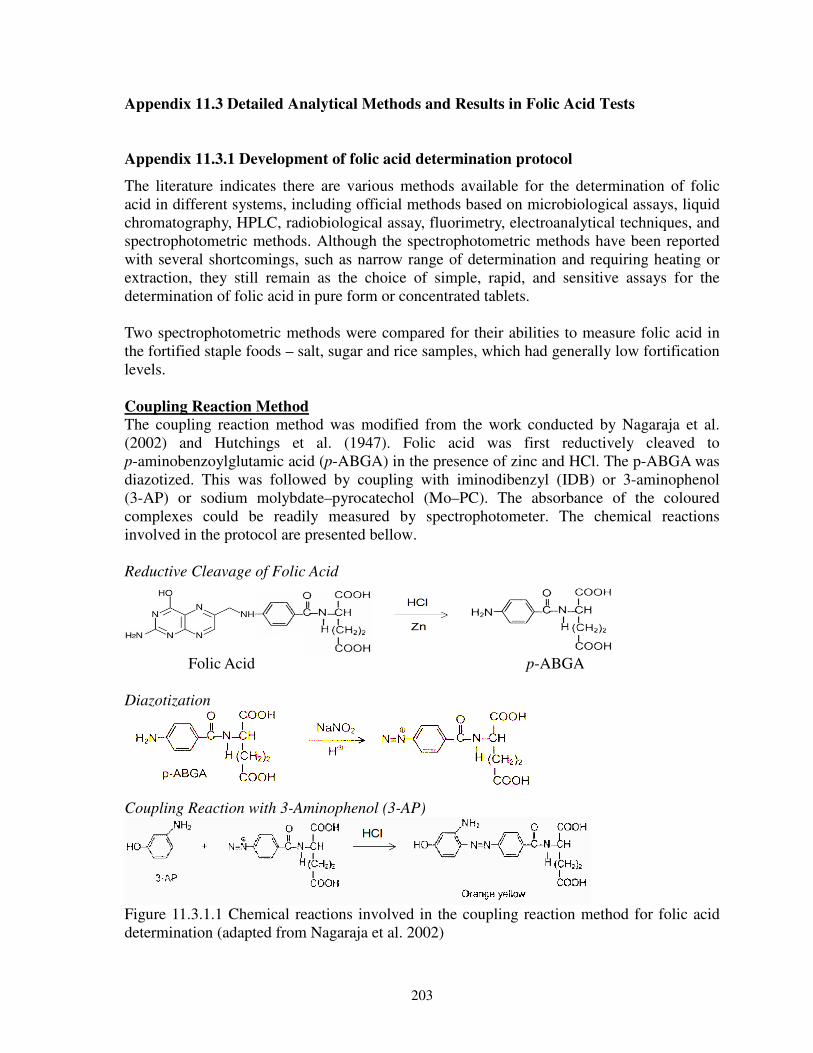
203
Appendix 11.3 Detailed Analytical Methods and Results in Folic Acid Tests
Appendix 11.3.1 Development of folic acid determination protocol
The literature indicates there are various methods available for the determination of folic acid in different systems, including official methods based on microbiological assays, liquid chromatography, HPLC, radiobiological assay, fluorimetry, electroanalytical techniques, and spectrophotometric methods. Although the spectrophotometric methods have been reported with several shortcomings, such as narrow range of determination and requiring heating or extraction, they still remain as the choice of simple, rapid, and sensitive assays for the determination of folic acid in pure form or concentrated tablets. Two spectrophotometric methods were compared for their abilities to measure folic acid in the fortified staple foods – salt, sugar and rice samples, which had generally low fortification levels. Coupling Reaction Method
The coupling reaction method was modified from the work conducted by Nagaraja et al. (2002) and Hutchings et al. (1947). Folic acid was first reductively cleaved to p-aminobenzoylglutamic acid (p-ABGA) in the presence of zinc and HCl. The p-ABGA was diazotized. This was followed by coupling with iminodibenzyl (IDB) or 3-aminophenol (3-AP) or sodium molybdate–pyrocatechol (Mo–PC). The absorbance of the coloured complexes could be readily measured by spectrophotometer. The chemical reactions involved in the protocol are presented bellow.
Reductive Cleavage of Folic Acid
Folic Acid p-ABGA
Diazotization
Coupling Reaction with 3-Aminophenol (3-AP)
Figure 11.3.1.1 Chemical reactions involved in the coupling reaction method for folic acid determination (adapted from Nagaraja et al. 2002)

204
From the three coupling reagents 3-aminophenol (3-AP), iminodibenzyl, and sodium molybdate-pyrocatechol, 3-AP was chosen due to its complex having longer stability and greater range for detection. Also it has no interference with other vitamins existing in the same sample system. Nevertheless, it is a common chemical with little hazard to human health. Direct Extraction Method
The direct extraction method was adopted from Ghasemi & Vosough’s work (2002), in which folic acid and other B vitamins were directly extracted into diluted NaOH solution and measured by uv/vis spectrophotometry at different wavelengths. Specifically, 0.01 N NaOH was used to extract folic acid in our study, and then measured at the wavelength of 284 nm. Results & Discussion
The initial scans of the standard solutions prepared by two methods showed similar folic acid absorbance spectra to the ones indicated in the literature. The calibration curves derived are shown in Figures 11.3.1.2 and 11.3.1.3. Clearly, good correlations between the folic acid (FA) concentration and the absorbance values were obtained for the both methods, with the values of correlation coefficient close to 1. However, the slope of the calibration curve from the coupling method was 0.0377, which was lower than the value given in the literature (0.0701). This lead to a detection limit of ~2.5 µg/mL for the method since the absorbance reading was below 0.1 AU at this point. From the calibration curve of the direct extraction method it seemed that this method could accurately measure the folic acid concentration as low as 1 µg/mL. Based on the results, the direct extraction method was chosen for determination of folic acid in fortified salt and sugar, due to its simple protocol, better time efficiency, and relatively higher sensitivity to lower concentrations of folic acid, whereas the coupling method was used in the determination of folic acid in the reconstituted Ultra Rice®, due mainly to its higher specificity which was expected to generate reliable results in the presence of other components in the relatively complex rice flour matrix.

205
Figure 11.3.1.2 Calibration curve for folic acid determination with the coupling reaction method
Figure 11.3.1.3 Calibration curve for folic acid determination with the direct extraction method
FA Calibration Curve - Coupling Method
y = 0.0377x + 0.0069
R2 = 0.9978
0
0.05
0.1
0.15
0.2
0 1 2 3 4 5
FA Concentration (ug/mL)
Ab
so
rba
nce
(A
U)
FA Calibration Curve - Direct Extraction Method
y = 0.0535x + 0.0142
R2 = 0.9999
0
0.2
0.4
0.6
0.8
1
1.2
1.4
0 2 4 6 8 10 12 14 16 18 20
Folic acid Conc. (ppm)
Ab
s
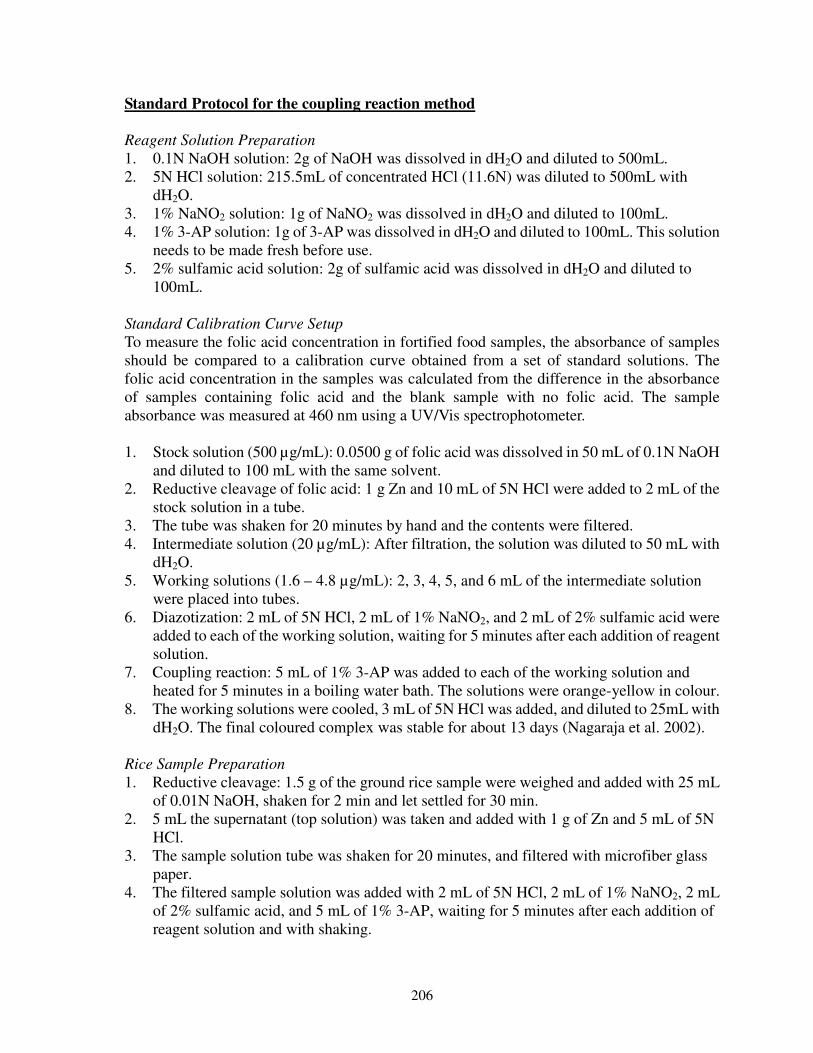
206
Standard Protocol for the coupling reaction method
Reagent Solution Preparation
1. 0.1N NaOH solution: 2g of NaOH was dissolved in dH2O and diluted to 500mL. 2. 5N HCl solution: 215.5mL of concentrated HCl (11.6N) was diluted to 500mL with
dH2O. 3. 1% NaNO2 solution: 1g of NaNO2 was dissolved in dH2O and diluted to 100mL. 4. 1% 3-AP solution: 1g of 3-AP was dissolved in dH2O and diluted to 100mL. This solution
needs to be made fresh before use. 5. 2% sulfamic acid solution: 2g of sulfamic acid was dissolved in dH2O and diluted to
100mL.
Standard Calibration Curve Setup
To measure the folic acid concentration in fortified food samples, the absorbance of samples should be compared to a calibration curve obtained from a set of standard solutions. The folic acid concentration in the samples was calculated from the difference in the absorbance of samples containing folic acid and the blank sample with no folic acid. The sample absorbance was measured at 460 nm using a UV/Vis spectrophotometer. 1. Stock solution (500 µg/mL): 0.0500 g of folic acid was dissolved in 50 mL of 0.1N NaOH
and diluted to 100 mL with the same solvent. 2. Reductive cleavage of folic acid: 1 g Zn and 10 mL of 5N HCl were added to 2 mL of the
stock solution in a tube. 3. The tube was shaken for 20 minutes by hand and the contents were filtered. 4. Intermediate solution (20 µg/mL): After filtration, the solution was diluted to 50 mL with
dH2O. 5. Working solutions (1.6 – 4.8 µg/mL): 2, 3, 4, 5, and 6 mL of the intermediate solution
were placed into tubes. 6. Diazotization: 2 mL of 5N HCl, 2 mL of 1% NaNO2, and 2 mL of 2% sulfamic acid were
added to each of the working solution, waiting for 5 minutes after each addition of reagent solution.
7. Coupling reaction: 5 mL of 1% 3-AP was added to each of the working solution and heated for 5 minutes in a boiling water bath. The solutions were orange-yellow in colour.
8. The working solutions were cooled, 3 mL of 5N HCl was added, and diluted to 25mL with dH2O. The final coloured complex was stable for about 13 days (Nagaraja et al. 2002).
Rice Sample Preparation
1. Reductive cleavage: 1.5 g of the ground rice sample were weighed and added with 25 mL of 0.01N NaOH, shaken for 2 min and let settled for 30 min.
2. 5 mL the supernatant (top solution) was taken and added with 1 g of Zn and 5 mL of 5N HCl.
3. The sample solution tube was shaken for 20 minutes, and filtered with microfiber glass paper.
4. The filtered sample solution was added with 2 mL of 5N HCl, 2 mL of 1% NaNO2, 2 mL of 2% sulfamic acid, and 5 mL of 1% 3-AP, waiting for 5 minutes after each addition of reagent solution and with shaking.

207
5. The sample solution was heated in a boiling water bath for 5 min, and cooled to the room temperature. The resulting sample solution was diluted with dH2O to 25 mL for the spectrometry measurement.
Blank Solution Preparation
1. 2 mL of 5N HCl, 2 mL of 1% NaNO2, 2 mL of 2% sulfamic acid, and 5 mL of 1% 3-AP were added to a tube, waiting for 5 minutes between each addition of reagent solution.
2. The tube was heated for 5 minutes in a boiling water bath and cooled. 3. 3 mL of 5N HCl was added and the solution was diluted to 25 mL with dH2O. Absorbance Measurement
1. The prepared solutions were transferred to 10 mm cuvettes. 2. The wavelength of light was set to 460 nm on the UV/Vis spectrophotometer. 3. The absorbance was measured for the blank and sample solutions with four replicates. 4. The difference between the absorbance of the sample and the blank solution was used to
obtain the concentration of folic acid in the solution through the standard calibration curve obtained previously.
5. The folic acid concentration in the sample was calculated by: Folic acid concentration in sample (µg/g) = conc. (µg/mL) x 25 / 5 x 25 / mass (g) 6. The average and the standard deviation of the folic acid concentration were calculated from the four replicates for each sample.

208
Standard Protocol for the direct extraction method
Reagent Solution Preparation
1. 0.01N NaOH solution: 0.4 g of NaOH was dissolved in dH2O and diluted to 1L. Standard Calibration Curve Setup
1. Stock solution (500 µg/mL): 0.0500 g of folic acid was dissolved in 0.01N NaOH and diluted to 100 mL with the same solvent.
2. Intermediate solution (50 µg/mL): 10 mL of the stock solution was diluted to 100 mL with 0.01N NaOH.
3. Working solutions (1.0 – 20 µg/mL): 0.5, 1, 2, 5, and 10 mL of the intermediate solution were diluted to 25 mL with dH2O.
4. Blank solution: 0.01N NaOH. Sugar Sample Preparation
1. 5g of the sugar sample was added to 25 mL of 0.01N NaOH and shaken on a vortex to dissolve the sample. Four replicates were taken.
2. 5mL of hexane was added and shaken on a vortex for 5 minutes. 3. The hexane was decanted. Steps 2 & 3 were repeated once. 4. The aqueous solution was filtered by a syringe filter membrane with a pore size of 0.45µm. 5. Blank solution: 5 g of blank sugar sample was used for steps 1 to 4 of sugar sample
preparation. Salt Sample Preparation
1. 4g of the salt sample was added to 20 mL of 0.01N NaOH and shaken on a vortex to dissolve the sample. Four replicates were taken.
2. The solution was filtered with a syringe filter membrane with a pore size of 0.2 or 0.45µm.
3. Blank solution: 4 g of blank salt sample was used for steps 1 to 2 of salt sample preparation.
Absorbance Measurement
1. The prepared solutions were transferred to 10 mm cuvettes. 2. The wavelength of light was set to 284 nm on the UV/Vis spectrophotometer. 3. The absorbance was measured for the blank sample solution and four replicates of the
sample solutions. 4. The difference between the absorbance of the sample and the blank solution was used to
obtain the concentration of folic acid in the solution through the standard calibration curve obtained previously.
5. The folic acid concentration in the sugar sample was calculated by: Folic acid concentration in sugar sample (µg/g) = conc. (µg/mL) x 25 / mass (g) 6. The folic acid concentration in the salt sample was calculated by: Folic acid concentration in salt sample (µg/g) = conc. (µg/mL) x 20 / mass (g)
The average and the standard deviation of the folic acid concentration were calculated from the four replicates for each sample.

209
Appendix 11.3.2
Colour stability of the double or triple fortified Guatemalan salt or sugar samples after
3 months storage under 40oC and 60% RH (Microscopic pictures were taken at x60
magnification)

210
Appendix 11.3.3
Folic acid-containing multiple fortified Ultra Rice®
appearance (microscopic pictures
were taken at x10 magnification)
Figure 11.3.3.1 Comparison of Ultra Rice® grains in colour made with various FePP sources
Figure 11.3.3.2 Comparison of Ultra Rice® grains in colour made with different addition levels of FePP (source of Dr. Lohmann) and TiO2
Colombian FePP
Fortitech FePP
Lohmann FePP
SunActive FePP
Native rice
3% FePP
1% TiO2
2% TiO2
3% TiO2
2% FePP
1% FePP
Native rice