
Physical properties of gluten-free bread caused by water ...
i
DEVELOPMENT OF GLUTEN-FREE BREAD FORMULATIONS FOR BAKING
IN INFRARED-MICROWAVE COMBINATION OVEN
A THESIS SUBMITTED TO
THE GRADUATE SCHOOL OF NATURAL AND APPLIED SCIENCES OF
MIDDLE EAST TECHNICAL UNIVERSITY
BY
İLKEM DEMİRKESEN MERT
IN PARTIAL FULFILLMENT OF THE REQUIREMENTS FOR
THE DEGREE OF DOCTOR OF PHILOSOPHY
IN
FOOD ENGINEERING
JULY 2013

ii
Approval of the thesis:
iii
Approval of the thesis:
DEVELOPMENT OF GLUTEN-FREE BREAD FORMULATIONS FOR BAKING IN
INFRARED-MICROWAVE COMBINATION OVEN
submitted by İLKEM DEMİRKESEN MERT in partial fulfillment of the requirements for
the degree of Doctor of Philosophy in Food Engineering Department, Middle East
Technical University by,
Prof. Dr. Canan Özgen _______________
Dean, Graduate School of Natural and Applied Sciences
Prof. Dr. Alev Bayındırlı _______________
Head of Department, Food Engineering Dept., METU
Prof. Dr. Servet Gülüm Şumnu _______________
Supervisor, Food Engineering Dept., METU
Prof. Dr. Serpil Şahin _______________
Co-Supervisor, Food Engineering Dept., METU
Examining Committee Members:
Prof. Dr. Hamit Köksel _______________
Food Engineering Dept., Hacettepe University
Prof. Dr. Servet Gülüm Şumnu _______________
Food Engineering Dept., METU
Prof. Dr. Alev Bayındırlı _______________
Food Engineering Dept., METU
Prof. Dr. Esra Yener _______________
Food Engineering Dept., METU
Assist. Prof. Dr. İlkay Şensoy _______________
Food Engineering Dept., METU
Date: 05.07.2013

iv
I hereby declare that all information in this document has been obtained and
presented in accordance with academic rules and ethical conduct. I also declare
that, as required by these rules and conduct, I have fully cited and referenced
all material and results that are not original to this work.
Name, Last name: İlkem Demirkesen Mert
Signature:
v
ABSTRACT
DEVELOPMENT OF GLUTEN-FREE BREAD FORMULATIONS FOR
BAKING IN INFRARED-MICROWAVE COMBINATION OVEN
Demirkesen Mert, İlkem
Ph.D., Department of Food Engineering
Supervisor: Prof. Dr. Servet Gülüm Şumnu
Co-Supervisor: Prof. Dr. Serpil Şahin
July 2013, 425 pages
The main objective of this study was to formulate gluten free breads based on
different flours, gums, and emulsifiers for baking in infrared-microwave combination
oven. In the first part of the study, the rheological properties of different gluten-free
bread dough formulations containing only rice flour and rice-chestnut flour blend
with different gums, gum blends and/or emulsifiers were evaluated. Power law
model and Herschel–Bulkley models were found to explain the flow behaviors of
rice and chestnut-rice dough formulations, respectively. The formulations with the
chestnut:rice flour ratio of 30:70 promoted the desired quality parameters of gluten-
free breads. Using tigernut flour in formulations improved the color of gluten-free
rice breads. Furthermore, gum blend and emulsifier DATEM addition were found to
be the necessary ingredients to obtain the desired physical properties in gluten-free
bread formulations.
In the second part of the study, Response Surface Methodology (RSM) was used to
optimize formulations and infrared-microwave baking conditions for gluten-free
breads. Breads containing 46.5% chestnut flour and 0.62% emulsifier and baked
using 40% infrared and 30% microwave power for 9 min had comparable quality
with conventionally baked ones.
The effects of different flours, gums, and emulsifiers on macro- and micro-structures
of the gluten-free breads baked in different ovens were studied by using image
analysis technique and Scanning Electron Microscope (SEM). The highest pore area
fraction values were obtained in breads prepared by replacement of 46% of rice flour
with chestnut flour containing xanthan–guar gum blend–DATEM mixture and baked
in an infrared–microwave combination oven. The addition of different gums and gum
blends on the crumb structures of gluten-free breads were evaluated by using X-ray
microtomography (X-ray μCT) and gluten-free breads prepared with the addition of
vi
xanthan, carboxyl methyl cellulose (CMC), xanthan-guar, xanthan-LBG and HPMC
had higher number of smaller pores with finer crumb structure.
Lastly, the effects of different formulations and storage time on staling of
conventionally and infrared-microwave baked breads were studied. Firmness,
moisture loss and retrogradation enthalpy values for all bread samples increased
significantly during storage. Retrogradation enthalpies and total crystallinity values
of breads did not show significant differences with baking method. Using chestnut
flour and xanthan-guar gum blend-DATEM mixture in formulations significantly
delayed staling of gluten-free breads by decreasing moisture loss, firmness,
retrogradation enthalpy, and total mass crystallinity.
Keywords: Chestnut flour, Emulsifier, Gluten-free bread, Gum, Infrared–microwave
combination baking, Rice flour, Tigernut flour.
vii
ÖZ
KIZILÖTESİ-MİKRODALGA KOMBİNASYONLU FIRIN İÇİN
GLUTENSIZ EKMEK FORMÜLASYONLARININ GELİŞTİRİLMESİ
Demirkesen Mert, İlkem
Doktora, Gıda Mühendisliği Bölümü
Tez Yöneticisi: Prof. Dr. Gülüm Şumnu
Ortak Tez Yöneticisi: Prof. Dr. Serpil Şahin
Temmuz 2013, 425 sayfa
Bu çalışmanın ana amacı kızılötesi-mikrodalga kombinasyonlu fırında pişirilmek
üzere farklı unlar, gamlar ve emülgatörler içeren glutensiz ekmeklerin
tasarlanmasıdır. Çalışmanın ilk kısmında, sadece pirinç unu ve pirinç-kestane unu
karışımlarıyla farklı gamlar, gam karışımları ve/veya farklı emülgatörler içeren
glutensiz ekmek hamurlarının reolojik özellikleri incelenmiştir. Power yasası ve
Herschel-Bulkley modelleri sırasıyla pirinç ve kestane-pirinç hamuru
formülasyonlarının akış davranışlarını açıklamakta uygun bulunmuştur.
Kestane:pirinç unu oranı 30:70 olan formülasyonlar istenilen kalite parametrelerini
sağlamıştır. Formülasyonlarda yer bademi unu kullanımı glütensiz pirinç
ekmeklerinin renklerini geliştirmiştir. Ayrıca, glutensiz ekmek formülasyonlarında
istenilen fiziksel özelliklerin elde edilebilmesi için gam karışımları ve emülgator
DATEM ilavesinin gerekli olduğu bulunmuştur.
Çalışmanın ikinci kısmında, glutensiz ekmekler için formülasyonları ve kızılötesi-
mikrodalga kombinasyonlu fırınlarda pişirme şartlarını optimize etmek amacıyla
Yanıt Yüzey Metodu kullanılmıştır. %46.5 kestane unu ve %0.62 emülgatör içeren
ve %40 kızılötesi ve %30 mikrodalga gücü kullanılarak 9 dakikada pişirilen
ekmekler konvansiyonel fırınlarda pişirilen ekmeklerle karşılaştırılabilir kaliteye
sahip olmuşlardır.
Görüntü analiz tekniği ve taramalı elektron mikroskobu kullanılarak farklı unların,
gamların ve emülgatörlerin farklı fırınlarda pişirilen glutensiz ekmeklerin makro ve
mikro yapıları üzerine etkileri incelenmiştir. En yüksek gözenek alan oranı pirinç
ununun % 46’sı yerine kestane unu eklenerek elde edilen ve ksantan−guar
gam−DATEM karışımı içeren ekmek formülasyonlarının kızıl ötesi−mikrodalga
kombinasyonlu fırınlarda pişirilmesiyle elde edilmiştir. Farklı gam ve gam
karışımları ilavesinin glutensiz ekmeklerin iç yapısına etkisi X-ray mikrotomografi
(X-ray μCT) kullanılarak değerlendirilmiştir ve ksantan, karboksi metil selüloz
viii
(CMC), ksantan-guar, ksantan-LBG ve HPMC ilavesi ile hazırlanan glutensiz
ekmekler yüksek sayıda küçük gözeneklerle iyi ekmek iç yapısı niteliğine sahip
olmuşlardır.
Son olarak, farklı formülasyonların ve saklama sürelerinin konvansiyonel ve kızıl
ötesi-mikrodalga kombinasyonlu fırınlarda pişirilen ekmeklerin bayatlamaları
üzerine etkileri belirlenmiştir. Ekmek örneklerinin sertlik, nem kaybı ve
retrogradasyon entalpi değerleri saklama sırasında önemli bir şekilde artmıştır.
Ekmeklerin retrogradasyon entalpileri ve toplam kristalleşme değerleri pişirme
yöntemine göre bir farklılık göstermemiştir. Formülasyonda kestane unu ve ksantan-
guar gam-DATEM karışımının kullanılması ekmeklerin bayatlamasını nem kaybını,
sertlik değerini, retrogradasyon entalpisini ve toplam kütle kristalleşmesini azalmak
suretiyle önemli bir şekilde geciktirmiştir.
Anahtar kelimeler: Kestane unu, Glutensiz ekmek, Gam, kızıl ötesi-mikrodalga
kombinasyonlu pişirme yöntemi, pirinç unu, yer bademi unu

ix
To My Grandmother’s Memory

x

xi
ACKNOWLEDGEMENT
I would like to express my sincere gratitude to my supervisor, Prof. Dr. Servet
Gülüm ŞUMNU and my co-supervisor, Prof. Dr. Serpil ŞAHİN for their continuous
support, outstanding guidance, energy, enthusiasm and valuable advices through this
study.
I also would like to extend my deep gratitude to Prof. Dr. Osvaldo Hector
Campanella for his wealth of knowledge and encouragement during my visit in the
USA. I also want to express my gratitude to Prof. Dr. Bruce Hamaker for his
valuable suggestions. I also want to express thanks to James BeMiller for valuable
advices. I also want to my express thanks to Prof. Dr. Martin Okos and Shivangi
Kelkar for their help about X-ray microtomography analysis. I would like to extend
my special thanks to Gordon Max Showalter, Leyla Kahyaoğlu, Simel Bağder, Anton
Terekhov and Mehtap Fevzioğlu for their help, support, encouragement and patience
during my visit in the USA. I would like to thank Prof. Dr. Ferhunde Us and İlknur
Gönenç for DSC measurements.
A very special thanks goes out to Prof. Dr. Ruşen Geçit, for his support,
understanding and kindness. He made a difference in my life and he provided me
with direction and encouragement and became more of a father, than a professor. I
would also like to thank Prof. Dr. Bekir Cemeroğlu for his motivation and
encouragement. I would like to extend my gratitude to members of my thesis
committee, Prof. Dr. Hamit Köksel and Assist. Prof. İlkay Şensoy for the assistance
they provided at all levels of the research project. It would be hard to imagine
completing the research without their support.
My sincere appreciation goes to Halil Mecit Öztop and Beste Bayramoğlu, my best
friends, for their endless support and unconditional love. My grateful thanks are
extended to Nalan Uysal Yazıcıoğlu, Filiz Köksel Üstündağ, Ceren Atay, and Zeynep
Ezgi Kurtpınar, my close friends, for their endless support, patience throughout this
study and love during my stressful days. Special acknowledgement must go to my
officemate Emrah Kırtıl for his endless support during my stressful days. My grateful
thanks are extended to Semin Özge Özkoç, İrem Alaçık, Betül Özdemir Söyler and
Bilge Uzun Özer for their support during the time I spent at METU. I would also like
to thank our all research assistants at our department especially, Betül Çilek, Elif
Yıldız, Sevil Çıkrıkçı, Hazal Turasan, Ayça Aydoğdu, Burçin Güzel and Bade
Tonyalı for their friendships.
Finally, as in everything that I have ever done, I am profoundly indebted to my sweet
family; my mother Sevil Demirkesen, my father Mustafa Demirkesen and my baby
sister Sinem Demirkesen for their endless and unconditional love and tireless
devotion throughout my life. I love them so much; they provided me everything in
my life and make me feel so lucky through my life. I would like express to my

xii
special appreciate to my husband Behiç Mert for his endless encouragement, his
patience and most important to make me happy. I married the best person out there
for me and I also feel very lucky to have such a wonderful husband and without
whom I simply would not have finished this PhD. Special thanks go out to my other
family members; my aunt Emel Kıroğlu, my uncle Fikret Kıroğlu, my cousins Murat,
Nuray and İrem Kıroğlu, and our new family members Poyraz Kıroğlu and my sweet
baby girl. Finally, my deepest thanks go to my Heros, my princess, grandmother &
angle Melahat Türkçüer and my prince & grandfather Mehmet Ali Türkçüer. This
study is the result of their support, encouragement, help and love and words are not
sufficient to express my gratitude to them. I dedicate this work to my big lost “my
grandmother, guide, balance in my life and hero” and hope that this work makes you
proud.
xiii
TABLE OF CONTENTS
ABSTRACT…………………………………………………………………………v
ÖZ…………………………………………………………………………………...vii
ACKNOWLEDGEMENTS………………………………………………………….xi
TABLE OF CONTENTS…………………………………………………………..xiii
LIST OF TABLES ………………………………………………………………….xv
LIST OF FIGURES ………………………………………………………………..xxi
CHAPTERS
1. INTRODUCTION ................................................................................... 1
1.1 Celiac Disease ................................................................................................. 1
1.1.1 The Difference between Wheat Sensitivity and Celiac Disease ............ 2 1.1.2 Symptoms of Celiac Disease .................................................................. 2 1.1.3 Screening for Celiac Disease ................................................................. 2 1.1.4 The Gluten-free Label Requirements ..................................................... 3
1.2 Gluten and Its Role in Breadmaking............................................................... 4
1.3 Gluten-free Flour Types ................................................................................. 5
1.3.1 Rice Flour ............................................................................................... 5 1.3.2 Chestnut Flour ........................................................................................ 6 1.3.3 Tigernut Flour ........................................................................................ 7
1.4 Ingredients Used in Gluten-free Baked Products............................................ 8
1.4.1 Gums ...................................................................................................... 8 1.4.2 Emulsifiers ........................................................................................... 15
1.5 Rheological Properties of Gluten-free Dough Formulations ........................ 19
1.6 Infrared-Microwave Combination Baking of Foods..................................... 20
1.6.1 Mechanism of Microwave Heating ...................................................... 21 1.6.2 Mechanism of Infrared Heating ........................................................... 23 1.6.3 Studies on Infrared-microwave Combination Baking of Foods ........... 25
1.7 Structural Analysis of Foods ........................................................................ 26
1.7.1 Macro-structure of Bakery Products .................................................... 27 1.7.2 Micro-structure of Bakery Products ..................................................... 27
1.8 Staling in Gluten-free Breads ....................................................................... 28
1.9 Optimization by Response Surface Methodology (RSM) ............................ 30
1.10 Objectives of the Study ................................................................................. 35
2. MATERIALS AND METHODS .......................................................... 37
2.1 Materials ....................................................................................................... 37
2.2 Methods ........................................................................................................ 37
xiv
2.2.1 Breadmaking Procedure ....................................................................... 37 2.2.2 Baking .................................................................................................. 40 2.2.3 Analysis of Bread Macro-structure and Micro-structure ...................... 43 2.2.4 Optimization by RSM........................................................................... 45 2.2.5 Staling Analysis .................................................................................... 46 2.2.6 Statistical Analysis ............................................................................... 48
3. RESULTS AND DISCUSSION ............................................................ 49
3.1 Bread Quality and Dough Rheology of Gluten-free Rice Bread Formulations
49
3.1.1 Rheological Measurements .................................................................. 50 3.1.2 Baking Tests ......................................................................................... 60
3.2 Bread Quality and Dough Rheology of Gluten-free Chestnut-rice Bread
Formulations .......................................................................................................... 64
3.2.1 Rheological Measurements .................................................................. 65 3.2.2 Baking Tests ......................................................................................... 69
3.3 Optimization of Formulations and Infrared-microwave Combination Baking
Conditions of Chestnut-rice Breads ....................................................................... 75
3.4 Bread Quality of Gluten-free Tigernut-rice Bread Formulations .................. 85
3.5 Effects of Different Gums, Gum Blends and DATEM mixture and Flour
Types on Macro- and Micro-structure of Breads ................................................... 91
3.5.1 Effects of Different types of Gums, Gum Blends and DATEM mixture
on Microstructure of Rice Breads ...................................................................... 91 3.5.2 Effects of Chestnut flour and Xanthan-guar gum blend-DATEM
Mixture Addition on Macro-structure of Rice Breads ....................................... 96 3.5.3 Effects of Chestnut Flour and Xanthan-guar Gum Blend-DATEM
Mixture Addition on Microstructure of Rice Breads ....................................... 102
3.6 Effect of Xanthan-guar Gum Blend-DATEM Mixture and Chestnut flour on
Staling of Gluten-free Rice Breads ...................................................................... 106
3.6.1 Moisture content ................................................................................. 106 3.6.2 Firmness ............................................................................................. 108 3.6.3 DSC (Differential Scanning Calorimeter) .......................................... 111 3.6.4 X-ray Diffraction ................................................................................ 113 3.6.5 FT-IR (Fourier Transform Infrared Spectroscopy) ............................ 118
4. CONCLUSION AND RECOMMENDATIONS ................................ 123
5. REFERENCES .................................................................................... 125
6. APPENDICES ..................................................................................... 125
A STATISTICAL ANALYSIS .............................................................. 106 B DSC THERMOGRAPHS ................................................................... 108
7. CURRICULUM VITAE ...................................................................... 423
xv
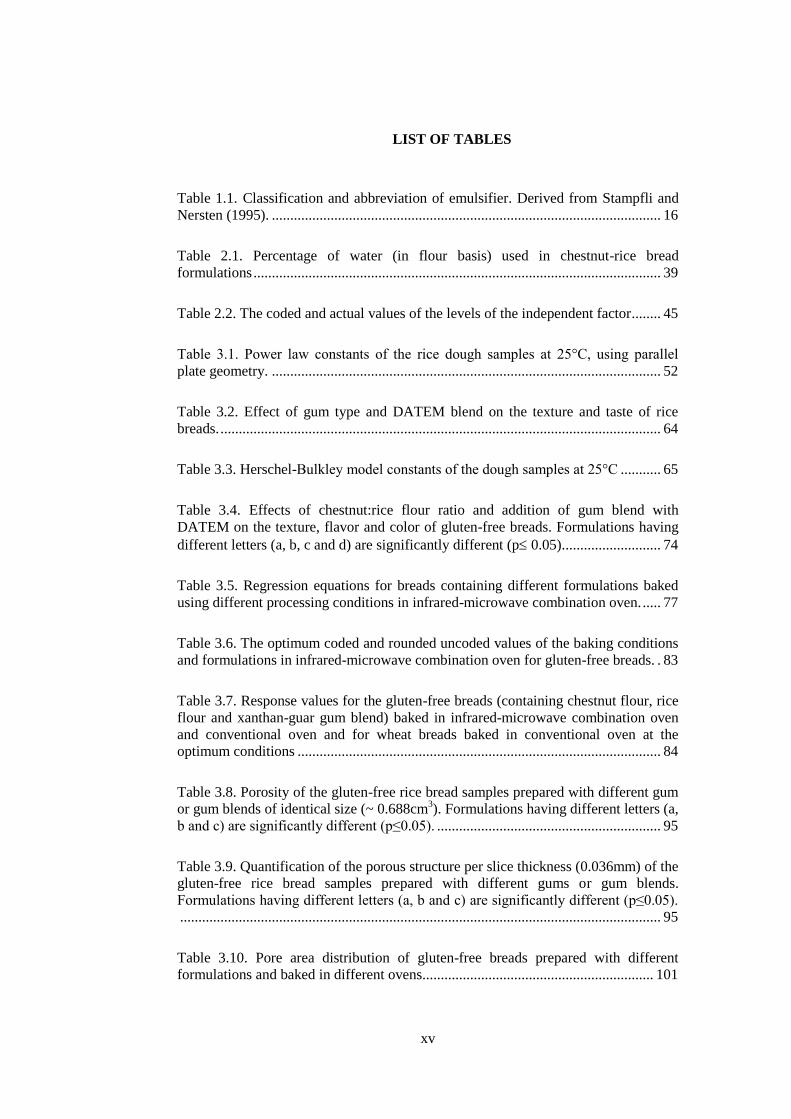
LIST OF TABLES
Table 1.1. Classification and abbreviation of emulsifier. Derived from Stampfli and
Nersten (1995). .......................................................................................................... 16
Table 2.1. Percentage of water (in flour basis) used in chestnut-rice bread
formulations ............................................................................................................... 39
Table 2.2. The coded and actual values of the levels of the independent factor ........ 45
Table 3.1. Power law constants of the rice dough samples at 25°C, using parallel
plate geometry. .......................................................................................................... 52
Table 3.2. Effect of gum type and DATEM blend on the texture and taste of rice
breads. ........................................................................................................................ 64
Table 3.3. Herschel-Bulkley model constants of the dough samples at 25°C ........... 65
Table 3.4. Effects of chestnut:rice flour ratio and addition of gum blend with
DATEM on the texture, flavor and color of gluten-free breads. Formulations having
different letters (a, b, c and d) are significantly different (p 0.05). .......................... 74
Table 3.5. Regression equations for breads containing different formulations baked
using different processing conditions in infrared-microwave combination oven. ..... 77
Table 3.6. The optimum coded and rounded uncoded values of the baking conditions
and formulations in infrared-microwave combination oven for gluten-free breads. . 83
Table 3.7. Response values for the gluten-free breads (containing chestnut flour, rice
flour and xanthan-guar gum blend) baked in infrared-microwave combination oven
and conventional oven and for wheat breads baked in conventional oven at the
optimum conditions ................................................................................................... 84
Table 3.8. Porosity of the gluten-free rice bread samples prepared with different gum
or gum blends of identical size (~ 0.688cm3). Formulations having different letters (a,
b and c) are significantly different (p≤0.05). ............................................................. 95
Table 3.9. Quantification of the porous structure per slice thickness (0.036mm) of the
gluten-free rice bread samples prepared with different gums or gum blends.
Formulations having different letters (a, b and c) are significantly different (p≤0.05).
................................................................................................................................... 95
Table 3.10. Pore area distribution of gluten-free breads prepared with different
formulations and baked in different ovens............................................................... 101
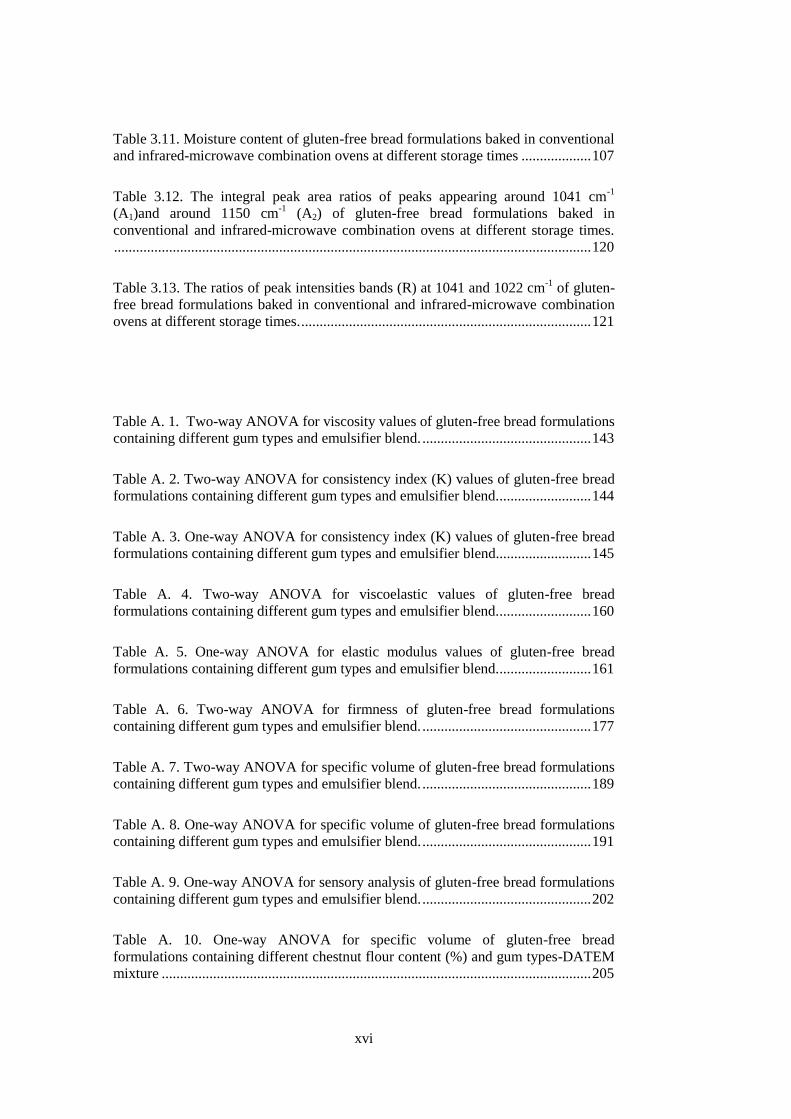
xvi
Table 3.11. Moisture content of gluten-free bread formulations baked in conventional
and infrared-microwave combination ovens at different storage times ................... 107
Table 3.12. The integral peak area ratios of peaks appearing around 1041 cm-1
(A1)and around 1150 cm-1
(A2) of gluten-free bread formulations baked in
conventional and infrared-microwave combination ovens at different storage times.
.................................................................................................................................. 120
Table 3.13. The ratios of peak intensities bands (R) at 1041 and 1022 cm-1
of gluten-
free bread formulations baked in conventional and infrared-microwave combination
ovens at different storage times. ............................................................................... 121
Table A. 1. Two-way ANOVA for viscosity values of gluten-free bread formulations
containing different gum types and emulsifier blend. .............................................. 143
Table A. 2. Two-way ANOVA for consistency index (K) values of gluten-free bread
formulations containing different gum types and emulsifier blend. ......................... 144
Table A. 3. One-way ANOVA for consistency index (K) values of gluten-free bread
formulations containing different gum types and emulsifier blend. ......................... 145
Table A. 4. Two-way ANOVA for viscoelastic values of gluten-free bread
formulations containing different gum types and emulsifier blend. ......................... 160
Table A. 5. One-way ANOVA for elastic modulus values of gluten-free bread
formulations containing different gum types and emulsifier blend. ......................... 161
Table A. 6. Two-way ANOVA for firmness of gluten-free bread formulations
containing different gum types and emulsifier blend. .............................................. 177
Table A. 7. Two-way ANOVA for specific volume of gluten-free bread formulations
containing different gum types and emulsifier blend. .............................................. 189
Table A. 8. One-way ANOVA for specific volume of gluten-free bread formulations
containing different gum types and emulsifier blend. .............................................. 191
Table A. 9. One-way ANOVA for sensory analysis of gluten-free bread formulations
containing different gum types and emulsifier blend. .............................................. 202
Table A. 10. One-way ANOVA for specific volume of gluten-free bread
formulations containing different chestnut flour content (%) and gum types-DATEM
mixture ..................................................................................................................... 205
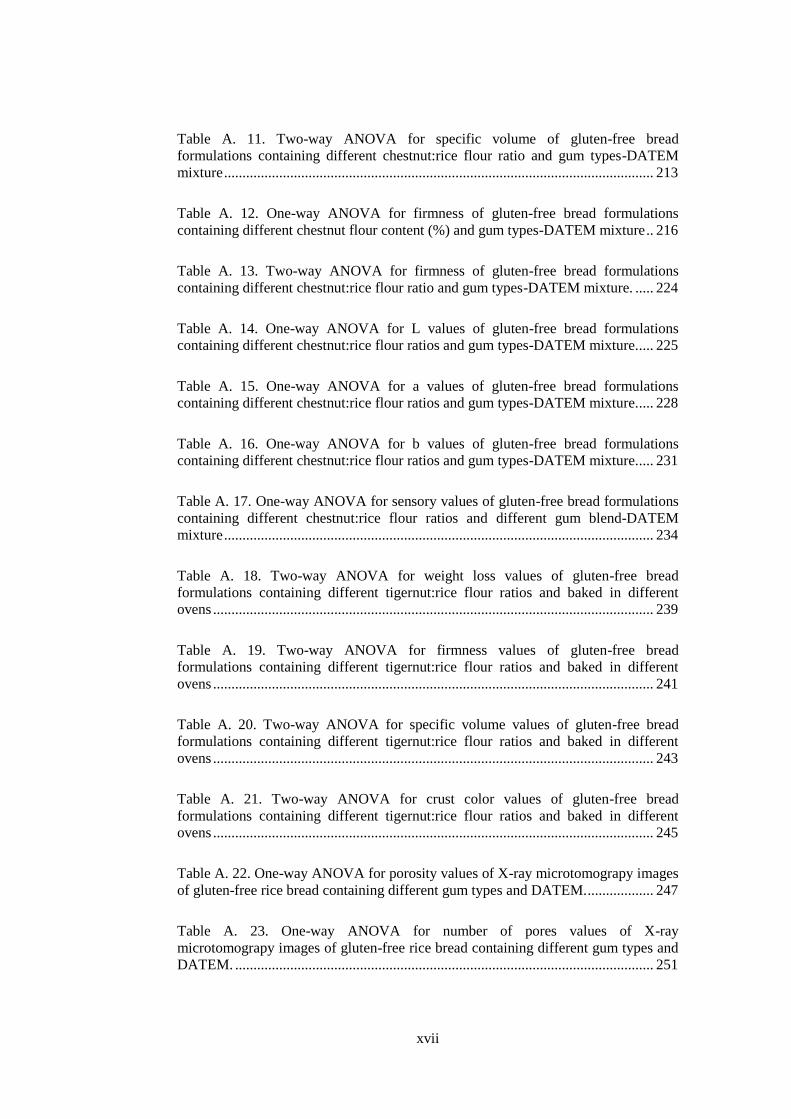
xvii
Table A. 11. Two-way ANOVA for specific volume of gluten-free bread
formulations containing different chestnut:rice flour ratio and gum types-DATEM
mixture ..................................................................................................................... 213
Table A. 12. One-way ANOVA for firmness of gluten-free bread formulations
containing different chestnut flour content (%) and gum types-DATEM mixture .. 216
Table A. 13. Two-way ANOVA for firmness of gluten-free bread formulations
containing different chestnut:rice flour ratio and gum types-DATEM mixture. ..... 224
Table A. 14. One-way ANOVA for L values of gluten-free bread formulations
containing different chestnut:rice flour ratios and gum types-DATEM mixture. .... 225
Table A. 15. One-way ANOVA for a values of gluten-free bread formulations
containing different chestnut:rice flour ratios and gum types-DATEM mixture. .... 228
Table A. 16. One-way ANOVA for b values of gluten-free bread formulations
containing different chestnut:rice flour ratios and gum types-DATEM mixture. .... 231
Table A. 17. One-way ANOVA for sensory values of gluten-free bread formulations
containing different chestnut:rice flour ratios and different gum blend-DATEM
mixture ..................................................................................................................... 234
Table A. 18. Two-way ANOVA for weight loss values of gluten-free bread
formulations containing different tigernut:rice flour ratios and baked in different
ovens ........................................................................................................................ 239
Table A. 19. Two-way ANOVA for firmness values of gluten-free bread
formulations containing different tigernut:rice flour ratios and baked in different
ovens ........................................................................................................................ 241
Table A. 20. Two-way ANOVA for specific volume values of gluten-free bread
formulations containing different tigernut:rice flour ratios and baked in different
ovens ........................................................................................................................ 243
Table A. 21. Two-way ANOVA for crust color values of gluten-free bread
formulations containing different tigernut:rice flour ratios and baked in different
ovens ........................................................................................................................ 245
Table A. 22. One-way ANOVA for porosity values of X-ray microtomograpy images
of gluten-free rice bread containing different gum types and DATEM. .................. 247
Table A. 23. One-way ANOVA for number of pores values of X-ray
microtomograpy images of gluten-free rice bread containing different gum types and
DATEM. .................................................................................................................. 251
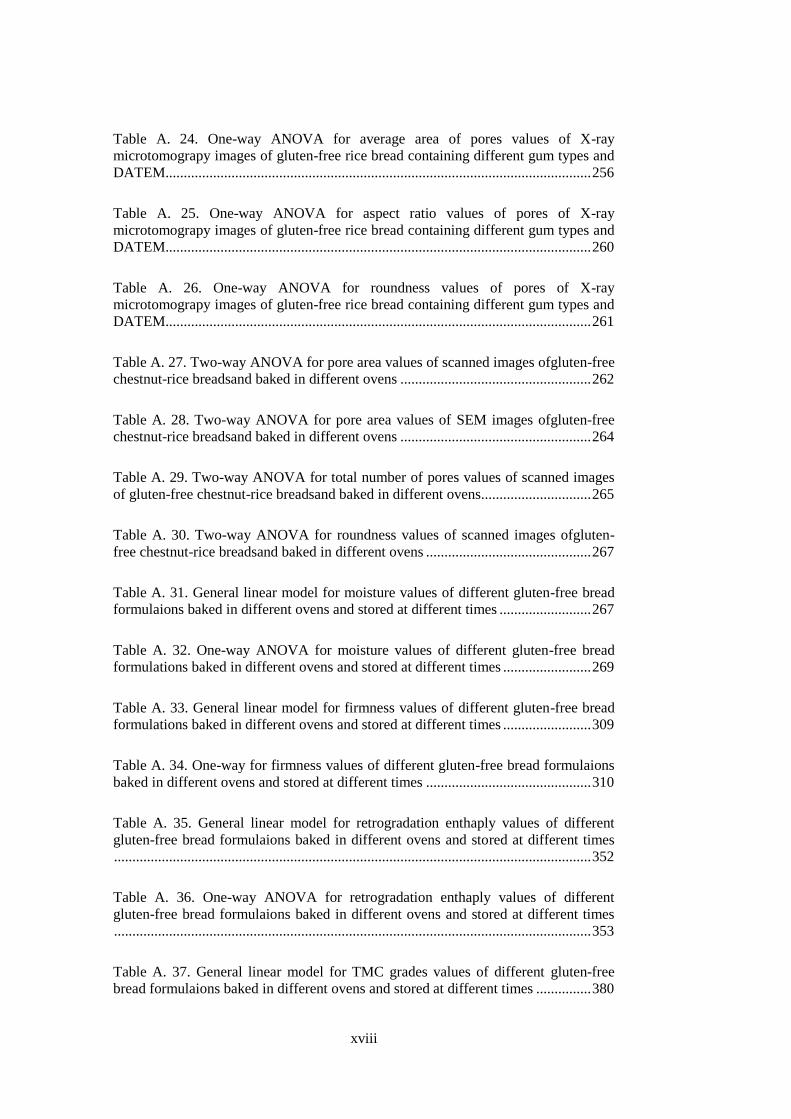
xviii
Table A. 24. One-way ANOVA for average area of pores values of X-ray
microtomograpy images of gluten-free rice bread containing different gum types and
DATEM.................................................................................................................... 256
Table A. 25. One-way ANOVA for aspect ratio values of pores of X-ray
microtomograpy images of gluten-free rice bread containing different gum types and
DATEM.................................................................................................................... 260
Table A. 26. One-way ANOVA for roundness values of pores of X-ray
microtomograpy images of gluten-free rice bread containing different gum types and
DATEM.................................................................................................................... 261
Table A. 27. Two-way ANOVA for pore area values of scanned images ofgluten-free
chestnut-rice breadsand baked in different ovens .................................................... 262
Table A. 28. Two-way ANOVA for pore area values of SEM images ofgluten-free
chestnut-rice breadsand baked in different ovens .................................................... 264
Table A. 29. Two-way ANOVA for total number of pores values of scanned images
of gluten-free chestnut-rice breadsand baked in different ovens.............................. 265
Table A. 30. Two-way ANOVA for roundness values of scanned images ofgluten-
free chestnut-rice breadsand baked in different ovens ............................................. 267
Table A. 31. General linear model for moisture values of different gluten-free bread
formulaions baked in different ovens and stored at different times ......................... 267
Table A. 32. One-way ANOVA for moisture values of different gluten-free bread
formulations baked in different ovens and stored at different times ........................ 269
Table A. 33. General linear model for firmness values of different gluten-free bread
formulations baked in different ovens and stored at different times ........................ 309
Table A. 34. One-way for firmness values of different gluten-free bread formulaions
baked in different ovens and stored at different times ............................................. 310
Table A. 35. General linear model for retrogradation enthaply values of different
gluten-free bread formulaions baked in different ovens and stored at different times
.................................................................................................................................. 352
Table A. 36. One-way ANOVA for retrogradation enthaply values of different
gluten-free bread formulaions baked in different ovens and stored at different times
.................................................................................................................................. 353
Table A. 37. General linear model for TMC grades values of different gluten-free
bread formulaions baked in different ovens and stored at different times ............... 380
xix
Table A. 38. One-way ANOVA for TMC values of different gluten-free bread
formulaions baked in different ovens and stored at different times ......................... 381

xx
xxi
LIST OF FIGURES
Figure 1.1. Primary structure of guar gum ................................................................. 10
Figure 1.2. Primary structure of (LBG) ..................................................................... 11
Figure 1.3. Primary structure of xanthan gum ........................................................... 12
Figure 1.4. Primary structure of HPMC .................................................................... 14
Figure 1.5. The electromagnetic spectrum (Sahin and Sumnu, 2006). ...................... 21
Figure 1.6. Schematic representations of dipolar rotation and ionic conduction
mechanisms ................................................................................................................ 22
Figure 1.7. The electromagnetic spectrum ................................................................. 24
Figure 1.8. a) Three-dimensional response surface indicating the response as function
of x1 and x2 and the corresponding contour plot of a response surface ..................... 32
Figure 1.9. Central composite designs for the optimization of two variables and three
variables. .................................................................................................................... 33
Figure 3.1. Flow curves obtained for rice flour dough containing gums ................... 50
Figure 3.2. Flow curves obtained for rice flour dough containing PurawaveTM
and
different gums ............................................................................................................ 51
Figure 3.3. Flow curves obtained for rice flour dough containing DATEM and
different gums. ........................................................................................................... 53
Figure 3.4. Biaxial extensional viscosity as a function of biaxial strain of wheat
dough used in this study at 3 different compression velocities.................................. 54
Figure 3.5. Flow curves of the gums (1% w/w) used in this study ............................ 55
Figure 3.6. Flow curves obtained for rice flour dough containing xanthan and
emulsifiers .................................................................................................................. 56
Figure 3.7. Linear viscoelastic moduli of dough samples containing wheat flour and
rice flour containing different gums.. ........................................................................ 57
xxii
Figure 3.8. Linear viscoelastic moduli of dough samples containing wheat flour and
rice flour containing Purawave and different gums ................................................... 58
Figure 3.9. Linear viscoelastic moduli of dough samples containing wheat flour and
rice flour containing DATEM and different gums ..................................................... 59
Figure 3.10. Firmness values of the bread samples prepared using different gums and
emulsifiers. ................................................................................................................. 60
Figure 3.11. Specific volume values of the bread samples prepared using different
gums and emulsifiers .................................................................................................. 62
Figure 3.12. Power law relation between the firmness and the viscoelatic moduli of
rice flour based breads................................................................................................ 63
Figure 3.13. Flow curves obtained for dough samples containing different
chestnut:rice flour ratio (CF:RF) with and without gum blend and emulsifier .......... 67
Figure 3.14. Linear viscoelastic modulus (storage modulus) of dough samples
containing different chestnut:rice flour ratio (CF:RF) with and without gum blend
and emulsifier. ............................................................................................................ 68
Figure 3.15. Linear viscoelastic modulus (loss modulus) of dough samples different
chestnut:rice flour ratio (CF:RF) with and without gum blend and emulsifier .......... 69
Figure 3.16. Firmness values of bread samples prepared using different chestnut:rice
flour ratio with and without gum blend and emulsifier .............................................. 70
Figure 3.17. Specific volume of bread samples prepared using different chestnut:rice
flour ratio with and without gum blend and emulsifier .............................................. 71
Figure 3.18. Color of breads containing different chestnut:rice flour ratio. ............... 72
Figure 3.19. Comparison of predicted and experimental values of depemdent
variables for gluten-free breads made of chestnut and rice flours.............................. 76
Figure 3.20. Variation of weight loss of the gluten-free breads with microwave power
(X4) and baking time (X5) when X1, X2and X3 = 0. ...................................................... 78
Figure 3.21. Variation of weight loss of the gluten-free breads with chestnut:rice
flour ratio (X1) and baking time (X5) when X2, X3and X4 = 0. .................................... 79
Figure 3.22. Variation of firmness of the gluten-free breads with chestnut:rice flour
ratio (X1) and emulsifier content (X2) when X3, X4 and X5= 0. .................................. 79
xxiii
Figure 3.23. Variation of specific volume of the gluten-free breads with chestnut:rice
flour ratio (X1) and emulsifier content (X2) when X3, X4 and X5 = 0.......................... 80
Figure 3.24. Variation of specific volume of the gluten-free breads with infrared
power (X3) and baking time (X5) when X1, X2 and X4= 0. .......................................... 81
Figure 3.25. Variation of E of the gluten-free breads with chestnut:rice flour ratio
(X1) and baking time (X5) when X2, X3 and X4= 0. .................................................... 82
Figure 3.26. Variation of E of the gluten-free breads with infrared power (X3) and
microwave power (X4) when X1, X2 and X5= 0........................................................... 83
Figure 3.27. Weight loss of breads containing different tigernut:rice flour ratios and
baked in conventional and infrared-microwave combination oven. .......................... 86
Figure 3.28. Firmness of breads containing different tigernut:rice flour ratios and
baked in conventional and infrared-microwave combination oven. .......................... 87
Figure 3.29. Specific volume of breads containing different tigernut:rice flour ratios
and baked in conventional and infrared-microwave combination oven. ................... 87
Figure 3.30. Bread samples........................................................................................ 89
Figure 3.31. Crust color values of breads containing different tigernut:rice flour
ratios and baked in conventional and infrared-microwave combination oven. ......... 90
Figure 3.32. 2D X-ray μCT images of gluten-free rice bread slices prepared with
different gums or gum blends .................................................................................... 92
Figure 3.33. 3D X-ray μCT images of gluten-free rice bread samples prepared with
different gums or gum blends .................................................................................... 93
Figure 3.34. Scanned images of different gluten-free bread formulations baked in
different ovens. .......................................................................................................... 98
Figure 3.35. Based on scanned images, pore area fractions of different gluten-free
bread formulations baked in conventional and infrared-microwave combination oven
................................................................................................................................... 99
Figure 3.36. Based on SEM at a magnification of 20×, pore area fractions of different
gluten-free bread formulations baked in conventional and infrared-microwave
combination oven ..................................................................................................... 102
Figure 3.37. SEM micrographs (1000×) of outside of gluten-free bread crumb
samples baked in different ovens ............................................................................. 104
xxiv
Figure 3.38. SEM micrographs (1000×) of inside of gluten-free bread crumb samples
baked in different ovens ........................................................................................... 105
Figure 3.39. Firmness of different gluten-free bread formulations baked in
conventional oven at different storage times ............................................................ 109
Figure 3.40. Firmness of different gluten-free bread formulations baked in infrared-
microwave combination oven at different storage times. ......................................... 110
Figure 3.41. Retrogradation enthalpy of different gluten-free bread formulations
baked in conventional oven at different storage times ............................................. 112
Figure 3.42. Retrogradation enthalpy of different gluten-free bread formulations
baked in infrared-microwave combination oven at different storage times ............. 113
Figure 3.43. X-ray diffraction diagrams of different gluten-free bread formulations
baked in conventional and infrared-microwave combination ovens and stored at
different storage times .............................................................................................. 115
Figure 3.44. Total mass crystallinity grades of different gluten-free bread
formulations baked in conventional oven at different storage times. ....................... 116
Figure 3.45. Total mass crystallinity grades of different gluten-free bread
formulations baked in infrared-microwave combination oven at different storage
times. ........................................................................................................................ 117
Figure 3.46. FTIR spectra of different gluten-free bread formulations baked in
conventional and infrared-microwave combination ovens and stored at different
storage times. ............................................................................................................ 119
Figure B. 1 DSC thermograph of chestnut-rice bread containing xanthan-guar gum
blend-DATEM mixture baked in infrared-microwave combination oven and stored
for 24 h……………..................................................................................................421
Figure B. 2 DSC thermograph of chestnut-rice bread containing xanthan-guar gum
blend-DATEM mixture baked in infrared-microwave combination oven and stored
for 96 h…………...………………………...............................................................422
1
CHAPTER 1
1. INTRODUCTION
1.1 Celiac Disease
Celiac disease (gluten sensitive entropathy), is a multi-symptom, autoimmune
disorder is which is triggered by the response of the body’s immune system to
prolamins found in wheat (gliadin), rye (secalin), barley (hordein), and their
crossbreeds (Bower, 2006). This gluten-sensitive enteropathy is controlled by a
combination of genetic and environmental risk factors. Hence a permanent
withdrawal of gluten from the diet of celiac patients is required throughout their life-
span. Recent studies showed that not only high molecular weight glutenin and sub-
units of gluten proteins but also the gliadin parts of glutens have also toxic effects to
celiac patients (Ellis et al., 2006). When people with celiac disease consume gluten,
their immune system generates antibodies against this protein causing damage to the
tiny hairlike projections in the small intestine, in severe cases the lesion extends to
the ileum colon. The inflammation of the small intestine causes the malabsorption of
nutrients such as iron, calcium, folate, and fat-soluble vitamin. Moreover, celiac
patients are prone to the nutrient-related deficiencies such as osteoporosis, anaemia,
and failure to thrive due to their nutritionally unbalanced diet (Mendoza, 2005,
Arendt et al., 2008).
Since the symptoms of celiac disease show similarities with many common chronic
intestinal disorders, such as irritable bowel syndrome, Crohn‘s disease, and
ulcerative colitis, it is frequently misdiagnosed (Mendoza, 2005). Moreover, it
remains undiagnosed because it is often a typical or even silent on clinical grounds
that lead to the risk of long-term complications such as osteoporosis, infertility and
cancer. Although it is difficult to calculate of the true extent of celiac disease
occurrence, the prevalence of celiac disease in the United States is estimated to be at
least 1:133 and it is approximately present in 1:150–300 in Europe (Fasano et al.,
2003; McLoughlin et al., 2003; Tandoruk, 2005). However, recent studies showed
that celiac disease is more common than previously reported and the incidence is
1:100-30:100 in the general population of Europe and United States (Catassi et al.,
2002). Although, there is not a certain percentage for Turkey, it is estimated that
there are 500000 celiac patients and due to insufficient diagnosis, only 1% of them
have been diagnosed until now (http://www.xn--lyak-zoa4g.com/haber/45-2colyak-
hastaligi-bilimsel-toplantisi-bursa39da-ya.html. Last visited: May, 2013). However,
according to recent national scientific researches, the occurrence of celiac disease is
much higher than supposed and 1 in every 100 people has celiac disease in Turkey.
2
1.1.1 The Difference between Wheat Sensitivity and Celiac Disease
Celiac disease differs from wheat sensitivity. There are four classes of protein in
wheat: albumin, globulin, gliadin, and glutenin. People who have sensitivity to
exposure of albumin and globulin are called as wheat sensitive and they have an IgE-
mediated response to these wheat proteins. In an IgE-mediated allergy, at least two
binding sites must be present on the epitope. The occurrence of this sensitivity is not
frequent and is often diagnosed in early childhood. People with wheat sensitivity
must avoid wheat, but they may consume barley, rye and oats. On the other hand,
celiac disease is caused by the exposure of glutenin and gliadin. In celiac disease
only a single binding peptide is present (Hamer, 2005). Therefore, celiac disease is
not categorized as an allergy. In addition, the onset of intestinal damage symptom of
celiac disease is not as fast as the onset of allergy, which typically occurs within an
hour. Thus, it is often misdiagnosed or undiagnosed.
1.1.2 Symptoms of Celiac Disease
Indigestion, abdominal pain, bloating and gas production, bulky fatty bowel motions,
sometimes pale and offensive smelling, failure to thrive, vomiting, muscle wasting
are general symptoms, while hypoprotein anemia comprising possible ascites,
general irritability and unhappiness are general signs of celiac disease. However, the
classical picture of celiac disease includes intestinal malabsorption, chronic diarrhea,
weight loss, abdominal distension and anaemia (Catassi et al., 2002). In infants and
children symptoms consist of muscle cramps due to low calcium levels, slowed
growth rate, itchy or painful rashes and in untreated conditions, symptoms can be
more severe including nervous system damage. On the other hand, adults do not
usually present with malabsorption unlike children (Niewinski and RD, 2008). In
addition, in adults, the disease has non-specific symptoms such as fatigue, vague
abdominal pains, intermittent diarrhea, tiredness, upper abdominal pain and
constipation. Moreover, because of damage of intestinal mucosa, lactose intolerance
can also occur in adults. In untreated conditions, adults with celiac disease have long-
term risks such as osteoporosis, anaemia and gastrointestinal malignancy (Hamer,
2005). More specifically, women with untreated celiac disease are prone to
miscarriages and mothers are at increased risk for having low birth weight babies
(Ciclitira and Moodie, 2003).
1.1.3 Screening for Celiac Disease
Blood test is used to screen celiac disease. Antibodies to gliadin, which is toxic to
celiac patients, are elevated in celiac patients. However, if high levels of anti-gliadin
are detected, they may not certainly show celiac disease. Nevertheless, anti-gliadin
antibody levels are useful in monitoring response to treatment since these antibodies
return to normal level within several months when a gluten-free diet is initiated.
Other antibodies produced by the body against itself and responsible for the damage
3
induced by gluten in the small bowel, are EmA (anti-endomysial antibodies) and
anti-Ttg (tissue transglutaminase antibodies). These antibodies are more sensitive
than antigliadin antibodies. Elevated levels of these antibodies almost certainly
reflect celiac disease (Niewinski and RD, 2008). Similar to antigliadin antibodies,
they begin to fall normal levels when gluten is removed from the diet. A positive
blood test requires tissue confirmation. A tissue biopsy is used not only to confirm
the diagnosis but also to measure the degree of damage. A small intestinal biopsy is
performed by the help of esophagogastroduodenoscopy (EGD), the tissue samples
for loss of villi and other features of celiac disease, which are screened by a
pathologist (http://www.webmd.com/digestive-disorders/celiac-disease/celiac-
disease-diagnosis-tests). With the introduction of a gluten-free diet, the damage to
the small bowel returns to normal over a period of a few months to 1–2 years in the
majority of patients.
1.1.4 The Gluten-free Label Requirements
Celiac patients should read all food labels to ensure the gluten-free status of a food
item. In 2004, The Food Allergen Labeling and Consumer Protection Act has
intended to provide consumers with sufficient information so that they can avoid
potentially life-threatening allergic reactions to food or an ingredient in food. After
2006, it has been stated that all food products manufactured must be clearly labeled
to indicate the presence of any of the top eight food allergens which are milk, eggs,
fish, crustacean shellfish, tree nuts, peanuts, soybeans, and wheat (Köksel, 2009).
There are certain groups of foods, which are not allowed in a gluten-free diet
a) Any bread, cereal or other food produced from wheat, rye, barley, triticale,
kamut and oat flour or ingredients, and by-products made from those grains
b) Processed foods that comprise wheat and gluten-derivatives as thickeners and
fillers, such as hot dogs, salad dressings, canned soups/dried soup mixes,
processed cheese and cream sauces
c) Medications that use gluten as pill or tablet binders (Gallagher et al., 2004).
However, there is still a debate around the world in labeling of gluten-free foods.
Since the protein component of wheat can not be completely removed from its starch
component and thus, completely removal of gluten from gluten-free products is
impossible.
US Food and Drug Administration is suggesting to determine food-labelling term
“gluten-free” to mean that a food bearing this claim does not contain any of the
following;
a) An ingredient that is a “prohibited grain”, which includes any species of wheat
(such as durum wheat, spelt wheat or kamut), rye, barley or their crossbred
hybrids;
4
b) An ingredient (e.g. wheat flour) that is derived from a “prohibited grain” and that
has not been processed to remove gluten;
c) An ingredient (e.g. wheat starch) that is derived from a “prohibited grain” that
has been processed to remove gluten, if the use of that ingredient results in the
presence of 20 ppm (6 mg equivalent) or more gluten in the food;
d) 20 ppm or more gluten.
Most European countries use The Codex Standard for gluten-free foods that were
adopted by the Codex Alimentarius Commission of the World Health Organization
(WHO) and by the Food and Agricultural Organization (FAO). “Gluten free” food
products are defined in Codex Alimentarius guidelines as containing <200 ppm
gluten for cereal derived and <20 ppm for non-cereal derived foods (Codex Standard
118, 1979). AOAC (1995) method 991.19 is the formally authorized method for the
determination of relatively high levels of gluten in food and its raw materials. For
this purpose, contamination tests can be done by using gluten assay kits and these
kits are used for the detection and quantification of gluten at very low concentrations
in uncooked and cooked foods and the assay uses antibodies to gliadin protein in a
non-competitive, sandwich type ELISA. The ready to use standards provide accurate
quantification in parts per million (ppm).
Due to the lack of federal standards, the Gluten Intolerance Group has also
established a voluntary program of testing and monitoring gluten-free food products.
The Gluten-Free Certification Organization, which identifies qualifying foods with a
“gluten-free” certification mark, was established in 2005. In order to meet the highest
standards for gluten-free ingredients and safe processing environment, this
organization uses strict standards to certify (Niewinski and RD, 2008). In Turkey, the
standard for gluten-free foods, which was adopted by Turkey Standards Institution
(TSE) are used (TS 13143, 2005).
1.2 Gluten and Its Role in Breadmaking
Bread is one of the most important basic items of the human diet. Wheat, which is
the major cereal in breadmaking, comprises of starch (70–75%), water (14%),
proteins (10–12%), non-starch polysaccharides (2–3%), particularly arabinoxylans
and lipids (2%) (Goesaert et al., 2005). Wheat flour consists of two groups of
proteins; the non-gluten proteins, which have either no or just a minor role in bread
making, and the gluten proteins, which have a major role. The non-gluten proteins,
which consist of 15 and 20 % of total wheat protein, are mainly present in the outer
layers of the wheat kernel. These proteins are mostly structural proteins and
genetically related to the major storage proteins in legumes and in the cereals of oats
and rice. Gluten is the major storage protein of wheat and contributed of 80-85% of
the total wheat protein. They are found in the endosperm cells of the mature wheat
grain where they form a continuous matrix around the starch granules (Van Der
5
Borght et al., 2005). It is essential to form a strong protein network for the desired
viscoelasticity to obtain high quality from breads. Therefore, the quality and quantity
of gluten have critical role in quality of breads. Since gluten proteins are largely
insoluble in the water, it can be purified by washing away from the associated starch
and the water soluble components. When it is isolated from flour, it is composed of
80% protein and 8% lipids (on a dry basis), with the remainder being ash and
carbohydrate (Hoseney, 1986). Glutenin and prolamin are the major fractions of the
gluten. Glutenin molecule is linked by intermolecular disulfide bonds giving a
network structure. In contrast, monomeric gliadin molecule is linked by
intramolecular disulfide bonds, creating the proteins a globular confirmation
(Tronsmo et al., 2002). Therefore, while prolamin provides viscous properties and
extensibility in a dough system, polymeric glutenin is responsible for elastic and
cohesive properties of dough (Gujral and Rosell, 2004). Together, the two are
important for crumb structure of cereal-based products and the relative proportions of
gliadin and glutenin affect the quality of products. When flour is mixed with water,
gluten proteins provide cohesive viscoelastic properties to dough that is responsible
of retaining gas produced during fermentation and oven-rise, so the high volume and
soft texture can be obtained from the products.
1.3 Gluten-free Flour Types
Since gluten provides the viscoelastic properties to dough, absence of gluten
significantly impairs the quality of products. Therefore, most of the gluten-free
products have low volume, poor texture and flavor and stales faster. In addition, they
do not have adequate amount of vitamins, minerals and fiber that worsens the
nutritionally unbalanced diet of celiac sufferers (Bardella et al., 2000). To fulfill the
expectations of celiac disease sufferers, many scientists and manufacturers seek
alternative flour types to wheat flour such as rice, corn, chickpea, soy, soybean and
sorghum flour and pseudocereals such as buckwheat and amaranth. However, it is
difficult to obtain desired quality without using some additives such as gums,
emulsifiers, dairy ingredients or dietary fiber.
1.3.1 Rice Flour
Rice is the most important staple food in Asia and India and it has the second or
third-highest worldwide production rate after maize and/or wheat (Rosell and Marco,
2008). Rice flour is the most suitable cereal flour for preparing gluten-free products
due to its several significant properties such as natural, hypoallergenic, colorless, and
bland taste. It has also very low level of protein, sodium, fat and high amount of
easily digested carbohydrates. Rice has very little prolamins (2.5-3.5%). It can be
used alone or in combination with other types of flours. Despite of its numerous
advantages, rice proteins have poor functional properties. Moreover, they are
insoluble because of the hydrophobic nature and this prevents the formation of
viscoelastic structure in dough (Rosell and Collar, 2007). As a consequence, rice
6
products have low volume, firm texture, short shelf-lives and stales rapidly.
Therefore, many studies were conducted on the usage of ingredients in bread
formulations to overcome the problems associated with rice flour.
Several studies in the literature have demonstrated the potential use of rice flour for
the development of gluten-free breads. In these studies, researchers used different
gums, enzymes, and dietary fibers to develop gluten-free bread formulations. Cato et
al. (2004) investigated the effect of guar gum, HPMC and CMC on gluten-free
breads using rice flour mixed with potato starch. Lopez et al. (2004) optimized
gluten-free bread formulation using rice flour, corn starch and cassava starch.
Sivaramakrishnan et al. (2004) studied the effect of HPMC on rheological properties
of rice dough and the quality of rice bread for the production of gluten-free bread.
Ahlborn et al. (2005) prepared and evaluated gluten-free breads using rice flours,
milk proteins, egg proteins, xanthan gum, and HPMC. McCarthy et al. (2005)
optimized a gluten-free bread formulation based on rice flour, potato starch, skim
milk powder and HPMC using a response surface methodology. Lee and Lee (2006)
showed that the addition of xanthan gum decreased crumb firmness of fresh and
stored rice flour based breads. Moore et al. (2006) conducted a study to show the
effect of xanthan gum on gluten free breads that were prepared using rice flour, corn
starch and potato starch. Lazaridou et al. (2007) prepared gluten-free bread
formulations based on rice flour, corn starch, sodium caseinate, and different gums
and found that there was an improvement in dough rheological characteristics and
bread quality when pectin and CMC combination was used. Phimolsiripol et al.
(2012) investigated the physical, nutritional and sensory quality and shelf life of rice-
based gluten-free bread by using different fractions of rice bran and different ratios
of insoluble to soluble dietary fibers.
A technological approach for the production of gluten-free breads that meet the
unique nutritional and sensory requirements of celiac patients is a growing need.
Using blends of different flours with rice flour in the presence of hydrocolloid has
the potential to give gluten-free breads with good sensory attributes.
1.3.2 Chestnut Flour
According to FAO statistics, The Republic of Korea and China are the top producers
of chestnut with their production about 43% of the world’s chestnuts. Other major
chestnut-producing countries are Italy and Turkey with their production about more
than 25% of the world’s chestnuts (FAO, 1999). Turkey’s production rate is about
49000 tons per year. Chestnut flour has high quality proteins with essential amino
acids (4-7%), relatively high amount of sugar (20-32%), starch (50-60%), dietary
fiber (4-10%), and low amount of fat (2-4%). It also includes some important
vitamins such as vitamins E, C, B group and minerals such as potassium,
phosphorous, magnesium, calcium, copper, iron, manganese and sulfur (Sacchetti et
al., 2004, Chenlo et al., 2007). In addition, it has some important phenolics (gallic
and ellagic acid) that have various positive health effects (Blaiotta et al., 2012). Most
7
of the gluten-free products do not contain sufficient amount of Vitamin B, Vitamin
D, magnesium, calcium, iron, folate, and dietary fiber since they are not enriched and
fortified (Arendt et al., 2008). Therefore, it may be advantageous to use chestnut
flour due to its nutritional value. Besides its health and nutritional benefits, the
ingredients of chestnut flour may provide some functional properties to the dough.
While fiber content of chestnut flour may assist emulsifying, stabilizing, texturizing
and thickening properties to dough, the sugar content of chestnut flour may improve
the color and flavour properties of gluten-free products when it is used at a certain
level.
The studies on chestnut flour are limited in literature. Sacchetti et al. (2004)
determined the effects of extrusion temperature and chestnut flour composition on
the functional and physical properties of snack-like products. They reported that the
relatively high sugar to starch ratio of chestnut flour resulted in insufficient
expansion of the extruded products. It was also reported that blending chestnut flour
with rice flour resulted in better quality products. Chenlo et al. (2007) determined the
influence of water content and temperature on the rheological behavior of chestnut
flour pastes. Correia et al. (2009) studied the effect of the drying temperature on
morphological, physical and chemical properties of the dried chestnut flours. In
2010, Moreira and coworkers determined the influence of particle size on the
rheological properties of chestnut flour doughs. There is no available study on the
production of gluten-free breads by using chestnut flour yet.
1.3.3 Tigernut Flour
Tigernut (Cyperusesculentus), also known as chufa, is an underutilized crop grown
extensively in Mediterranean regions (Coskuner et al., 2002). Tigernut flour is a rich
source of high quality oil and contains appreciable quantities of the fatty acids such
as myristic acid, oleic acid and linoleic acid (Chinma et al., 2010). For satisfying
adult needs, it has moderate amount of proteins with higher essential amino acids
than those proposed in the protein standard by the FAO/WHO (1985) (Ade-
Omowaye et al., 2008). Furthermore, it is an excellent source of some useful
minerals and vitamins such as phosphorus, potassium, iron, calcium, and vitamins E
and C.
Tigernut flour has high amount of dietary fiber, which is an important role in the
human health because of the prevention, reduction, and treatment of some disease
such as colon cancer, coronary heart diseases, obesity, diabetics and gastro intestinal
disorders. Moreover, high dietary fiber consumption enhances blood circulation, aids
in weight loss and appears to improve immune function. Tigernut has also been
reported to be used in the treatment of flatulence, indigestion, diarrhea, dysentery,
and excessive thirst (Sánchez-Zapata et al., 2010). In addition to its health effects,
fiber content of tigernut flour also responsible for providing some functional and
technological properties. Therefore, it can improve volume and texture of breads
when they are used as certain quantities.
8
Studies on the usage of tigernut flour in bakery products are limited in literature.
Oladele and Aina (2007) compared chemical composition and functional properties
of flour produced from two varieties of tigernut. Chinma et al. (2010) studied the
usage of tigernut and wheat flours at different proportions (0:100, 10:90, 20:80,
30:70, 40:60 and 50:50) in cakes and found that cakes were acceptable in terms of
volume and batter density when 30% tigernut flour substitution was used. Ade-
Omowaye et al. (2008) produced breads by substituting wheat with tigernut flour at
different proportions (0:100, 10:90, 20:80, 30:70, 40:60 and 50:50) and evaluated
these breads for proximate composition and physico-chemical properties. It was
found that breads with qualities similar to 100% wheat bread were produced from
10% tigernut flour addition. Chinma and co-workers (2012) investigated the effects
of the addition of germinated tigernut and moringa flour on the quality characteristics
of wheat-based bread. It has been demonstrated that blending wheat flour with
germinated tigernut and moringa flour blends improved the proximate composition
and affected their pasting properties. It has also been suggested that such composite
flour would help reduce protein–energy and micronutrient deficiency prevalent in
developing countries. All these studies have been shown that tigernut flour has a
potential to be used in the development of gluten-free products alone or in
combination with the gluten-free flours such as rice flour.
1.4 Ingredients Used in Gluten-free Baked Products
Nowadays, the use of additives, which have the ability to mimic the viscoelastic
properties of gluten has commonly been applied in gluten-free industry. Food
hydrocolloids are one of the most extensively used functional ingredients in the food
industry. In the gluten-free baked goods, hydrocolloids have been used for improving
rheological properties of doughs as well as the quality of the fresh products and for
retarding the staling. The most used hydrocolloids in the gluten-free industry
included in this kind of substances are xanthan gum, guar gum, locust bean gum
(LBG) and hydroxypropylmethylcellulose (HPMC) and carboxymethylcellulose
(CMC). Emulsifiers are frequently added to commercial bakery products to improve
bread quality as well as dough handling characteristics. Some widely applied
emulsifiers are diacetyl tartaric acid esters of monodiglycerides (DATEM) and
sodium stearoyl-2- lactylate (SSL), which are known as dough improvers.
Monoacylglycerols, however, are used as antistaling agents or crumb softeners
(Kohajdová et al., 2009).
1.4.1 Gums
Hydrocolloids, commonly named gums, are hydrophilic polymers obtained from
vegetable, animal, microbial or synthetic material, which are composed of hydroxyl
groups and sometimes polyelectrodes. Hydrocolloids have been widely used in food
industry because of their functions such as thickening and gelling aqueous solutions,
stabilizing foams, emulsions and dispersions (Arendt et al., 2008). Furthermore, they
9
can improve viscoelastic properties of dough, enhance moisture retention ability,
texture and shelf life of bakery products, retard retrogradation of the starch, modify
starch gelatinization and act as fat replacer in formulations. The textures of frozen
foods are also improved by hydrocolloids since they can affect ice-crystal formation
and growth. In recent years, there has been growing interest in the usage of
hydrocolloids as gluten-substitutes in gluten-free bread formulations (Acs et al.,
1997; Gambus et al., 2001; Ribotta et al., 2004a; Anton and Artfield, 2008; Rosell
and Marco, 2008; Brites et al., 2010; Leray et al., 2010; Peressini et al., 2011). Thus,
the use of hydrocolloids in gluten-free baking industry appears to be a promising
alternative for the development of high-quality foods for consumers. Hydrocolloids
mimic the viscoelastic properties to dough, so the gas holding ability, texture and
shelf-life of gluten-free products may be improved. Nevertheless, the function and
hydration rate of hydrocolloids depend on many factors, such as chemical nature of
the gum, temperature and pH range, electrolyte concentration, particle size, thermal
treatment, presence of other inorganic ions and chelating agents and storage ability.
Thus, selection of the particular hydrocolloid for a specific purpose is the task of
product developers.
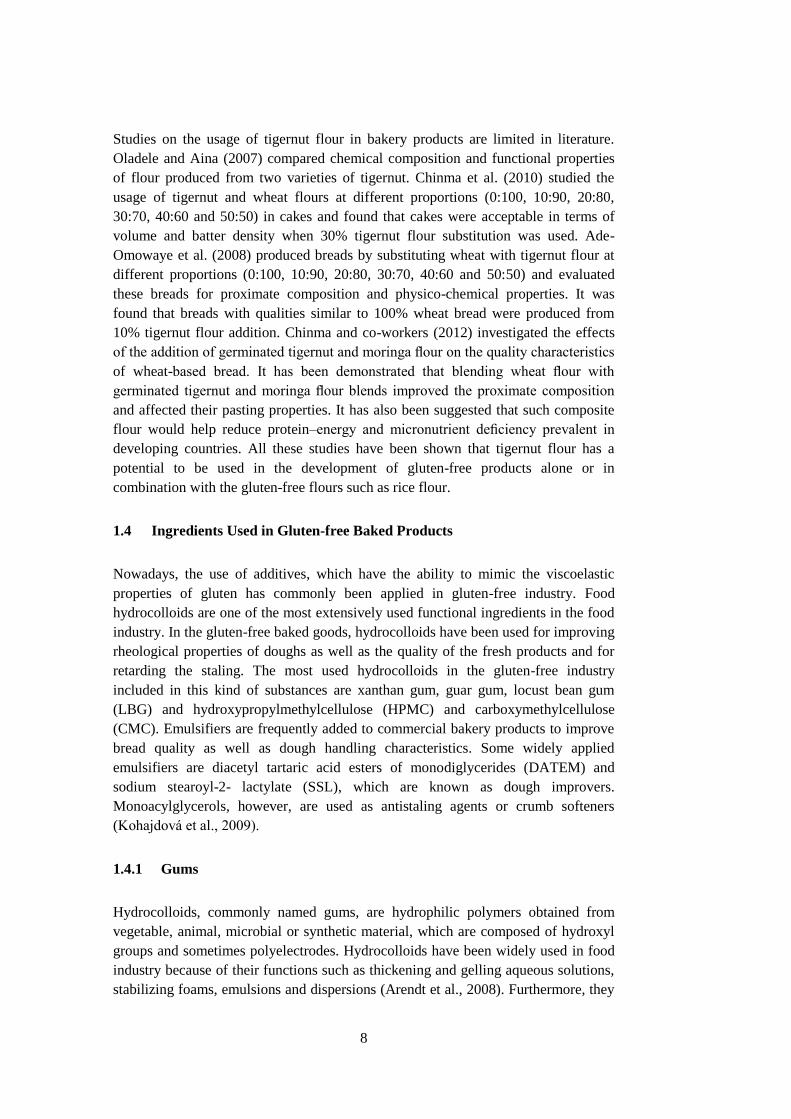
1.4.1.1 Guar Gum
Guar gum derives its name from the ground endosperm of the guar plant
“Cyamopsistetragonoloba”, a plant of the Leguminosae family. It is soluble in water,
nonionic, salt tolerant and its solutions are little affected by ions or pH. It exhibits
synergism with agar, kappa-type carrageenan, and xanthan gum. Galactomannans are
organized by entirely of linear (1, 4)-β-D-mannan chains with changing amounts of
single D-galactose substituents linked to the main backbone by (1-6)-α-glycosidic
bonds. There are 1.5 to 2 mannose residues for every galactose unit as presented in
Figure 1.1. The degree of substitution of galactose strongly affects the properties of
guar gum. Higher mannose amounts increase the stiffness of the polymer but they
also decrease the extensibility and the radius of gyration for every isolated chain
(Ptaszek et al., 2007).
10
Figure 1.1. Primary structure of guar gum
Since its aqueous solutions exhibit high viscosity even at low concentrations, it is
extensively used in the food industry. In addition, it is used as a food stabilizer and
source of dietary fiber. The strong hydrophilic character of guar gum makes it
suitable additive for salad dressings, ice cream mixes and bakery products (Berk,
1976). Moreover, the hydrophilic nature of guar gum is important to prevent of water
release and polymer aggregation during refrigeration. Since guar gum preferentially
binds to the starch, amylopectin retrogradation can be delayed, which can be
explained by the influence on the amylose network formation avoiding the creation
of a spongy matrix. Thus, the softening effect of guar gum has a critical role in the
retardation of bread staling.
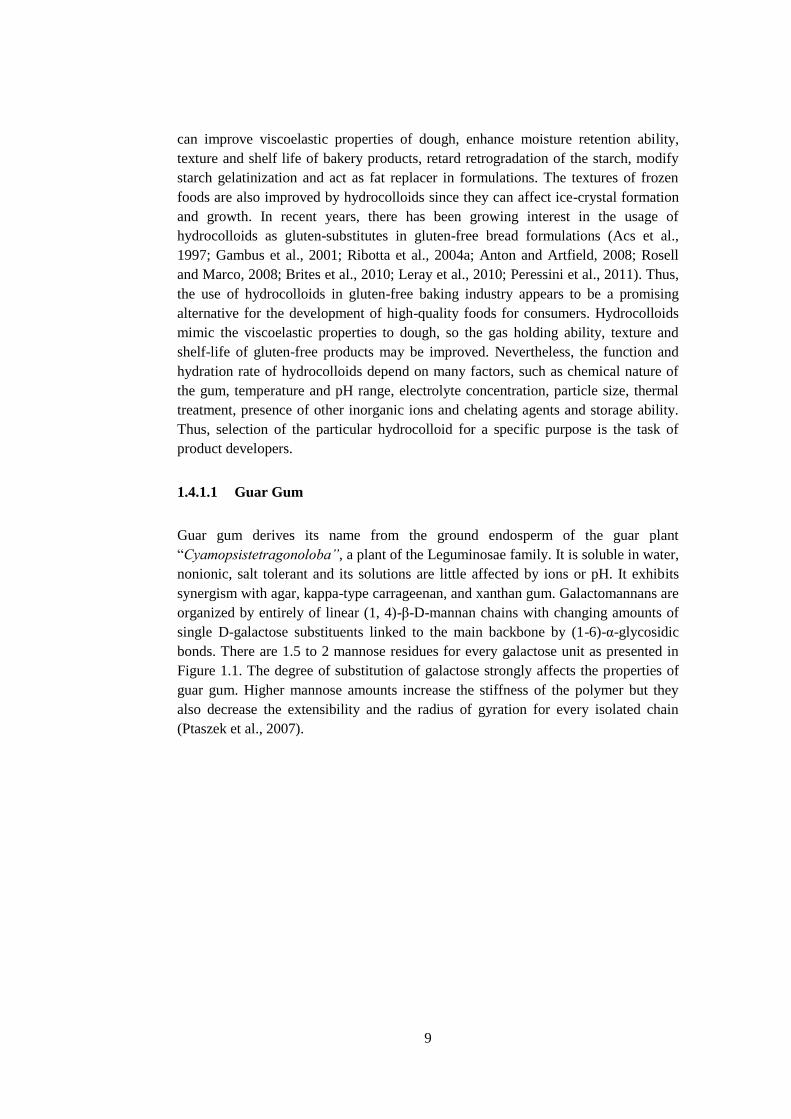
1.4.1.2 Locust bean Gum (LBG)
LBG, which is also known as carob gum is extracted from the seeds of carob tree
“Ceratoniasiliqua L.” after the removal of testa (seed coat) (Bonaduce et al, 2007).
Its structure shows similarities with guar gum. It is also a natural hydrocolloid and
flour made from the endosperm of the seed of a legume. However, it shows
important property differences from guar gum. As opposed to most of the
hydrocolloids, LBG is only slightly soluble in room-temperature water. To obtain a
required dissolution, it is necessary to heat suspensions to about 85°C. Solutions of
LBG by itself can not form gel, but hot solutions of LBG with agar, kappa-
carrageenan, and xanthan can form gel when cooled below the gelling temperature.
LBG is also a galactamannan but it has fewer branch units and more irregular
structure compared to guar gum. It has ability to form junction zones with its long
“naked chain” sections (BeMiller and Whistler, 1996). It is constituted of
galactomannan polysaccharides (together with guar gum), which are neutral
polysaccharides with a 1,4-linked β-D-mannopyranosyl backbone partially
11
substituted with a single 1,6-linkedα-D galactopyranosyl side group (Kök et al.,
1999) (Figure 1.2).
Figure 1.2. Primary structure of (LBG)
LBG is generally used in combination with other gums, such as HPMC, CMC,
carrageenan, xanthan, guar gum, in dairy products including frozen products (ice
cream), soft drinks, fruit juices, bread, pastry, fruit preserves, baby food and as
household gelling agents in puddings, flans and pudding powder, as dietary fibers,
and in pet foods. The thickening and gelling ability of LBG provides to products to
be more appealing and attractive to the consumer. It improves the shelf life and
texture of products by binding water, enhances the freeze-thaw behavior, prevents
crystallization, creaming or settling, syneresis and retrogradation of starch products
and maintains turbidity in soft drinks and juices (Wielinga and Maehall, 2000).
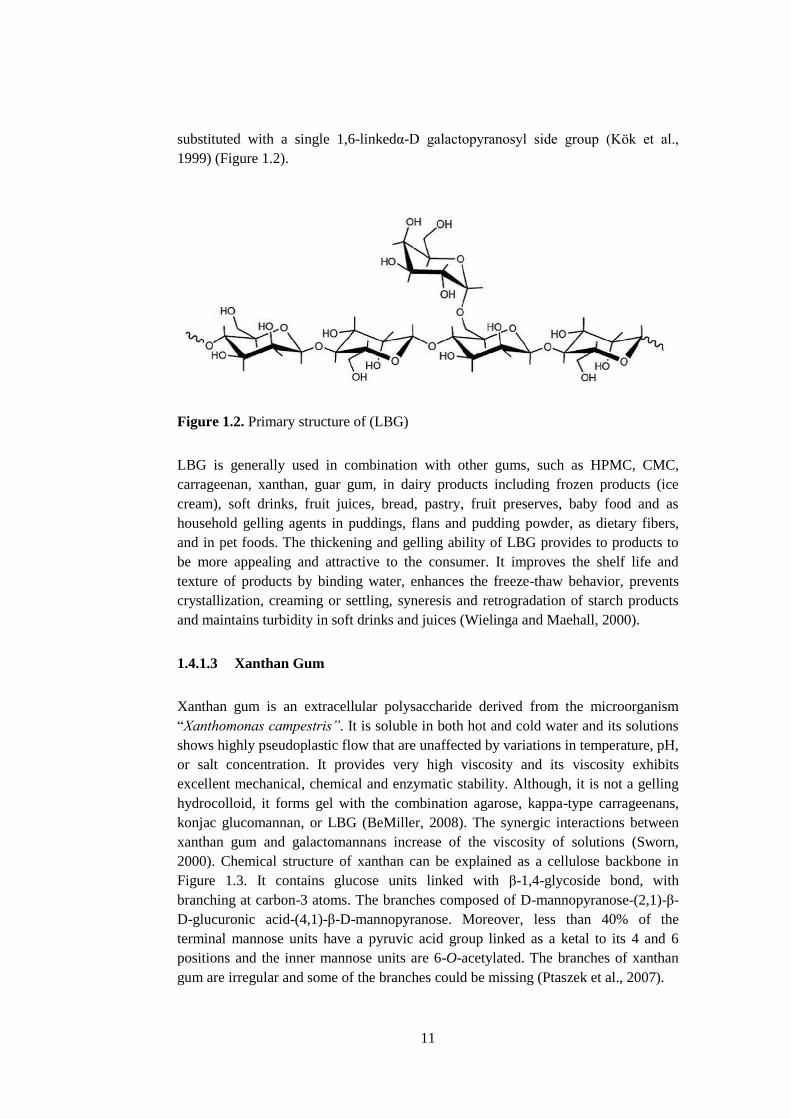
1.4.1.3 Xanthan Gum
Xanthan gum is an extracellular polysaccharide derived from the microorganism
“Xanthomonas campestris”. It is soluble in both hot and cold water and its solutions
shows highly pseudoplastic flow that are unaffected by variations in temperature, pH,
or salt concentration. It provides very high viscosity and its viscosity exhibits
excellent mechanical, chemical and enzymatic stability. Although, it is not a gelling
hydrocolloid, it forms gel with the combination agarose, kappa-type carrageenans,
konjac glucomannan, or LBG (BeMiller, 2008). The synergic interactions between
xanthan gum and galactomannans increase of the viscosity of solutions (Sworn,
2000). Chemical structure of xanthan can be explained as a cellulose backbone in
Figure 1.3. It contains glucose units linked with β-1,4-glycoside bond, with
branching at carbon-3 atoms. The branches composed of D-mannopyranose-(2,1)-β-
D-glucuronic acid-(4,1)-β-D-mannopyranose. Moreover, less than 40% of the
terminal mannose units have a pyruvic acid group linked as a ketal to its 4 and 6
positions and the inner mannose units are 6-O-acetylated. The branches of xanthan
gum are irregular and some of the branches could be missing (Ptaszek et al., 2007).
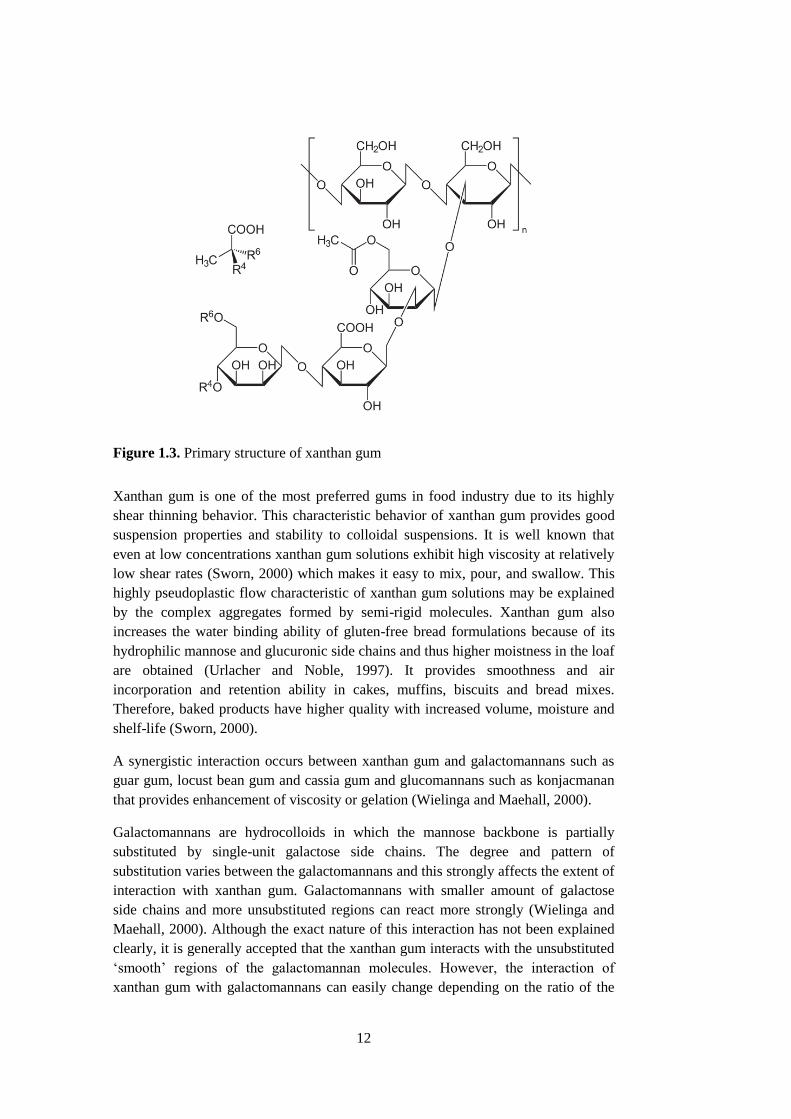
12
Figure 1.3. Primary structure of xanthan gum
Xanthan gum is one of the most preferred gums in food industry due to its highly
shear thinning behavior. This characteristic behavior of xanthan gum provides good
suspension properties and stability to colloidal suspensions. It is well known that
even at low concentrations xanthan gum solutions exhibit high viscosity at relatively
low shear rates (Sworn, 2000) which makes it easy to mix, pour, and swallow. This
highly pseudoplastic flow characteristic of xanthan gum solutions may be explained
by the complex aggregates formed by semi-rigid molecules. Xanthan gum also
increases the water binding ability of gluten-free bread formulations because of its
hydrophilic mannose and glucuronic side chains and thus higher moistness in the loaf
are obtained (Urlacher and Noble, 1997). It provides smoothness and air
incorporation and retention ability in cakes, muffins, biscuits and bread mixes.
Therefore, baked products have higher quality with increased volume, moisture and
shelf-life (Sworn, 2000).
A synergistic interaction occurs between xanthan gum and galactomannans such as
guar gum, locust bean gum and cassia gum and glucomannans such as konjacmanan
that provides enhancement of viscosity or gelation (Wielinga and Maehall, 2000).
Galactomannans are hydrocolloids in which the mannose backbone is partially
substituted by single-unit galactose side chains. The degree and pattern of
substitution varies between the galactomannans and this strongly affects the extent of
interaction with xanthan gum. Galactomannans with smaller amount of galactose
side chains and more unsubstituted regions can react more strongly (Wielinga and
Maehall, 2000). Although the exact nature of this interaction has not been explained
clearly, it is generally accepted that the xanthan gum interacts with the unsubstituted
‘smooth’ regions of the galactomannan molecules. However, the interaction of
xanthan gum with galactomannans can easily change depending on the ratio of the
13
mixture, pH, ionic environment and temperature of the solutions (Wielinga and
Maehall, 2000).
1.4.1.4 Cellulose Derivatives
Cellulose is known as the most abundant organic substances existing in nature and
cannot be digested by the human body. It is soluble in cold water and undergo
reversible thermal gelation. Like xanthan gum, their solutions are pseudoplastic. Due
to their interfacial activity, they can form films (BeMiller, 2008). The derivatives of
cellulose are methylcellulose, hydroxypropyl cellulose, hydroxypropyl
methylcellulose, methylethyl cellulose, and sodium carboxymethyl cellulose, which
is frequently called simply carboxymethyl cellulose and also known as cellulose
gumare obtained by chemical modification of cellulose.
HPMC is a chemically modified cellulose where hydroxyl groups are substituted by
hydroxypropyl and methoxy groups (Figure 1.4). It is soluble in cold water to give
solutions with a wide range of viscosity. It also binds water and shows shear thinning
behavior. The hydroxypropyl groups are hydrophilic while the methoxy groups are
hydrophobic that gives surfactant-like properties to HPMC. The etherification of
hydroxyl groups of the cellulose increases its water solubility and also confers some
affinity for the non-polar phase in doughs. Therefore, this bifunctional behavior
permits a multiphase system like bread dough to provide its uniformity and to protect
and maintain the emulsion stability during breadmaking (Selomulyo and Zhou,
2007). Although, hydrophobic groups present in the HPMC chain, it partially
maintains the hydrophilic properties of cellulose (Sarkar and Walker, 1995; Barcenas
and Rosell, 2005). HPMC undergoes reversible thermal gelation (gelling in cool
water, then becoming amorphous upon heated, and after further cooling, it reverts
back to a gel) (BeMiller, 2008).
The amount of hydrophilic and hydrophobic substitution can be changed in different
varieties of HPMC. This property makes it a valuable hydrocolloid for challenging
food applications. Due to its ether groups, methylcellulose can easily stabilize
emulsions and foams. Since it provides fat like properties, it reduces the amount of
fat in foods and the absorption of fat in fried products. Thus, they are used in low-
calorie, yeast-leavened, wheat-flour-free baked products. It is also used in wheat
based baked goods to improve crumb structure, loaf volume, crumb moisture and
sensory properties. In addition to these properties, it is a good anti-staling agent and
retards the crumb firming and amylopectin retrogradation (Guarda et al., 2004).
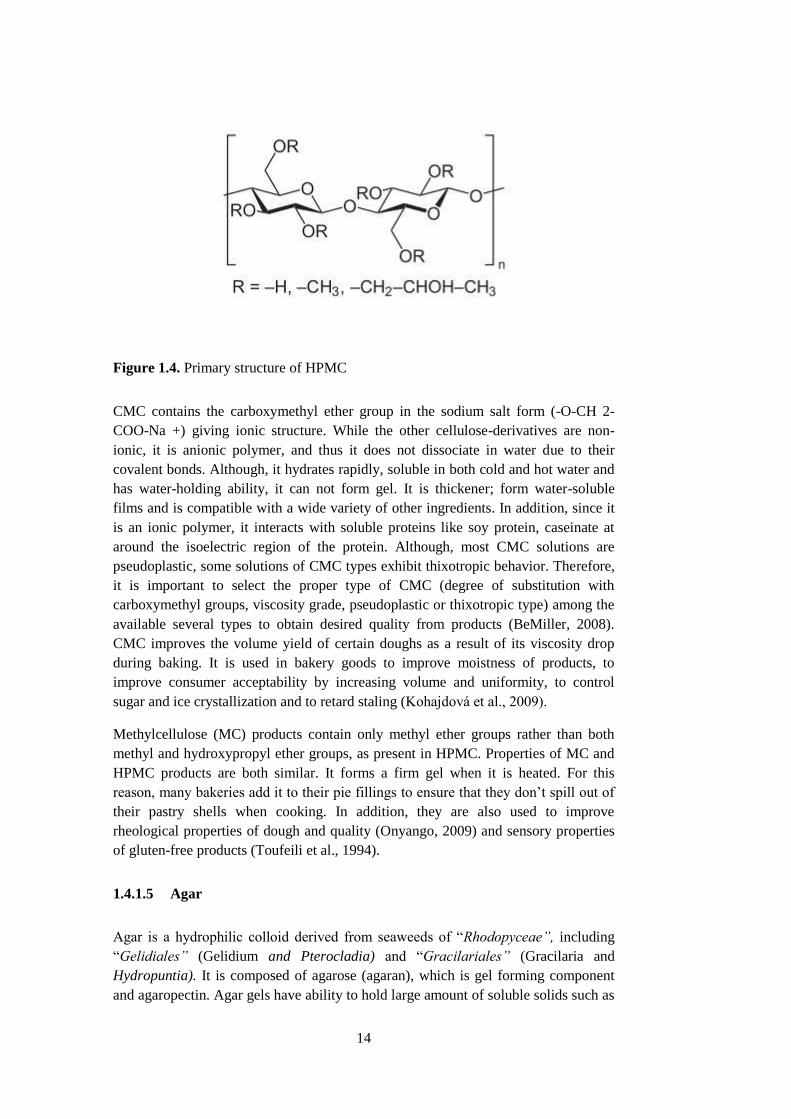
14
Figure 1.4. Primary structure of HPMC
CMC contains the carboxymethyl ether group in the sodium salt form (-O-CH 2-
COO-Na +) giving ionic structure. While the other cellulose-derivatives are non-
ionic, it is anionic polymer, and thus it does not dissociate in water due to their
covalent bonds. Although, it hydrates rapidly, soluble in both cold and hot water and
has water-holding ability, it can not form gel. It is thickener; form water-soluble
films and is compatible with a wide variety of other ingredients. In addition, since it
is an ionic polymer, it interacts with soluble proteins like soy protein, caseinate at
around the isoelectric region of the protein. Although, most CMC solutions are
pseudoplastic, some solutions of CMC types exhibit thixotropic behavior. Therefore,
it is important to select the proper type of CMC (degree of substitution with
carboxymethyl groups, viscosity grade, pseudoplastic or thixotropic type) among the
available several types to obtain desired quality from products (BeMiller, 2008).
CMC improves the volume yield of certain doughs as a result of its viscosity drop
during baking. It is used in bakery goods to improve moistness of products, to
improve consumer acceptability by increasing volume and uniformity, to control
sugar and ice crystallization and to retard staling (Kohajdová et al., 2009).
Methylcellulose (MC) products contain only methyl ether groups rather than both
methyl and hydroxypropyl ether groups, as present in HPMC. Properties of MC and
HPMC products are both similar. It forms a firm gel when it is heated. For this
reason, many bakeries add it to their pie fillings to ensure that they don’t spill out of
their pastry shells when cooking. In addition, they are also used to improve
rheological properties of dough and quality (Onyango, 2009) and sensory properties
of gluten-free products (Toufeili et al., 1994).
1.4.1.5 Agar
Agar is a hydrophilic colloid derived from seaweeds of “Rhodopyceae”, including
“Gelidiales” (Gelidium and Pterocladia) and “Gracilariales” (Gracilaria and
Hydropuntia). It is composed of agarose (agaran), which is gel forming component
and agaropectin. Agar gels have ability to hold large amount of soluble solids such as
15
sugar without allowing crystallization becoming opaque, or losing adhesive
properties. Therefore, they are generally used in the preparation of bakery glazes,
icings and toppings and in the formulation of piping jellies for fillings in doughnuts
and filled cakes (Kohajdová et al., 2009). However, it is rather expensive than other
hydrocolloids, which limits its usage in food products.
1.4.1.6 Pectin
Pectin is a natural product, which can be found in the cell wall of all plants and many
fruits in variable amounts and qualities. Pectin substances are primarily soluble fiber.
Pectin substances contain a wide variety of materials based upon poly-α-1,4-D-
galacturonic acid, with some side chains of galactose, rabinose, xylose, rhamnose or
glucose and with varying degrees of esterification of the carboxylicacid with methyl
groups compositions. Pectin may either a high degree (high methoxyl pectin, HMP)
or a lower degree (low methoxyl pectin, LMP) of esterification. While HMP is
naturally found in the fruit, LMP is a chemically modified pectin (Stauffer, 1990;
Edwards, 2007). HMP readily forms film gels at low concentrations and is widely
used rapid-setting jellies and similar products. On the other hand, LMP gels are less
reactive and used for the usual consumer jellies and similar products in which a
softer jells is required. It is used jellifying, thickening and stabilizing agent in the
production of jams, confectionery, baked and dairy products. Pectin is also used as an
ingredient in aerated products and adds moistness to the bread and used as a fat
replacer (Stauffer, 1990; Edwards, 2007).
1.4.2 Emulsifiers
In addition to hydrocolloids, emulsifiers are also commonly used in bakery products
to assist blending and emulsification of ingredients, to enhance the properties of the
shortening, and to obtain a softer crumb. Moreover, they enhance dough handling
ability, improve rate of hydration and water absorption, provide greater tolerance to
resting and fermentation, improve crumb structure and loaf volume, increase
uniformity in cell size, advance gas retention resulting in lower yeast requirements,
better oven spring and faster rate of proof and provide longer shelf-life of bread
(Stampfli and Nersten, 1995). Interaction of an emulsifier with the protein can
improve the strength and allow better retention of CO2. They can also inhibit the
firming of the crumb, associated with staling. Their interaction with starch and
blocking effect of moisture migration between gluten and starch prevents starch from
adsorbing water. This property provides anti-staling mechanism to emulsifiers
(Arendt and Moore, 2006).
Emulsifiers are amphilic substances. Their hydrophilic and lipophilic groups allow
the interaction between the emulsifiers and other components of dough such as
starch, protein, water and shortening and thus contribute to the increased stability of
a thermodynamically unstable system. The hydrophilic/lipophilic balance number
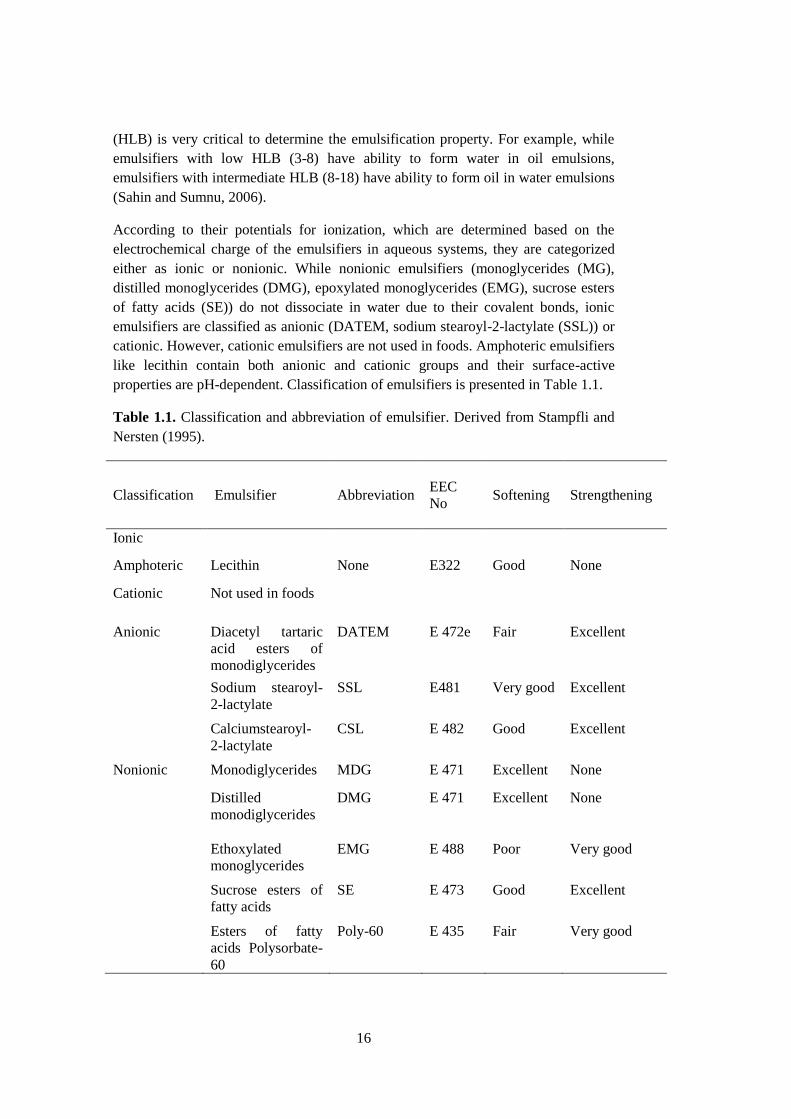
16
(HLB) is very critical to determine the emulsification property. For example, while
emulsifiers with low HLB (3-8) have ability to form water in oil emulsions,
emulsifiers with intermediate HLB (8-18) have ability to form oil in water emulsions
(Sahin and Sumnu, 2006).
According to their potentials for ionization, which are determined based on the
electrochemical charge of the emulsifiers in aqueous systems, they are categorized
either as ionic or nonionic. While nonionic emulsifiers (monoglycerides (MG),
distilled monoglycerides (DMG), epoxylated monoglycerides (EMG), sucrose esters
of fatty acids (SE)) do not dissociate in water due to their covalent bonds, ionic
emulsifiers are classified as anionic (DATEM, sodium stearoyl-2-lactylate (SSL)) or
cationic. However, cationic emulsifiers are not used in foods. Amphoteric emulsifiers
like lecithin contain both anionic and cationic groups and their surface-active
properties are pH-dependent. Classification of emulsifiers is presented in Table 1.1.
Table 1.1. Classification and abbreviation of emulsifier. Derived from Stampfli and
Nersten (1995).
Classification Emulsifier Abbreviation
EEC
No
Softening Strengthening
Ionic
Amphoteric Lecithin None E322 Good None
Cationic Not used in foods
Anionic Diacetyl tartaric
acid esters of
monodiglycerides
DATEM
E 472e Fair Excellent
Sodium stearoyl-
2-lactylate
SSL E481 Very good Excellent
Calciumstearoyl-
2-lactylate
CSL E 482 Good Excellent
Nonionic Monodiglycerides MDG E 471 Excellent None
Distilled
monodiglycerides
DMG
E 471 Excellent
None
Ethoxylated
monoglycerides
EMG E 488 Poor Very good
Sucrose esters of
fatty acids
SE E 473 Good Excellent
Esters of fatty
acids Polysorbate-
60
Poly-60 E 435 Fair Very good
17
According to the required properties in bread making, the emulsifiers are normally
classified as dough strengtheners and crumb softeners. However, some emulsifiers
such as SSL exhibit both dough strengthening and crumb softening properties.
DATEM, lecithin, monodiglycerides (MDG), DMG, SSL, calciumstearoyl-2-
lactylate (CSL), EMG, SE, polysorbate-60 (Poly-60), sodium stearoylfumarate,
sodium lauryl sulfate, dioctyl sodium sulfosuccinate, polyglycerol esters, and sucrose
esters are some of the frequently used emulsifiers in wheat based bakery products
(Orthoefer, 2008). Emulsifier PurawaveTM
has also been shown to improve quality of
microwave baked wheat based breads and gluten-free cakes (Ozmutlu et al., 2001;
Turabi et al., 2008a). Although, the synergic interaction between hydrocolloids and
emulsifiers are well known, there is limited number of study on the use of both
hydrocolloids and emulsifiers in gluten-free bread formulations. Onyango et al.
(2009) conducted a study on the effect of cellulose-derivatives and emulsifiers on the
creep-recovery behavior of gluten-free dough and quality of gluten-free breads
prepared from gelatinized cassava starch and sorghum. Nunes et al. (2009) studied
the impacts of the emulsifiers (lecithin (LC), DATEM, DMG or SSL) on the
rheological properties of rice bread dough and final quality of bread formulated with
xanthan gum.
1.4.2.1 Dough Strengthener
The rheological properties of the dough plays critical role in the production of bread.
Emulsifiers are generally used as dough conditioners to obtain a good machine
tolerance from dough. DATEM, SSL, CSL and polysorbate are the most widely used
dough strengtheners in baking industry. These emulsifiers are effective during
mechanical handling, fermentation, shaping, transport and the first part of the baking
period. Their positive effect on specific volume and texture of breads has been
demonstrated in different studies (Stampfli and Nersten, 1995). Although, the
mechanism of dough strengthening of emulsifiers is not fully understood, several
theories exist to explain their positive effect as dough strengthener (Krog, 1981;
Tamstorf, 1983). One of the explanations is that emulsifiers promote strength to
wheat dough due to the complex formation between emulsifier and gluten proteins.
The emulsifier may bind to the protein hydrophobic surface that assists aggregation
of gluten proteins in dough and formation of a strong protein network and therefore
better texture and increased volume of bread were obtained. Another theory is based
on the ability of polar emulsifiers to form liquid–crystalline phases in water, which
associates with gliadin and provides dough elasticity allowing gas cell to expand
resulting in an increased volume.
DATA ESTERS or DATEM is anionic oil-in-water emulsifier. It enhances mixing
tolerance, gas retention, and resistance of the dough to collapse, improves loaf
volume and endows the crumb with a good texture, fine grain and good slicing
properties like SSL. DATEM may form hydrogen bonds with starch and glutamine,
which have ability to promote the aggregation of gluten proteins in dough by binding
to the protein hydrophobic surface. This provides the formation of a strong protein

18
network resulting in better crumb texture and increased volume. It has been also
reported that DATEM may also form lamellar liquid-crystalline phases in water,
which associates with gliadins and the formation of such structures allows the
expansion of gas cells and contributes to dough elasticity resulting in improvement of
bread volume. When it is used in frozen dough, DATEM provides bread with
increased loaf volume and form ratio (i.e. height/width) values, lower firmness and
delays staling. Its interaction with starch, particularly with the linear amylose
molecules and also with amylopectin offers crumb-softening effect. The formations
of such complexes also avoid bread staling either by preventing amylose or
amylopectin retrogradation or by having fewer ß-type amylose nuclei that also could
promote amylopectin retrogradation (Kohajdová et al., 2009).
SE contains a hydrophilic sugar head and one or more lipophilic fatty acid tails. It
provides high volume, fine and soft crumb structure, extends shelf life, raises dough
mixing tolerance, and enhances freeze–thaw stability. It interacts with the amylose
molecules to form inclusion complexes with the helical amylose molecules during
gelatinization and such complex formations inhibit starch retrogradation resulting in
a baked product with longer freshness. It avoids wheat protein denaturation during
freezing and thus damage to the baking properties of the frozen dough is minimized.
1.4.2.2 Crumb Softeners
Crumb softeners have ability to produce a long-term softness in the crumb of bread
by interacting with the flour components and retarding the staling. One of the most
used crumb softeners is the monoglycerides. The generally accepted model about the
mechanism by which crumb softeners retard the firming process is based on the
ability of monoglycerides to form complexes with amylose. Tamstorf (1983) stated
that the amylose-monoglyceride inclusion complex was insoluble in water and did
not participate in the gel formation, which typically happens during baking. In
addition, this complex neither recrystallizes nor contributes to the staling of the bread
crumb upon cooling. Nevertheless, it has been stated that the ability of different
emulsifiers to form complexes with amylose varies; hence their contributions to
reduction of the staling rate changes.
SSL, an anionic oil-in-water emulsifier, is used to improve the quality of products in
baking industry. It improves mixing tolerance and resistance of the dough to
collapse. In addition, it offers the gas-dough interface with certain properties, which
are favorable for the stability of the gas bubbles in bread dough throughout the
breadmaking process and thus it enhances loaf volume, provides improved texture,
fine grain, and slicing properties. It has been also observed that it can decrease the
effects of frozen storage on rheological properties. However, it has not been found to
be effective in reducing the dough proofing time (Kohajdová et al., 2009).
Monoacylglycerol is extensively used fat-based emulsifiers in breads to delay staling
and as crumb softeners. The ability of monoglycerides to form complexes with
19
amylose offers retardation of the firming effect. Upon cooling, the complexed
amylose is not recrystallize as well as not contributes to staling of the bread crumb
(Kohajdová et al., 2009). Their combination with DATEM may be also used in
baking industry and such combinations provide a dough conditioner and crumb
softener effects to emulsifiers (Kohajdová et al., 2009).
1.5 Rheological Properties of Gluten-free Dough Formulations
Rheological information is critical to determine molecular interactions such as
starch-emulsifier, starch-gum interactions, which are important to optimize
acceptability, stability and textural properties of baked products. Rheological
analysis is also essential for dough studies since dough behavior is predictive of
baking performance (Dobraszczyk et al., 2001). Since dough undergoes stress during
mixing, proofing and baking, the final quality attributes such as loaf volume and
crumb texture can be correlated with dough handling ability (Dobraszczyk et al.,
2001). The direct correlation between dough handling ability and final bread quality
can be observed in wheat dough. However, the predictability of relationship between
rheological properties of gluten-free dough and final bread quality is not as easy as in
the case of wheat dough.
In food industry, rheology defines a relationship between the stress acting on a given
material and the resulting deformation and/or flow. Deformation (strain), which
occurs due to a force or stress, is the change in arrangement of the material
(response) (Malkin and Isayev, 2006) and this measures the resistance to flow of a
material (Steffe, 1996). In nature, there are no true elastic solids or liquids; but there
are complex materials that have behaviors with solid-like and liquid-like properties
(Malkin and Isayev, 2006). A material’s deformation behavior is determined as
elastic response, viscous response, and the ratio of viscous to elastic response. Elastic
modulus (G') shows the material’s solid (elastic) behavior while the viscous modulus
(G'') reflects liquid (viscous) behavior. Wheat dough has a nonlinear viscoelastic
behavior, which is shear-thinning with a small yield stress (Dobraszczyk et al.,
2001). When the low shear is applied, the dough will slowly flow with a fluid like
behavior. On the other hand, when it is rapidly stretched with high shear, it will
recoil back with elastic like behavior. However, gluten-free dough flows at low shear
due to their high G'', but at higher shear, the deformation will be permanent. Most
dough rheology focuses on large deformation in the non-linear region such as with a
farinograph, mixograph, or extensograph. However, testing is conducted with the
intent of destruction of the dough structure, which only determines single-point
measurements and does not reflect fully physical behavior of the dough. In addition,
the stress applied during the rheological measurements is much greater than that of
proofing and oven rise. Thus, it is important to determine rheological behavior of
dough within the linear viscoelastic region since the linear viscoelastic region is the
small range of applied stress where a material‘s response is independent of the stress
applied. Dynamic measurements reflect the flow and deformation of substances and,
in particular, their behavior in the transient area between solids and fluids. Thus, it
20
defines a relationship between the stress acting on a given material and the resulting
deformation and/or flow that occur (Crockett, 2009).
Recent studies have focused on the rheological properties of gluten-free doughs and
in these studies; researchers have tried to find a relationship between rheological
properties of gluten-free dough and final bread quality. The effects of hydrocolloids
on dough rheology and bread quality in gluten-free formulations based on rice flour,
corn starch, and sodium caseinate were studied by Lazaridou et al. (2007). The
influences of enzymes such as cyclodextrin glycosyl transferase, oxidase and
protease addition on rice flour dough rheology and bread quality were also
investigated (Gujral et al., 2003a; Gujral and Rosell, 2004; Renzetti and Arendt,
2009). Turabi et al. (2008a) determined rheological properties of rice cake batters
formulated with different gums (xanthan gum, guar gum, LBG, kappa-carrageenan,
HPMC, xanthan–guar gum blend and xanthan–kappa-carrageenan gum blend)and an
emulsifier blend (Purawave™).In the study of Sivaramakrishnan et al. (2004), it has
been reported that rice dough containing HPMC had similar rheological properties as
that of wheat flour dough and thus, gluten-free rice dough supplemented with HPMC
was suitable for making rice bread. Sciarini et al. (2012) determined the effect of
emulsifiers, hydrocolloids and enzymes on gluten-free dough rheology and thermal
properties and bread quality and they related dough properties parameters to bread
quality. The impacts of addition of both xanthan gum and different type of
emulsifiers on the rheological behavior of gluten-free rice dough were studied by
Nunes et al. (2009). Rheological properties of chestnut dough samples were also
worked in different studies, the effects of hydrocolloids, gelling agents and particle
size on rheological properties of chestnut dough were determined (Moreira 2010;
2011a; 2011b).
1.6 Infrared-Microwave Combination Baking of Foods
Although microwave heating has a number of advantages such as energy efficiency,
faster heating, space saving, precise process control, selective heating, and food with
high nutritional quality, microwave-baked products do not meet with consumer
acceptance due to their unacceptable quality (Sumnu, 2001). Infrared-microwave
combination heating includes infrared and microwave heating mechanisms together.
In combination heating, infrared heating can operate at different times and at
different locations compared to microwave heating which offers more uniform and
higher overall rate of heating (Datta et al., 2005). The combination heating provides
selectivity that improves moisture distribution inside food by heating the surface of a
food faster. Therefore, moisture can be easily removed from the surface of the
product and the food remains crisp (Datta et al., 2005). Thus, this technology
combines the browning and crisping advantages of near-infrared heating and the
time-saving and energy efficiency advantages of microwave heating.
The advantages of infrared–microwave combination heating over the microwave
heating have been realized over the past few years. This baking technology may be
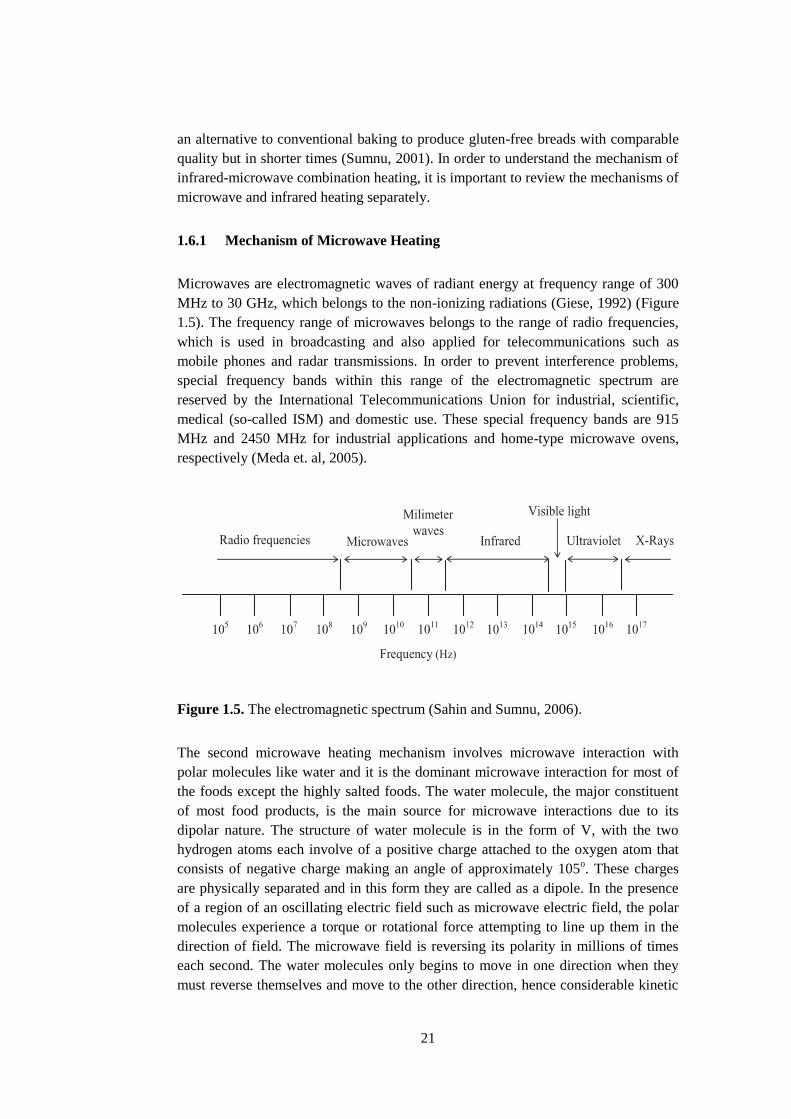
21
an alternative to conventional baking to produce gluten-free breads with comparable
quality but in shorter times (Sumnu, 2001). In order to understand the mechanism of
infrared-microwave combination heating, it is important to review the mechanisms of
microwave and infrared heating separately.
1.6.1 Mechanism of Microwave Heating
Microwaves are electromagnetic waves of radiant energy at frequency range of 300
MHz to 30 GHz, which belongs to the non-ionizing radiations (Giese, 1992) (Figure
1.5). The frequency range of microwaves belongs to the range of radio frequencies,
which is used in broadcasting and also applied for telecommunications such as
mobile phones and radar transmissions. In order to prevent interference problems,
special frequency bands within this range of the electromagnetic spectrum are
reserved by the International Telecommunications Union for industrial, scientific,
medical (so-called ISM) and domestic use. These special frequency bands are 915
MHz and 2450 MHz for industrial applications and home-type microwave ovens,
respectively (Meda et. al, 2005).
Figure 1.5. The electromagnetic spectrum (Sahin and Sumnu, 2006).
The second microwave heating mechanism involves microwave interaction with
polar molecules like water and it is the dominant microwave interaction for most of
the foods except the highly salted foods. The water molecule, the major constituent
of most food products, is the main source for microwave interactions due to its
dipolar nature. The structure of water molecule is in the form of V, with the two
hydrogen atoms each involve of a positive charge attached to the oxygen atom that
consists of negative charge making an angle of approximately 105o. These charges
are physically separated and in this form they are called as a dipole. In the presence
of a region of an oscillating electric field such as microwave electric field, the polar
molecules experience a torque or rotational force attempting to line up them in the
direction of field. The microwave field is reversing its polarity in millions of times
each second. The water molecules only begins to move in one direction when they
must reverse themselves and move to the other direction, hence considerable kinetic
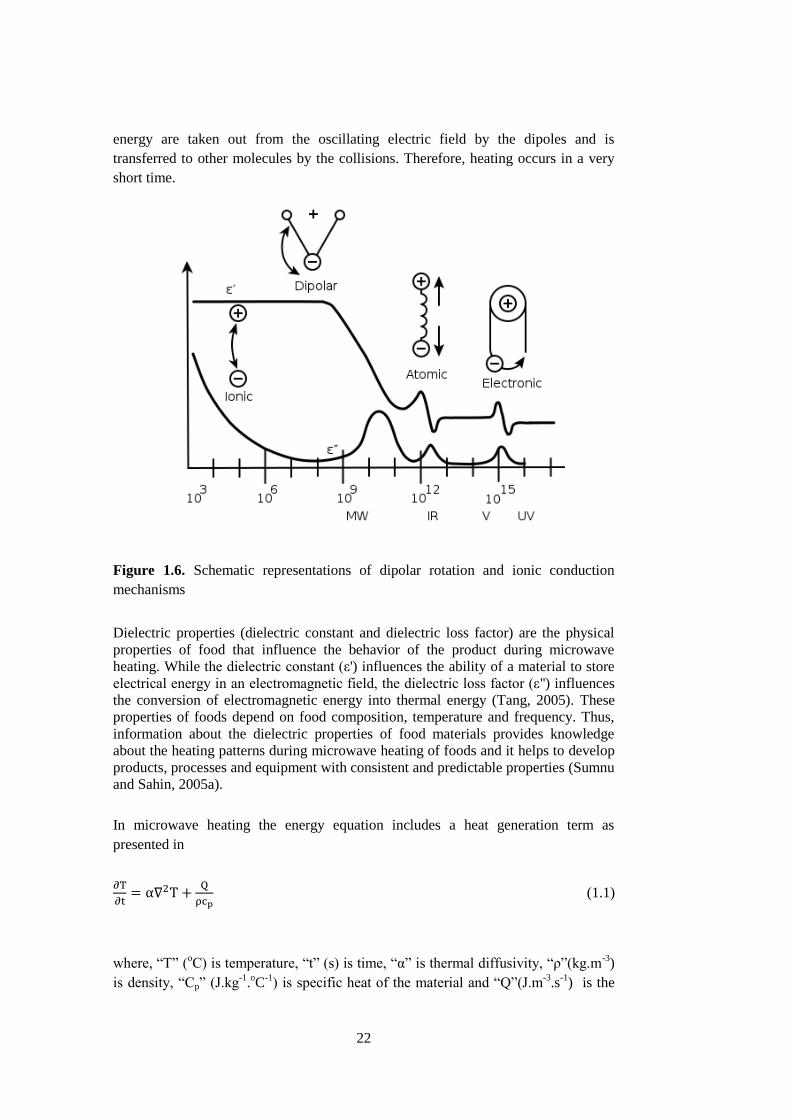
22
energy are taken out from the oscillating electric field by the dipoles and is
transferred to other molecules by the collisions. Therefore, heating occurs in a very
short time.
Figure 1.6. Schematic representations of dipolar rotation and ionic conduction
mechanisms
Dielectric properties (dielectric constant and dielectric loss factor) are the physical
properties of food that influence the behavior of the product during microwave
heating. While the dielectric constant (ε') influences the ability of a material to store
electrical energy in an electromagnetic field, the dielectric loss factor (ε'') influences
the conversion of electromagnetic energy into thermal energy (Tang, 2005). These
properties of foods depend on food composition, temperature and frequency. Thus,
information about the dielectric properties of food materials provides knowledge
about the heating patterns during microwave heating of foods and it helps to develop
products, processes and equipment with consistent and predictable properties (Sumnu
and Sahin, 2005a).
In microwave heating the energy equation includes a heat generation term as
presented in
(1.1)
where, “T” (oC) is temperature, “t” (s) is time, “α” is thermal diffusivity, “ρ”(kg.m
-3)
is density, “Cp” (J.kg-1
.oC
-1) is specific heat of the material and “Q”(J.m
-3.s
-1) is the
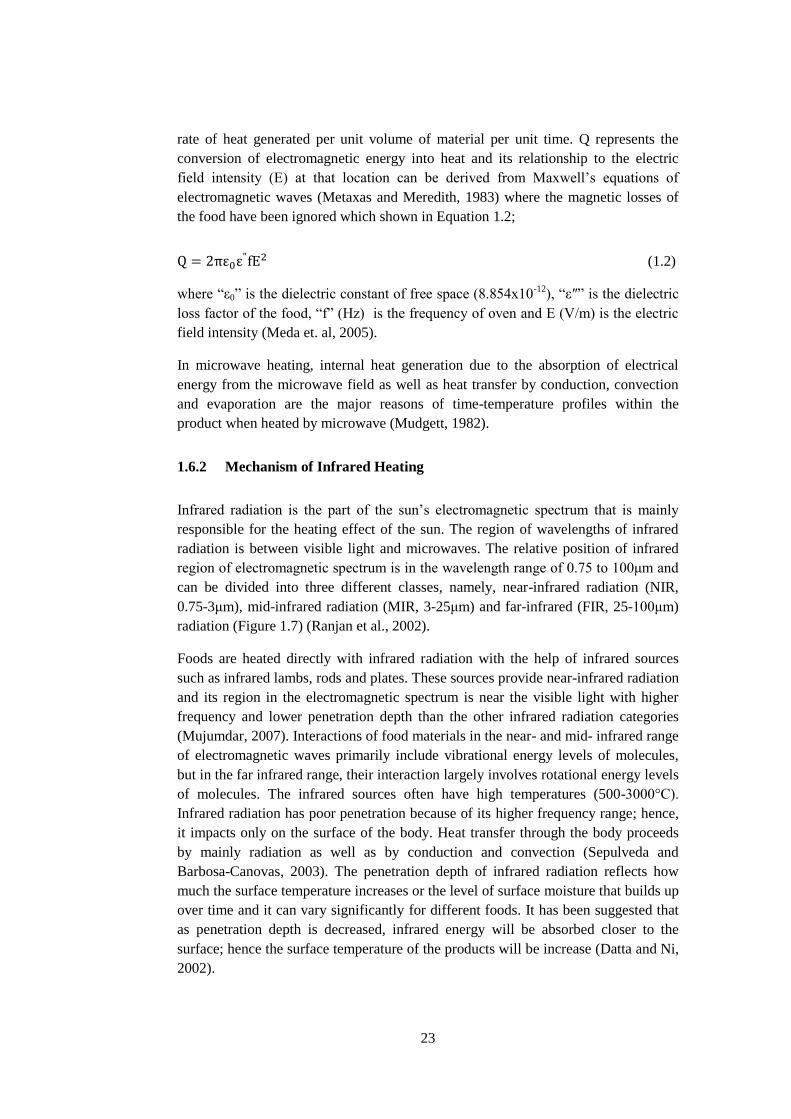
23
rate of heat generated per unit volume of material per unit time. Q represents the
conversion of electromagnetic energy into heat and its relationship to the electric
field intensity (E) at that location can be derived from Maxwell’s equations of
electromagnetic waves (Metaxas and Meredith, 1983) where the magnetic losses of
the food have been ignored which shown in Equation 1.2;
(1.2)
where “ε0” is the dielectric constant of free space (8.854x10⁻¹²), “ε″” is the dielectric
loss factor of the food, “f” (Hz) is the frequency of oven and E (V/m) is the electric
field intensity (Meda et. al, 2005).
In microwave heating, internal heat generation due to the absorption of electrical
energy from the microwave field as well as heat transfer by conduction, convection
and evaporation are the major reasons of time-temperature profiles within the
product when heated by microwave (Mudgett, 1982).
1.6.2 Mechanism of Infrared Heating
Infrared radiation is the part of the sun’s electromagnetic spectrum that is mainly
responsible for the heating effect of the sun. The region of wavelengths of infrared
radiation is between visible light and microwaves. The relative position of infrared
region of electromagnetic spectrum is in the wavelength range of 0.75 to 100μm and
can be divided into three different classes, namely, near-infrared radiation (NIR,
0.75-3μm), mid-infrared radiation (MIR, 3-25μm) and far-infrared (FIR, 25-100μm)
radiation (Figure 1.7) (Ranjan et al., 2002).
Foods are heated directly with infrared radiation with the help of infrared sources
such as infrared lambs, rods and plates. These sources provide near-infrared radiation
and its region in the electromagnetic spectrum is near the visible light with higher
frequency and lower penetration depth than the other infrared radiation categories
(Mujumdar, 2007). Interactions of food materials in the near- and mid- infrared range
of electromagnetic waves primarily include vibrational energy levels of molecules,
but in the far infrared range, their interaction largely involves rotational energy levels
of molecules. The infrared sources often have high temperatures (500-3000°C).
Infrared radiation has poor penetration because of its higher frequency range; hence,
it impacts only on the surface of the body. Heat transfer through the body proceeds
by mainly radiation as well as by conduction and convection (Sepulveda and
Barbosa-Canovas, 2003). The penetration depth of infrared radiation reflects how
much the surface temperature increases or the level of surface moisture that builds up
over time and it can vary significantly for different foods. It has been suggested that
as penetration depth is decreased, infrared energy will be absorbed closer to the
surface; hence the surface temperature of the products will be increase (Datta and Ni,
2002).
24
The advantages of infrared radiation are the versatility of infrared heating, simplicity
and compactness of the required equipment, fast transient response, reduced heating
time, rapid processing, decreased change of flavor loss, preservation of vitamins in
food products, absence of solute migration from inner to outer regions and also
energy saving effect (Ranjan et al., 2002; Mujumdar, 2007). Olsson et al. (2005)
investigated the effects of air jet impingement and infrared radiation on crust
formation of par-baked baguettes during post-baking. It has been stated that infrared
radiation and jet impingement increased the rate of color development of the crust
and reduced the heating time as compared conventional heating. The fastest color
development was obtained when infrared and impingement heating were combined.
Although combination baking increased moisture loss rate because of the high rate of
heat transfer, the total moisture loss was reduced due to the shorter heating time. In
the study of Shyu et al. (2008), bun bread, toast, pound cake, and sponge cake were
baked in a far infrared oven as well as in an electrical oven in order to evaluate the
influences of far infrared radiation on quality of baked products. It was found that
there were no significant differences in these products in terms of volume, water
activity, staling rate and sensory scores. Sumnu et al. (2005) determined the effects
of different baking methods (microwave, infrared and infrared-microwave
combination) on the quality of cakes. Researchers suggested that using only infrared
heating was not advisable since the cakes had a very thick crust and baking time was
not less than infrared-microwave baking.
Figure 1.7. The electromagnetic spectrum
25
1.6.3 Studies on Infrared-microwave Combination Baking of Foods
Although the use of microwave baking introduces some advantages over
conventional baking such as energy efficiency, faster heating, space saving, precise
process control, selective heating and food with high nutritional quality, there are
quality problems in these products which do not meet the expectations of the
customers (Sumnu, 2001). Common quality problems of microwave-baked products
are high moisture loss, firm structure, rapid staling and lack of surface browning,
flavor and crust formation.
One of the reasons for the problems related to microwave heating is the short baking
time in microwave oven, which does not allow the completion of physicochemical
changes and interactions of major ingredients. However, these reactions are
completed over a lengthy period in a conventional system (Sumnu, 2001). Specific
interactions of each component in the formulation with microwave energy are also
the cause of undesired texture of microwave-baked products (Sumnu, 2001).
Microwave ovens baking can neither promote browning reactions nor crust
formation. Because of the cool ambient temperature inside a microwave oven, the
surface temperature can not reach sufficient temperature to promote browning
reactions during the microwave baking (Decareau, 1992; Hegenbert, 1992). As a
result, the desired color and flavor are not obtained from microwave-baked products.
The color problems related to microwave baking may be overcome by using of
chestnut-rice flour and/or tigernut-rice flour blends. The problems associated to
crustless or unacceptable color of products baked using microwave can also be
eliminated by combining of microwaves with infrared heating.
Breads baked in microwave oven stale faster as compared to conventionally baked
one. During the microwave baking, more amylose is leached out of starch granules
that increases amount of starch gel (Sumnu and Sahin, 2005b). Moreover, this
amylose is more disoriented and contains less bound water in microwave-baked
bread as compared to conventionally baked one. Upon cooling, the surrounding
amylose molecules align and increased crumb firmness. Since amylose fractions of
microwave-heated bread have higher ability to realign into a more crystalline
structure than conventionally heated one, they have firmer texture (Sumnu, 2001).
Previous attempts have been made to overcome the problems associated with
microwave baking and in these studies the combination of microwave heating with
infrared heating has been successfully used by several researchers (Demirekler et al.,
2004; Keskin et al., 2004; Keskin et al., 2005; Sumnu et al., 2005; Demirkol, 2007;
Datta et al., 2007; Turabi et al., 2008b).
According to Demirekler et al. (2004) breads baked in infrared-microwave
combination oven had comparable quality with conventionally baked ones.
Moreover, the desirable color and crust formation in breads were obtained by the
help of infrared mechanism. However, the microwave power was found to be the
dominant factor on the weight loss and textural properties of wheat breads during the
26
infrared-microwave combination baking (Keskin et al., 2004). Sumnu et al. (2005)
compared the quality of microwave, infrared and infrared-microwave combination
baking of cakes and found that cakes baked in infrared-microwave combination oven
had similar color and firmness values with conventionally baked ones. Furthermore,
infrared-microwave combination oven reduced conventional baking time by about
75%. Keskin et al. (2007) determined the effect of different gums on quality of
infrared-microwave baked breads and found that xanthan-guar blend addition
improved bread quality in terms of specific volume, porosity and firmness. Sakiyan
et al. (2011) conducted a study on the gelatinization of cakes baked in microwave
and infrared-microwave combination oven and found that infrared-microwave
combination baking increased gelatinization degree as compared to microwave
baking and resulted in cakes comparable with the conventional baked ones. The
gluten-free rice cakes baked in infrared-microwave combination oven had
comparable quality with those baked in conventional oven in the study of Turabi et
al. (2008b). Sumnu et al. (2010) studied the effects of xanthan and guar gums on
staling of gluten-free rice cakes and found that xanthan-guar gum blend decreased
firmness, weight loss and retrogradation enthalpy of cakes baked in infrared-
microwave combination and conventional ovens. The studies on gluten-free products
baked in infrared-microwave combination oven are limited and there is a need for a
broader research about the infrared-microwave combination baking of gluten free
breads as well as their quality during storage.
1.7 Structural Analysis of Foods
Quality of a baked product depends on appearance, texture, loaf volume, and sensory
properties (Zghal et al., 1999). These properties are significantly affected by structure
of foods varying from the molecular to macroscopic levels. Thus, knowledge of
macro- and micro-structure is essential. However, examining food microstructure is
difficult, since food materials are complex and the majority of structural elements are
below the 100-μm range (Aguilera, 2005). Several microscopy, scanning, and
spectrometric techniques that allow visualization of changes in structure at different
levels without intrusion have been proposed as useful tools for image acquisition
(Falcone et al. 2006). In recent years, image analysis based on a large variety of
macroscopic and microscopic techniques has been applied as quantitative tool for
characterization of bread crumbs and digital scanners to capture bread crumb two
dimensions (2D) high-resolution images. Size, distribution, wall thickness, and
number of cells were determined in these studies (Zayas, 1993; Sapirstein et al.,
1994; Zghal et al., 2002; Rouille et al., 2005; Datta et al., 2007; Sanchez-Pardo et al.,
2008; Ozkoc et al., 2009a; Polaki et al., 2010; Rosell and Santos, 2010; Farrera-
Rebollo et al., 2012).
27
1.7.1 Macro-structure of Bakery Products
Image analysis methods based on a large variety of macroscopic techniques such as
scanning have widely been applied for quantitative evaluation of morphology and
macro-/micro-structure of food products. Quantitative examination of bread crumb,
such as measuring gas cell sizes and their distribution, can be done by image analysis
to provide information on structural system. The obtained data from image analysis
is useful to convert the complex food system to numerical data that improves the
understanding of structure-function relationships of foods (Falcone et al., 2006)
The most widely applied imaging techniques in macro-structural food research is
scanning. The use of scanner for image acquisition and for the assessment of
appearance and/or colour offers all the advantages of previously investigated camera
based systems. In addition, the acquisition of 2D images by flatbed scanning offers
some advantages over camera based systems such as being fast, easy to use,
economical, robust, independent of the external light conditions and with good
accuracy. However, one of the disadvantages of this technique is the lack of a
standardized technique for this evaluation. The differences in methodologies such as
scanning resolution also result in different data for similar breads. Hence, comparing
information among published report is a challenging issue. The most of image
analysis applications in the area of cereal research were focused on the
characterization of dough and bread-crumb structure (Zghal et al., 1999; Schober et
al., 2005; Tlapale-Valdivia et al., 2010, Van Riemsdijk, 2011, Farrera-Rebollo et al.,
2012)
1.7.2 Micro-structure of Bakery Products
Sensory (size, shape and color) and texture characteristics of bakery products are
strongly affected by structural organization of foods at molecular, microscopic, and
macroscopic levels. In particular, microstructure and interactions of food components
critically contribute to transport, physical and sensory properties of foods; hence
determine the texture of foods.
Studies on food structure at a microscopic level can be performed by using a large
variety of microscopic techniques including light microscopy (LM), scanning
electron microscopy (SEM), transmission electron microscopy (TEM), and confocal
laser scanning microscopy (CLSM). Up to date, image analysis techniques such as
LM, CSLM and electron microscopy (EM) have been applied to evaluate the
relationship between microstructure and physical properties of bread. LM offers the
specific staining of the different chemical components of a food (proteins, fat
droplets, and so on), which make it a suitable imaging technique for the research of
multicomponent or multiphase foods such as cereal-based foods. However, as
compared to electron microscopy techniques, the magnification of this technique is
modest. Different characteristics of particulate structures can be determined by
combining of different imaging techniques (Falcone et al., 2006). In the study of
28
Langton et al. (1996), different imaging techniques were used to analyze the structure
of microporous, particulate gels. In this study, LM was used to visualize pores, TEM
was applied to evaluate particle size, while SEM allowed to detect how the particles
were linked together (Falcone et al., 2006). Compared to LM, SEM and TEM allow a
higher resolution, but sample preparation procedures such as freezing and
dehydration are required and that may cause artifacts. SEM is one of the most
important image analysis techniques, since it provides the combination of higher
magnification, larger depth of focus, greater resolution, and ease of sample
observation. SEM studies have been assessed to determine the changes that occur
during baking qualitatively (Sanchez-Pardo et al., 2008; Ozkoc et al., 2009a; Polaki
et al., 2010; Rosell and Santos, 2010). In a recent study by Turabi et al. (2010), SEM
has been used to obtain quantitative information on macro- and micro-structure of
gluten-free rice cakes. Concerning sample preparation, CLSM represents a suitable
alternative imaging technique since it requires a minimum sample preparation.
CLSM can be used to investigative the 3D structure of the protein network of
doughs, breads, pasta samples, or high-fat foods (Moore et al., 2004; Renzetti et al.,
2004; Moore et al., 2007; Schober et al., 2007). One of the other advantages of this
method is presenting the optical slicing of the sample. The use of X-ray
microtomography (X-ray μCT), which is usually used in medical applications,
introduces some advantages over other image analysis techniques. This new imaging
technique creates 3-D representation of the inside structure of food from 2-D image
slices allowing a set of projection measurements recorded from a certain number of
points of view in non-destructive and non-invasive way. The visualization of the
final image results can be recorded by 3-D rendering, by 2-D slices, or projections
following arbitrary directions. It has an ability to create the contrast-enhanced
imaging without any sample preparation that helps to overcome typical artifacts in
the visualization of structure. In very recent studies, X-ray μCT has been used for
quantitative characterization of bread crumbs by creating 3-D representation of the
inside structure of bread from 2-D image slices (Falcone et al., 2004, Falcone et al.,
2005; Primo-Martín et al., 2010; Wang et al., 2011).
1.8 Staling in Gluten-free Breads
Staling is a complex process that encompasses many of the physical, chemical and
sensory changes occurring in bakery products during storage, which cause large
economic losses and decreases in consumer acceptance. Dough formulations include
various components each undergoing complicated changes during the breadmaking
process as well as during storage of bread, which make staling an extremely complex
phenomenon to describe (Gray and BeMiller, 2003). Starch
retrogradation/crystallization, moisture diffusion and redistribution among the
protein-starch components and crumb-crust fractions of the bread as well as
reorganization of starch polymers within the amorphous region have been related to
bread staling (Ozkoc et al. 2009b).
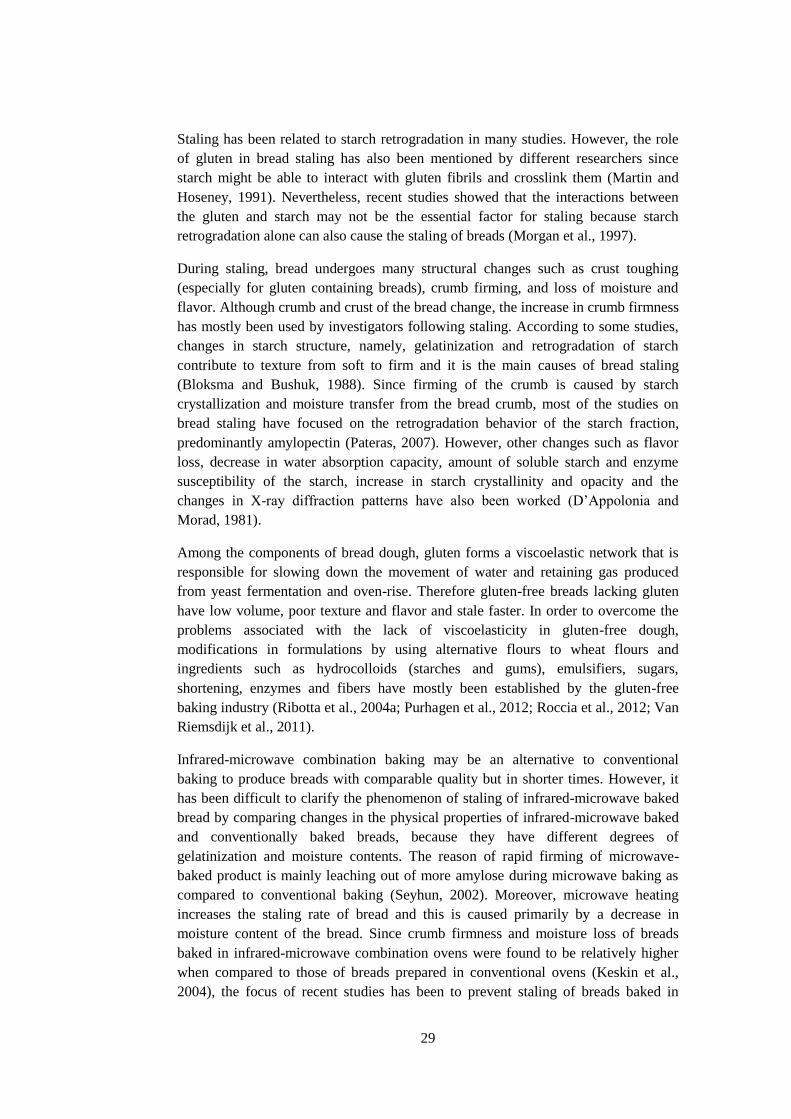
29
Staling has been related to starch retrogradation in many studies. However, the role
of gluten in bread staling has also been mentioned by different researchers since
starch might be able to interact with gluten fibrils and crosslink them (Martin and
Hoseney, 1991). Nevertheless, recent studies showed that the interactions between
the gluten and starch may not be the essential factor for staling because starch
retrogradation alone can also cause the staling of breads (Morgan et al., 1997).
During staling, bread undergoes many structural changes such as crust toughing
(especially for gluten containing breads), crumb firming, and loss of moisture and
flavor. Although crumb and crust of the bread change, the increase in crumb firmness
has mostly been used by investigators following staling. According to some studies,
changes in starch structure, namely, gelatinization and retrogradation of starch
contribute to texture from soft to firm and it is the main causes of bread staling
(Bloksma and Bushuk, 1988). Since firming of the crumb is caused by starch
crystallization and moisture transfer from the bread crumb, most of the studies on
bread staling have focused on the retrogradation behavior of the starch fraction,
predominantly amylopectin (Pateras, 2007). However, other changes such as flavor
loss, decrease in water absorption capacity, amount of soluble starch and enzyme
susceptibility of the starch, increase in starch crystallinity and opacity and the
changes in X-ray diffraction patterns have also been worked (D’Appolonia and
Morad, 1981).
Among the components of bread dough, gluten forms a viscoelastic network that is
responsible for slowing down the movement of water and retaining gas produced
from yeast fermentation and oven-rise. Therefore gluten-free breads lacking gluten
have low volume, poor texture and flavor and stale faster. In order to overcome the
problems associated with the lack of viscoelasticity in gluten-free dough,
modifications in formulations by using alternative flours to wheat flours and
ingredients such as hydrocolloids (starches and gums), emulsifiers, sugars,
shortening, enzymes and fibers have mostly been established by the gluten-free
baking industry (Ribotta et al., 2004a; Purhagen et al., 2012; Roccia et al., 2012; Van
Riemsdijk et al., 2011).
Infrared-microwave combination baking may be an alternative to conventional
baking to produce breads with comparable quality but in shorter times. However, it
has been difficult to clarify the phenomenon of staling of infrared-microwave baked
bread by comparing changes in the physical properties of infrared-microwave baked
and conventionally baked breads, because they have different degrees of
gelatinization and moisture contents. The reason of rapid firming of microwave-
baked product is mainly leaching out of more amylose during microwave baking as
compared to conventional baking (Seyhun, 2002). Moreover, microwave heating
increases the staling rate of bread and this is caused primarily by a decrease in
moisture content of the bread. Since crumb firmness and moisture loss of breads
baked in infrared-microwave combination ovens were found to be relatively higher
when compared to those of breads prepared in conventional ovens (Keskin et al.,
2004), the focus of recent studies has been to prevent staling of breads baked in
30
infrared-microwave combination ovens by modifying the bread formulation and by
adjusting processing conditions (Ozkoc et al. 2009b). Ozkoc et al. (2009b) studied
staling of breads baked in different ovens (microwave, infrared-microwave
combination and conventional) by mechanical (compression measurements),
physicochemical (DSC, X-ray, FTIR) and rheological (RVA) methods and the
retrogradation enthalpy values and FTIR outputs related to starch retrogradation of
breads baked in combination oven were not found to be statistically different than
that of conventionally baked ones. In literature, there are a limited number of the
studies on staling of gluten-free products. Addition of xanthan-guar gum blend was
found to be effective on the retardation of staling of gluten-free cakes baked in
infrared-microwave oven (Sumnu et al., 2010).
Different techniques have been used to characterize and gain an understanding of the
staling phenomenon. Rheological techniques, differential scanning calorimetry
(DSC), X-ray diffractometry, fourier transform infrared spectroscopy (FTIR), nuclear
magnetic resonance (NMR) and vibrational spectrophotometry have been widely
used to monitor changes in certain physical properties of breads as indicators of
retrogradation at the macroscopic level and in starch polymer conformation and
water mobility in starch gels at the molecular level. To obtain an adequate
description of retrogradation, it is also important to determine retrogradation
characteristics of gluten-free breads at both macroscopic and molecular levels (Karim
et al., 2000). However, the staling parameters of gluten-free breads baked in infrared-
microwave combination oven have not been studied yet.
1.9 Optimization by Response Surface Methodology (RSM)
Optimization means improvement of the performance of a system, a process, or a
product to gain the maximum benefit from it. Generally as an optimization technique,
one-at-a-time is used to monitor the influence of one factor at a time on experimental
response. It means that while only one factor is varied at a time, all other variables
are fixed to their central or baseline values. However, one-factor optimization is
problematic since this technique does not involve the interactive effects among the
variables studied; hence it does not represent the complete effects of the parameter
on the response. Another disadvantage of one-factor optimization is the increase in
the number of experiments needed to conduct, which results in an increase of time
and expenses and increase in the consumption of reagents and materials. Thus, in
order to overcome this problem, multivariate statistic techniques are applied in the
optimization. Among the most applicable multivariate techniques utilized in
optimization is response surface methodology (RSM).
RSM includes a group of mathematical and statistical procedures based on the fit of a
polynomial equation to the experimental data. It is a helpful tool to examine the
relationship between the responses and factors. It is used to minimize the number of
trials and to provide multiple regression approach for optimization of ingredient
levels, formulations and processes in food technology (Myers and Montgomery,
31
2002). Basically the application of RSM includes some stages as an optimization
technique are as follows: (1) the selection of independent variables (2) the selection
of the experimental design and using the experiments according to the selected
experimental matrix; (3) the mathematical–statistical treatment of the obtained
experimental data through the fit of a polynomial function; (4) the evaluation of the
model’s fitness; (5) the verification of the necessity and possibility of performing a
displacement in direction to the optimal region; and (6) obtaining the optimum values
for each studied variable.
If the response (y) is to be maximized in a two variables (x1, x2) system and the
response is a function of the levels of variables, as follows:
( ) (1.3)
where ε represents the noise which is also called as standard deviation or error
detected in the response y. If the expected response is presented by
( ) ( ) (1.4)
then the surface is represented by
( ) (1.5)
which is called a response surface.
The response can be represented graphically either in 3-D space or as contour plots,
where expected response (η) is plotted versus the levels of variables x1 and x2. This
assist visualizes the shape of the response surface. In this method, dependent
variables are described as arbitrary functions of independent variables. Figure 1.8
shows three-dimensional and the contours of the response surface. In the contour
plot, lines of constant response are drawn in the x1-x2 plane and each contour
corresponds to a particular height of the response surface.
32
Figure 1.8. a) Three-dimensional response surface indicating the response as a
function of x1 and x2 and b) the corresponding contour plot of a response surface
(Turabi, 2010).
In RSM problems, since the form of the relationship between the response and the
independent variables is mostly unknown, the first step is to find a suitable
approximation for the true functional relationship between y and the set of
independent variables. Two types of models, first order and second order models, are
frequently used in RSM studies. First order models rarely applied for biological
phenomena. Therefore, second order models are preferred in such cases, which have
the advantage of being easy to fit using multiple regressions (Sumnu, 1997). The
general form of the second order polynomial equation presented in equation 1.7 is
often chosen.
The response variables were fitted to a second-order polynomial model equation in
order to correlate the response variables to the independent variables. The general
form of the second order polynomial equation was as follows:
(1.6)
where Y’s are the dependent variables, Xi’s are the independent variables, bo is the
constant coefficient, bi’s are the linear, bii’s are the quadratic and bij’s are the
interactions regression terms and is the error.
Central composite design (CCD), which was presented by Box and Wilson in 1951,
is the most commonly applied experimental design in engineering purposes. The
advantages of this design over the other designs is the reduction of the number of
treatment combinations required to estimate the terms in the second order model
(Anderson and Mc Lean, 1974). This design includes the following parts: (1) a full
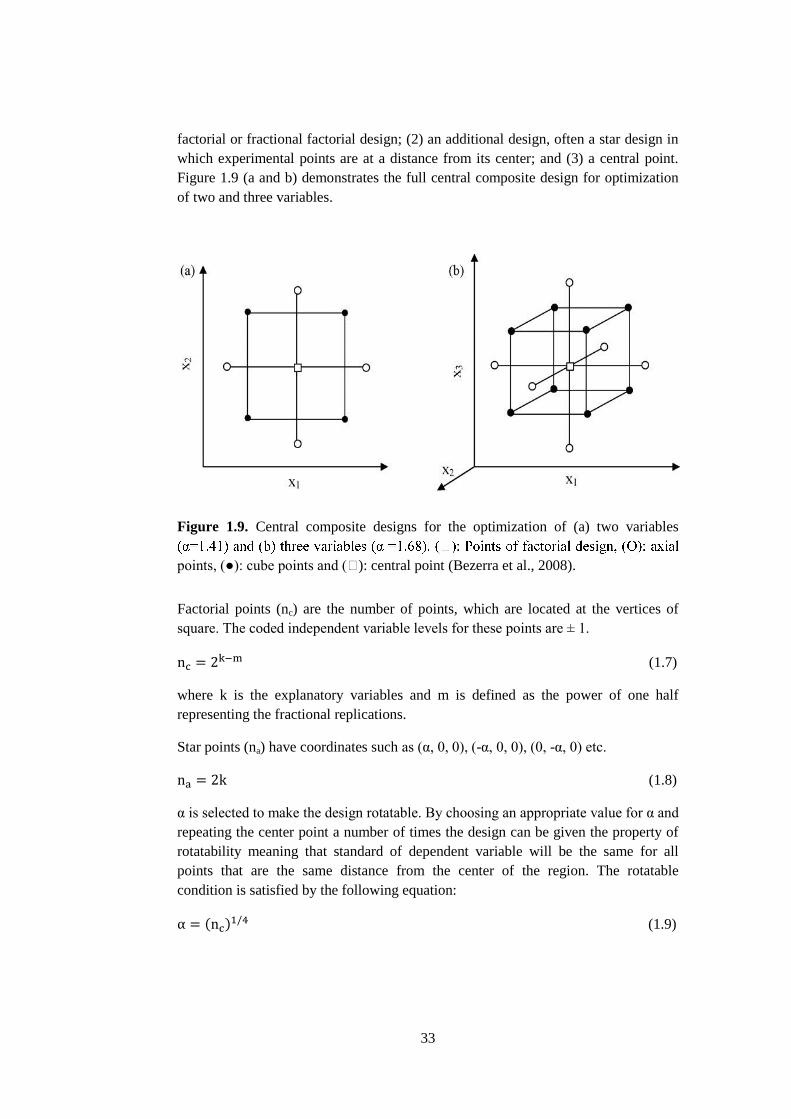
33
factorial or fractional factorial design; (2) an additional design, often a star design in
which experimental points are at a distance from its center; and (3) a central point.
Figure 1.9 (a and b) demonstrates the full central composite design for optimization
of two and three variables.
Figure 1.9. Central composite designs for the optimization of (a) two variables
points, (●): cube points and (�): central point (Bezerra et al., 2008).
Factorial points (nc) are the number of points, which are located at the vertices of
square. The coded independent variable levels for these points are ± 1.
(1.7)
where k is the explanatory variables and m is defined as the power of one half
representing the fractional replications.
Star points (na) have coordinates such as (α, 0, 0), (-α, 0, 0), (0, -α, 0) etc.
(1.8)
α is selected to make the design rotatable. By choosing an appropriate value for α and
repeating the center point a number of times the design can be given the property of
rotatability meaning that standard of dependent variable will be the same for all
points that are the same distance from the center of the region. The rotatable
condition is satisfied by the following equation:
( ) (1.9)
34
Center points (n0) are the replicated points at the center of the design. These points
have all coordinates (0,....,0). These points provide a mean for estimating the
experimental error and provide a measure of lack of fit with one degree of freedom
( ( ) ) (1.10)
RSM has been broadly used in baking studies. The effectiveness of RSM in the
development and optimization of gluten-free breads has also been efficiently used by
several researchers (Toufeili et al., 1994; Sanchez et al., 2002; McCarthy et.al., 2005;
Sanchez et al., 2004; Mezaize et al., 2009; Sabanis et al., 2009). Toufelli et al. (1994)
optimized methylcellulose, gum arabic, and egg albumen levels by response surface
methodology for production of gluten-free pocket type flat breads. Ingredient levels
(corn starch, cassava starch, and rice flour) were optimized for production of gluten-
free bread to maximize specific volume, crumb grain score and bread score (Sanchez
et al., 2002). In another study, RSM was carried out to optimize gluten-free bread
fortified with soy flour and dry milk (Sanchez et al., 2004). McCarthy et al. (2005)
also used response surface methodology in the development of gluten-free bread. In
the study of Sabanis et al. (2009), levels of ingredients (corn starch, rice flour and
hydroxypropylmethylcellulose) were optimized for a fibre-enriched gluten-free bread
formulation. In 2009, Mezaize et al. optimized formulations for the development of
French-style gluten-free breads. Turabi et al. (2008b) optimized processing
conditions and formulation for production gluten-free cakes to be baked in infrared-
microwave combination oven. However, there is no study in the literature on
optimization of formulations and processing conditions of gluten-free breads to be
baked in infrared-microwave combination oven.
35
1.10 Objectives of the Study
People suffering from celiac disease, cannot consume products containing gluten.
Therefore, many scientists and manufacturers seek alternative flour types to wheat
flour to meet nutritional requirements of celiac patients. Since gluten is responsible
for viscoelastic properties of the dough, it is necessary to use additional ingredients
in gluten free baked products to provide required functional properties.
Infrared-microwave combination heating technology combines the time saving
advantage of microwave heating with the browning and crisping advantages of
infrared heating. The main objective of this study was to design gluten-free breads
made from alternative flours (rice flour, rice-chestnut flour blend, rice-tigernut flour
blend) with the addition of different gums, gum blends and different emulsifiers to be
baked in infrared-microwave combination oven.
Rheological properties are critical for acceptability and stability of baked products. In
the literature, there is no study on investigating the effect of combination of different
hydrocolloids and emulsifiers on the rheological properties of gluten-free bread
dough and final quality of bread. Therefore, one of the objectives of the present work
was to study the rheological behavior of different dough formulations containing
only rice flour and rice-chestnut flour blend with different gums and/or emulsifiers.
In addition, the influences of these additives on bread quality were also investigated.
Analysis of macro- and micro-structure is essential since it provides valuable
information about the quality of breads. SEM is one of the main instruments for
qualitative structural analysis of foods. However, quantitative characterization of
baked products using SEM images is very limited. In the present study, it was aimed
to obtain both quantitative and qualitative information on macro- and micro-structure
of different gluten-free breads baked in different ovens. The X-ray μCT introduces
some advantages over other image analysis techniques. The application of X-ray
μCT for quantitative characterization of gluten-free bread crumbs has not been
studied yet. Thus, another objective of the present study was to point out microscopic
changes of gluten-free breads by using X-ray μCT and to relate crumb micro-
structure with physical properties of breads. Another objective of this research was to
understand the influence of different gums or gum blends and emulsifier addition on
crumb porous structure of gluten-free breads.
There is no study in the literature on optimization of formulations and processing
conditions of gluten-free breads to be baked in infrared-microwave combination
oven. Therefore, in this study it was not only aimed to optimize the baking conditions
but also aimed to optimize formulations of gluten-free breads to be baked in infrared-
microwave combination oven. Moreover, staling of gluten-free breads having
different formulations and baked in different ovens were studied using different
techniques.

36
1.
2.
3.
4.
5.
6.
7.
37
8. CHAPTER 2
2. MATERIALS AND METHODS
2.1 Materials
Rice flour (Knorr-Çapamarka, Istanbul, Turkey) with 10% moisture, 79.9% starch,
0.1% sugar, 1.3% fiber, 6.0% protein, 2.1% crude fat and 0.6% ash was obtained
from a local market. Chestnut flour with 10.8% moisture, 47.8% starch, 21.5% sugar,
9.5% fiber, 4.6% protein, 3.8% crude fat and 2.0% ash was supplied by Kafkas Pasta
Şekerleme San. & Tic. A.Ş. (Karacabey, Bursa, Turkey). The tigernut flour was
composed of 4.8% moisture, 25.2% starch, 21.5% sugar, 22.3% dietary fiber, 3.6%
protein, 20.5% fat, and 2.1% ash. Sugar (sucrose), salt, instant yeast (Saccharomyces
cerevisiae) (Dr. Oetker, Istanbul, Turkey), and shortening (Becel, Unilever, İstanbul,
Turkey) containing vegetable oil, water, non-fat pasteurized milk, emulsifier blend
(vegetable mono/digliserides, soy lecithin), salt, lactic acid, potasyum sorbate,
vitamins (B6, Folic acid, A, D and B12), butter aroma and color additive (β-carotene)
were also purchased from local markets. Emulsifiers; PurawaveTM
which is
composed of lecithin, soy protein, mono/diglycerides, and vegetable gums supplied
from Puratos (İstanbul, Turkey) and DATEM (diacetyltartaric acid esters of
monoglycerides) were obtained from Danisco Co., (Copenhagen, Denmark). Xanthan
(Xanthomonascampestris), guar gum, LBG (locust bean gum), agar, MC (methyl
cellulose), CMC (carboxymethyl cellulose), HPMC (hydroxylpropylmethyl
cellulose) and pectin gum from citrus peel were obtained from Sigma–Aldrich
(Steinheim, Germany and St. Louis, MO, USA).
2.2 Methods
2.2.1 Breadmaking Procedure
2.2.1.1 Rice Breadmaking Procedure
Basic dough recipe on 100 g rice flour basis consists of 8% sugar, 8% shortening, 1%
instant yeast, and 2% salt were used in the experiments. On flour basis, the amount of
water (30°C) added to rice dough was 150%. For wheat dough, the used amount of
water was 75% on flour basis. Water content used for each bread formulation was
determined by conducting experiments based on the quality tests of breads in terms
of specific volume and hardness.
Gums (xanthan, guar, LBG, HPMC and pectin) and/or gum blends (xanthan–guar
and xanthan–LBG) and/or emulsifiers (PurawaveTM
and DATEM) were added at
0.5% of flour weight. The blends of xanthan-guar gum and xanthan–LBG were
38
prepared by mixing equal amounts of each gum. Rice dough/bread and wheat
dough/bread without any gum and emulsifier were used as controls. Before adding
the gums or gum blends into dough mixture, gums or gum blends were dispersed in
half of the water to be used in the dough formulation using a high speed homogenizer
(Ika T18 Ultra-Turrax, Staufen, Germany). During preparation of the bread, first dry
ingredients (rice flour, instant yeast, sugar, salt and emulsifier) were mixed
thoroughly, and then the melted shortening was added. Finally gum suspension and
rest of the water were added slowly and mixed for 2 min at 85 rpm and then 1 min at
140 rpm using a mixer (Kitchen Aid, 5K45SS, ELKGROVE Village, USA). After
complete mixing, the dough samples were placed in the cylindrical glass baking cups
(diameter 8.7 cm and depth 4.8 cm) and fermented in an incubator (Nüve EN 400,
Ankara, Turkey) at 30°C for 40 min. The fermentation time of wheat dough was
determined as 110 min. Following fermentation, breads were ready for baking.
In order to characterize the structure of gluten-free breads by using X-ray
microtomography, experiments were conducted in Purdue University, USA. Thus,
brown rice flour was used during these analyses. Bob's Red Mill Organic Brown Rice
Flour (Milwaukie, OR, USA) with 10% moisture, 76% starch, 3% protein, 8 % fiber,
2 % crude fat and 1% ash was obtained from a local market. Sugar (sucrose), salt,
instant yeast (Saccharomyces cerevisiae) (Red Star Yeast & Products, Milwaukee,
WI, USA), vegetable oil (Market Pantry® vegetable oil, MN, USA) were also
purchased from local markets. The amount of water (30°C) added to rice dough was
determined as 143% on flour basis. Gluten-free rice bread sample prepared without
any additives (gums and emulsifiers) was used as control.
2.2.1.2 Chestnut-rice Breadmaking Procedure
Basic dough recipe on 100 g flour basis contained 8% sugar, 8% shortening, 1%
instant yeast, and 2% salt. On flour basis, the amount of water (30 °C) added to
dough varied between 150% and 210% for the different chestnut:rice flour ratios
(0:100, 10:90, 20:80, 30:70, 40:60, 50:50, and 100:0). The water content used for the
each formulation was determined by conducting many preliminary experiments. The
water levels used for each bread formulations were determined based on the quality
tests of breads in terms of specific volume and hardness and are shown in Table 2.1.
Dough samples containing only rice flour and chestnut flour without any gum and
emulsifier were used as controls. For investigation of the effect of gum blends
(xanthan–guar gum, xanthan–LBG) and emulsifier DATEM on the rheological
behavior of dough and quality parameters of gluten-free breads, the dough samples
with chestnut:rice flour ratio of 10:90, 20:70, 30:70, and 40:60 were chosen.
During dough preparation, the mixing of dry ingredients (chestnut flour, rice flour,
instant yeast, sugar, salt and emulsifier) was followed by addition of melted
shortening. Then the gum blend suspension and water were added slowly and mixed
for 3 min at 85 rpm and 2 min at 140 rpm using a mixer (Kitchen Aid, 5K45SS,
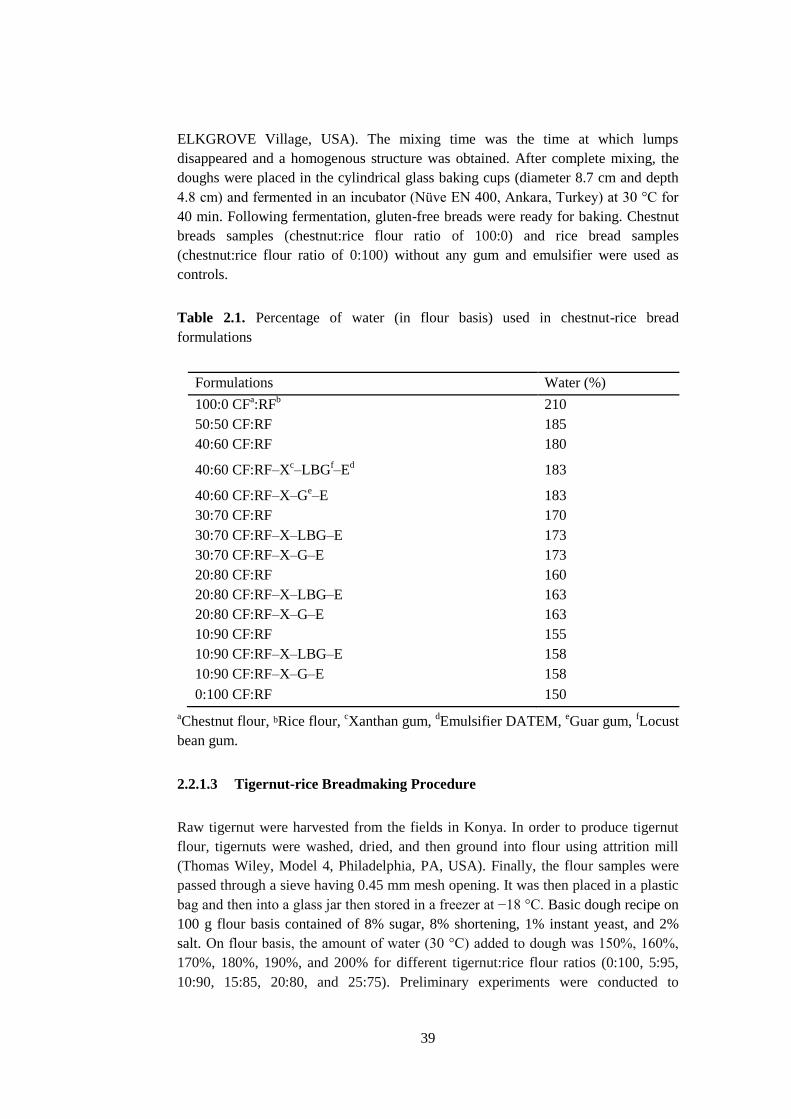
39
ELKGROVE Village, USA). The mixing time was the time at which lumps
disappeared and a homogenous structure was obtained. After complete mixing, the
doughs were placed in the cylindrical glass baking cups (diameter 8.7 cm and depth
4.8 cm) and fermented in an incubator (Nüve EN 400, Ankara, Turkey) at 30 °C for
40 min. Following fermentation, gluten-free breads were ready for baking. Chestnut
breads samples (chestnut:rice flour ratio of 100:0) and rice bread samples
(chestnut:rice flour ratio of 0:100) without any gum and emulsifier were used as
controls.
Table 2.1. Percentage of water (in flour basis) used in chestnut-rice bread
formulations
Formulations Water (%)
100:0 CFa:RF
b 210
50:50 CF:RF 185
40:60 CF:RF 180
40:60 CF:RF–Xc–LBG
f–E
d 183
40:60 CF:RF–X–Ge–E 183
30:70 CF:RF 170
30:70 CF:RF–X–LBG–E 173
30:70 CF:RF–X–G–E 173
20:80 CF:RF 160
20:80 CF:RF–X–LBG–E 163
20:80 CF:RF–X–G–E 163
10:90 CF:RF 155
10:90 CF:RF–X–LBG–E 158
10:90 CF:RF–X–G–E 158
0:100 CF:RF 150
aChestnut flour, bRice flour,
cXanthan gum,
dEmulsifier DATEM,
eGuar gum,
fLocust
bean gum.
2.2.1.3 Tigernut-rice Breadmaking Procedure
Raw tigernut were harvested from the fields in Konya. In order to produce tigernut
flour, tigernuts were washed, dried, and then ground into flour using attrition mill
(Thomas Wiley, Model 4, Philadelphia, PA, USA). Finally, the flour samples were
passed through a sieve having 0.45 mm mesh opening. It was then placed in a plastic
bag and then into a glass jar then stored in a freezer at −18 °C. Basic dough recipe on
100 g flour basis contained of 8% sugar, 8% shortening, 1% instant yeast, and 2%
salt. On flour basis, the amount of water (30 °C) added to dough was 150%, 160%,
170%, 180%, 190%, and 200% for different tigernut:rice flour ratios (0:100, 5:95,
10:90, 15:85, 20:80, and 25:75). Preliminary experiments were conducted to
40
determine the appropriate water amounts for different tigernut:rice flour ratios. The
gum blend (xanthan–guar gum) was prepared by mixing equal amount of each gum.
The gum blend was dispersed in half of the water to be used in the dough formulation
using a high-speed homogenizer (Ika T18 Ultra-Turrax, Staufen, Germany) before
adding it into dough mixture. Both gum blend (xanthan–guar gum) and emulsifier
(DATEM) were added as 0.5% (w/w) of flour amount.
During dough preparation, mixing of dry ingredients was followed by addition of
melted shortening. Then, the gum blend suspension and water were added slowly and
mixed for 4 min at 85 rpm and 3min at 140 rpm using a mixer (Kitchen Aid,
5K45SS, Elkgrove Village, St. Joseph, USA). After complete mixing, tigernut dough
was placed in the cylindrical baking cups (diameter 8.7 cm and depth 4.8 cm) and
fermented in the incubator (Nüve EN 400, Ankara, Turkey) at 30 °C for 70 min.
Following fermentation, samples were baked in different ovens. Tigernut breads
samples (tigernut:rice flour ratio of 100:0) and rice bread samples (tigernut:rice flour
ratio of 0:100) without any gum and emulsifier were used as controls.
2.2.2 Baking
Following fermentation process, dough samples were baked in either conventional or
infrared-microwave combination oven.
2.2.2.1 Conventional Baking
Conventional baking was performed in conventional oven (Arçelik A.Ş., İstanbul,
Turkey) preheated to 200°C. Four bread samples (100g each) were baked at a time.
Baking time for rice breads, wheat breads, chestnut-rice flour blend containing
breads and tigernut-rice flour blend containing breads were 30, 30, 25 and 35
minutes, respectively.
2.2.2.2 Infrared-microwave Combination Oven Baking
Infrared-microwave combination oven (Advantium oven, General Electric Company,
Louisville, KY, USA) combines microwave heating and infrared heating in the oven.
The microwave power of the oven has been determined as 682 W by using IMPI 2-
liter test (Buffler, 1993). In order to improve heating uniformity of samples, there is a
rotary table in the oven. The oven has three halogen lamps, each having 1500 W.
Two of the lamps were located at the top of the oven and one was at the bottom. To
maintain the humidity in the oven, four beakers, each containing 400 ml water, were
placed in the corners of the oven during baking. Four dough samples (100 g each)
were placed at the center of the turntable and baked using 40% upper infrared and
30% microwave power for 9 min.
41
2.2.2.3 Analytical Tests
Protein content was determined by the LECO Nitrogen Determinator (Sweeney and
Rexfod, 1987). The sugar and starch contents were determined in accordance with
AOAC (1990) methods 982.14 and 978.17, respectively. Total fat content was
determined by the Soxhlet extraction using petroleum ether as a solvent according to
AOAC (1990) method 963.15. The fiber content was determined using AOAC
(1990) method 991.43. The moisture and ash contents were determined according to
AOAC (1990) methods 925.10 (air oven method) and 923.03, respectively.
2.2.2.4 Rheological Measurements
The rheological measurements were conducted using TA rheometer (RA 2000ex,
Sussex, UK or ARG-2 Model, from TA Instruments, Newcastle, DE, USA). All
measurements were done at 25°C, using parallel plate geometry (40 mm diameter
and 2 mm gap). The dough samples were placed between the plates and the edges
were carefully trimmed with a spatula. The flow experiments were conducted under
steady-shear conditions with shear rate ranging from 1 to 50 1/s. For the relaxation of
the residual stresses, the dough was rested at room temperature for 20 min before
testing. The wheat dough samples were also characterized using the lubricated
squeezing technique described by Campanella and Peleg (1987).The dough sample at
25°C was placed between two parallel plates (60 mm) lubricated with a silicon oil
and allowed to rest until the normal force reading minimized and stabilized (RA
2000ex Rheometer, Sussex, UK). The biaxial deformations of 100 µm/s, 300 µm/s
and 500 µm/s were applied until the dough was compressed 80% of its original
thickness. In the case of the dynamic oscillatory experiments, first linear viscoelastic
region of the samples were determined. Then, frequency sweep experiments were
carried out at 0.5% strain rate between 0.1 to 10 Hz. Finally, results were expressed
in terms of elastic (G') and loss (G'') values. In order to avoid interference of bubble
formation, dough samples for the rheological tests were prepared without adding any
yeast to the formulation. All the rheological experiments were performed at least
twice and their averages were reported in the study.
2.2.2.5 Weight Loss
The percentage weight loss (WL%) of the breads during the baking was calculated
by measuring the weights of the bread samples before (Wdough) and after the baking
process (Wbread). The weight loss expressed as the percentage of the initial value. The
measurements were done in duplicate.
( ) [
] (2.1)
where, W denotes weight (g).
42
2.2.2.6 Texture Analysis
After 1 h cooling at 25 °C, firmness, cohesiveness, springiness, chewiness and
adhesiveness of bread samples were evaluated by the Texture Analyzer (TA Plus,
Lloyd Instruments, UK and Texture Technologies Corp., Scarsdale, NY, USA).
Samples in cubic shape having dimensions of 25 × 25 × 25 mm were taken from the
center of bread and were compressed to 25% of thickness with a cylindrical probe
(diameter 10 mm) (approved method 74–09, AACC, 2000). The measurements were
done in duplicate.
2.2.2.7 Specific Bulk Volume
To determine specific volume, volume (cm3) of bread sample with known weight (g)
was determined by the rapeseed displacement method after 20 min cooling at 25°C.
Then, specific volume was calculated as the volume/mass ratio (cm3/g) of bread
according to (approved method 10–05, AACC 2000). The measurements were done
in duplicate.
2.2.2.8 Color Analysis
The crust color of the bread samples was measured using a Minolta CR-10 color
reader (Osaka, Japan) using the CIE L*, a*, and b* color scale. Five readings were
carried out from different positions of bread crust, and mean value was recorded.
Total color change (E) was calculated from the following equation;
[( ) ( )
( ) ] (2.2)
Color of rice dough was selected as reference point and its L*, a* and b* values were
represented as L0, a0 and b0 which were 78.32, 4.65, 32.43, respectively.
2.2.2.9 Sensory Analysis
Ten-member semi-trained panelists who are familiar with sensory analysis
techniques were participated in sensory analysis of bread samples. The freshly baked
breads were submitted for an acceptance test, applying a hedonic scale of 5 point
(Resurreccion, 2008). Panelists were asked to assess the breads for acceptability of
texture, taste, and crumb color and to rate samples from 0 to 5 (0 means unacceptable
& 5 means very acceptable).
43
2.2.3 Analysis of Bread Macro-structure and Micro-structure
X-ray microtomography was used to determine microscopic changes of gluten-free
breads containing different gums. Macro- and micro-structures of gluten-free breads
containing different flour types and different gums baked in conventional and
infrared-microwave combination ovens were investigated by using the images
obtained by scanner and scanning electron microscopy (SEM).
2.2.3.1 X-ray Micro Computed Tomography (X-ray μCT) Analysis
MicroCT 40 (Scano Medical Inc.,PA) was used to study porous structure of gluten-
free bread crumbs. The parameters of µCT were selected for foods to be most
favorable at 45-kVp and 177μA intensity (Kelkar, et al., 2011). The largest sample
cell having 35.6 mm diameter and medium resolution was selected for scanning the
crumbs. Each of the bread samples was cut to fit into the sample cell with minimal
damage to the structure using serrated cutter. Cotton was placed on top and bottom of
the sample in the cell to avoid movement of sample during scanning. Then, the
sample cell was covered with a paraffin film to avoid any possible moisture loss. To
create a tomogram, a sample is placed on a rotary stage and the X-rays penetrate the
sample, the stage is rotated. Each sample was scanned to obtain 100 slices of 0.036
mm thickness each.
2.2.3.2 Scanning of Bread
Gluten free breads were cut into two halves vertically by an electrical knife (Arzum
AR 156 Colte, Ankara, Turkey). The cut side of one of the halves was placed over
the glass of a scanner (CanoScan 3200F, Tokyo, Japan). Scanning was performed
with a resolution of 300 dpi.
2.2.3.3 Scanning Electron Microscopy (SEM) Analysis
For SEM analysis, bread crumbs which were broken into small pieces (cubes in
about 2.5 cm dimension), frozen in liquid nitrogen and then freeze dried. Freeze-
dried samples were sputter coated with gold-palladium to render them electrically
conductive by using HUMMLE VII Sputter Coating Device (Anatech Electronics,
Garfield, N.J., USA). Samples were then examined and images were recorded with a
scanning electron microscope (JSM-6400, JEOL, Tokyo, Japan) at an accelerating
voltage of 20 kV. Samples were observed at magnification levels of 20× and 1000×.
In the case of 1000× magnification level, both outside and inside of bread crumbs
were examined.
44
2.2.3.4 Image Analysis
The scanned images of the samples were exported to a computer and Image J
software (http://rsbweb.nih.gov/ij/) was used to quantify the results. The scans were
segmented to obtain similar sized rectangular region of interest from the middle part
of the sample to eliminate possible artifacts (Babin et al., 2007). Thresholding
operation was performed using the Otsu’s algorithm (Otsu, 1979) to divide the
grayscale image into foreground (air) and background (bread). Porosity of the bread
crumbs was determined from the ratio of the number of foreground (air) voxels
divided by the total number of voxels in the image using Image J. The shape
descriptors plugin was used to determine the number of pores, aspect ratio, roundness
and the average size of the pores. Due to the resolution of the µCT, only pores
greater than 0.05cm2
were considered. Crumb structures of bread samples were
analyzed calculating porosity, the number of pores and mean roundness values by
this software. The equations for the roundness and aspect ratio are given below
(Russ, 2004).
( ) (2.3)
(2.4)
where major axis is length and minor axis is width. Aspect ratio and roundness value
of 1 indicates a perfect circle.
Crumb cell characteristics of the scanned images and SEM micrographs at
magnification of 20× were analyzed using the software Image J
(http://rsb.info.nih.gov/ij/). In the software, the contrast between two phases (pores
and solid part) for each images were used. In the case of scanned images, each color
image was first converted to gray scale (8 bit). Values of scanned images were
obtained in pixels and converted into cm by using bars of known lengths.
Segmentation was carried out using Image J software by applying the manual
thresholding tool. The largest possible cross-section of the images (5 cm × 5 cm) was
selected for each image. However, the whole area was analyzed without any
cropping in the case of SEM micrographs. To determine the pore distribution in
bread crumbs, the method and software used in the study of Impoco et al. (2007) was
used. This software is in the form of a plug-in for Image J. The plug-in encompasses
two commands: Binarise SEM and Compute Stats.
Binarise SEM segments the input image into “holes” and “structure”. The command
Compute Stats is used for the output of the previous application Binarise SEM to
obtain image statistics about the distribution of pores.
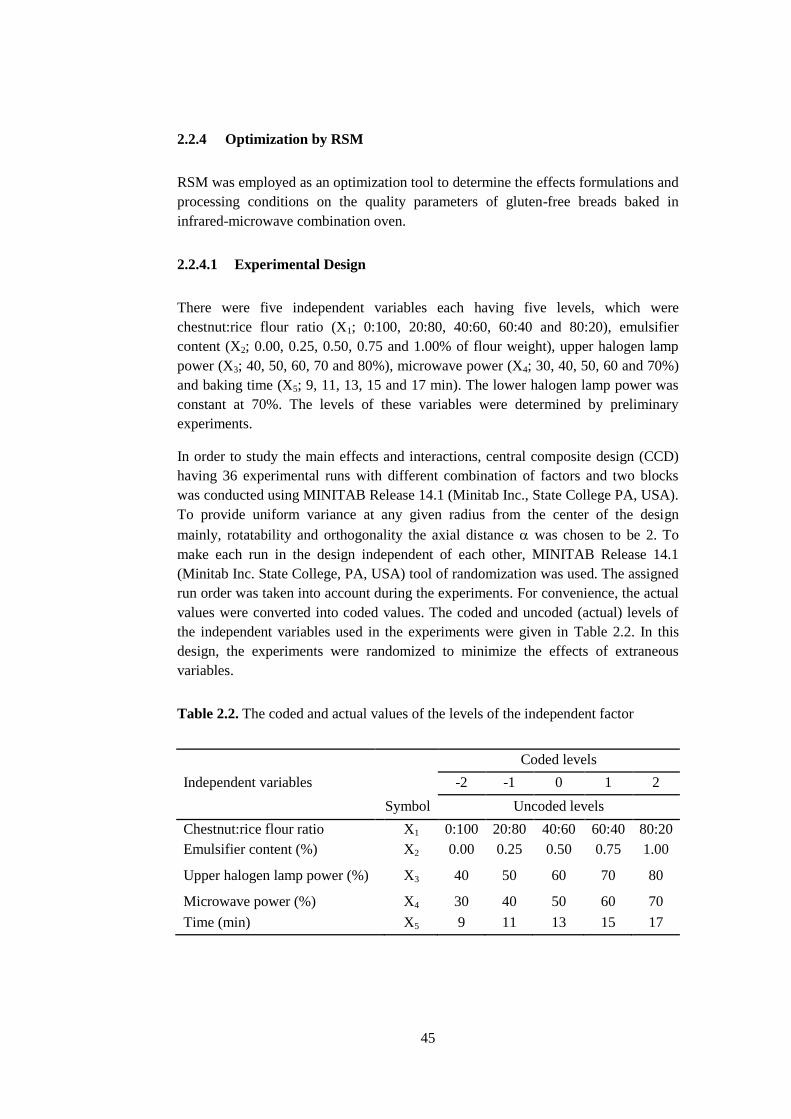
45
2.2.4 Optimization by RSM
RSM was employed as an optimization tool to determine the effects formulations and
processing conditions on the quality parameters of gluten-free breads baked in
infrared-microwave combination oven.
2.2.4.1 Experimental Design
There were five independent variables each having five levels, which were
chestnut:rice flour ratio (X1; 0:100, 20:80, 40:60, 60:40 and 80:20), emulsifier
content (X2; 0.00, 0.25, 0.50, 0.75 and 1.00% of flour weight), upper halogen lamp
power (X3; 40, 50, 60, 70 and 80%), microwave power (X4; 30, 40, 50, 60 and 70%)
and baking time (X5; 9, 11, 13, 15 and 17 min). The lower halogen lamp power was
constant at 70%. The levels of these variables were determined by preliminary
experiments.
In order to study the main effects and interactions, central composite design (CCD)
having 36 experimental runs with different combination of factors and two blocks
was conducted using MINITAB Release 14.1 (Minitab Inc., State College PA, USA).
To provide uniform variance at any given radius from the center of the design
mainly, rotatability and orthogonality the axial distance was chosen to be 2. To
make each run in the design independent of each other, MINITAB Release 14.1
(Minitab Inc. State College, PA, USA) tool of randomization was used. The assigned
run order was taken into account during the experiments. For convenience, the actual
values were converted into coded values. The coded and uncoded (actual) levels of
the independent variables used in the experiments were given in Table 2.2. In this
design, the experiments were randomized to minimize the effects of extraneous
variables.
Table 2.2. The coded and actual values of the levels of the independent factor
Coded levels
Independent variables
-2 -1 0 1 2
Symbol Uncoded levels
Chestnut:rice flour ratio X1 0:100 20:80 40:60 60:40 80:20
Emulsifier content (%) X2 0.00 0.25 0.50 0.75 1.00
Upper halogen lamp power (%) X3 40 50 60 70 80
Microwave power (%) X4 30 40 50 60 70
Time (min) X5 9 11 13 15 17
46
2.2.4.2 Optimization
For the optimization, the second-order regression equations and coefficients were
determined from the analysis of response surface design by using MINITAB Release
15 (Minitab Inc. State College, PA, USA). According to the results of ANOVA, only
the factors affecting responses significantly were selected. Model selection for each
response was made on the basis of the Anderson and Darling normality test and
Bartlett’s test. The optimization of the process conditions of infrared-microwave
combination baking was calculated by optimization tool of MATLAB Package
(Version: 7.4.0.278, R2007a, The Math Works Inc., Natick, MA, USA). A constraint
optimization program was written by entering the models obtained for responses
color and firmness of breads. The program was written to find the optimum point by
considering a maximum specific volume, a minimum weight loss and constraint of
color and firmness. Firmness and color constraint was obtained by using firmness
and ΔE* values of conventionally baked gluten-free breads. One-way ANOVA was
used to determine whether oven type significantly affected quality parameters of
bread formulations or not (p 0.05).
2.2.5 Staling Analysis
2.2.5.1 Storage of Gluten-free Breads
After baking, breads were allowed to cool down for 1 h; then covered with a stretch
film, and kept in a plastic bag at 22 ± 2 °C for different storage times (1, 24, 48, 72,
and 96 h).
2.2.5.2 Analysis of Bread
DSC was used to measure the retrogradation enthalpies of amylopectin in gluten-free
breads during storage. The crystallinity levels in the bread samples were determined
by using X-ray diffraction and FTIR analyses. For DSC, X-ray and FT-IR
measurements, gluten-free bread samples, which were stored at different times, were
frozen at -80ºC (Beko, 7103 DF, Istanbul, Turkey) and then freeze-dried (Christ,
Alpha 1-2 LD plus, Germany) for 48 h at a pressure below 1 mbar. Samples were
ground in a coffee grinder (Sinbo, SCM-2909, Istanbul, Turkey) and sieved through
a 212-m screen.
2.2.5.3 Moisture Content
The moisture content of bread crumb samples was determined by drying bread
samples in an oven at 105°C until constant weight was obtained (approved method
44-15, AACC, 2000). Results were expressed on a wet weight basis. Three replicates
were done.
47
2.2.5.4 Firmness
Firmness of bread samples was evaluated with a Texture Analyzer (TA Plus, Lloyd
Instruments, Hants, UK) equipped with a 50 N load cell. Samples taken from the
center of the bread samples were cut into cubic shapes having dimensions of 25 mm
× 25 mm × 25 mm and compressed to 25% of their thickness at a speed of 55
mm/min with a cylindrical probe (diameter 10 mm) (AACC approved method 74-09,
2000). The measurements were done in duplicate.
2.2.5.5 DSC (Differential Scanning Calorimetry) Analysis
Differential Scanning Calorimetry (TA Q20 model from TA Instruments, New
Castle, DE, USA) was used to measure the retrogradation enthalpies of amylopectin
in gluten-free breads during storage. Dry samples were weighed (3 ± 1 mg) into DSC
pans. The samples were hydrated by adding water (water:dry sample =3:1) with a
micro-syringe. The pans were hermetically sealed and allowed to equilibrate at
5±2ºC in the refrigerator for 24 h prior to analysis. An empty pan was used as a
reference. The DSC cell was heated at a rate of 10°C/min from 10 °C to 130°C. The
endothermic peaks at around 90–130oC are due to amylose-lipid complexation for
fresh samples. The retrogradation enthalpies of bread samples (ΔHr) were computed
as J/g by integration of the thermal curves using the analysis software supplied with
the instrument. The measurements were done in duplicate.
2.2.5.6 X-ray Diffraction Analysis
X-ray diffraction analysis was done using CuKa (λ=1.54056) radiation on a D8
Focus X-ray diffractometer (Bruker, USA) at 40 kV and 40 mA. The equipment was
managed through Difrac plus V4.02 (Bruker) software. The scanning region of the
diffraction angle (2θ) was 10°–40° with the scanning speed of 4°/min. The analysis
was performed using PeakFit version 4.12 software. The freeze–dried and ground
samples were compressed to thin disks of 1–2 mm thickness and a diameter of 13
mm. The pressed samples were mounted on a sample holder. Two replicates were
done. Crystalline peaks were analyzed as pseudo-Voight-form and the amorphous
ones as Gaussian-form peaks. The crystallinity levels in the samples were determined
by the separation and integration of the areas under the crystalline and amorphous X-
ray diffraction peaks. The quantification of relative crystallinity was performed using
total mass crystallinity grade (TC), the ratio of area of the crystalline fraction to the
area of crystalline fraction plus the amorphous fraction, based on the method
described by Ribotta et al. (2004c) and Ozkoc et al. (2009b).
(2.5)
is the integrated intensity of crystalline phase, and is the integrated intensity of
the amorphous phase.
48
2.2.5.7 FT-IR (Fourier Transform Infrared Spectroscopy) Analysis
All spectra of freeze-dried breads were recorded on a Thermo Nicolet Nexus 670 FT-
IR (Thermo Nicolet Analytical Instruments, Madison, Wis., USA) spectrometer
equipped with a mercury cadmium telluride (MCT) detector and KBr beam splitter
using anavatar Smart Multibounce HATR accessory (Smart ARK, Thermo Electron
Corp) with a ZnSe crystal at an angle of incidence of 45°. The detector was cooled
with liquid nitrogen for 60 min before data collection. Spectra were collected using
256 scans at 4 cm-1
resolutions over the entire 4000-400 cm-1
wave number region.
Two spectra were collected for each sample and averaged. The analysis was
performed using PeakFit version 4.12 software. The integral peak area ratios of peaks
around 1041 cm-1
(A1) and around 1150 cm-1
(A2), the ratio of peak intensities bands
(R) at 1041 cm-1
and 1022 cm-1
were made on spectra of gluten-free breads.
2.2.6 Statistical Analysis
Analysis of variance (ANOVA) was performed to determine whether there were
significant differences between different gluten-free bread formulations (different
flours, gums, and/or emulsifiers), storage time, and oven types. If significant
difference is found out, Tukey multiple comparison test were used (p 0.05) using
MINITAB (Version 16) software.
49
CHAPTER 3
3. RESULTS AND DISCUSSION
In the first part of study, the rheological properties of different gluten-free bread
dough formulations containing only rice flour and rice-chestnut flour blend with
different gums (xanthan, guar, LBG, HPMC, pectin), gum blends (xanthan-guar, and
xanthan-LBG blend) and/or emulsifiers (PurawaveTM
and DATEM) were evaluated.
The effects of these additives on the quality of rice breads, rice-chestnut and rice-
tigernut breads (weight loss, specific volume, texture, color and sensory) baked in
conventional oven were also determined.
As a second part of the study RSM was used to optimize formulations and infrared-
microwave baking conditions for gluten-free chestnut-rice breads. The relationships
between the responses of weight loss, firmness, specific volume and color change of
the breads and independent variables, which were chestnut:rice flour ratio, emulsifier
content, upper halogen lamp powers, microwave powers and baking time were
determined by using second order models. The effects of different flours, gums, and
emulsifiers on macro- and micro-structures of the gluten-free breads baked in
different ovens were studied both qualitatively and quantitatively by using an image
analysis technique and SEM. The addition of different gums (xanthan, guar, LBG,
HPMC, MC, CMC and agar) and gum blends (xanthan-guar, and xanthan-LBG
blend) on the crumb structures of gluten-free rice breads were evaluated by using X-
ray μCT.
In the last part of the study, the effects of different formulations (different flours,
gums, and/or emulsifiers) and storage time on staling of gluten-free rice breads baked
in conventional and infrared-microwave combination ovens were studied. Staling
properties of the bread were assessed using mechanical compression, DSC, X-ray
diffraction, and FT-IR.
3.1 Bread Quality and Dough Rheology of Gluten-free Rice Bread
Formulations
The rheological properties of rice bread dough containing different gums
with/without emulsifiers were determined. In addition, the quality of rice breads
(volume, firmness and sensory analysis) was evaluated. Different gums (xanthan
gum, guar gum, LBG, HPMC, pectin, xanthan–guar, and xanthan–LBG blend) and
emulsifiers (PurawaveTM
and DATEM) were used to find the best formulation for
gluten-free breads.
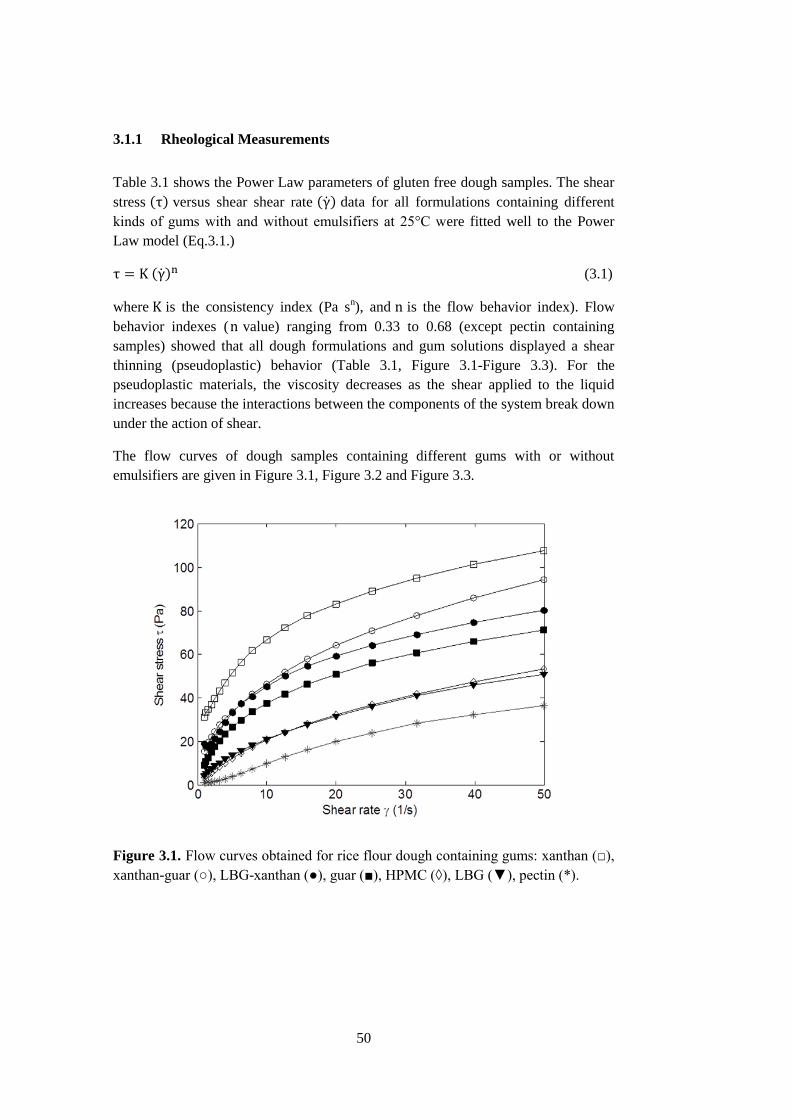
50
3.1.1 Rheological Measurements
Table 3.1 shows the Power Law parameters of gluten free dough samples. The shear
stress ( ) versus shear shear rate ( ̇) data for all formulations containing different
kinds of gums with and without emulsifiers at 25°C were fitted well to the Power
Law model (Eq.3.1.)
( ̇) (3.1)
where is the consistency index (Pa sn), and is the flow behavior index). Flow
behavior indexes ( value) ranging from 0.33 to 0.68 (except pectin containing
samples) showed that all dough formulations and gum solutions displayed a shear
thinning (pseudoplastic) behavior (Table 3.1, Figure 3.1-Figure 3.3). For the
pseudoplastic materials, the viscosity decreases as the shear applied to the liquid
increases because the interactions between the components of the system break down
under the action of shear.
The flow curves of dough samples containing different gums with or without
emulsifiers are given in Figure 3.1, Figure 3.2 and Figure 3.3.
Figure 3.1. Flow curves obtained for rice flour dough containing gums: xanthan (□),
xanthan-guar (○), LBG-xanthan (●), guar (■), HPMC (◊), LBG (▼), pectin (*).
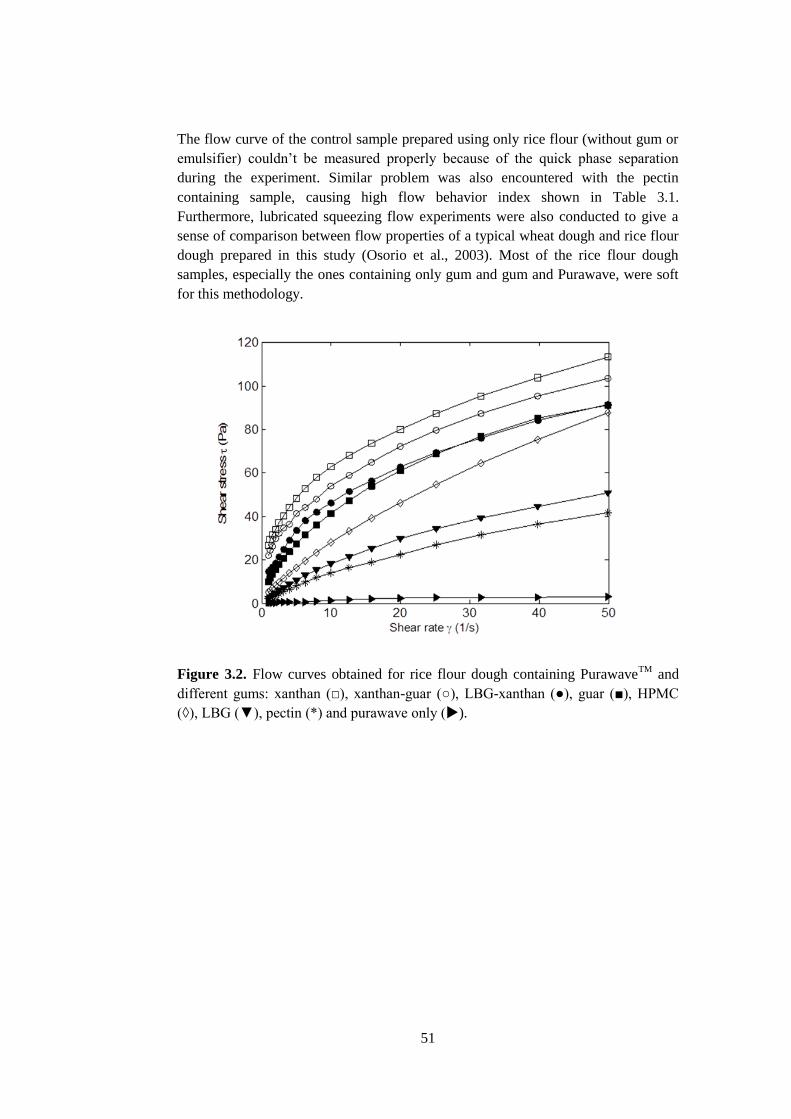
51
The flow curve of the control sample prepared using only rice flour (without gum or
emulsifier) couldn’t be measured properly because of the quick phase separation
during the experiment. Similar problem was also encountered with the pectin
containing sample, causing high flow behavior index shown in Table 3.1.
Furthermore, lubricated squeezing flow experiments were also conducted to give a
sense of comparison between flow properties of a typical wheat dough and rice flour
dough prepared in this study (Osorio et al., 2003). Most of the rice flour dough
samples, especially the ones containing only gum and gum and Purawave, were soft
for this methodology.
Figure 3.2. Flow curves obtained for rice flour dough containing PurawaveTM
and
different gums: xanthan (□), xanthan-guar (○), LBG-xanthan (●), guar (■), HPMC
(◊), LBG (▼), pectin (*) and purawave only ().
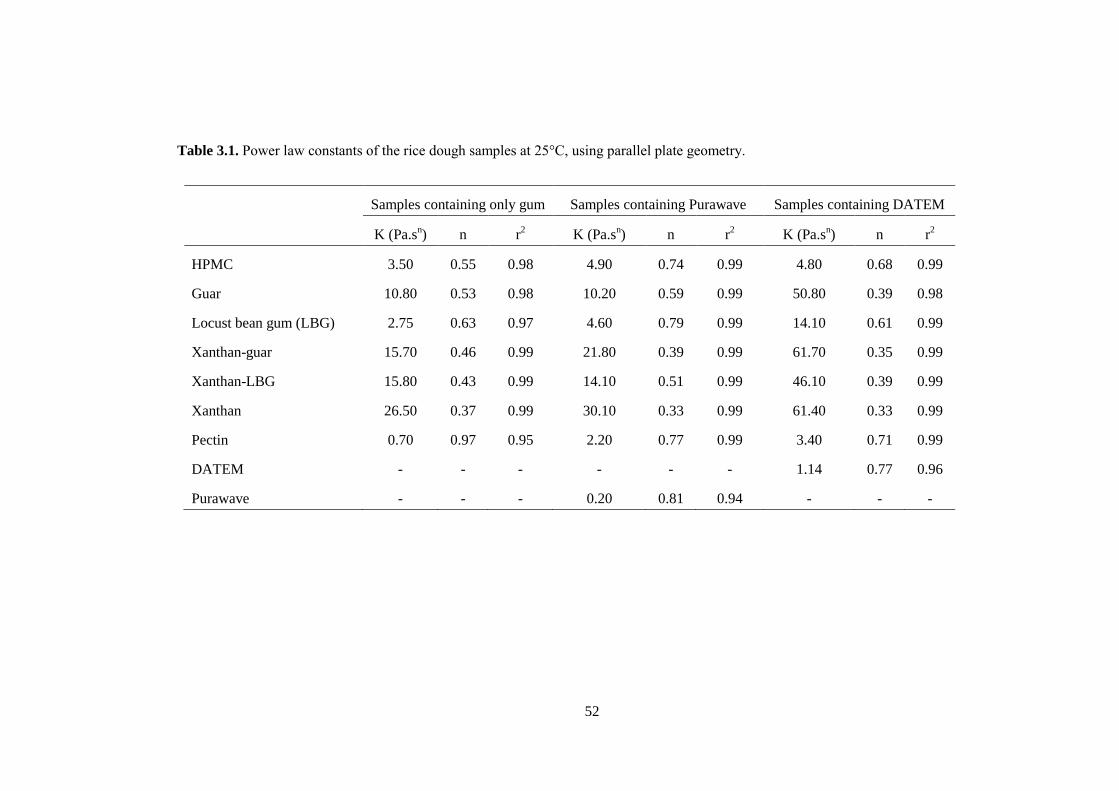
52
Table 3.1. Power law constants of the rice dough samples at 25°C, using parallel plate geometry.
Samples containing only gum Samples containing Purawave Samples containing DATEM
K (Pa.sn) n r
2 K (Pa.s
n) n r
2 K (Pa.s
n) n r
2
HPMC 3.50 0.55 0.98 4.90 0.74 0.99 4.80 0.68 0.99
Guar 10.80 0.53 0.98 10.20 0.59 0.99 50.80 0.39 0.98
Locust bean gum (LBG) 2.75 0.63 0.97 4.60 0.79 0.99 14.10 0.61 0.99
Xanthan-guar 15.70 0.46 0.99 21.80 0.39 0.99 61.70 0.35 0.99
Xanthan-LBG 15.80 0.43 0.99 14.10 0.51 0.99 46.10 0.39 0.99
Xanthan 26.50 0.37 0.99 30.10 0.33 0.99 61.40 0.33 0.99
Pectin 0.70 0.97 0.95 2.20 0.77 0.99 3.40 0.71 0.99
DATEM - - - - - - 1.14 0.77 0.96
Purawave - - - 0.20 0.81 0.94 - - -
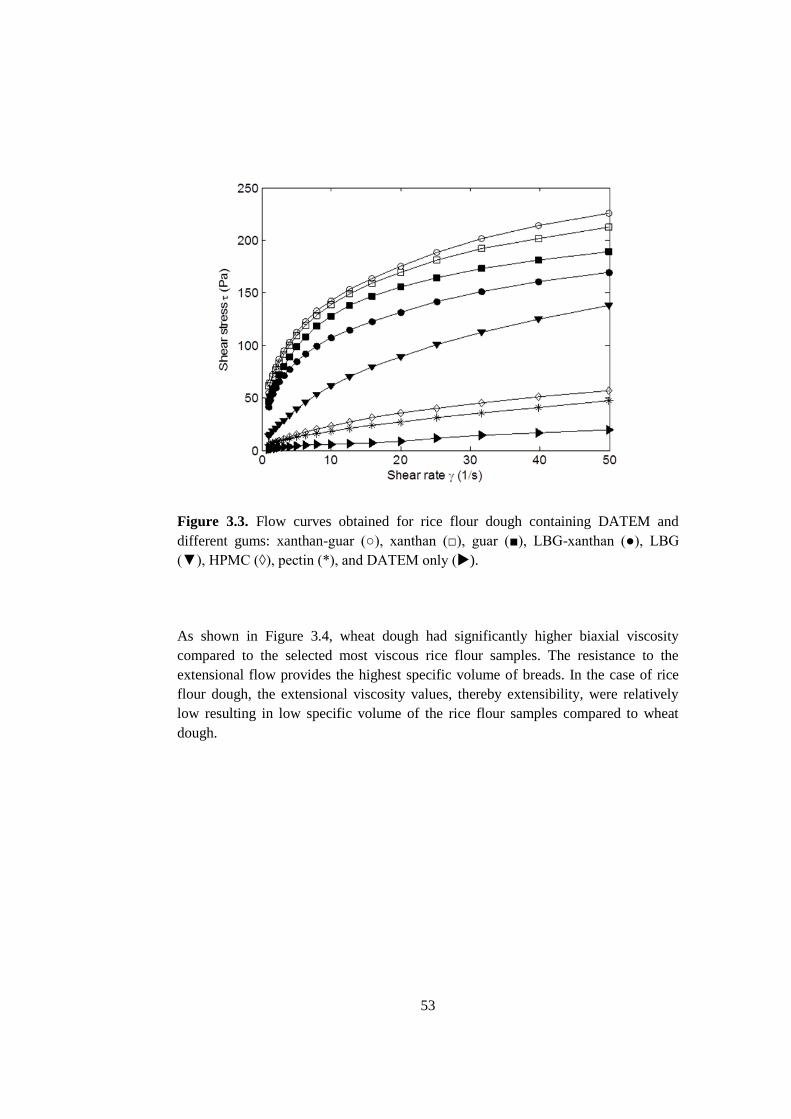
53
Figure 3.3. Flow curves obtained for rice flour dough containing DATEM and
different gums: xanthan-guar (○), xanthan (□), guar (■), LBG-xanthan (●), LBG
(▼), HPMC (◊), pectin (*), and DATEM only ().
As shown in Figure 3.4, wheat dough had significantly higher biaxial viscosity
compared to the selected most viscous rice flour samples. The resistance to the
extensional flow provides the highest specific volume of breads. In the case of rice
flour dough, the extensional viscosity values, thereby extensibility, were relatively
low resulting in low specific volume of the rice flour samples compared to wheat
dough.
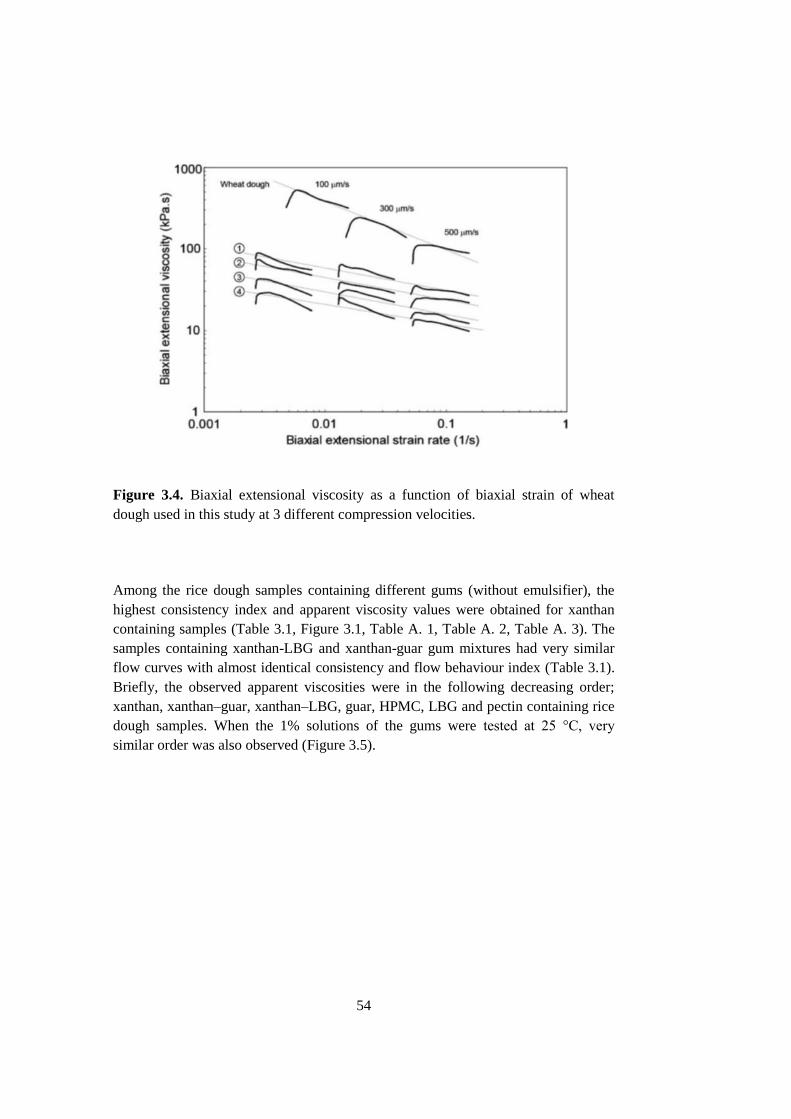
54
Figure 3.4. Biaxial extensional viscosity as a function of biaxial strain of wheat
dough used in this study at 3 different compression velocities.
Among the rice dough samples containing different gums (without emulsifier), the
highest consistency index and apparent viscosity values were obtained for xanthan
containing samples (Table 3.1, Figure 3.1, Table A. 1, Table A. 2, Table A. 3). The
samples containing xanthan-LBG and xanthan-guar gum mixtures had very similar
flow curves with almost identical consistency and flow behaviour index (Table 3.1).
Briefly, the observed apparent viscosities were in the following decreasing order;
xanthan, xanthan–guar, xanthan–LBG, guar, HPMC, LBG and pectin containing rice
dough samples. When the 1% solutions of the gums were tested at 25 °C, very
similar order was also observed (Figure 3.5).
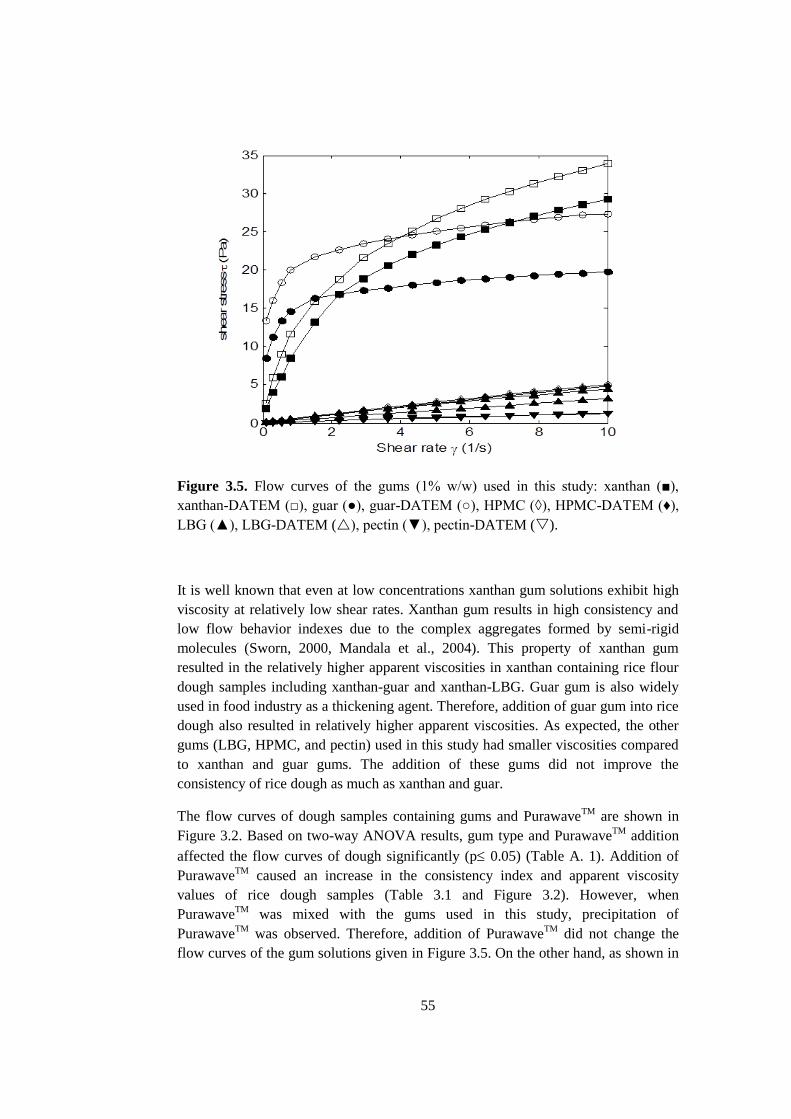
55
Figure 3.5. Flow curves of the gums (1% w/w) used in this study: xanthan (■),
xanthan-DATEM (□), guar (●), guar-DATEM (○), HPMC (◊), HPMC-DATEM (♦),
LBG (▲), LBG-DATEM (), pectin (▼), pectin-DATEM ().
It is well known that even at low concentrations xanthan gum solutions exhibit high
viscosity at relatively low shear rates. Xanthan gum results in high consistency and
low flow behavior indexes due to the complex aggregates formed by semi-rigid
molecules (Sworn, 2000, Mandala et al., 2004). This property of xanthan gum
resulted in the relatively higher apparent viscosities in xanthan containing rice flour
dough samples including xanthan-guar and xanthan-LBG. Guar gum is also widely
used in food industry as a thickening agent. Therefore, addition of guar gum into rice
dough also resulted in relatively higher apparent viscosities. As expected, the other
gums (LBG, HPMC, and pectin) used in this study had smaller viscosities compared
to xanthan and guar gums. The addition of these gums did not improve the
consistency of rice dough as much as xanthan and guar.
The flow curves of dough samples containing gums and PurawaveTM
are shown in
Figure 3.2. Based on two-way ANOVA results, gum type and PurawaveTM
addition
affected the flow curves of dough significantly (p 0.05) (Table A. 1). Addition of
PurawaveTM
caused an increase in the consistency index and apparent viscosity
values of rice dough samples (Table 3.1 and Figure 3.2). However, when
PurawaveTM
was mixed with the gums used in this study, precipitation of
PurawaveTM
was observed. Therefore, addition of PurawaveTM
did not change the
flow curves of the gum solutions given in Figure 3.5. On the other hand, as shown in
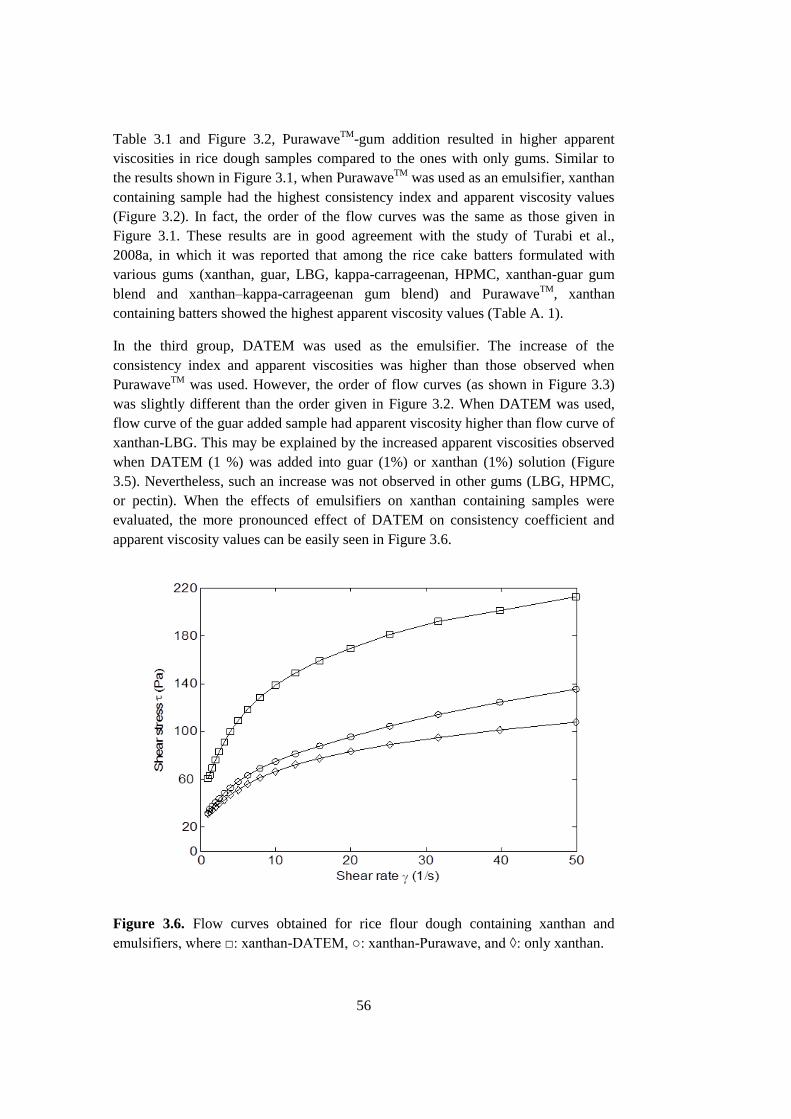
56
Table 3.1 and Figure 3.2, PurawaveTM
-gum addition resulted in higher apparent
viscosities in rice dough samples compared to the ones with only gums. Similar to
the results shown in Figure 3.1, when PurawaveTM
was used as an emulsifier, xanthan
containing sample had the highest consistency index and apparent viscosity values
(Figure 3.2). In fact, the order of the flow curves was the same as those given in
Figure 3.1. These results are in good agreement with the study of Turabi et al.,
2008a, in which it was reported that among the rice cake batters formulated with
various gums (xanthan, guar, LBG, kappa-carrageenan, HPMC, xanthan-guar gum
blend and xanthan–kappa-carrageenan gum blend) and PurawaveTM
, xanthan
containing batters showed the highest apparent viscosity values (Table A. 1).
In the third group, DATEM was used as the emulsifier. The increase of the
consistency index and apparent viscosities was higher than those observed when
PurawaveTM
was used. However, the order of flow curves (as shown in Figure 3.3)
was slightly different than the order given in Figure 3.2. When DATEM was used,
flow curve of the guar added sample had apparent viscosity higher than flow curve of
xanthan-LBG. This may be explained by the increased apparent viscosities observed
when DATEM (1 %) was added into guar (1%) or xanthan (1%) solution (Figure
3.5). Nevertheless, such an increase was not observed in other gums (LBG, HPMC,
or pectin). When the effects of emulsifiers on xanthan containing samples were
evaluated, the more pronounced effect of DATEM on consistency coefficient and
apparent viscosity values can be easily seen in Figure 3.6.
Figure 3.6. Flow curves obtained for rice flour dough containing xanthan and
emulsifiers, where □: xanthan-DATEM, ○: xanthan-Purawave, and ◊: only xanthan.
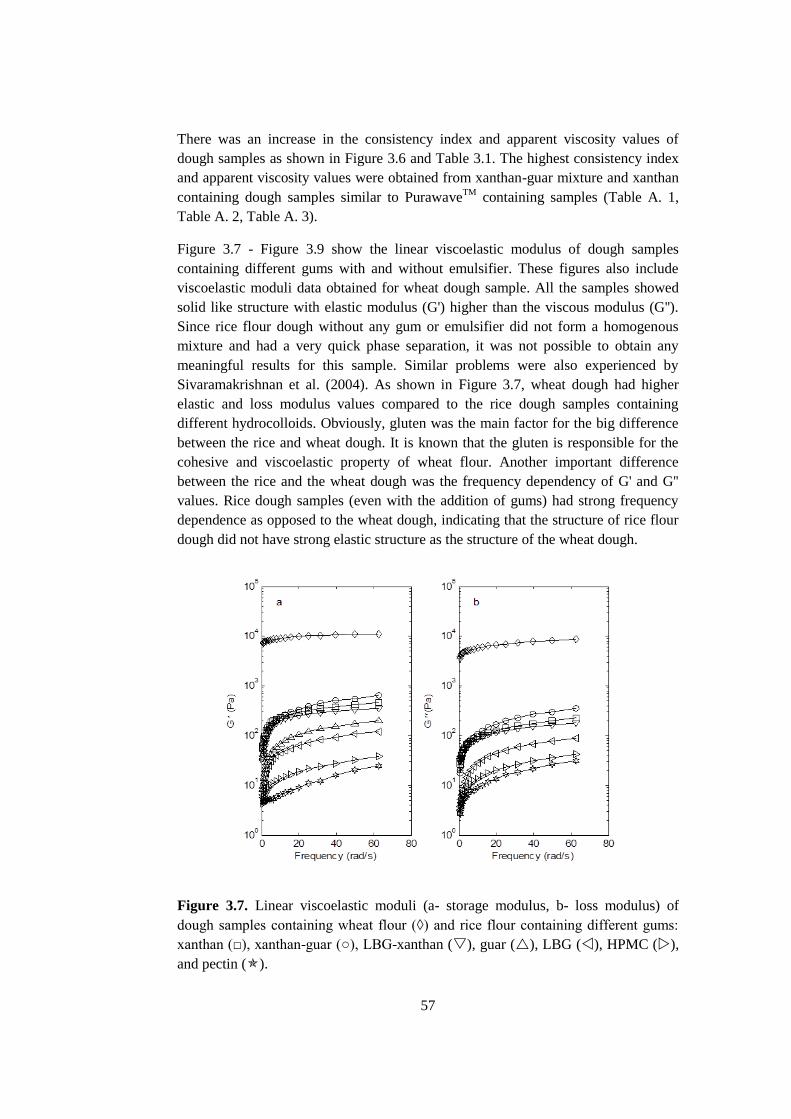
57
There was an increase in the consistency index and apparent viscosity values of
dough samples as shown in Figure 3.6 and Table 3.1. The highest consistency index
and apparent viscosity values were obtained from xanthan-guar mixture and xanthan
containing dough samples similar to PurawaveTM
containing samples (Table A. 1,
Table A. 2, Table A. 3).
Figure 3.7 - Figure 3.9 show the linear viscoelastic modulus of dough samples
containing different gums with and without emulsifier. These figures also include
viscoelastic moduli data obtained for wheat dough sample. All the samples showed
solid like structure with elastic modulus (G') higher than the viscous modulus (G'').
Since rice flour dough without any gum or emulsifier did not form a homogenous
mixture and had a very quick phase separation, it was not possible to obtain any
meaningful results for this sample. Similar problems were also experienced by
Sivaramakrishnan et al. (2004). As shown in Figure 3.7, wheat dough had higher
elastic and loss modulus values compared to the rice dough samples containing
different hydrocolloids. Obviously, gluten was the main factor for the big difference
between the rice and wheat dough. It is known that the gluten is responsible for the
cohesive and viscoelastic property of wheat flour. Another important difference
between the rice and the wheat dough was the frequency dependency of G' and G''
values. Rice dough samples (even with the addition of gums) had strong frequency
dependence as opposed to the wheat dough, indicating that the structure of rice flour
dough did not have strong elastic structure as the structure of the wheat dough.
Figure 3.7. Linear viscoelastic moduli (a- storage modulus, b- loss modulus) of
dough samples containing wheat flour (◊) and rice flour containing different gums:
xanthan (□), xanthan-guar (○), LBG-xanthan (), guar (), LBG (), HPMC (),
and pectin ().
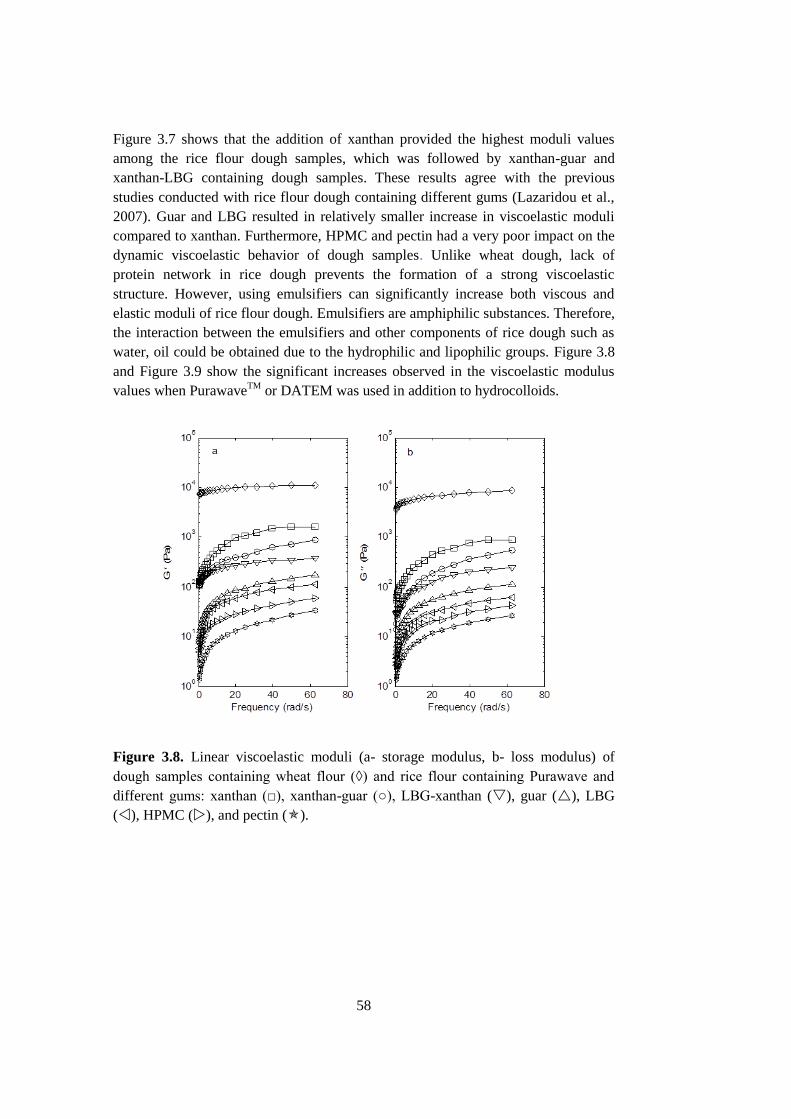
58
Figure 3.7 shows that the addition of xanthan provided the highest moduli values
among the rice flour dough samples, which was followed by xanthan-guar and
xanthan-LBG containing dough samples. These results agree with the previous
studies conducted with rice flour dough containing different gums (Lazaridou et al.,
2007). Guar and LBG resulted in relatively smaller increase in viscoelastic moduli
compared to xanthan. Furthermore, HPMC and pectin had a very poor impact on the
dynamic viscoelastic behavior of dough samples. Unlike wheat dough, lack of
protein network in rice dough prevents the formation of a strong viscoelastic
structure. However, using emulsifiers can significantly increase both viscous and
elastic moduli of rice flour dough. Emulsifiers are amphiphilic substances. Therefore,
the interaction between the emulsifiers and other components of rice dough such as
water, oil could be obtained due to the hydrophilic and lipophilic groups. Figure 3.8
and Figure 3.9 show the significant increases observed in the viscoelastic modulus
values when PurawaveTM
or DATEM was used in addition to hydrocolloids.
Figure 3.8. Linear viscoelastic moduli (a- storage modulus, b- loss modulus) of
dough samples containing wheat flour (◊) and rice flour containing Purawave and
different gums: xanthan (□), xanthan-guar (○), LBG-xanthan (), guar (), LBG
(), HPMC (), and pectin ().
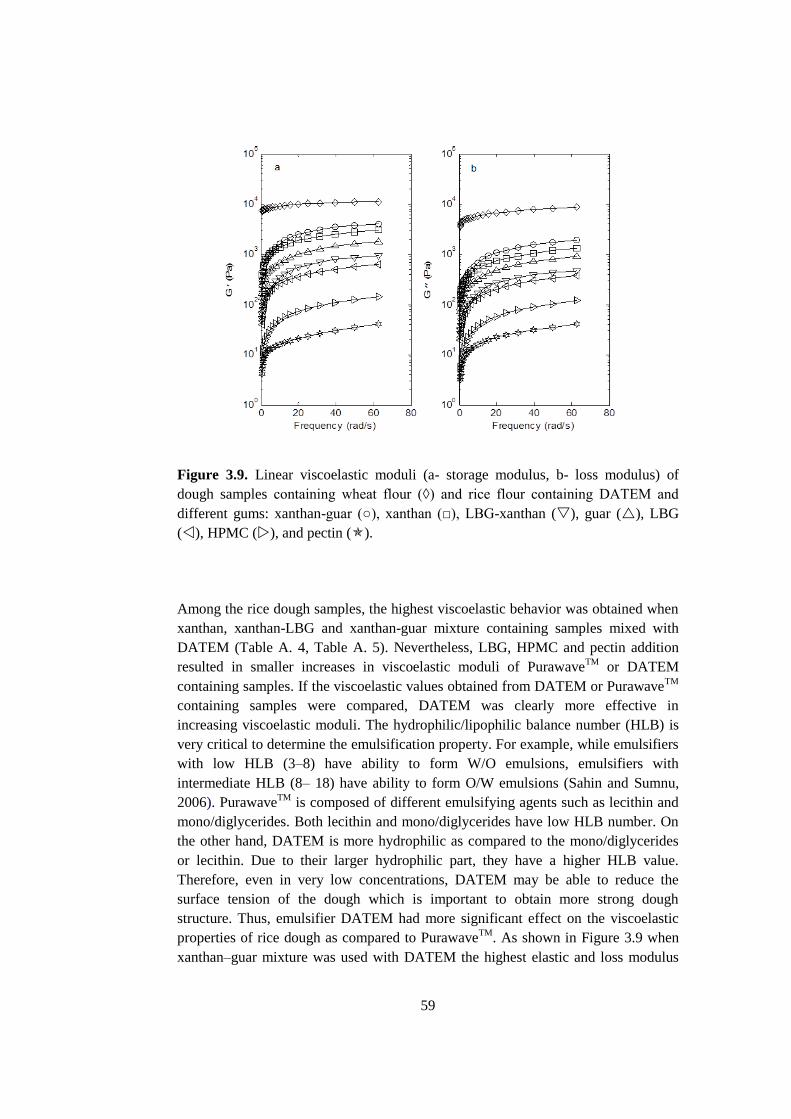
59
Figure 3.9. Linear viscoelastic moduli (a- storage modulus, b- loss modulus) of
dough samples containing wheat flour (◊) and rice flour containing DATEM and
different gums: xanthan-guar (○), xanthan (□), LBG-xanthan (), guar (), LBG
(), HPMC (), and pectin ().
Among the rice dough samples, the highest viscoelastic behavior was obtained when
xanthan, xanthan-LBG and xanthan-guar mixture containing samples mixed with
DATEM (Table A. 4, Table A. 5). Nevertheless, LBG, HPMC and pectin addition
resulted in smaller increases in viscoelastic moduli of PurawaveTM
or DATEM
containing samples. If the viscoelastic values obtained from DATEM or PurawaveTM
containing samples were compared, DATEM was clearly more effective in
increasing viscoelastic moduli. The hydrophilic/lipophilic balance number (HLB) is
very critical to determine the emulsification property. For example, while emulsifiers
with low HLB (3–8) have ability to form W/O emulsions, emulsifiers with
intermediate HLB (8– 18) have ability to form O/W emulsions (Sahin and Sumnu,
2006). PurawaveTM
is composed of different emulsifying agents such as lecithin and
mono/diglycerides. Both lecithin and mono/diglycerides have low HLB number. On
the other hand, DATEM is more hydrophilic as compared to the mono/diglycerides
or lecithin. Due to their larger hydrophilic part, they have a higher HLB value.
Therefore, even in very low concentrations, DATEM may be able to reduce the
surface tension of the dough which is important to obtain more strong dough
structure. Thus, emulsifier DATEM had more significant effect on the viscoelastic
properties of rice dough as compared to PurawaveTM
. As shown in Figure 3.9 when
xanthan–guar mixture was used with DATEM the highest elastic and loss modulus
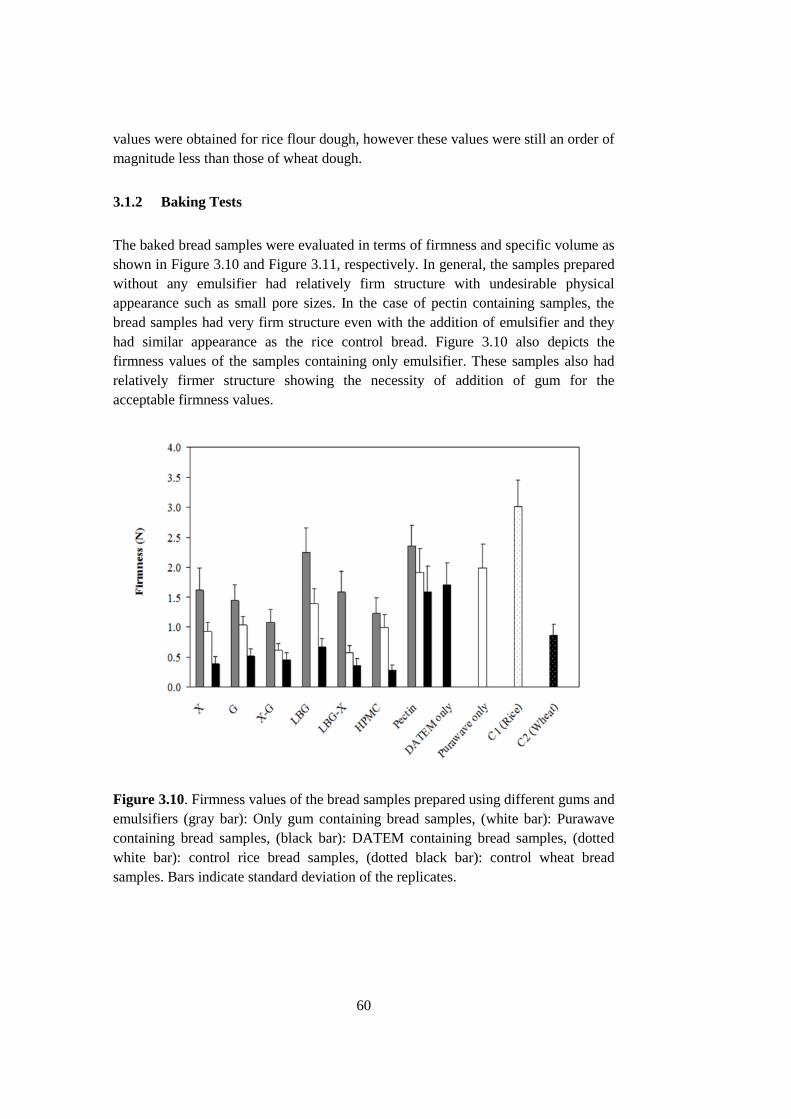
60
values were obtained for rice flour dough, however these values were still an order of
magnitude less than those of wheat dough.
3.1.2 Baking Tests
The baked bread samples were evaluated in terms of firmness and specific volume as
shown in Figure 3.10 and Figure 3.11, respectively. In general, the samples prepared
without any emulsifier had relatively firm structure with undesirable physical
appearance such as small pore sizes. In the case of pectin containing samples, the
bread samples had very firm structure even with the addition of emulsifier and they
had similar appearance as the rice control bread. Figure 3.10 also depicts the
firmness values of the samples containing only emulsifier. These samples also had
relatively firmer structure showing the necessity of addition of gum for the
acceptable firmness values.
Figure 3.10. Firmness values of the bread samples prepared using different gums and
emulsifiers (gray bar): Only gum containing bread samples, (white bar): Purawave
containing bread samples, (black bar): DATEM containing bread samples, (dotted
white bar): control rice bread samples, (dotted black bar): control wheat bread
samples. Bars indicate standard deviation of the replicates.
61
Addition of gum together with an emulsifier resulted in bread samples with firmness
values comparable to that of wheat bread. More specifically, firmness of bread
samples decreased with the addition of gum and further decreased with addition of
the PurawaveTM
and DATEM. Especially DATEM and gum combinations lowered
the firmness values and improved the texture. In fact, the firmness values of all the
samples prepared with DATEM and gum combinations were comparable with the
sample prepared with wheat dough. The positive effect of DATEM on firmness has
been long recognized for wheat breads (Ribotta et al., 2004b) and also shown for the
rice bread in this study. DATEM is mainly used for softening effect in wheat or rye
based baked products (Goesaert et al., 2005). It facilitates the aggregation of gluten
proteins, creating a gluten network that can improve the entrainment of air and result
in better bread volume and crumb texture (Ribotta et al., 2004b). In this study, it was
shown that DATEM can also be effective in providing increased water absorption
and gas retention during fermentation and proofing in gluten free rice breads. These
functions of DATEM in combination with hydrocolloids provided the most
acceptable gluten free rice breads having similar firmness values to wheat dough
bread (Table A. 6).
The specific volume values obtained from bread samples are given in Figure 3.11. As
shown in figure, wheat bread had clearly higher volume value compared to all rice
flour breads. The gluten proteins are responsible not only for this cohesive and
viscoelastic property of wheat flour dough but also for the protein-starch interaction
that is related to the dough’s ability to retain gas during fermentation and partly for
the setting of the dough during baking (Hoseney, 1986; Gan et al., 2001).
In the case of rice breads, addition of gums and emulsifiers clearly improved the
volume of the breads by allowing the entrapment of air bubbles in dough and
providing stability to the dough mixture during baking. There are a number studies
showing that hydrocolloids improved the volume and texture of gluten-free breads
(Nishitia et al., 1976; Acs et al., 1997; Kang et al., 1997; Gambus et al., 2001, Gan et
al., 2001; Cato et al, 2004, Lopez et al., 2004; Moore et al., 2004; Sivaramakrishnan
et al., 2004; Ahlborn et al., 2005; Ribotta et al., 2004a; Lazaridou et al., 2007).
Although breads prepared using only gums had softer texture than breads prepared
without the addition of gums, these breads still had firmer texture values compared to
wheat breads. Therefore, the addition of emulsifier is essential to ensure that gluten-
free breads have comparable quality parameters with that of wheat breads. This study
shows that the addition of PurawaveTM
or especially DATEM is critical to obtain
required volume of the rice flour based breads. When the emulsifiers are compared in
terms of their impact on volume, all bread samples supplemented with DATEM had
higher specific volume values compared to PurawaveTM
added breads.
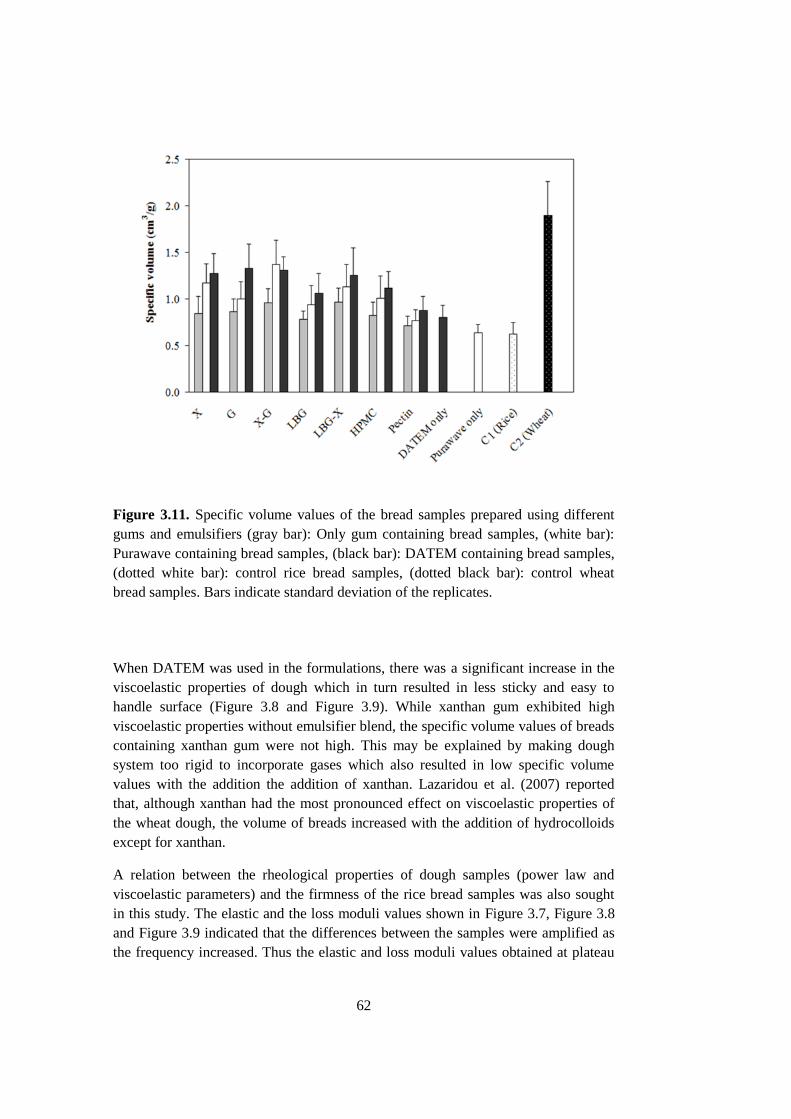
62
Figure 3.11. Specific volume values of the bread samples prepared using different
gums and emulsifiers (gray bar): Only gum containing bread samples, (white bar):
Purawave containing bread samples, (black bar): DATEM containing bread samples,
(dotted white bar): control rice bread samples, (dotted black bar): control wheat
bread samples. Bars indicate standard deviation of the replicates.
When DATEM was used in the formulations, there was a significant increase in the
viscoelastic properties of dough which in turn resulted in less sticky and easy to
handle surface (Figure 3.8 and Figure 3.9). While xanthan gum exhibited high
viscoelastic properties without emulsifier blend, the specific volume values of breads
containing xanthan gum were not high. This may be explained by making dough
system too rigid to incorporate gases which also resulted in low specific volume
values with the addition the addition of xanthan. Lazaridou et al. (2007) reported
that, although xanthan had the most pronounced effect on viscoelastic properties of
the wheat dough, the volume of breads increased with the addition of hydrocolloids
except for xanthan.
A relation between the rheological properties of dough samples (power law and
viscoelastic parameters) and the firmness of the rice bread samples was also sought
in this study. The elastic and the loss moduli values shown in Figure 3.7, Figure 3.8
and Figure 3.9 indicated that the differences between the samples were amplified as
the frequency increased. Thus the elastic and loss moduli values obtained at plateau
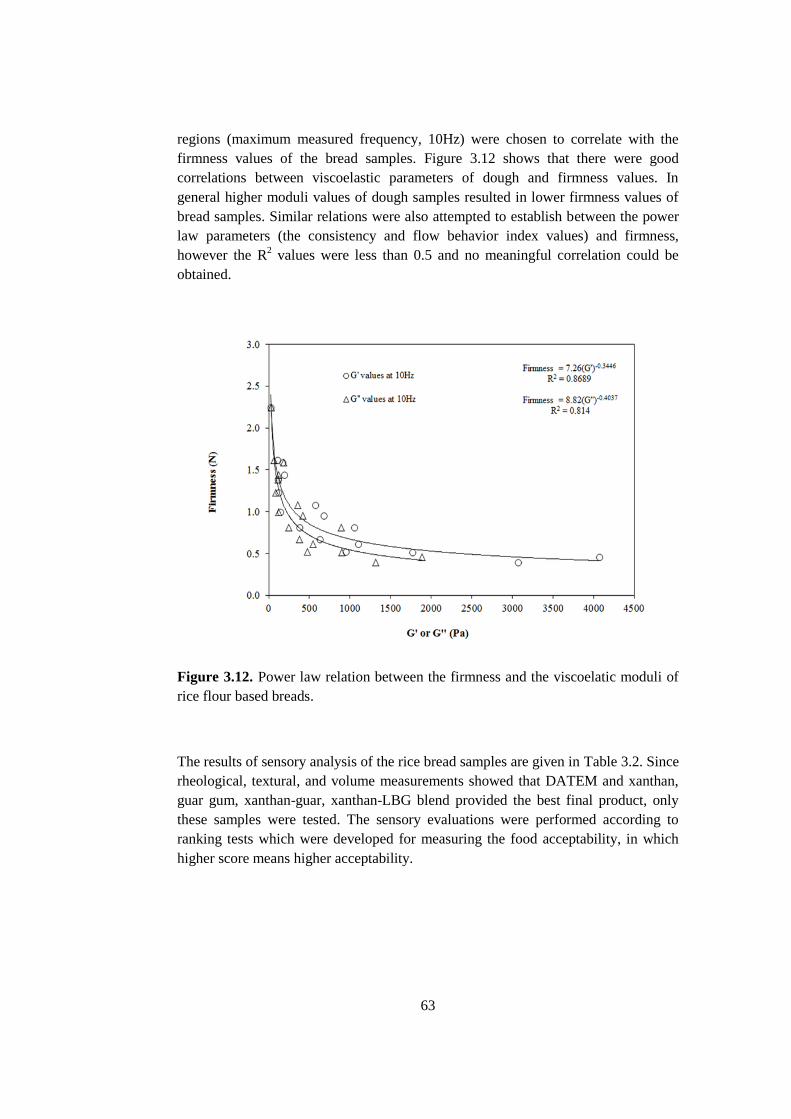
63
regions (maximum measured frequency, 10Hz) were chosen to correlate with the
firmness values of the bread samples. Figure 3.12 shows that there were good
correlations between viscoelastic parameters of dough and firmness values. In
general higher moduli values of dough samples resulted in lower firmness values of
bread samples. Similar relations were also attempted to establish between the power
law parameters (the consistency and flow behavior index values) and firmness,
however the R2 values were less than 0.5 and no meaningful correlation could be
obtained.
Figure 3.12. Power law relation between the firmness and the viscoelatic moduli of
rice flour based breads.
The results of sensory analysis of the rice bread samples are given in Table 3.2. Since
rheological, textural, and volume measurements showed that DATEM and xanthan,
guar gum, xanthan-guar, xanthan-LBG blend provided the best final product, only
these samples were tested. The sensory evaluations were performed according to
ranking tests which were developed for measuring the food acceptability, in which
higher score means higher acceptability.
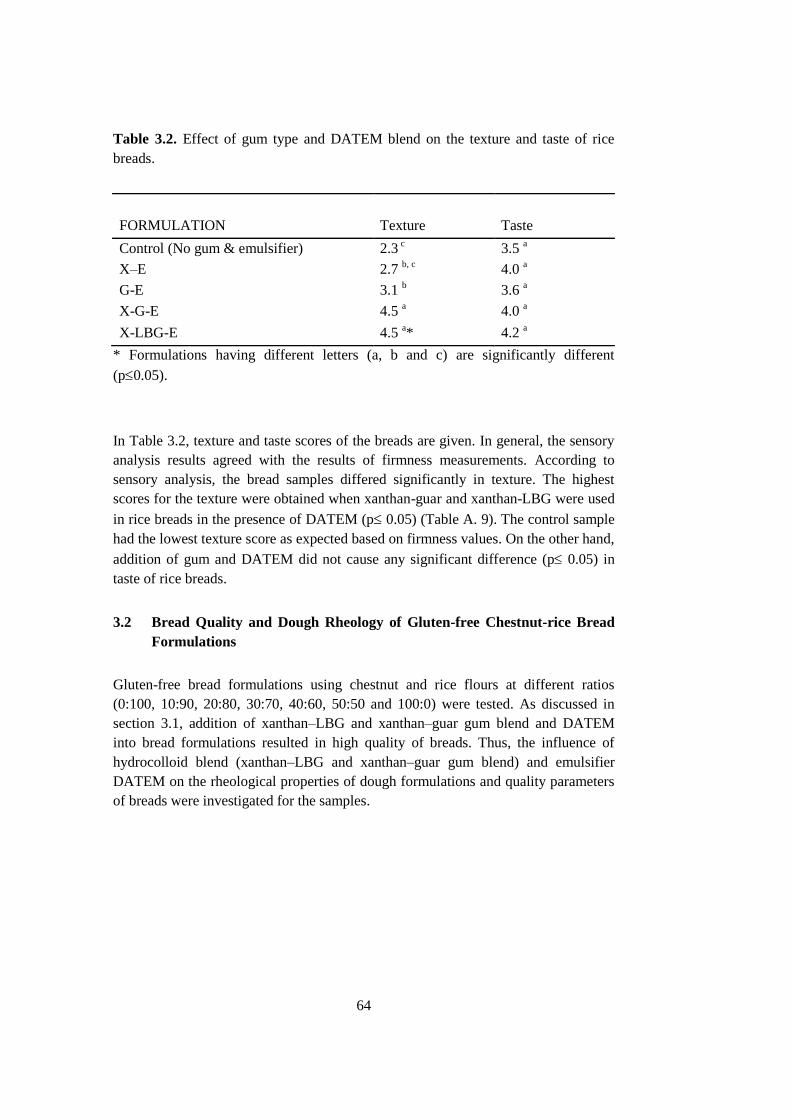
64
Table 3.2. Effect of gum type and DATEM blend on the texture and taste of rice
breads.
FORMULATION Texture Taste
Control (No gum & emulsifier) 2.3 c 3.5
a
X–E 2.7 b, c
4.0 a
G-E 3.1 b 3.6
a
X-G-E 4.5 a 4.0
a
X-LBG-E 4.5 a* 4.2
a
* Formulations having different letters (a, b and c) are significantly different
(p0.05).
In Table 3.2, texture and taste scores of the breads are given. In general, the sensory
analysis results agreed with the results of firmness measurements. According to
sensory analysis, the bread samples differed significantly in texture. The highest
scores for the texture were obtained when xanthan-guar and xanthan-LBG were used
in rice breads in the presence of DATEM (p 0.05) (Table A. 9). The control sample
had the lowest texture score as expected based on firmness values. On the other hand,
addition of gum and DATEM did not cause any significant difference (p 0.05) in
taste of rice breads.
3.2 Bread Quality and Dough Rheology of Gluten-free Chestnut-rice Bread
Formulations
Gluten-free bread formulations using chestnut and rice flours at different ratios
(0:100, 10:90, 20:80, 30:70, 40:60, 50:50 and 100:0) were tested. As discussed in
section 3.1, addition of xanthan–LBG and xanthan–guar gum blend and DATEM
into bread formulations resulted in high quality of breads. Thus, the influence of
hydrocolloid blend (xanthan–LBG and xanthan–guar gum blend) and emulsifier
DATEM on the rheological properties of dough formulations and quality parameters
of breads were investigated for the samples.
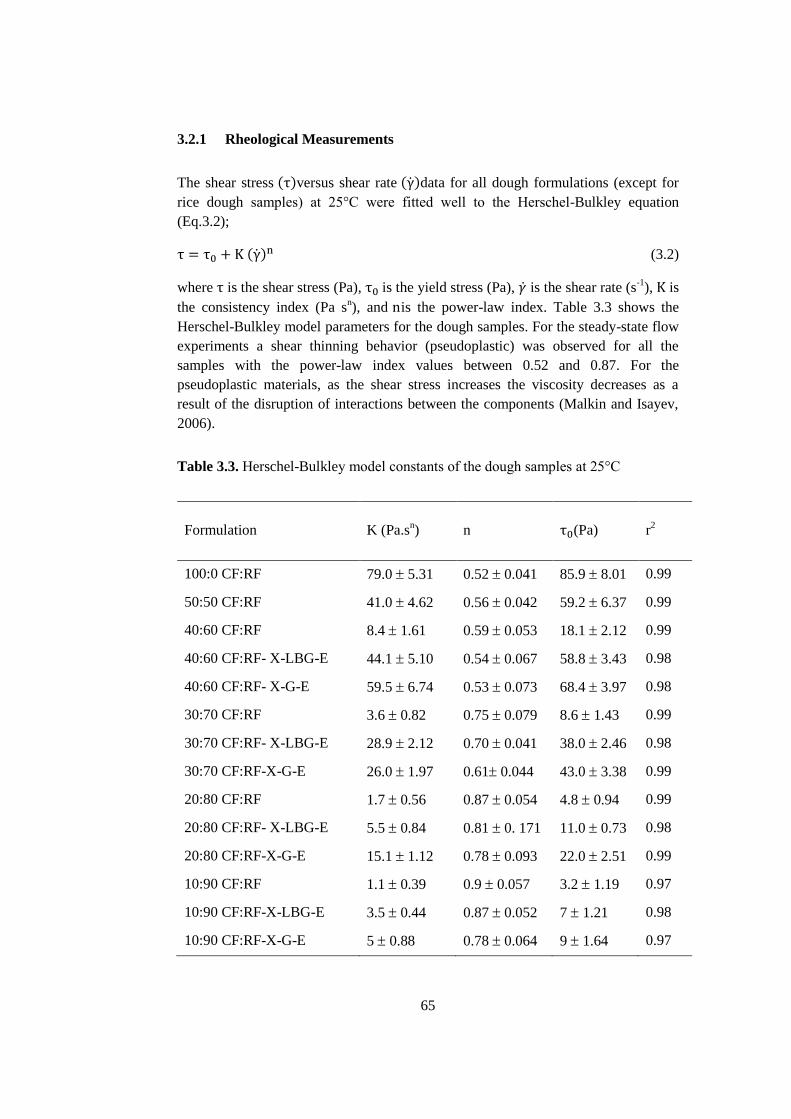
65
3.2.1 Rheological Measurements
The shear stress ( )versus shear rate ( ̇)data for all dough formulations (except for
rice dough samples) at 25°C were fitted well to the Herschel-Bulkley equation
(Eq.3.2);
( ̇) (3.2)
where is the shear stress (Pa), is the yield stress (Pa), ̇ is the shear rate (s-1
), is
the consistency index (Pa sn), and is the power-law index. Table 3.3 shows the
Herschel-Bulkley model parameters for the dough samples. For the steady-state flow
experiments a shear thinning behavior (pseudoplastic) was observed for all the
samples with the power-law index values between 0.52 and 0.87. For the
pseudoplastic materials, as the shear stress increases the viscosity decreases as a
result of the disruption of interactions between the components (Malkin and Isayev,
2006).
Table 3.3. Herschel-Bulkley model constants of the dough samples at 25°C
Formulation
K (Pa.sn) n (Pa)
r
2
100:0 CF:RF 79.0 5.31 0.52 0.041 85.9 8.01 0.99
50:50 CF:RF 41.0 4.62 0.56 0.042 59.2 6.37 0.99
40:60 CF:RF 8.4 1.61 0.59 0.053 18.1 2.12 0.99
40:60 CF:RF- X-LBG-E 44.1 5.10 0.54 0.067 58.8 3.43 0.98
40:60 CF:RF- X-G-E 59.5 6.74 0.53 0.073 68.4 3.97 0.98
30:70 CF:RF 3.6 0.82 0.75 0.079 8.6 1.43 0.99
30:70 CF:RF- X-LBG-E 28.9 2.12 0.70 0.041 38.0 2.46 0.98
30:70 CF:RF-X-G-E 26.0 1.97 0.61 0.044 43.0 3.38 0.99
20:80 CF:RF 1.7 0.56 0.87 0.054 4.8 0.94 0.99
20:80 CF:RF- X-LBG-E 5.5 0.84 0.81 0. 171 11.0 0.73 0.98
20:80 CF:RF-X-G-E 15.1 1.12 0.78 0.093 22.0 2.51 0.99
10:90 CF:RF 1.1 0.39 0.9 0.057 3.2 1.19 0.97
10:90 CF:RF-X-LBG-E 3.5 0.44 0.87 0.052 7 1.21 0.98
10:90 CF:RF-X-G-E 5 0.88 0.78 0.064 9 1.64 0.97
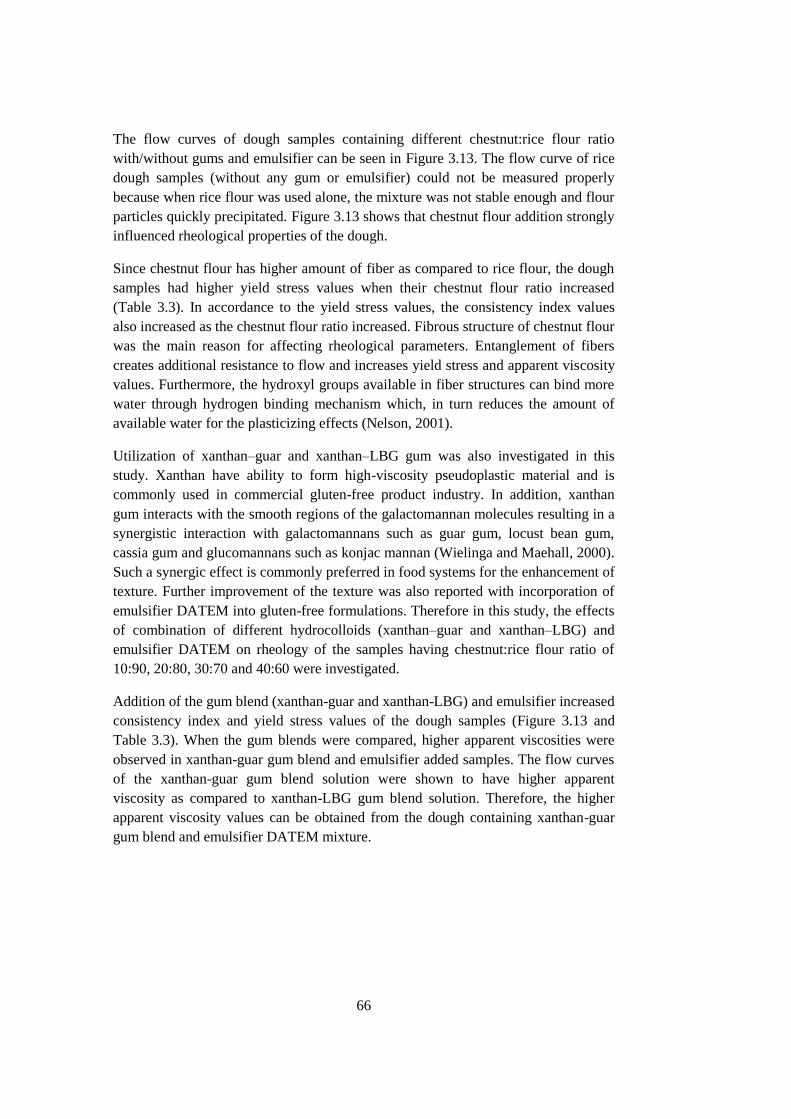
66
The flow curves of dough samples containing different chestnut:rice flour ratio
with/without gums and emulsifier can be seen in Figure 3.13. The flow curve of rice
dough samples (without any gum or emulsifier) could not be measured properly
because when rice flour was used alone, the mixture was not stable enough and flour
particles quickly precipitated. Figure 3.13 shows that chestnut flour addition strongly
influenced rheological properties of the dough.
Since chestnut flour has higher amount of fiber as compared to rice flour, the dough
samples had higher yield stress values when their chestnut flour ratio increased
(Table 3.3). In accordance to the yield stress values, the consistency index values
also increased as the chestnut flour ratio increased. Fibrous structure of chestnut flour
was the main reason for affecting rheological parameters. Entanglement of fibers
creates additional resistance to flow and increases yield stress and apparent viscosity
values. Furthermore, the hydroxyl groups available in fiber structures can bind more
water through hydrogen binding mechanism which, in turn reduces the amount of
available water for the plasticizing effects (Nelson, 2001).
Utilization of xanthan–guar and xanthan–LBG gum was also investigated in this
study. Xanthan have ability to form high-viscosity pseudoplastic material and is
commonly used in commercial gluten-free product industry. In addition, xanthan
gum interacts with the smooth regions of the galactomannan molecules resulting in a
synergistic interaction with galactomannans such as guar gum, locust bean gum,
cassia gum and glucomannans such as konjac mannan (Wielinga and Maehall, 2000).
Such a synergic effect is commonly preferred in food systems for the enhancement of
texture. Further improvement of the texture was also reported with incorporation of
emulsifier DATEM into gluten-free formulations. Therefore in this study, the effects
of combination of different hydrocolloids (xanthan–guar and xanthan–LBG) and
emulsifier DATEM on rheology of the samples having chestnut:rice flour ratio of
10:90, 20:80, 30:70 and 40:60 were investigated.
Addition of the gum blend (xanthan-guar and xanthan-LBG) and emulsifier increased
consistency index and yield stress values of the dough samples (Figure 3.13 and
Table 3.3). When the gum blends were compared, higher apparent viscosities were
observed in xanthan-guar gum blend and emulsifier added samples. The flow curves
of the xanthan-guar gum blend solution were shown to have higher apparent
viscosity as compared to xanthan-LBG gum blend solution. Therefore, the higher
apparent viscosity values can be obtained from the dough containing xanthan-guar
gum blend and emulsifier DATEM mixture.
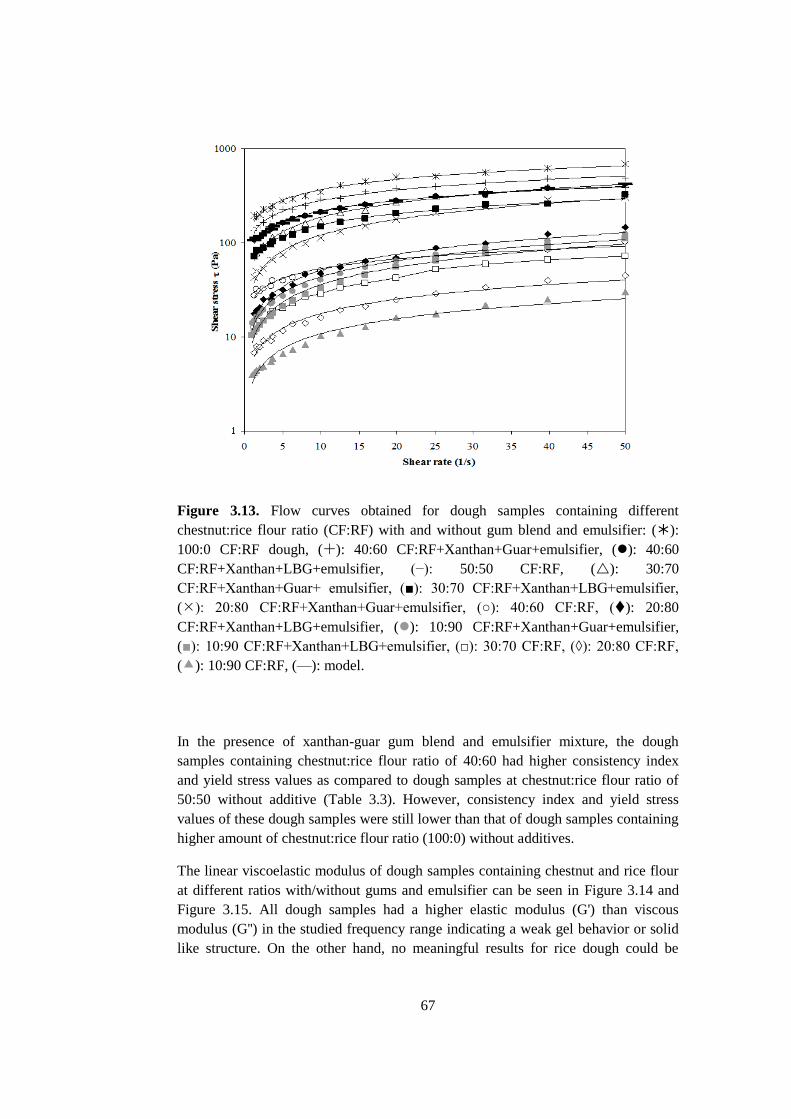
67
Figure 3.13. Flow curves obtained for dough samples containing different
chestnut:rice flour ratio (CF:RF) with and without gum blend and emulsifier: ():
100:0 CF:RF dough, (): 40:60 CF:RF+Xanthan+Guar+emulsifier, (): 40:60
CF:RF+Xanthan+LBG+emulsifier, (−): 50:50 CF:RF, (): 30:70
CF:RF+Xanthan+Guar+ emulsifier, (■): 30:70 CF:RF+Xanthan+LBG+emulsifier,
(): 20:80 CF:RF+Xanthan+Guar+emulsifier, (○): 40:60 CF:RF, (): 20:80
CF:RF+Xanthan+LBG+emulsifier, (): 10:90 CF:RF+Xanthan+Guar+emulsifier,
(■): 10:90 CF:RF+Xanthan+LBG+emulsifier, (□): 30:70 CF:RF, (◊): 20:80 CF:RF,
(): 10:90 CF:RF, (—): model.
In the presence of xanthan-guar gum blend and emulsifier mixture, the dough
samples containing chestnut:rice flour ratio of 40:60 had higher consistency index
and yield stress values as compared to dough samples at chestnut:rice flour ratio of
50:50 without additive (Table 3.3). However, consistency index and yield stress
values of these dough samples were still lower than that of dough samples containing
higher amount of chestnut:rice flour ratio (100:0) without additives.
The linear viscoelastic modulus of dough samples containing chestnut and rice flour
at different ratios with/without gums and emulsifier can be seen in Figure 3.14 and
Figure 3.15. All dough samples had a higher elastic modulus (G') than viscous
modulus (G'') in the studied frequency range indicating a weak gel behavior or solid
like structure. On the other hand, no meaningful results for rice dough could be
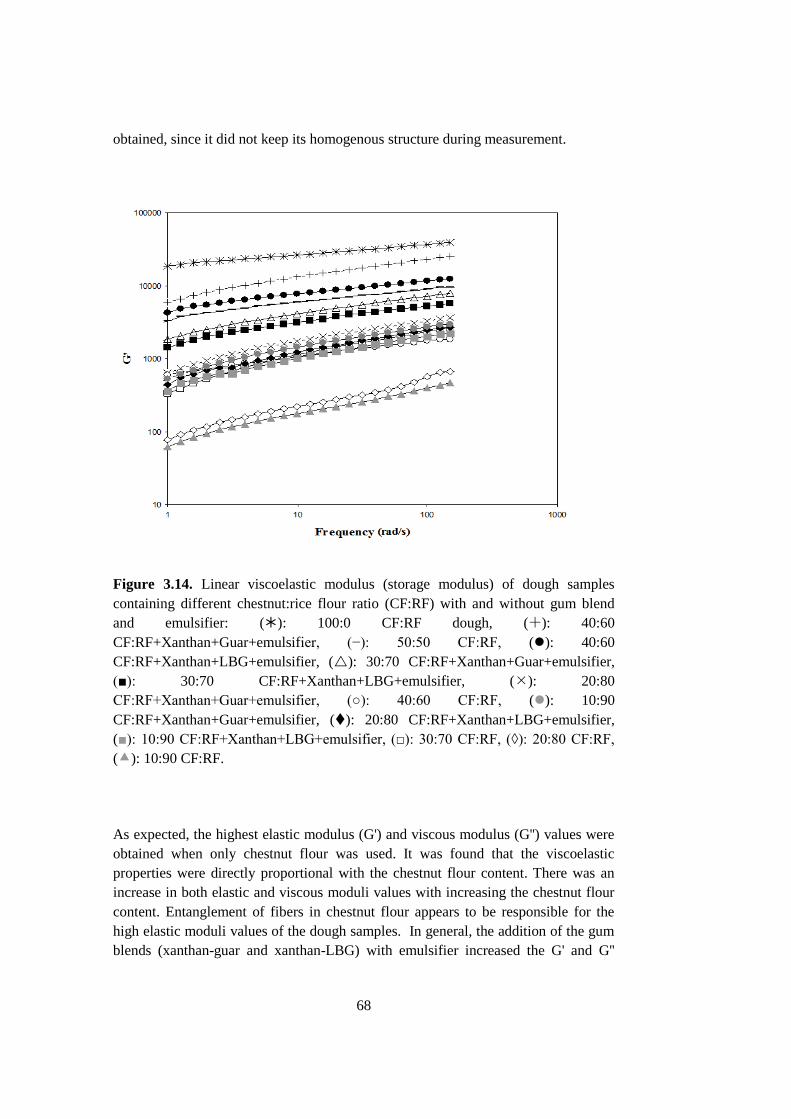
68
obtained, since it did not keep its homogenous structure during measurement.
Figure 3.14. Linear viscoelastic modulus (storage modulus) of dough samples
containing different chestnut:rice flour ratio (CF:RF) with and without gum blend
and emulsifier: (): 100:0 CF:RF dough, (): 40:60
CF:RF+Xanthan+Guar+emulsifier, (−): 50:50 CF:RF, (): 40:60
CF:RF+Xanthan+LBG+emulsifier, (): 30:70 CF:RF+Xanthan+Guar+emulsifier,
(■): 30:70 CF:RF+Xanthan+LBG+emulsifier, (): 20:80
CF:RF+Xanthan+Guar+emulsifier, (○): 40:60 CF:RF, (): 10:90
CF:RF+Xanthan+Guar+emulsifier, (): 20:80 CF:RF+Xanthan+LBG+emulsifier,
(■): 10:90 CF:RF+Xanthan+LBG+emulsifier, (□): 30:70 CF:RF, (◊): 20:80 CF:RF,
(): 10:90 CF:RF.
As expected, the highest elastic modulus (G') and viscous modulus (G'') values were
obtained when only chestnut flour was used. It was found that the viscoelastic
properties were directly proportional with the chestnut flour content. There was an
increase in both elastic and viscous moduli values with increasing the chestnut flour
content. Entanglement of fibers in chestnut flour appears to be responsible for the
high elastic moduli values of the dough samples. In general, the addition of the gum
blends (xanthan-guar and xanthan-LBG) with emulsifier increased the G' and G''
69
moduli of the dough samples (Figure 3.14 and Figure 3.15). Similar to the flow
properties; xanthan-guar blend containing dough had higher elastic and viscous
moduli values than xanthan- LBG blend containing ones.
Figure 3.15. Linear viscoelastic modulus (loss modulus) of dough samples different
chestnut:rice flour ratio (CF:RF) with and without gum blend and emulsifier: ():
100:0 CF:RF dough, (): 40:60 CF:RF+Xanthan+Guar+emulsifier, (−): 50:50
CF:RF, (): 40:60 CF:RF+Xanthan+LBG+emulsifier, (): 30:70
CF:RF+Xanthan+Guar+emulsifier, (■): 30:70 CF:RF+Xanthan+LBG+emulsifier,
(): 20:80 CF:RF+Xanthan+Guar+emulsifier, (○): 40:60 CF:RF, (): 10:90
CF:RF+Xanthan+Guar+emulsifier, (): 20:80 CF:RF+Xanthan+LBG+emulsifier,
(■): 10:90 CF:RF+Xanthan+LBG+emulsifier, (□): 30:70 CF:RF, (◊): 20:80 CF:RF,
(): 10:90 CF:RF.
3.2.2 Baking Tests
Bread samples were evaluated according to their firmness, specific volume and color.
When the bread sample was prepared using only chestnut flour, the firmest structure
with the lowest volume was observed because of the rigid and compact structure of
the fibrous chestnut flour dough (Figure 3.16 and Figure 3.17).
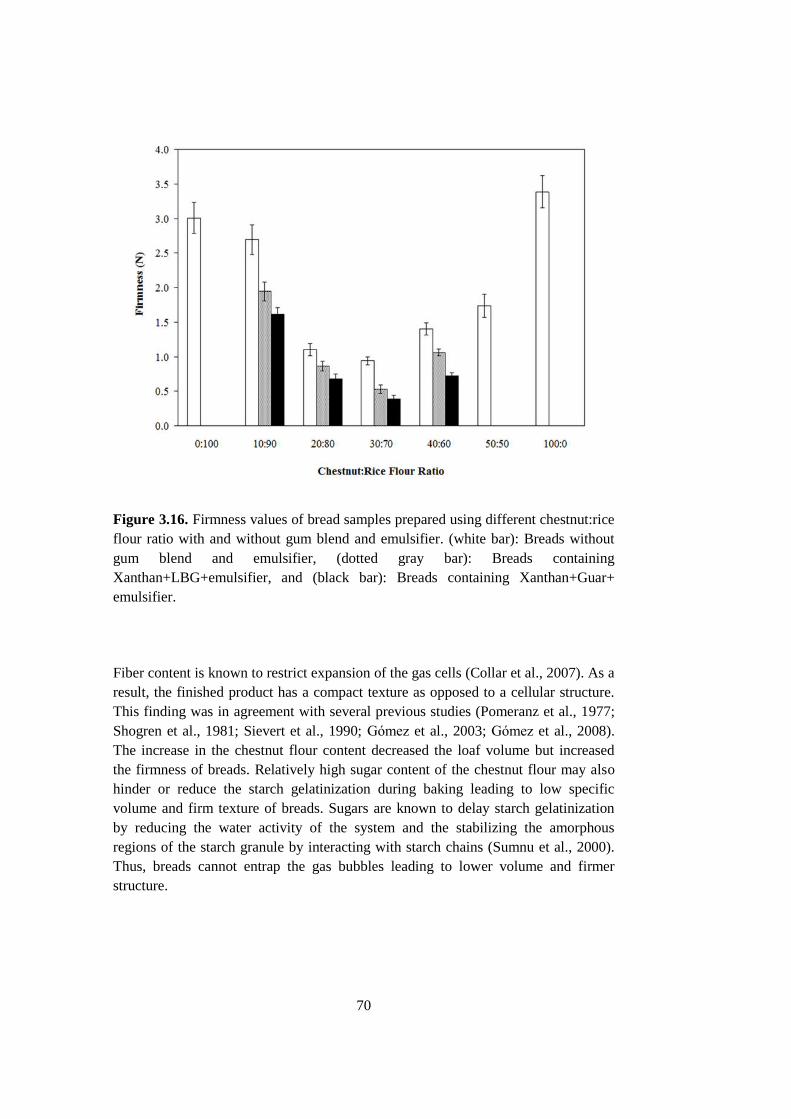
70
Figure 3.16. Firmness values of bread samples prepared using different chestnut:rice
flour ratio with and without gum blend and emulsifier. (white bar): Breads without
gum blend and emulsifier, (dotted gray bar): Breads containing
Xanthan+LBG+emulsifier, and (black bar): Breads containing Xanthan+Guar+
emulsifier.
Fiber content is known to restrict expansion of the gas cells (Collar et al., 2007). As a
result, the finished product has a compact texture as opposed to a cellular structure.
This finding was in agreement with several previous studies (Pomeranz et al., 1977;
Shogren et al., 1981; Sievert et al., 1990; Gómez et al., 2003; Gómez et al., 2008).
The increase in the chestnut flour content decreased the loaf volume but increased
the firmness of breads. Relatively high sugar content of the chestnut flour may also
hinder or reduce the starch gelatinization during baking leading to low specific
volume and firm texture of breads. Sugars are known to delay starch gelatinization
by reducing the water activity of the system and the stabilizing the amorphous
regions of the starch granule by interacting with starch chains (Sumnu et al., 2000).
Thus, breads cannot entrap the gas bubbles leading to lower volume and firmer
structure.
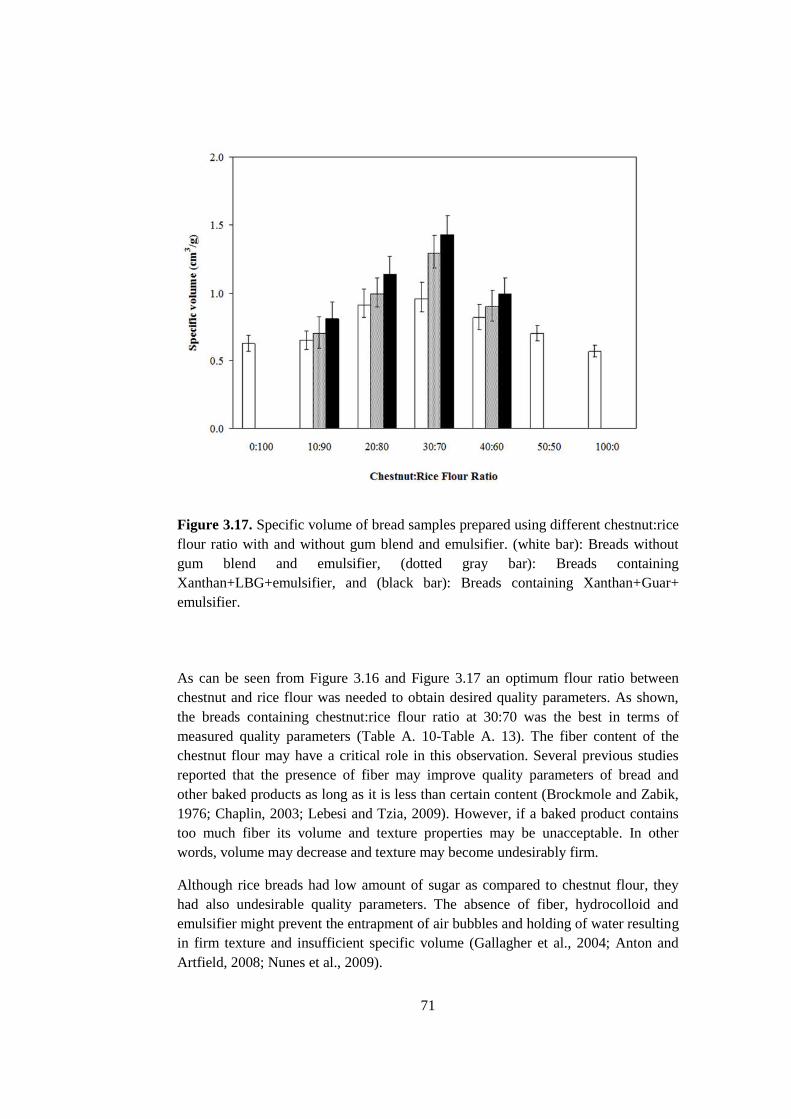
71
Figure 3.17. Specific volume of bread samples prepared using different chestnut:rice
flour ratio with and without gum blend and emulsifier. (white bar): Breads without
gum blend and emulsifier, (dotted gray bar): Breads containing
Xanthan+LBG+emulsifier, and (black bar): Breads containing Xanthan+Guar+
emulsifier.
As can be seen from Figure 3.16 and Figure 3.17 an optimum flour ratio between
chestnut and rice flour was needed to obtain desired quality parameters. As shown,
the breads containing chestnut:rice flour ratio at 30:70 was the best in terms of
measured quality parameters (Table A. 10-Table A. 13). The fiber content of the
chestnut flour may have a critical role in this observation. Several previous studies
reported that the presence of fiber may improve quality parameters of bread and
other baked products as long as it is less than certain content (Brockmole and Zabik,
1976; Chaplin, 2003; Lebesi and Tzia, 2009). However, if a baked product contains
too much fiber its volume and texture properties may be unacceptable. In other
words, volume may decrease and texture may become undesirably firm.
Although rice breads had low amount of sugar as compared to chestnut flour, they
had also undesirable quality parameters. The absence of fiber, hydrocolloid and
emulsifier might prevent the entrapment of air bubbles and holding of water resulting
in firm texture and insufficient specific volume (Gallagher et al., 2004; Anton and
Artfield, 2008; Nunes et al., 2009).
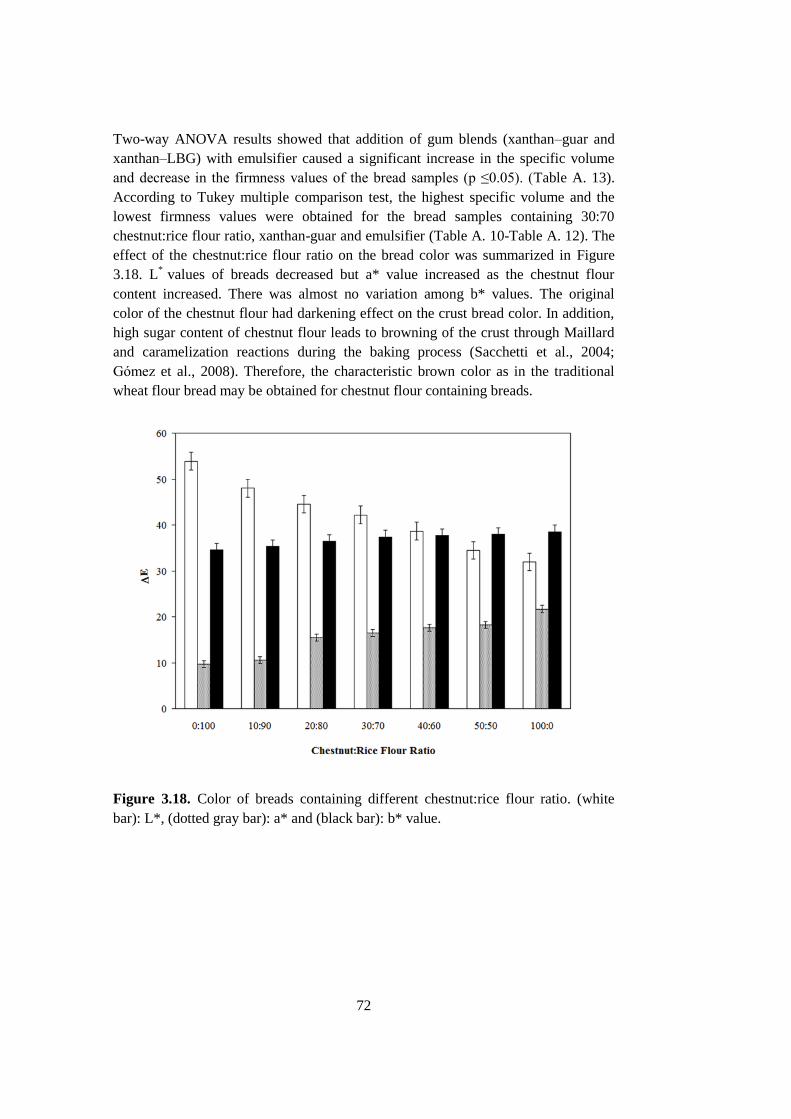
72
Two-way ANOVA results showed that addition of gum blends (xanthan–guar and
xanthan–LBG) with emulsifier caused a significant increase in the specific volume
and decrease in the firmness values of the bread samples (p ≤0.05). (Table A. 13).
According to Tukey multiple comparison test, the highest specific volume and the
lowest firmness values were obtained for the bread samples containing 30:70
chestnut:rice flour ratio, xanthan-guar and emulsifier (Table A. 10-Table A. 12). The
effect of the chestnut:rice flour ratio on the bread color was summarized in Figure
3.18. L*
values of breads decreased but a* value increased as the chestnut flour
content increased. There was almost no variation among b* values. The original
color of the chestnut flour had darkening effect on the crust bread color. In addition,
high sugar content of chestnut flour leads to browning of the crust through Maillard
and caramelization reactions during the baking process (Sacchetti et al., 2004;
Gómez et al., 2008). Therefore, the characteristic brown color as in the traditional
wheat flour bread may be obtained for chestnut flour containing breads.
Figure 3.18. Color of breads containing different chestnut:rice flour ratio. (white
bar): L*, (dotted gray bar): a* and (black bar): b* value.
73
The results of sensory analysis of the breads made using chestnut and rice flours are
given in Table 3.4. According to the rheological, textural, and colour measurements,
the best final product were obtained when the chestnut:rice flour ratio at 30:70 was
used. Therefore, breads prepared at this flour ratio with/without additives were
tested. The acceptability of breads declined mainly due to more compact texture of
the crumb and crack formation occurred in the breads containing only chestnut flour.
The highest scores for the texture were obtained when xanthan-guar gum blend and
DATEM were used in breads prepared using 30:70 chestnut:rice flour ratio (p 0.05)
(Table A. 17).
The scores of the sensory evaluation for the flavor showed that the breads containing
chestnut:rice flour ratio at 30:70 had higher scores as compared to 100% chestnut
bread and 100% rice bread (Table A. 17). Breads prepared by using only chestnut
flour had lower flavor score as compared to breads made with chestnut:rice flour
ratio of 30:70. This may be due to the off-flavor formation as a result of Maillard
reactions. Furthermore, low scores might have also caused by intense chestnut flavor
in high chestnut flour containing breads. Sacchetti et al. (2004) found a similar result.
Rice breads were not accepted due to the lack of unique taste of chestnut flour. On
the other hand, addition of the blends of hydrocolloids and emulsifier did not cause
any significant difference (p 0.05) in the taste of breads.
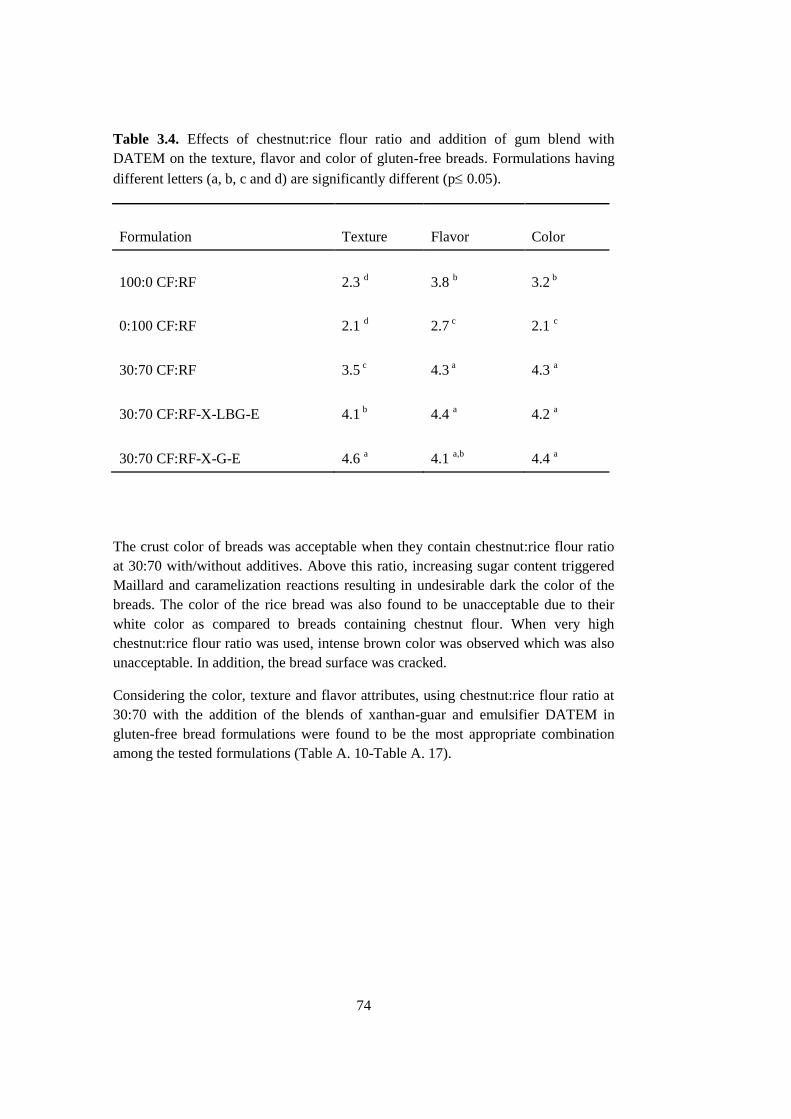
74
Table 3.4. Effects of chestnut:rice flour ratio and addition of gum blend with
DATEM on the texture, flavor and color of gluten-free breads. Formulations having
different letters (a, b, c and d) are significantly different (p 0.05).
Formulation Texture Flavor Color
100:0 CF:RF 2.3
d 3.8
b 3.2
b
0:100 CF:RF 2.1
d 2.7
c 2.1
c
30:70 CF:RF 3.5
c 4.3
a 4.3
a
30:70 CF:RF-X-LBG-E 4.1
b 4.4
a 4.2
a
30:70 CF:RF-X-G-E 4.6
a 4.1
a,b 4.4
a
The crust color of breads was acceptable when they contain chestnut:rice flour ratio
at 30:70 with/without additives. Above this ratio, increasing sugar content triggered
Maillard and caramelization reactions resulting in undesirable dark the color of the
breads. The color of the rice bread was also found to be unacceptable due to their
white color as compared to breads containing chestnut flour. When very high
chestnut:rice flour ratio was used, intense brown color was observed which was also
unacceptable. In addition, the bread surface was cracked.
Considering the color, texture and flavor attributes, using chestnut:rice flour ratio at
30:70 with the addition of the blends of xanthan-guar and emulsifier DATEM in
gluten-free bread formulations were found to be the most appropriate combination
among the tested formulations (Table A. 10-Table A. 17).
75
3.3 Optimization of Formulations and Infrared-microwave Combination
Baking Conditions of Chestnut-rice Breads
Response surface methodology (RSM) was used to optimize gluten-free bread
formulations and processing conditions. Rice flour mixed with different proportions
of chestnut flour and different emulsifier contents were used to prepare breads. The
relationships between the responses of weight loss, firmness, specific volume and
colour change of the breads and independent variables of chestnut:rice flour ratio,
emulsifier content, upper halogen lamp powers, microwave powers and baking time
were determined by using second order models obtained.
The response variables were fitted to a second-order polynomial model equation in
order to correlate the response variables to the independent variables. The general
form of the second order polynomial equation was as follows:
Y = b0 + b1X1 + b2X2 + b3X3 + b4X4 + b5X5 + b11X12 + b22X2
2 + b33X3
2 + b44X4
2 + b5X55
2
+ b12X1X2 + b13X1X3 + b14X1X4 + b15X1X5 + b23X2X3 + b24X2X4 + b25X2X5 + b34X3X4 +
b35X3X5 + b45X4X5+ (3.3)
where Yi’s (Y1-Y4) are the dependent variables (weight loss, firmness, specific
volume, and total color change (E)), Xi’s (X1-X5) are the independent variables
(chestnut:rice flour ratio, emulsifier content, upper halogen lamp power, microwave
power and baking time), bo is the constant coefficient, bi’s (b1-b5) are the linear, bii’s
(b11-b55) are the quadratic and bij’s (b12-b45) are the interactions regression terms and
is the error.
By applying diagnostic plots, the assumptions of normality, independence and
randomness of the residual were fulfilled. Unless the model exhibits an adequate fit,
proceeding with exploration and optimization of a fitted response surface may result
in misleading (Myers and Montgomery, 2002). Therefore, verifying the model
adequacy is essential. To check the normality, normal probability curves of
standardized residuals were sketched. The figures obtained from this drawing
appeared to be linear. Nevertheless, to obtain definite results, Anderson and Darling
normality test was also conducted. The results of these tests showed that the residuals
were normally distributed with constant variance.
To test the various correlations against a representative body of available data,
predicted values were plotted against the experimental values, the 45° line
representing good correlation (Figure 3.19). High regression coefficients were
calculated between the experimental and predicted data.
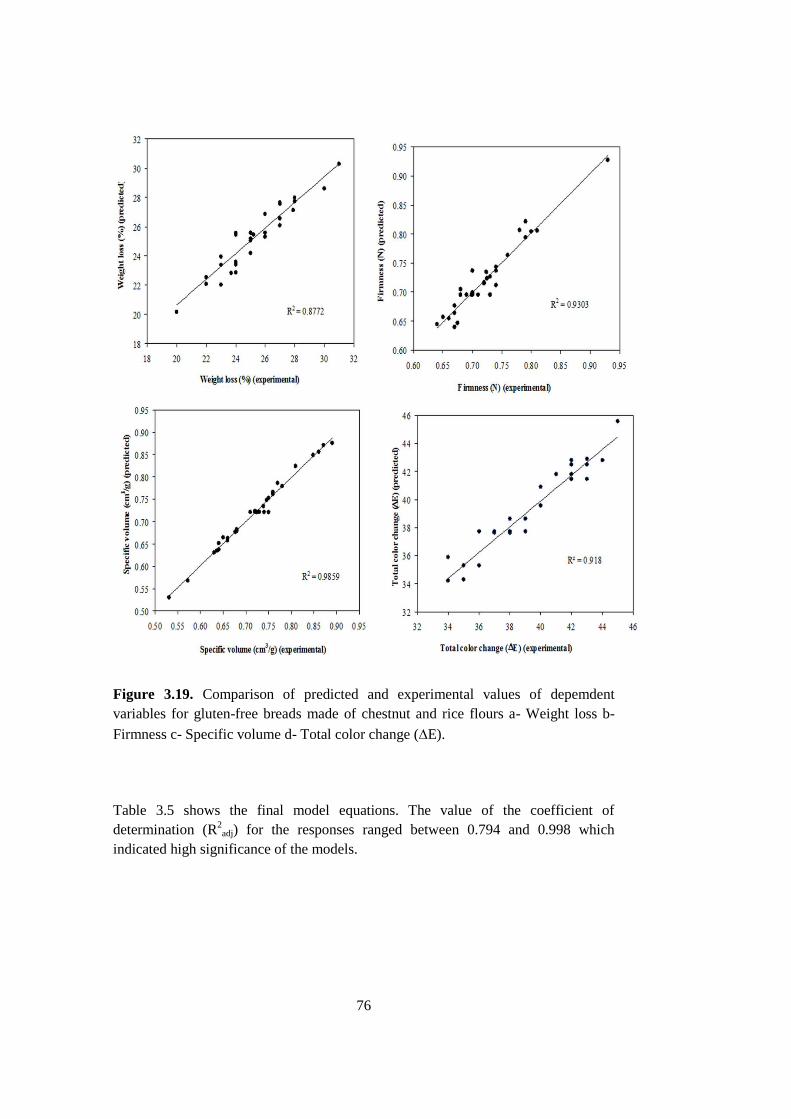
76
Figure 3.19. Comparison of predicted and experimental values of depemdent
variables for gluten-free breads made of chestnut and rice flours a- Weight loss b-
Firmness c- Specific volume d- Total color change (E).
Table 3.5 shows the final model equations. The value of the coefficient of
determination (R2
adj) for the responses ranged between 0.794 and 0.998 which
indicated high significance of the models.
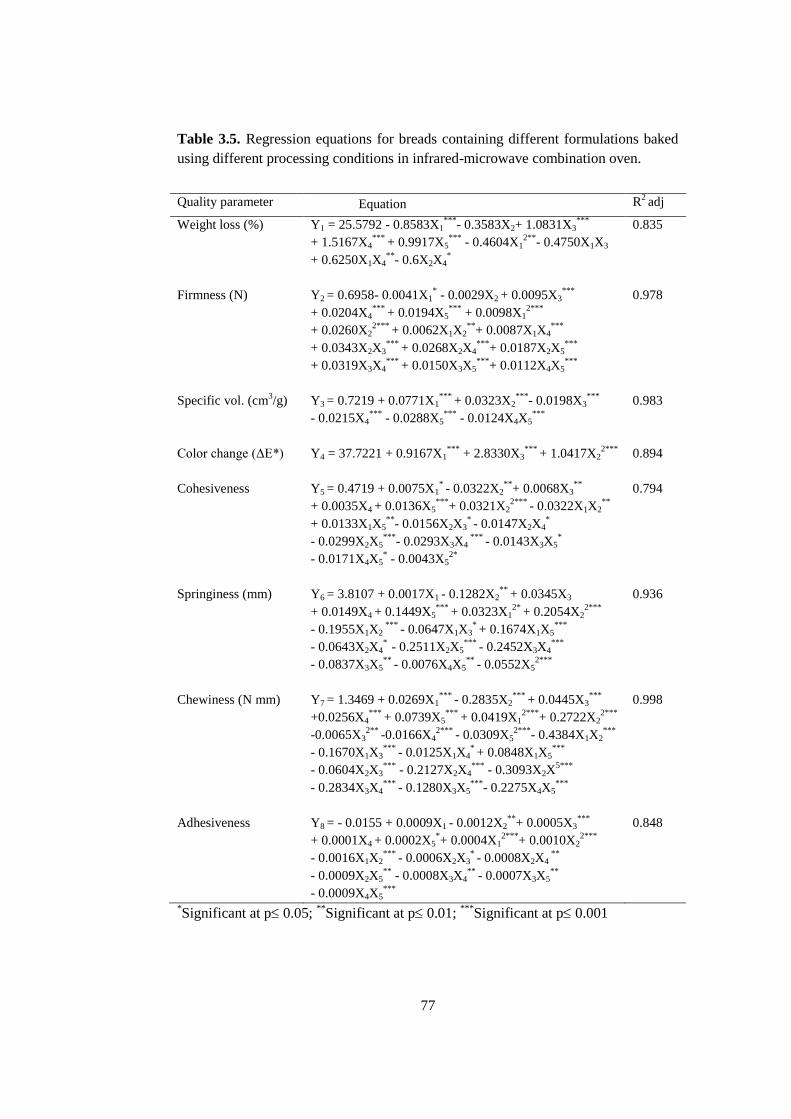
77
Table 3.5. Regression equations for breads containing different formulations baked
using different processing conditions in infrared-microwave combination oven.
Quality parameter Equation R2 adj
Weight loss (%) Y1 = 25.5792 - 0.8583X1***
- 0.3583X2+ 1.0831X3***
0.835
+ 1.5167X4***
+ 0.9917X5***
- 0.4604X12**
- 0.4750X1X3
+ 0.6250X1X4**
- 0.6X2X4*
Firmness (N) Y2 = 0.6958- 0.0041X1* - 0.0029X2 + 0.0095X3
*** 0.978
+ 0.0204X4***
+ 0.0194X5***
+ 0.0098X12***
+ 0.0260X22***
+ 0.0062X1X2**
+ 0.0087X1X4***
+ 0.0343X2X3***
+ 0.0268X2X4***
+ 0.0187X2X5***
+ 0.0319X3X4***
+ 0.0150X3X5***
+ 0.0112X4X5***
Specific vol. (cm3/g) Y3 = 0.7219 + 0.0771X1
*** + 0.0323X2
***- 0.0198X3
*** 0.983
- 0.0215X4***
- 0.0288X5***
- 0.0124X4X5***
Color change (ΔE*) Y4 = 37.7221 + 0.9167X1***
+ 2.8330X3***
+ 1.0417X22***
0.894
Cohesiveness Y5 = 0.4719 + 0.0075X1* - 0.0322X2
**+ 0.0068X3
** 0.794
+ 0.0035X4 + 0.0136X5***
+ 0.0321X22***
- 0.0322X1X2**
+ 0.0133X1X5**
- 0.0156X2X3* - 0.0147X2X4
*
- 0.0299X2X5***
- 0.0293X3X4 ***
- 0.0143X3X5*
- 0.0171X4X5* - 0.0043X5
2*
Springiness (mm) Y6 = 3.8107 + 0.0017X1 - 0.1282X2**
+ 0.0345X3 0.936
+ 0.0149X4 + 0.1449X5***
+ 0.0323X12*
+ 0.2054X22***
- 0.1955X1X2 ***
- 0.0647X1X3* + 0.1674X1X5
***
- 0.0643X2X4*
- 0.2511X2X5***
- 0.2452X3X4***
- 0.0837X3X5**
- 0.0076X4X5**
- 0.0552X52***
Chewiness (N mm) Y7 = 1.3469 + 0.0269X1***
- 0.2835X2***
+ 0.0445X3***
0.998
+0.0256X4***
+ 0.0739X5***
+ 0.0419X12***
+ 0.2722X22***
-0.0065X32**
-0.0166X42***
- 0.0309X52***
- 0.4384X1X2***
- 0.1670X1X3***
- 0.0125X1X4* + 0.0848X1X5
***
- 0.0604X2X3***
- 0.2127X2X4***
- 0.3093X2X5***
- 0.2834X3X4***
- 0.1280X3X5***
- 0.2275X4X5***
Adhesiveness Y8 = - 0.0155 + 0.0009X1 - 0.0012X2**
+ 0.0005X3***
0.848
+ 0.0001X4 + 0.0002X5*+ 0.0004X1
2***+ 0.0010X2
2***
- 0.0016X1X2***
- 0.0006X2X3* - 0.0008X2X4
**
- 0.0009X2X5**
- 0.0008X3X4**
- 0.0007X3X5**
- 0.0009X4X5***
*Significant at p 0.05;
**Significant at p 0.01;
***Significant at p 0.001

78
All the independent factors, except emulsifier content, significantly affected the
weight loss of breads (Table 3.5). The effects of baking time and microwave power
on the weight loss of breads are illustrated in Figure 3.20.
Figure 3.20. Variation of weight loss of the gluten-free breads with microwave
power (X4) and baking time (X5) when X1, X2and X3 = 0.
As the baking time and the microwave power increased, the weight loss of breads
increased. Microwave power was more effective on weight loss of breads in
comparison to the baking time. This finding is in agreement with a previous study in
which the microwave power was found to be the dominant factor on the weight loss
of wheat breads during the infrared-microwave combination baking (Keskin et al.,
2004). As the microwave power increased, a greater interior pressure and
concentration gradient occurred in the food which led to an increase in the drawing
of liquid through the food boundary (Datta, 1990). Weight loss of breads increased
also with increase in infrared powers (Table 3.5). With increasing infrared powers,
breads were exposed to more radiative heat and the higher pressure gradient resulting
in higher rate of removal of moisture from the bread samples.
As shown in Figure 3.21, weight loss of breads decreased as chestnut:rice flour ratio
increased, but it increased with the baking time. The decrease in weight loss of
breads with the increasing chestnut:rice flour ratio may be probably due to an
increase in the fiber content of chestnut flour. Since fiber has water binding ability,
the weight loss of breads decreased as more fiber was available in the formulations.
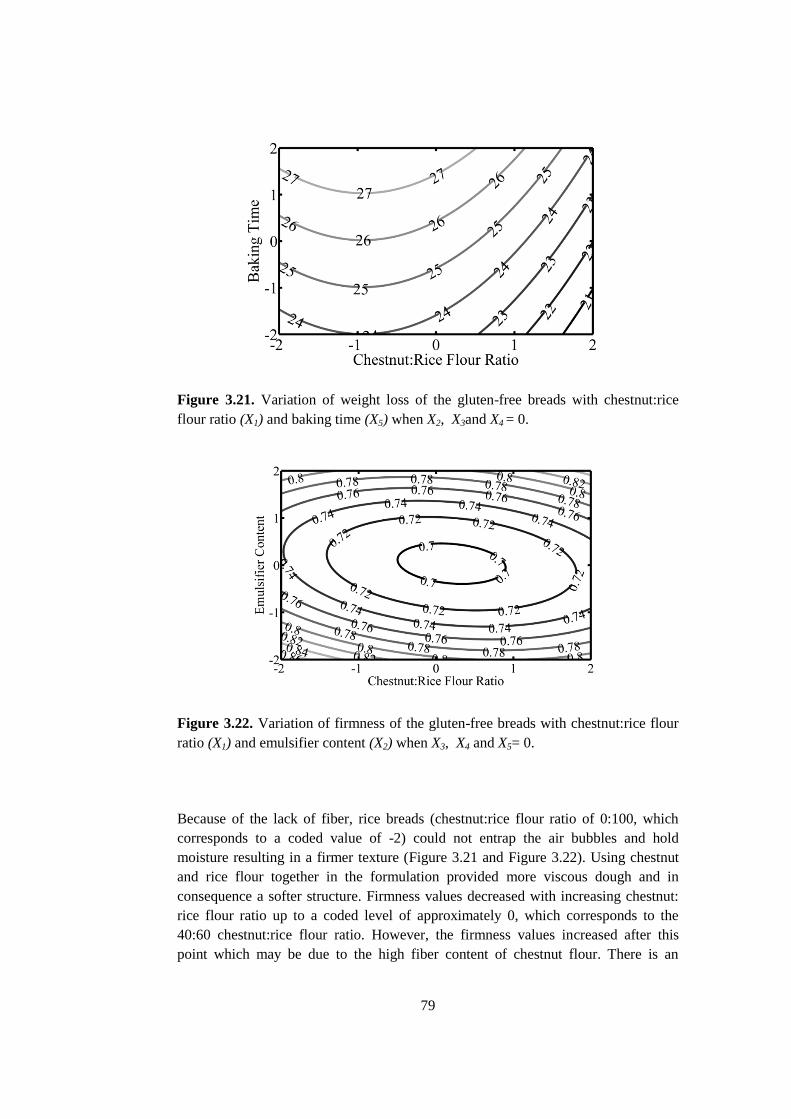
79
Figure 3.21. Variation of weight loss of the gluten-free breads with chestnut:rice
flour ratio (X1) and baking time (X5) when X2, X3and X4 = 0.
Figure 3.22. Variation of firmness of the gluten-free breads with chestnut:rice flour
ratio (X1) and emulsifier content (X2) when X3, X4 and X5= 0.
Because of the lack of fiber, rice breads (chestnut:rice flour ratio of 0:100, which
corresponds to a coded value of -2) could not entrap the air bubbles and hold
moisture resulting in a firmer texture (Figure 3.21 and Figure 3.22). Using chestnut
and rice flour together in the formulation provided more viscous dough and in
consequence a softer structure. Firmness values decreased with increasing chestnut:
rice flour ratio up to a coded level of approximately 0, which corresponds to the
40:60 chestnut:rice flour ratio. However, the firmness values increased after this
point which may be due to the high fiber content of chestnut flour. There is an
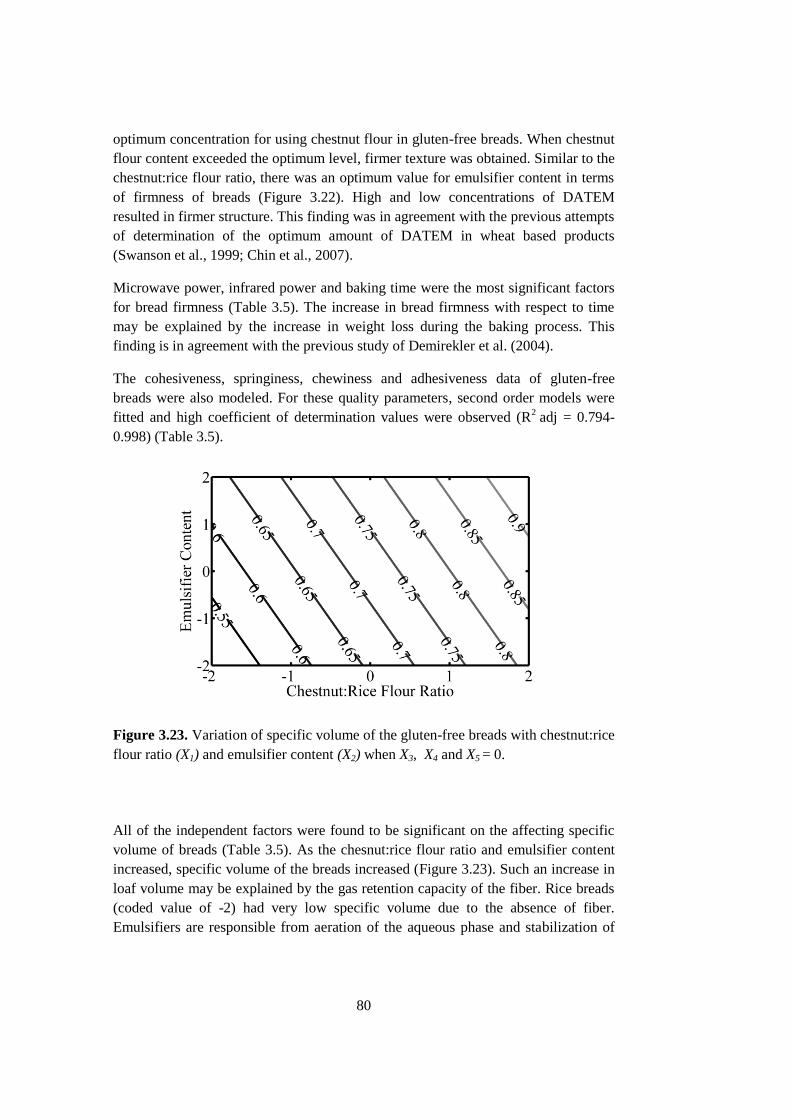
80
optimum concentration for using chestnut flour in gluten-free breads. When chestnut
flour content exceeded the optimum level, firmer texture was obtained. Similar to the
chestnut:rice flour ratio, there was an optimum value for emulsifier content in terms
of firmness of breads (Figure 3.22). High and low concentrations of DATEM
resulted in firmer structure. This finding was in agreement with the previous attempts
of determination of the optimum amount of DATEM in wheat based products
(Swanson et al., 1999; Chin et al., 2007).
Microwave power, infrared power and baking time were the most significant factors
for bread firmness (Table 3.5). The increase in bread firmness with respect to time
may be explained by the increase in weight loss during the baking process. This
finding is in agreement with the previous study of Demirekler et al. (2004).
The cohesiveness, springiness, chewiness and adhesiveness data of gluten-free
breads were also modeled. For these quality parameters, second order models were
fitted and high coefficient of determination values were observed (R2
adj = 0.794-
0.998) (Table 3.5).
Figure 3.23. Variation of specific volume of the gluten-free breads with chestnut:rice
flour ratio (X1) and emulsifier content (X2) when X3, X4 and X5 = 0.
All of the independent factors were found to be significant on the affecting specific
volume of breads (Table 3.5). As the chesnut:rice flour ratio and emulsifier content
increased, specific volume of the breads increased (Figure 3.23). Such an increase in
loaf volume may be explained by the gas retention capacity of the fiber. Rice breads
(coded value of -2) had very low specific volume due to the absence of fiber.
Emulsifiers are responsible from aeration of the aqueous phase and stabilization of
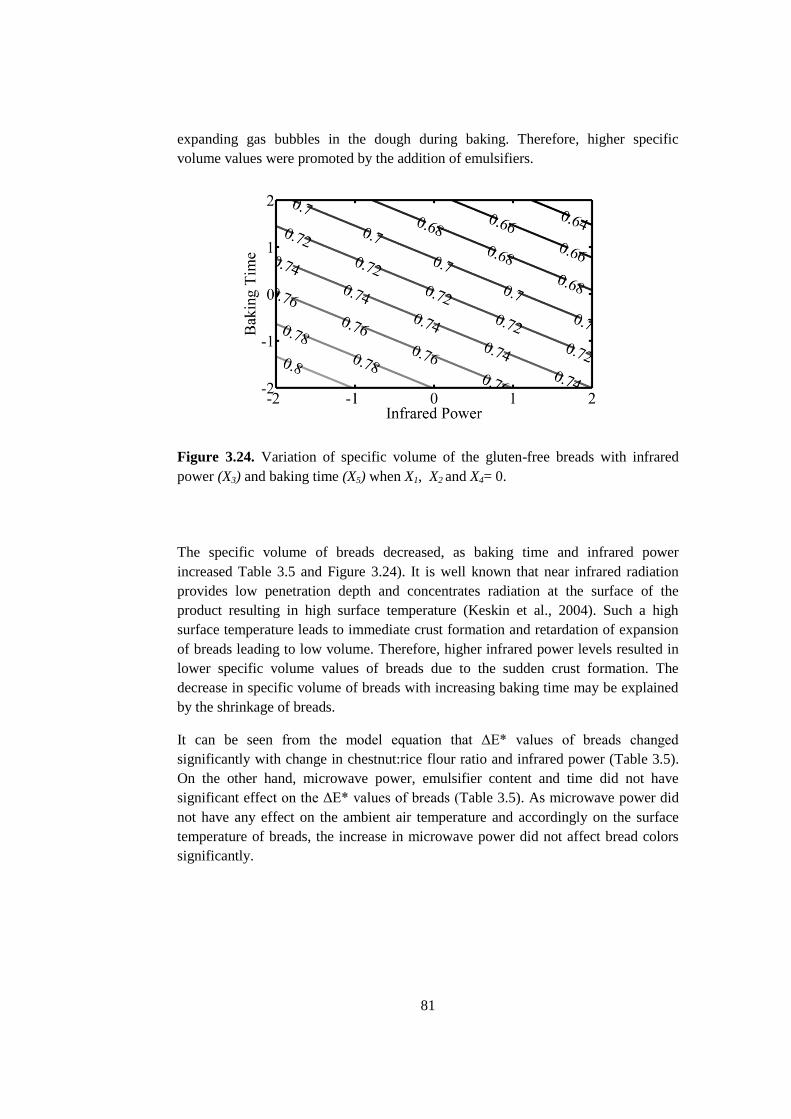
81
expanding gas bubbles in the dough during baking. Therefore, higher specific
volume values were promoted by the addition of emulsifiers.
Figure 3.24. Variation of specific volume of the gluten-free breads with infrared
power (X3) and baking time (X5) when X1, X2 and X4= 0.
The specific volume of breads decreased, as baking time and infrared power
increased Table 3.5 and Figure 3.24). It is well known that near infrared radiation
provides low penetration depth and concentrates radiation at the surface of the
product resulting in high surface temperature (Keskin et al., 2004). Such a high
surface temperature leads to immediate crust formation and retardation of expansion
of breads leading to low volume. Therefore, higher infrared power levels resulted in
lower specific volume values of breads due to the sudden crust formation. The
decrease in specific volume of breads with increasing baking time may be explained
by the shrinkage of breads.
It can be seen from the model equation that ΔE* values of breads changed
significantly with change in chestnut:rice flour ratio and infrared power (Table 3.5).
On the other hand, microwave power, emulsifier content and time did not have
significant effect on the ΔE* values of breads (Table 3.5). As microwave power did
not have any effect on the ambient air temperature and accordingly on the surface
temperature of breads, the increase in microwave power did not affect bread colors
significantly.
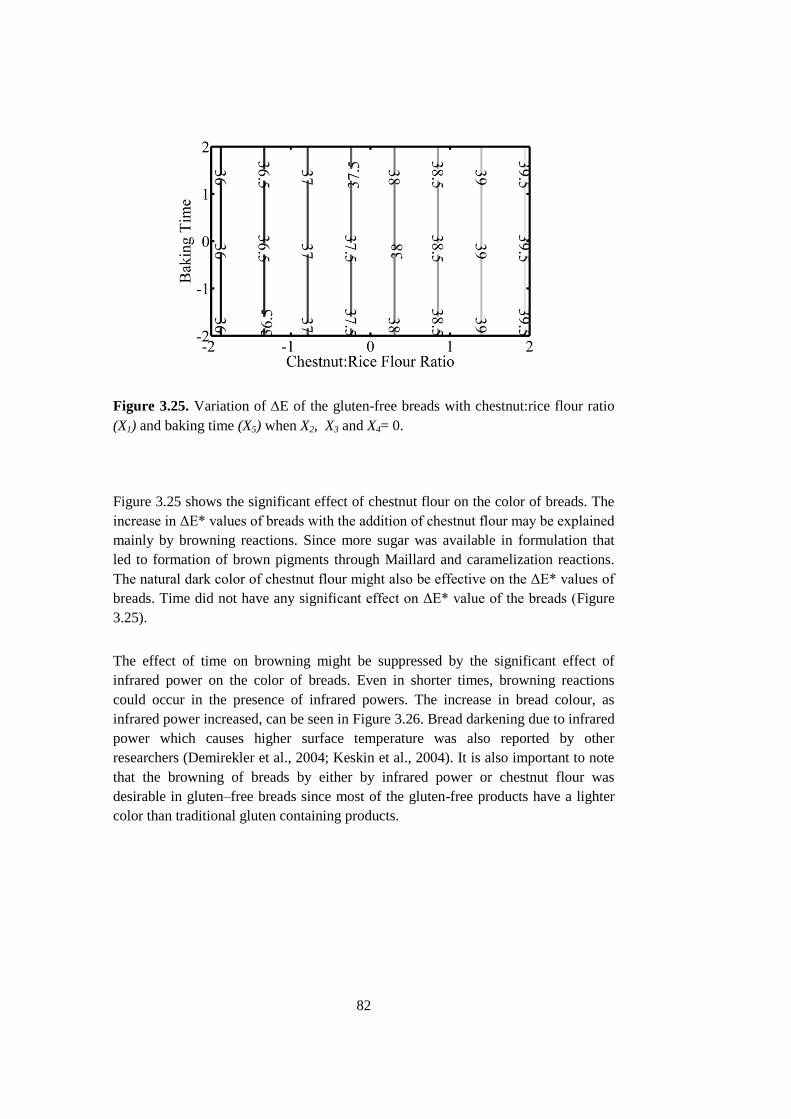
82
Figure 3.25. Variation of E of the gluten-free breads with chestnut:rice flour ratio
(X1) and baking time (X5) when X2, X3 and X4= 0.
Figure 3.25 shows the significant effect of chestnut flour on the color of breads. The
increase in ΔE* values of breads with the addition of chestnut flour may be explained
mainly by browning reactions. Since more sugar was available in formulation that
led to formation of brown pigments through Maillard and caramelization reactions.
The natural dark color of chestnut flour might also be effective on the ΔE* values of
breads. Time did not have any significant effect on ΔE* value of the breads (Figure
3.25).
The effect of time on browning might be suppressed by the significant effect of
infrared power on the color of breads. Even in shorter times, browning reactions
could occur in the presence of infrared powers. The increase in bread colour, as
infrared power increased, can be seen in Figure 3.26. Bread darkening due to infrared
power which causes higher surface temperature was also reported by other
researchers (Demirekler et al., 2004; Keskin et al., 2004). It is also important to note
that the browning of breads by either by infrared power or chestnut flour was
desirable in gluten–free breads since most of the gluten-free products have a lighter
color than traditional gluten containing products.
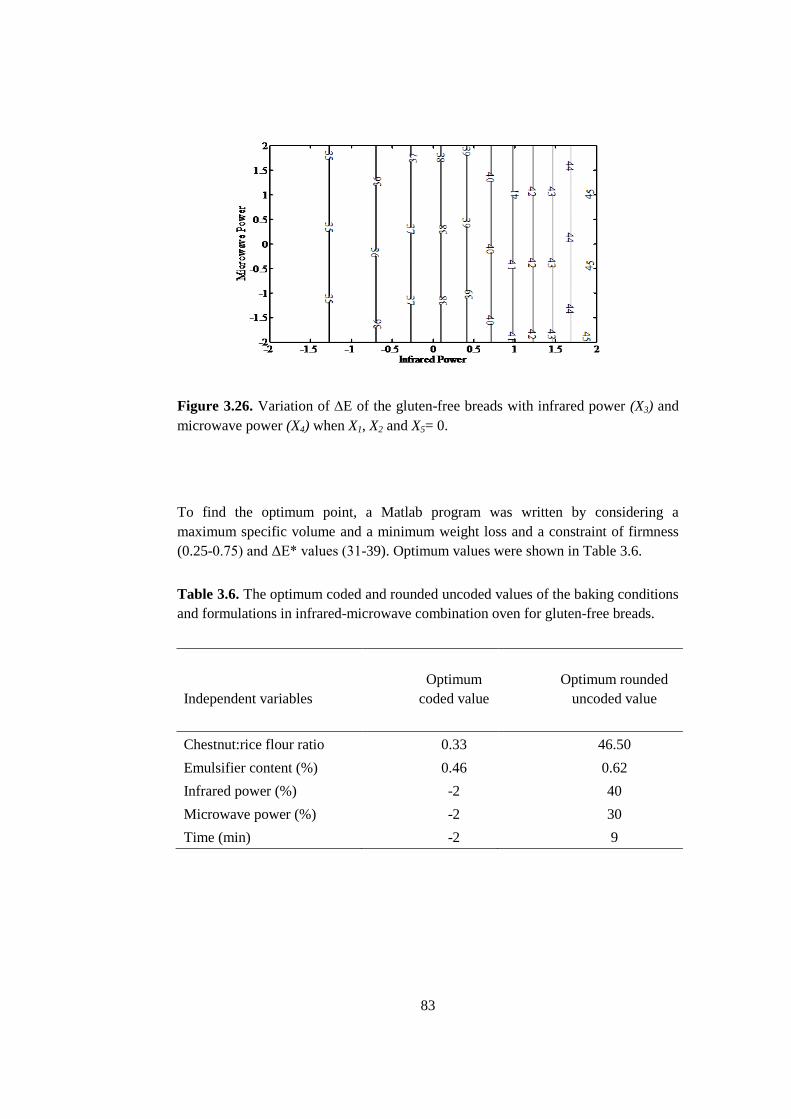
83
Figure 3.26. Variation of E of the gluten-free breads with infrared power (X3) and
microwave power (X4) when X1, X2 and X5= 0.
To find the optimum point, a Matlab program was written by considering a
maximum specific volume and a minimum weight loss and a constraint of firmness
(0.25-0.75) and ΔE* values (31-39). Optimum values were shown in Table 3.6.
Table 3.6. The optimum coded and rounded uncoded values of the baking conditions
and formulations in infrared-microwave combination oven for gluten-free breads.
Independent variables
Optimum
coded value
Optimum rounded
uncoded value
Chestnut:rice flour ratio 0.33 46.50
Emulsifier content (%) 0.46 0.62
Infrared power (%) -2 40
Microwave power (%) -2 30
Time (min) -2 9
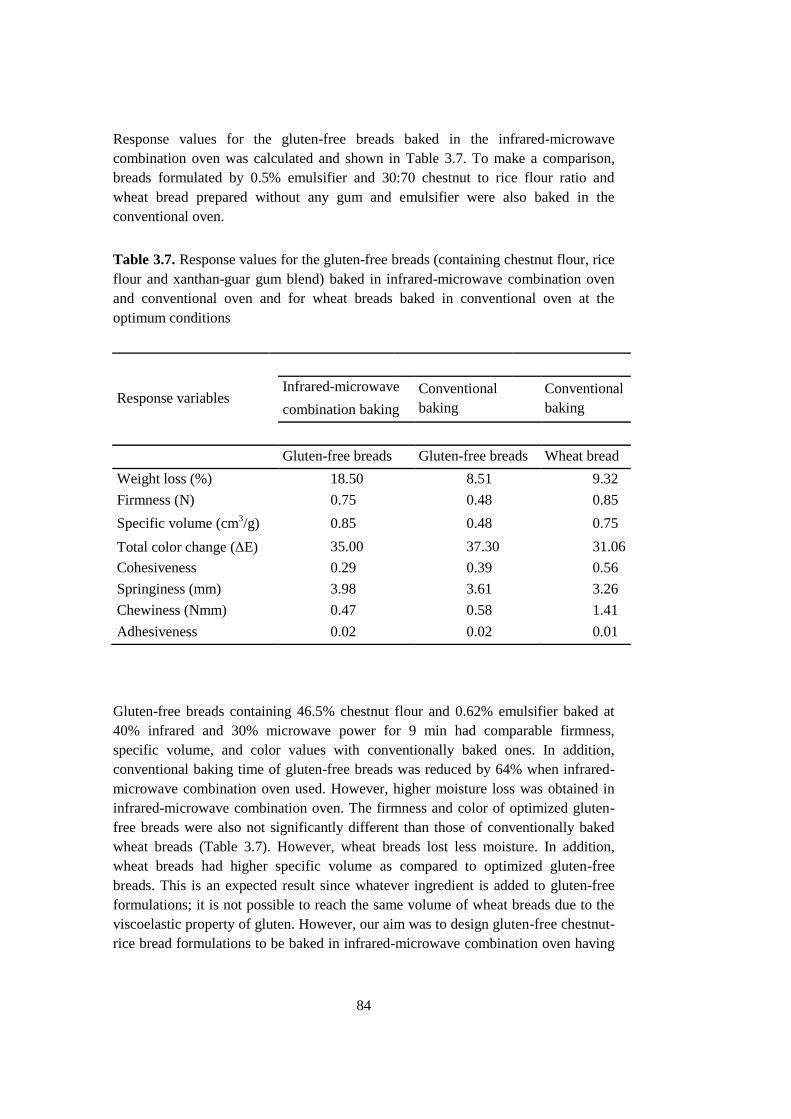
84
Response values for the gluten-free breads baked in the infrared-microwave
combination oven was calculated and shown in Table 3.7. To make a comparison,
breads formulated by 0.5% emulsifier and 30:70 chestnut to rice flour ratio and
wheat bread prepared without any gum and emulsifier were also baked in the
conventional oven.
Table 3.7. Response values for the gluten-free breads (containing chestnut flour, rice
flour and xanthan-guar gum blend) baked in infrared-microwave combination oven
and conventional oven and for wheat breads baked in conventional oven at the
optimum conditions
Response variables Infrared-microwave Conventional
baking
Conventional
baking combination baking
Gluten-free breads Gluten-free breads Wheat bread
Weight loss (%) 18.50 8.51 9.32
Firmness (N) 0.75 0.48 0.85
Specific volume (cm3/g) 0.85 0.48 0.75
Total color change (E) 35.00 37.30 31.06
Cohesiveness 0.29 0.39 0.56
Springiness (mm) 3.98 3.61 3.26
Chewiness (Nmm) 0.47 0.58 1.41
Adhesiveness 0.02 0.02 0.01
Gluten-free breads containing 46.5% chestnut flour and 0.62% emulsifier baked at
40% infrared and 30% microwave power for 9 min had comparable firmness,
specific volume, and color values with conventionally baked ones. In addition,
conventional baking time of gluten-free breads was reduced by 64% when infrared-
microwave combination oven used. However, higher moisture loss was obtained in
infrared-microwave combination oven. The firmness and color of optimized gluten-
free breads were also not significantly different than those of conventionally baked
wheat breads (Table 3.7). However, wheat breads lost less moisture. In addition,
wheat breads had higher specific volume as compared to optimized gluten-free
breads. This is an expected result since whatever ingredient is added to gluten-free
formulations; it is not possible to reach the same volume of wheat breads due to the
viscoelastic property of gluten. However, our aim was to design gluten-free chestnut-
rice bread formulations to be baked in infrared-microwave combination oven having
85
comparable quality with conventionally baked gluten-free breads not with wheat
breads.
3.4 Bread Quality of Gluten-free Tigernut-rice Bread Formulations
The effects of different tigernut:rice flour ratios (0:100, 5:95, 10:90, 15:85, 20:80 and
25:75) on quality of gluten-free bread formulations baked in infrared-microwave
combination and conventional ovens were determined.
The weight loss of breads baked in conventional and infrared-microwave
combination ovens are shown in Figure 3.27. Significantly higher weight losses were
obtained for breads baked in infrared-microwave combination oven (16.3±1.12%-
28.7±1.73%) as compared to the ones baked conventionally (7.7±0.91%-
13.8±1.60%) (p 0.05) (Figure 3.27) (Table A. 18). This is similar to the results
obtained in Table 3.7. When bread formulations were compared, the highest weight
loss was obtained in %100 rice breads. The absence of fiber in rice breads resulted in
high weight loss. However, partial replacement of rice flour by tigernut flour (from
0:100 to 20:80) significantly decreased the weight loss of breads baked in infrared-
microwave combination oven (p0.05). This is similar to the results obtained by
chestnut flour (Figure 3.21). Tigernut flour addition was effective up to 10% in
conventionally baked breads (p0.05). The reduction in the weight loss of breads
(from 13.8±1.60% to 7.7±0.91%) with increasing tigernut:rice flour ratios (from
0:100 to 10:90) may be probably due to the increase in fiber contents of the
formulations since the hydroxyl groups of fiber molecules allow water interaction
(Sabanis et al., 2009). Many studies investigated to determine the functionality of
fiber on the quality of baked products and it was reported that the quality of products
may be improved by addition of certain amount of fiber (Pomeranz et al., 1977;
Sabanis et al., 2009). It was also found that substitution of a certain amount of flour
such as tigernut flour (Ade-Omowaye et al., 2008; Chinma et al., 2010) may enhance
the quality of wheat products due to their fiber content.
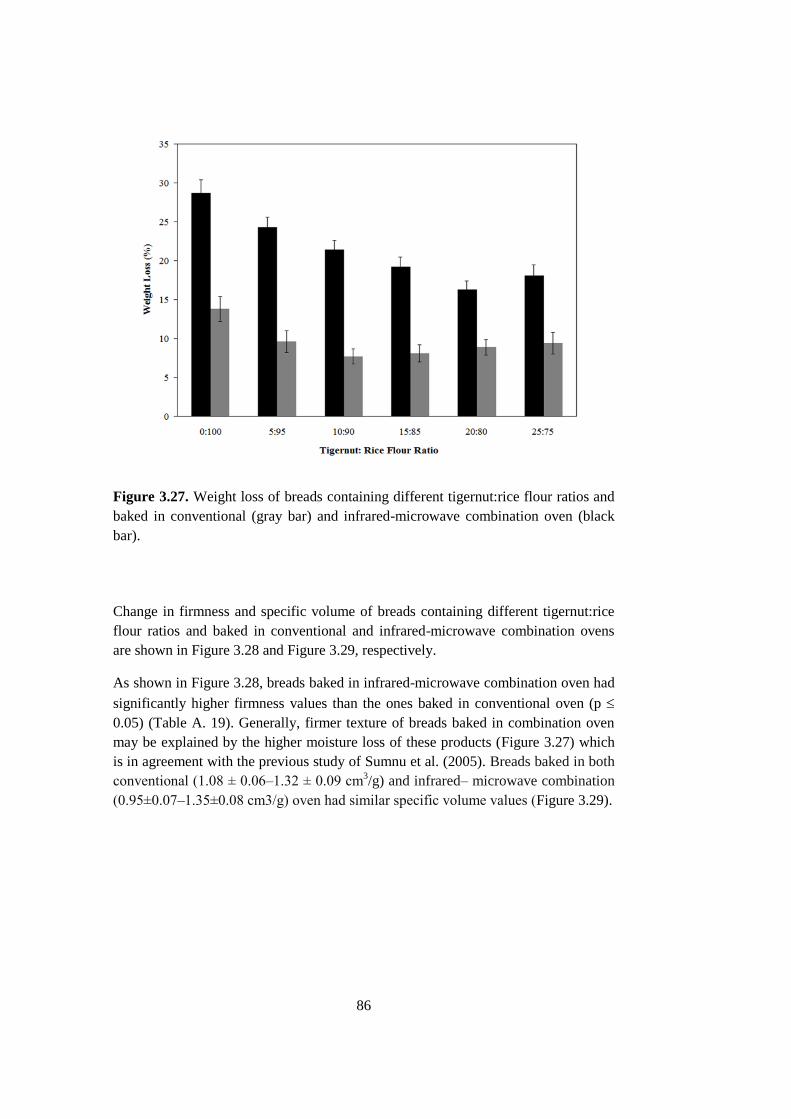
86
Figure 3.27. Weight loss of breads containing different tigernut:rice flour ratios and
baked in conventional (gray bar) and infrared-microwave combination oven (black
bar).
Change in firmness and specific volume of breads containing different tigernut:rice
flour ratios and baked in conventional and infrared-microwave combination ovens
are shown in Figure 3.28 and Figure 3.29, respectively.
As shown in Figure 3.28, breads baked in infrared-microwave combination oven had
significantly higher firmness values than the ones baked in conventional oven (p
0.05) (Table A. 19). Generally, firmer texture of breads baked in combination oven
may be explained by the higher moisture loss of these products (Figure 3.27) which
is in agreement with the previous study of Sumnu et al. (2005). Breads baked in both
conventional (1.08 ± 0.06–1.32 ± 0.09 cm3/g) and infrared– microwave combination
(0.95±0.07–1.35±0.08 cm3/g) oven had similar specific volume values (Figure 3.29).
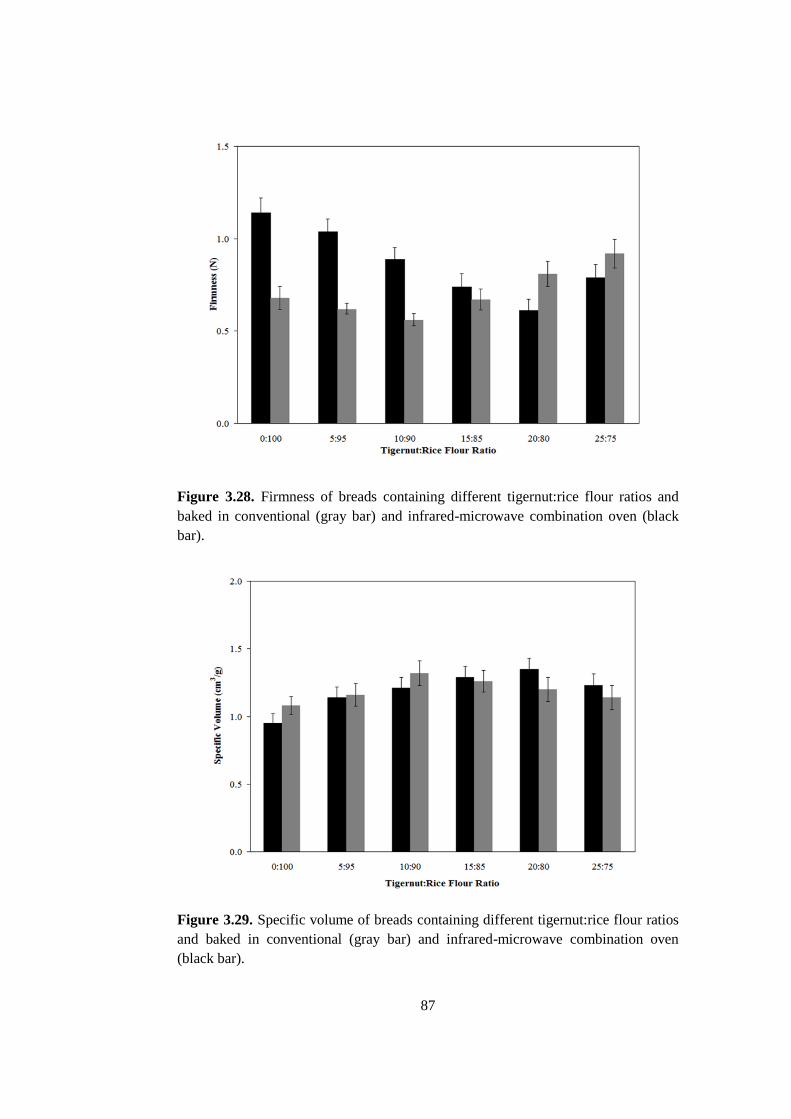
87
Figure 3.28. Firmness of breads containing different tigernut:rice flour ratios and
baked in conventional (gray bar) and infrared-microwave combination oven (black
bar).
Figure 3.29. Specific volume of breads containing different tigernut:rice flour ratios
and baked in conventional (gray bar) and infrared-microwave combination oven
(black bar).
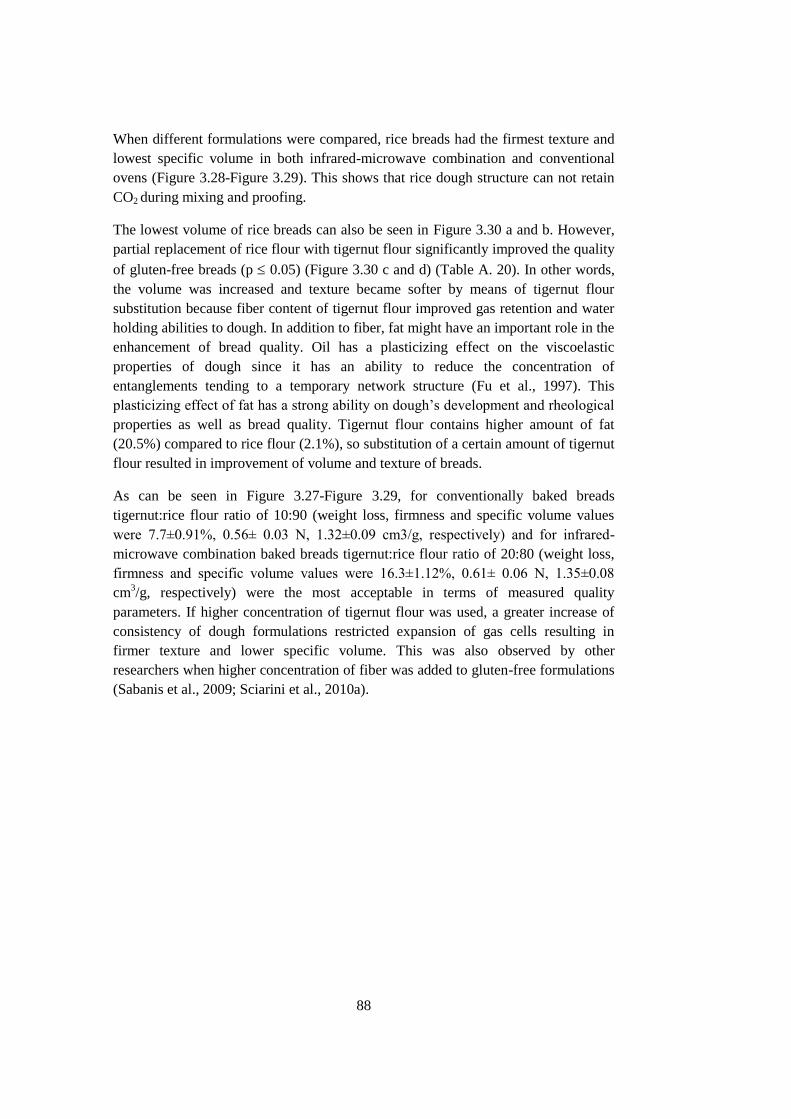
88
When different formulations were compared, rice breads had the firmest texture and
lowest specific volume in both infrared-microwave combination and conventional
ovens (Figure 3.28-Figure 3.29). This shows that rice dough structure can not retain
CO2 during mixing and proofing.
The lowest volume of rice breads can also be seen in Figure 3.30 a and b. However,
partial replacement of rice flour with tigernut flour significantly improved the quality
of gluten-free breads (p 0.05) (Figure 3.30 c and d) (Table A. 20). In other words,
the volume was increased and texture became softer by means of tigernut flour
substitution because fiber content of tigernut flour improved gas retention and water
holding abilities to dough. In addition to fiber, fat might have an important role in the
enhancement of bread quality. Oil has a plasticizing effect on the viscoelastic
properties of dough since it has an ability to reduce the concentration of
entanglements tending to a temporary network structure (Fu et al., 1997). This
plasticizing effect of fat has a strong ability on dough’s development and rheological
properties as well as bread quality. Tigernut flour contains higher amount of fat
(20.5%) compared to rice flour (2.1%), so substitution of a certain amount of tigernut
flour resulted in improvement of volume and texture of breads.
As can be seen in Figure 3.27-Figure 3.29, for conventionally baked breads
tigernut:rice flour ratio of 10:90 (weight loss, firmness and specific volume values
were 7.7±0.91%, 0.56± 0.03 N, 1.32±0.09 cm3/g, respectively) and for infrared-
microwave combination baked breads tigernut:rice flour ratio of 20:80 (weight loss,
firmness and specific volume values were 16.3±1.12%, 0.61± 0.06 N, 1.35±0.08
cm3/g, respectively) were the most acceptable in terms of measured quality
parameters. If higher concentration of tigernut flour was used, a greater increase of
consistency of dough formulations restricted expansion of gas cells resulting in
firmer texture and lower specific volume. This was also observed by other
researchers when higher concentration of fiber was added to gluten-free formulations
(Sabanis et al., 2009; Sciarini et al., 2010a).
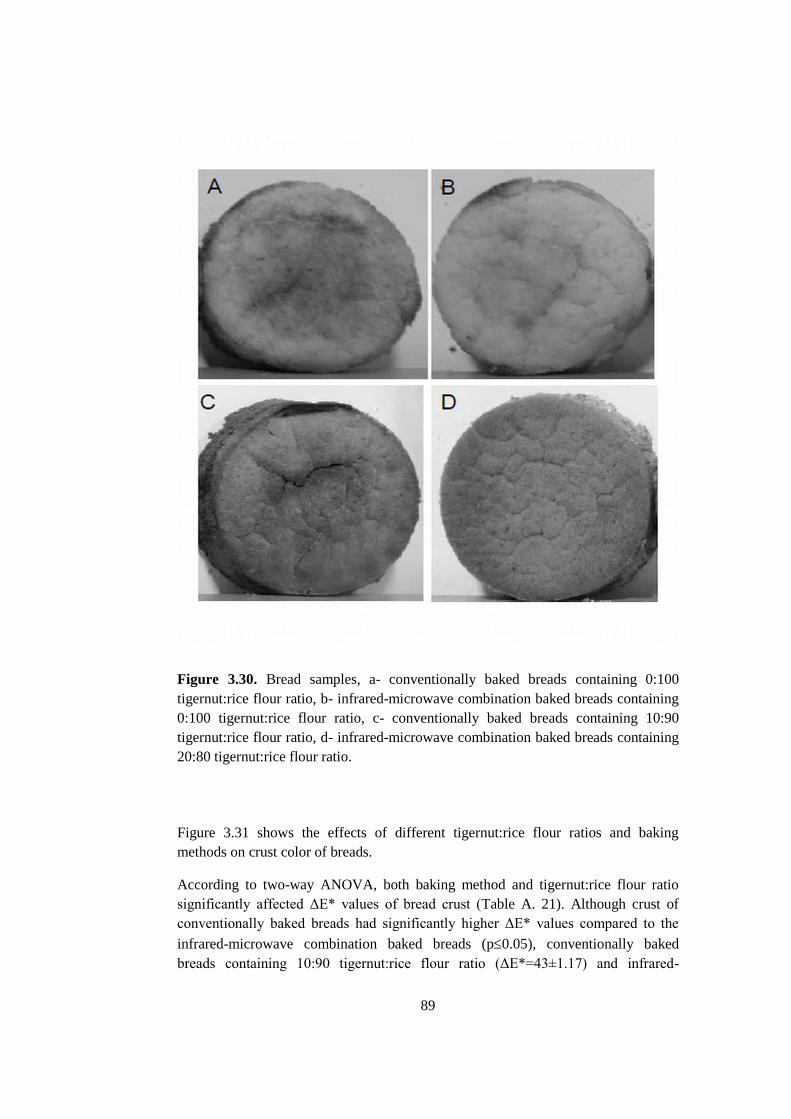
89
Figure 3.30. Bread samples, a- conventionally baked breads containing 0:100
tigernut:rice flour ratio, b- infrared-microwave combination baked breads containing
0:100 tigernut:rice flour ratio, c- conventionally baked breads containing 10:90
tigernut:rice flour ratio, d- infrared-microwave combination baked breads containing
20:80 tigernut:rice flour ratio.
Figure 3.31 shows the effects of different tigernut:rice flour ratios and baking
methods on crust color of breads.
According to two-way ANOVA, both baking method and tigernut:rice flour ratio
significantly affected ΔE* values of bread crust (Table A. 21). Although crust of
conventionally baked breads had significantly higher ΔE* values compared to the
infrared-microwave combination baked breads (p0.05), conventionally baked
breads containing 10:90 tigernut:rice flour ratio (ΔE*=43±1.17) and infrared-
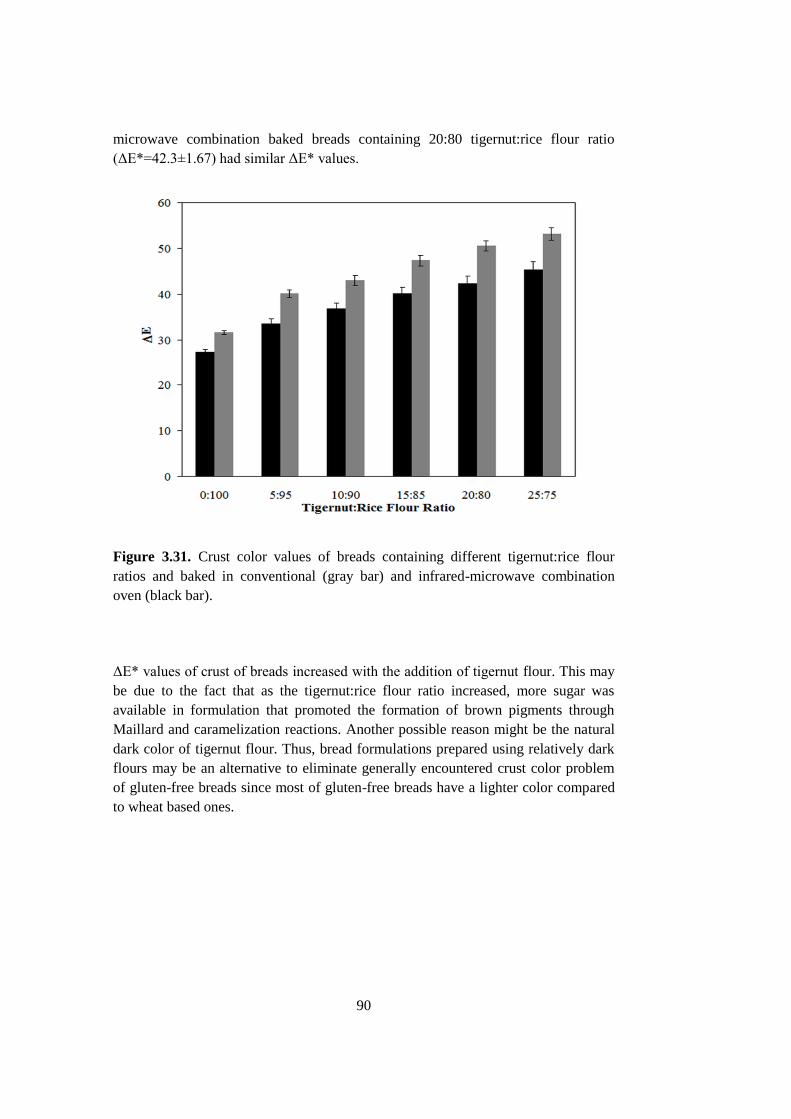
90
microwave combination baked breads containing 20:80 tigernut:rice flour ratio
(ΔE*=42.3±1.67) had similar ΔE* values.
Figure 3.31. Crust color values of breads containing different tigernut:rice flour
ratios and baked in conventional (gray bar) and infrared-microwave combination
oven (black bar).
ΔE* values of crust of breads increased with the addition of tigernut flour. This may
be due to the fact that as the tigernut:rice flour ratio increased, more sugar was
available in formulation that promoted the formation of brown pigments through
Maillard and caramelization reactions. Another possible reason might be the natural
dark color of tigernut flour. Thus, bread formulations prepared using relatively dark
flours may be an alternative to eliminate generally encountered crust color problem
of gluten-free breads since most of gluten-free breads have a lighter color compared
to wheat based ones.
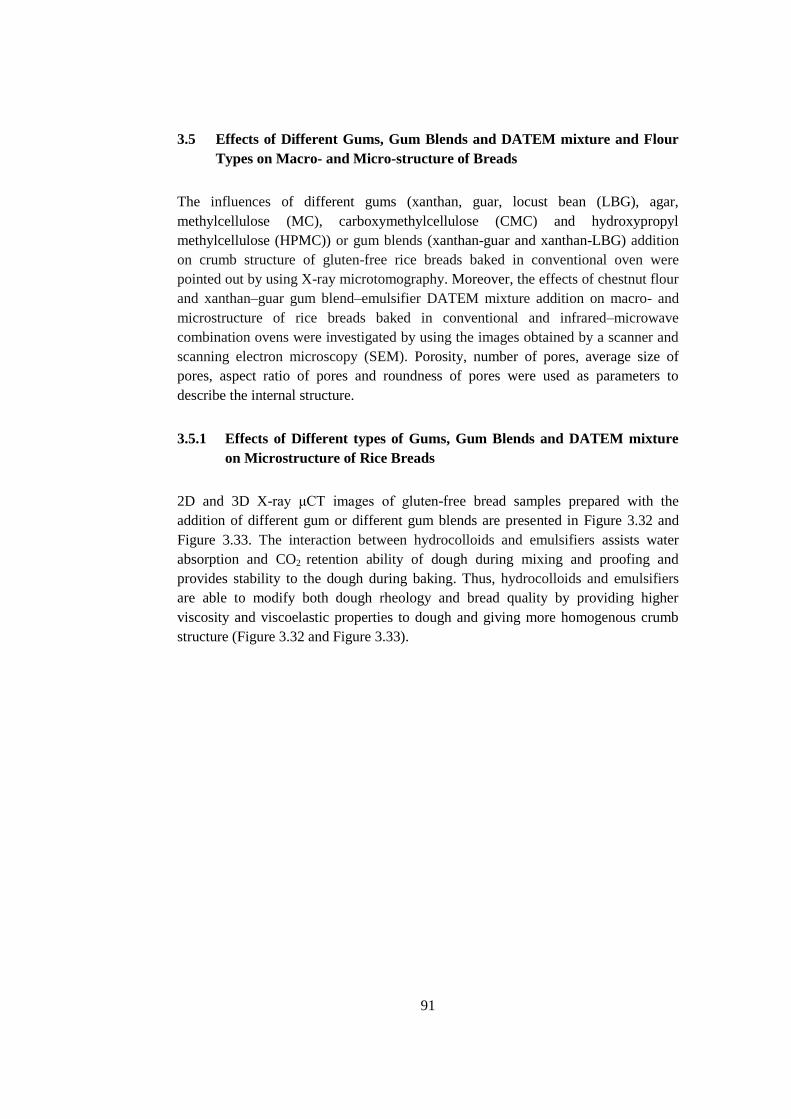
91
3.5 Effects of Different Gums, Gum Blends and DATEM mixture and Flour
Types on Macro- and Micro-structure of Breads
The influences of different gums (xanthan, guar, locust bean (LBG), agar,
methylcellulose (MC), carboxymethylcellulose (CMC) and hydroxypropyl
methylcellulose (HPMC)) or gum blends (xanthan-guar and xanthan-LBG) addition
on crumb structure of gluten-free rice breads baked in conventional oven were
pointed out by using X-ray microtomography. Moreover, the effects of chestnut flour
and xanthan–guar gum blend–emulsifier DATEM mixture addition on macro- and
microstructure of rice breads baked in conventional and infrared–microwave
combination ovens were investigated by using the images obtained by a scanner and
scanning electron microscopy (SEM). Porosity, number of pores, average size of
pores, aspect ratio of pores and roundness of pores were used as parameters to
describe the internal structure.
3.5.1 Effects of Different types of Gums, Gum Blends and DATEM mixture
on Microstructure of Rice Breads
2D and 3D X-ray μCT images of gluten-free bread samples prepared with the
addition of different gum or different gum blends are presented in Figure 3.32 and
Figure 3.33. The interaction between hydrocolloids and emulsifiers assists water
absorption and CO2 retention ability of dough during mixing and proofing and
provides stability to the dough during baking. Thus, hydrocolloids and emulsifiers
are able to modify both dough rheology and bread quality by providing higher
viscosity and viscoelastic properties to dough and giving more homogenous crumb
structure (Figure 3.32 and Figure 3.33).
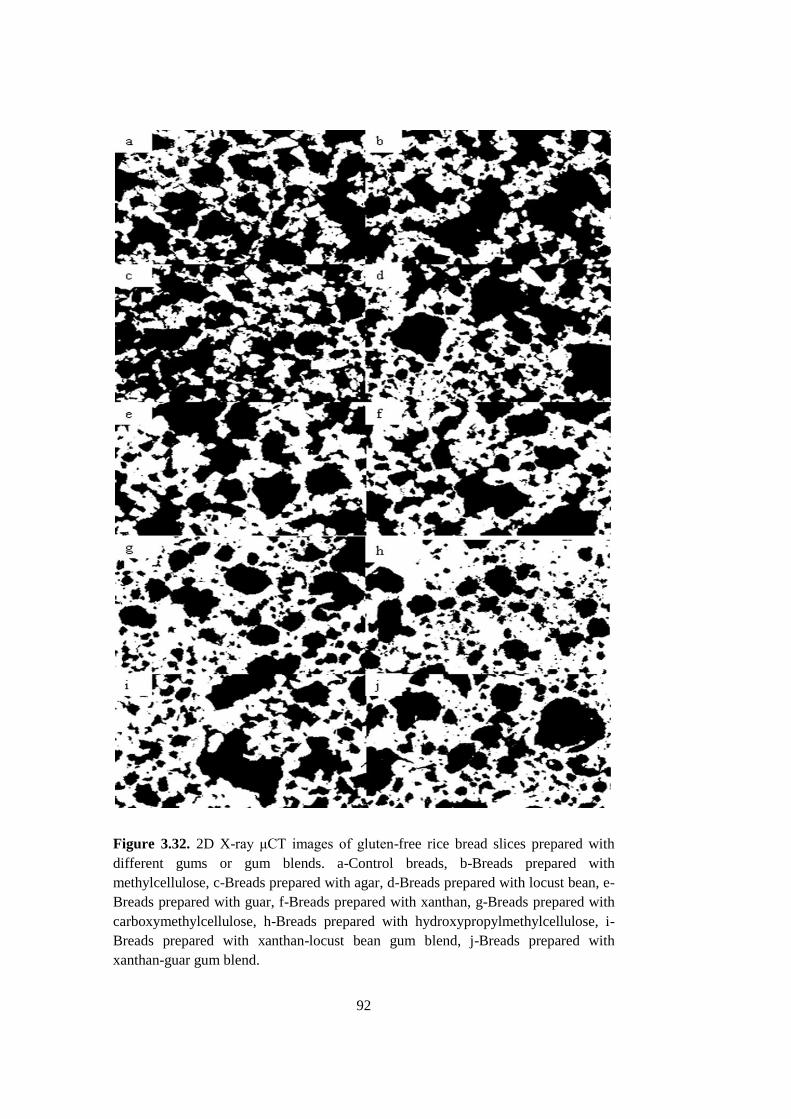
92
Figure 3.32. 2D X-ray μCT images of gluten-free rice bread slices prepared with
different gums or gum blends. a-Control breads, b-Breads prepared with
methylcellulose, c-Breads prepared with agar, d-Breads prepared with locust bean, e-
Breads prepared with guar, f-Breads prepared with xanthan, g-Breads prepared with
carboxymethylcellulose, h-Breads prepared with hydroxypropylmethylcellulose, i-
Breads prepared with xanthan-locust bean gum blend, j-Breads prepared with
xanthan-guar gum blend.
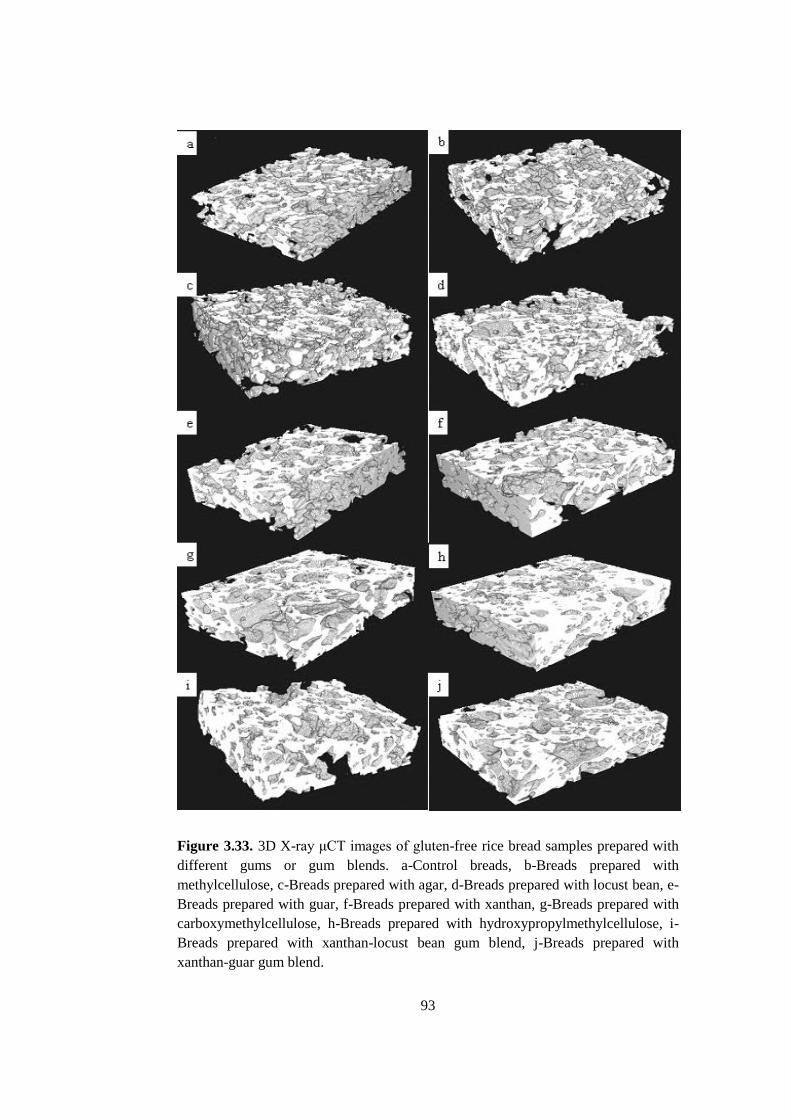
93
Figure 3.33. 3D X-ray μCT images of gluten-free rice bread samples prepared with
different gums or gum blends. a-Control breads, b-Breads prepared with
methylcellulose, c-Breads prepared with agar, d-Breads prepared with locust bean, e-
Breads prepared with guar, f-Breads prepared with xanthan, g-Breads prepared with
carboxymethylcellulose, h-Breads prepared with hydroxypropylmethylcellulose, i-
Breads prepared with xanthan-locust bean gum blend, j-Breads prepared with
xanthan-guar gum blend.
94
Crumb structure of breads prepared with MC and agar showed similarity with control
bread crumb structure. Pores within the food materials can be classified as closed
pores that are closed from all sides, blind pores that with one end closed, open pores
where the flow characteristically takes places (Sahin and Sumnu, 2006; Datta et al,
2007). As depicted in Figure 3.32a-c and Figure 3.33a-c, control breads and breads
prepared with MC and agar had a very open sponge-like structure. As compared to
crumb structures of other breads, the higher amounts of pores in these breads were
interconnected with other pores that indicated their heterogeneous structure with lots
of void spaces (open pores). The types of pores and the distribution of pores greatly
affected appearance of crumb structure, hence quality of breads (Datta et al., 2007).
In a very recent study of Wang et al. (2011), the critical role of open and closed pores
on the shape and texture of bakery products have been reported. It has been stated
that non-uniform distribution of open pores as well as wide distribution of closed
cells in breads might cause the total or partial collapse of breads when they are taken
out of the oven. The role of the viscosity and viscoelastic properties on crumb
structure cannot also be ignored. Our previous findings demonstrated that in the lack
of additives, the viscoelastic properties of control rice dough was not high enough to
provide sufficient bubble stability during fermentation and baking process (Figure
3.7 and Figure 3.11). Thus, control rice breads had undesirable appearance with non-
uniform crumb structure and very large pores. It was visually observed that neither
MC nor agar was capable of providing high viscosity and viscoelastic structure to
dough during mixing. This might be the other reason for their undesirable,
heterogeneous crumb appearance with non-uniformly distributed void spaces (Figure
3.32 a-c and Figure 3.33 a-c). In the presence of additives except MC and agar,
gluten-free breads had relatively finer crumb structure with their smaller pores
(Figure 3.32 a-c and Figure 3.33 a-c). The presence of relatively higher number of
small pores might be provided by the capture of more gas bubbles and moisture in
their closed pores (Figure 3.32 d-j and Figure 3.33 d-j). In addition, the presence of
these additives might have provided sufficient viscosity and viscoelastic properties to
dough samples that provided bubble capture and stability during baking (Mettler and
Seibel, 1993; Guarda et al., 2004; Lazaridou et al., 2007; Sciarini et al., 2010b).
Porosity, number of pores, averages size of pores, aspect ratio and roundness values
of pores were also studied with X-ray μCT (Table 3.8 and Table 3.9). One-way
ANOVA results showed that porosity, number of pores and averages size of pores
were significantly affected by the addition of different gums (p≤0.05), while the
differences in aspect ratio and roundness values of pores for breads prepared with
different formulations were found to be not statistically different (Table A. 22-Table
A. 26). Recent studies have showed that porosity measurement is not a property that
can be used to describe pore structure since it does not give any information about
whether pores are distributed homogenously or heterogeneously (Falcone et al.,
2004; Gonzales-Barron and Butler, 2008). However, appearance of bread crumb can
be efficiently quantified and qualified by X-ray μCT since it gives more detailed
95
inside information about homogeneity and fineness of crumb structure by providing
2-D or 3-D images.
Table 3.8. Porosity of the gluten-free rice bread samples prepared with different gum
or gum blends of identical size (~ 0.688cm3). Formulations having different letters (a,
b and c) are significantly different (p≤0.05).
Gluten-free Porosity
bread samples
Control 0.568a
MCd 0.629
a
Ae 0.602
a
LBGf 0.539
b
Gg 0.510
b
Xh 0.453
c
CMCi 0.471
c
HPMCj 0.382
c
X-LBG 0.502c
X-G 0.423c
dMethylcellulose,
eAgar,
fLocust bean gum,
gGuar gum ,
hXanthan,
iCarboxymethylcellulose,
jHydroxypropyl methylcellulose
Table 3.9. Quantification of the porous structure per slice thickness (0.036mm) of
the gluten-free rice bread samples prepared with different gums or gum blends.
Formulations having different letters (a, b and c) are significantly different (p≤0.05).
Gluten-free
bread samples
Number of pores
per 1.85cm2 area
Aspect ratio
of the pore
Roundness of
the pore
Average size of
the pore (cm2)
Control 8.56c 1.810
a 0.597
a 0.165
a
MC 5.10c 1.782
a 0.609
a 0.298
a
A 3.99c 1.723
a 0.637
a 0.478
a
LBG 11.0b 1.909
a 0.583
a 0.088
b
G 11.4b 1.949
a 0.559
a 0.083
b
X 13.9a 1.942
a 0.577
a 0.055
c
CMC 15.5a 1.835
a 0.597
a 0.050
c
HPMC 14.3a 1.814
a 0.601
a 0.040
c
X-LBG 12.3a 1.890
a 0.583
a 0.071
b
X-G 14.4a 1.855
a 0.592
a 0.047
c
Analysis was done in duplicate. Pores > 0.01 cm2 considered. Values are means of
100 slices.

96
As shown in Table 3.8 and Table 3.9, breads containing MC and agar and control
breads had the highest porosity values with their lowest number of pores. This result
also indicated their non-uniform crumb structure with very large pores. In the study
of Wang et al. (2011), it has been reported that extremely interconnected and open
pores of breads are responsible for 99% of bread’s total porosity. Thus, the highest
average areas of pores determined for these breads might be probably due to the
interconnection between all gas cells (Table 3.9, Figure 3.32 and Figure 3.33a-c). A
significant negative correlation between porosity and number of pores (r=-0.90) and
a positive correlation between porosity and average size of pores (r=0.80) also
exhibited the noticeable effect of void spaces on porosity of crumb structure. On the
other hand, the lowest porosity, the lowest average area of pores and the highest
number of pores were obtained for gluten-free breads prepared with the addition of
xanthan, CMC, xanthan-guar, xanthan-LBG and HPMC. Another negative
correlation was also observed between number of pores and average size of pores
(r=-0.94). This result showed that breads prepared with the addition of xanthan,
CMC, xanthan-LBG, xanthan-guar and HPMC had higher number of smaller pores
attributing to their finer crumb structure.
The aspect ratio of all the bread samples which expresses the relationship between
the width of the pore to its height was found to be under 2, indicating ellipsoidal
nature of the pores (Ishida et al., 2001). The roundness of pores in gluten-free bread
samples prepared with different additives was ranged between 0.559 and 0.637
indicating their non-circular shape.
3.5.2 Effects of Chestnut flour and Xanthan-guar gum blend-DATEM
Mixture Addition on Macro-structure of Rice Breads
Figure 3.34 shows the scanned images of gluten-free bread samples prepared with
different formulations and baked in different ovens. The scanned images of bread
samples prepared without additives and baked in different ovens are shown in Figure
3.34a, c, e and g. Breads formulated with rice flour and containing no gum and
DATEM had non-uniform and larger pores (Figure 3.34a). As explained before, this
might be due to the fact that the viscosity and viscoelastic properties of rice dough
was not sufficient to allow bubble capture during the fermentation and baking
process. The puffing effect of infrared-microwave combination baking was not
effective on the size and distribution of pores in rice bread crumb either (Figure
3.34e). Therefore, control rice breads had heterogeneous and coarser crumb with
very large pores (Figure 3.34a and e). On the other hand, in the presence of chestnut
flour, even in the absence of additives, large pores in bread crumb were prevented
(Figure 3.34c and g). As mentioned in section of 3.2.1, the higher fiber content of
chestnut flour enhanced the viscoelastic properties and resulted in entrapment of
more air bubbles which might be other reason of more uniform crumb structure with
small pores of chestnut flour containing breads. Moreover, using different baking
97
ovens resulted in noticeable differences in the size and distribution of pores of
chestnut-rice bread crumbs (Figure 3.34c and g). During infrared-microwave
combination heating, higher internal pressure and faster vaporization occurred inside
chestnut-rice breads that created a puffing effect. Therefore, among all gluten-free
breads prepared without additives, the most uniform structure with small pores was
obtained from breads prepared with using chestnut and rice flour and baked in
infrared-microwave combination oven (Figure 3.34g).
It has been shown that the benefit of hydrocolloids as dough stabilizers can be
promoted in the presence of surfactants (Bollain and Collar, 2004). This may be due
to the fact that the interaction between hydrocolloids and emulsifiers assists the
entrapment of air bubbles during mixing and fermentation process. While
hydrocolloids improve bread quality by increasing water absorption and viscoelastic
properties of dough (Kohajdova and Karovicova, 2009), emulsifiers lower the
surface tension of dough leading to the subdivision of the entrapped air bubbles into
more and smaller bubbles during mixing (Kokelaar et al., 1995; Ribotta et al.,
2004b). Consequently, in the presence of xanthan-guar gum blend-DATEM mixture,
the pores of gluten-free breads were smaller and more uniform in size (Figure 3.34b,
d, f and h). Among all gluten-free breads, the most homogenous structure was
obtained in the presence of chestnut flour, xanthan-guar gum blend-DATEM mixture
addition and infrared-microwave combination baking (Figure 3.34).
98
Figure 3.34. Scanned images of different gluten-free bread formulations baked in
different ovens. a- Rice bread baked in conventional oven, b-Rice bread containing
xanthan-guar gum blend-DATEM mixture and baked in conventional oven, c-
Chestnut-rice breads baked in conventional oven, d-Chestnut-rice bread containing
xanthan-guar gum blend-DATEM mixture and baked in conventional oven. e- Rice
bread baked in infrared-microwave combination oven, f-Rice bread containing
xanthan-guar gum blend-DATEM mixture and baked in infrared-microwave
combination oven, g-Chestnut-rice breads baked ininfrared-microwave combination,
h-Chestnut-rice bread containing xanthan-guar gum blend-DATEM mixture and
baked in infrared-microwave combination.
99
Figure 3.35. Based on scanned images, pore area fractions of different gluten-free
bread formulations baked in conventional (gray bar) and infrared-microwave
combination oven (black bar). (RB: Rice bread, RB-X-G-E: Rice bread containing
xanthan-guar gum blend-DATEM mixture, CRB: Chestnut-rice bread, CRB-X-G-
E:Chestnut-rice bread containing xanthan-guar gum blend-DATEM mixture).
Figure 3.35 shows the pore area fractions of gluten-free breads prepared with
different formulations and baked in different ovens based on scanned images.
According to two-way ANOVA, both gluten-free bread formulations and oven type
were found to be significantly effective on the pore area fractions of crumb structure
(p ≤ 0.05) (Table A. 27). The lowest pore area fraction values were obtained from
rice breads without any additives. In the absence of xanthan-guar gum blend-
DATEM mixture, rice dough had very low viscosity and viscoelastic moduli values,
which prevented entrapment of air bubbles resulting in low specific volume values
(Figure 3.13 and Figure 3.14). However, fiber content of chestnut flour provided
higher apparent viscosity and viscoelastic properties to dough. This property helped
entrapment of more air bubbles into chestnut flour containing dough and caused
higher specific volume values. Thus, chestnut flour containing breads had higher
pore area fractions as compared to rice breads.
As mentioned before, gums and emulsifiers have the ability to improve volume and
texture of breads by increasing water absorption and gas retention ability of dough
during mixing and fermentation process and by providing stability to the dough
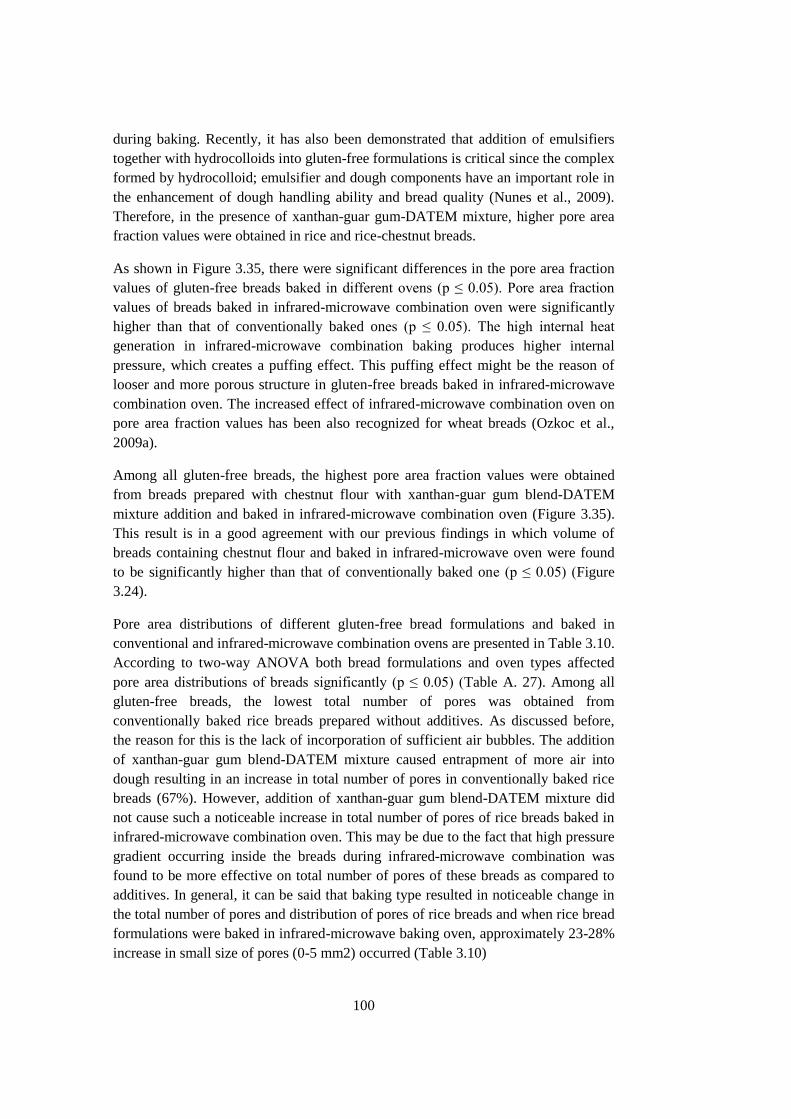
100
during baking. Recently, it has also been demonstrated that addition of emulsifiers
together with hydrocolloids into gluten-free formulations is critical since the complex
formed by hydrocolloid; emulsifier and dough components have an important role in
the enhancement of dough handling ability and bread quality (Nunes et al., 2009).
Therefore, in the presence of xanthan-guar gum-DATEM mixture, higher pore area
fraction values were obtained in rice and rice-chestnut breads.
As shown in Figure 3.35, there were significant differences in the pore area fraction
values of gluten-free breads baked in different ovens (p ≤ 0.05). Pore area fraction
values of breads baked in infrared-microwave combination oven were significantly
higher than that of conventionally baked ones (p ≤ 0.05). The high internal heat
generation in infrared-microwave combination baking produces higher internal
pressure, which creates a puffing effect. This puffing effect might be the reason of
looser and more porous structure in gluten-free breads baked in infrared-microwave
combination oven. The increased effect of infrared-microwave combination oven on
pore area fraction values has been also recognized for wheat breads (Ozkoc et al.,
2009a).
Among all gluten-free breads, the highest pore area fraction values were obtained
from breads prepared with chestnut flour with xanthan-guar gum blend-DATEM
mixture addition and baked in infrared-microwave combination oven (Figure 3.35).
This result is in a good agreement with our previous findings in which volume of
breads containing chestnut flour and baked in infrared-microwave oven were found
to be significantly higher than that of conventionally baked one (p ≤ 0.05) (Figure
3.24).
Pore area distributions of different gluten-free bread formulations and baked in
conventional and infrared-microwave combination ovens are presented in Table 3.10.
According to two-way ANOVA both bread formulations and oven types affected
pore area distributions of breads significantly (p ≤ 0.05) (Table A. 27). Among all
gluten-free breads, the lowest total number of pores was obtained from
conventionally baked rice breads prepared without additives. As discussed before,
the reason for this is the lack of incorporation of sufficient air bubbles. The addition
of xanthan-guar gum blend-DATEM mixture caused entrapment of more air into
dough resulting in an increase in total number of pores in conventionally baked rice
breads (67%). However, addition of xanthan-guar gum blend-DATEM mixture did
not cause such a noticeable increase in total number of pores of rice breads baked in
infrared-microwave combination oven. This may be due to the fact that high pressure
gradient occurring inside the breads during infrared-microwave combination was
found to be more effective on total number of pores of these breads as compared to
additives. In general, it can be said that baking type resulted in noticeable change in
the total number of pores and distribution of pores of rice breads and when rice bread
formulations were baked in infrared-microwave baking oven, approximately 23-28%
increase in small size of pores (0-5 mm2) occurred (Table 3.10)

101
As opposed to rice dough, chestnut flour containing dough could incorporate
sufficient amount of air bubbles during the mixing and fermentation process. Both
the presence of additives and baking type did not result in noticeable change in the
total number of pores of chestnut-rice breads. However, despite the slight differences
in total number of pores of chestnut-rice breads, high pressure during infrared-
microwave baking changed pore area distribution of chestnut-rice breads resulting in
approximately a 71% increase in the number of large pores (>10 mm2).
Pore roundness of the gluten-free bread samples were also determined by analyzing
the scanned images of crumbs and no significant difference was obtained in
roundness values of gluten-free breads (p ≤ 0.05) (Table A. 30). The roundness
values of pores were in between 0.61 and 0.67 showing that the pores in breads had
not circular shape.
Table 3.10. Pore area distribution of gluten-free breads prepared with different
formulations and baked in different ovens.
Number of Pores Oven Type RB-X-G-E RB CRB-X-G-E CRB
Range of Pore
Area (mm2)
Conventional
0-5
161 98 278 339
5-10
62 23 54 32
10-20
24 18 28 24
>20
3 11 1 5
Total number of
pores
Infrared-
microwave
combination
250 150 361 400
0-5
259 271 291 292
5-10
54 25 27 26
10-20
16 23 26 25
>20
0 5 17 19
Total number of
pores 329 324 361 362
RB: Rice bread, RB-X-G-E: Rice bread containing xanthan-guar gum blend-DATEM
mixture, CRB: Chestnut-rice breads, CRB-X-G-E: Chestnut-rice bread containing
xanthan-guar gum blend-DATEM mixture.
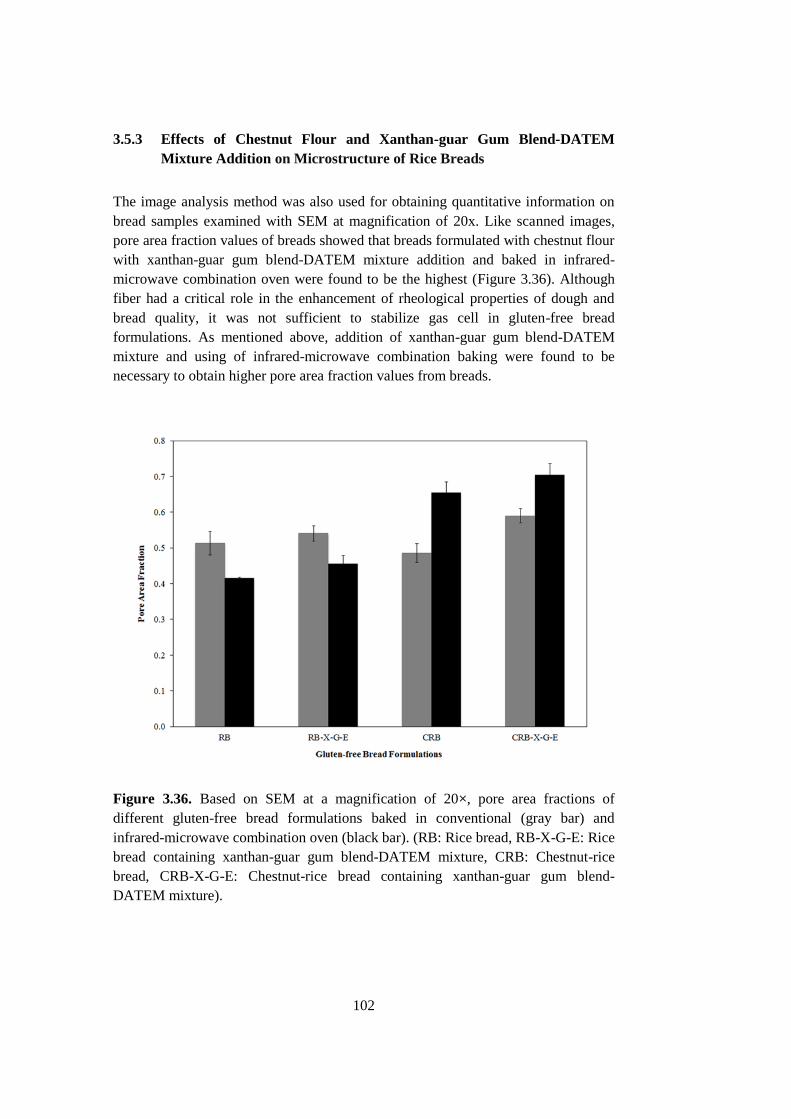
102
3.5.3 Effects of Chestnut Flour and Xanthan-guar Gum Blend-DATEM
Mixture Addition on Microstructure of Rice Breads
The image analysis method was also used for obtaining quantitative information on
bread samples examined with SEM at magnification of 20x. Like scanned images,
pore area fraction values of breads showed that breads formulated with chestnut flour
with xanthan-guar gum blend-DATEM mixture addition and baked in infrared-
microwave combination oven were found to be the highest (Figure 3.36). Although
fiber had a critical role in the enhancement of rheological properties of dough and
bread quality, it was not sufficient to stabilize gas cell in gluten-free bread
formulations. As mentioned above, addition of xanthan-guar gum blend-DATEM
mixture and using of infrared-microwave combination baking were found to be
necessary to obtain higher pore area fraction values from breads.
Figure 3.36. Based on SEM at a magnification of 20×, pore area fractions of
different gluten-free bread formulations baked in conventional (gray bar) and
infrared-microwave combination oven (black bar). (RB: Rice bread, RB-X-G-E: Rice
bread containing xanthan-guar gum blend-DATEM mixture, CRB: Chestnut-rice
bread, CRB-X-G-E: Chestnut-rice bread containing xanthan-guar gum blend-
DATEM mixture).
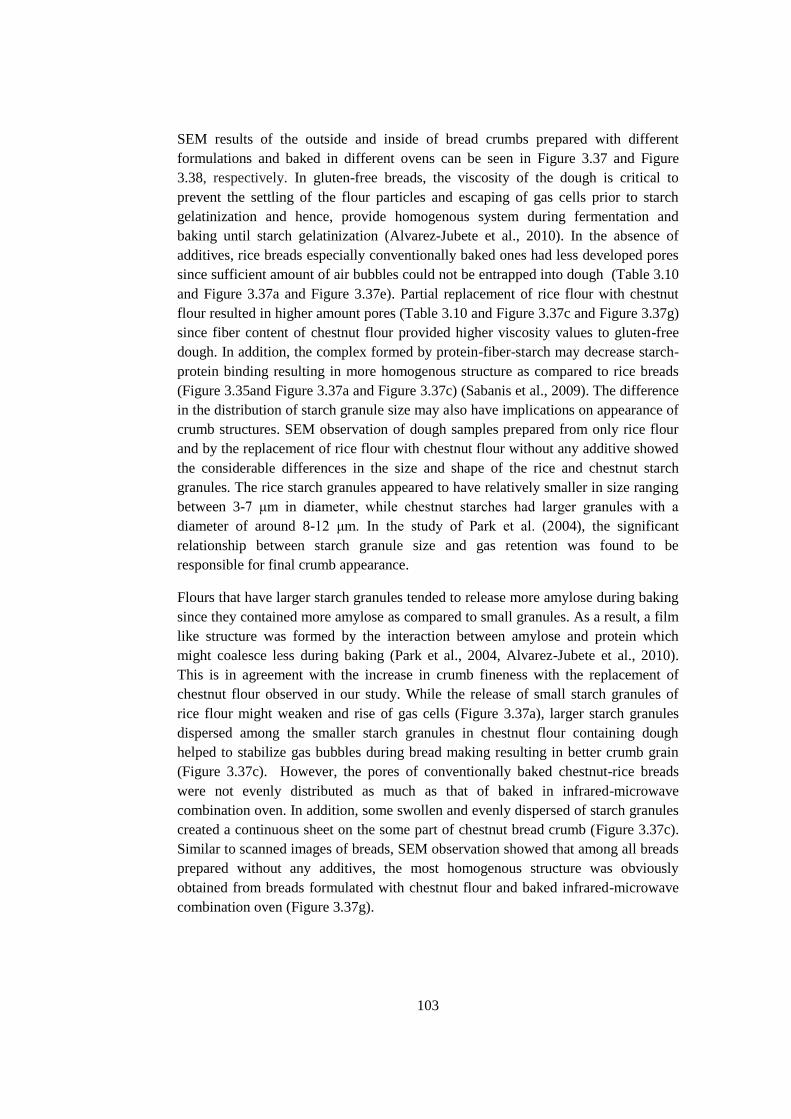
103
SEM results of the outside and inside of bread crumbs prepared with different
formulations and baked in different ovens can be seen in Figure 3.37 and Figure
3.38, respectively. In gluten-free breads, the viscosity of the dough is critical to
prevent the settling of the flour particles and escaping of gas cells prior to starch
gelatinization and hence, provide homogenous system during fermentation and
baking until starch gelatinization (Alvarez-Jubete et al., 2010). In the absence of
additives, rice breads especially conventionally baked ones had less developed pores
since sufficient amount of air bubbles could not be entrapped into dough (Table 3.10
and Figure 3.37a and Figure 3.37e). Partial replacement of rice flour with chestnut
flour resulted in higher amount pores (Table 3.10 and Figure 3.37c and Figure 3.37g)
since fiber content of chestnut flour provided higher viscosity values to gluten-free
dough. In addition, the complex formed by protein-fiber-starch may decrease starch-
protein binding resulting in more homogenous structure as compared to rice breads
(Figure 3.35and Figure 3.37a and Figure 3.37c) (Sabanis et al., 2009). The difference
in the distribution of starch granule size may also have implications on appearance of
crumb structures. SEM observation of dough samples prepared from only rice flour
and by the replacement of rice flour with chestnut flour without any additive showed
the considerable differences in the size and shape of the rice and chestnut starch
granules. The rice starch granules appeared to have relatively smaller in size ranging
between 3-7 μm in diameter, while chestnut starches had larger granules with a
diameter of around 8-12 μm. In the study of Park et al. (2004), the significant
relationship between starch granule size and gas retention was found to be
responsible for final crumb appearance.
Flours that have larger starch granules tended to release more amylose during baking
since they contained more amylose as compared to small granules. As a result, a film
like structure was formed by the interaction between amylose and protein which
might coalesce less during baking (Park et al., 2004, Alvarez-Jubete et al., 2010).
This is in agreement with the increase in crumb fineness with the replacement of
chestnut flour observed in our study. While the release of small starch granules of
rice flour might weaken and rise of gas cells (Figure 3.37a), larger starch granules
dispersed among the smaller starch granules in chestnut flour containing dough
helped to stabilize gas bubbles during bread making resulting in better crumb grain
(Figure 3.37c). However, the pores of conventionally baked chestnut-rice breads
were not evenly distributed as much as that of baked in infrared-microwave
combination oven. In addition, some swollen and evenly dispersed of starch granules
created a continuous sheet on the some part of chestnut bread crumb (Figure 3.37c).
Similar to scanned images of breads, SEM observation showed that among all breads
prepared without any additives, the most homogenous structure was obviously
obtained from breads formulated with chestnut flour and baked infrared-microwave
combination oven (Figure 3.37g).
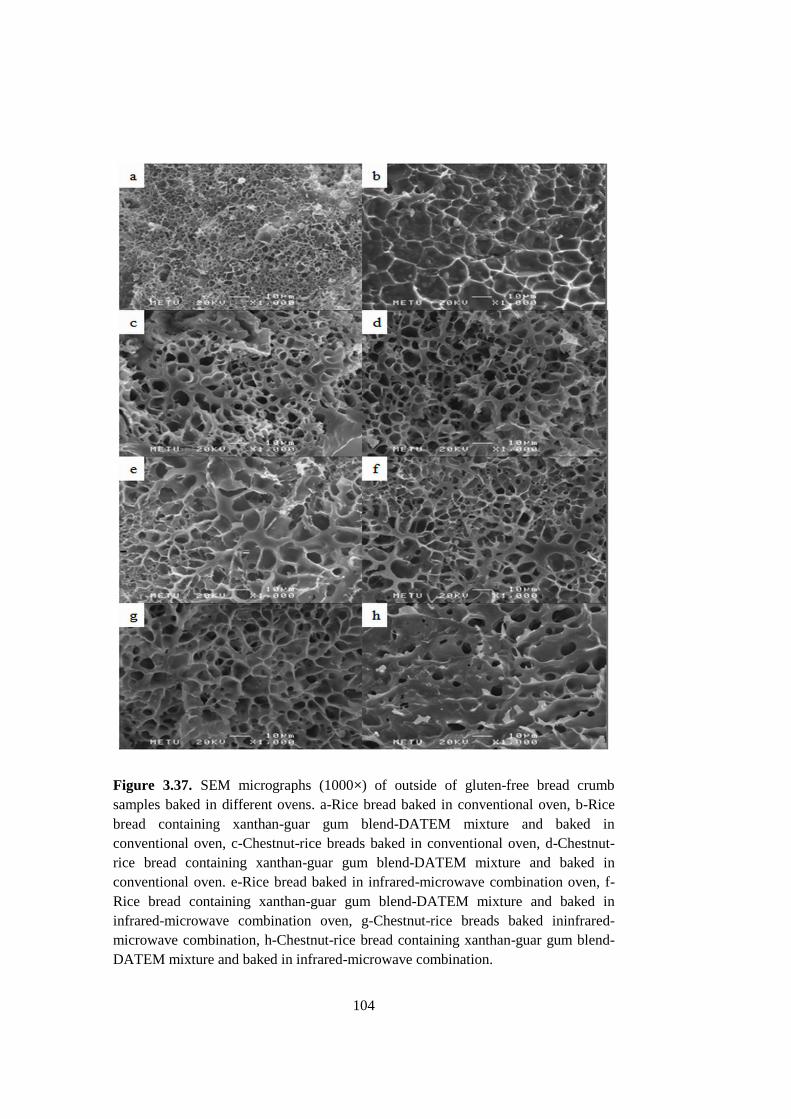
104
Figure 3.37. SEM micrographs (1000×) of outside of gluten-free bread crumb
samples baked in different ovens. a-Rice bread baked in conventional oven, b-Rice
bread containing xanthan-guar gum blend-DATEM mixture and baked in
conventional oven, c-Chestnut-rice breads baked in conventional oven, d-Chestnut-
rice bread containing xanthan-guar gum blend-DATEM mixture and baked in
conventional oven. e-Rice bread baked in infrared-microwave combination oven, f-
Rice bread containing xanthan-guar gum blend-DATEM mixture and baked in
infrared-microwave combination oven, g-Chestnut-rice breads baked ininfrared-
microwave combination, h-Chestnut-rice bread containing xanthan-guar gum blend-
DATEM mixture and baked in infrared-microwave combination.
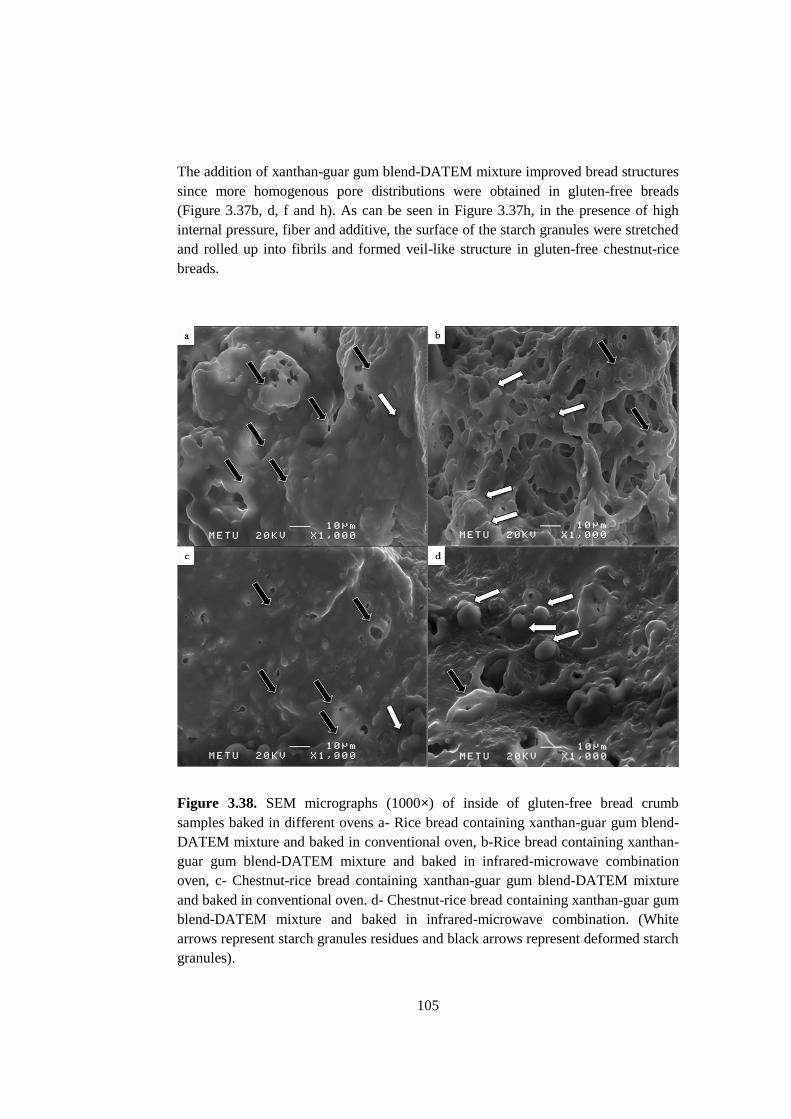
105
The addition of xanthan-guar gum blend-DATEM mixture improved bread structures
since more homogenous pore distributions were obtained in gluten-free breads
(Figure 3.37b, d, f and h). As can be seen in Figure 3.37h, in the presence of high
internal pressure, fiber and additive, the surface of the starch granules were stretched
and rolled up into fibrils and formed veil-like structure in gluten-free chestnut-rice
breads.
Figure 3.38. SEM micrographs (1000×) of inside of gluten-free bread crumb
samples baked in different ovens a- Rice bread containing xanthan-guar gum blend-
DATEM mixture and baked in conventional oven, b-Rice bread containing xanthan-
guar gum blend-DATEM mixture and baked in infrared-microwave combination
oven, c- Chestnut-rice bread containing xanthan-guar gum blend-DATEM mixture
and baked in conventional oven. d- Chestnut-rice bread containing xanthan-guar gum
blend-DATEM mixture and baked in infrared-microwave combination. (White
arrows represent starch granules residues and black arrows represent deformed starch
granules).
106
According to inside bread crumb images obtained at 1000× magnifications, breads
baked in conventional and infrared-microwave combination ovens had granular and
deformed starch together (Figure 3.38). However, breads prepared with both rice and
chestnut flour and baked in infrared-microwave combination oven had more granular
residues (Figure 3.38d). Furthermore, the starch granules in these breads did not lose
their identity and did not disintegrate completely. Incomplete disintegration of starch
granules may be due to the fact that shorter processing time that affects swelling and
gelatinization. Sakıyan and coworkers (2011) found that gelatinization degrees in
cakes baked infrared-microwave combination (85-93%) were found to be lower than
that in conventionally baked cakes (70-90%). Higher fiber and sugar content of flour
are also effective in incomplete disintegration of starch granules. Higher fiber content
and sugar content in chestnut flour might increase gelatinization temperatures
resulting in hindering of starch gelatinization during baking. Thus, in the presence of
both chestnut flour and infrared-microwave combination baking, more granular
residues were obtained.
3.6 Effect of Xanthan-guar Gum Blend-DATEM Mixture and Chestnut flour
on Staling of Gluten-free Rice Breads
The effects of chestnut flour and a xanthan-guar gum blend-DATEM mixture on
staling of gluten-free rice breads baked in conventional and infrared-microwave
combination ovens were studied. Staling properties of the bread were assessed using
moisture measurements, mechanical compression, differential scanning calorimetry
(DSC), X-ray diffraction, and fourier transform infrared spectroscopy (FT-IR).
3.6.1 Moisture content
Moisture contents of bread samples were significantly affected by storage time, oven
type, and formulations (p ≤ 0.05) (Table 3.11). Significantly lower moisture content
were obtained in breads stored at longer times, breads baked in infrared-microwave
combination oven and breads prepared without chestnut flour and xanthan-guar gum
blend-DATEM mixture (p ≤ 0.05) (Table A. 31 and Table A. 32).
During storage, moisture is transferred from the crumb to the crust causing a
reduction in crumb moisture due to the difference in vapor pressures (Sabanis et al.,
2009). Thus, the lowest moisture losses were obtained in breads stored at shortest
time. In Table 3.11, it can be noted that fresh bread samples lost moisture most
rapidly during the first day of storage. After 24 h aging, moisture loss of bread crumb
changed slowly.
In infrared-microwave combination baking, the dominant mechanism is microwave
heating. During microwave heating, the greater interior pressure and the higher
moisture concentration gradient result in an increase in the diffusion of water through
107
the bread. Thus, significantly higher moisture losses were obtained from breads
baked in infrared-microwave combination oven (p ≤ 0.05), which is in agreements
with Figure 3.27 and Table 3.7.
As illustrated in Table 3.11, significantly higher moisture contents were obtained in
breads containing chestnut flour and xanthan-guar gum blend-DATEM mixture
(CRB-X-G-E), at all storage time and for both oven types, signifying lower water
loss. As discussed before, the water binding ability of fiber and gums prevents water
loss during storage and with the possible hydrogen bonding between fiber and starch
and gums and starch that delay the starch retrogradation (Sabanis et al., 2009).
Table 3.11. Moisture content of gluten-free bread formulations baked in
conventional and infrared-microwave combination ovens at different storage times
Storage
Time (h) Oven Type RB-X-G-E RB CRB-X-G-E CRB
Conventional
1
49.5±0.13 47.5±0.12 54.7±0.13 52.3±0.14
24
47.8±0.19 45.7±0.14 51.3±0.09 48.0±0.12
48
46.6±0.16 44.1±0.17 49.9±0.11 47.4±0.10
72
46.1±0.10 43.6±0.14 49.2±0.14 46.7±0.13
96
45.9±0.08 43.4±0.12 48.9±0.12 46.5±0.17
Infrared-
microwave
combination
1
47.9±0.15 46.2±0.11 52.4±0.14 49.4±0.15
24
46.0±0.13 44.8±0.10 49.9±0.12 47.6±0.18
48
45.5±0.11 44.4±0.08 48.8±0.14 45.9±0.16
72
45.1±0.12 44.1±0.13 48.4±0.12 45.5±0.14
96 44.8±0.14 43.6±0.09 48.2±0.16 45.3±0.18
RB: Rice bread, RB-X-G-E: Rice bread containing xanthan-guar gum blend-DATEM
mixture, CRB: Chestnut-rice bread, which was prepared by replacement of 30% or
46% of rice flour with chestnut flour, CRB-X-G-E: Chestnut-rice bread which was
prepared by replacement of 30% or 46% of rice flour with chestnut flour and
containing xanthan-guar gum blend-DATEM mixture.
108
3.6.2 Firmness
Effects of storage time, oven type and gluten-free bread formulations on firmness
values of breads were found to be statistically significant (p≤ 0.05) (Figure 3.39 and
Figure 3.40) (Table A. 33 and Table A. 34). The firmness values of all breads
increased linearly during storage (r2=0.93-0.98) following zero order kinetics. The
rate constant was the highest for rice breads prepared without additives and baked in
conventional and infrared-microwave combination oven (0.060 N/day). The rate
constant for chestnut-rice breads prepared with additives and baked in both ovens
were the lowest (0.041 N/day).
Fast staling (increase in firmness) is one of the quality problems associated with
gluten-free breads. Obviously, starch is the main cause of staling in gluten-free
breads. Researchers have tried to identify the roles of amylose and amylopectin in
staling. Ghiasi et al. (1984) found that firming of breads was not only as a result of
amylopectin retrogradation, but also due to leaching out of the amylose granules.
Upon cooling, amylose retrogradation occurs very fast and helps to stabilize the
crumb. Thus, the formation of ordered amylose structure in the center of the
gelatinized granules might be attributed to initial firming of breads due to its rapid
retrogradation. In contrast, amylopectin retrogradation is slower and seems to be the
critical factor for the aspects of staling like crumb firming and loss of elasticity. In
addition to starch, the role of water on either the firming of crust and/or the
retrogradation process cannot be ignored. In bread, water behaves as a plasticizer for
the amorphous regions, which makes its main components more flexible. During
storage of bread, water is transferred between the bread components and cannot act
as a plasticizer (Gray and BeMiller, 2003). Thus, migration of water from crumb to
crust and amylopectin retrogradation, especially the formation of double helical
structures and crystalline regions, are considered to be the main reasons for firming
and/or staling of breads (Arendt et al. 2008).
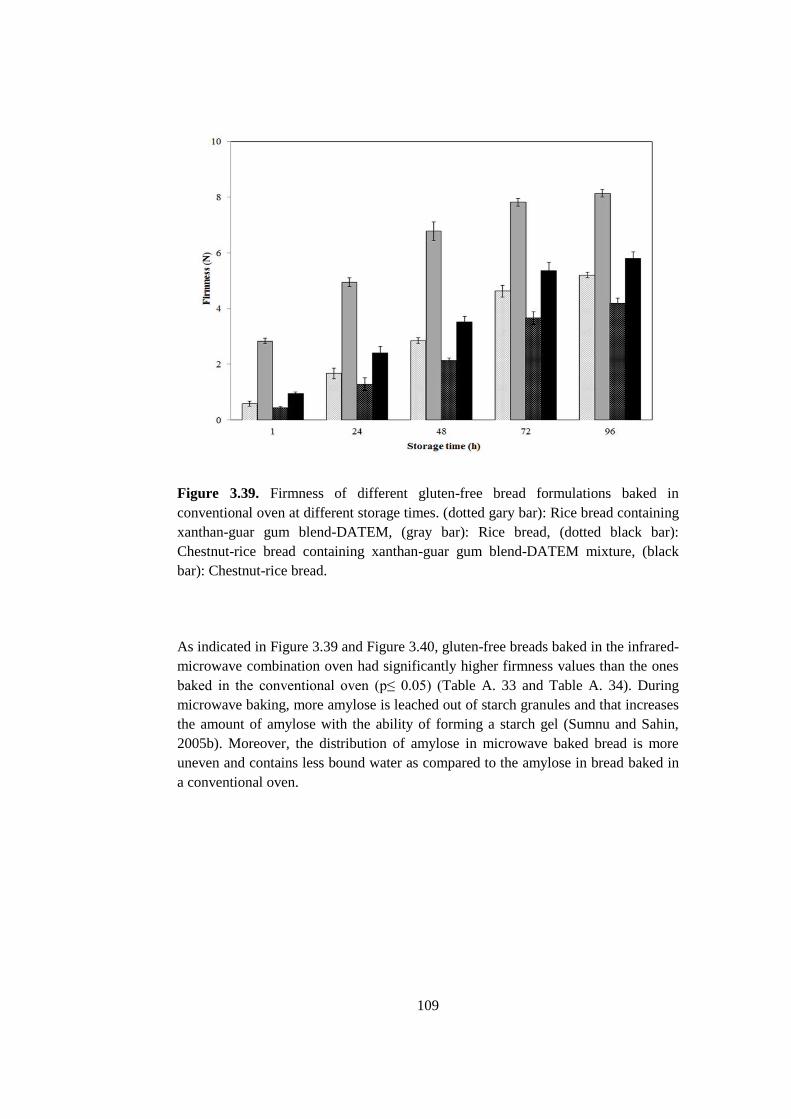
109
Figure 3.39. Firmness of different gluten-free bread formulations baked in
conventional oven at different storage times. (dotted gary bar): Rice bread containing
xanthan-guar gum blend-DATEM, (gray bar): Rice bread, (dotted black bar):
Chestnut-rice bread containing xanthan-guar gum blend-DATEM mixture, (black
bar): Chestnut-rice bread.
As indicated in Figure 3.39 and Figure 3.40, gluten-free breads baked in the infrared-
microwave combination oven had significantly higher firmness values than the ones
baked in the conventional oven (p≤ 0.05) (Table A. 33 and Table A. 34). During
microwave baking, more amylose is leached out of starch granules and that increases
the amount of amylose with the ability of forming a starch gel (Sumnu and Sahin,
2005b). Moreover, the distribution of amylose in microwave baked bread is more
uneven and contains less bound water as compared to the amylose in bread baked in
a conventional oven.
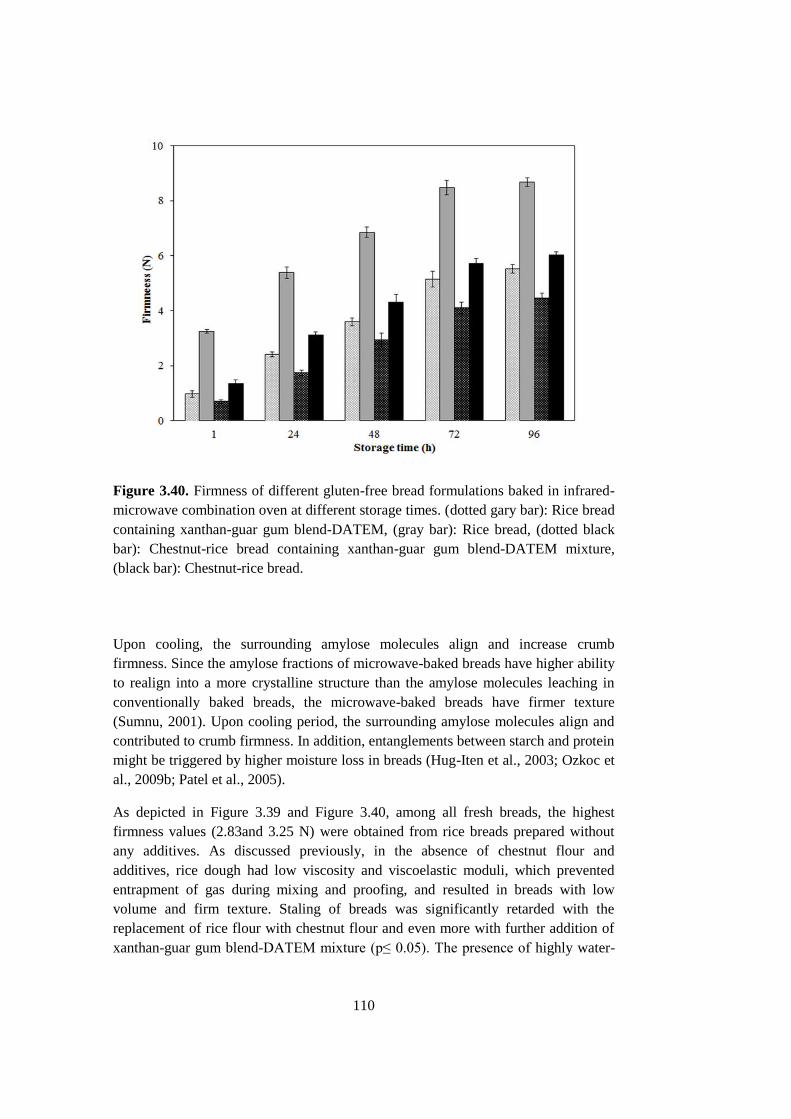
110
Figure 3.40. Firmness of different gluten-free bread formulations baked in infrared-
microwave combination oven at different storage times. (dotted gary bar): Rice bread
containing xanthan-guar gum blend-DATEM, (gray bar): Rice bread, (dotted black
bar): Chestnut-rice bread containing xanthan-guar gum blend-DATEM mixture,
(black bar): Chestnut-rice bread.
Upon cooling, the surrounding amylose molecules align and increase crumb
firmness. Since the amylose fractions of microwave-baked breads have higher ability
to realign into a more crystalline structure than the amylose molecules leaching in
conventionally baked breads, the microwave-baked breads have firmer texture
(Sumnu, 2001). Upon cooling period, the surrounding amylose molecules align and
contributed to crumb firmness. In addition, entanglements between starch and protein
might be triggered by higher moisture loss in breads (Hug-Iten et al., 2003; Ozkoc et
al., 2009b; Patel et al., 2005).
As depicted in Figure 3.39 and Figure 3.40, among all fresh breads, the highest
firmness values (2.83and 3.25 N) were obtained from rice breads prepared without
any additives. As discussed previously, in the absence of chestnut flour and
additives, rice dough had low viscosity and viscoelastic moduli, which prevented
entrapment of gas during mixing and proofing, and resulted in breads with low
volume and firm texture. Staling of breads was significantly retarded with the
replacement of rice flour with chestnut flour and even more with further addition of
xanthan-guar gum blend-DATEM mixture (p≤ 0.05). The presence of highly water-
111
binding macromolecules such as fibers, hydrocolloids and emulsifiers noticeably
enhanced the mixing properties and handling ability of dough that helped the
entrapment of more air bubbles. Thus, lower firmness values (0.43 and 0.69 N) were
obtained from breads in the presence of chestnut flour and xanthan-guar gum blend-
DATEM mixture. Such a reduction in crumb firmness values of breads with fibers,
hydrocolloids and emulsifiers were also reported (Guarda et al., 2004; Santos et al.,
2008; Ozkoc et al., 2009b; Sumnu et al., 2010).
3.6.3 DSC (Differential Scanning Calorimeter)
Amylopectin retrogradation can be monitored and quantified by DSC. Retrogradation
enthalpies (ΔHr) of bread samples were significantly affected by storage time, oven
type and gluten-free formulations according to three-way ANOVA (p≤ 0.05) (Table
A. 35 and Table A. 36). During amylopectin retrogradation, crystal structures are
formed and these crystal structures require an extra amount of energy for their
melting (Santos et al., 2008). As a result of the crystal growth and the reorganization
of amylopectin in crystal structures, retrogradation enthalpies of breads increase over
the storage time. DSC curves with retrogradation endotherms are presented in Fig. B.
1 and B. 2.
As illustrated in Figure 3.41 and Figure 3.42, amylopectin retrogradation enthalpies
of different breads baked in different ovens increased linearly with storage time.
Breads prepared with a mixture of rice and chestnut flour and in the presence of
xanthan gum and DATEM exhibited lower retrogradation enthalpies than the bread
prepared with rice flour alone. At 24 hours storage time breads prepared with either
chestnut or in the presence of xanthan gum and emulsifiers exhibited similar
retrogradation enthalpies. However, at longer storages times, amylopectin
retrogradation of breads was significantly reduced in the presence of both chestnut
flour and xanthan-guar gum blend-DATEM mixture (p≤ 0.05) (Table A. 35 and
Table A. 36). The same behavior was observed in breads baked with the two
different ovens (Figure 3.41 - Figure 3.42). In other words, the synergic interaction
between chestnut flour and xanthan-guar gum blend-DATEM mixture found to be
more effective on staling of gluten-free breads stored at longer times.
The differences in retrogradation enthalpies for breads baked in infrared-microwave
combination and conventional ovens were not statistically significant. This is in
agreement with a previous study conducted on staling properties of wheat breads
baked in these different ovens (Ozkoc et al., 2009b). In the study, it was suggested
that the infrared-microwave combination heating partially solved the rapid staling
problem observed with microwave heating since the retrogradation enthalpies of
breads baked in infrared-microwave combination oven (Hr= 0.65-0.73 J/g) were
found to be between the values obtained for conventionally (Hr= 0.35-0.75 J/g) and
microwave-baked breads (Hr= 0.72-0.87 J/g) (Ozkoc et al., 2009b).
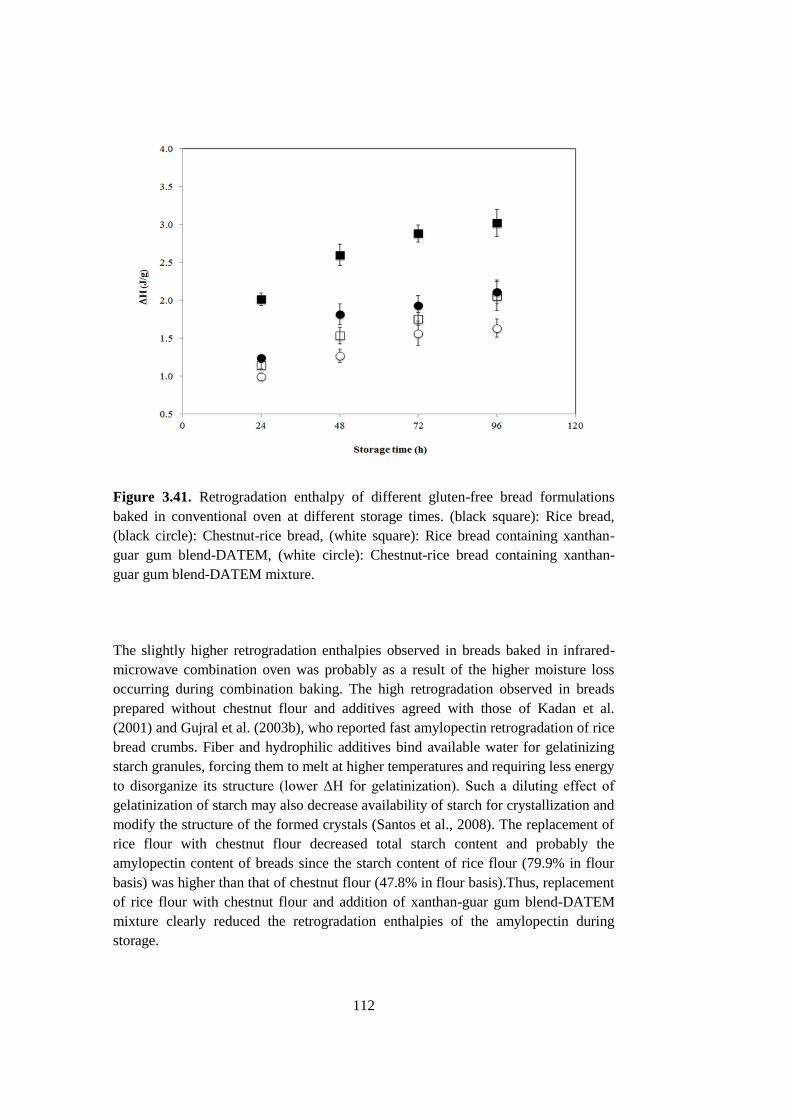
112
Figure 3.41. Retrogradation enthalpy of different gluten-free bread formulations
baked in conventional oven at different storage times. (black square): Rice bread,
(black circle): Chestnut-rice bread, (white square): Rice bread containing xanthan-
guar gum blend-DATEM, (white circle): Chestnut-rice bread containing xanthan-
guar gum blend-DATEM mixture.
The slightly higher retrogradation enthalpies observed in breads baked in infrared-
microwave combination oven was probably as a result of the higher moisture loss
occurring during combination baking. The high retrogradation observed in breads
prepared without chestnut flour and additives agreed with those of Kadan et al.
(2001) and Gujral et al. (2003b), who reported fast amylopectin retrogradation of rice
bread crumbs. Fiber and hydrophilic additives bind available water for gelatinizing
starch granules, forcing them to melt at higher temperatures and requiring less energy
to disorganize its structure (lower ΔH for gelatinization). Such a diluting effect of
gelatinization of starch may also decrease availability of starch for crystallization and
modify the structure of the formed crystals (Santos et al., 2008). The replacement of
rice flour with chestnut flour decreased total starch content and probably the
amylopectin content of breads since the starch content of rice flour (79.9% in flour
basis) was higher than that of chestnut flour (47.8% in flour basis).Thus, replacement
of rice flour with chestnut flour and addition of xanthan-guar gum blend-DATEM
mixture clearly reduced the retrogradation enthalpies of the amylopectin during
storage.
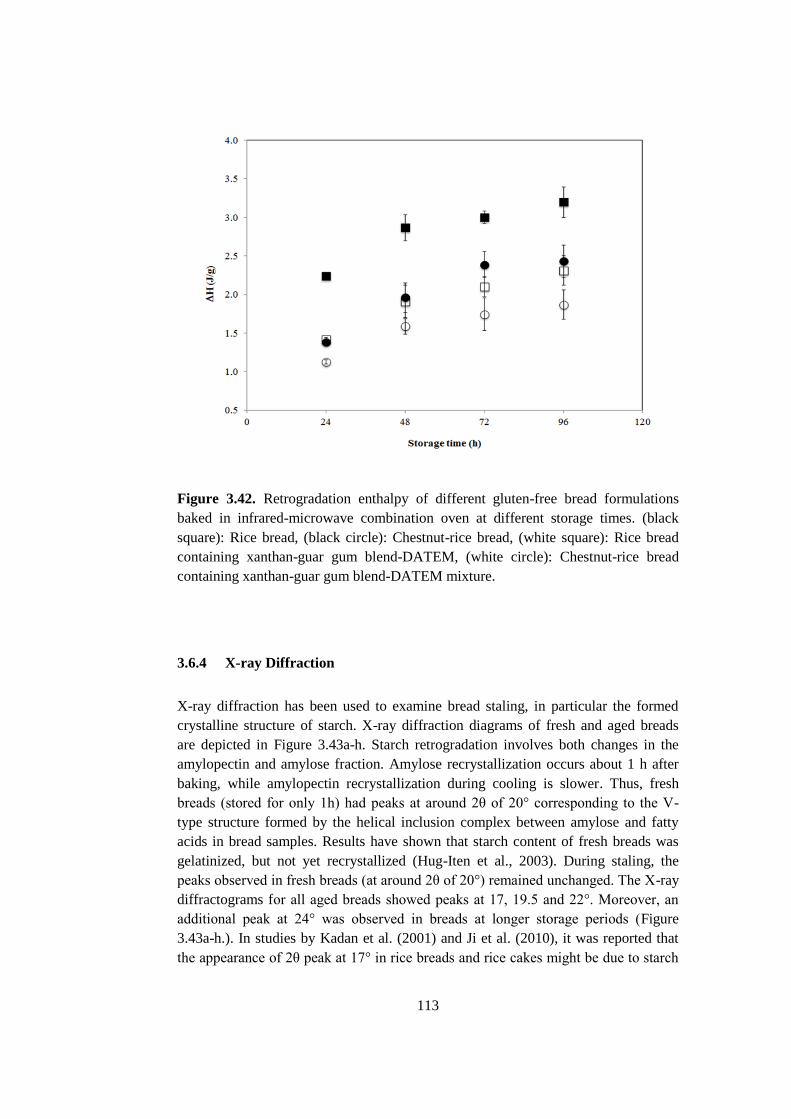
113
Figure 3.42. Retrogradation enthalpy of different gluten-free bread formulations
baked in infrared-microwave combination oven at different storage times. (black
square): Rice bread, (black circle): Chestnut-rice bread, (white square): Rice bread
containing xanthan-guar gum blend-DATEM, (white circle): Chestnut-rice bread
containing xanthan-guar gum blend-DATEM mixture.
3.6.4 X-ray Diffraction
X-ray diffraction has been used to examine bread staling, in particular the formed
crystalline structure of starch. X-ray diffraction diagrams of fresh and aged breads
are depicted in Figure 3.43a-h. Starch retrogradation involves both changes in the
amylopectin and amylose fraction. Amylose recrystallization occurs about 1 h after
baking, while amylopectin recrystallization during cooling is slower. Thus, fresh
breads (stored for only 1h) had peaks at around 2θ of 20° corresponding to the V-
type structure formed by the helical inclusion complex between amylose and fatty
acids in bread samples. Results have shown that starch content of fresh breads was
gelatinized, but not yet recrystallized (Hug-Iten et al., 2003). During staling, the
peaks observed in fresh breads (at around 2θ of 20°) remained unchanged. The X-ray
diffractograms for all aged breads showed peaks at 17, 19.5 and 22°. Moreover, an
additional peak at 24° was observed in breads at longer storage periods (Figure
3.43a-h.). In studies by Kadan et al. (2001) and Ji et al. (2010), it was reported that
the appearance of 2θ peak at 17° in rice breads and rice cakes might be due to starch

114
retrogradation. Osella et al. (2005) observed another peak at around 22° in gluten-
free breads samples prepared with rice flour, corn and cassava starch. Ribotta et al.
(2004c) analyzed B-type structure of breads with peaks at diffraction angles of 15,
17, 22.2 and 24°.These peaks which are characteristics of B-type structure are due to
the crystallization of the amorphous starch melt, mostly of the amylopectin fraction
and increased during storage. It has been indicated in the literature that native
starches may have A, B or C-type structures based on their origins (Wang et al.,
1998).These crystals contains different amount of water molecules and they affect
the distribution of water within the crumb differently. During storage, B-type
crystalline regions are formed which contain higher number of water molecules as
compared to A and C-type starch as more water migrates into the crystalline region
due to the recrystallization of amylopectin (Ozkoc et al. 2009b). As can be seen in
Figure 3.43a-h, the increase in starch crystallinity with storage time also caused
increase in the peak intensities. Generally, the replacement of rice flour with chestnut
flour and addition of xanthan-guar gum blend-DATEM mixture resulted in decrease
in these peak intensities (Figure 3.43c,d,g and h).When oven types are compared, it
can be said that similar peak intensities were obtained from breads baked in
conventional and infrared-microwave combination ovens (Figure 3.43a-h).
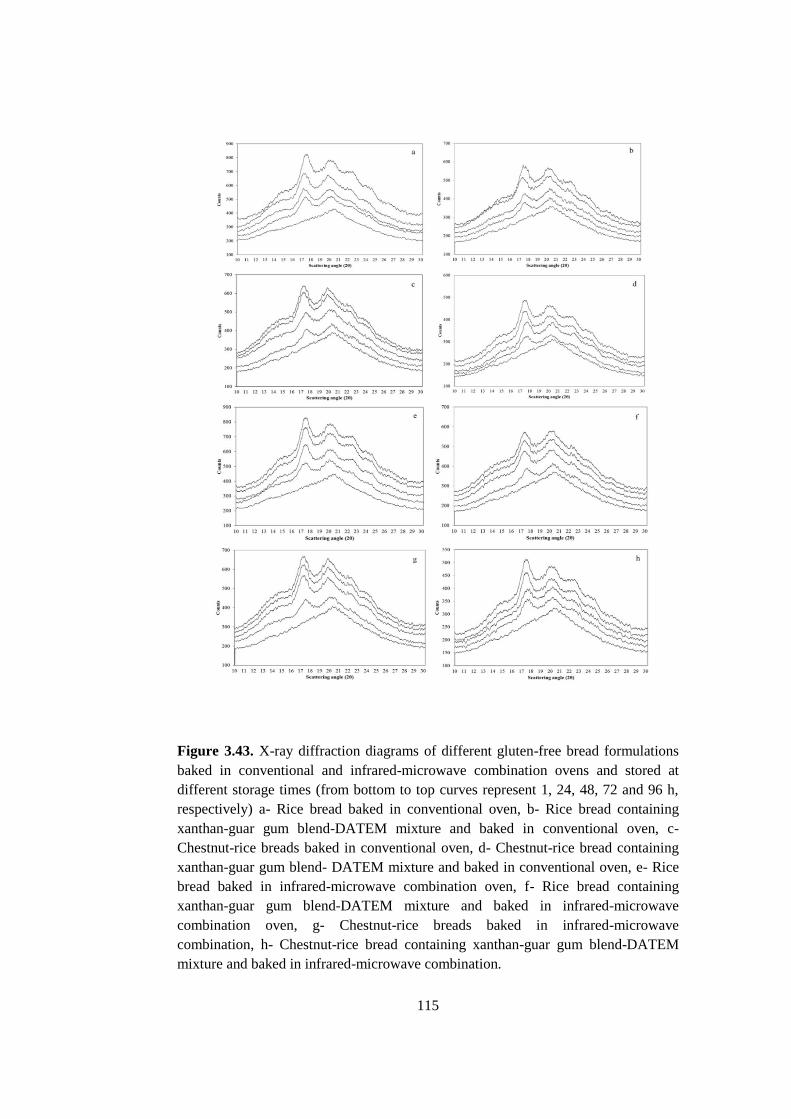
115
Figure 3.43. X-ray diffraction diagrams of different gluten-free bread formulations
baked in conventional and infrared-microwave combination ovens and stored at
different storage times (from bottom to top curves represent 1, 24, 48, 72 and 96 h,
respectively) a- Rice bread baked in conventional oven, b- Rice bread containing
xanthan-guar gum blend-DATEM mixture and baked in conventional oven, c-
Chestnut-rice breads baked in conventional oven, d- Chestnut-rice bread containing
xanthan-guar gum blend- DATEM mixture and baked in conventional oven, e- Rice
bread baked in infrared-microwave combination oven, f- Rice bread containing
xanthan-guar gum blend-DATEM mixture and baked in infrared-microwave
combination oven, g- Chestnut-rice breads baked in infrared-microwave
combination, h- Chestnut-rice bread containing xanthan-guar gum blend-DATEM
mixture and baked in infrared-microwave combination.
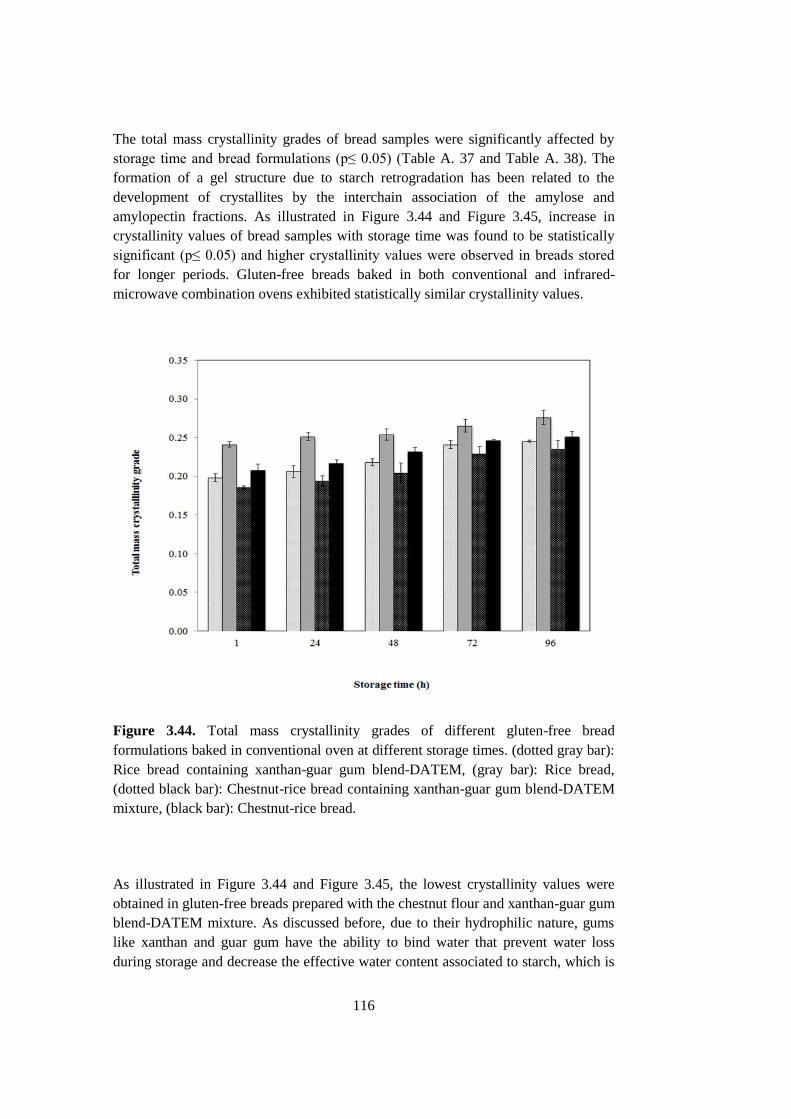
116
The total mass crystallinity grades of bread samples were significantly affected by
storage time and bread formulations (p≤ 0.05) (Table A. 37 and Table A. 38). The
formation of a gel structure due to starch retrogradation has been related to the
development of crystallites by the interchain association of the amylose and
amylopectin fractions. As illustrated in Figure 3.44 and Figure 3.45, increase in
crystallinity values of bread samples with storage time was found to be statistically
significant (p≤ 0.05) and higher crystallinity values were observed in breads stored
for longer periods. Gluten-free breads baked in both conventional and infrared-
microwave combination ovens exhibited statistically similar crystallinity values.
Figure 3.44. Total mass crystallinity grades of different gluten-free bread
formulations baked in conventional oven at different storage times. (dotted gray bar):
Rice bread containing xanthan-guar gum blend-DATEM, (gray bar): Rice bread,
(dotted black bar): Chestnut-rice bread containing xanthan-guar gum blend-DATEM
mixture, (black bar): Chestnut-rice bread.
As illustrated in Figure 3.44 and Figure 3.45, the lowest crystallinity values were
obtained in gluten-free breads prepared with the chestnut flour and xanthan-guar gum
blend-DATEM mixture. As discussed before, due to their hydrophilic nature, gums
like xanthan and guar gum have the ability to bind water that prevent water loss
during storage and decrease the effective water content associated to starch, which is
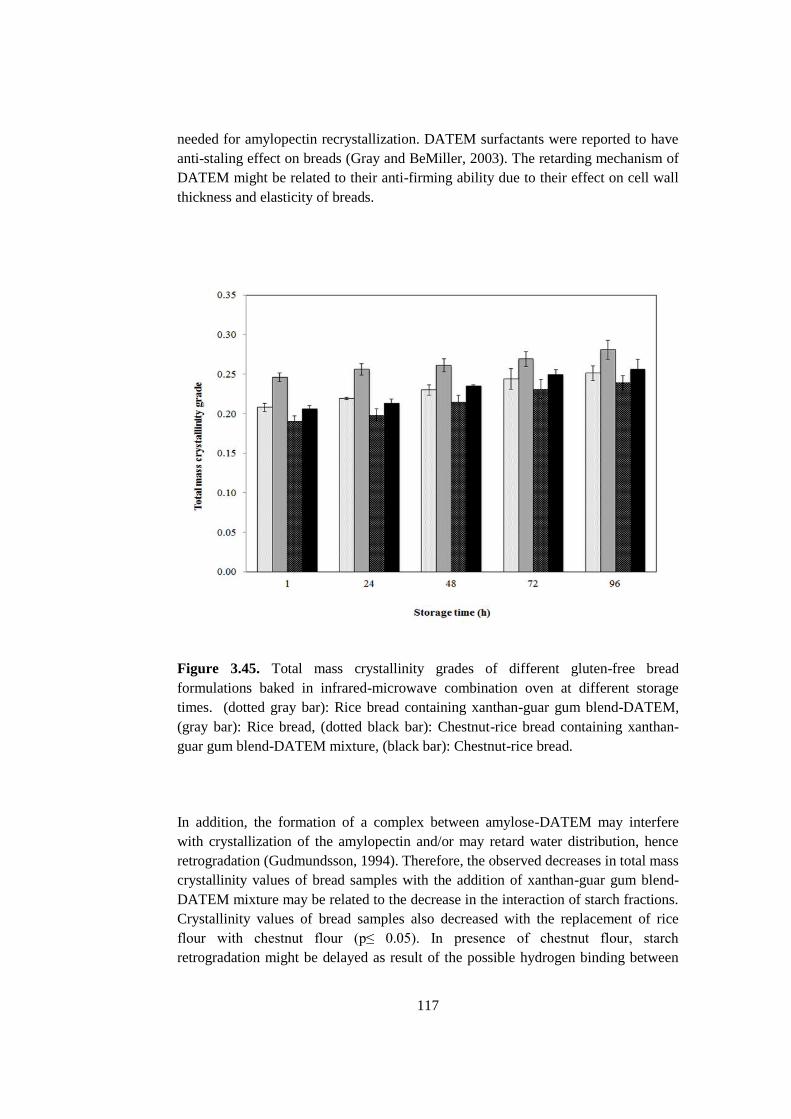
117
needed for amylopectin recrystallization. DATEM surfactants were reported to have
anti-staling effect on breads (Gray and BeMiller, 2003). The retarding mechanism of
DATEM might be related to their anti-firming ability due to their effect on cell wall
thickness and elasticity of breads.
Figure 3.45. Total mass crystallinity grades of different gluten-free bread
formulations baked in infrared-microwave combination oven at different storage
times. (dotted gray bar): Rice bread containing xanthan-guar gum blend-DATEM,
(gray bar): Rice bread, (dotted black bar): Chestnut-rice bread containing xanthan-
guar gum blend-DATEM mixture, (black bar): Chestnut-rice bread.
In addition, the formation of a complex between amylose-DATEM may interfere
with crystallization of the amylopectin and/or may retard water distribution, hence
retrogradation (Gudmundsson, 1994). Therefore, the observed decreases in total mass
crystallinity values of bread samples with the addition of xanthan-guar gum blend-
DATEM mixture may be related to the decrease in the interaction of starch fractions.
Crystallinity values of bread samples also decreased with the replacement of rice
flour with chestnut flour (p≤ 0.05). In presence of chestnut flour, starch
retrogradation might be delayed as result of the possible hydrogen binding between
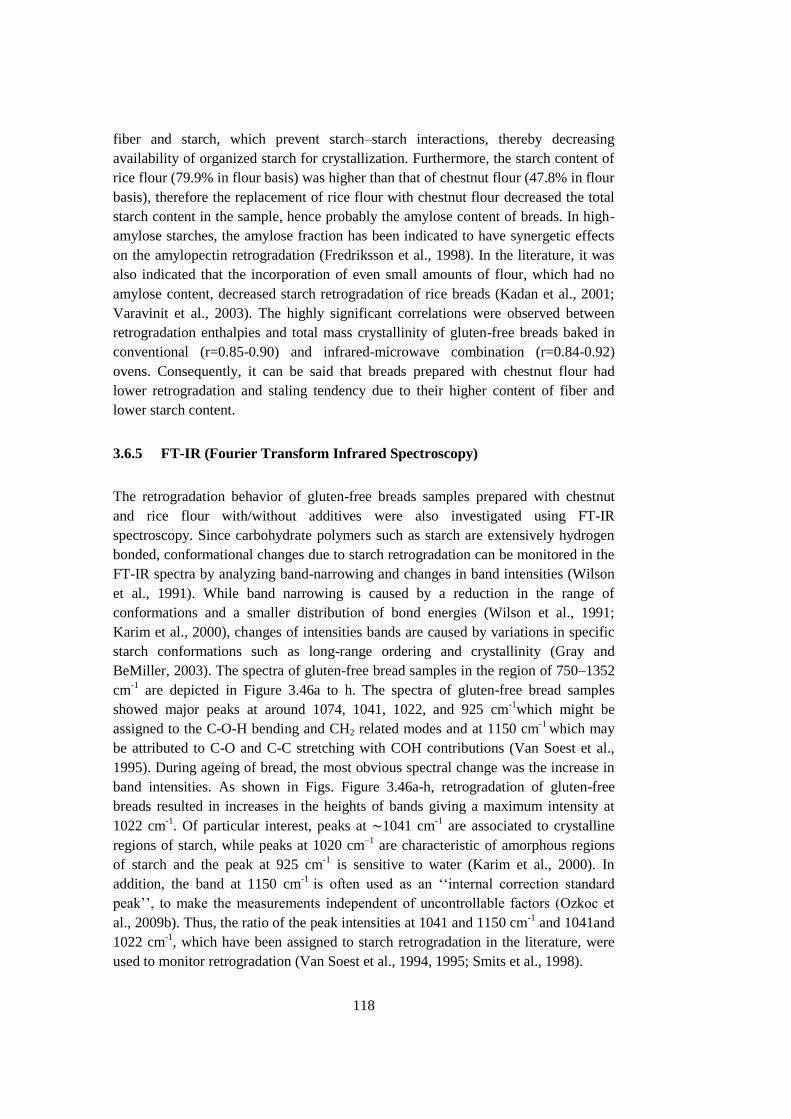
118
fiber and starch, which prevent starch–starch interactions, thereby decreasing
availability of organized starch for crystallization. Furthermore, the starch content of
rice flour (79.9% in flour basis) was higher than that of chestnut flour (47.8% in flour
basis), therefore the replacement of rice flour with chestnut flour decreased the total
starch content in the sample, hence probably the amylose content of breads. In high-
amylose starches, the amylose fraction has been indicated to have synergetic effects
on the amylopectin retrogradation (Fredriksson et al., 1998). In the literature, it was
also indicated that the incorporation of even small amounts of flour, which had no
amylose content, decreased starch retrogradation of rice breads (Kadan et al., 2001;
Varavinit et al., 2003). The highly significant correlations were observed between
retrogradation enthalpies and total mass crystallinity of gluten-free breads baked in
conventional (r=0.85-0.90) and infrared-microwave combination (r=0.84-0.92)
ovens. Consequently, it can be said that breads prepared with chestnut flour had
lower retrogradation and staling tendency due to their higher content of fiber and
lower starch content.
3.6.5 FT-IR (Fourier Transform Infrared Spectroscopy)
The retrogradation behavior of gluten-free breads samples prepared with chestnut
and rice flour with/without additives were also investigated using FT-IR
spectroscopy. Since carbohydrate polymers such as starch are extensively hydrogen
bonded, conformational changes due to starch retrogradation can be monitored in the
FT-IR spectra by analyzing band-narrowing and changes in band intensities (Wilson
et al., 1991). While band narrowing is caused by a reduction in the range of
conformations and a smaller distribution of bond energies (Wilson et al., 1991;
Karim et al., 2000), changes of intensities bands are caused by variations in specific
starch conformations such as long-range ordering and crystallinity (Gray and
BeMiller, 2003). The spectra of gluten-free bread samples in the region of 750–1352
cm-1
are depicted in Figure 3.46a to h. The spectra of gluten-free bread samples
showed major peaks at around 1074, 1041, 1022, and 925 cm-1
which might be
assigned to the C-O-H bending and CH2 related modes and at 1150 cm-1
which may
be attributed to C-O and C-C stretching with COH contributions (Van Soest et al.,
1995). During ageing of bread, the most obvious spectral change was the increase in
band intensities. As shown in Figs. Figure 3.46a-h, retrogradation of gluten-free
breads resulted in increases in the heights of bands giving a maximum intensity at
1022 cm-1
. Of particular interest, peaks at ∼1041 cm-1
are associated to crystalline
regions of starch, while peaks at 1020 cm–1
are characteristic of amorphous regions
of starch and the peak at 925 cm-1
is sensitive to water (Karim et al., 2000). In
addition, the band at 1150 cm-1 is often used as an ‘‘internal correction standard
peak’’, to make the measurements independent of uncontrollable factors (Ozkoc et
al., 2009b). Thus, the ratio of the peak intensities at 1041 and 1150 cm-1
and 1041and
1022 cm-1
, which have been assigned to starch retrogradation in the literature, were
used to monitor retrogradation (Van Soest et al., 1994, 1995; Smits et al., 1998).
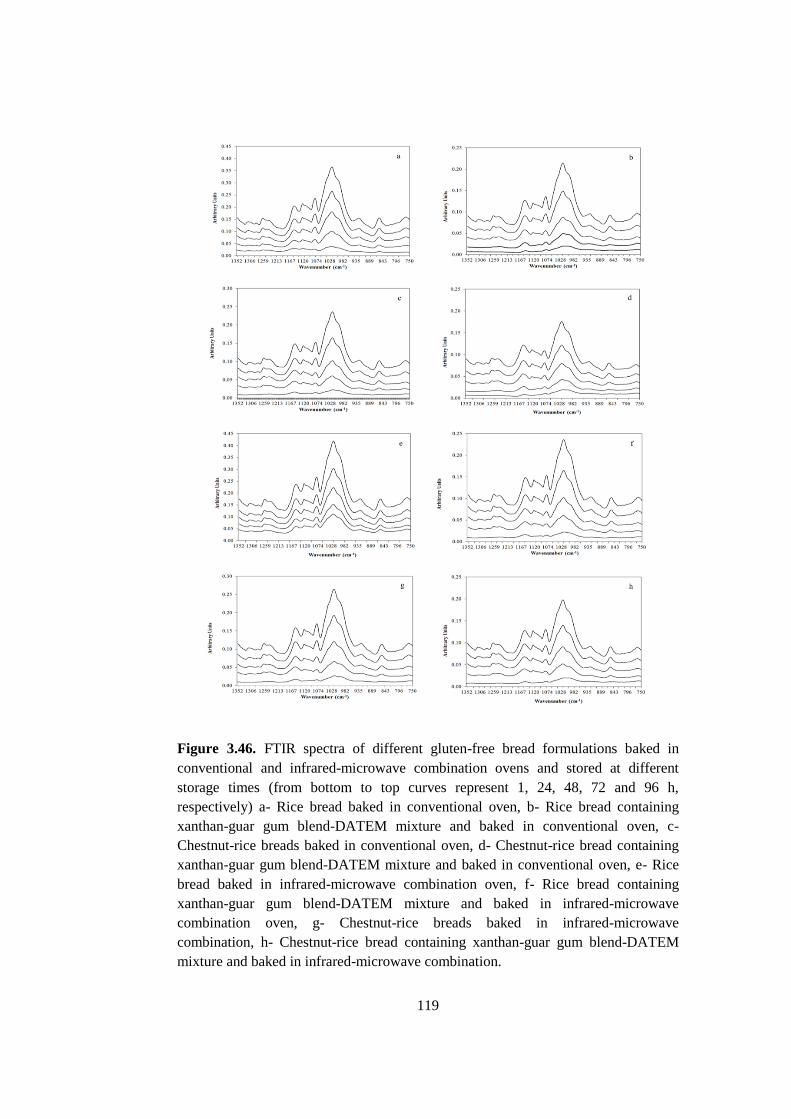
119
Figure 3.46. FTIR spectra of different gluten-free bread formulations baked in
conventional and infrared-microwave combination ovens and stored at different
storage times (from bottom to top curves represent 1, 24, 48, 72 and 96 h,
respectively) a- Rice bread baked in conventional oven, b- Rice bread containing
xanthan-guar gum blend-DATEM mixture and baked in conventional oven, c-
Chestnut-rice breads baked in conventional oven, d- Chestnut-rice bread containing
xanthan-guar gum blend-DATEM mixture and baked in conventional oven, e- Rice
bread baked in infrared-microwave combination oven, f- Rice bread containing
xanthan-guar gum blend-DATEM mixture and baked in infrared-microwave
combination oven, g- Chestnut-rice breads baked in infrared-microwave
combination, h- Chestnut-rice bread containing xanthan-guar gum blend-DATEM
mixture and baked in infrared-microwave combination.
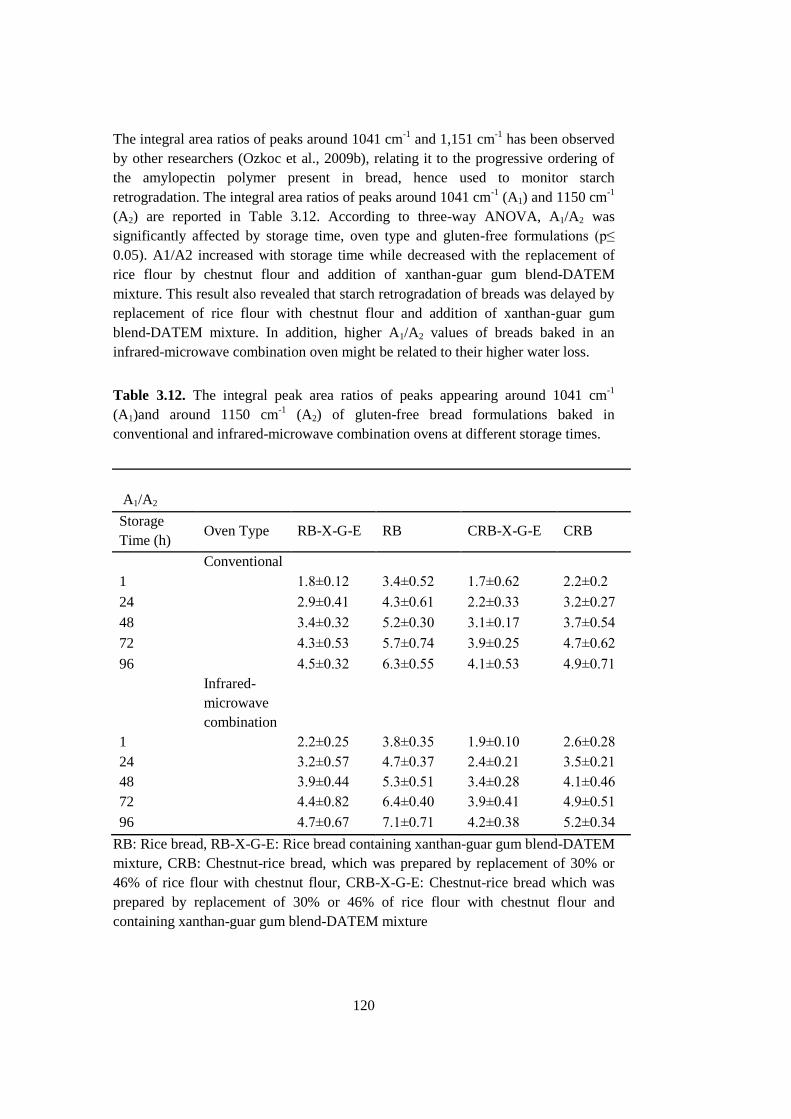
120
The integral area ratios of peaks around 1041 cm-1
and 1,151 cm-1
has been observed
by other researchers (Ozkoc et al., 2009b), relating it to the progressive ordering of
the amylopectin polymer present in bread, hence used to monitor starch
retrogradation. The integral area ratios of peaks around 1041 cm-1
(A1) and 1150 cm-1
(A2) are reported in Table 3.12. According to three-way ANOVA, A1/A2 was
significantly affected by storage time, oven type and gluten-free formulations (p≤
0.05). A1/A2 increased with storage time while decreased with the replacement of
rice flour by chestnut flour and addition of xanthan-guar gum blend-DATEM
mixture. This result also revealed that starch retrogradation of breads was delayed by
replacement of rice flour with chestnut flour and addition of xanthan-guar gum
blend-DATEM mixture. In addition, higher A1/A2 values of breads baked in an
infrared-microwave combination oven might be related to their higher water loss.
Table 3.12. The integral peak area ratios of peaks appearing around 1041 cm-1
(A1)and around 1150 cm-1
(A2) of gluten-free bread formulations baked in
conventional and infrared-microwave combination ovens at different storage times.
A1/A2
Storage
Time (h) Oven Type RB-X-G-E RB CRB-X-G-E CRB
Conventional
1
1.8±0.12 3.4±0.52 1.7±0.62 2.2±0.2
24
2.9±0.41 4.3±0.61 2.2±0.33 3.2±0.27
48
3.4±0.32 5.2±0.30 3.1±0.17 3.7±0.54
72
4.3±0.53 5.7±0.74 3.9±0.25 4.7±0.62
96
4.5±0.32 6.3±0.55 4.1±0.53 4.9±0.71
Infrared-
microwave
combination
1
2.2±0.25 3.8±0.35 1.9±0.10 2.6±0.28
24
3.2±0.57 4.7±0.37 2.4±0.21 3.5±0.21
48
3.9±0.44 5.3±0.51 3.4±0.28 4.1±0.46
72
4.4±0.82 6.4±0.40 3.9±0.41 4.9±0.51
96 4.7±0.67 7.1±0.71 4.2±0.38 5.2±0.34
RB: Rice bread, RB-X-G-E: Rice bread containing xanthan-guar gum blend-DATEM
mixture, CRB: Chestnut-rice bread, which was prepared by replacement of 30% or
46% of rice flour with chestnut flour, CRB-X-G-E: Chestnut-rice bread which was
prepared by replacement of 30% or 46% of rice flour with chestnut flour and
containing xanthan-guar gum blend-DATEM mixture
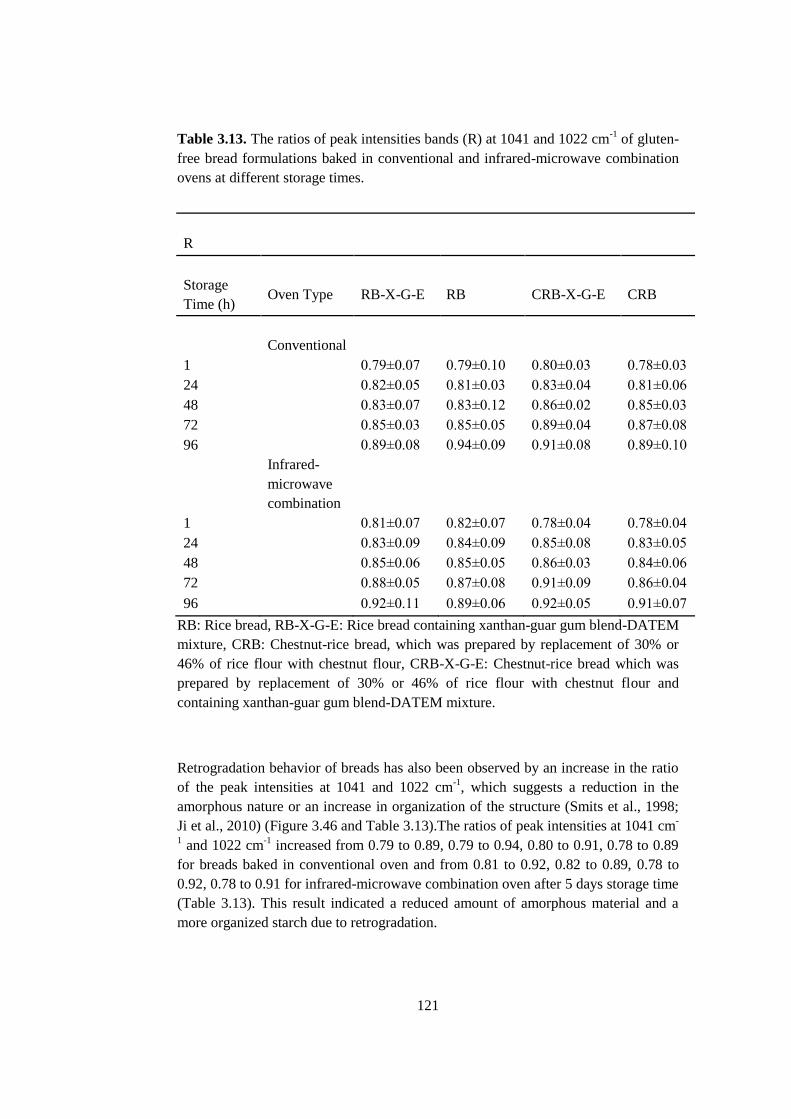
121
Table 3.13. The ratios of peak intensities bands (R) at 1041 and 1022 cm-1
of gluten-
free bread formulations baked in conventional and infrared-microwave combination
ovens at different storage times.
R
Storage
Time (h) Oven Type RB-X-G-E RB CRB-X-G-E CRB
Conventional
1
0.79±0.07 0.79±0.10 0.80±0.03 0.78±0.03
24
0.82±0.05 0.81±0.03 0.83±0.04 0.81±0.06
48
0.83±0.07 0.83±0.12 0.86±0.02 0.85±0.03
72
0.85±0.03 0.85±0.05 0.89±0.04 0.87±0.08
96
0.89±0.08 0.94±0.09 0.91±0.08 0.89±0.10
Infrared-
microwave
combination
1
0.81±0.07 0.82±0.07 0.78±0.04 0.78±0.04
24
0.83±0.09 0.84±0.09 0.85±0.08 0.83±0.05
48
0.85±0.06 0.85±0.05 0.86±0.03 0.84±0.06
72
0.88±0.05 0.87±0.08 0.91±0.09 0.86±0.04
96 0.92±0.11 0.89±0.06 0.92±0.05 0.91±0.07
RB: Rice bread, RB-X-G-E: Rice bread containing xanthan-guar gum blend-DATEM
mixture, CRB: Chestnut-rice bread, which was prepared by replacement of 30% or
46% of rice flour with chestnut flour, CRB-X-G-E: Chestnut-rice bread which was
prepared by replacement of 30% or 46% of rice flour with chestnut flour and
containing xanthan-guar gum blend-DATEM mixture.
Retrogradation behavior of breads has also been observed by an increase in the ratio
of the peak intensities at 1041 and 1022 cm-1
, which suggests a reduction in the
amorphous nature or an increase in organization of the structure (Smits et al., 1998;
Ji et al., 2010) (Figure 3.46 and Table 3.13).The ratios of peak intensities at 1041 cm-
1 and 1022 cm
-1 increased from 0.79 to 0.89, 0.79 to 0.94, 0.80 to 0.91, 0.78 to 0.89
for breads baked in conventional oven and from 0.81 to 0.92, 0.82 to 0.89, 0.78 to
0.92, 0.78 to 0.91 for infrared-microwave combination oven after 5 days storage time
(Table 3.13). This result indicated a reduced amount of amorphous material and a
more organized starch due to retrogradation.

122
123
CHAPTER 4
4. CONCLUSION AND RECOMMENDATIONS
All rice and rice–chestnut dough formulations had shear thinning behavior with
different power law constants and they obeyed power law and Herschel–Bulkley
models, respectively. Xanthan, xanthan–LBG and xanthan–guar gum mixture were
observed to be the most effective gums in improving dough structure. It was possible
to obtain high quality breads by using chestnut and rice flours at a ratio of 30:70.
Response surface methodology was successfully applied to the optimize formulation
and the baking conditions of the gluten-free chestnut and rice breads to be baked in
infrared–microwave combination oven. The chestnut:rice flour ratio and infrared
power were found to be the significant factors in affecting all the quality parameters
of gluten-free breads. The microwave power and baking time significantly affected
the firmness, weight loss and specific volume of breads. On the other hand,
emulsifier content was found to be insignificant in affecting all the quality
parameters, except specific volume of breads. Partial replacement of rice flour by
chestnut flour improved the quality of gluten-free breads, significantly. Gluten-free
breads baked in infrared–microwave combination oven at the optimum conditions
had statistically similar quality with conventionally baked ones in terms of colour,
specific volume and firmness. In addition, conventional baking time of gluten-free
breads was significantly reduced.
Tigernut flour also improved the quality parameters of gluten-free breads.
Conventionally baked breads containing 10:90 tigernut:rice flour ratio and the
infrared–microwave combination-baked breads prepared using 20:80 tigernut:rice
flour ratio had best quality parameters in terms of firmness, specific volume, and
color values.
X-ray microtomography was successfully used for characterization of gluten-free
bread structures. X-ray microtomography results indicated that addition of different
gums or gum blends were found to be effective on crumb porous structure of gluten-
free breads. The lowest porosity, the lowest average area of pores and the highest
number of pores was obtained from gluten-free breads prepared with the addition of
xanthan, CMC, xanthan-guar, xanthan-LBG and HPMC indicating their finer
crumbs. Different formulations and oven types were found to be effective on pore
area fractions and pore area distributions of bread crumbs. Breads prepared with
chestnut flour and xanthan–guar gum blend–DATEM mixture had a more porous
structure. In addition, pore area fraction values of breads increased when the
infrared–microwave combination baking method was used. Based on scanned and
SEM images, the highest pore area fractions were obtained from gluten-free breads
124
containing chestnut flour and xanthan–guar gum blend–DATEM mixture and baked
in infrared–microwave combination oven. Generally, the usage of infrared–
microwave combination baking increased the number of small pores in rice breads
and large pores in chestnut–rice breads. The replacement of rice flour with chestnut
flour partially resulted in a more uniform structure. The presence of additives and
infrared–microwave combination oven increased the uniformity of microstructure of
rice and rice–chestnut breads. SEM observation showed that breads prepared with
chestnut flour and baked in an infrared– microwave combination oven had more
starch granules, which did not lose their identity and did not disintegrate completely.
Firmness, moisture loss, retrogradation enthalpies, total crystallinity values, and
FTIR results showed that starch retrogradation in bread samples increased during
storage of breads. Partial replacement of rice flour with chestnut flour and addition of
xanthan-guar gum blend-DATEM mixture significantly decreased moisture loss,
firmness, retrogradation enthalpy, and total mass crystallinity of gluten-free bread
samples. The use of infrared-microwave combination oven did not result in excessive
firmness after storage. In addition, retrogradation enthalpy values and total mass
crystallinity of gluten-free breads baked in conventional and combination ovens
showed that it should be possible to produce breads by combination heating with
similar staling degrees as conventionally baked ones. The partial replacement of rice
flour with chestnut flour and addition of xanthan-guar gum blend-DATEM mixture
retarded staling of gluten-free bread formulations baked in different ovens. In
addition, addition of chestnut flour improved the quality of gluten-free rice breads.
Therefore, chestnut flour may be recommended to be used in gluten-free bread
formulations to be baked both conventional and infrared-microwave combination
oven.
In the future study, the effects of frozen storage on quality and staling of gluten-free
chestnut-rice doughs may be investigated. In addition, as a further research partial-
baking of gluten-free breads in different ovens (infrared-microwave combination and
conventional) can be studied.
125
5. REFERENCES
(http://www.webmd.com/digestive-disorders/celiac-disease/celiac-disease-diagnosis-
tests. Last visited: May, 2013).
http://www.xn--lyak-zoa4g.com/haber/45-2colyak-hastaligi-bilimsel-toplantisi-
bursa39da-ya.html. Last visited: May, 2013).
AACC, 2000. Approved Methods of the American Association of Cereal Chemists
(10th ed.) Methods 10-05, 44-15 (formerly 72-10) and 74–09. The Association, St.
Paul, Minnesota.
Acs, E., Kovacs, Z., Matuz, J., 1997. Possibilities of producing low-protein, gluten-
free bread. 1. Structure formation. Novenytermeles, 46, 227-234.
Ade-Omowaye, B. I. O., Akinwande, B. A., Bolarinwa, I. F., Adebiyi, A. O., 2008.
Evaluation of tigernut (Cyperusesculentus) –wheat composite flour and bread.
African Journal of Food Science, 2, 087-091.
Aguilera, J. M., 2005. Why food microstructure? Journal of Food Engineering, 67,
3–11.
Ahlborn, G. J., Pike, O. A., Hendrix, S. B., Hess, W. M., Huber, C. S., 2005.
Sensory, mechanical, and microscopic evaluation of staling in low-protein and
gluten-free breads. Cereal Chemistry, 82, 328-335.
Alvarez-Jubete, L., Auty, M., Arendt, E. K., Gallagher, E., 2010. Baking properties
and microstructure of pseudocereal flours in gluten-free bread formulations.
European Food Research and Technology, 230, 437–445.
Anderson, V. L. and Mc Lean, R. A. 1974. Design of experiments: A realistic
approach. Markel Dekker, Inc., New York.
Anton, A. A. and Artfield, S. D. 2008. Hydrocolloids in gluten-free breads: A
review. International Journal of Food Sciences and Nutrition, 59(1), 11-23.
AOAC, 1990. Association of Official Analytical Chemists, Official methods of
analysis. Methods 923.03; 925.10; 963.15; 978.17; 982.14 and 991.43, 15th ed.
Washington, DC.
AOAC, 1995. Association of Offcial Analytical Chemists, Official methods of
analysis. Method 991.19, 15th ed. Washington, DC.
Arendt, E. K. and Moore, M. M., 2006. Gluten-free cereal based products. In: Bakery
Products: Science and Technology, (Eds.) Hui, Y.H., Rosell, C.M., Gómez, M.,
Blackwell Publishing, NY, USA, pp. 471–497.
126
Arendt, E. K., Morrissey A., Moore M. M., Dal Bello, F., 2008. Gluten-free Breads.
In: Gluten-free Cereral products and Beverages (Eds.) Arendt, E. K and Dal Bello, F,
(1st ed.), Academic Press, Oxford, UK, pp. 289-321.
Babin, P., Della Valle, G., Chiron, H., Cloetens, P., Hoszowska, J., Pernot, P.,
Réguerre, A.L., Salvo, L., Dendievel, R., 2006. Fast X-ray tomography analysis of
bubble growth and foam setting during breadmaking. Journal of Cereal Science, 43,
393–397.
Barcenas, M. E., and Rosell, C. M., 2005. Effect of HPMC addition on the
microstructure, quality and aging of wheat bread. Food Hydrocolloids, 19, 1037–
1043.
Bardella, M. T., Fredella, C., Prampolini, L., Molteni, N., Giunta, A. M., Bianchi, P.
A., 2000. Body composition and dietary intakes in adult celiac disease patients
consuming a strict gluten-free diet. American Journal of Clinical Nutrition, 72(4),
937-939.
BeMiller, J. N., 2008. Gluten-free Breads. In: Gluten-free Cereral products and
Beverages. Academic Press, (Eds) Arendt, E. K and Dal Bello, F, (1st ed.), Oxford,
UK, pp. 203-217.
BeMiller, J. N. and Whistler, R.L., 1996. Carbohydrates. In: Food Chemistry. (Eds.)
O.R., Fennema and Marcel Dekker, New York, pp. 158-220
Berk, Z., 1976. Introduction to the biochemistry of foods. Elsevier, New York, pp.
116-117.
Bezerra, M. A., Santelli, R. E., Oliveira, E. P., 2008. Response Surface Methodology
(RSM) as a tool for optimization in analytical chemistry. Talanta, 76, 965–977.
Blaiotta, G., Di Capua, M., Coppola, R., Aponte, M., 2012. Production of fermented
chestnut purees by lactic acid bacteria. International Journal of Food Microbiology,
158, 195-202.
Bloksma, A. H. and Bushuk, W., 1988. Rheologhy and chemistry of dough. In:
Wheat chemistry and technology. (Eds) Pomeranz, Y. American Association of
Cereal Chemists, Inc., Minnesota, USA, pp. 131-219.
Bollaín, C. and Collar, C., 2004. Dough viscoelastic response
ofhydrocolloid/enzyme/surfactant blends assessed by uni- and bi- axial extension
measurements. Food Hydrocolloids, 18, 499–507.
Bonaduce, I., Brecoulaki, H., Colombini, M. P., Lluveras, A., Restivoo, V.,
Ribechini, E., 2007. Gas chromatographicmass spectrometric characterisation of
plant gums in samples from painted works of art. Journal of Chromatography A,
1144, 275–282.
127
Box, G. E. P. and Wilson, K. B., 1951. On the experimental attainment of optimum
conditions. Journal of the Royal Statistical Society (Series B), 13, 1–45.
Bower, S. L., 2006. What is Celiac Disease. In Celiac disease: a guide to living with
gluten intolerance. (Eds.) S. L. Bower, M. K., Sharrett, and S., Plogste, (1st
ed.).
Demos Medical Publishing, New York, pp. 1-9.
Brites, C., Trigo, M. J., Santos, C., Collar, C., Rosell, C. M., 2010. Maize based
Gluten-free bread: Influence of processing parameters on sensory and instrumental
quality. Food and Bioprocess Technology, 3, 707-715.
Brockmole, C. L., Zabik, M. E., 1976.Wheat bran and middlings in white layer
cakes. Journal of Food Science 41, 357–360.
Buffler., C. R., 1993. Microwave cooking and processing: Engineering fundamentals
for the food scientist.Pp.6, 39, 54. New York, USA: Avi Book.
Campanella, O. H., Peleg, M., 1987. Squeezing flow viscosimetry of peanut butter.
Journal of Food Science, 52, 180–184.
Catassi, C., Fornaroli, F., Fasano, A., 2002. Celiac disease: From basic immunology
to bedside practice. Clinical and Applied Immunology Reviews, 3(1-2), 61-71.
Cato, L., Gan, J. J., Rafael, L. G. B., Small, D. M., 2004. Gluten free breads using
rice flour and hydrocolloid gums. Food Australia, 56, 75–78.
Chaplin, M. F., 2003. Fibre and water binding. Proceeding of the Nutrition Society,
62, 223–227.
Chenlo, F., Moreira, R., Pereira, G., Silva, C. C., 2007. Evaluation of the rheological
behaviour of chestnut (castanea sativa mill) flour pastes as function of water content
and temperature. Electronic Journal of Environmental Agriculture and Food
Chemistry, 6(2), 1794-1802.
Chin, N. L., Goh, S. K., Rahman, R. A., Hashim, D. M., 2007.Functional effect of
fully hydrogenated palm oil-based emulsifiers on baking performance of white bread.
International Journal of Food Engineering, 3, 1–15.
Chinma, C. E., Abu, J. O. Abubakar, Y. A., 2010. Effect of tigernut
(Cyperusesculentus) flour addition on the quality of wheat-based cake. International
Journal of Food Science and Technology, 45(8), 1746–1752.
Chinma, C.E., Abu, J.O., Akoma, S.N., 2012. Effect of Germinated Tigernut and
MoringaFlour Blends on the Quality of Wheat-Based Bread. Journal of Food
Processing and Preservation. ISSN 1745-4549, 1-7.
128
Ciclitira, P. J. and Moodie, S. J., 2003.Coeliac disease. Best Practice and Research
Clinical Gastroenterology, 17(2), 181-195.
Codex standard for foods for special dietary use for persons intolerant to gluten,
1979. Codex Standard, 118, 1-3.
Collar, C., Santos, E., Rosell, C. M., 2007. Assessment of the rheological profile of
fibre-enriched bread doughs by response surface methodology. Journal of Food
Engineering, 78, 820–826.
Correia, P., Leitão, A., Beirão-da-Costa M. L., 2009. The effect of drying
temperatures on morphological and chemical properties of dried chestnuts flours.
Journal of Food Engineering, 90, 325–332.
Coskuner, Y., Ercan, R., Karababa, E., Nazlıcan, A. N., 2002. Physical and chemical
properties of chufa (Cyperusesculentus L) tubers grown in the Çukurova region of
Turkey.Journal of the Science of Food and Agriculture, 82(6), 625–631.
Crockett R., 2009. The Physicochemical Properties of Gluten-Free Dough with the
Addition of Hydrocolloids and Proteins, MS Thesis, The Ohio State University,
USA.
D’Appolonia, B. L., and Morad, M. M., 1981. Bread staling. Cereal Chemistry, 58,
186-190.
Datta, A. K. (1990). Heat and mass transfer in the microwave processing of food.
Chemical Engineering Progress, 86, 47–53.
Datta, A.K., Greedipalli, S.S.R., Almeida, M.F., 2005. Microwave combination
heating. Food Technology, 59, 36-40.
Datta, A. K. and Ni, H., 2002. Infrared and hot air-assisted microwave heating of
foods for control of surface moisture. Journal of Food Engineering, 51, 355-364.
Datta A. K., Sahin S., Sumnu G., Keskin O., 2007. Porous media characterization of
breads baked using novel heating modes. Journal of Food Engineering, 79, 106–116.
Decareau, R.V., 1992. Microwave Foods: New Product Development. Connecticut:
Food Nutrition Press Inc., pp 117.
Demirekler, P., Sumnu, G., Sahin, S., 2004. Optimization of bread baking in
halogenlamp-microwave combination oven by response surface methodology.
European Food Research and Technology, 219, 341-347.
Demirkol, O. S., 2007. Investigation of physical properties of different cakes
formulations during baking with microwave and infrared-microwave combination,
PhD thesis, METU, Ankara.
129
Dobraszczyk, B. J., Grant, M., Campbell, Gan, Z., 2001. Bread: A unique food. In:
Cereals and cereal products: chemistry and technology. (Eds) D.A.V. Dendy and B.
J. Dobraszczyk. Gaithersburg, ML: Aspen Publications, pp. 182-232.
Edwards, W. P., 2007. Gums and Gelling Agents or Hydrocoollids. In: The Science
of Bakery Products. The Royal Science of Chemistry. pp.125-127.
Ellis, H. J., Deward, D., Pollock, E. L., Gonzales-Cinca, N., Engel, W., Wieser, H.,
2006. The toxicity recombinant HMW glutenin sub-units of wheat patients with
celiac disease. In: M. Stern (Ed.), Proceedings of the 20 th Meeting of the Working
Group on Prolamin Analysis and Toxicity. Verlag Wissenschaftiliche Scripten,
Zwickau, pp. 35-40.
Falcone, P. M., Baiano, A., Conte, A., Mancini, L., Tromba, G., Zanini, F., Del
Nobile, M. A., 2006.Imaging techniques for the study of food microstructure: a
review. Advances in Food and Nutrition Research, 51, 205–263.
Falcone, P. M., Baiano, A., Zanini, F., Mancini., L., Tromba., G., Dresossi., D.,
Montanari, F., Scuor, N., Del Nobile, M. A., 2005. Three- dimensional quantitative
analysis of bread crumb by x-ray microtomography. Food Engineering and Physical
Properties, 70, 265–272.
Falcone, P. M, Baiano, A., Zanini, F., Mancini, L., Tromba., G., Montanari, F., Del
Nobile, M. A., 2004. A novel approach to the study of bread porous structure: Phase-
contrast X-ray Microtomography. Food Engineering and Physical Properties, 69,
38−43.
FAO STAT, 1999. Food and Agriculture Organization of the United
States.Available:http://faostat.fao.org/site/339/default.aspx
Farrera-Rebollo, R. R., Salgado-Cruz., M. P., Chanona-Pérez, J., Gutiérrez-López, G.
F., Alamilla-Beltrán, L., Calderón-Domínguez, G., 2012. Evaluation of Image
Analysis Tools for Characterization of Sweet Bread Crumb Structure. Food
Bioprocess and Technology, 5 (2), 474-484.
Fasano, A., Berti, I., Gerarduzzi, T., Not, T., Colletti, R. B., Drago, S., 2003.
Prevalence of celiac disease in at-risk and not-at-risk groups in the United States.
Archives of Internal Medicine, 163, 286-292.
Fredriksson, H., Silverio, J., Andersson, R., Eliasson., A. C., Aman., P., 1998. The
influence of amylose and amylopectin characteristics on gelatinization and
retrogradation properties of different starches. Carbohydrate Polymers, 35, 119-134.
Fu, J., Mulvaney, S. J., Cohen, J., 1997. Effect of added fat on the rheological
properties of wheat flour doughs. Cereal Chemistry, 74, 304–311.
130
Gallagher, E., Gormley, T.R., Arendt, E.K., 2004. Recent advances in the
formulation of gluten-free cereal-based products. Trends in Food Science and
Technology, 15, 143-152.
Gambus, H., Nowotna, A., Ziobro, R., Gumul, D., Sikora, M., 2001. The effect of
use of guar gum with pectin mixture in gluten-free bread. Electronic Journal Polish
Agricultural University, 4, 1-13.
Gan, J., Rafael, L. G. B., Cato, L., Small, D. M., 2001. Evaluation of the potential of
different rice flours in bakery formulations. In: Wooton, M., Batey, I.L., Wrigley,
C.W. (Eds.), Cereals. Proceedings of the 51st Australian Cereal Chemistry
Conference, 9, 13 September, 2001, Royal Australian Chemical Institute, Coogee,
New South Wales, Australia, Werribee, Australia, pp. 309–312.
Ghiasi, K., Hoseney, R. C., Zeleznak, K., Rogers, D. E., 1984. Effects of waxy
barley starch and reheating on firmness of bread crumb. Cereal Chemistry, 61, 281-
285.
Giese, J., 1992. Advances in microwave food processing. Food Technology, 46 (9),
118-123.
Goesaert, H., Brijs, K., Veraverbeke, W. S., Courtin, C. M., Gebruers, K., Delcour, J.
A., 2005. Wheat flour constituents: how they impact bread quality, and how to
impact their functionality. Trends in Food Science and Technology 16, 12–30.
Gómez, M., Oliete, B., Caballero, P. A., Ronda, F., Blanco, C. A., 2008. Effect of nut
paste enrichment on wheat dough rheology and bread volume. Food Science
Technology International, 14, 57–65.
Gómez, M., Ronda, F., Blanco, C. A., Caballero, P. A., Apestequia, A., 2003. Effects
of dietary fiber on dough rheology and bread quality. European Food Research
Technology, 216, 51–56.
Gonzales-Barron, U. and Butler, F., 2008. Fractal texture analysis of bread crumb
digital images. European Food Research and Technology, 226, 721–729.
Gray, J. A. and BeMiller, J. N., 2003. Bread staling: molecular basis and control.
Comprehensive Review in Food Science and Food Safety, 2, 1–21.
Guarda, A., Rosell, C. M., Beneditode Barber, C., Galotto, M. J., 2004. Different
hydrocolloids as bread improvers and antistaling agents. Food Hydrocolloids,
18,241–247.
Gudmundsson, M., 1994. Retrogradation of starch and the role of its components.
Thermochimica Acta, 246, 329-341.
131
Gujral, H. S., Guardiola, I., Carbonell, J. V., Rosell, C. M., 2003a. Effect of
cyclodextrinase on dough rheology and bread quality from rice flour. Journal of
Agriculture and Food Chemistry, 51, 3814-3818.
Gujral, H. S., Haros, M., Rosell, C. M., 2003b. Starch Hydrolyzing Enzymes for
Retarding the Staling of Rice Bread.Cereal Chemistry, 80, 750–754.
Gujral, S. G. and Rosell, C. M., 2004. Improvement of the breadmaking quality of
rice flour by glucose oxidase. Food Research International 37, 75–81.
Hamer, R. J., 2005. Coeliac Disease: Background and biochemical aspects.
Biotechnology Advances, 23(6), 401-408.
Hegenbert, S., 1992. Microwave quality: Coming of age. Food Product Design, 17,
29-52.
Hoseney, R. C., 1986. Principles of cereal science and technology, (2nd
eds.),
American Association of Cereal Chemists, Inc., St. Paul, Minnesota, USA, pp. 205–
206.
Hug-Iten, S., Escher, F., Conde-Petit, B., 2003. Staling of bread: Role of amylose
and amylopectin and influence of starch-degrading enzymes. Cereal Chemistry, 80,
654–661.
Impoco, G., Carrato, S., Caccamo, M., Tuminello, L., Licitra, G., 2007. Quantitative
analysis of cheese microstructure using SEM imagery. Communications to SIMAI
Congress, 2, 1-10.
Ishida, N., Takano, H., Naito, S., Isobe, S., Uemura, K., Haishi, T., Kose, K.,
Koizumi, M., Kano, H., 2001. Architecture of baked breads depicted by a magnetic
resonance imaging, Magnetic Resonance Imaging, 19, 867–874.
Ji, Y., Zhu K., Zhou, H., Qian, H., 2010. Study of the retrogradation behavior of rice
cakes using rapid visco analyzer, Fourier transform infrared spectroscopy and X-ray
analysis. International food science and technology, 45, 871-876.
Kadan, R. S., Robinsonm, M. G., Thibodeux, D. P., Pepperman, A. B., 2001. Texture
and other physiochemical properties of whole rice bread.Journal of Food Science,
66,940-944.
Kang, M.Y., Choi, Y.H., Choi, H. C., 1997. Effects of gums, fats and glutens adding
on processing and quality of milled rice bread. Korean Society for Food Science and
Technology 29, 700–704.
Karim, A.A., Norziah, M. H., Seow, C. C., 2000. Methods for the study of starch
retrogradation.Food Chemistry, 71, 9-36.
132
Kassama, L. S. and Ngadi, M. O., 2005. Pore development and moisture transfer in
chicken meat during deep-fat frying. Drying Technology, 23, 907–923
Kelkar, S., Stella, S., Boushey, C., Okos, M., 2011. Developing novel 3D
measurement techniques and prediction method for food density determination,
Procedia Food Science, 1, 483–491.
Keskin, S. O., Ozturk, S., Sahin, S., Koksel, H., Sumnu, G., 2005. Halogen lamp-
microwave combination baking of cookies. European Food Research and
Technology, 220, 546-551.
Keskin, S. O., Sumnu, S., Sahin, S., 2004. Bread baking in halogen lamp-microwave
combination oven. Food Research International, 37, 489-495.
Keskin, S. O., Sumnu, S., Sahin, S., 2007. A study on the effects of different gums
ondielectric properties and quality of breads baked in infrared-microwave
combination oven. European Food Research and Technology, 224(3), 329-334.
Kohajdova, Z. and Karovicova, J., 2009. Application of hydrolloids as baking
improvers. Chemical Papers, 63, 26–38.
Kohajdová, Z., Karovi ová, J., Schmidt, S., 2009. Significance of Emulsifiers and
Hydrocolloids in Bakery Industry. Acta Chimica Slovaca, 2, 46 – 61.
Kokelaar, J. J., Garritsen, J. A., Prins, A., 1995. Surface rheological properties of
sodium stearoyl-2-lactylate (SSL) and diacetyl tar- taric esters of mono (and di)
glyceride (DATEM) surfactants after a mechanical surface treatment in relation to
their bread improv- ing abilities. Colloids and Surfaces A: Physicochemical and
Engineering Aspects, 95, 69–77.
Kök, M. S., Hill, S. E., Mitchell, R., 1999. A Comparison of the rheological
behaviour of crude and refined locust bean gum preparations during thermal
processing. Carbohydrate Polymers, 38, 261–265.
Köksel, F., 2009. Effects of xanthan and guar gums on quality and staling of gluten-
free cakes baked in microwave infrared combination oven, MS Thesis, METU,
Ankara.
Krog, N., 1981. Theoretical aspects of surfactants in relation to their use in
breadmaking.Cereal Chemistry, 58(3), 158-164.
Langton, M., Aström, A., Hermansson, A., 1996. Texture as a reflection of
microstructure. Food Quality and Preference, 7(3-4), 185-191.
Lazaridou, A., Duta, D., Papageorgiou, M., Belc, N., Biliaderis, C.G., 2007. Effects
of hydrocolloids on dough rheology and bread quality parameters in gluten-free
formulations. Journal of Food Engineering, 79, 1033–1047.
133
Lebesi, D. M. and Tzia, C., 2009. Effect of the addition of different dietary fiber and
edible cereal bran sources on the baking and sensory characteristics of cupcakes.
Food Bioprocess Technology.
Lee, M. and Lee, Y., 2006. Properties of gluten-free rice breads using different rice
flours prepared by dry, wet and semi-wet milling. Food Engineering Progress 10,
180– 185.
Leray, G., Oliete, B., Mezaize, S., Chevallier, S., De Lamballerie, M., 2010. Effects
of freezing and frozen storage conditions on the rheological properties of different
formulations of non-yeasted wheat and gluten-free bread dough. Journal of Food
Engineering,100 (1), 70-76.
Lopez, A. C. B., Pereira, A. J. G., Junqueira, R. G., 2004. Flour mixture of rice flour,
corn and cassava starch in the production of gluten free white bread. Brazilian
Archives of Biology and Technology 47 (1), 63–70.
Malkin, A. Y. and Isayev, A. I., 2006. Pressure corrections. In: Rheology: concepts,
methods, and applications (1st ed.). ChemTac Publishing, Toronto, pp. 253-320.
Mandala, I. G., Savvas, T. P., Kostaropoulos, A. E., 2004. Xanthan and locust bean
gum influence on the rheology and structure of a white model-sauce. Journal of Food
Engineering, 64, 335-342.
Martin, M. L. and Hoseney, R. C., 1991. A mechanism of bread firming. 2. Role of
starch hydrolyzing enzymes. Cereal Chemistry, 68, 503-507.
McCarthy, D. F., Gallagher, E., Gormley, T. R. Schober, T. J., Arendt, E. K., 2005.
Application of response surface methodology in the development of gluten-free
bread. Cereal Chemistry, 82 (5), 609-615.
McLoughlin, R., Sebastian, S. S, Qasim, A., McNamara, D., O’Connor, H. J.,
Buckley, M., O’Morain, C., 2003. Coeliac disease in Europe, Aliment Pharmacology
Therapeutics, 18, 45–48.
Meda, V., Orsat, V., Ragvahan, V., 2005. Microwave heating and the dielectric
properties of foods In: The microwave processing of foods, (Eds.) Helmar Schubert
and Mark Regier, CRC Press, Washington DC, USA, pp. 61-73.
Mendoza, N., 2005. Coeliac disease: and overview of the diagnosis, treatment and
management. British Nutrition Bulletin. 30, 231-236.
Metaxas, A. C., and Meredith, R. J., 1983. Industrial microwave heating. London:
Peter Peregrimus, pp. 6, 80.
134
Mettler, E. and Seibel, W., 1993. Effects of emulsifiers and hydrocolloids on whole
wheat bread quality: a response surface methodology study. Cereal Chemistry, 70(4),
373-7.
Mezaize, S., Chevallier, S., Le Bail, A., De Lamballerie, M., 2009. Optimization of
gluten-free formulations for French-style breads. Journal of Food Science, 74 (3),
140-146.
Moore, M. M., Heinbockel, M., Dockery, P., Ulmer, H. M., Arendt, E. K., 2006.
Network formation in gluten-free bread with application of transglutaminase. Cereal
Chemistry, 83, 28-36.
Moore, M. M., Juga, B., Schober, T. J., Arendt, E. K., 2007. Effect of lactic acid
bacteria onproperties of gluten-free sourdoughs, batters, and quality and
ultrastructure ofgluten-free bread. Cereal Chemistry 84, 357–364.
Moore, M. M, Schober, T. J., Peter, D., Arendt, E. K., 2004. Textural Comparisons
of Gluten-Free and Wheat-Based Doughs, Batters, and Breads. Cereal Chemisty,
81(5), 567-575.
Moreira, R., Chenlo, F., Torres, M. D., Prieto, D. M., 2010. Influence of particle size
on the rheological behavior of chestnut flour doughs. Journal of Food Engineering,
100(2), 270-277.
Moreira, R., Chenlo, F., Torres, M. D., 2011a. Rheology of commercial chestnut
flour doughs incorporated with gelling agents. Food Hydrocolloids, 25(5), 1361-
1371.
Moreira, R., Chenlo, F., Torres, M. D., 2011b. Rheological properties of commercial
chestnut flour doughs with different gums. International Journal of Food Science and
Technology, 46(10), 2085-2095.
Morgan, K. R., Hutt, L., Gerrard, J., Every, D., Ross, M., Gilpin, M., 1997.Staling in
Starch Breads: The Effect of Antistaling α-Amylase. Starch, 49(2), 54-59.
Mudgett, R. E., 1982. Electrical properties of foods in microwave processing. Food
Technology, 36: 109-115.
Mujumdar, A. S., 2007. Handbook of industrial drying, Chapter 18, Infrared drying,
Cristina Ratti, Arun S. Mujumdar 423-438.
Myers, R. H. and Montgomery, D. C., 2002. Response Surface Methodology (RSM):
Process and Product Optimization Using Designed Experiments. Wiley Interscience
Publication, New York, USA. pp. 1–3.
Nelson, A. L., 2001. High Fiber Ingredients. ( 1st eds.) Eagen Press Handbook Series,
AACC, Minnesota. pp. 44–61.
135
Niewinski, M. M. and MS, R. D., 2008. Advances in Celiac Disease and Gluten-Free
Diet, Journal of the American Dietetic Association, 661-672.
Nishita, K. D., Roberts, R. L., Bean, M. M., Kennedy, B. M., 1976. Development of
a yeast-leavened rice-bread formula. Cereal Chemistry, 53, 626-635.
Nunes, M. H. B., Moore, M. M., Ryan, L. A. M., Arendt, E. K., 2009. Impact of
emulsifiers on the quality and rheological properties of gluten-free breads and
batters. European Food Research and Technology, 228, 633–642.
Oladele, A. K. and Aina, J. O., 2007. Chemical composition and functional
properties of flour produced from two varieties of tigernut (Cyperusesculentus),
African Journal of Biotechnology, 6(21), 2473-2476.
Olsson, E. E. M., Trägårdh, A. C., Ahrné, L. M., 2005. Effect of Near-infrared
Radiation and Jet Impingement Heat Transfer on Crust Formation of Bread, Journal
of Food Science, 70 (8), 484-491.
Onyango, C., Unbehend, G., Lindhuaer, M. G., 2009. Effect of cellulose-derivatives
and emulsifiers on creep-recovery and crumb properties of gluten-free bread
prepared from sorghum and gelatinised starch. Food Research International, 42, 949–
955.
Orthoefer, F., 2008. Applications of emulsifiers in baked foods. In: Food Emulsifiers
and Their Applications, (Eds.) Gerard, L. H. and Hartel, R. W., (2nd
ed.), Springer,
New York, NY, USA, pp. 211-233.
Osella, C.A., Sanchez, H.D., Carrara, C. R., Torre, M. A. D. L., Buera, M. P., 2005.
Water Redistribution and Structural Changes of Starch During Storage of a Gluten-
free Bread. Starch/Stärke, 57, 208-216.
Osorio, F., Gahona, E., Alvarez, F., 2003. Water absorption effects on biaxial
extensional viscosity of wheat flour dough. Journal of Texture Studies 34, 147– 157.
Otsu, N., 1979. A threshold selection method from gray-level histograms. IEEE
Transactions on Systems Man Cybernet, SMC-9, 62–66.
Ozkoc, S. O., Sumnu, G., Sahin, S., 2009a. The effects of gums on macro and micro-
structure of breads baked in different ovens. Food Hydrocolloids, 23, 2182–2189.
Ozkoc, S. E., Sumnu, G., Sahin, S., Turabi, E., 2009b. Investigation of
physicochemical of breads baked in microwave and infrared-microwave combination
ovens during storage. European Food Research and Technology, 217, 8-19.
Ozmutlu, O., Sumnu, G., Sahin, S., 2001. Assessment of proofing of bread dough in
the microwave oven. European Food Research Technology, 212, 487–490.
136
Park, S. H., Wilson, J. D., Chung, O. K., Seib, P. A., 2004. Size distribution and
properties of wheat starch granules in relation to crumb score of pup-loaf bread.
Cereal Chemistry, 81, 699–704.
Patel, B. K., Waniska, R. D., Seetharaman, K., 2005. Impact of different baking
processes on bread firmness and starch properties in breadcrumb. Journal of Cereal
Science, 42,173–184.
Pateras, I.M.C., 2007. Bread spoilage and staling. In: Technology of Breadmaking,
Cauvain, S.P., Young, L.S. (Eds.), Springer, UK, pp. 275- 298,
Peressini, D., Pin, M., Sensidoni, A., 2011. Rheology and breadmaking performance
of rice-buckwheat batters supplemented with hydrocolloids. Food Hydrocolloids, 25
(3), 340-349.
Phimolsiripol, Y., Mukprasirt, A., Schoenlechner, R., 2012. Quality improvement of
rice-based gluten-free bread using different dietary fibre fractions of rice bran.
Journal of Cereal Science, 56 (2), 389–395.
Polaki, A., Xasapis, P., Fasseas, C., Yanniotis, S., Mandala, I., 2010. Fiber and
hydrocolloid content affect the microstructural and sensory characteristics of fresh
and frozen stored bread. Journal of Food Engineering, 97, 1–7.
Pomeranz, Y., Shogren, M. D., Finney, K. F., Bechtel, D. B., 1977. Fibre in
breadmaking–effects on functional properties. Cereal Chemistry, 54, 25-41.
Primo-Martín, C., van Dalen, G., Meinders, M. B. J., Don, A. Hamer, R. H., Van
Vliet, T., 2010. Bread crispness and morphology can be controlled by proving
conditions. Food Research International, 43, 207–217.
Ptaszek, P., Lukasiewicz, M., Achremowicz, B., Grzesik, M., 2007. Interaction of
hydrocolloid networks with mono- and oligosaccharides. Polymer Bulletin, 58, 295-
303.
Purhagen J. K., Sjöö, M. E., Eliasson A., 2012. The anti-staling effect of pre-
gelatinized flour and emulsifier in gluten-free bread. European Food Research
Technology, 235, 265–276.
Ranjan, R., Irudayaraj, J., Jun, S. 2002. Simulation of infrared drying process. Drying
Technology, 20(2), 363-379.
Renzetti, S., Dal Bello, F., Arendt, E. K., 2004. Microstructure, fundamental
rheology and baking characteristics of batters and breads from different gluten-free
flours treated with a microbial transglutaminase, Journal of Cereal Science, 48(1),
33-45.
137
Renzetti, S. and Arendt, E. K., 2009. Effect of protease treatment on the baking
quality of brown rice bread: From textural and rheological properties to biochemistry
and microstructure, Journal of Cereal Science, 50 (1), 22-28.
Resurreccion, A. V. A., 2008. Consumer sensory testing for food product
development. In: Developing New Food Products for a Changing Marketplace,
(Eds.), Brody, Aaron L., Lord, John B. ( 2nd
ed.), CRC Press Taylor and Francis
Group, FL, USA, pp. 5–25.
Ribotta, P. D., Ausar, S. F., Morcillo, M. H., Perez, G. T., Beltramo, D. M., Leon, A.
E., 2004a. Production of gluten-free bread using soybean flour. Journal of the
Science of Food and Agriculture, 84, 1969–1974.
Ribotta, P. D., Perez, G. T., Leon, A. E., Anon, M. C., 2004b. Effects of emulsifier
and guar gum on micro structural, rheological and baking performance of frozen
bread dough. Food Hydrocolloids, 18, 305-313.
Ribotta, P. D., Cuffini, S., Leon, A. E., 2004c. The staling of bread: X-ray diffraction
study. European Food and Research Technology, 218, 219-223.
Roccia P., Ribotta P. D., Ferrero C., Perez G.T., Leon A. E., 2012. Enzymes action
on wheat-soy dough properties and bread quality. Food Bioprocess and Technology,
5, 1255-1264.
Rosell, C. M. and Collor, C., 2007. Rise based products. In: Handbook of Food
Products Manufacturing (Ed) H.Y. Hui. Hoboken, NJ: Wiley-Interscience, pp. 523–
523.
Rosell, C. M. and Marco, C., 2008. Rice. In: Gluten-free Cereal Products and
Beverages, Arendt, E. K and Dal Bello, F, (1st ed.), Academic Press, Oxford, UK, pp.
81-101.
Rosell C. M., Rojas, J. A., Benedito de Barber, C., 2001. Influence of hydrocolloids
on dough rheology and bread quality. Food Hydrocolloids, 15, 75–81.
Rosell, C. M. and Santos, E., 2010. Impact of fibers on physical characteristics of
fresh and staled bake off bread. Journal of Food Engineering, 98, 273–281.
Rouille, J., Valle, G. D., Devaux, M. F., Marion, D., Dubreil, L., 2005. French bread
loaf volume variations and digital imageanalysis of crumb grain changes induced by
the minor components of wheat flour. Cereal Chemistry, 82, 20–27.
Russ, J. C., 2004. Image analysis of food microstructure. Boca Raton, London.
Sabanis, D., Lebesi, D., Tzia, C., 2009. Effect of dietary fibre enrichment on selected
properties of gluten-free bread. Food Science and Technology, 42, 1380–1389.
138
Sacchetti, G., Pinnavaia, G. G., Guidolin E., Dalla-Rosa M., 2004. Effects of
extrusion temperature and feed composition on the functional, physical and sensory
properties of chestnut and rice flour-based snack-like products. Food Research
International, 37, 527-534.
Sahin S. and Sumnu S. G., 2006. Physical Properties of Foods. New York. Springer,
USA, pp.27, 241-242.
Sakiyan, O., Sumnu, G., Sahin, S., Meda, V., Koksel, H., Chang, P., 2011. A study
on degree of starch gelatinization in cakes baked in three different ovens. Food
Bioprocess Technology, 4, 1237-1244.
Sanchez, H. D., Osella, C. A., De La Torre, M. A., 2002. Optimization of gluten-free
bread prepared from cornstarch, rice flour, cassava starch. Journal of Food Science.
67, 416-419.
Sanchez, H. D., Osella, C. A., De La Torre, M. A., 2004. Use of response surface
methodology to optimize gluten-free bread fortified with soy flour and dry milk.
Food Science and Technology International, 10, 5-9.
Sanchez-Pardo, M. E., Ortiz-Moreno, A., Mora-Escobedo, R., Chanona-Perez, J. J.,
Necoechea-Mondragon, H., 2008. Comparison of crumb microstructure from pound
cakes baked in a microwave or conventional oven. LWT- Food Science and Tech-
nology, 41, 620–627.
Sánchez-Zapata, E., Munoz, C. M., Fuentes, E., Fernández-López, J., Sendra, E.,
Sayas, E., 2010. Effect of tigernut fibre quality characteristics of pork burger. Meat
Science, 85, 70–76.
Santos, E., Collar, C., Rosell, M. C., 2008. Gelatinisation and retrogradation kinetics
of high fibre-wheat flour blends: a calorimetric approach. Cereal Chemistry, 85, 455–
463.
Sapirstein, H. D., Roller, R., Bushuk, W., 1994. Instrumental measurement of bread
crumb grain by digital image analysis. Cereal Chemistry, 71(4), 383–391.
Sarkar, N. and Walker, L.C., 1995. Hydration-dehydration properties
of.methylcellulose and hydroxyprophylmethylcellulose. Carbohydrate Polymers, 27,
177–185.
Schober, T. J., Messerschmidt, M., Bean, S. R., Park, S., Arendt, E. K., 2005.
Gluten-Free Bread from Sorghum: Quality Differences Among Hybrids. Cereal
Chemistry, 82 (4), 394-404.
Schober, T. J., Bean, S. R., Boyle, D. L., 2007. Gluten-free sorghum bread improved
by sourdough fermentation: biochemical, rheological, and microstructural
background. Journal of Agricultural and Food Chemistry 55, 5137–5146.
139
Sciarini, L. S., Ribotta, P. D., Leon, A. E., Perez, G. T., 2010a. Influence of gluten-
free flours and their mixtures on batter properties and bread qualities. Food
Bioprocess Technology, 3, 577–585.
Sciarini, L. S., Ribotta, P. D., León, A. E., Pérez, G. T., 2010b. Effect of
hydrocolloids on gluten-free batter properties and bread quality. International Journal
of Food Science and Technology, 45, 2306-2312.
Sciarini, L. S. Ribotta, P. D. León, A. E., Pérez G. T., 2012. Incorporation of several
additives into gluten free breads: Effect on dough properties and bread quality.
Journal of Food Engineering, 111(4), 590-597.
Selomulyo, V. O. and Zhou, W., 2007. Frozen bread dough: Effects of freezing
storage and dough improvers. Journal of Cereal Science, 45, 1-17.
Sepulveda, D. R. and Barbosa-Canovas, G. V., 2003. Heat transfer in food products.
In: Transport phenomena in food processing. J.W. (Eds.) Chanes, J.F. Velez-Ruiz,
G.V. Barbosa-Canovas. Food Preservation Technology Series.
Seyhun, N., 2002. Retardation of staling of microwave baked cakes, MS Thesis,
METU, Ankara.
Shyu, Y. S., Sung, W. C., Chang, M. H., Hwang, J. Y., 2008. Effect of Far Infrared
Oven on the Qualities of Bakery Products, 6 (2-3), 105-118.
Shogren, M. D., Pomeranz, Y., Finney, K. F., 1981. Counteracting the deleterious
effects of fibre in breadmaking. Cereal Chemisry 58, 142–144.
Sievert, D., Pomeranz, Y., Abdelrahman, A., 1990. Functional properties of soy
polysaccharides and wheat bran in soft wheat products. Cereal Chemistry 67, 10–13.
Sivaramakrishnan, H. P., Senge, B., Chattopadhyay, P. K., 2004. Rheological
properties of rice dough for making rice bread.Journal of Food Engineering, 62(9),
37–45.
Smits, A. L. M., Ruhnau, F. C., Vliagenthart, J. F. G., Van Soest, J. J. G., 1998.
Ageing of starch based systems as observed with FT-IR and solid state NMR
spectroscopy. Starch/Stärke, 50, 478-483.
Stampfli, L. And Nersten, B., 1995. Emulsifiers in bread making. Food Chemistry,
52, 353-360.
Stauffer, C. E., 1990. Leaving Agent. In: Functional Additives for Bakery Foods.
AVI book, New York, USA, pp.183.
Steffe, J.F., 1996. Rheological methods in food process engineering. MI. Freeman
Press.
140
Sumnu, G., 1997. Optimization of microwave baking of cakes, PhD Thesis, METU,
Ankara.
Sumnu, G., 2001. A review on microwave baking of foods. International Journal of
Food Science and Technology, 36, 117-127.
Sumnu, G., Koksel, F., Sahin, S., Basman, A., Meda, V., 2010. The effects ofxanthan
and guar gums on staling of gluten-free rice cakes baked in different ovens.
International Journal of Food Science and Technology, 45 (1), 87-93.
Sumnu, G. S., Ndife, M. K., Bayındırlı, L., 2000. Effects of sugar, protein and water
content on wheat starch gelatinization due to microwave heating. European Food
Research Technology 211, 169–174.
Sumnu G. and Sahin S., 2005a. Recent Developments in Microwave Processing.
In: Emerging Technologies for Food Processing. D. Sun, (Ed). (pp. 419-444),
Elsevier, UK.
Sumnu, G. and Sahin, S., 2005b. Baking using microwave processing. In: The
Microwave Processing of Foods. H. Schubert and M. Regier (Eds), Woodhead
Publishing Limited. Cambridge, pp.119-141.
Sumnu, G., Sahin, S., Sevimli, K. M., 2005. Microwave, infrared and infrared-
microwave combination baking of cakes. Journal of Food Engineering, 71, 150–155.
Sweeny, R. A., Rexford, P. R., 1987. Comparison of LECO FP-228 ‘‘Nitrogen
Determinator” with AOAC Copper Catalyst Kjeldahl Method for Crude Protein.
Journal of the Association of Official Analytical Chemists, 70, 1028– 1030.
Sworn, G., 2000. Xanthan gum. In: Philips and Williams, (1st ed.), Handbook of
hydrocolloids, Woodhead, Cambridge, England, pp. 103-115.
Tamstorf, S., 1983. Emulsifiers for bakery and starch products. Grindsted Technical
Paper, TP 9-le, pp. l-27.
Tandoruk, O., 2005. Çölyak dosyası. Dünya gıda dergisi, pp. 15–25.
Tang, J., 2005. Dielectric properties of foods, Chapter 2. The microwave processing
of foods, Edited by Helmar Schubert and Mark Regier, CRC Press, Washington DC,
USA, 22-38.
Thomson, D., 1982. Response Surface Experimentation. Journal of Food Processing
and Preservation, 6, 155-188.
Tlapale-Valdivia, A. D., Chanona-Pérez, J. J., Mora-Escobedo, R., Farrera-Rebollo,
R. R., Gutiérrez-López, G. F., Calderón- Domínguez, G., 2010. Dough and crumb
grain changes during mixing and fermentation and their relation with extension
141
properties and bread quality of yeasted sweet dough. International Journal of Food
Science and Technology, 45(3), 530–539.
Toufeili, I., Dagher, S., Shadarevian, S., Noureddine, A., Sarakbi, M., Farran, M. T.,
1994. Formulation of gluten-free pocket type flat breads: optimization of
methylcellulose, gum arabic, and egg albumen levels by response surface
methodology. Cereal Chemistry, 71(6), 594-601.
Tronsmo, K. M., Faergestad, E. M., Longva, A., Schofield, J. D., Magnus, E. M.,
2002. A Study of how Size Distribution of Gluten Proteins, Surface Properties of
Gluten and Dough Mixing Properties Relate to Baking Properties of Wheat Flours.
Journal of Cereal Science, 35(2), 201-214.
Turabi, 2010. Design of gluten-free rice cake formulations for baking in infrared-
microwave combination oven. PhD Thesis, METU, Ankara.
Turabi, E., Sumnu, G., Sahin, S., 2008a. Rheological properties and quality of rice
cakes formulated with different gums and an emulsifier blend. Food Hydrocolloids,
22, 305–312.
Turabi, E., Sumnu, G., Sahin, S., 2008b. Optimization of baking of rice cakes in
infrared microwave combination oven by response surface methodology. Food and
Bioprocess Technology, 1: 64–73.
Turabi, E., Sumnu, G., Sahin, S., 2010. Quantitative analysis of macro and
microstructure of gluten-free rice cakes containing different types of gums baked in
different ovens. Food Hydrocolloids, 24 (8), 755-762.
Turkey Standards Institution (TSE) standard for gluten reduced and gluten-free
foods, 2005. (TS 13143).
Urlacher, B. and Noble, O., 1997. Xanthan. In: Thickening and gelling agents for
food. In: A. Imeson (Ed.), Chapman and Hall, London. pp. 84.
Van Der Borght, A., Goesaert, H., Veraverbeke, W. S., Delcour, J., 2005.
Fractionation of wheat and wheat flour into starch and gluten: overview of the main
processes and the factors involved. Journal of Cereal Science, 41(3), 221-237.
Van Riemsdijk, L. E., Van der Goot, A. J., Hamer, R. J., Boom, R. M., 2011.
Preparation of gluten-free bread using a meso-structured whey protein particle
system. Journal of Cereal Science, 53, 355-361.
Van Soest, J. J. G., de Wit, D., Tournois, H., Vliegenthart, J. F. G., 1994.
Retrogradation of potato starch as studied by Fourier transform infrared-
spectroscopy. Starch/Stärke, 46, 453-457.
142
Van Soest, J. J. G., Tournois, H., de Wit, D., Vliegenthart, J. F. G., 1995. Short-range
structure in (partically) crystalline potato starch determined with attenuated total
reflectance Fourier-transform IR spectroscopy. Carbohydrate research, 279,201-214.
Varavinit, S., Shobsngob, S., Varanyanondc, W., Chinachotid, P., Naivikule, O.,
2003. Effect of Amylose Content on Gelatinization, Retrogradation and Pasting
Properties of Flours from Different Cultivars of Thai Rice.Starch/Stärke, 55,410–
415.
Wang, S, Austin, P, Bell, S., 2011. It’s a maze: The pore structure of bread crumbs.
Journal of Cereal Science, 54, 203-210.
Wang, T.L., Bogracheva, T. Ya., Hedley, C. L., 1998. Starch: as simple as A, B, C?.
Journal of experimental botany, 49, 481-502.
Wielinga, W.C., and Maehall, A. G., 2000. Galactomannans. In: Philips and
Williams, (1st ed.), Handbook of hydrocolloids (pp. 137-155). Woodhead,
Cambridge, England.
Wilson, R. H., Goodfellow, B. J., Belton, P.S., 1991. Comparison of Fourier
Transform Mid Infrared Spectroscopy and Near Infrared Reflectance Spectroscopy
with Differential Scanning Calorimetry for the Study of the Staling of Bread. Journal
of the Science of Food and Agriculture, 54, 471-483.
Zayas, I. Y., 1993. Digital image texture analysis for bread crumb grain evaluation.
Cereal Foods World, 38(10), 760–766.
Zghal, M. C., Scanlon, M. G., Sapirstein, H. D., 1999. Prediction of bread crumb
density by digital image analysis. Cereal Chemistry, 76, 734–742.
Zghal, M. C., Scanlon, M. G., Sapirstein, H. D., 2002. Cellular structure of bread
crumb and its influence on mechanical properties. Journal of Cereal Science, 36,
167−176.
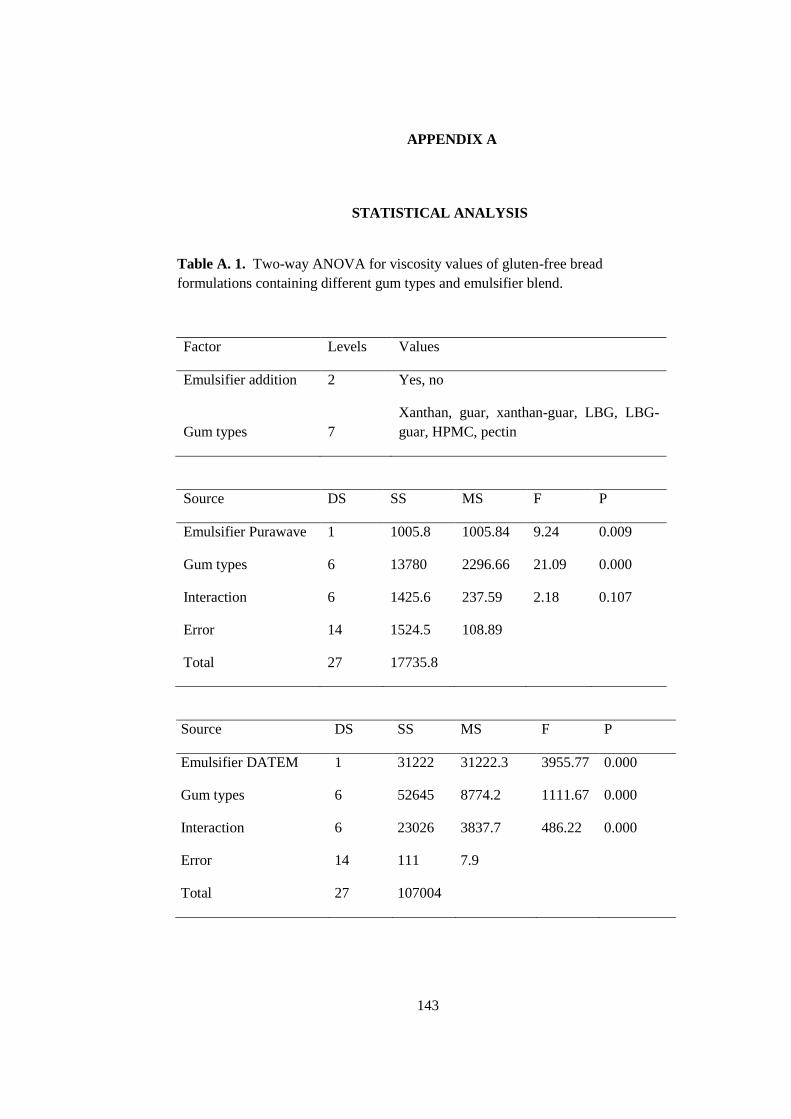
143
APPENDIX A
6. STATISTICAL ANALYSIS
Table A. 1. Two-way ANOVA for viscosity values of gluten-free bread
formulations containing different gum types and emulsifier blend.
Factor Levels Values
Emulsifier addition 2 Yes, no
Gum types 7
Xanthan, guar, xanthan-guar, LBG, LBG-
guar, HPMC, pectin
Source DS SS MS F P
Emulsifier Purawave 1 1005.8 1005.84 9.24 0.009
Gum types 6 13780 2296.66 21.09 0.000
Interaction 6 1425.6 237.59 2.18 0.107
Error 14 1524.5 108.89
Total 27 17735.8
Source DS SS MS F P
Emulsifier DATEM 1 31222 31222.3 3955.77 0.000
Gum types 6 52645 8774.2 1111.67 0.000
Interaction 6 23026 3837.7 486.22 0.000
Error 14 111 7.9
Total 27 107004
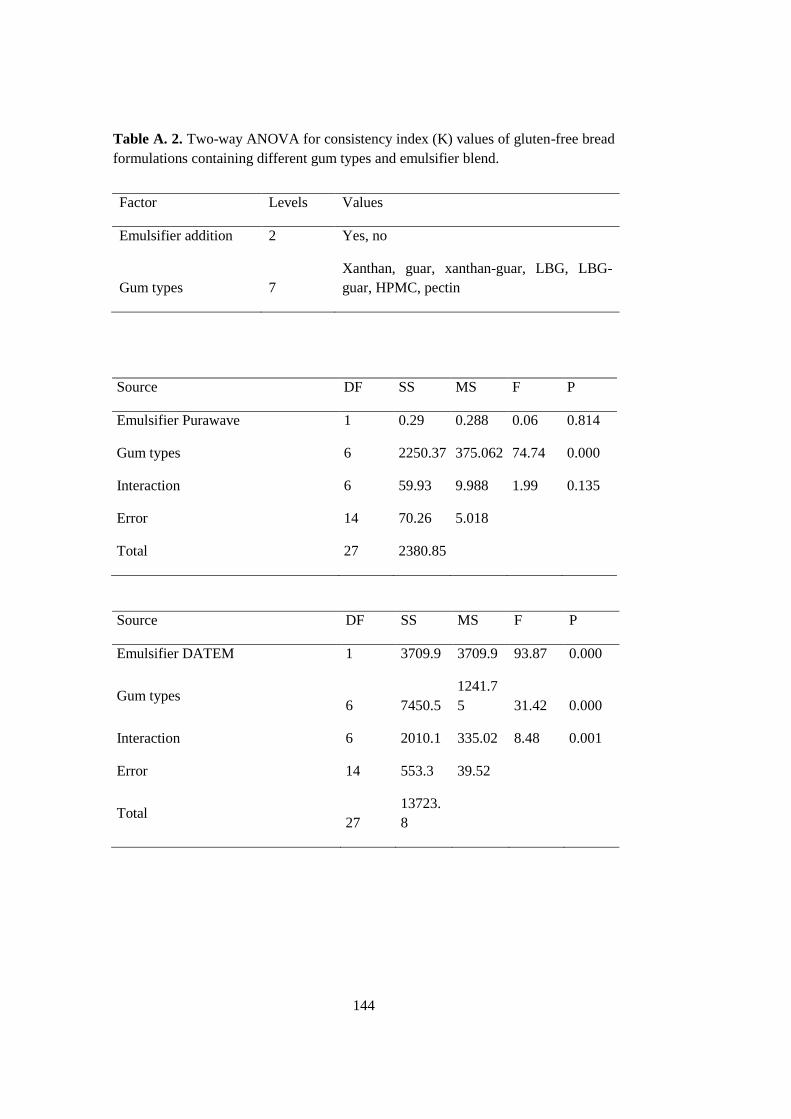
144
Table A. 2. Two-way ANOVA for consistency index (K) values of gluten-free bread
formulations containing different gum types and emulsifier blend.
Factor Levels Values
Emulsifier addition 2 Yes, no
Gum types 7
Xanthan, guar, xanthan-guar, LBG, LBG-
guar, HPMC, pectin
Source DF SS MS F P
Emulsifier Purawave 1 0.29 0.288 0.06 0.814
Gum types 6 2250.37 375.062 74.74 0.000
Interaction 6 59.93 9.988 1.99 0.135
Error 14 70.26 5.018
Total 27 2380.85
Source DF SS MS F P
Emulsifier DATEM 1 3709.9 3709.9 93.87 0.000
Gum types 6 7450.5
1241.7
5 31.42 0.000
Interaction 6 2010.1 335.02 8.48 0.001
Error 14 553.3 39.52
Total
27
13723.
8
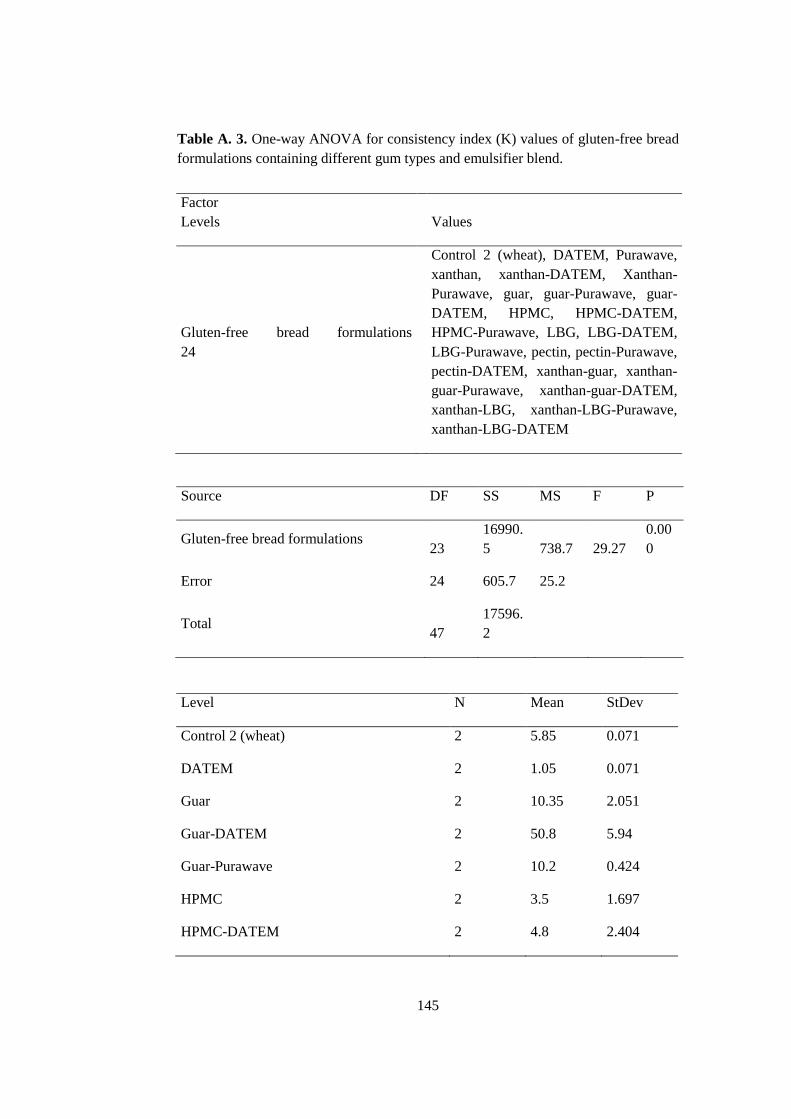
145
Table A. 3. One-way ANOVA for consistency index (K) values of gluten-free bread
formulations containing different gum types and emulsifier blend.
Factor
Levels
Values
Gluten-free bread formulations
24
Control 2 (wheat), DATEM, Purawave,
xanthan, xanthan-DATEM, Xanthan-
Purawave, guar, guar-Purawave, guar-
DATEM, HPMC, HPMC-DATEM,
HPMC-Purawave, LBG, LBG-DATEM,
LBG-Purawave, pectin, pectin-Purawave,
pectin-DATEM, xanthan-guar, xanthan-
guar-Purawave, xanthan-guar-DATEM,
xanthan-LBG, xanthan-LBG-Purawave,
xanthan-LBG-DATEM
Source DF SS MS F P
Gluten-free bread formulations 23
16990.
5 738.7 29.27
0.00
0
Error 24 605.7 25.2
Total
47
17596.
2
Level N Mean StDev
Control 2 (wheat) 2 5.85 0.071
DATEM 2 1.05 0.071
Guar 2 10.35 2.051
Guar-DATEM 2 50.8 5.94
Guar-Purawave 2 10.2 0.424
HPMC 2 3.5 1.697
HPMC-DATEM 2 4.8 2.404

146
HPMC-Purawave 2 5.05 0.071
LBG 2 4.6 0.141
LBG-DATEM 2 14.1 1.414
LBG-Purawave 2 2.72 0.82
LBG-xanthan 2 15.9 0.99
LBG-xanthan-DATEM 2 46.1 20.365
LBG-xanthan-Purawave 2 13.9 2.687
Pectin 2 0.7 0.141
Pectin-DATEM 2 3.4 0.424
Pectin-Purawave 2 2.2 0.354
Purawave 2 0.25 0.212
Xanthan 2 30.05 3.041
Xanthan-DATEM 2 61.2 5.233
Xanthan-guar 2 15.85 0.778
Xanthan-guar-DATEM 2 61.7 7.071
Xanthan-guar-Purawave 2 21.8 5.94
Xanthan-Purawave 2 26.5 2.97
Tukey Simultaneous Tests
All Pairwise Comparions among Level of Gluten free bread formulations
Gluten-free bread formulations= control 2 (wheat) subtracted from:
Gluten-free bread formulations Lower Center Upper
DATEM -25.26 -4.8 15.66
Guar -15.96 4.5 24.96
Guar-DATEM 24.49 44.95 65.41
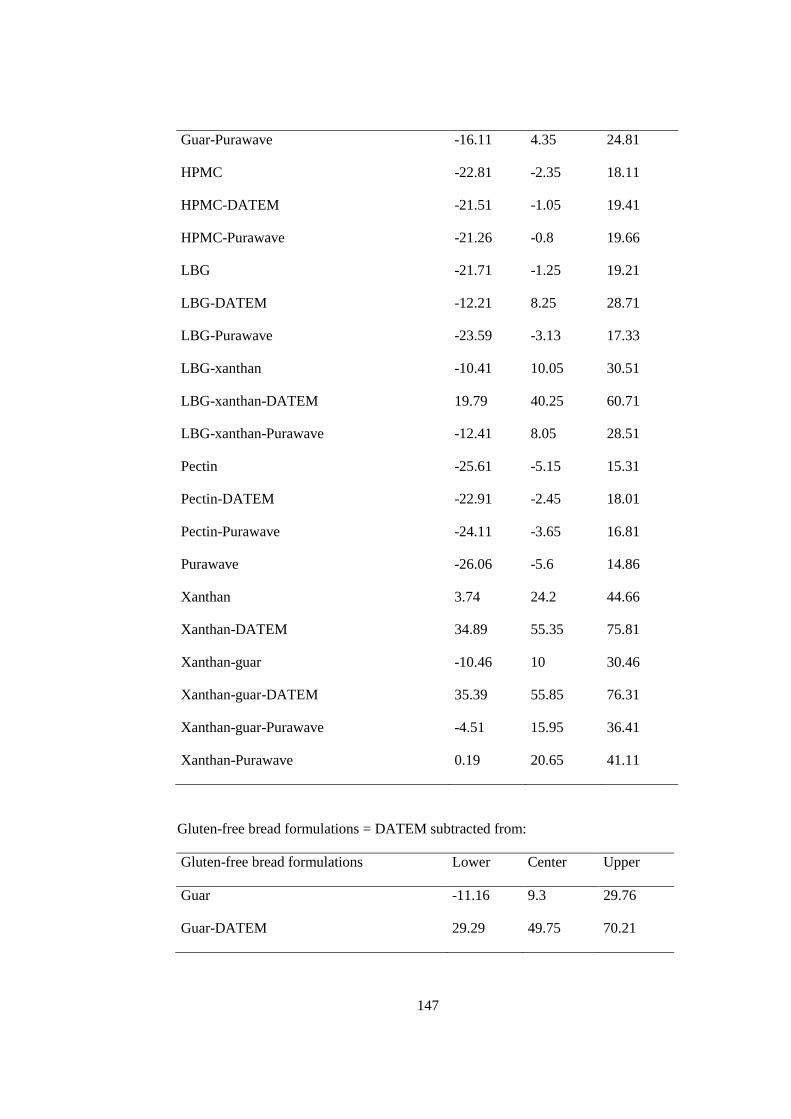
147
Guar-Purawave -16.11 4.35 24.81
HPMC -22.81 -2.35 18.11
HPMC-DATEM -21.51 -1.05 19.41
HPMC-Purawave -21.26 -0.8 19.66
LBG -21.71 -1.25 19.21
LBG-DATEM -12.21 8.25 28.71
LBG-Purawave -23.59 -3.13 17.33
LBG-xanthan -10.41 10.05 30.51
LBG-xanthan-DATEM 19.79 40.25 60.71
LBG-xanthan-Purawave -12.41 8.05 28.51
Pectin -25.61 -5.15 15.31
Pectin-DATEM -22.91 -2.45 18.01
Pectin-Purawave -24.11 -3.65 16.81
Purawave -26.06 -5.6 14.86
Xanthan 3.74 24.2 44.66
Xanthan-DATEM 34.89 55.35 75.81
Xanthan-guar -10.46 10 30.46
Xanthan-guar-DATEM 35.39 55.85 76.31
Xanthan-guar-Purawave -4.51 15.95 36.41
Xanthan-Purawave 0.19 20.65 41.11
Gluten-free bread formulations = DATEM subtracted from:
Gluten-free bread formulations Lower Center Upper
Guar -11.16 9.3 29.76
Guar-DATEM 29.29 49.75 70.21
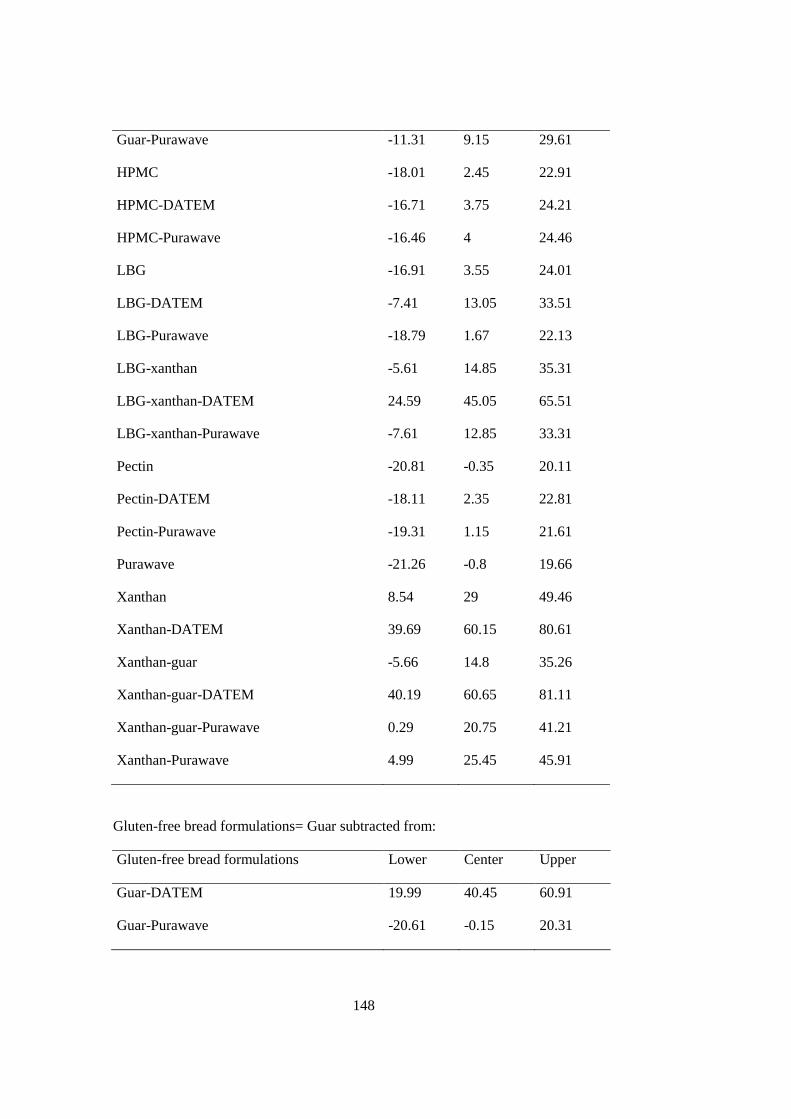
148
Guar-Purawave -11.31 9.15 29.61
HPMC -18.01 2.45 22.91
HPMC-DATEM -16.71 3.75 24.21
HPMC-Purawave -16.46 4 24.46
LBG -16.91 3.55 24.01
LBG-DATEM -7.41 13.05 33.51
LBG-Purawave -18.79 1.67 22.13
LBG-xanthan -5.61 14.85 35.31
LBG-xanthan-DATEM 24.59 45.05 65.51
LBG-xanthan-Purawave -7.61 12.85 33.31
Pectin -20.81 -0.35 20.11
Pectin-DATEM -18.11 2.35 22.81
Pectin-Purawave -19.31 1.15 21.61
Purawave -21.26 -0.8 19.66
Xanthan 8.54 29 49.46
Xanthan-DATEM 39.69 60.15 80.61
Xanthan-guar -5.66 14.8 35.26
Xanthan-guar-DATEM 40.19 60.65 81.11
Xanthan-guar-Purawave 0.29 20.75 41.21
Xanthan-Purawave 4.99 25.45 45.91
Gluten-free bread formulations= Guar subtracted from:
Gluten-free bread formulations Lower Center Upper
Guar-DATEM 19.99 40.45 60.91
Guar-Purawave -20.61 -0.15 20.31

149
HPMC -27.31 -6.85 13.61
HPMC-DATEM -26.01 -5.55 14.91
HPMC-Purawave -25.76 -5.3 15.16
LBG -26.21 -5.75 14.71
LBG-DATEM -16.71 3.75 24.21
LBG-Purawave -28.09 -7.63 12.83
LBG-xanthan -14.91 5.55 26.01
LBG-xanthan-DATEM 15.29 35.75 56.21
LBG-xanthan-Purawave -16.91 3.55 24.01
Pectin -30.11 -9.65 10.81
Pectin-DATEM -27.41 -6.95 13.51
Pectin-Purawave -28.61 -8.15 12.31
Purawave -30.56 -10.1 10.36
Xanthan -0.76 19.7 40.16
Xanthan-DATEM 30.39 50.85 71.31
Xanthan-guar -14.96 5.5 25.96
Xanthan-guar-DATEM 30.89 51.35 71.81
Xanthan-guar-Purawave -9.01 11.45 31.91
Xanthan-Purawave -4.31 16.15 36.61
Gluten-free bread formulations= Guar-DATEM subtracted from:
Gluten-free bread formulations Lower Center Upper
Guar-Purawave -61.06 -40.6 -20.14
HPMC -67.76 -47.3 -26.84
HPMC-DATEM -66.46 -46 -25.54
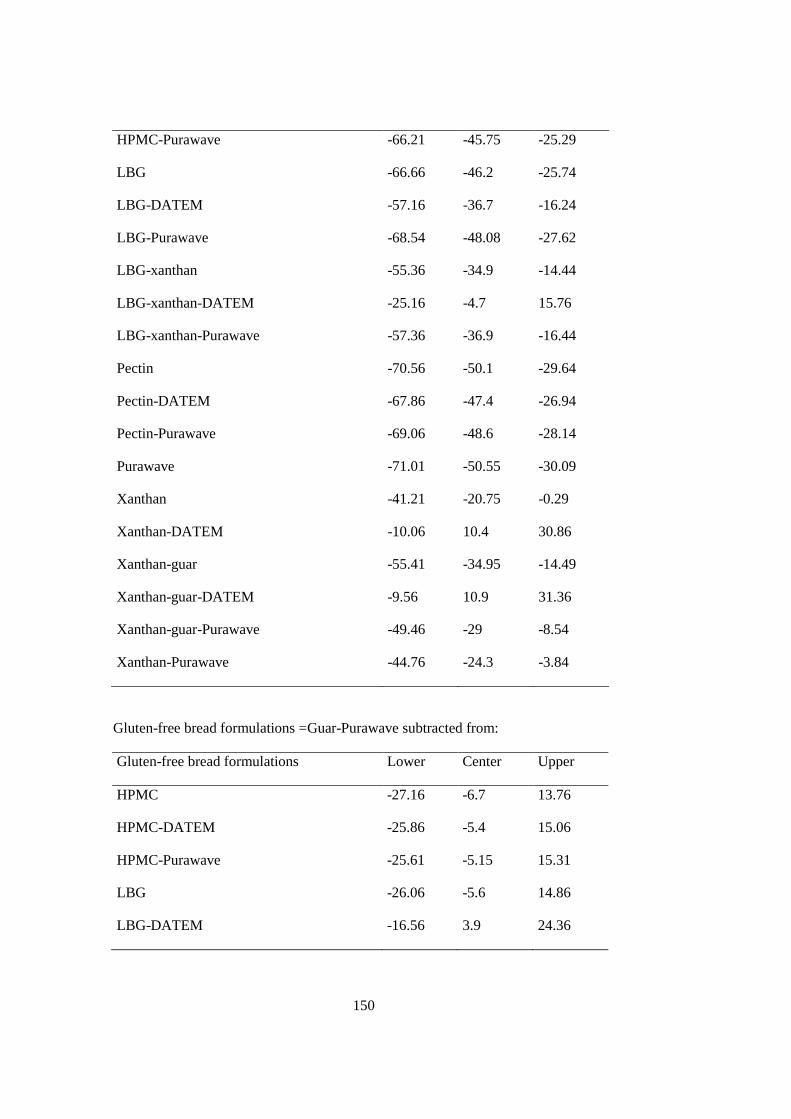
150
HPMC-Purawave -66.21 -45.75 -25.29
LBG -66.66 -46.2 -25.74
LBG-DATEM -57.16 -36.7 -16.24
LBG-Purawave -68.54 -48.08 -27.62
LBG-xanthan -55.36 -34.9 -14.44
LBG-xanthan-DATEM -25.16 -4.7 15.76
LBG-xanthan-Purawave -57.36 -36.9 -16.44
Pectin -70.56 -50.1 -29.64
Pectin-DATEM -67.86 -47.4 -26.94
Pectin-Purawave -69.06 -48.6 -28.14
Purawave -71.01 -50.55 -30.09
Xanthan -41.21 -20.75 -0.29
Xanthan-DATEM -10.06 10.4 30.86
Xanthan-guar -55.41 -34.95 -14.49
Xanthan-guar-DATEM -9.56 10.9 31.36
Xanthan-guar-Purawave -49.46 -29 -8.54
Xanthan-Purawave -44.76 -24.3 -3.84
Gluten-free bread formulations =Guar-Purawave subtracted from:
Gluten-free bread formulations Lower Center Upper
HPMC -27.16 -6.7 13.76
HPMC-DATEM -25.86 -5.4 15.06
HPMC-Purawave -25.61 -5.15 15.31
LBG -26.06 -5.6 14.86
LBG-DATEM -16.56 3.9 24.36
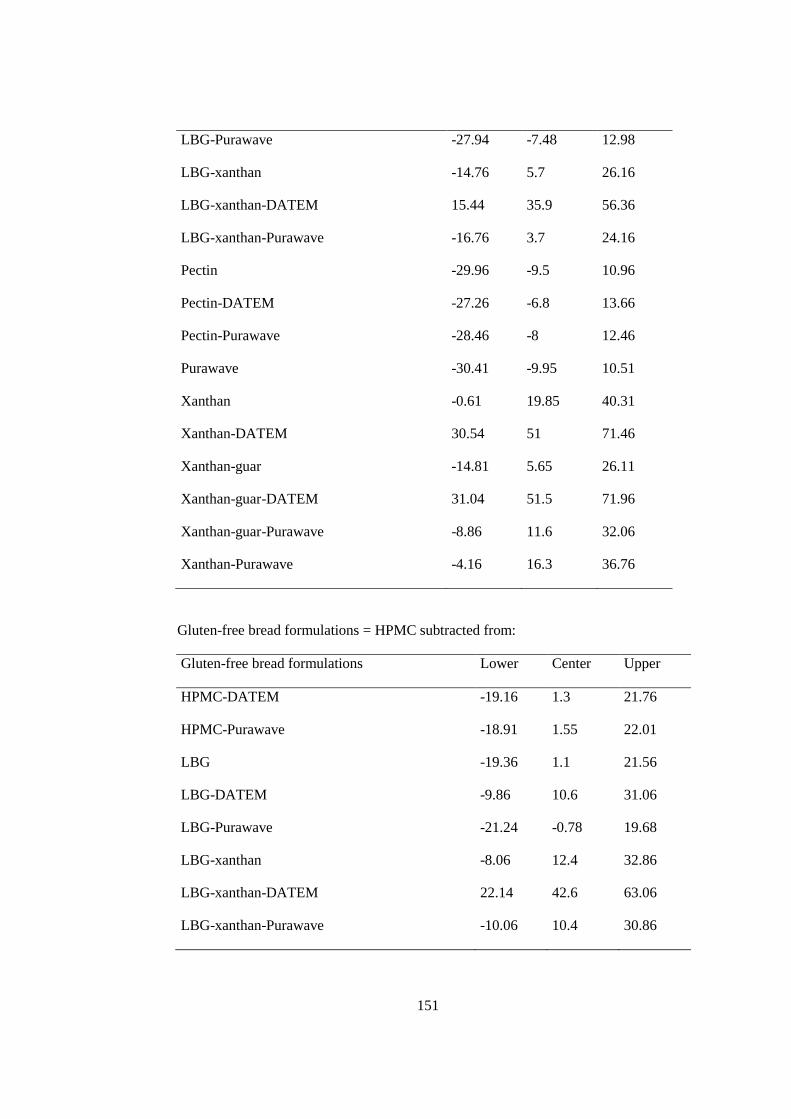
151
LBG-Purawave -27.94 -7.48 12.98
LBG-xanthan -14.76 5.7 26.16
LBG-xanthan-DATEM 15.44 35.9 56.36
LBG-xanthan-Purawave -16.76 3.7 24.16
Pectin -29.96 -9.5 10.96
Pectin-DATEM -27.26 -6.8 13.66
Pectin-Purawave -28.46 -8 12.46
Purawave -30.41 -9.95 10.51
Xanthan -0.61 19.85 40.31
Xanthan-DATEM 30.54 51 71.46
Xanthan-guar -14.81 5.65 26.11
Xanthan-guar-DATEM 31.04 51.5 71.96
Xanthan-guar-Purawave -8.86 11.6 32.06
Xanthan-Purawave -4.16 16.3 36.76
Gluten-free bread formulations = HPMC subtracted from:
Gluten-free bread formulations Lower Center Upper
HPMC-DATEM -19.16 1.3 21.76
HPMC-Purawave -18.91 1.55 22.01
LBG -19.36 1.1 21.56
LBG-DATEM -9.86 10.6 31.06
LBG-Purawave -21.24 -0.78 19.68
LBG-xanthan -8.06 12.4 32.86
LBG-xanthan-DATEM 22.14 42.6 63.06
LBG-xanthan-Purawave -10.06 10.4 30.86
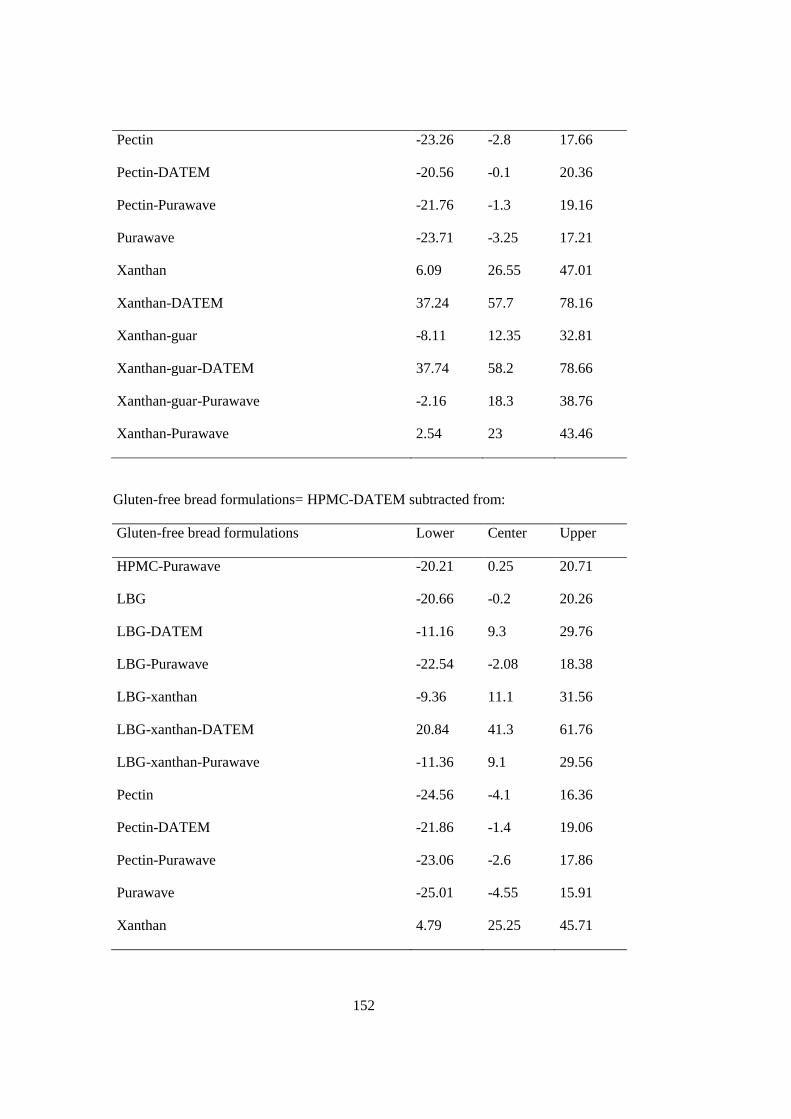
152
Pectin -23.26 -2.8 17.66
Pectin-DATEM -20.56 -0.1 20.36
Pectin-Purawave -21.76 -1.3 19.16
Purawave -23.71 -3.25 17.21
Xanthan 6.09 26.55 47.01
Xanthan-DATEM 37.24 57.7 78.16
Xanthan-guar -8.11 12.35 32.81
Xanthan-guar-DATEM 37.74 58.2 78.66
Xanthan-guar-Purawave -2.16 18.3 38.76
Xanthan-Purawave 2.54 23 43.46
Gluten-free bread formulations= HPMC-DATEM subtracted from:
Gluten-free bread formulations Lower Center Upper
HPMC-Purawave -20.21 0.25 20.71
LBG -20.66 -0.2 20.26
LBG-DATEM -11.16 9.3 29.76
LBG-Purawave -22.54 -2.08 18.38
LBG-xanthan -9.36 11.1 31.56
LBG-xanthan-DATEM 20.84 41.3 61.76
LBG-xanthan-Purawave -11.36 9.1 29.56
Pectin -24.56 -4.1 16.36
Pectin-DATEM -21.86 -1.4 19.06
Pectin-Purawave -23.06 -2.6 17.86
Purawave -25.01 -4.55 15.91
Xanthan 4.79 25.25 45.71
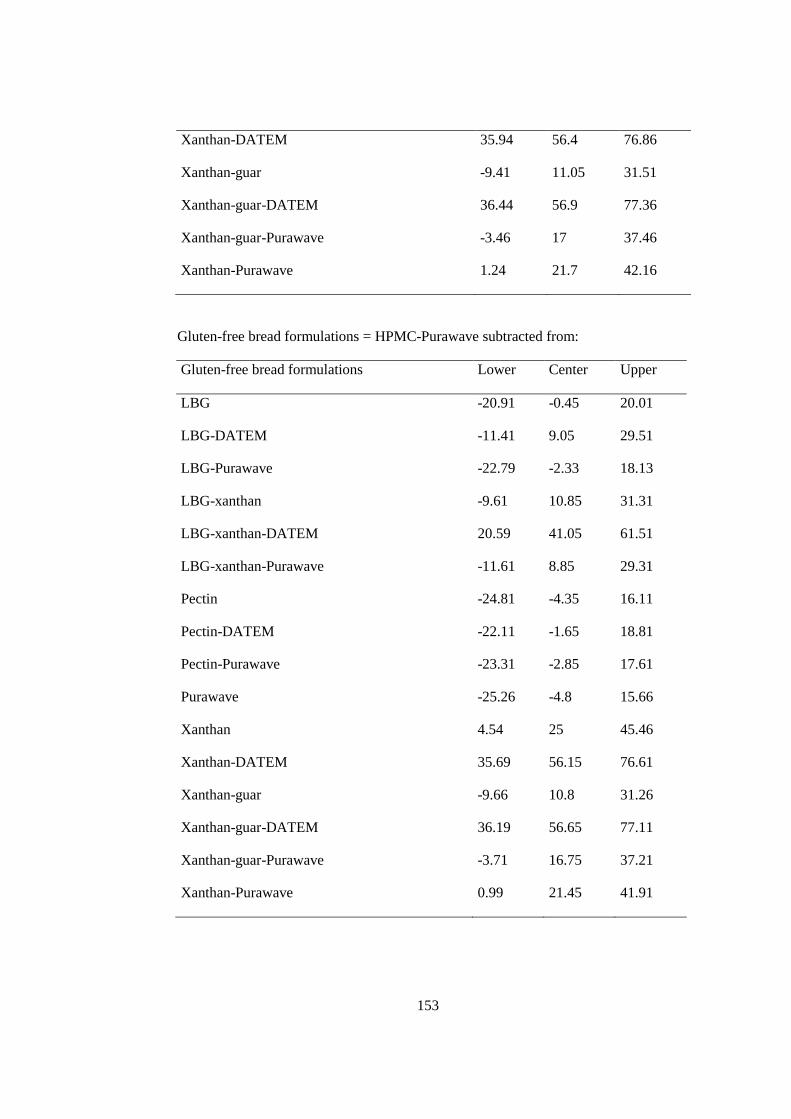
153
Xanthan-DATEM 35.94 56.4 76.86
Xanthan-guar -9.41 11.05 31.51
Xanthan-guar-DATEM 36.44 56.9 77.36
Xanthan-guar-Purawave -3.46 17 37.46
Xanthan-Purawave 1.24 21.7 42.16
Gluten-free bread formulations = HPMC-Purawave subtracted from:
Gluten-free bread formulations Lower Center Upper
LBG -20.91 -0.45 20.01
LBG-DATEM -11.41 9.05 29.51
LBG-Purawave -22.79 -2.33 18.13
LBG-xanthan -9.61 10.85 31.31
LBG-xanthan-DATEM 20.59 41.05 61.51
LBG-xanthan-Purawave -11.61 8.85 29.31
Pectin -24.81 -4.35 16.11
Pectin-DATEM -22.11 -1.65 18.81
Pectin-Purawave -23.31 -2.85 17.61
Purawave -25.26 -4.8 15.66
Xanthan 4.54 25 45.46
Xanthan-DATEM 35.69 56.15 76.61
Xanthan-guar -9.66 10.8 31.26
Xanthan-guar-DATEM 36.19 56.65 77.11
Xanthan-guar-Purawave -3.71 16.75 37.21
Xanthan-Purawave 0.99 21.45 41.91
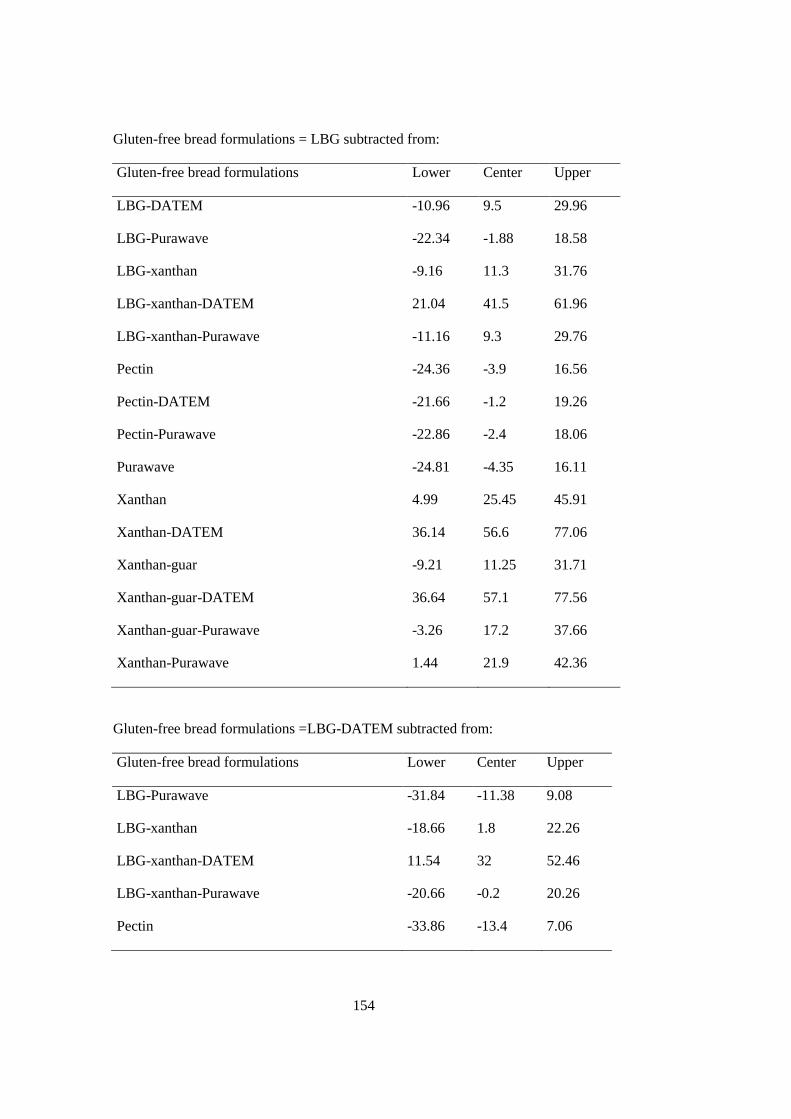
154
Gluten-free bread formulations = LBG subtracted from:
Gluten-free bread formulations Lower Center Upper
LBG-DATEM -10.96 9.5 29.96
LBG-Purawave -22.34 -1.88 18.58
LBG-xanthan -9.16 11.3 31.76
LBG-xanthan-DATEM 21.04 41.5 61.96
LBG-xanthan-Purawave -11.16 9.3 29.76
Pectin -24.36 -3.9 16.56
Pectin-DATEM -21.66 -1.2 19.26
Pectin-Purawave -22.86 -2.4 18.06
Purawave -24.81 -4.35 16.11
Xanthan 4.99 25.45 45.91
Xanthan-DATEM 36.14 56.6 77.06
Xanthan-guar -9.21 11.25 31.71
Xanthan-guar-DATEM 36.64 57.1 77.56
Xanthan-guar-Purawave -3.26 17.2 37.66
Xanthan-Purawave 1.44 21.9 42.36
Gluten-free bread formulations =LBG-DATEM subtracted from:
Gluten-free bread formulations Lower Center Upper
LBG-Purawave -31.84 -11.38 9.08
LBG-xanthan -18.66 1.8 22.26
LBG-xanthan-DATEM 11.54 32 52.46
LBG-xanthan-Purawave -20.66 -0.2 20.26
Pectin -33.86 -13.4 7.06
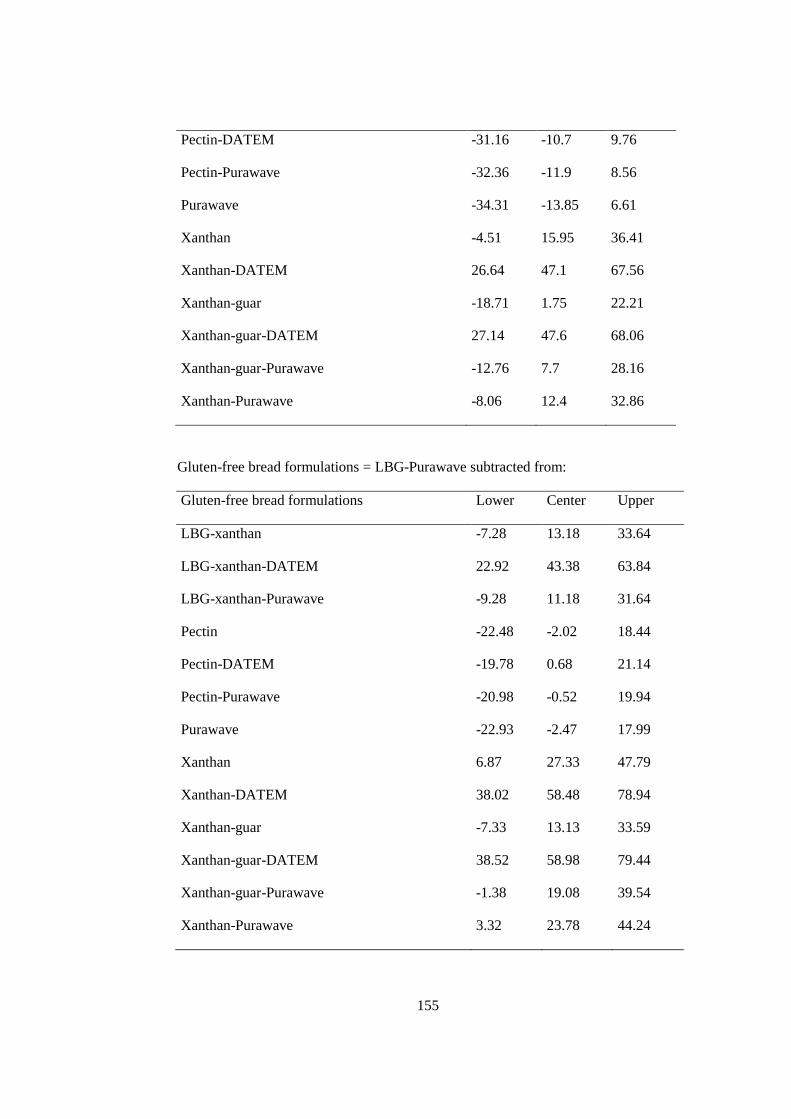
155
Pectin-DATEM -31.16 -10.7 9.76
Pectin-Purawave -32.36 -11.9 8.56
Purawave -34.31 -13.85 6.61
Xanthan -4.51 15.95 36.41
Xanthan-DATEM 26.64 47.1 67.56
Xanthan-guar -18.71 1.75 22.21
Xanthan-guar-DATEM 27.14 47.6 68.06
Xanthan-guar-Purawave -12.76 7.7 28.16
Xanthan-Purawave -8.06 12.4 32.86
Gluten-free bread formulations = LBG-Purawave subtracted from:
Gluten-free bread formulations Lower Center Upper
LBG-xanthan -7.28 13.18 33.64
LBG-xanthan-DATEM 22.92 43.38 63.84
LBG-xanthan-Purawave -9.28 11.18 31.64
Pectin -22.48 -2.02 18.44
Pectin-DATEM -19.78 0.68 21.14
Pectin-Purawave -20.98 -0.52 19.94
Purawave -22.93 -2.47 17.99
Xanthan 6.87 27.33 47.79
Xanthan-DATEM 38.02 58.48 78.94
Xanthan-guar -7.33 13.13 33.59
Xanthan-guar-DATEM 38.52 58.98 79.44
Xanthan-guar-Purawave -1.38 19.08 39.54
Xanthan-Purawave 3.32 23.78 44.24
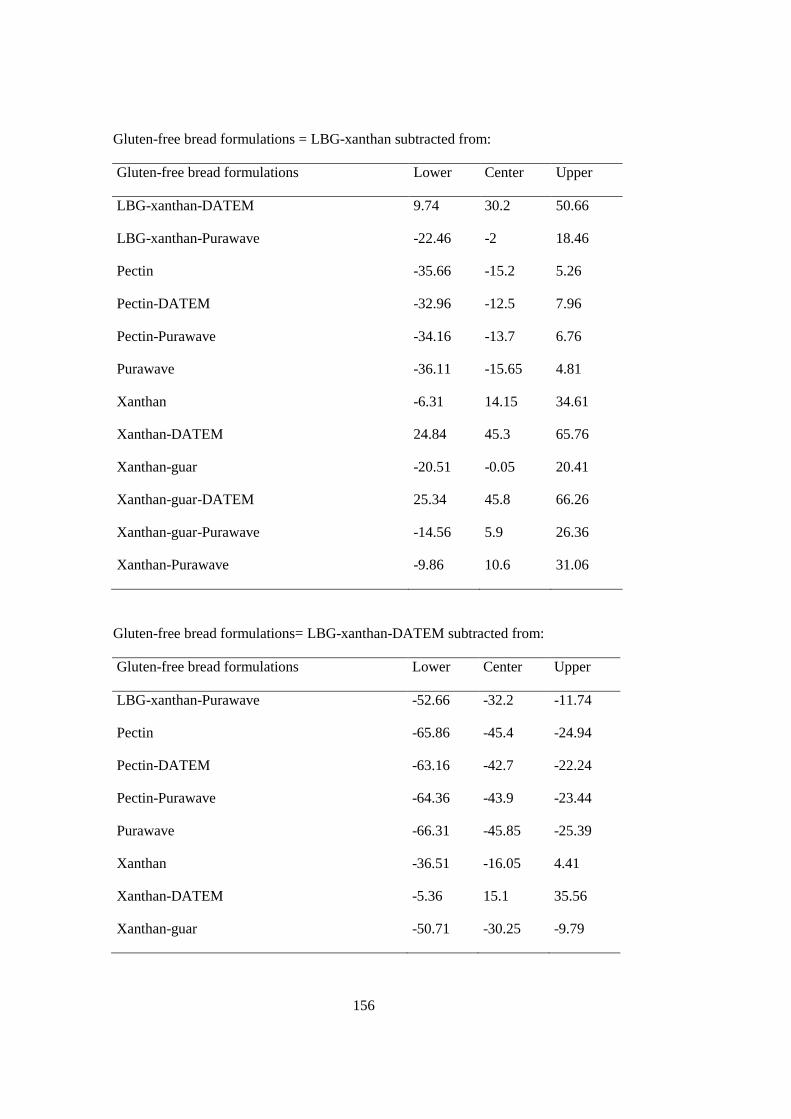
156
Gluten-free bread formulations = LBG-xanthan subtracted from:
Gluten-free bread formulations Lower Center Upper
LBG-xanthan-DATEM 9.74 30.2 50.66
LBG-xanthan-Purawave -22.46 -2 18.46
Pectin -35.66 -15.2 5.26
Pectin-DATEM -32.96 -12.5 7.96
Pectin-Purawave -34.16 -13.7 6.76
Purawave -36.11 -15.65 4.81
Xanthan -6.31 14.15 34.61
Xanthan-DATEM 24.84 45.3 65.76
Xanthan-guar -20.51 -0.05 20.41
Xanthan-guar-DATEM 25.34 45.8 66.26
Xanthan-guar-Purawave -14.56 5.9 26.36
Xanthan-Purawave -9.86 10.6 31.06
Gluten-free bread formulations= LBG-xanthan-DATEM subtracted from:
Gluten-free bread formulations Lower Center Upper
LBG-xanthan-Purawave -52.66 -32.2 -11.74
Pectin -65.86 -45.4 -24.94
Pectin-DATEM -63.16 -42.7 -22.24
Pectin-Purawave -64.36 -43.9 -23.44
Purawave -66.31 -45.85 -25.39
Xanthan -36.51 -16.05 4.41
Xanthan-DATEM -5.36 15.1 35.56
Xanthan-guar -50.71 -30.25 -9.79
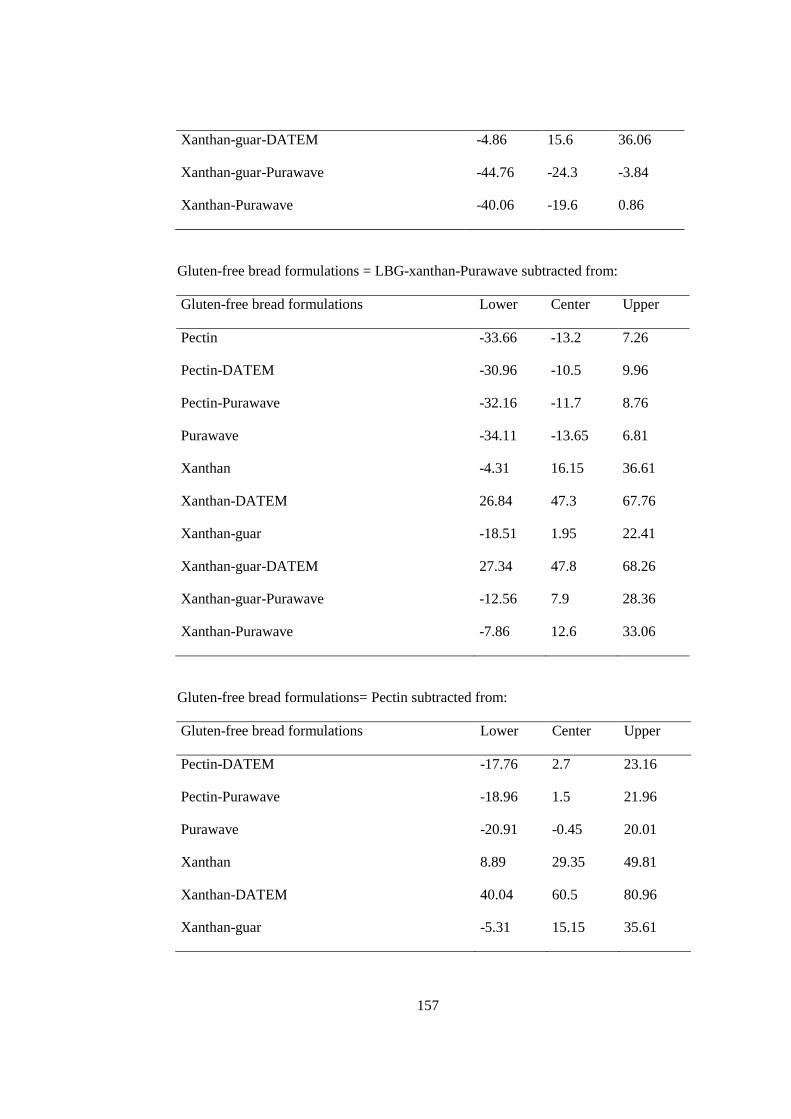
157
Xanthan-guar-DATEM -4.86 15.6 36.06
Xanthan-guar-Purawave -44.76 -24.3 -3.84
Xanthan-Purawave -40.06 -19.6 0.86
Gluten-free bread formulations = LBG-xanthan-Purawave subtracted from:
Gluten-free bread formulations Lower Center Upper
Pectin -33.66 -13.2 7.26
Pectin-DATEM -30.96 -10.5 9.96
Pectin-Purawave -32.16 -11.7 8.76
Purawave -34.11 -13.65 6.81
Xanthan -4.31 16.15 36.61
Xanthan-DATEM 26.84 47.3 67.76
Xanthan-guar -18.51 1.95 22.41
Xanthan-guar-DATEM 27.34 47.8 68.26
Xanthan-guar-Purawave -12.56 7.9 28.36
Xanthan-Purawave -7.86 12.6 33.06
Gluten-free bread formulations= Pectin subtracted from:
Gluten-free bread formulations Lower Center Upper
Pectin-DATEM -17.76 2.7 23.16
Pectin-Purawave -18.96 1.5 21.96
Purawave -20.91 -0.45 20.01
Xanthan 8.89 29.35 49.81
Xanthan-DATEM 40.04 60.5 80.96
Xanthan-guar -5.31 15.15 35.61
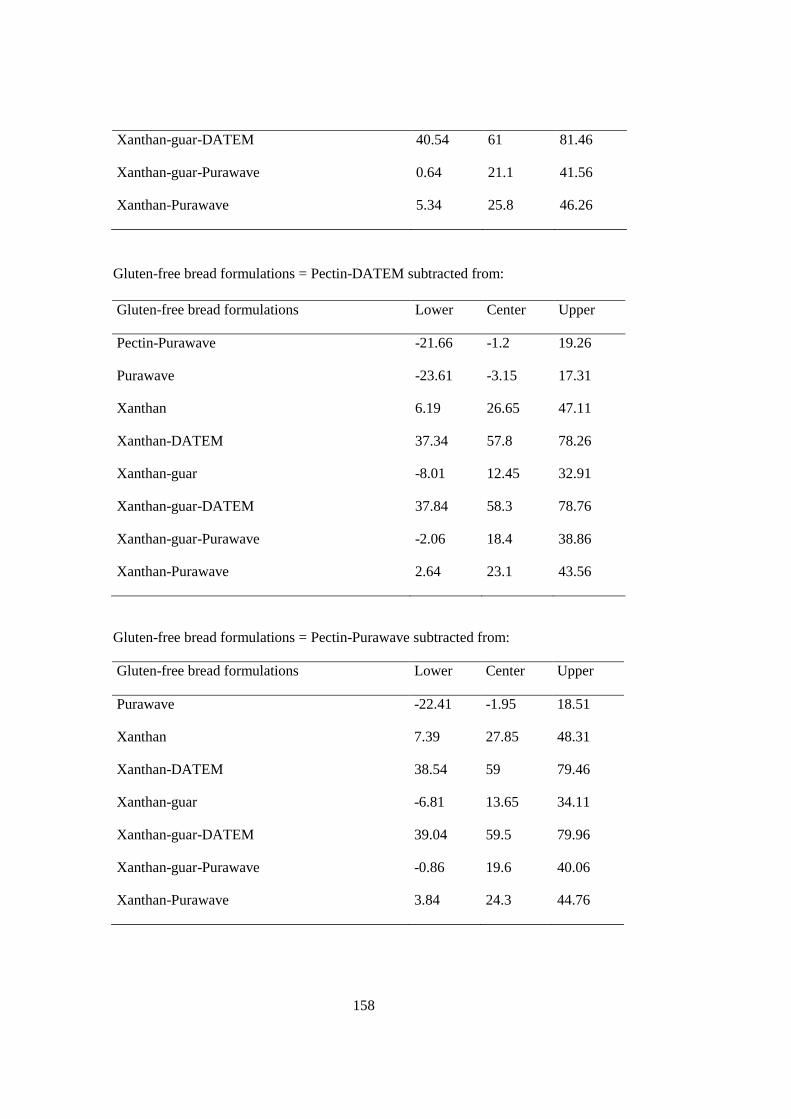
158
Xanthan-guar-DATEM 40.54 61 81.46
Xanthan-guar-Purawave 0.64 21.1 41.56
Xanthan-Purawave 5.34 25.8 46.26
Gluten-free bread formulations = Pectin-DATEM subtracted from:
Gluten-free bread formulations Lower Center Upper
Pectin-Purawave -21.66 -1.2 19.26
Purawave -23.61 -3.15 17.31
Xanthan 6.19 26.65 47.11
Xanthan-DATEM 37.34 57.8 78.26
Xanthan-guar -8.01 12.45 32.91
Xanthan-guar-DATEM 37.84 58.3 78.76
Xanthan-guar-Purawave -2.06 18.4 38.86
Xanthan-Purawave 2.64 23.1 43.56
Gluten-free bread formulations = Pectin-Purawave subtracted from:
Gluten-free bread formulations Lower Center Upper
Purawave -22.41 -1.95 18.51
Xanthan 7.39 27.85 48.31
Xanthan-DATEM 38.54 59 79.46
Xanthan-guar -6.81 13.65 34.11
Xanthan-guar-DATEM 39.04 59.5 79.96
Xanthan-guar-Purawave -0.86 19.6 40.06
Xanthan-Purawave 3.84 24.3 44.76
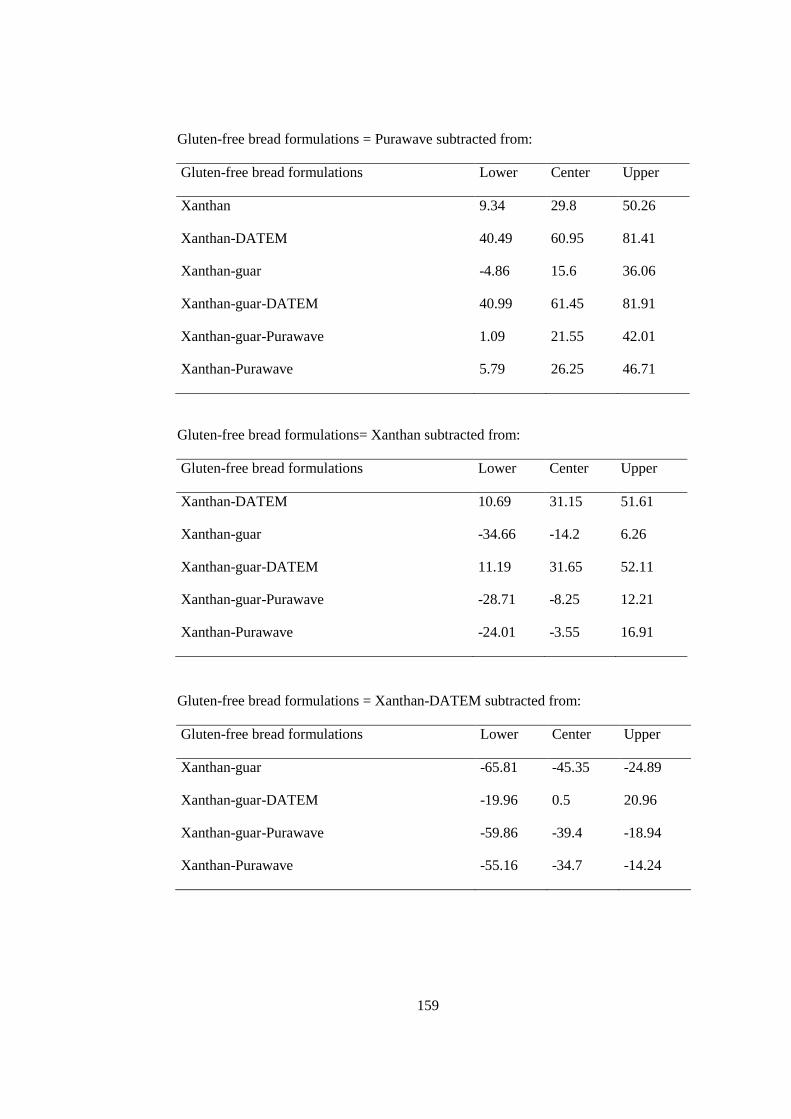
159
Gluten-free bread formulations = Purawave subtracted from:
Gluten-free bread formulations Lower Center Upper
Xanthan 9.34 29.8 50.26
Xanthan-DATEM 40.49 60.95 81.41
Xanthan-guar -4.86 15.6 36.06
Xanthan-guar-DATEM 40.99 61.45 81.91
Xanthan-guar-Purawave 1.09 21.55 42.01
Xanthan-Purawave 5.79 26.25 46.71
Gluten-free bread formulations= Xanthan subtracted from:
Gluten-free bread formulations Lower Center Upper
Xanthan-DATEM 10.69 31.15 51.61
Xanthan-guar -34.66 -14.2 6.26
Xanthan-guar-DATEM 11.19 31.65 52.11
Xanthan-guar-Purawave -28.71 -8.25 12.21
Xanthan-Purawave -24.01 -3.55 16.91
Gluten-free bread formulations = Xanthan-DATEM subtracted from:
Gluten-free bread formulations Lower Center Upper
Xanthan-guar -65.81 -45.35 -24.89
Xanthan-guar-DATEM -19.96 0.5 20.96
Xanthan-guar-Purawave -59.86 -39.4 -18.94
Xanthan-Purawave -55.16 -34.7 -14.24
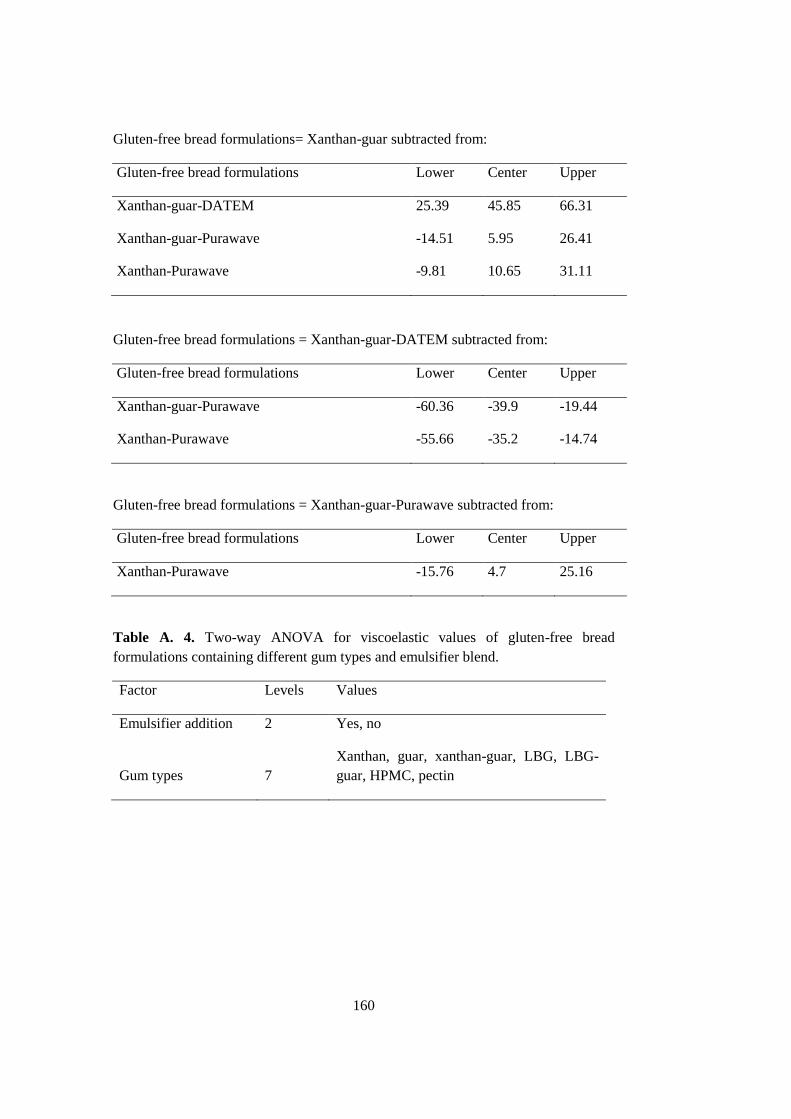
160
Gluten-free bread formulations= Xanthan-guar subtracted from:
Gluten-free bread formulations Lower Center Upper
Xanthan-guar-DATEM 25.39 45.85 66.31
Xanthan-guar-Purawave -14.51 5.95 26.41
Xanthan-Purawave -9.81 10.65 31.11
Gluten-free bread formulations = Xanthan-guar-DATEM subtracted from:
Gluten-free bread formulations Lower Center Upper
Xanthan-guar-Purawave -60.36 -39.9 -19.44
Xanthan-Purawave -55.66 -35.2 -14.74
Gluten-free bread formulations = Xanthan-guar-Purawave subtracted from:
Gluten-free bread formulations Lower Center Upper
Xanthan-Purawave -15.76 4.7 25.16
Table A. 4. Two-way ANOVA for viscoelastic values of gluten-free bread
formulations containing different gum types and emulsifier blend.
Factor Levels Values
Emulsifier addition 2 Yes, no
Gum types 7
Xanthan, guar, xanthan-guar, LBG, LBG-
guar, HPMC, pectin
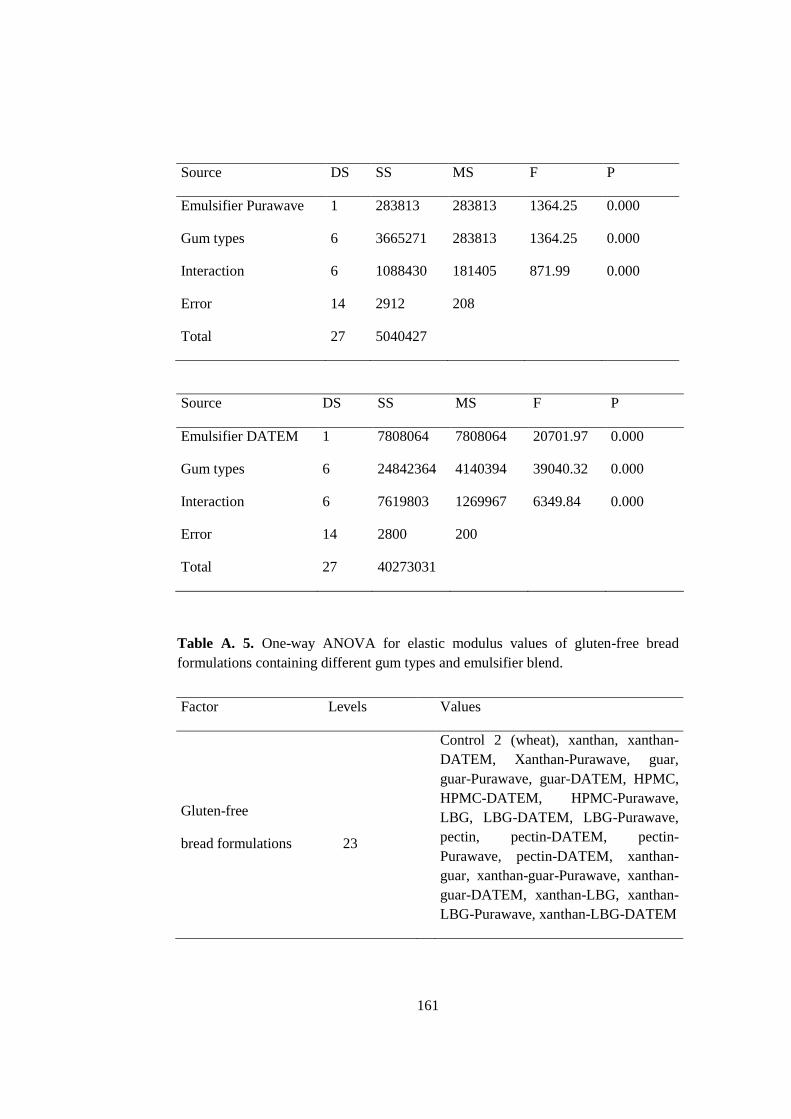
161
Source DS SS MS F P
Emulsifier Purawave 1 283813 283813 1364.25 0.000
Gum types 6 3665271 283813 1364.25 0.000
Interaction 6 1088430 181405 871.99 0.000
Error 14 2912 208
Total 27 5040427
Source DS SS MS F P
Emulsifier DATEM 1 7808064 7808064 20701.97 0.000
Gum types 6 24842364 4140394 39040.32 0.000
Interaction 6 7619803 1269967 6349.84 0.000
Error 14 2800 200
Total 27 40273031
Table A. 5. One-way ANOVA for elastic modulus values of gluten-free bread
formulations containing different gum types and emulsifier blend.
Factor Levels
Values
Gluten-free
bread formulations 23
Control 2 (wheat), xanthan, xanthan-
DATEM, Xanthan-Purawave, guar,
guar-Purawave, guar-DATEM, HPMC,
HPMC-DATEM, HPMC-Purawave,
LBG, LBG-DATEM, LBG-Purawave,
pectin, pectin-DATEM, pectin-
Purawave, pectin-DATEM, xanthan-
guar, xanthan-guar-Purawave, xanthan-
guar-DATEM, xanthan-LBG, xanthan-
LBG-Purawave, xanthan-LBG-DATEM
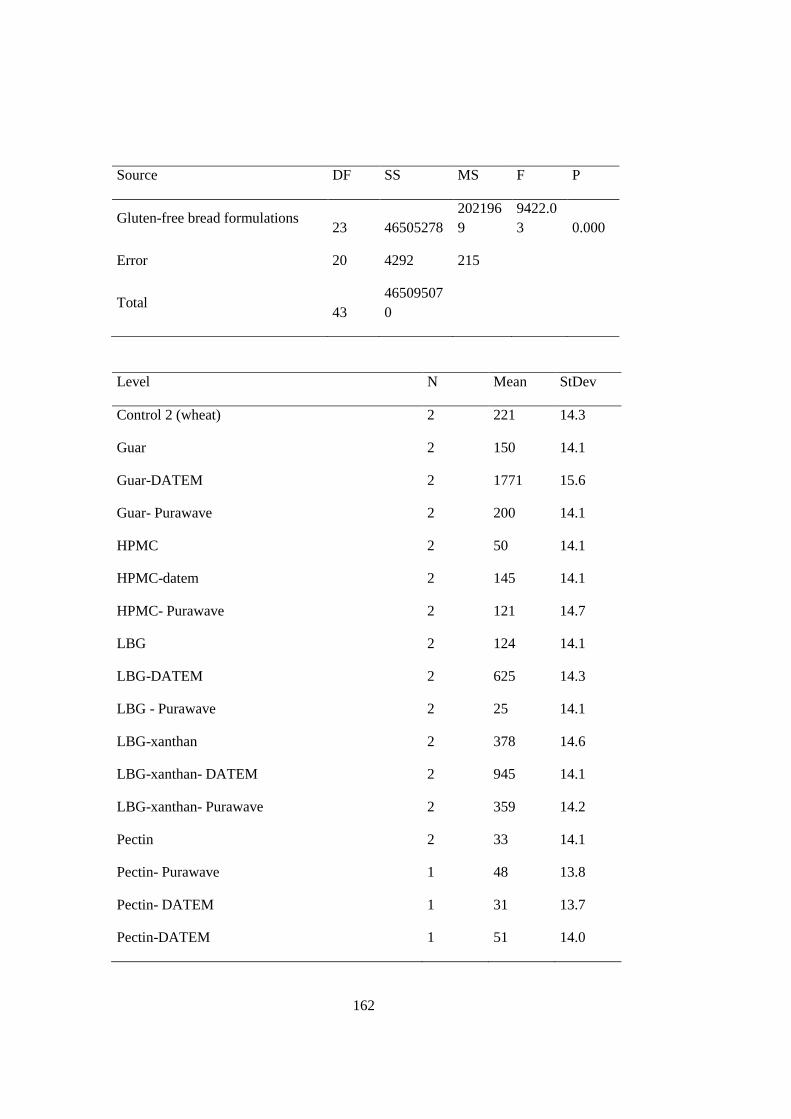
162
Source DF SS MS F P
Gluten-free bread formulations 23 46505278
202196
9
9422.0
3 0.000
Error 20 4292 215
Total
43
46509507
0
Level N Mean StDev
Control 2 (wheat) 2 221 14.3
Guar 2 150 14.1
Guar-DATEM 2 1771 15.6
Guar- Purawave 2 200 14.1
HPMC 2 50 14.1
HPMC-datem 2 145 14.1
HPMC- Purawave 2 121 14.7
LBG 2 124 14.1
LBG-DATEM 2 625 14.3
LBG - Purawave 2 25 14.1
LBG-xanthan 2 378 14.6
LBG-xanthan- DATEM 2 945 14.1
LBG-xanthan- Purawave 2 359 14.2
Pectin 2 33 14.1
Pectin- Purawave 1 48 13.8
Pectin- DATEM 1 31 13.7
Pectin-DATEM 1 51 14.0
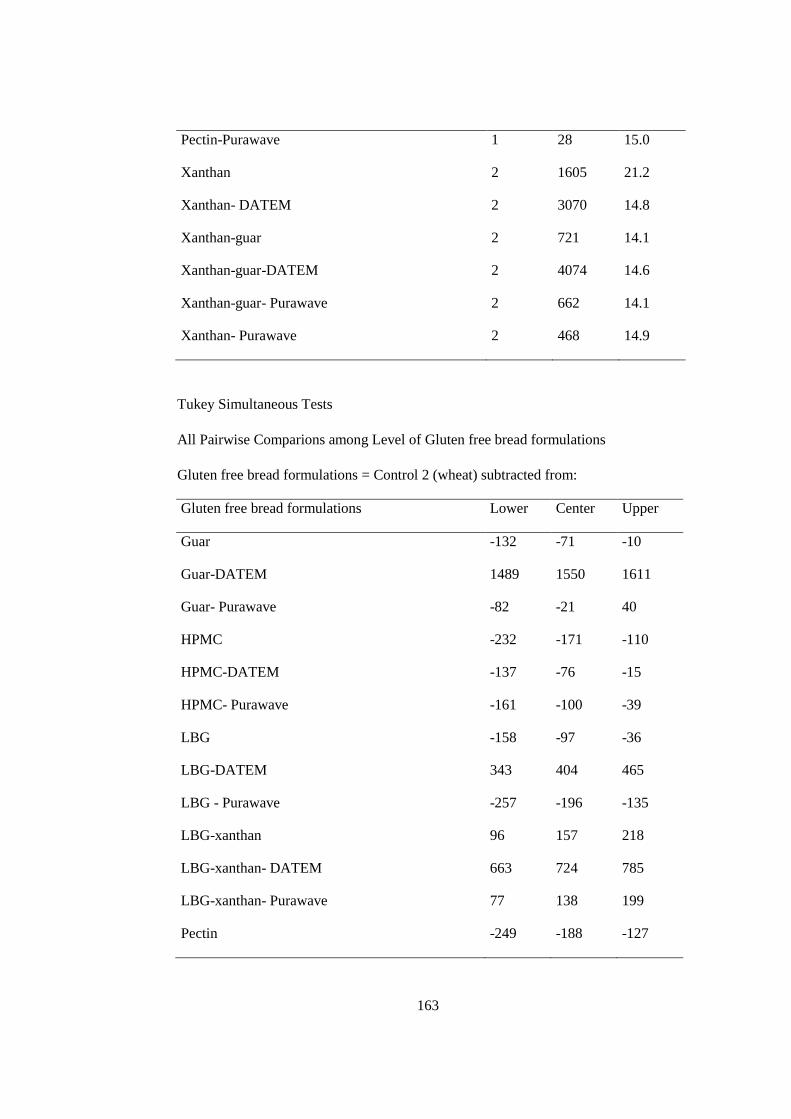
163
Pectin-Purawave 1 28 15.0
Xanthan 2 1605 21.2
Xanthan- DATEM 2 3070 14.8
Xanthan-guar 2 721 14.1
Xanthan-guar-DATEM 2 4074 14.6
Xanthan-guar- Purawave 2 662 14.1
Xanthan- Purawave 2 468 14.9
Tukey Simultaneous Tests
All Pairwise Comparions among Level of Gluten free bread formulations
Gluten free bread formulations = Control 2 (wheat) subtracted from:
Gluten free bread formulations Lower Center Upper
Guar -132 -71 -10
Guar-DATEM 1489 1550 1611
Guar- Purawave -82 -21 40
HPMC -232 -171 -110
HPMC-DATEM -137 -76 -15
HPMC- Purawave -161 -100 -39
LBG -158 -97 -36
LBG-DATEM 343 404 465
LBG - Purawave -257 -196 -135
LBG-xanthan 96 157 218
LBG-xanthan- DATEM 663 724 785
LBG-xanthan- Purawave 77 138 199
Pectin -249 -188 -127
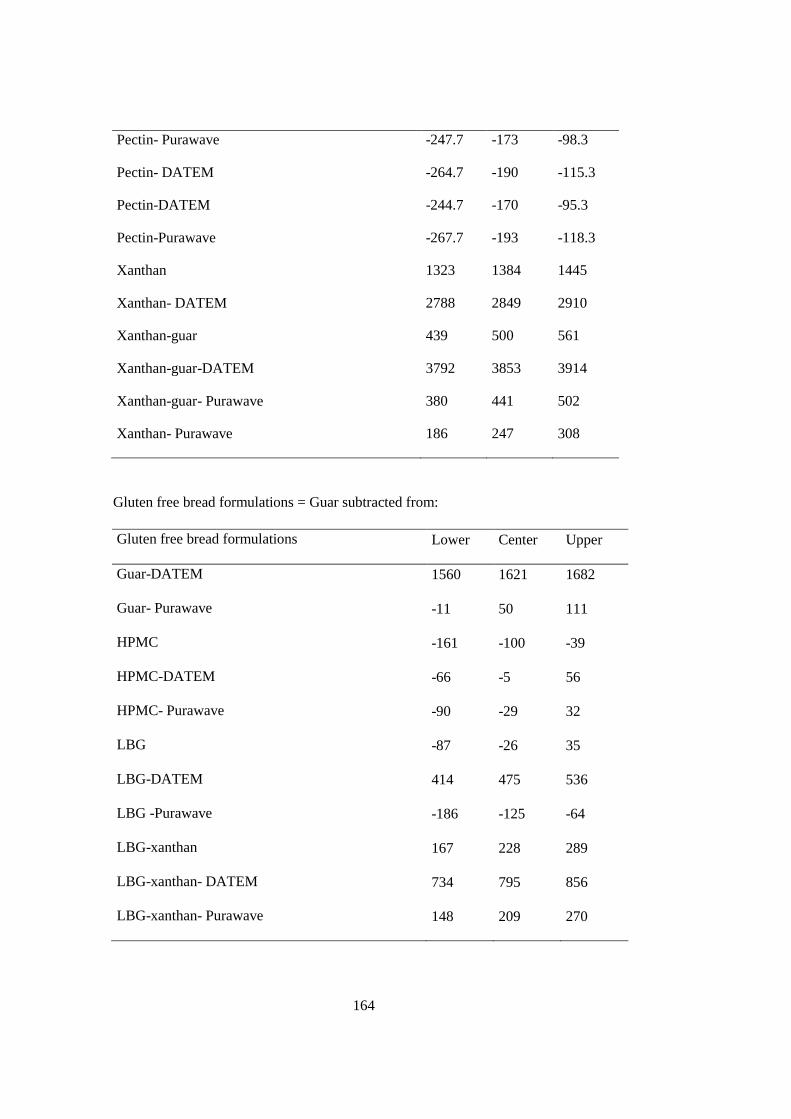
164
Pectin- Purawave -247.7 -173 -98.3
Pectin- DATEM -264.7 -190 -115.3
Pectin-DATEM -244.7 -170 -95.3
Pectin-Purawave -267.7 -193 -118.3
Xanthan 1323 1384 1445
Xanthan- DATEM 2788 2849 2910
Xanthan-guar 439 500 561
Xanthan-guar-DATEM 3792 3853 3914
Xanthan-guar- Purawave 380 441 502
Xanthan- Purawave 186 247 308
Gluten free bread formulations = Guar subtracted from:
Gluten free bread formulations Lower Center Upper
Guar-DATEM 1560 1621 1682
Guar- Purawave -11 50 111
HPMC -161 -100 -39
HPMC-DATEM -66 -5 56
HPMC- Purawave -90 -29 32
LBG -87 -26 35
LBG-DATEM 414 475 536
LBG -Purawave -186 -125 -64
LBG-xanthan 167 228 289
LBG-xanthan- DATEM 734 795 856
LBG-xanthan- Purawave 148 209 270
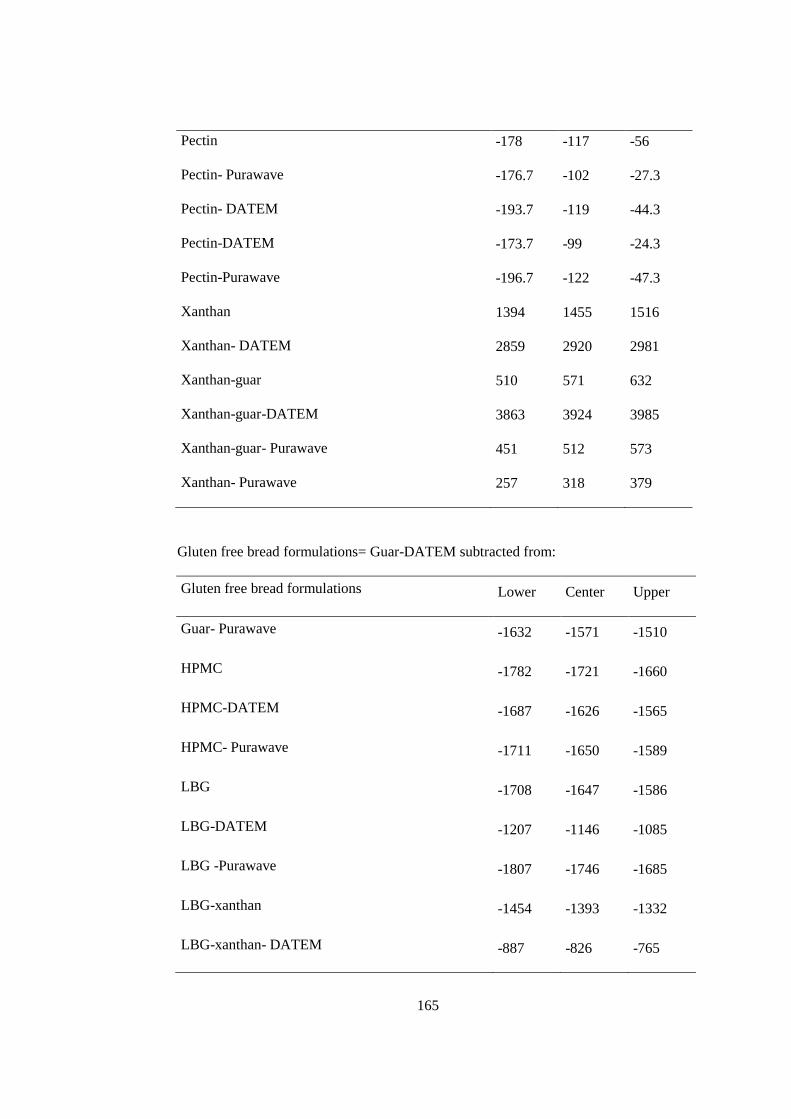
165
Pectin -178 -117 -56
Pectin- Purawave -176.7 -102 -27.3
Pectin- DATEM -193.7 -119 -44.3
Pectin-DATEM -173.7 -99 -24.3
Pectin-Purawave -196.7 -122 -47.3
Xanthan 1394 1455 1516
Xanthan- DATEM 2859 2920 2981
Xanthan-guar 510 571 632
Xanthan-guar-DATEM 3863 3924 3985
Xanthan-guar- Purawave 451 512 573
Xanthan- Purawave 257 318 379
Gluten free bread formulations= Guar-DATEM subtracted from:
Gluten free bread formulations Lower Center Upper
Guar- Purawave -1632 -1571 -1510
HPMC -1782 -1721 -1660
HPMC-DATEM -1687 -1626 -1565
HPMC- Purawave -1711 -1650 -1589
LBG -1708 -1647 -1586
LBG-DATEM -1207 -1146 -1085
LBG -Purawave -1807 -1746 -1685
LBG-xanthan -1454 -1393 -1332
LBG-xanthan- DATEM -887 -826 -765
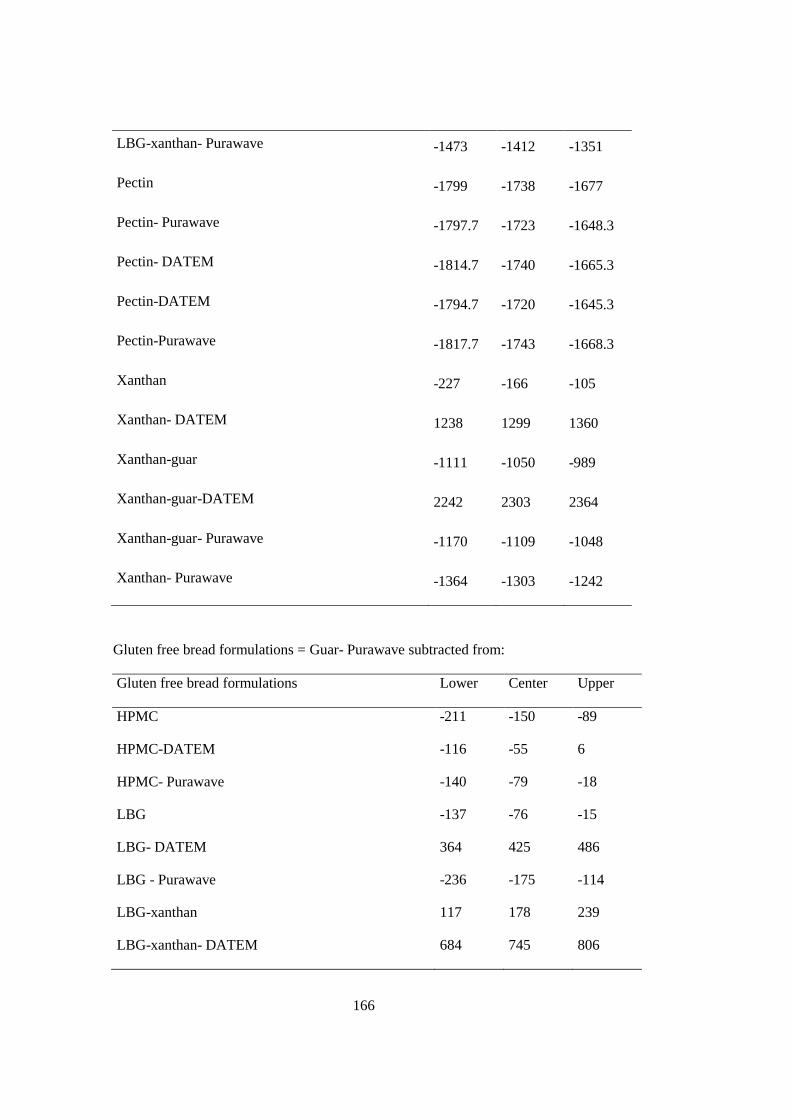
166
LBG-xanthan- Purawave -1473 -1412 -1351
Pectin -1799 -1738 -1677
Pectin- Purawave -1797.7 -1723 -1648.3
Pectin- DATEM -1814.7 -1740 -1665.3
Pectin-DATEM -1794.7 -1720 -1645.3
Pectin-Purawave -1817.7 -1743 -1668.3
Xanthan -227 -166 -105
Xanthan- DATEM 1238 1299 1360
Xanthan-guar -1111 -1050 -989
Xanthan-guar-DATEM 2242 2303 2364
Xanthan-guar- Purawave -1170 -1109 -1048
Xanthan- Purawave -1364 -1303 -1242
Gluten free bread formulations = Guar- Purawave subtracted from:
Gluten free bread formulations Lower Center Upper
HPMC -211 -150 -89
HPMC-DATEM -116 -55 6
HPMC- Purawave -140 -79 -18
LBG -137 -76 -15
LBG- DATEM 364 425 486
LBG - Purawave -236 -175 -114
LBG-xanthan 117 178 239
LBG-xanthan- DATEM 684 745 806
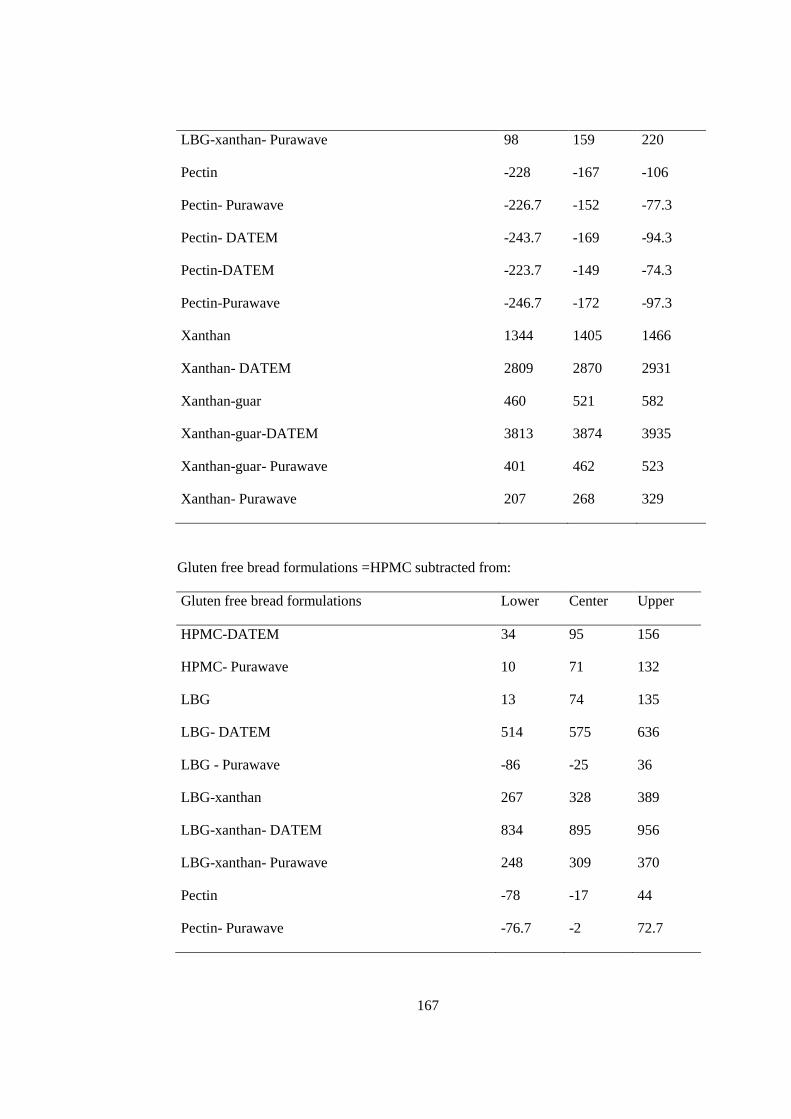
167
LBG-xanthan- Purawave 98 159 220
Pectin -228 -167 -106
Pectin- Purawave -226.7 -152 -77.3
Pectin- DATEM -243.7 -169 -94.3
Pectin-DATEM -223.7 -149 -74.3
Pectin-Purawave -246.7 -172 -97.3
Xanthan 1344 1405 1466
Xanthan- DATEM 2809 2870 2931
Xanthan-guar 460 521 582
Xanthan-guar-DATEM 3813 3874 3935
Xanthan-guar- Purawave 401 462 523
Xanthan- Purawave 207 268 329
Gluten free bread formulations =HPMC subtracted from:
Gluten free bread formulations Lower Center Upper
HPMC-DATEM 34 95 156
HPMC- Purawave 10 71 132
LBG 13 74 135
LBG- DATEM 514 575 636
LBG - Purawave -86 -25 36
LBG-xanthan 267 328 389
LBG-xanthan- DATEM 834 895 956
LBG-xanthan- Purawave 248 309 370
Pectin -78 -17 44
Pectin- Purawave -76.7 -2 72.7
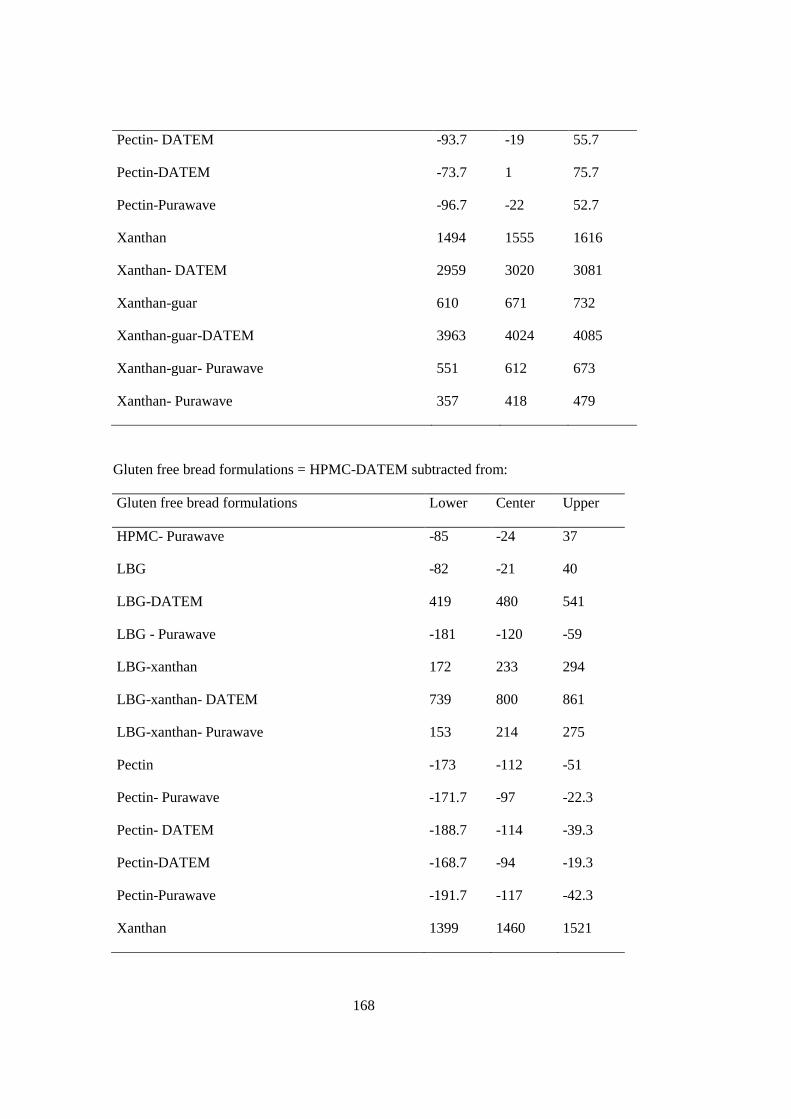
168
Pectin- DATEM -93.7 -19 55.7
Pectin-DATEM -73.7 1 75.7
Pectin-Purawave -96.7 -22 52.7
Xanthan 1494 1555 1616
Xanthan- DATEM 2959 3020 3081
Xanthan-guar 610 671 732
Xanthan-guar-DATEM 3963 4024 4085
Xanthan-guar- Purawave 551 612 673
Xanthan- Purawave 357 418 479
Gluten free bread formulations = HPMC-DATEM subtracted from:
Gluten free bread formulations Lower Center Upper
HPMC- Purawave -85 -24 37
LBG -82 -21 40
LBG-DATEM 419 480 541
LBG - Purawave -181 -120 -59
LBG-xanthan 172 233 294
LBG-xanthan- DATEM 739 800 861
LBG-xanthan- Purawave 153 214 275
Pectin -173 -112 -51
Pectin- Purawave -171.7 -97 -22.3
Pectin- DATEM -188.7 -114 -39.3
Pectin-DATEM -168.7 -94 -19.3
Pectin-Purawave -191.7 -117 -42.3
Xanthan 1399 1460 1521
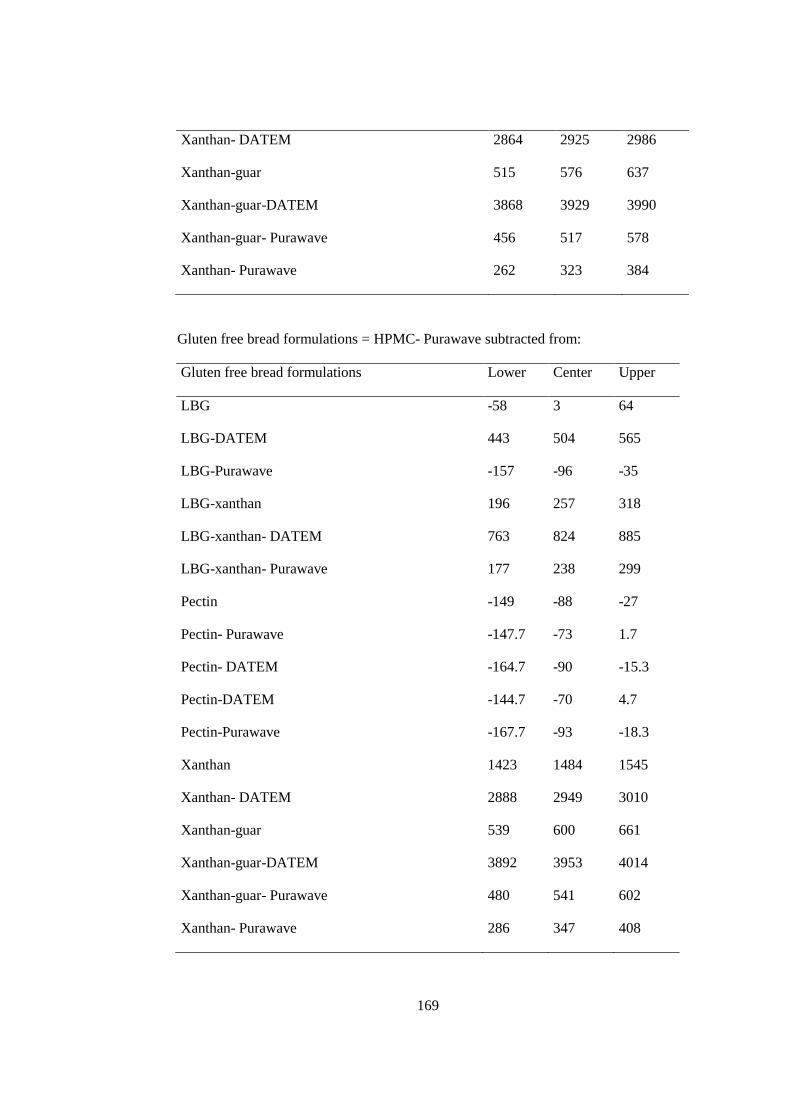
169
Xanthan- DATEM 2864 2925 2986
Xanthan-guar 515 576 637
Xanthan-guar-DATEM 3868 3929 3990
Xanthan-guar- Purawave 456 517 578
Xanthan- Purawave 262 323 384
Gluten free bread formulations = HPMC- Purawave subtracted from:
Gluten free bread formulations Lower Center Upper
LBG -58 3 64
LBG-DATEM 443 504 565
LBG-Purawave -157 -96 -35
LBG-xanthan 196 257 318
LBG-xanthan- DATEM 763 824 885
LBG-xanthan- Purawave 177 238 299
Pectin -149 -88 -27
Pectin- Purawave -147.7 -73 1.7
Pectin- DATEM -164.7 -90 -15.3
Pectin-DATEM -144.7 -70 4.7
Pectin-Purawave -167.7 -93 -18.3
Xanthan 1423 1484 1545
Xanthan- DATEM 2888 2949 3010
Xanthan-guar 539 600 661
Xanthan-guar-DATEM 3892 3953 4014
Xanthan-guar- Purawave 480 541 602
Xanthan- Purawave 286 347 408
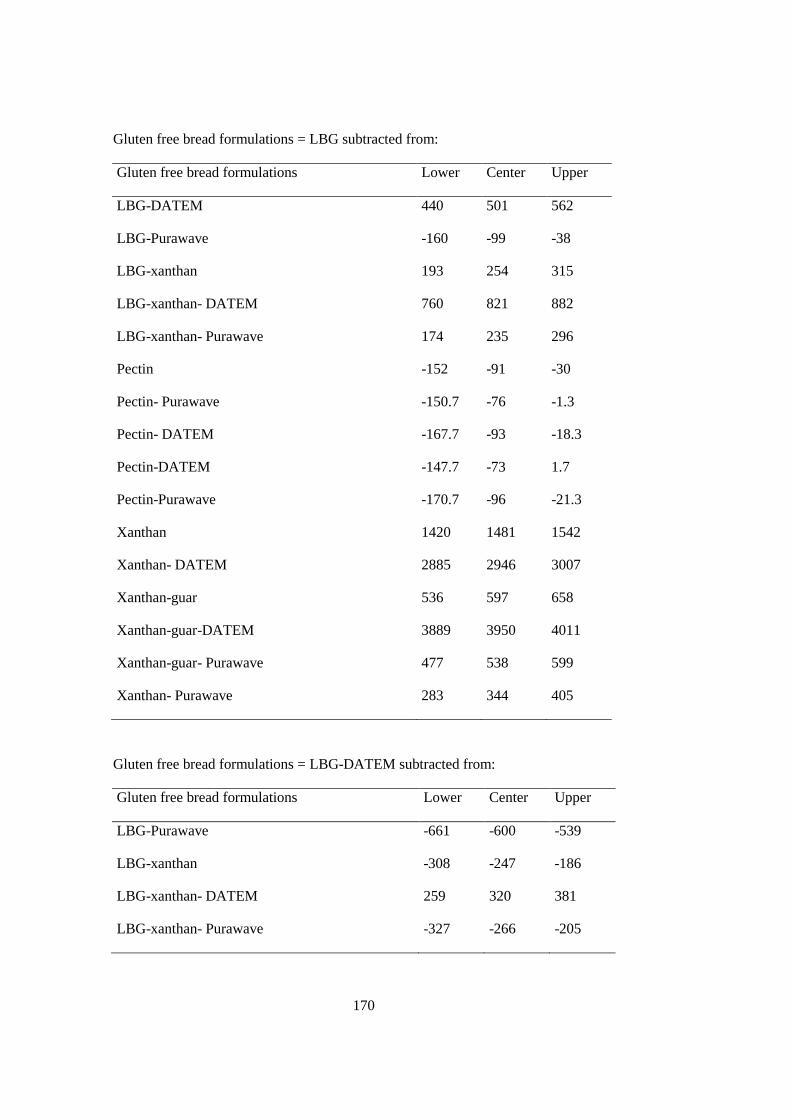
170
Gluten free bread formulations = LBG subtracted from:
Gluten free bread formulations Lower Center Upper
LBG-DATEM 440 501 562
LBG-Purawave -160 -99 -38
LBG-xanthan 193 254 315
LBG-xanthan- DATEM 760 821 882
LBG-xanthan- Purawave 174 235 296
Pectin -152 -91 -30
Pectin- Purawave -150.7 -76 -1.3
Pectin- DATEM -167.7 -93 -18.3
Pectin-DATEM -147.7 -73 1.7
Pectin-Purawave -170.7 -96 -21.3
Xanthan 1420 1481 1542
Xanthan- DATEM 2885 2946 3007
Xanthan-guar 536 597 658
Xanthan-guar-DATEM 3889 3950 4011
Xanthan-guar- Purawave 477 538 599
Xanthan- Purawave 283 344 405
Gluten free bread formulations = LBG-DATEM subtracted from:
Gluten free bread formulations Lower Center Upper
LBG-Purawave -661 -600 -539
LBG-xanthan -308 -247 -186
LBG-xanthan- DATEM 259 320 381
LBG-xanthan- Purawave -327 -266 -205
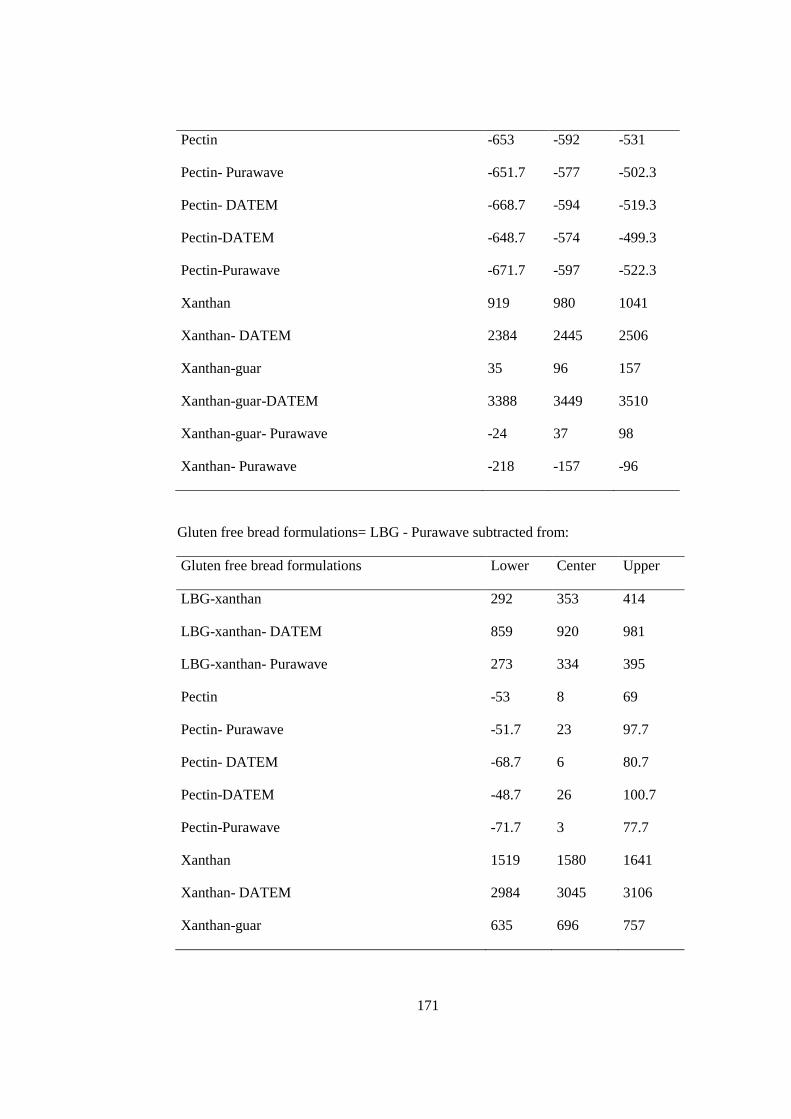
171
Pectin -653 -592 -531
Pectin- Purawave -651.7 -577 -502.3
Pectin- DATEM -668.7 -594 -519.3
Pectin-DATEM -648.7 -574 -499.3
Pectin-Purawave -671.7 -597 -522.3
Xanthan 919 980 1041
Xanthan- DATEM 2384 2445 2506
Xanthan-guar 35 96 157
Xanthan-guar-DATEM 3388 3449 3510
Xanthan-guar- Purawave -24 37 98
Xanthan- Purawave -218 -157 -96
Gluten free bread formulations= LBG - Purawave subtracted from:
Gluten free bread formulations Lower Center Upper
LBG-xanthan 292 353 414
LBG-xanthan- DATEM 859 920 981
LBG-xanthan- Purawave 273 334 395
Pectin -53 8 69
Pectin- Purawave -51.7 23 97.7
Pectin- DATEM -68.7 6 80.7
Pectin-DATEM -48.7 26 100.7
Pectin-Purawave -71.7 3 77.7
Xanthan 1519 1580 1641
Xanthan- DATEM 2984 3045 3106
Xanthan-guar 635 696 757
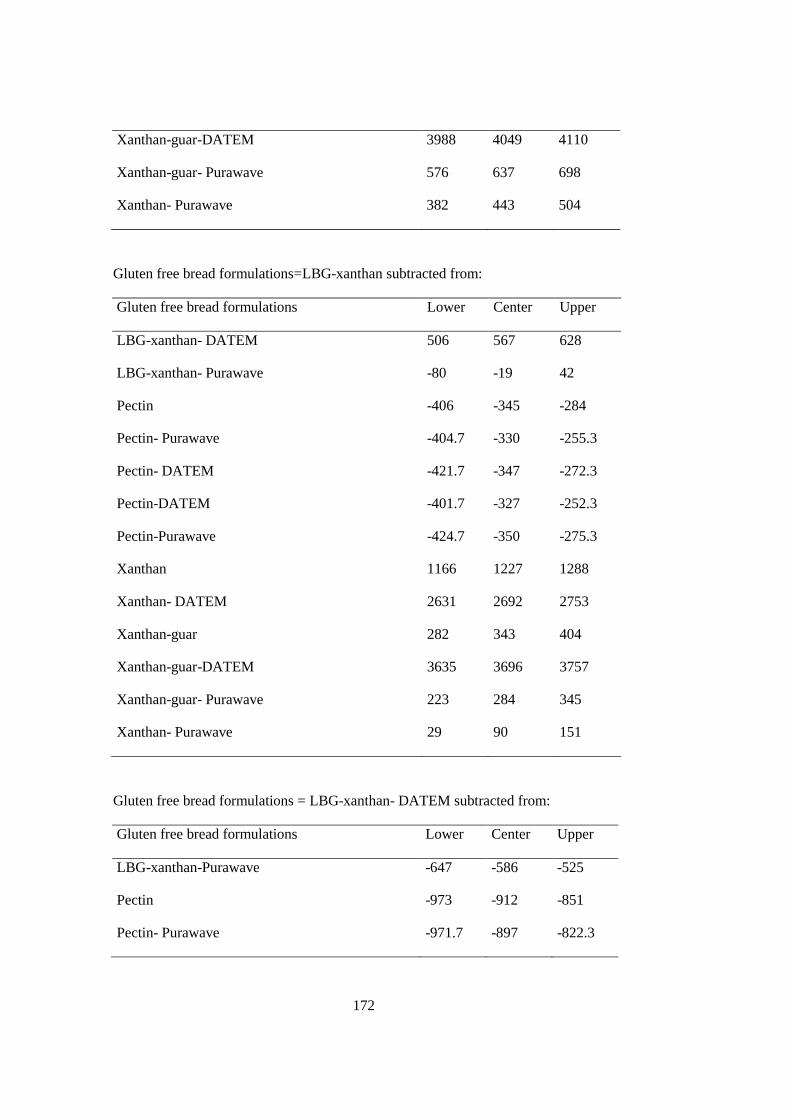
172
Xanthan-guar-DATEM 3988 4049 4110
Xanthan-guar- Purawave 576 637 698
Xanthan- Purawave 382 443 504
Gluten free bread formulations=LBG-xanthan subtracted from:
Gluten free bread formulations Lower Center Upper
LBG-xanthan- DATEM 506 567 628
LBG-xanthan- Purawave -80 -19 42
Pectin -406 -345 -284
Pectin- Purawave -404.7 -330 -255.3
Pectin- DATEM -421.7 -347 -272.3
Pectin-DATEM -401.7 -327 -252.3
Pectin-Purawave -424.7 -350 -275.3
Xanthan 1166 1227 1288
Xanthan- DATEM 2631 2692 2753
Xanthan-guar 282 343 404
Xanthan-guar-DATEM 3635 3696 3757
Xanthan-guar- Purawave 223 284 345
Xanthan- Purawave 29 90 151
Gluten free bread formulations = LBG-xanthan- DATEM subtracted from:
Gluten free bread formulations Lower Center Upper
LBG-xanthan-Purawave -647 -586 -525
Pectin -973 -912 -851
Pectin- Purawave -971.7 -897 -822.3
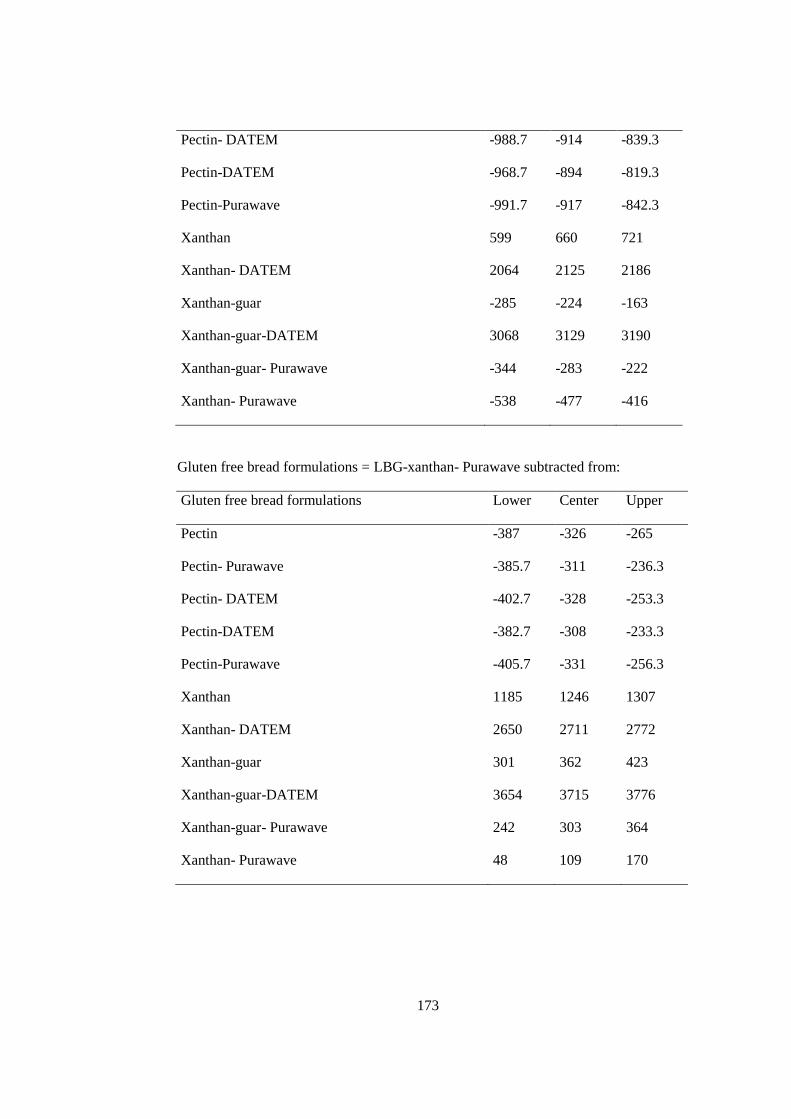
173
Pectin- DATEM -988.7 -914 -839.3
Pectin-DATEM -968.7 -894 -819.3
Pectin-Purawave -991.7 -917 -842.3
Xanthan 599 660 721
Xanthan- DATEM 2064 2125 2186
Xanthan-guar -285 -224 -163
Xanthan-guar-DATEM 3068 3129 3190
Xanthan-guar- Purawave -344 -283 -222
Xanthan- Purawave -538 -477 -416
Gluten free bread formulations = LBG-xanthan- Purawave subtracted from:
Gluten free bread formulations Lower Center Upper
Pectin -387 -326 -265
Pectin- Purawave -385.7 -311 -236.3
Pectin- DATEM -402.7 -328 -253.3
Pectin-DATEM -382.7 -308 -233.3
Pectin-Purawave -405.7 -331 -256.3
Xanthan 1185 1246 1307
Xanthan- DATEM 2650 2711 2772
Xanthan-guar 301 362 423
Xanthan-guar-DATEM 3654 3715 3776
Xanthan-guar- Purawave 242 303 364
Xanthan- Purawave 48 109 170
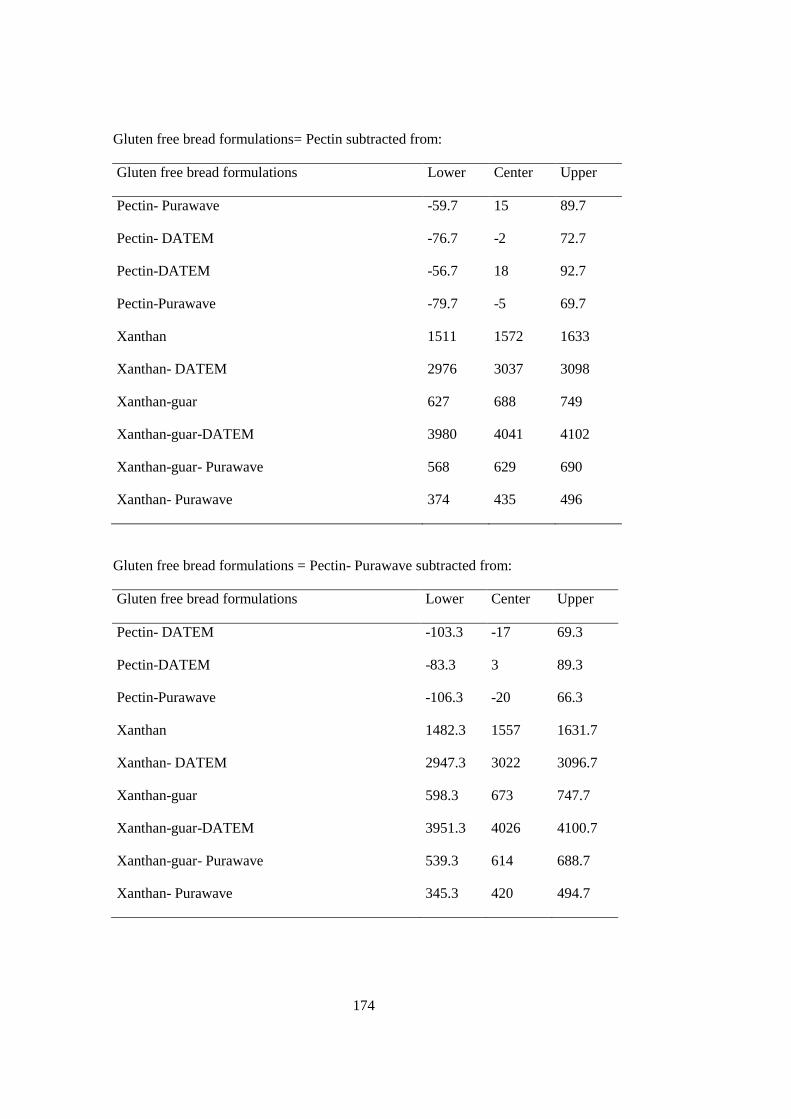
174
Gluten free bread formulations= Pectin subtracted from:
Gluten free bread formulations Lower Center Upper
Pectin- Purawave -59.7 15 89.7
Pectin- DATEM -76.7 -2 72.7
Pectin-DATEM -56.7 18 92.7
Pectin-Purawave -79.7 -5 69.7
Xanthan 1511 1572 1633
Xanthan- DATEM 2976 3037 3098
Xanthan-guar 627 688 749
Xanthan-guar-DATEM 3980 4041 4102
Xanthan-guar- Purawave 568 629 690
Xanthan- Purawave 374 435 496
Gluten free bread formulations = Pectin- Purawave subtracted from:
Gluten free bread formulations Lower Center Upper
Pectin- DATEM -103.3 -17 69.3
Pectin-DATEM -83.3 3 89.3
Pectin-Purawave -106.3 -20 66.3
Xanthan 1482.3 1557 1631.7
Xanthan- DATEM 2947.3 3022 3096.7
Xanthan-guar 598.3 673 747.7
Xanthan-guar-DATEM 3951.3 4026 4100.7
Xanthan-guar- Purawave 539.3 614 688.7
Xanthan- Purawave 345.3 420 494.7
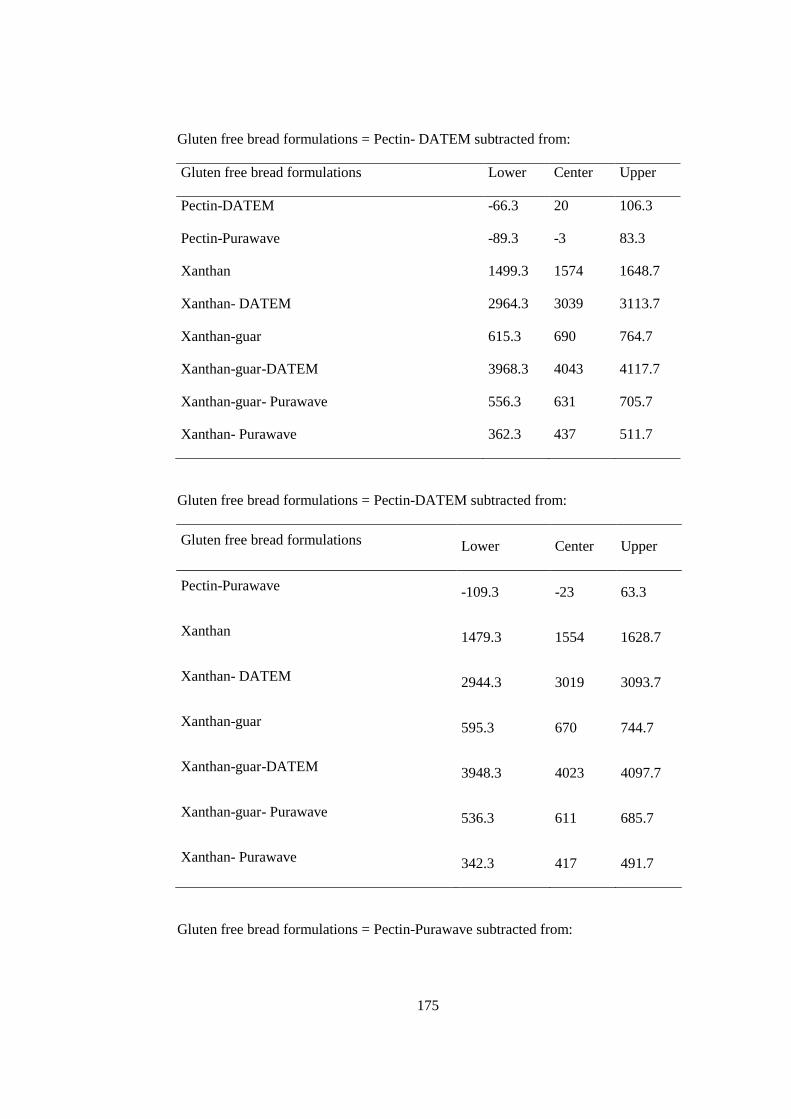
175
Gluten free bread formulations = Pectin- DATEM subtracted from:
Gluten free bread formulations Lower Center Upper
Pectin-DATEM -66.3 20 106.3
Pectin-Purawave -89.3 -3 83.3
Xanthan 1499.3 1574 1648.7
Xanthan- DATEM 2964.3 3039 3113.7
Xanthan-guar 615.3 690 764.7
Xanthan-guar-DATEM 3968.3 4043 4117.7
Xanthan-guar- Purawave 556.3 631 705.7
Xanthan- Purawave 362.3 437 511.7
Gluten free bread formulations = Pectin-DATEM subtracted from:
Gluten free bread formulations Lower Center Upper
Pectin-Purawave -109.3 -23 63.3
Xanthan 1479.3 1554 1628.7
Xanthan- DATEM 2944.3 3019 3093.7
Xanthan-guar 595.3 670 744.7
Xanthan-guar-DATEM 3948.3 4023 4097.7
Xanthan-guar- Purawave 536.3 611 685.7
Xanthan- Purawave 342.3 417 491.7
Gluten free bread formulations = Pectin-Purawave subtracted from:
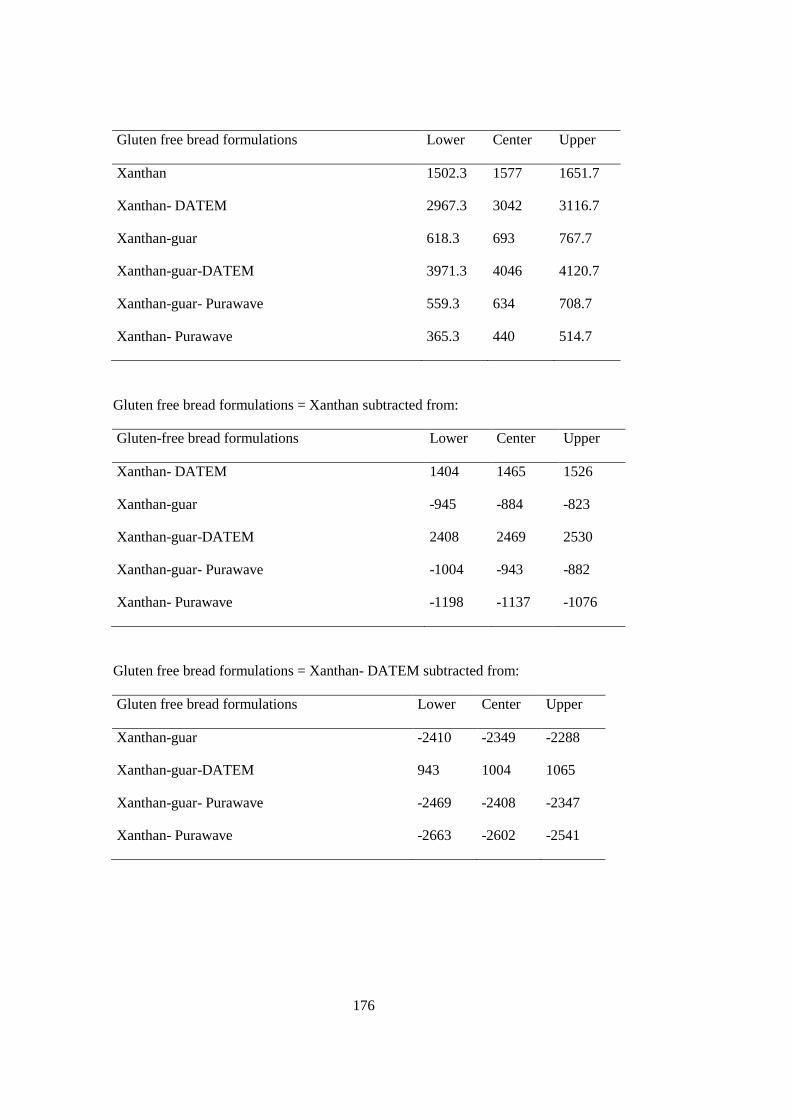
176
Gluten free bread formulations Lower Center Upper
Xanthan 1502.3 1577 1651.7
Xanthan- DATEM 2967.3 3042 3116.7
Xanthan-guar 618.3 693 767.7
Xanthan-guar-DATEM 3971.3 4046 4120.7
Xanthan-guar- Purawave 559.3 634 708.7
Xanthan- Purawave 365.3 440 514.7
Gluten free bread formulations = Xanthan subtracted from:
Gluten-free bread formulations Lower Center Upper
Xanthan- DATEM 1404 1465 1526
Xanthan-guar -945 -884 -823
Xanthan-guar-DATEM 2408 2469 2530
Xanthan-guar- Purawave -1004 -943 -882
Xanthan- Purawave -1198 -1137 -1076
Gluten free bread formulations = Xanthan- DATEM subtracted from:
Gluten free bread formulations Lower Center Upper
Xanthan-guar -2410 -2349 -2288
Xanthan-guar-DATEM 943 1004 1065
Xanthan-guar- Purawave -2469 -2408 -2347
Xanthan- Purawave -2663 -2602 -2541
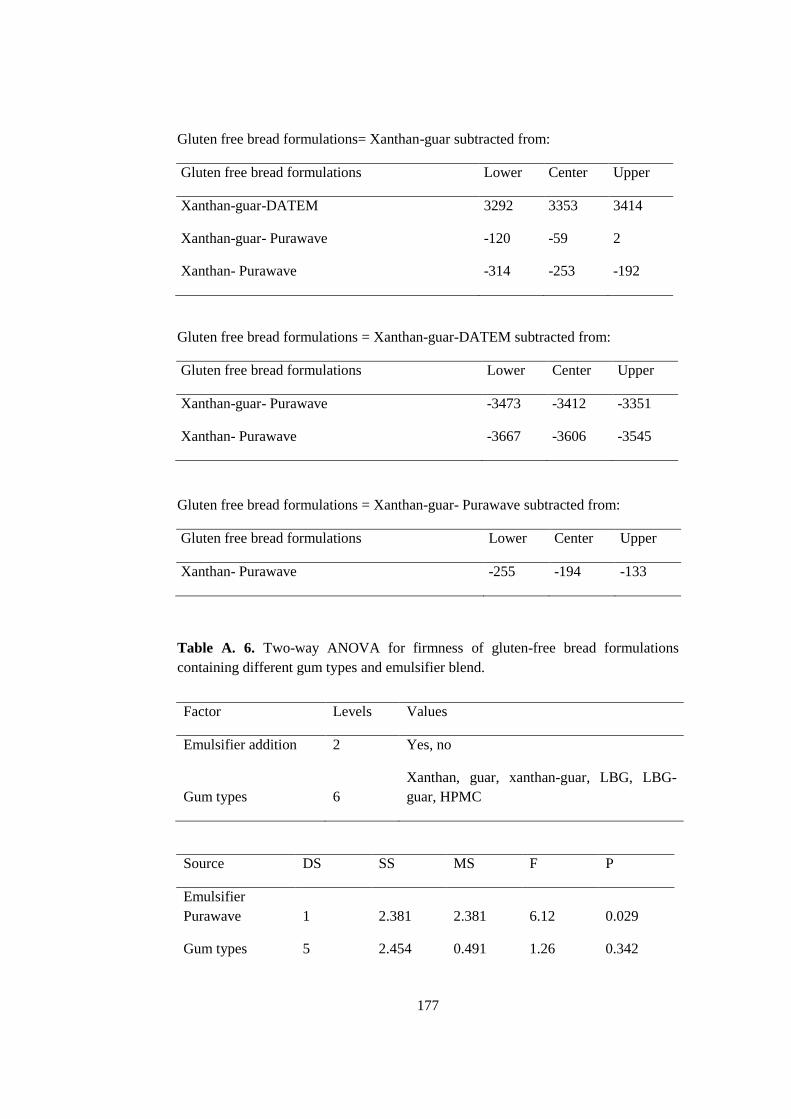
177
Gluten free bread formulations= Xanthan-guar subtracted from:
Gluten free bread formulations Lower Center Upper
Xanthan-guar-DATEM 3292 3353 3414
Xanthan-guar- Purawave -120 -59 2
Xanthan- Purawave -314 -253 -192
Gluten free bread formulations = Xanthan-guar-DATEM subtracted from:
Gluten free bread formulations Lower Center Upper
Xanthan-guar- Purawave -3473 -3412 -3351
Xanthan- Purawave -3667 -3606 -3545
Gluten free bread formulations = Xanthan-guar- Purawave subtracted from:
Gluten free bread formulations Lower Center Upper
Xanthan- Purawave -255 -194 -133
Table A. 6. Two-way ANOVA for firmness of gluten-free bread formulations
containing different gum types and emulsifier blend.
Factor Levels Values
Emulsifier addition 2 Yes, no
Gum types 6
Xanthan, guar, xanthan-guar, LBG, LBG-
guar, HPMC
Source DS SS MS F P
Emulsifier
Purawave 1 2.381 2.381 6.12 0.029
Gum types 5 2.454 0.491 1.26 0.342
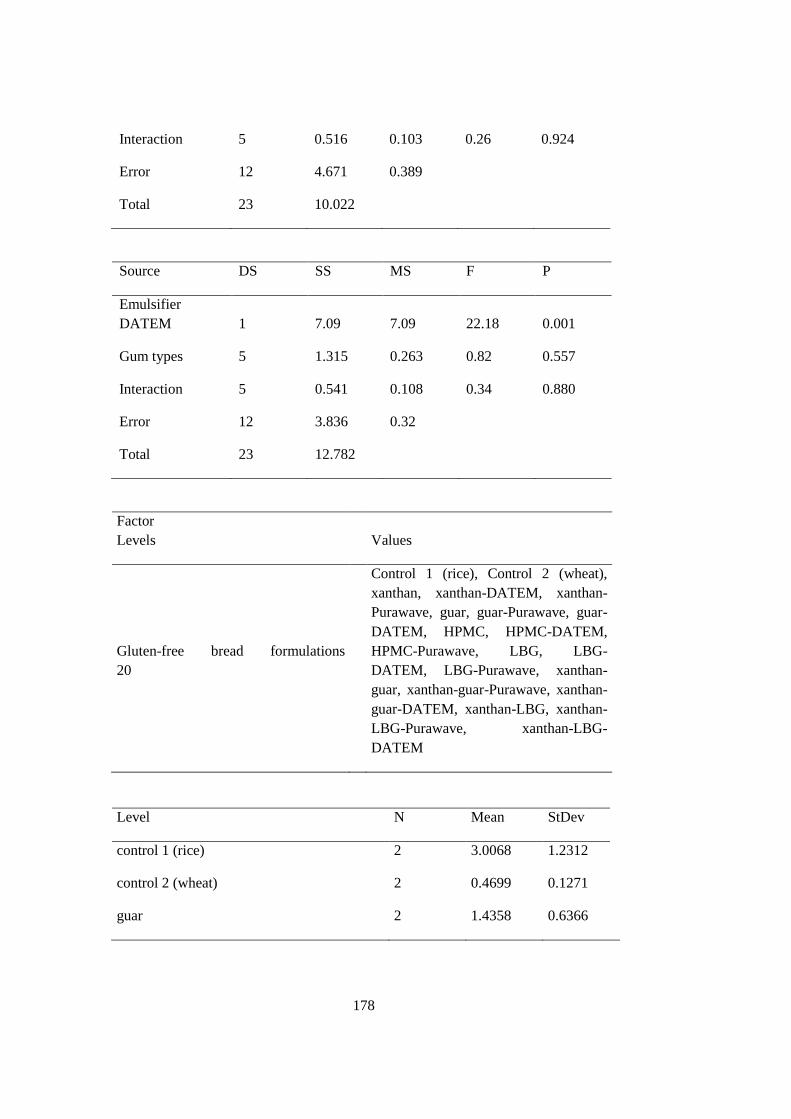
178
Interaction 5 0.516 0.103 0.26 0.924
Error 12 4.671 0.389
Total 23 10.022
Source DS SS MS F P
Emulsifier
DATEM 1 7.09 7.09 22.18 0.001
Gum types 5 1.315 0.263 0.82 0.557
Interaction 5 0.541 0.108 0.34 0.880
Error 12 3.836 0.32
Total 23 12.782
Factor
Levels
Values
Gluten-free bread formulations
20
Control 1 (rice), Control 2 (wheat),
xanthan, xanthan-DATEM, xanthan-
Purawave, guar, guar-Purawave, guar-
DATEM, HPMC, HPMC-DATEM,
HPMC-Purawave, LBG, LBG-
DATEM, LBG-Purawave, xanthan-
guar, xanthan-guar-Purawave, xanthan-
guar-DATEM, xanthan-LBG, xanthan-
LBG-Purawave, xanthan-LBG-
DATEM
Level N Mean StDev
control 1 (rice) 2 3.0068 1.2312
control 2 (wheat) 2 0.4699 0.1271
guar 2 1.4358 0.6366
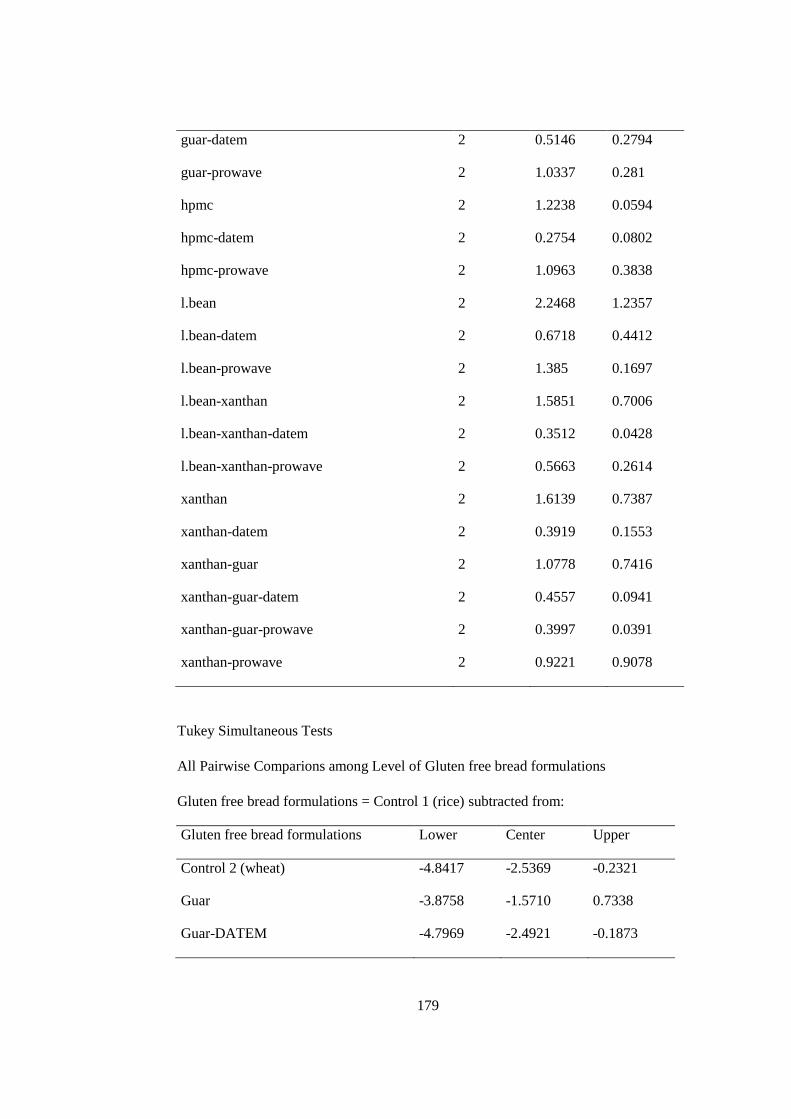
179
guar-datem 2 0.5146 0.2794
guar-prowave 2 1.0337 0.281
hpmc 2 1.2238 0.0594
hpmc-datem 2 0.2754 0.0802
hpmc-prowave 2 1.0963 0.3838
l.bean 2 2.2468 1.2357
l.bean-datem 2 0.6718 0.4412
l.bean-prowave 2 1.385 0.1697
l.bean-xanthan 2 1.5851 0.7006
l.bean-xanthan-datem 2 0.3512 0.0428
l.bean-xanthan-prowave 2 0.5663 0.2614
xanthan 2 1.6139 0.7387
xanthan-datem 2 0.3919 0.1553
xanthan-guar 2 1.0778 0.7416
xanthan-guar-datem 2 0.4557 0.0941
xanthan-guar-prowave 2 0.3997 0.0391
xanthan-prowave 2 0.9221 0.9078
Tukey Simultaneous Tests
All Pairwise Comparions among Level of Gluten free bread formulations
Gluten free bread formulations = Control 1 (rice) subtracted from:
Gluten free bread formulations Lower Center Upper
Control 2 (wheat) -4.8417 -2.5369 -0.2321
Guar -3.8758 -1.5710 0.7338
Guar-DATEM -4.7969 -2.4921 -0.1873
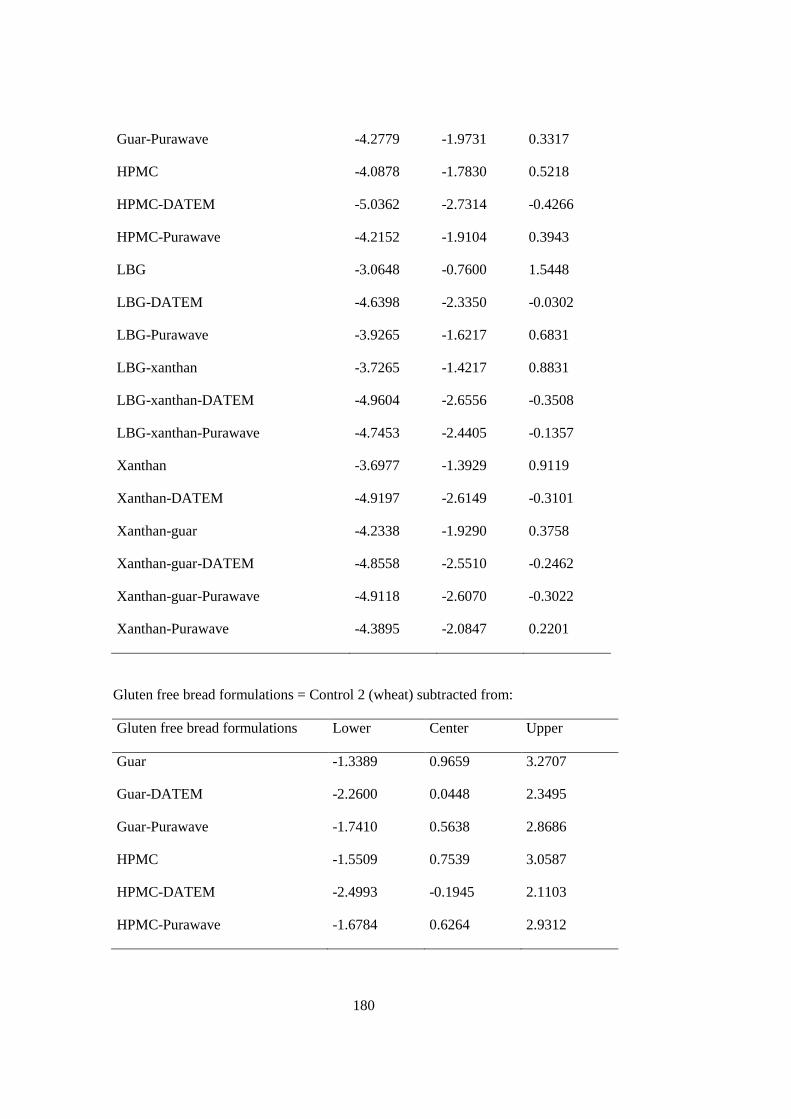
180
Guar-Purawave -4.2779 -1.9731 0.3317
HPMC -4.0878 -1.7830 0.5218
HPMC-DATEM -5.0362 -2.7314 -0.4266
HPMC-Purawave -4.2152 -1.9104 0.3943
LBG -3.0648 -0.7600 1.5448
LBG-DATEM -4.6398 -2.3350 -0.0302
LBG-Purawave -3.9265 -1.6217 0.6831
LBG-xanthan -3.7265 -1.4217 0.8831
LBG-xanthan-DATEM -4.9604 -2.6556 -0.3508
LBG-xanthan-Purawave -4.7453 -2.4405 -0.1357
Xanthan -3.6977 -1.3929 0.9119
Xanthan-DATEM -4.9197 -2.6149 -0.3101
Xanthan-guar -4.2338 -1.9290 0.3758
Xanthan-guar-DATEM -4.8558 -2.5510 -0.2462
Xanthan-guar-Purawave -4.9118 -2.6070 -0.3022
Xanthan-Purawave -4.3895 -2.0847 0.2201
Gluten free bread formulations = Control 2 (wheat) subtracted from:
Gluten free bread formulations Lower Center Upper
Guar -1.3389 0.9659 3.2707
Guar-DATEM -2.2600 0.0448 2.3495
Guar-Purawave -1.7410 0.5638 2.8686
HPMC -1.5509 0.7539 3.0587
HPMC-DATEM -2.4993 -0.1945 2.1103
HPMC-Purawave -1.6784 0.6264 2.9312
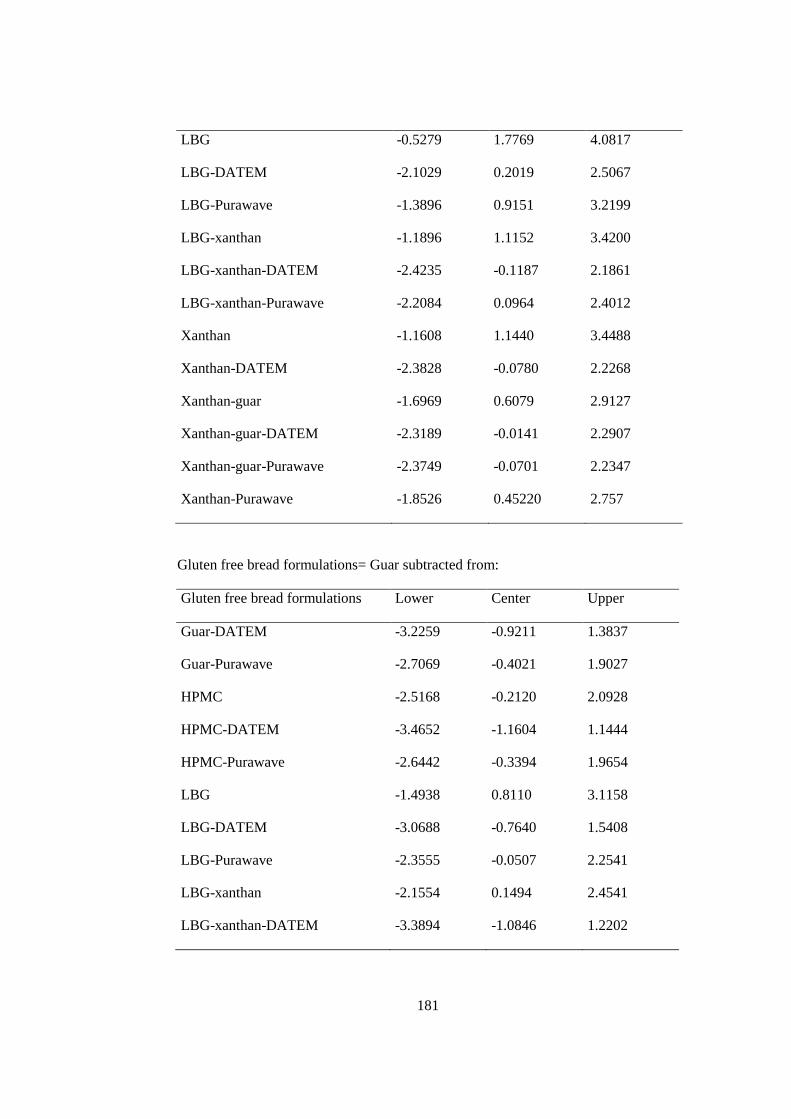
181
LBG -0.5279 1.7769 4.0817
LBG-DATEM -2.1029 0.2019 2.5067
LBG-Purawave -1.3896 0.9151 3.2199
LBG-xanthan -1.1896 1.1152 3.4200
LBG-xanthan-DATEM -2.4235 -0.1187 2.1861
LBG-xanthan-Purawave -2.2084 0.0964 2.4012
Xanthan -1.1608 1.1440 3.4488
Xanthan-DATEM -2.3828 -0.0780 2.2268
Xanthan-guar -1.6969 0.6079 2.9127
Xanthan-guar-DATEM -2.3189 -0.0141 2.2907
Xanthan-guar-Purawave -2.3749 -0.0701 2.2347
Xanthan-Purawave -1.8526 0.45220 2.757
Gluten free bread formulations= Guar subtracted from:
Gluten free bread formulations Lower Center Upper
Guar-DATEM -3.2259 -0.9211 1.3837
Guar-Purawave -2.7069 -0.4021 1.9027
HPMC -2.5168 -0.2120 2.0928
HPMC-DATEM -3.4652 -1.1604 1.1444
HPMC-Purawave -2.6442 -0.3394 1.9654
LBG -1.4938 0.8110 3.1158
LBG-DATEM -3.0688 -0.7640 1.5408
LBG-Purawave -2.3555 -0.0507 2.2541
LBG-xanthan -2.1554 0.1494 2.4541
LBG-xanthan-DATEM -3.3894 -1.0846 1.2202
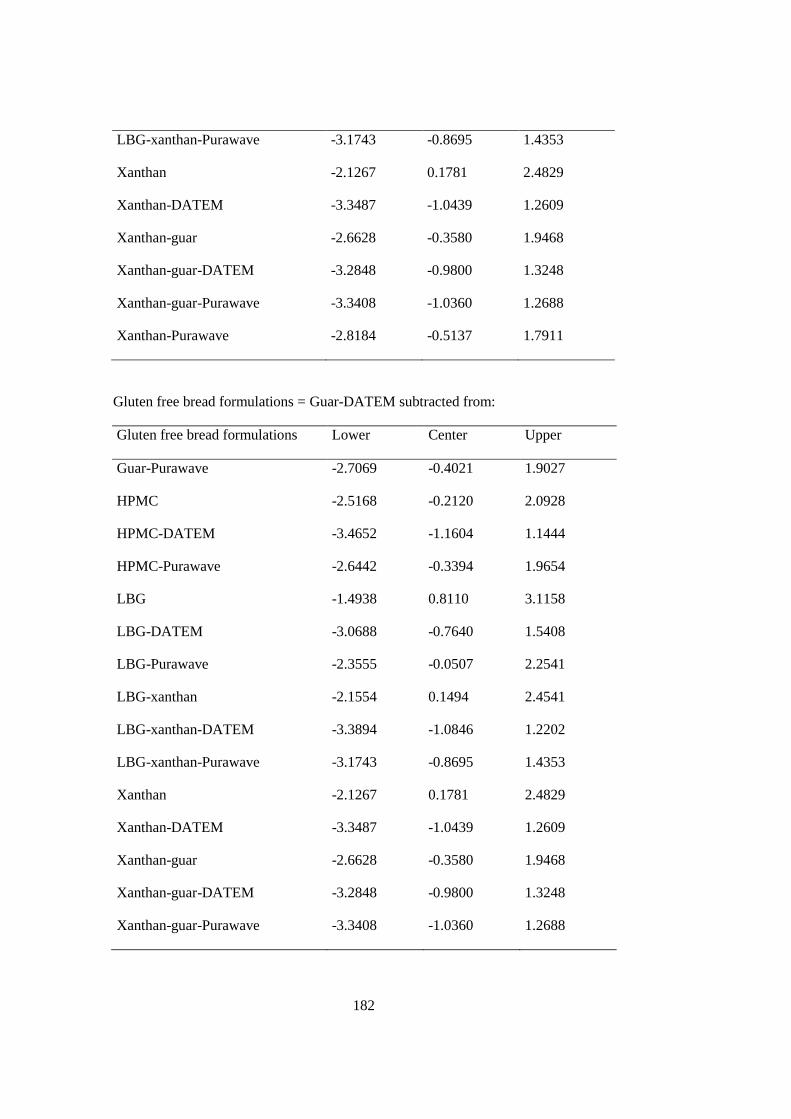
182
LBG-xanthan-Purawave -3.1743 -0.8695 1.4353
Xanthan -2.1267 0.1781 2.4829
Xanthan-DATEM -3.3487 -1.0439 1.2609
Xanthan-guar -2.6628 -0.3580 1.9468
Xanthan-guar-DATEM -3.2848 -0.9800 1.3248
Xanthan-guar-Purawave -3.3408 -1.0360 1.2688
Xanthan-Purawave -2.8184 -0.5137 1.7911
Gluten free bread formulations = Guar-DATEM subtracted from:
Gluten free bread formulations Lower Center Upper
Guar-Purawave -2.7069 -0.4021 1.9027
HPMC -2.5168 -0.2120 2.0928
HPMC-DATEM -3.4652 -1.1604 1.1444
HPMC-Purawave -2.6442 -0.3394 1.9654
LBG -1.4938 0.8110 3.1158
LBG-DATEM -3.0688 -0.7640 1.5408
LBG-Purawave -2.3555 -0.0507 2.2541
LBG-xanthan -2.1554 0.1494 2.4541
LBG-xanthan-DATEM -3.3894 -1.0846 1.2202
LBG-xanthan-Purawave -3.1743 -0.8695 1.4353
Xanthan -2.1267 0.1781 2.4829
Xanthan-DATEM -3.3487 -1.0439 1.2609
Xanthan-guar -2.6628 -0.3580 1.9468
Xanthan-guar-DATEM -3.2848 -0.9800 1.3248
Xanthan-guar-Purawave -3.3408 -1.0360 1.2688
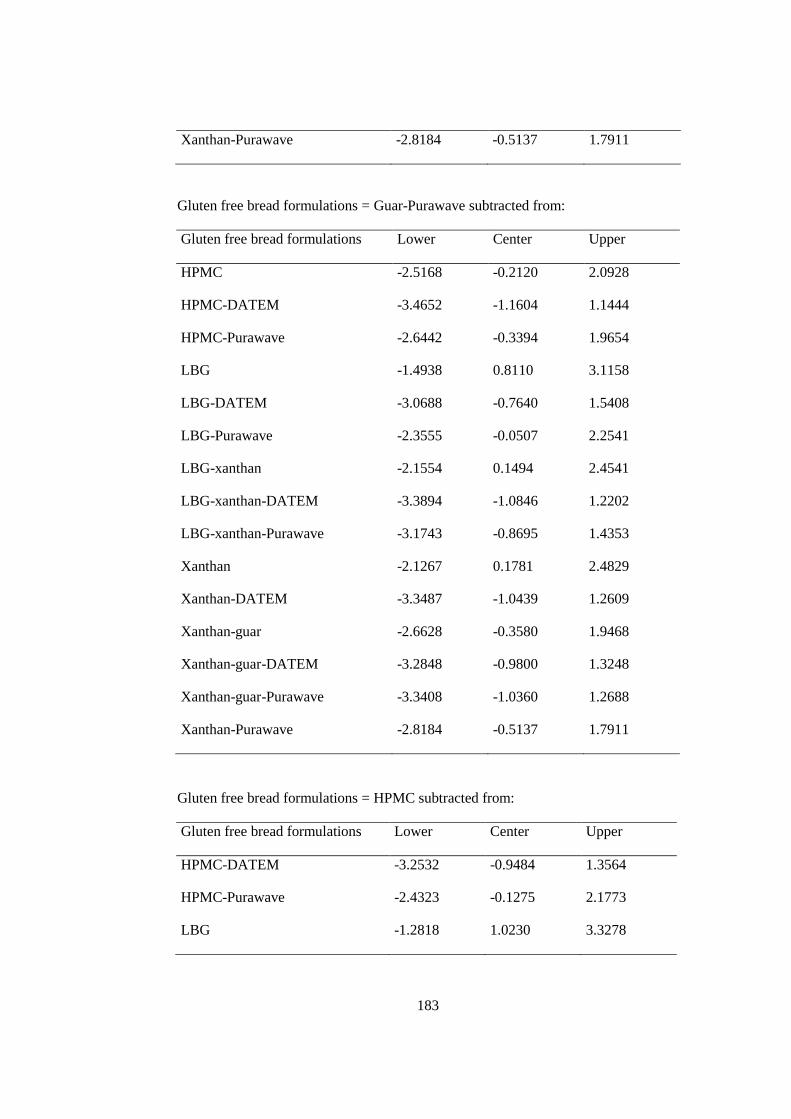
183
Xanthan-Purawave -2.8184 -0.5137 1.7911
Gluten free bread formulations = Guar-Purawave subtracted from:
Gluten free bread formulations Lower Center Upper
HPMC -2.5168 -0.2120 2.0928
HPMC-DATEM -3.4652 -1.1604 1.1444
HPMC-Purawave -2.6442 -0.3394 1.9654
LBG -1.4938 0.8110 3.1158
LBG-DATEM -3.0688 -0.7640 1.5408
LBG-Purawave -2.3555 -0.0507 2.2541
LBG-xanthan -2.1554 0.1494 2.4541
LBG-xanthan-DATEM -3.3894 -1.0846 1.2202
LBG-xanthan-Purawave -3.1743 -0.8695 1.4353
Xanthan -2.1267 0.1781 2.4829
Xanthan-DATEM -3.3487 -1.0439 1.2609
Xanthan-guar -2.6628 -0.3580 1.9468
Xanthan-guar-DATEM -3.2848 -0.9800 1.3248
Xanthan-guar-Purawave -3.3408 -1.0360 1.2688
Xanthan-Purawave -2.8184 -0.5137 1.7911
Gluten free bread formulations = HPMC subtracted from:
Gluten free bread formulations Lower Center Upper
HPMC-DATEM -3.2532 -0.9484 1.3564
HPMC-Purawave -2.4323 -0.1275 2.1773
LBG -1.2818 1.0230 3.3278
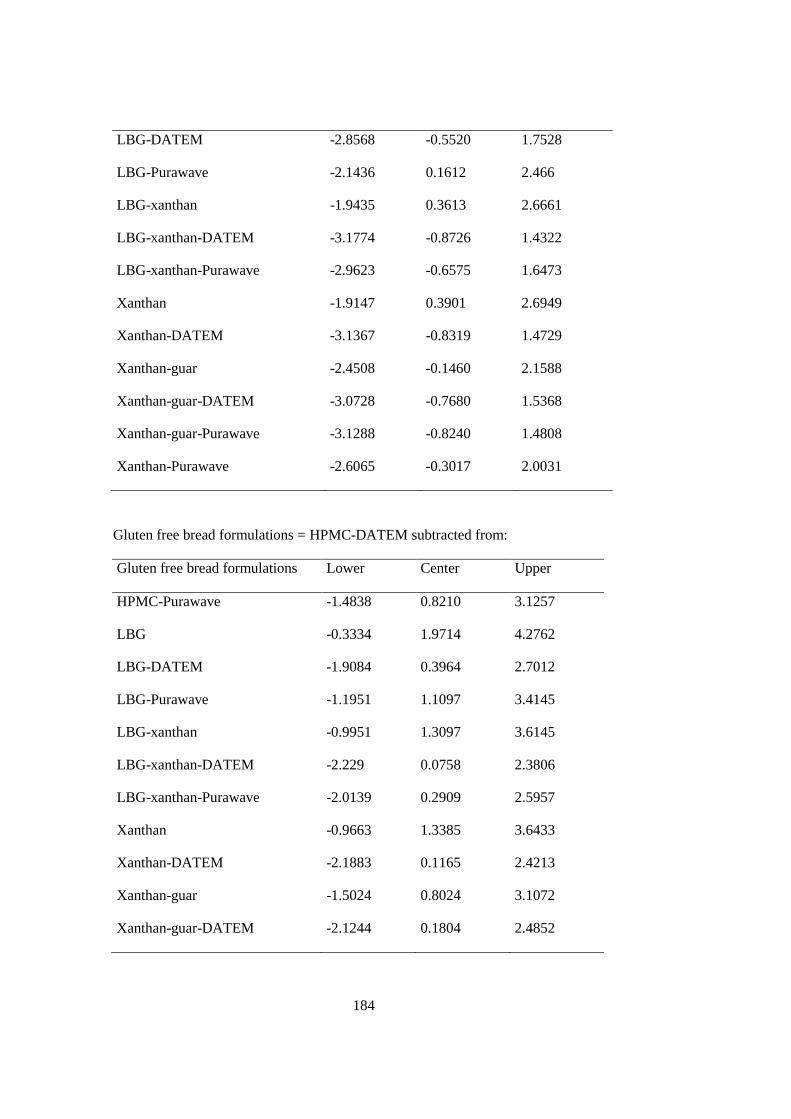
184
LBG-DATEM -2.8568 -0.5520 1.7528
LBG-Purawave -2.1436 0.1612 2.466
LBG-xanthan -1.9435 0.3613 2.6661
LBG-xanthan-DATEM -3.1774 -0.8726 1.4322
LBG-xanthan-Purawave -2.9623 -0.6575 1.6473
Xanthan -1.9147 0.3901 2.6949
Xanthan-DATEM -3.1367 -0.8319 1.4729
Xanthan-guar -2.4508 -0.1460 2.1588
Xanthan-guar-DATEM -3.0728 -0.7680 1.5368
Xanthan-guar-Purawave -3.1288 -0.8240 1.4808
Xanthan-Purawave -2.6065 -0.3017 2.0031
Gluten free bread formulations = HPMC-DATEM subtracted from:
Gluten free bread formulations Lower Center Upper
HPMC-Purawave -1.4838 0.8210 3.1257
LBG -0.3334 1.9714 4.2762
LBG-DATEM -1.9084 0.3964 2.7012
LBG-Purawave -1.1951 1.1097 3.4145
LBG-xanthan -0.9951 1.3097 3.6145
LBG-xanthan-DATEM -2.229 0.0758 2.3806
LBG-xanthan-Purawave -2.0139 0.2909 2.5957
Xanthan -0.9663 1.3385 3.6433
Xanthan-DATEM -2.1883 0.1165 2.4213
Xanthan-guar -1.5024 0.8024 3.1072
Xanthan-guar-DATEM -2.1244 0.1804 2.4852
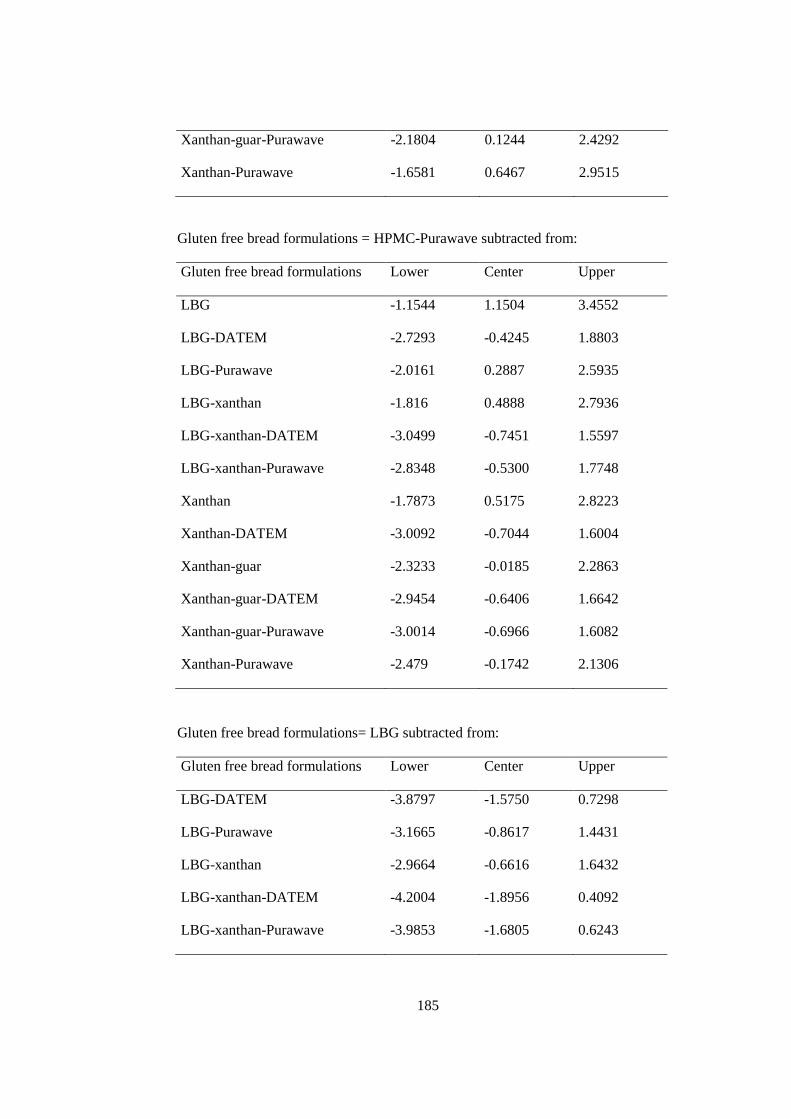
185
Xanthan-guar-Purawave -2.1804 0.1244 2.4292
Xanthan-Purawave -1.6581 0.6467 2.9515
Gluten free bread formulations = HPMC-Purawave subtracted from:
Gluten free bread formulations Lower Center Upper
LBG -1.1544 1.1504 3.4552
LBG-DATEM -2.7293 -0.4245 1.8803
LBG-Purawave -2.0161 0.2887 2.5935
LBG-xanthan -1.816 0.4888 2.7936
LBG-xanthan-DATEM -3.0499 -0.7451 1.5597
LBG-xanthan-Purawave -2.8348 -0.5300 1.7748
Xanthan -1.7873 0.5175 2.8223
Xanthan-DATEM -3.0092 -0.7044 1.6004
Xanthan-guar -2.3233 -0.0185 2.2863
Xanthan-guar-DATEM -2.9454 -0.6406 1.6642
Xanthan-guar-Purawave -3.0014 -0.6966 1.6082
Xanthan-Purawave -2.479 -0.1742 2.1306
Gluten free bread formulations= LBG subtracted from:
Gluten free bread formulations Lower Center Upper
LBG-DATEM -3.8797 -1.5750 0.7298
LBG-Purawave -3.1665 -0.8617 1.4431
LBG-xanthan -2.9664 -0.6616 1.6432
LBG-xanthan-DATEM -4.2004 -1.8956 0.4092
LBG-xanthan-Purawave -3.9853 -1.6805 0.6243
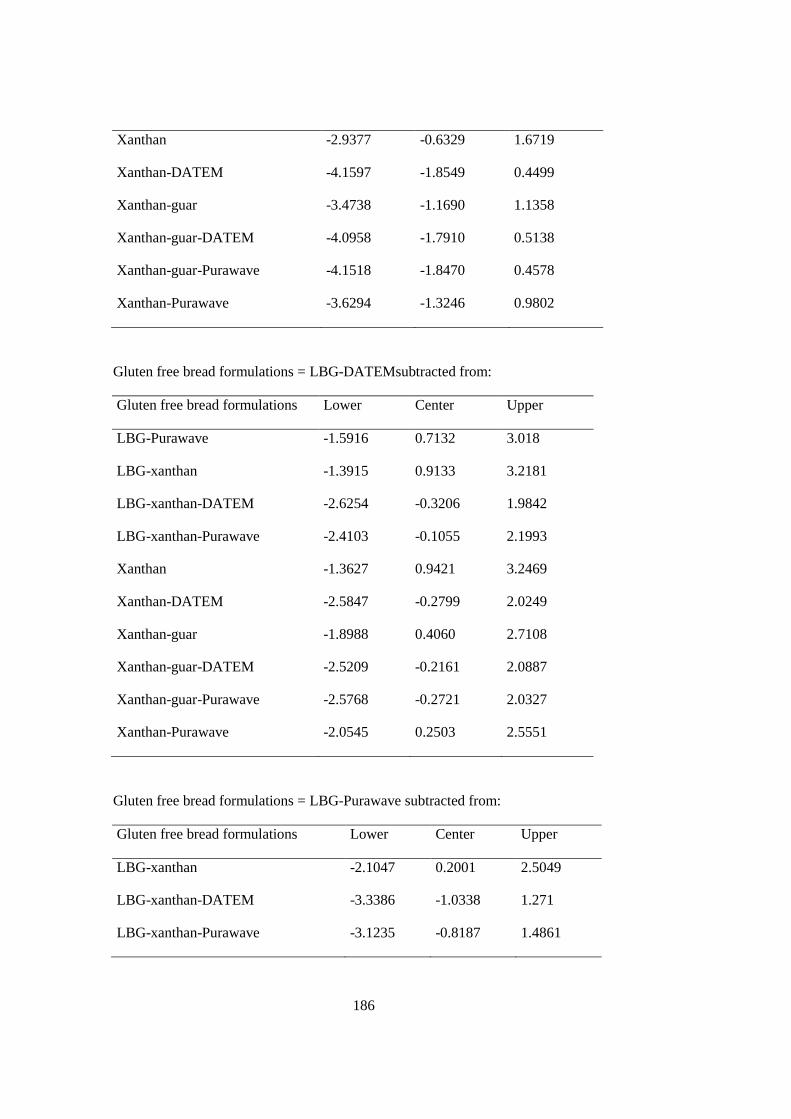
186
Xanthan -2.9377 -0.6329 1.6719
Xanthan-DATEM -4.1597 -1.8549 0.4499
Xanthan-guar -3.4738 -1.1690 1.1358
Xanthan-guar-DATEM -4.0958 -1.7910 0.5138
Xanthan-guar-Purawave -4.1518 -1.8470 0.4578
Xanthan-Purawave -3.6294 -1.3246 0.9802
Gluten free bread formulations = LBG-DATEMsubtracted from:
Gluten free bread formulations Lower Center Upper
LBG-Purawave -1.5916 0.7132 3.018
LBG-xanthan -1.3915 0.9133 3.2181
LBG-xanthan-DATEM -2.6254 -0.3206 1.9842
LBG-xanthan-Purawave -2.4103 -0.1055 2.1993
Xanthan -1.3627 0.9421 3.2469
Xanthan-DATEM -2.5847 -0.2799 2.0249
Xanthan-guar -1.8988 0.4060 2.7108
Xanthan-guar-DATEM -2.5209 -0.2161 2.0887
Xanthan-guar-Purawave -2.5768 -0.2721 2.0327
Xanthan-Purawave -2.0545 0.2503 2.5551
Gluten free bread formulations = LBG-Purawave subtracted from:
Gluten free bread formulations Lower Center Upper
LBG-xanthan -2.1047 0.2001 2.5049
LBG-xanthan-DATEM -3.3386 -1.0338 1.271
LBG-xanthan-Purawave -3.1235 -0.8187 1.4861
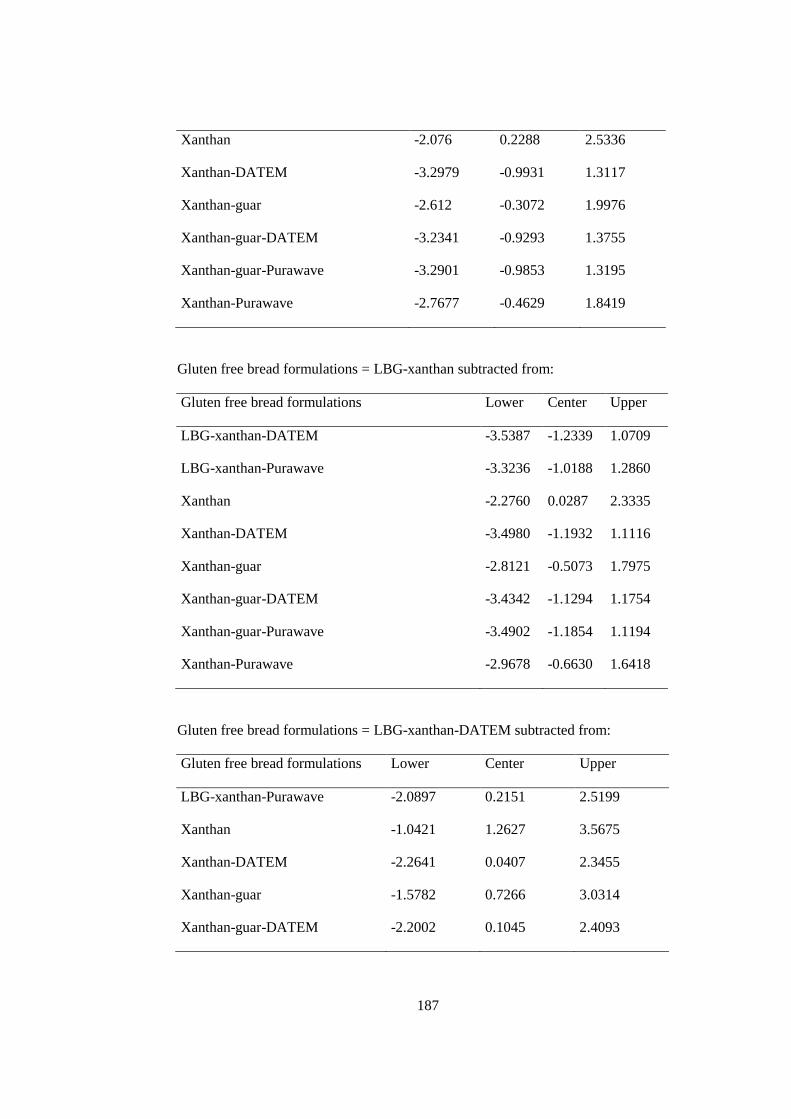
187
Xanthan -2.076 0.2288 2.5336
Xanthan-DATEM -3.2979 -0.9931 1.3117
Xanthan-guar -2.612 -0.3072 1.9976
Xanthan-guar-DATEM -3.2341 -0.9293 1.3755
Xanthan-guar-Purawave -3.2901 -0.9853 1.3195
Xanthan-Purawave -2.7677 -0.4629 1.8419
Gluten free bread formulations = LBG-xanthan subtracted from:
Gluten free bread formulations Lower Center Upper
LBG-xanthan-DATEM -3.5387 -1.2339 1.0709
LBG-xanthan-Purawave -3.3236 -1.0188 1.2860
Xanthan -2.2760 0.0287 2.3335
Xanthan-DATEM -3.4980 -1.1932 1.1116
Xanthan-guar -2.8121 -0.5073 1.7975
Xanthan-guar-DATEM -3.4342 -1.1294 1.1754
Xanthan-guar-Purawave -3.4902 -1.1854 1.1194
Xanthan-Purawave -2.9678 -0.6630 1.6418
Gluten free bread formulations = LBG-xanthan-DATEM subtracted from:
Gluten free bread formulations Lower Center Upper
LBG-xanthan-Purawave -2.0897 0.2151 2.5199
Xanthan -1.0421 1.2627 3.5675
Xanthan-DATEM -2.2641 0.0407 2.3455
Xanthan-guar -1.5782 0.7266 3.0314
Xanthan-guar-DATEM -2.2002 0.1045 2.4093
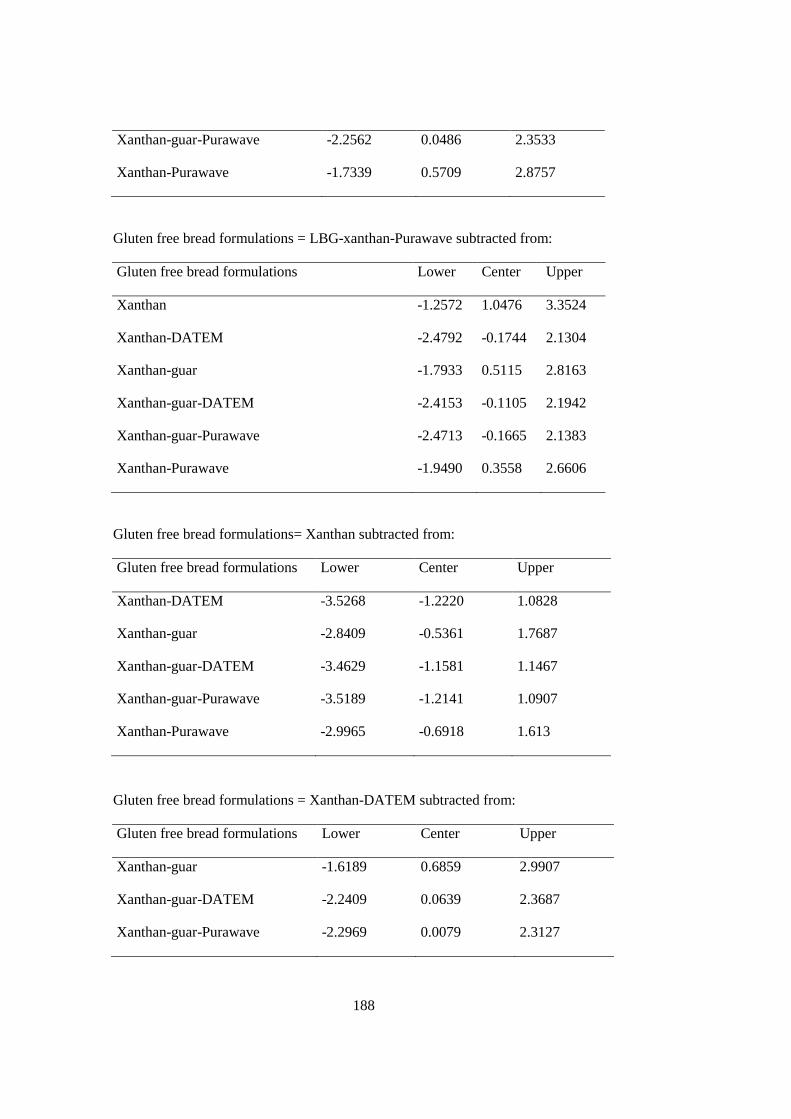
188
Xanthan-guar-Purawave -2.2562 0.0486 2.3533
Xanthan-Purawave -1.7339 0.5709 2.8757
Gluten free bread formulations = LBG-xanthan-Purawave subtracted from:
Gluten free bread formulations Lower Center Upper
Xanthan -1.2572 1.0476 3.3524
Xanthan-DATEM -2.4792 -0.1744 2.1304
Xanthan-guar -1.7933 0.5115 2.8163
Xanthan-guar-DATEM -2.4153 -0.1105 2.1942
Xanthan-guar-Purawave -2.4713 -0.1665 2.1383
Xanthan-Purawave -1.9490 0.3558 2.6606
Gluten free bread formulations= Xanthan subtracted from:
Gluten free bread formulations Lower Center Upper
Xanthan-DATEM -3.5268 -1.2220 1.0828
Xanthan-guar -2.8409 -0.5361 1.7687
Xanthan-guar-DATEM -3.4629 -1.1581 1.1467
Xanthan-guar-Purawave -3.5189 -1.2141 1.0907
Xanthan-Purawave -2.9965 -0.6918 1.613
Gluten free bread formulations = Xanthan-DATEM subtracted from:
Gluten free bread formulations Lower Center Upper
Xanthan-guar -1.6189 0.6859 2.9907
Xanthan-guar-DATEM -2.2409 0.0639 2.3687
Xanthan-guar-Purawave -2.2969 0.0079 2.3127
189
Xanthan-Purawave -1.7746 0.5302 2.8350
Gluten free bread formulations= Xanthan-guar subtracted from:
Gluten free bread formulations Lower Center Upper
Xanthan-guar-DATEM -2.9268 -0.6220 1.6828
Xanthan-guar-Purawave -2.9828 -0.6780 1.6268
Xanthan-Purawave -2.4605 -0.1557 2.1491
Gluten free bread formulations = xanthan-guar-datem subtracted from:
Gluten free bread formulations Lower Center Upper
Xanthan-guar-Purawave -2.3608 -0.056 2.2488
Xanthan-Purawave -1.8384 0.4664 2.7712
Gluten free bread formulations= Xanthan-guar-Purawave subtracted from:
Gluten free bread formulations Lower Center Upper
Xanthan-Purawave -1.7824 0.5224 2.8272
Table A. 7. Two-way ANOVA for specific volume of gluten-free bread formulations
containing different gum types and emulsifier blend.
Factor Levels Values
Emulsifier addition 2 Yes, no
Gum types 6
Xanthan, guar, xanthan-guar, LBG, LBG-
guar, HPMC
190
Source DS SS MS F P
Emulsifier
Purawave 1 0.3168 0.3168 10.74 0.007
Gum 5 0.2436 0.0487 1.65 0.220
Interaction 5 0.0644 0.0129 0.44 0.815
Error 12 0.3539 0.0295
Total 23 0.9787
Source DS SS MS F P
Emulsifier
DATEM 1 0.7382 0.7382 23.07 0.000
Gum 5 0.1436 0.0287 0.9 0.513
Interaction 5 0.0329 0.0066 0.21 0.954
Error 12 0.3839 0.032
Total 23 1.2986
Factor
Levels
Values
Gluten-free bread formulations
20
Control 1 (rice), Control 2
(wheat), xanthan, xanthan-
DATEM, xanthan-Purawave,
guar, guar-Purawave, guar-
DATEM, HPMC, HPMC-
DATEM, HPMC-Purawave,
LBG, LBG-DATEM, LBG-
Purawave, xanthan-guar,
xanthan-guar-Purawave,
xanthan-guar-DATEM, xanthan-
LBG, xanthan-LBG-Purawave,
xanthan-LBG-DATEM
191
Source DS SS MS F P
Emulsifier
Purawave 19 18.940 0.997 3.06 0.008
Error 20 6.517 0.326
Total 39 25.457
Table A. 8. One-way ANOVA for specific volume of gluten-free bread formulations
containing different gum types and emulsifier blend.
Source DF SS MS F P
Gluten-free bread formulations 19 1.9644 0.1034 4.48 0.001
Error 20 0.4616 0.0231
Total 39 2.426
Tukey Simultaneous Tests
All Pairwise Comparions among Level of Gluten free bread formulations
Gluten-free bread formulations= control 2 (wheat) subtracted from:
Level N Mean StDev
Control 1 (rice) 2 0.6250 0.1344
Control 2 (wheat) 2 1.5050 0.1061
Guar 2 0.8630 0.0750
Guar-DATEM 2 1.3270 0.2588
Guar-Purawave 2 1.0020 0.0311
HPMC 2 0.8250 0.1683
192
HPMC-DATEM 2 1.1140 0.0057
HPMC-Purawave 2 1.0058 0.0506
LBG 2 0.7825 0.2934
LBG-DATEM 2 1.0615 0.0686
LBG-Purawave 2 0.9350 0.1485
LBG-xanthan 2 0.9675 0.1379
LBG-xanthan-DATEM 2 1.2550 0.0354
LBG-xanthan-Purawave 2 1.1315 0.0757
Xanthan 2 0.8400 0.2263
Xanthan-DATEM 2 1.2750 0.0354
Xanthan-guar 2 0.9600 0.3394
Xanthan-guar-DATEM 2 1.3100 0.0651
Xanthan-guar-Purawave 2 1.3725 0.1237
Xanthan-Purawave 2 1.1700 0.0424
Gluten-free bread formulations= Control 1 (rice) subtracted from:
Gluten-free bread formulations Lower Center Upper
Control 2 (wheat) 0.2666 0.8800 1.4934
Guar -0.3754 0.2380 0.8514
Guar-DATEM 0.0886 0.7020 1.3154
Guar-Purawave -0.2364 0.3770 0.9904
HPMC -0.4134 0.2000 0.8134
HPMC-DATEM -0.1244 0.4890 1.1024
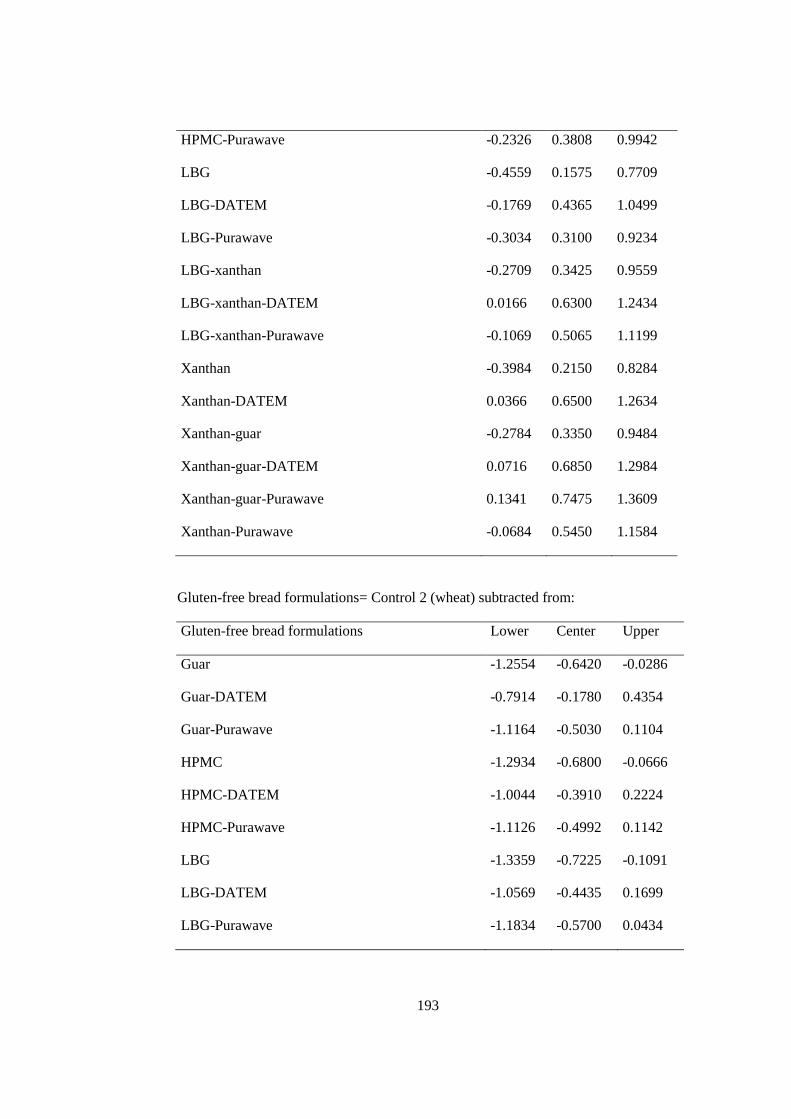
193
HPMC-Purawave -0.2326 0.3808 0.9942
LBG -0.4559 0.1575 0.7709
LBG-DATEM -0.1769 0.4365 1.0499
LBG-Purawave -0.3034 0.3100 0.9234
LBG-xanthan -0.2709 0.3425 0.9559
LBG-xanthan-DATEM 0.0166 0.6300 1.2434
LBG-xanthan-Purawave -0.1069 0.5065 1.1199
Xanthan -0.3984 0.2150 0.8284
Xanthan-DATEM 0.0366 0.6500 1.2634
Xanthan-guar -0.2784 0.3350 0.9484
Xanthan-guar-DATEM 0.0716 0.6850 1.2984
Xanthan-guar-Purawave 0.1341 0.7475 1.3609
Xanthan-Purawave -0.0684 0.5450 1.1584
Gluten-free bread formulations= Control 2 (wheat) subtracted from:
Gluten-free bread formulations Lower Center Upper
Guar -1.2554 -0.6420 -0.0286
Guar-DATEM -0.7914 -0.1780 0.4354
Guar-Purawave -1.1164 -0.5030 0.1104
HPMC -1.2934 -0.6800 -0.0666
HPMC-DATEM -1.0044 -0.3910 0.2224
HPMC-Purawave -1.1126 -0.4992 0.1142
LBG -1.3359 -0.7225 -0.1091
LBG-DATEM -1.0569 -0.4435 0.1699
LBG-Purawave -1.1834 -0.5700 0.0434
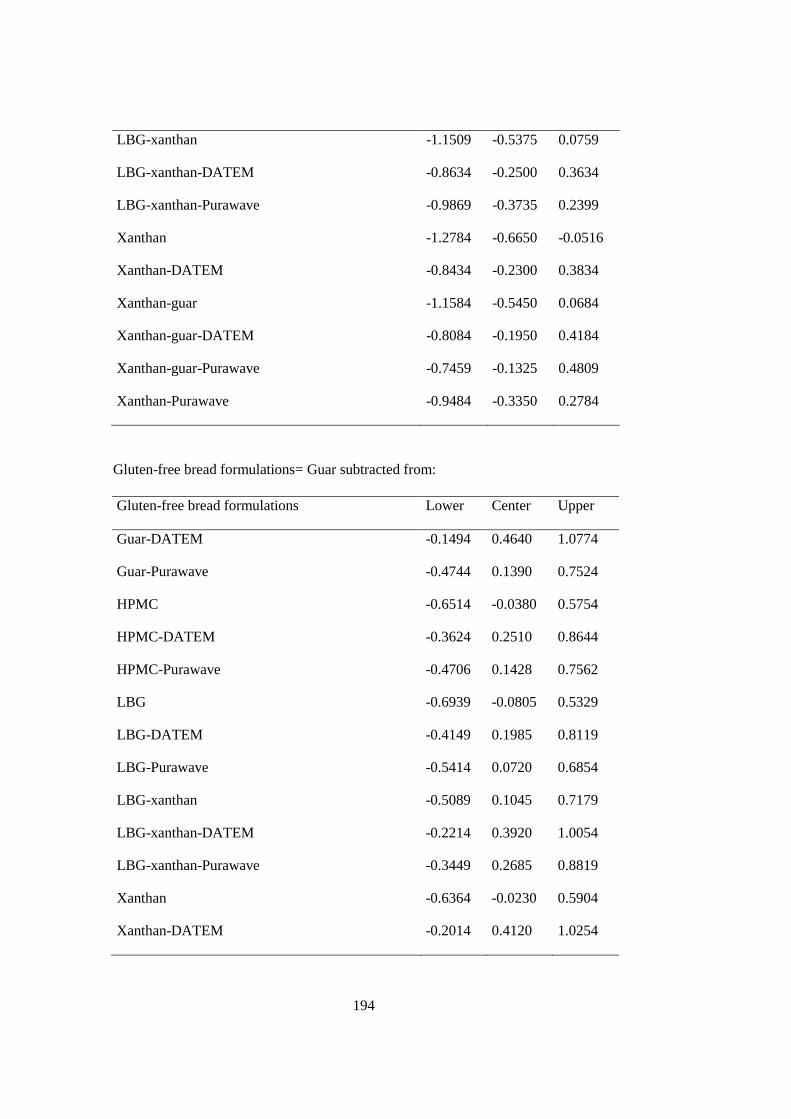
194
LBG-xanthan -1.1509 -0.5375 0.0759
LBG-xanthan-DATEM -0.8634 -0.2500 0.3634
LBG-xanthan-Purawave -0.9869 -0.3735 0.2399
Xanthan -1.2784 -0.6650 -0.0516
Xanthan-DATEM -0.8434 -0.2300 0.3834
Xanthan-guar -1.1584 -0.5450 0.0684
Xanthan-guar-DATEM -0.8084 -0.1950 0.4184
Xanthan-guar-Purawave -0.7459 -0.1325 0.4809
Xanthan-Purawave -0.9484 -0.3350 0.2784
Gluten-free bread formulations= Guar subtracted from:
Gluten-free bread formulations Lower Center Upper
Guar-DATEM -0.1494 0.4640 1.0774
Guar-Purawave -0.4744 0.1390 0.7524
HPMC -0.6514 -0.0380 0.5754
HPMC-DATEM -0.3624 0.2510 0.8644
HPMC-Purawave -0.4706 0.1428 0.7562
LBG -0.6939 -0.0805 0.5329
LBG-DATEM -0.4149 0.1985 0.8119
LBG-Purawave -0.5414 0.0720 0.6854
LBG-xanthan -0.5089 0.1045 0.7179
LBG-xanthan-DATEM -0.2214 0.3920 1.0054
LBG-xanthan-Purawave -0.3449 0.2685 0.8819
Xanthan -0.6364 -0.0230 0.5904
Xanthan-DATEM -0.2014 0.4120 1.0254
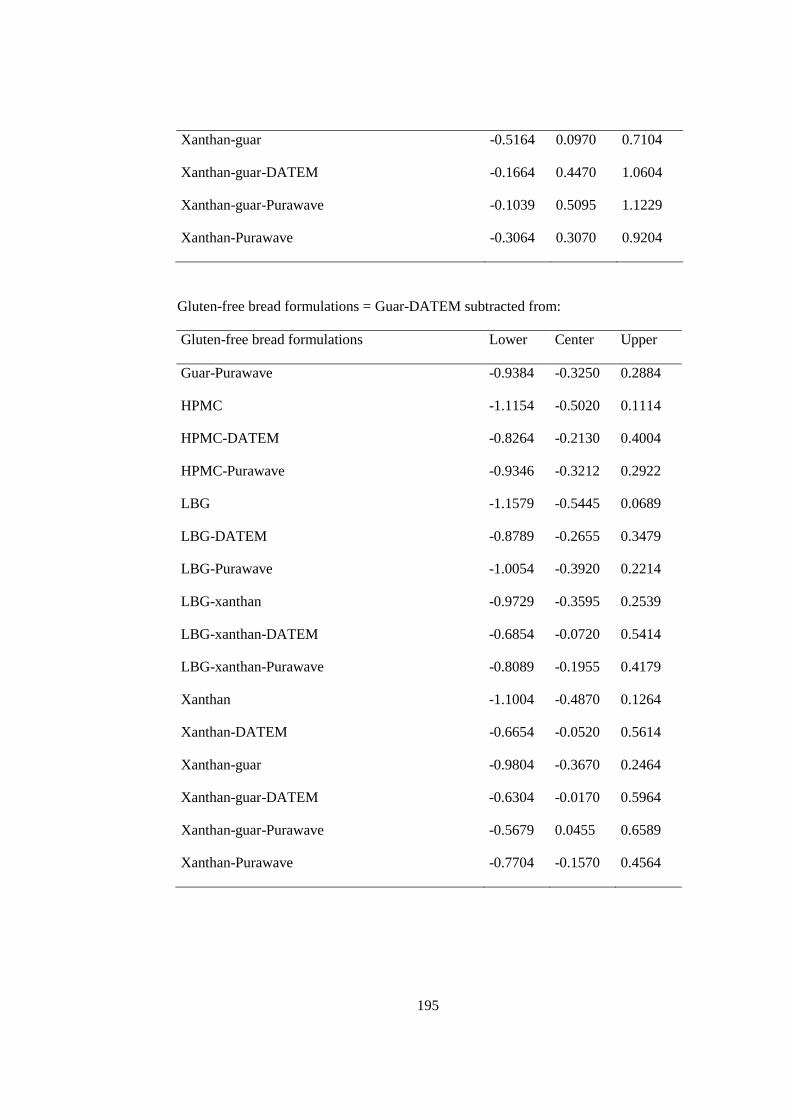
195
Xanthan-guar -0.5164 0.0970 0.7104
Xanthan-guar-DATEM -0.1664 0.4470 1.0604
Xanthan-guar-Purawave -0.1039 0.5095 1.1229
Xanthan-Purawave -0.3064 0.3070 0.9204
Gluten-free bread formulations = Guar-DATEM subtracted from:
Gluten-free bread formulations Lower Center Upper
Guar-Purawave -0.9384 -0.3250 0.2884
HPMC -1.1154 -0.5020 0.1114
HPMC-DATEM -0.8264 -0.2130 0.4004
HPMC-Purawave -0.9346 -0.3212 0.2922
LBG -1.1579 -0.5445 0.0689
LBG-DATEM -0.8789 -0.2655 0.3479
LBG-Purawave -1.0054 -0.3920 0.2214
LBG-xanthan -0.9729 -0.3595 0.2539
LBG-xanthan-DATEM -0.6854 -0.0720 0.5414
LBG-xanthan-Purawave -0.8089 -0.1955 0.4179
Xanthan -1.1004 -0.4870 0.1264
Xanthan-DATEM -0.6654 -0.0520 0.5614
Xanthan-guar -0.9804 -0.3670 0.2464
Xanthan-guar-DATEM -0.6304 -0.0170 0.5964
Xanthan-guar-Purawave -0.5679 0.0455 0.6589
Xanthan-Purawave -0.7704 -0.1570 0.4564
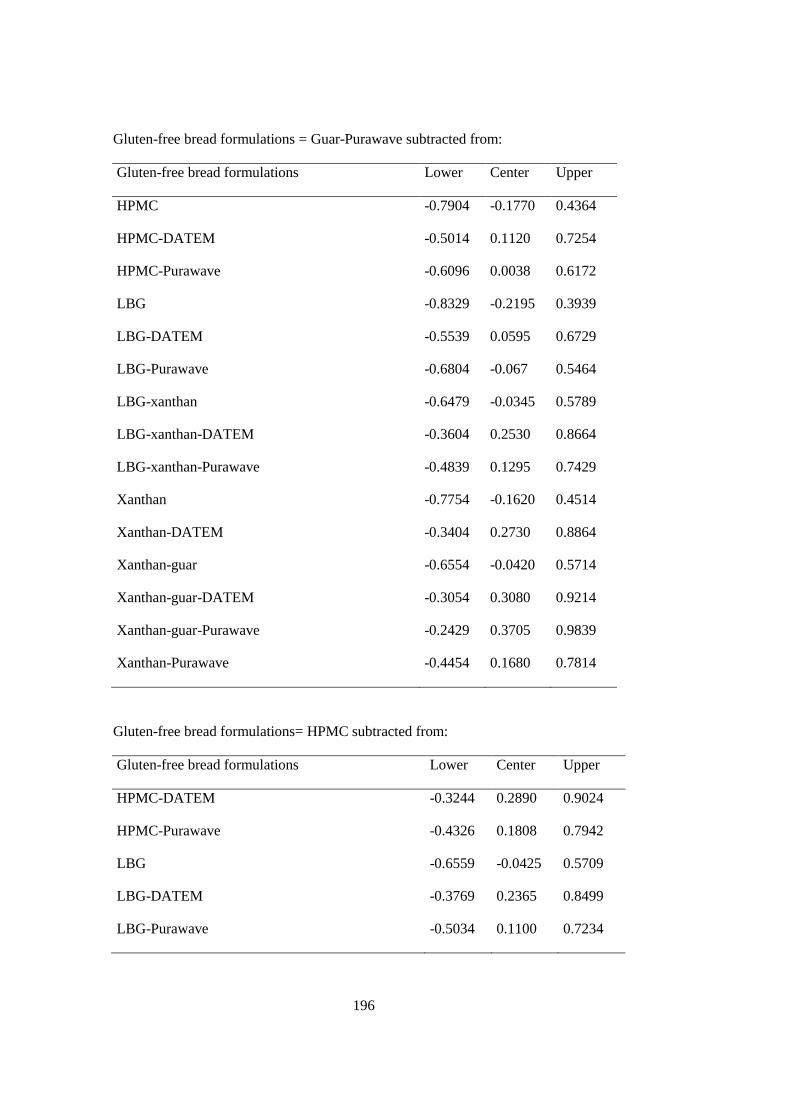
196
Gluten-free bread formulations = Guar-Purawave subtracted from:
Gluten-free bread formulations Lower Center Upper
HPMC -0.7904 -0.1770 0.4364
HPMC-DATEM -0.5014 0.1120 0.7254
HPMC-Purawave -0.6096 0.0038 0.6172
LBG -0.8329 -0.2195 0.3939
LBG-DATEM -0.5539 0.0595 0.6729
LBG-Purawave -0.6804 -0.067 0.5464
LBG-xanthan -0.6479 -0.0345 0.5789
LBG-xanthan-DATEM -0.3604 0.2530 0.8664
LBG-xanthan-Purawave -0.4839 0.1295 0.7429
Xanthan -0.7754 -0.1620 0.4514
Xanthan-DATEM -0.3404 0.2730 0.8864
Xanthan-guar -0.6554 -0.0420 0.5714
Xanthan-guar-DATEM -0.3054 0.3080 0.9214
Xanthan-guar-Purawave -0.2429 0.3705 0.9839
Xanthan-Purawave -0.4454 0.1680 0.7814
Gluten-free bread formulations= HPMC subtracted from:
Gluten-free bread formulations Lower Center Upper
HPMC-DATEM -0.3244 0.2890 0.9024
HPMC-Purawave -0.4326 0.1808 0.7942
LBG -0.6559 -0.0425 0.5709
LBG-DATEM -0.3769 0.2365 0.8499
LBG-Purawave -0.5034 0.1100 0.7234
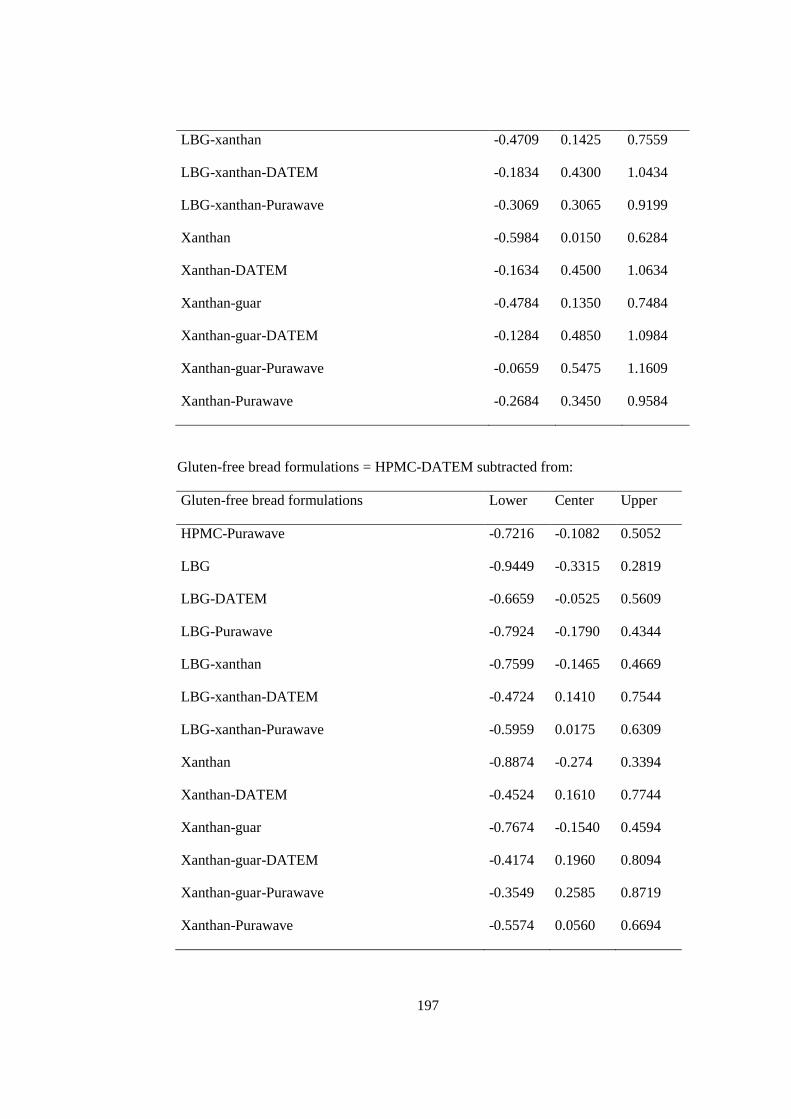
197
LBG-xanthan -0.4709 0.1425 0.7559
LBG-xanthan-DATEM -0.1834 0.4300 1.0434
LBG-xanthan-Purawave -0.3069 0.3065 0.9199
Xanthan -0.5984 0.0150 0.6284
Xanthan-DATEM -0.1634 0.4500 1.0634
Xanthan-guar -0.4784 0.1350 0.7484
Xanthan-guar-DATEM -0.1284 0.4850 1.0984
Xanthan-guar-Purawave -0.0659 0.5475 1.1609
Xanthan-Purawave -0.2684 0.3450 0.9584
Gluten-free bread formulations = HPMC-DATEM subtracted from:
Gluten-free bread formulations Lower Center Upper
HPMC-Purawave -0.7216 -0.1082 0.5052
LBG -0.9449 -0.3315 0.2819
LBG-DATEM -0.6659 -0.0525 0.5609
LBG-Purawave -0.7924 -0.1790 0.4344
LBG-xanthan -0.7599 -0.1465 0.4669
LBG-xanthan-DATEM -0.4724 0.1410 0.7544
LBG-xanthan-Purawave -0.5959 0.0175 0.6309
Xanthan -0.8874 -0.274 0.3394
Xanthan-DATEM -0.4524 0.1610 0.7744
Xanthan-guar -0.7674 -0.1540 0.4594
Xanthan-guar-DATEM -0.4174 0.1960 0.8094
Xanthan-guar-Purawave -0.3549 0.2585 0.8719
Xanthan-Purawave -0.5574 0.0560 0.6694
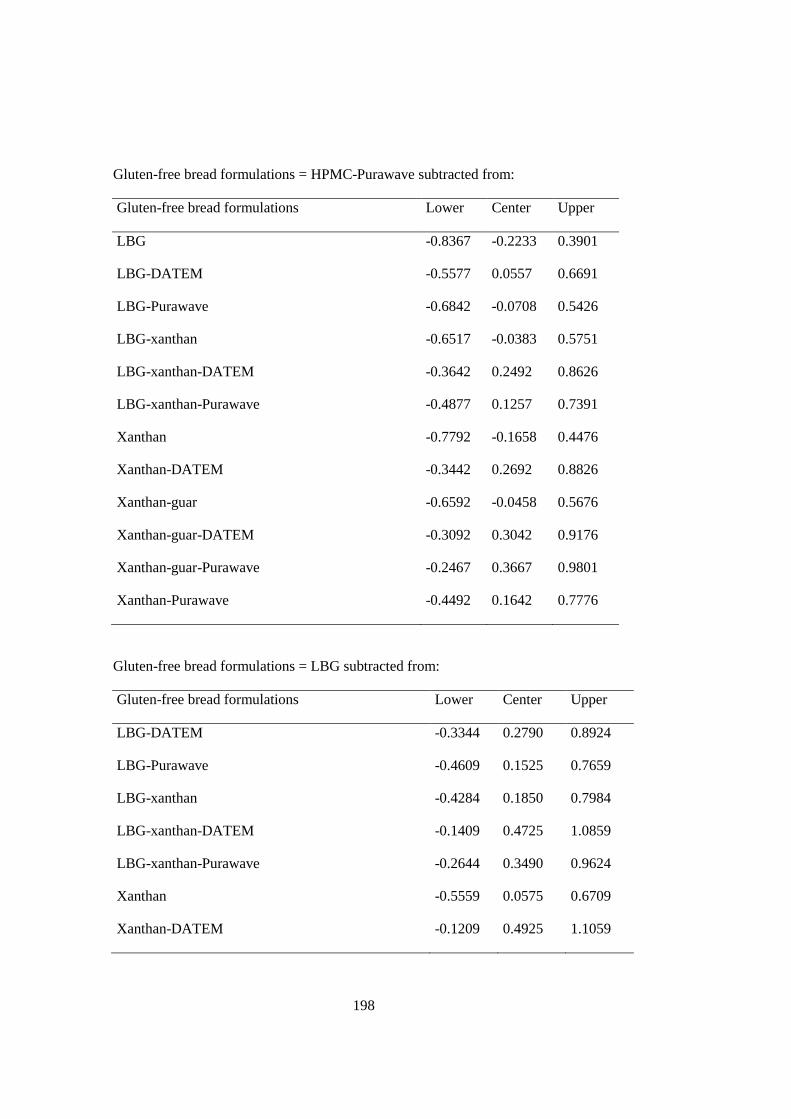
198
Gluten-free bread formulations = HPMC-Purawave subtracted from:
Gluten-free bread formulations Lower Center Upper
LBG -0.8367 -0.2233 0.3901
LBG-DATEM -0.5577 0.0557 0.6691
LBG-Purawave -0.6842 -0.0708 0.5426
LBG-xanthan -0.6517 -0.0383 0.5751
LBG-xanthan-DATEM -0.3642 0.2492 0.8626
LBG-xanthan-Purawave -0.4877 0.1257 0.7391
Xanthan -0.7792 -0.1658 0.4476
Xanthan-DATEM -0.3442 0.2692 0.8826
Xanthan-guar -0.6592 -0.0458 0.5676
Xanthan-guar-DATEM -0.3092 0.3042 0.9176
Xanthan-guar-Purawave -0.2467 0.3667 0.9801
Xanthan-Purawave -0.4492 0.1642 0.7776
Gluten-free bread formulations = LBG subtracted from:
Gluten-free bread formulations Lower Center Upper
LBG-DATEM -0.3344 0.2790 0.8924
LBG-Purawave -0.4609 0.1525 0.7659
LBG-xanthan -0.4284 0.1850 0.7984
LBG-xanthan-DATEM -0.1409 0.4725 1.0859
LBG-xanthan-Purawave -0.2644 0.3490 0.9624
Xanthan -0.5559 0.0575 0.6709
Xanthan-DATEM -0.1209 0.4925 1.1059
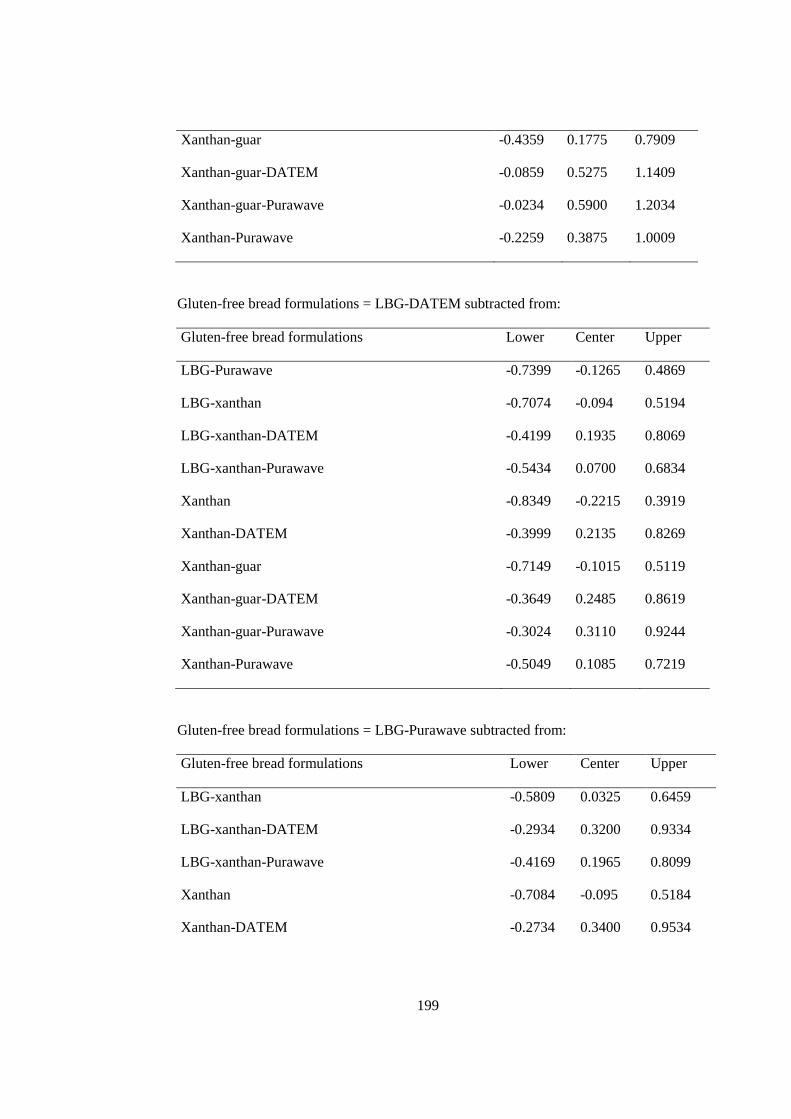
199
Xanthan-guar -0.4359 0.1775 0.7909
Xanthan-guar-DATEM -0.0859 0.5275 1.1409
Xanthan-guar-Purawave -0.0234 0.5900 1.2034
Xanthan-Purawave -0.2259 0.3875 1.0009
Gluten-free bread formulations = LBG-DATEM subtracted from:
Gluten-free bread formulations Lower Center Upper
LBG-Purawave -0.7399 -0.1265 0.4869
LBG-xanthan -0.7074 -0.094 0.5194
LBG-xanthan-DATEM -0.4199 0.1935 0.8069
LBG-xanthan-Purawave -0.5434 0.0700 0.6834
Xanthan -0.8349 -0.2215 0.3919
Xanthan-DATEM -0.3999 0.2135 0.8269
Xanthan-guar -0.7149 -0.1015 0.5119
Xanthan-guar-DATEM -0.3649 0.2485 0.8619
Xanthan-guar-Purawave -0.3024 0.3110 0.9244
Xanthan-Purawave -0.5049 0.1085 0.7219
Gluten-free bread formulations = LBG-Purawave subtracted from:
Gluten-free bread formulations Lower Center Upper
LBG-xanthan -0.5809 0.0325 0.6459
LBG-xanthan-DATEM -0.2934 0.3200 0.9334
LBG-xanthan-Purawave -0.4169 0.1965 0.8099
Xanthan -0.7084 -0.095 0.5184
Xanthan-DATEM -0.2734 0.3400 0.9534
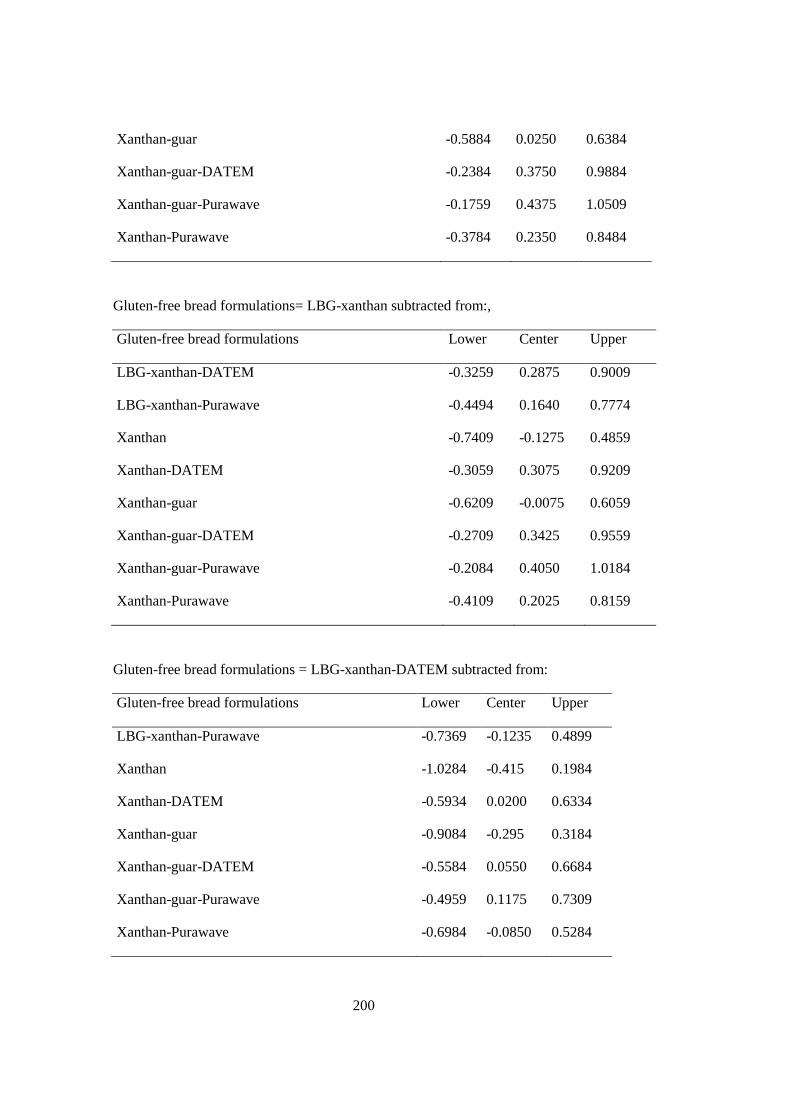
200
Xanthan-guar -0.5884 0.0250 0.6384
Xanthan-guar-DATEM -0.2384 0.3750 0.9884
Xanthan-guar-Purawave -0.1759 0.4375 1.0509
Xanthan-Purawave -0.3784 0.2350 0.8484
Gluten-free bread formulations= LBG-xanthan subtracted from:,
Gluten-free bread formulations Lower Center Upper
LBG-xanthan-DATEM -0.3259 0.2875 0.9009
LBG-xanthan-Purawave -0.4494 0.1640 0.7774
Xanthan -0.7409 -0.1275 0.4859
Xanthan-DATEM -0.3059 0.3075 0.9209
Xanthan-guar -0.6209 -0.0075 0.6059
Xanthan-guar-DATEM -0.2709 0.3425 0.9559
Xanthan-guar-Purawave -0.2084 0.4050 1.0184
Xanthan-Purawave -0.4109 0.2025 0.8159
Gluten-free bread formulations = LBG-xanthan-DATEM subtracted from:
Gluten-free bread formulations Lower Center Upper
LBG-xanthan-Purawave -0.7369 -0.1235 0.4899
Xanthan -1.0284 -0.415 0.1984
Xanthan-DATEM -0.5934 0.0200 0.6334
Xanthan-guar -0.9084 -0.295 0.3184
Xanthan-guar-DATEM -0.5584 0.0550 0.6684
Xanthan-guar-Purawave -0.4959 0.1175 0.7309
Xanthan-Purawave -0.6984 -0.0850 0.5284
201
Gluten-free bread formulations= LBG-xanthan-Purawave subtracted from:
Gluten-free bread formulations Lower Center Upper
Xanthan -0.9049 -0.2915 0.3219
Xanthan-DATEM -0.4699 0.1435 0.7569
Xanthan-guar -0.7849 -0.1715 0.4419
Xanthan-guar-DATEM -0.4349 0.1785 0.7919
Xanthan-guar-Purawave -0.3724 0.2410 0.8544
Xanthan-Purawave -0.5749 0.0385 0.6519
Gluten-free bread formulations= Xanthan subtracted from:
Gluten-free bread formulations Lower Center Upper
Xanthan-DATEM -0.1784 0.435 1.0484
Xanthan-guar -0.4934 0.1200 0.7334
Xanthan-guar-DATEM -0.1434 0.4700 1.0834
Xanthan-guar-Purawave -0.0809 0.5325 1.1459
Xanthan-Purawave -0.2834 0.3300 0.9434
Gluten-free bread formulations = Xanthan-DATEM subtracted from:
Gluten-free bread formulations Lower Center Upper
Xanthan-guar -0.9284 -0.3150 0.2984
Xanthan-guar-DATEM -0.5784 0.0350 0.6484
Xanthan-guar-Purawave -0.5159 0.0975 0.7109
Xanthan-Purawave -0.7184 -0.1050 0.5084
202
Gluten-free bread formulations= Xanthan-guar subtracted from:
Gluten-free bread formulations Lower Center Upper
Xanthan-guar-DATEM -0.2634 0.3500 0.9634
Xanthan-guar-Purawave -0.2009 0.4125 1.0259
Xanthan-Purawave -0.4034 0.2100 0.8234
Gluten-free bread formulations= Xanthan-guar-DATEM subtracted from:
Gluten-free bread formulations Lower Center Upper
Xanthan-guar-Purawave -0.5509 0.0625 0.6759
Xanthan-Purawave -0.7534 -0.1400 0.4734
Gluten-free bread formulations= Xanthan-guar-Purawave subtracted from:
Gluten-free bread formulations Lower Center Upper
Xanthan-Purawave -0.8159 -0.2025 0.4109
Table A. 9. One-way ANOVA for sensory analysis of gluten-free bread formulations
containing different gum types and emulsifier blend.
Factor Levels Values
Gluten-free bread
formulations 5
Control 1(rice), guar-DATEM, xanthan-
DATEM, xanthan-guar-DATEM, xanthan-
LBG-DATEM
203
Flavour versus gluten-free bread formualations
Source DF SS MS F P
Gluten-free
bread
formulations 4 3.520 0.880 2.40 0.064
Error 45 16.500 0.367
Total 49 20.020
Level N Mean StDev
Control 1 (rice) 10 3.5000 0.7071
Guar 10 3.6000 0.6992
Xanthan-DATEM 10 4.0000 0.4714
Xanthan-guar-DATEM 10 4.0000 0.4714
Xanthan-LBG-DATEM 10 4.2000 0.6325
Flavour versus texture
Source DF SS MS F P
Texture 3 1.415 0.472 1.17 0.333
Error 46 18.605 0.404
Total 49 20.020
Level N Mean StDev
2 10 3.8000 0.7888
3 19 3.6842 0.5824
204
4 11 4.0000 0.7746
5 10 4.1000 0.3162
Texture versus gluten-free bread formualations
Source DF SS MS F P
Gluten-free
bread
formulations 4 42.080 10.520 46.87 0.000
Error 45 10.100 0.224
Total 49 52.180
Flavour versus gluten-free bread formualations
Source DF SS MS F P
Gluten-free
bread
formulations 4 3.520 0.880 2.40 0.064
Error 45 16.500 0.367
Total 49 20.020
Level N Mean StDev
Control 1 (rice) 10 3.5000 0.7071
Guar 10 3.6000 0.6992
Xanthan-DATEM 10 4.0000 0.4714
Xanthan-guar-DATEM 10 4.0000 0.4714
Xanthan-LBG-DATEM 10 4.2000 0.6325

205
Table A. 10. One-way ANOVA for specific volume of gluten-free bread
formulations containing different chestnut flour content (%) and gum types-DATEM
mixture
Source DF SS MS F P
Gluten-free bread
formulations 14 1.81448 0.12961 50.75 0.000
Error 15 0.03830 0.00255
Total 29 1.85278
Factor
Levels
Values
Gluten-free bread formulations
15
0%, 10%, 10% CF-X-G-D, 10%
CF-X-LBG-D, 100%, 20%, 20%
CF-X-G-D, 20% CF-X-LBG-D,
30%, 30% CF-X-G-D, 30% CF-
X-LBG-D, 40%, 40% CF-X-G-
D, 40% CF-X-LBG-D, 50%
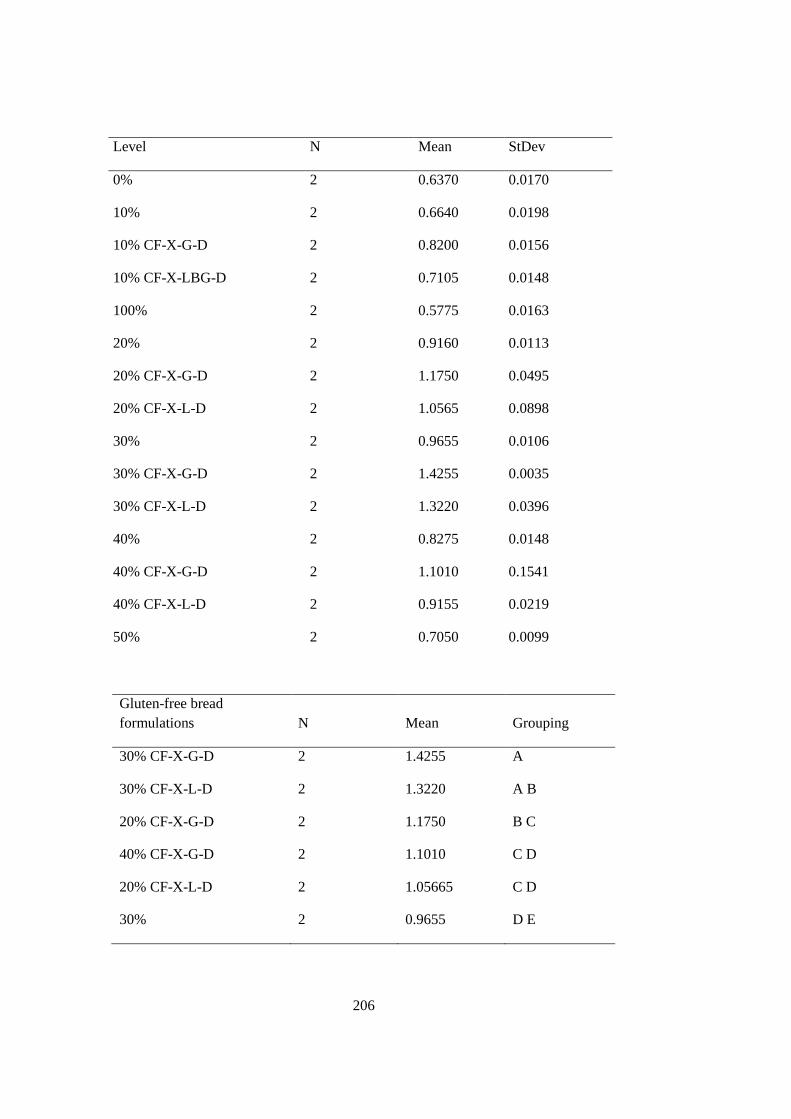
206
Gluten-free bread
formulations N Mean Grouping
30% CF-X-G-D 2 1.4255 A
30% CF-X-L-D 2 1.3220 A B
20% CF-X-G-D 2 1.1750 B C
40% CF-X-G-D 2 1.1010 C D
20% CF-X-L-D 2 1.05665 C D
30% 2 0.9655 D E
Level N Mean StDev
0% 2 0.6370 0.0170
10% 2 0.6640 0.0198
10% CF-X-G-D 2 0.8200 0.0156
10% CF-X-LBG-D 2 0.7105 0.0148
100% 2 0.5775 0.0163
20% 2 0.9160 0.0113
20% CF-X-G-D 2 1.1750 0.0495
20% CF-X-L-D 2 1.0565 0.0898
30% 2 0.9655 0.0106
30% CF-X-G-D 2 1.4255 0.0035
30% CF-X-L-D 2 1.3220 0.0396
40% 2 0.8275 0.0148
40% CF-X-G-D 2 1.1010 0.1541
40% CF-X-L-D 2 0.9155 0.0219
50% 2 0.7050 0.0099
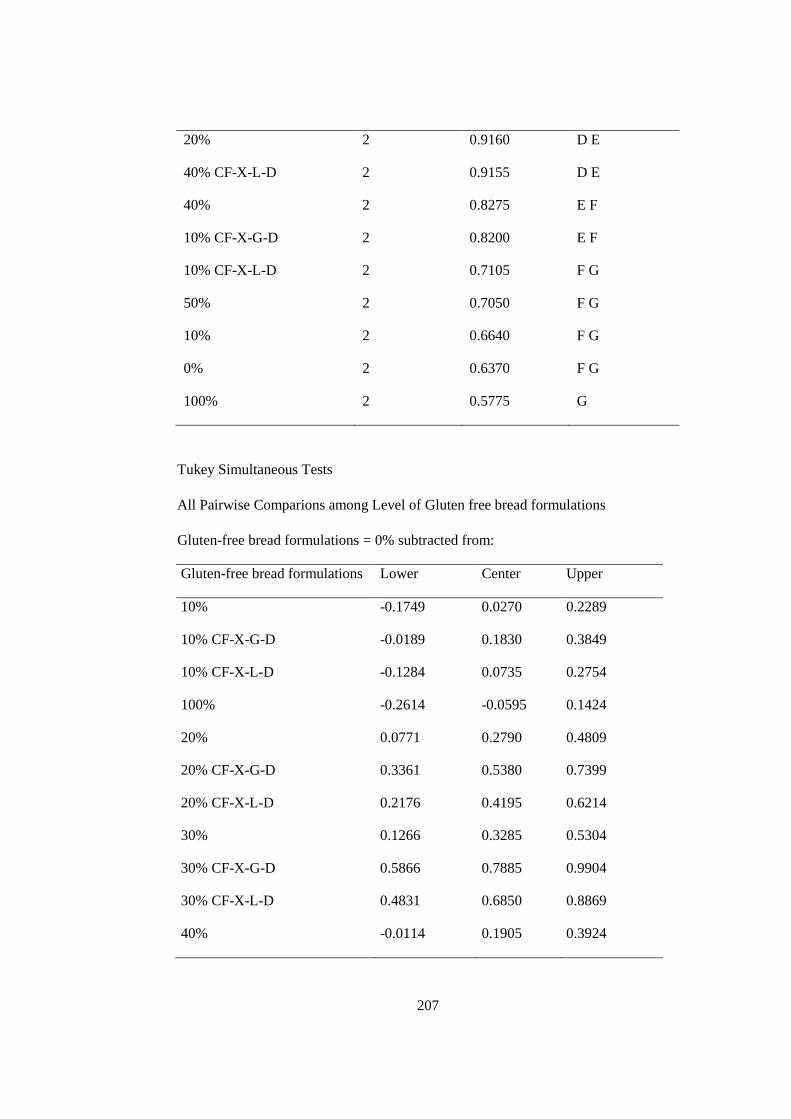
207
20% 2 0.9160 D E
40% CF-X-L-D 2 0.9155 D E
40% 2 0.8275 E F
10% CF-X-G-D 2 0.8200 E F
10% CF-X-L-D 2 0.7105 F G
50% 2 0.7050 F G
10% 2 0.6640 F G
0% 2 0.6370 F G
100% 2 0.5775 G
Tukey Simultaneous Tests
All Pairwise Comparions among Level of Gluten free bread formulations
Gluten-free bread formulations = 0% subtracted from:
Gluten-free bread formulations Lower Center Upper
10% -0.1749 0.0270 0.2289
10% CF-X-G-D -0.0189 0.1830 0.3849
10% CF-X-L-D -0.1284 0.0735 0.2754
100% -0.2614 -0.0595 0.1424
20% 0.0771 0.2790 0.4809
20% CF-X-G-D 0.3361 0.5380 0.7399
20% CF-X-L-D 0.2176 0.4195 0.6214
30% 0.1266 0.3285 0.5304
30% CF-X-G-D 0.5866 0.7885 0.9904
30% CF-X-L-D 0.4831 0.6850 0.8869
40% -0.0114 0.1905 0.3924
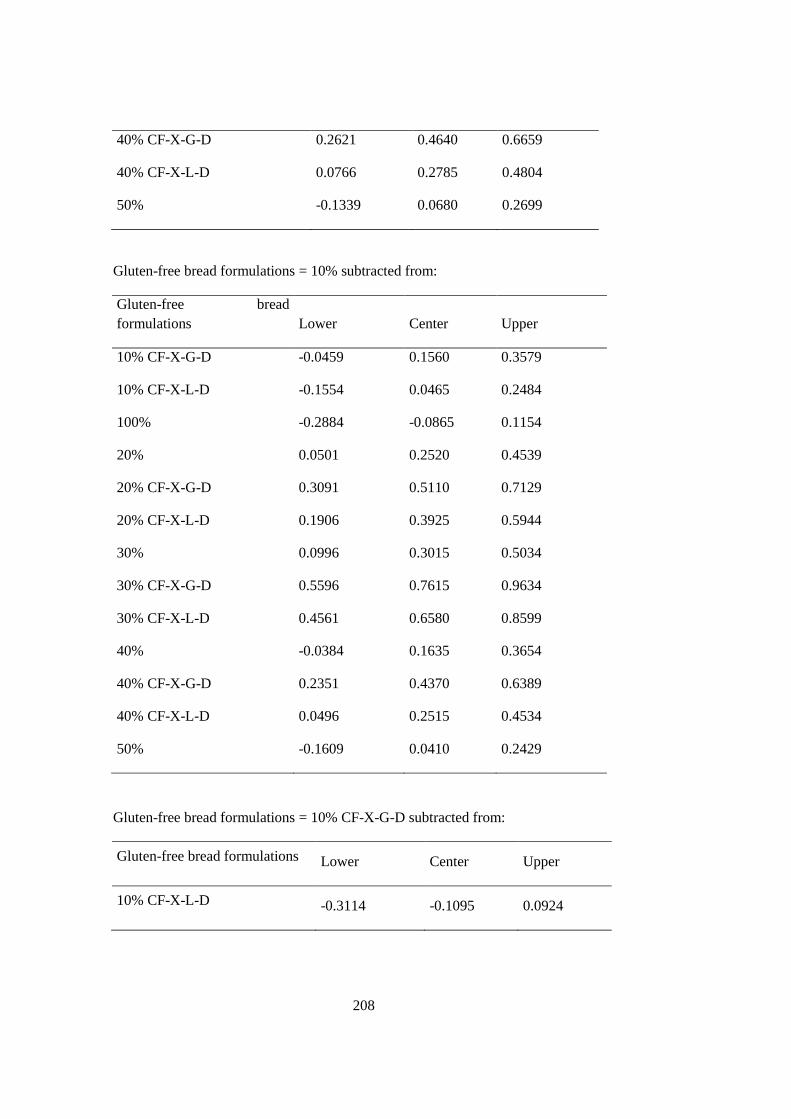
208
40% CF-X-G-D 0.2621 0.4640 0.6659
40% CF-X-L-D 0.0766 0.2785 0.4804
50% -0.1339 0.0680 0.2699
Gluten-free bread formulations = 10% subtracted from:
Gluten-free bread
formulations Lower Center Upper
10% CF-X-G-D -0.0459 0.1560 0.3579
10% CF-X-L-D -0.1554 0.0465 0.2484
100% -0.2884 -0.0865 0.1154
20% 0.0501 0.2520 0.4539
20% CF-X-G-D 0.3091 0.5110 0.7129
20% CF-X-L-D 0.1906 0.3925 0.5944
30% 0.0996 0.3015 0.5034
30% CF-X-G-D 0.5596 0.7615 0.9634
30% CF-X-L-D 0.4561 0.6580 0.8599
40% -0.0384 0.1635 0.3654
40% CF-X-G-D 0.2351 0.4370 0.6389
40% CF-X-L-D 0.0496 0.2515 0.4534
50% -0.1609 0.0410 0.2429
Gluten-free bread formulations = 10% CF-X-G-D subtracted from:
Gluten-free bread formulations Lower Center Upper
10% CF-X-L-D -0.3114 -0.1095 0.0924
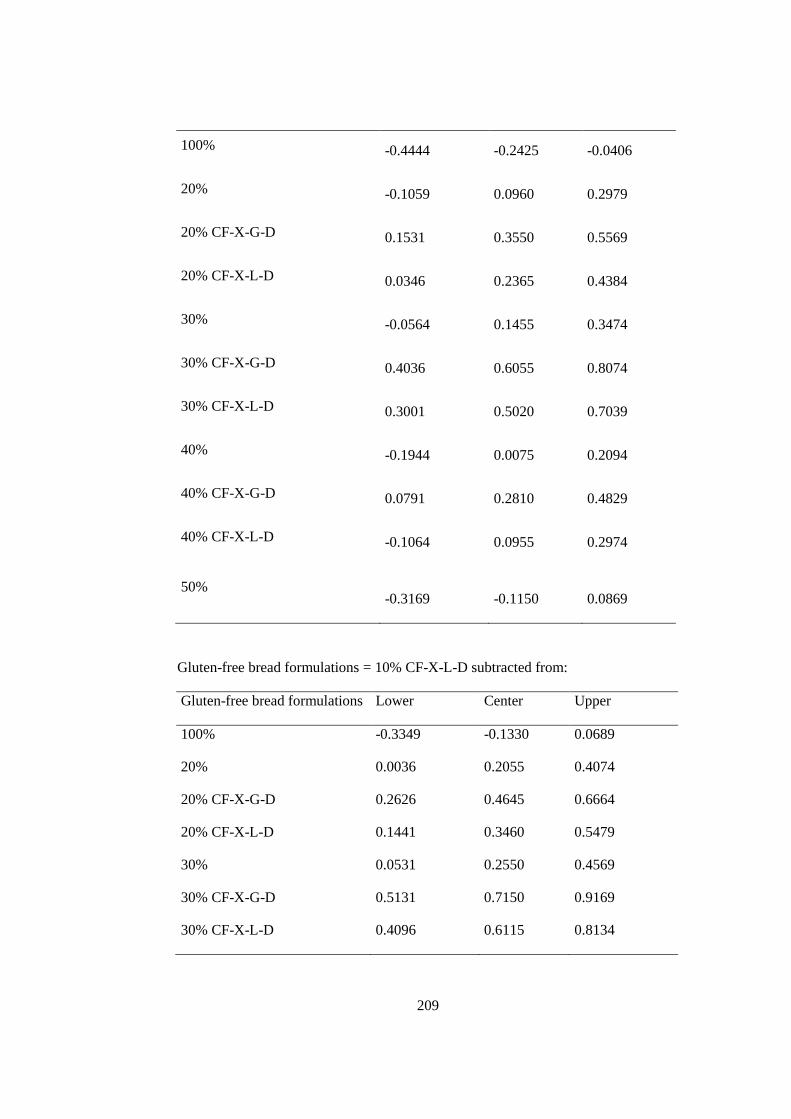
209
100% -0.4444 -0.2425 -0.0406
20% -0.1059 0.0960 0.2979
20% CF-X-G-D 0.1531 0.3550 0.5569
20% CF-X-L-D 0.0346 0.2365 0.4384
30% -0.0564 0.1455 0.3474
30% CF-X-G-D 0.4036 0.6055 0.8074
30% CF-X-L-D 0.3001 0.5020 0.7039
40% -0.1944 0.0075 0.2094
40% CF-X-G-D 0.0791 0.2810 0.4829
40% CF-X-L-D -0.1064 0.0955 0.2974
50% -0.3169 -0.1150 0.0869
Gluten-free bread formulations = 10% CF-X-L-D subtracted from:
Gluten-free bread formulations Lower Center Upper
100% -0.3349 -0.1330 0.0689
20% 0.0036 0.2055 0.4074
20% CF-X-G-D 0.2626 0.4645 0.6664
20% CF-X-L-D 0.1441 0.3460 0.5479
30% 0.0531 0.2550 0.4569
30% CF-X-G-D 0.5131 0.7150 0.9169
30% CF-X-L-D 0.4096 0.6115 0.8134
210
40% -0.0849 0.1170 0.3189
40% CF-X-G-D 0.1886 0.3905 0.5924
40% CF-X-L-D 0.0031 0.2050 0.4069
50% -0.2074 -0.0055 0.1964
Gluten-free bread formulations = 100% subtracted from:
Gluten-free bread
formulations Lower Center Upper
20% 0.1366 0.3385 0.5404
20% CF-X-G-D 0.3956 0.5975 0.7994
20% CF-X-L-D 0.2771 0.4790 0.6809
30% 0.1861 0.3880 0.5899
30% CF-X-G-D 0.6461 0.8480 10.499
30% CF-X-L-D 0.5426 0.7445 0.9464
40% 0.0481 0.2500 0.4519
40% CF-X-G-D 0.3216 0.5235 0.7254
40% CF-X-L-D 0.1361 0.3380 0.5399
50% -0.0744 0.1275 0.3294
Gluten-free bread formulations = 20% subtracted from:
Gluten-free bread
formulations Lower Center Upper
20% CF-X-G-D 0.0571 0.2590 0.4609
20% CF-X-L-D -0.0614 0.1405 0.3424
30% -0.1524 0.0495 0.2514
30% CF-X-G-D 0.3076 0.5095 0.7114
211
30% CF-X-L-D 0.2041 0.4060 0.6079
40% -0.2904 -0.0885 0.1134
40% CF-X-G-D -0.0169 0.1850 0.3869
40% CF-X-L-D -0.2024 -0.0005 0.2014
50% -0.4129 -0.2110 -0.0091
Gluten-free bread formulations = 20% CF-X-G-D subtracted from:
Gluten-free bread
formulations Lower Center Upper
20% CF-X-L-D -0.3204 -0.1185 0.0834
30% -0.4114 -0.2095 -0.0076
30% CF-X-G-D 0.0486 0.2505 0.4524
30% CF-X-L-D -0.0549 0.1470 0.3489
40% -0.5494 -0.3475 -0.1456
40% CF-X-G-D -0.2759 -0.0740 0.1279
40% CF-X-L-D -0.4614 -0.2595 -0.0576
50% -0.6719 -0.4700 -0.2681
Gluten-free bread formulations = 20% CF-X-L-D subtracted from:
Gluten-free bread
formulations Lower Center Upper
30% -0.2929 -0.0910 0.1109
30% CF-X-G-D 0.1671 0.3690 0.5709
30% CF-X-L-D 0.0636 0.2655 0.4674
40% -0.4309 -0.2290 -0.0271
40% CF-X-G-D -0.1574 0.0445 0.2464
212
40% CF-X-L-D -0.3429 -0.1410 0.0609
50% -0.5534 -0.3515 -0.1496
Gluten-free bread formulations = 30% subtracted from:
Gluten-free bread
formulations Lower Center Upper
30% CF-X-G-D 0.2581 0.4600 0.6619
30% CF-X-L-D 0.1546 0.3565 0.5584
40% -0.3399 -0.1380 0.0639
40% CF-X-G-D -0.0664 0.1355 0.3374
40% CF-X-L-D -0.2519 -0.0500 0.1519
50% -0.4624 -0.2605 -0.0586
Gluten-free bread formulations = 30% CF-X-G-D subtracted from:
Gluten-free bread
formulations Lower Center Upper
30% CF-X-L-D -0.3054 -0.1035 0.0984
40% -0.7999 -0.5980 -0.3961
40% CF-X-G-D -0.5264 -0.3245 -0.1226
40% CF-X-L-D -0.7119 -0.5100 -0.3081
50% -0.9224 -0.7205 -0.5186
Gluten-free bread formulations = 30% CF-X-L-D subtracted from:
Gluten-free bread
formulations Lower Center Upper
40% -0.6964 -0.4945 -0.2926
213
40% CF-X-G-D -0.4229 -0.2210 -0.0191
40% CF-X-L-D -0.6084 -0.4065 -0.2046
50% -0.8189 -0.6170 -0.4151
Gluten-free bread formulations = 40% subtracted from:
Gluten-free bread
formulations Lower Center Upper
40% CF-X-G-D 0.0716 0.2735 0.4754
40% CF-X-L-D -0.1139 0.0880 0.2899
50% -0.3244 -0.1225 0.0794
Gluten-free bread formulations = 40% CF-X-G-D subtracted from:
Gluten-free bread
formulations Lower Center Upper
40% CF-X-L-D -0.3874 -0.1855 0.0164
50% -0.5979 -0.3960 -0.1941
Gluten-free bread formulations = 40% CF-X-L-D subtracted from:
Gluten-free bread
formulations Lower Center Upper
50% -0.4124 -0.2105 -0.0086
Table A. 11. Two-way ANOVA for specific volume of gluten-free bread
formulations containing different chestnut:rice flour ratio and gum types-DATEM
mixture
Source DF SS MS F P
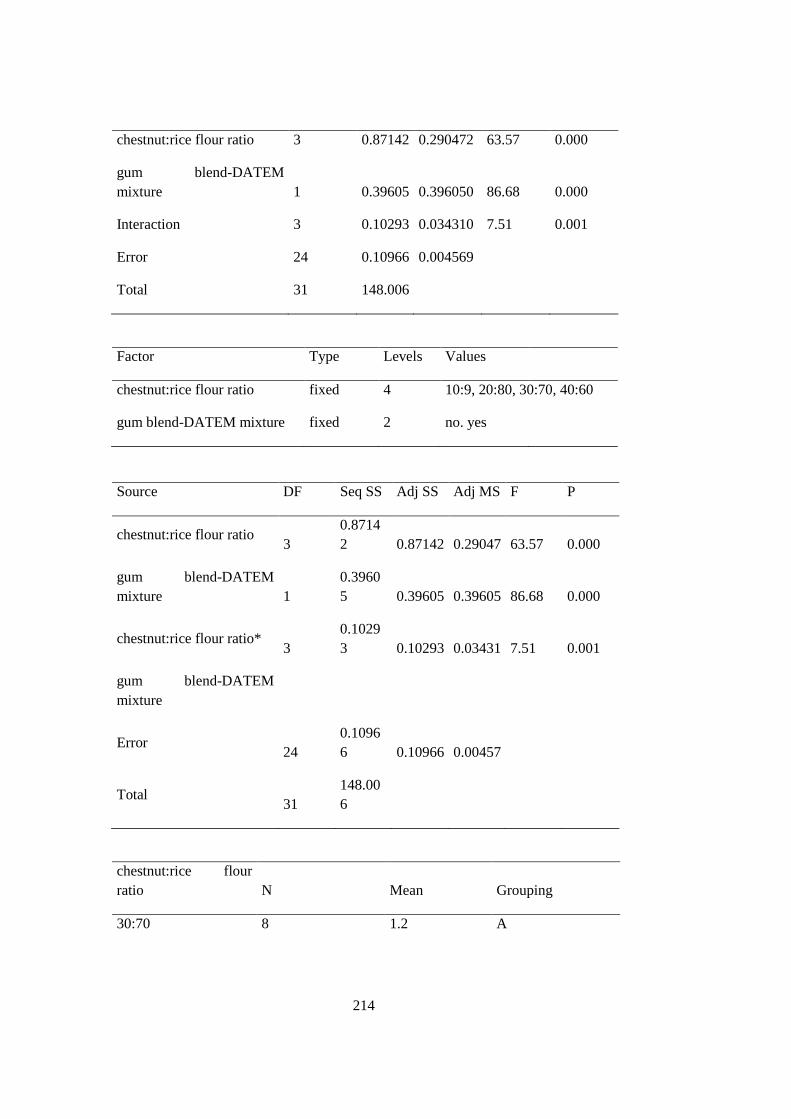
214
chestnut:rice flour ratio 3 0.87142 0.290472 63.57 0.000
gum blend-DATEM
mixture 1 0.39605 0.396050 86.68 0.000
Interaction 3 0.10293 0.034310 7.51 0.001
Error 24 0.10966 0.004569
Total 31 148.006
Factor Type Levels Values
chestnut:rice flour ratio fixed 4 10:9, 20:80, 30:70, 40:60
gum blend-DATEM mixture fixed 2 no. yes
Source DF Seq SS Adj SS Adj MS F P
chestnut:rice flour ratio 3
0.8714
2 0.87142 0.29047 63.57 0.000
gum blend-DATEM
mixture 1
0.3960
5 0.39605 0.39605 86.68 0.000
chestnut:rice flour ratio* 3
0.1029
3 0.10293 0.03431 7.51 0.001
gum blend-DATEM
mixture
Error
24
0.1096
6 0.10966 0.00457
Total
31
148.00
6
chestnut:rice flour
ratio N Mean Grouping
30:70 8 1.2 A
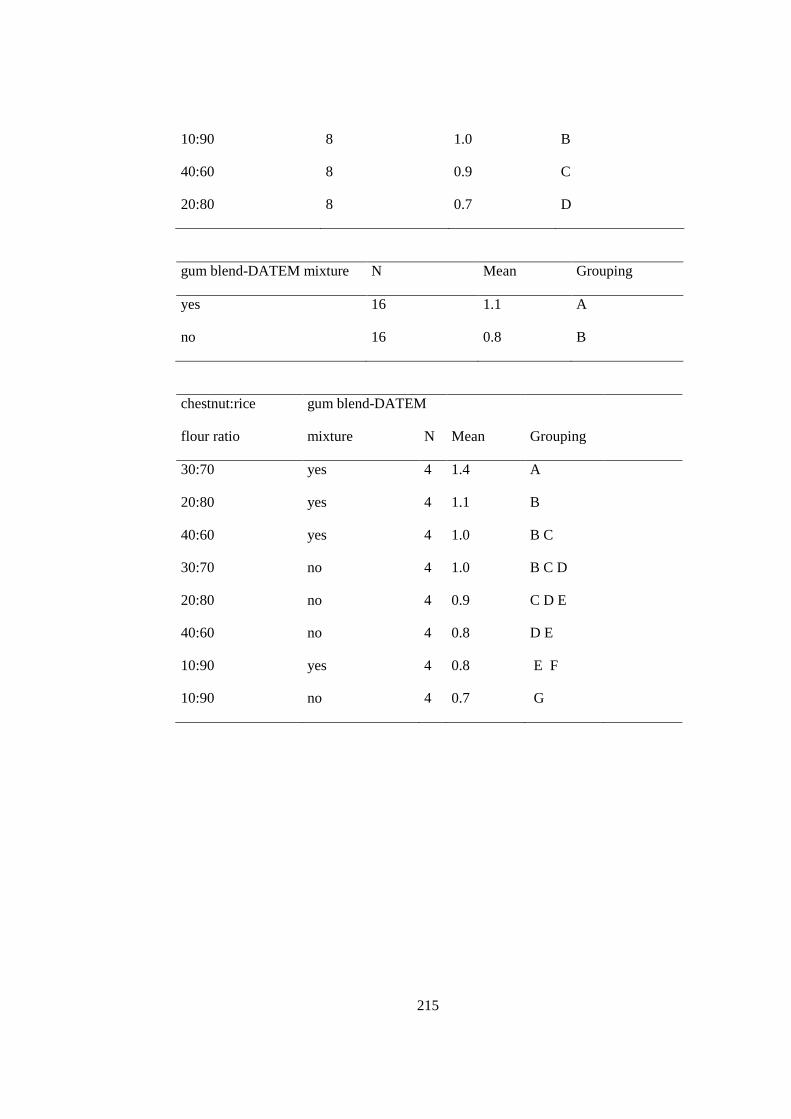
215
10:90 8 1.0 B
40:60 8 0.9 C
20:80 8 0.7 D
gum blend-DATEM mixture N Mean Grouping
yes 16 1.1 A
no 16 0.8 B
chestnut:rice gum blend-DATEM
flour ratio mixture N Mean Grouping
30:70 yes 4 1.4 A
20:80 yes 4 1.1 B
40:60 yes 4 1.0 B C
30:70 no 4 1.0 B C D
20:80 no 4 0.9 C D E
40:60 no 4 0.8 D E
10:90 yes 4 0.8 E F
10:90 no 4 0.7 G

216
Table A. 12. One-way ANOVA for firmness of gluten-free bread formulations
containing different chestnut flour content (%) and gum types-DATEM mixture
Source DF SS MS F P
Gluten-free bread
formulations 14 25.32966 1.80926 342.93 0.000
Error 15 0.07914 0.00528
Total 29 25.40880
Tukey Simultaneous Tests
All Pairwise Comparions among Level of Gluten free bread formulations
Gluten-free bread formulations = 0% subtracted from:
Level N Mean StDev
0% 2 3.1080 0.1442
10% 2 2.7600 0.0849
10% CF-X-G-D 2 1.7100 0.1414
10% CF-X-L-D 2 2.0250 0.1061
100% 2 3.4450 0.0919
20% 2 1.1250 0.0354
20% CF-X-G-D 2 0.6950 0.0212
Factor
Levels
Values
Gluten-free bread formulations
15
0%, 10%, 10% CF-X-G-D, 10%
CF-X-LBG-D, 100%, 20%, 20%
CF-X-G-D, 20% CF-X-LBG-D,
30%, 30% CF-X-G-D, 30% CF-
X-LBG-D, 40%, 40% CF-X-G-
D, 40% CF-X-LBG-D, 50%
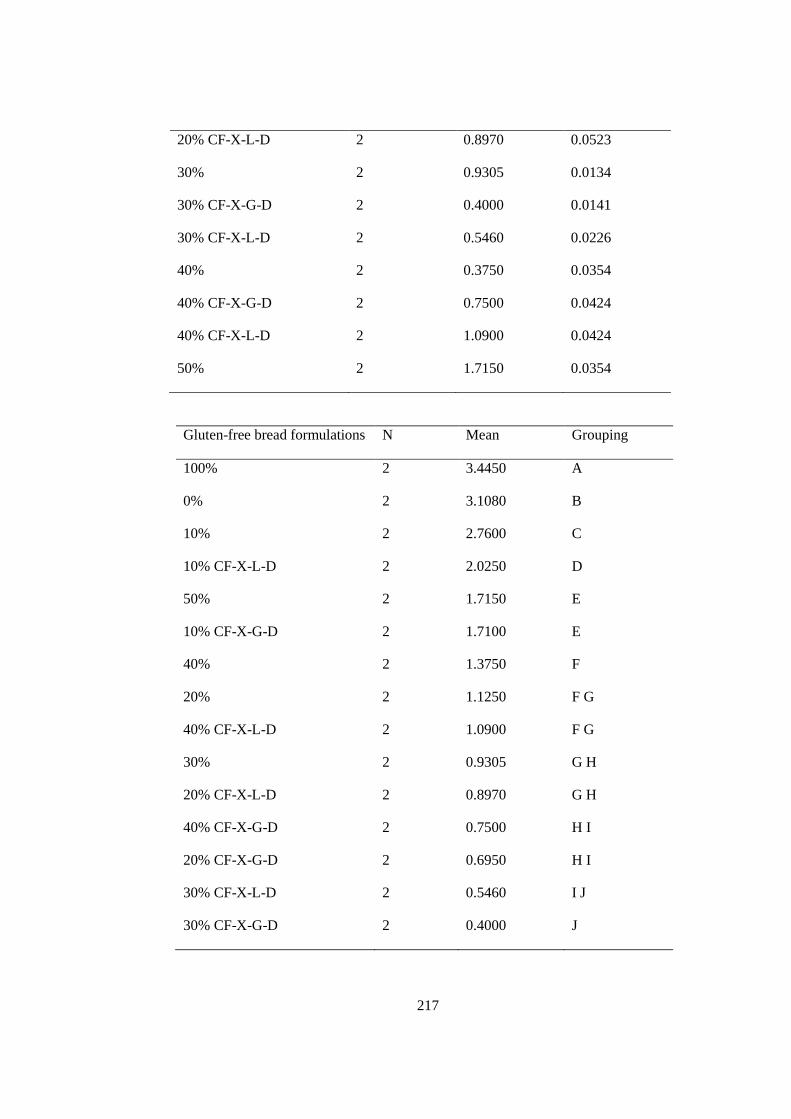
217
20% CF-X-L-D 2 0.8970 0.0523
30% 2 0.9305 0.0134
30% CF-X-G-D 2 0.4000 0.0141
30% CF-X-L-D 2 0.5460 0.0226
40% 2 0.3750 0.0354
40% CF-X-G-D 2 0.7500 0.0424
40% CF-X-L-D 2 1.0900 0.0424
50% 2 1.7150 0.0354
Gluten-free bread formulations N Mean Grouping
100% 2 3.4450 A
0% 2 3.1080 B
10% 2 2.7600 C
10% CF-X-L-D 2 2.0250 D
50% 2 1.7150 E
10% CF-X-G-D 2 1.7100 E
40% 2 1.3750 F
20% 2 1.1250 F G
40% CF-X-L-D 2 1.0900 F G
30% 2 0.9305 G H
20% CF-X-L-D 2 0.8970 G H
40% CF-X-G-D 2 0.7500 H I
20% CF-X-G-D 2 0.6950 H I
30% CF-X-L-D 2 0.5460 I J
30% CF-X-G-D 2 0.4000 J
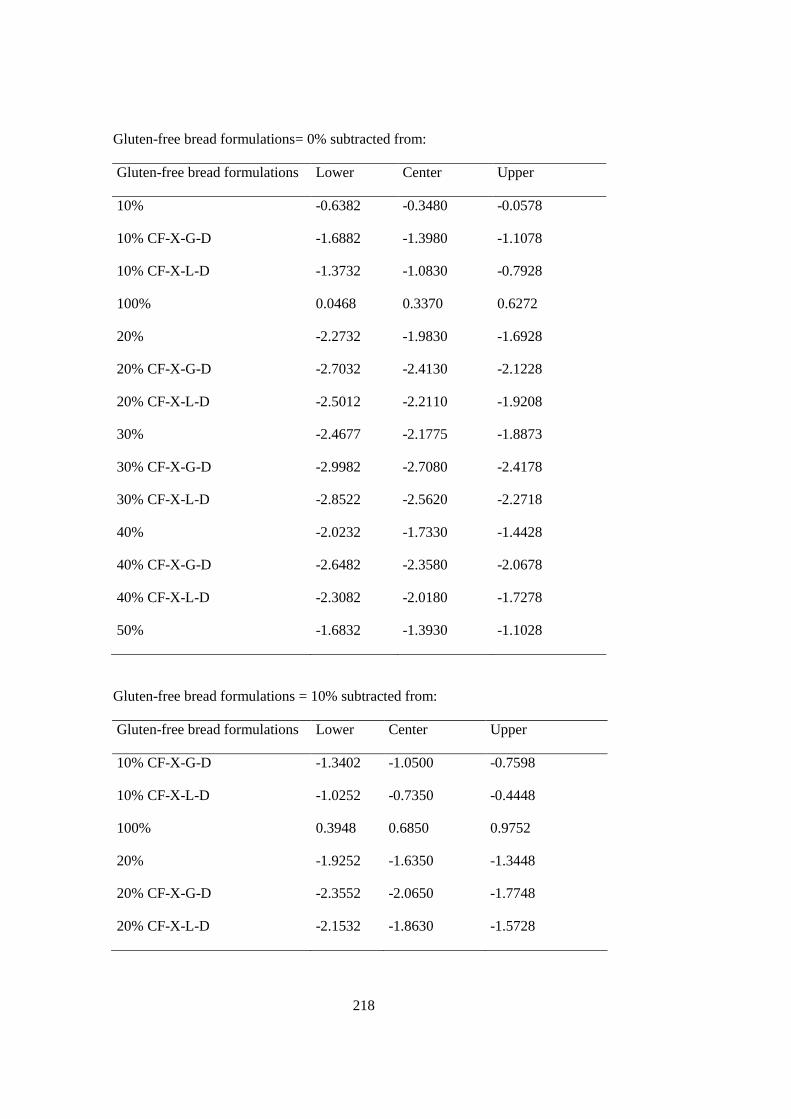
218
Gluten-free bread formulations= 0% subtracted from:
Gluten-free bread formulations Lower Center Upper
10% -0.6382 -0.3480 -0.0578
10% CF-X-G-D -1.6882 -1.3980 -1.1078
10% CF-X-L-D -1.3732 -1.0830 -0.7928
100% 0.0468 0.3370 0.6272
20% -2.2732 -1.9830 -1.6928
20% CF-X-G-D -2.7032 -2.4130 -2.1228
20% CF-X-L-D -2.5012 -2.2110 -1.9208
30% -2.4677 -2.1775 -1.8873
30% CF-X-G-D -2.9982 -2.7080 -2.4178
30% CF-X-L-D -2.8522 -2.5620 -2.2718
40% -2.0232 -1.7330 -1.4428
40% CF-X-G-D -2.6482 -2.3580 -2.0678
40% CF-X-L-D -2.3082 -2.0180 -1.7278
50% -1.6832 -1.3930 -1.1028
Gluten-free bread formulations = 10% subtracted from:
Gluten-free bread formulations Lower Center Upper
10% CF-X-G-D -1.3402 -1.0500 -0.7598
10% CF-X-L-D -1.0252 -0.7350 -0.4448
100% 0.3948 0.6850 0.9752
20% -1.9252 -1.6350 -1.3448
20% CF-X-G-D -2.3552 -2.0650 -1.7748
20% CF-X-L-D -2.1532 -1.8630 -1.5728
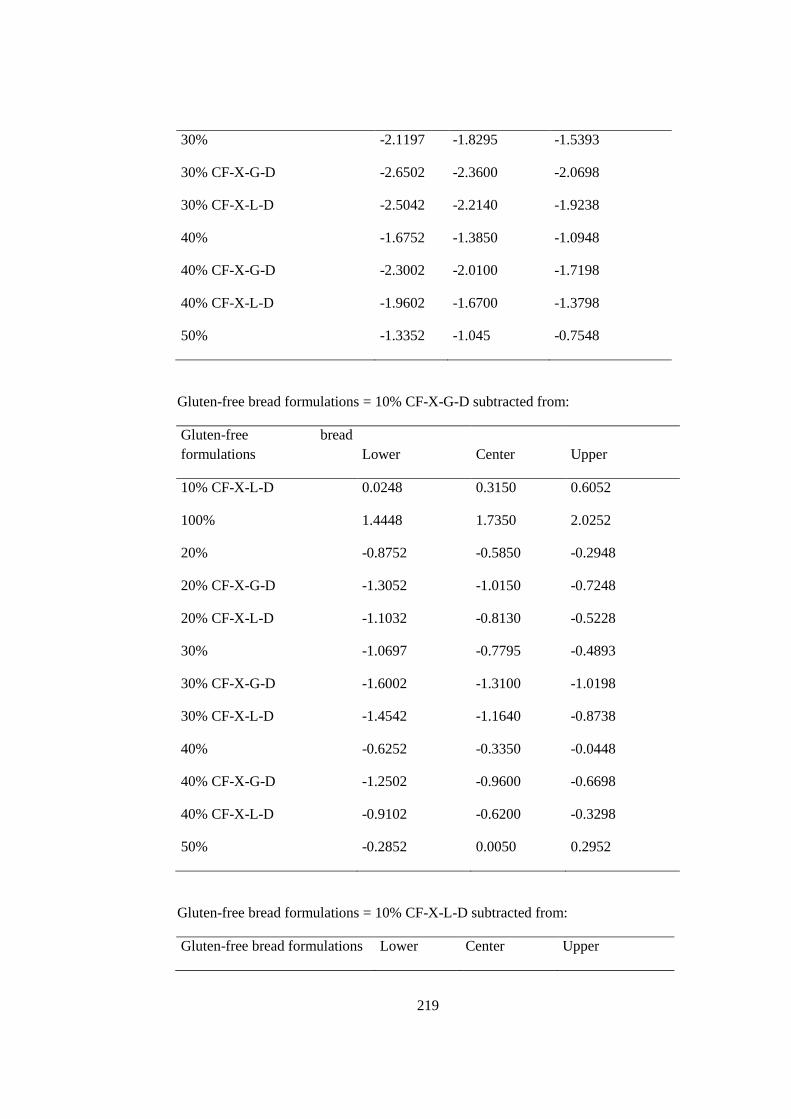
219
30% -2.1197 -1.8295 -1.5393
30% CF-X-G-D -2.6502 -2.3600 -2.0698
30% CF-X-L-D -2.5042 -2.2140 -1.9238
40% -1.6752 -1.3850 -1.0948
40% CF-X-G-D -2.3002 -2.0100 -1.7198
40% CF-X-L-D -1.9602 -1.6700 -1.3798
50% -1.3352 -1.045 -0.7548
Gluten-free bread formulations = 10% CF-X-G-D subtracted from:
Gluten-free bread
formulations Lower Center Upper
10% CF-X-L-D 0.0248 0.3150 0.6052
100% 1.4448 1.7350 2.0252
20% -0.8752 -0.5850 -0.2948
20% CF-X-G-D -1.3052 -1.0150 -0.7248
20% CF-X-L-D -1.1032 -0.8130 -0.5228
30% -1.0697 -0.7795 -0.4893
30% CF-X-G-D -1.6002 -1.3100 -1.0198
30% CF-X-L-D -1.4542 -1.1640 -0.8738
40% -0.6252 -0.3350 -0.0448
40% CF-X-G-D -1.2502 -0.9600 -0.6698
40% CF-X-L-D -0.9102 -0.6200 -0.3298
50% -0.2852 0.0050 0.2952
Gluten-free bread formulations = 10% CF-X-L-D subtracted from:
Gluten-free bread formulations Lower Center Upper
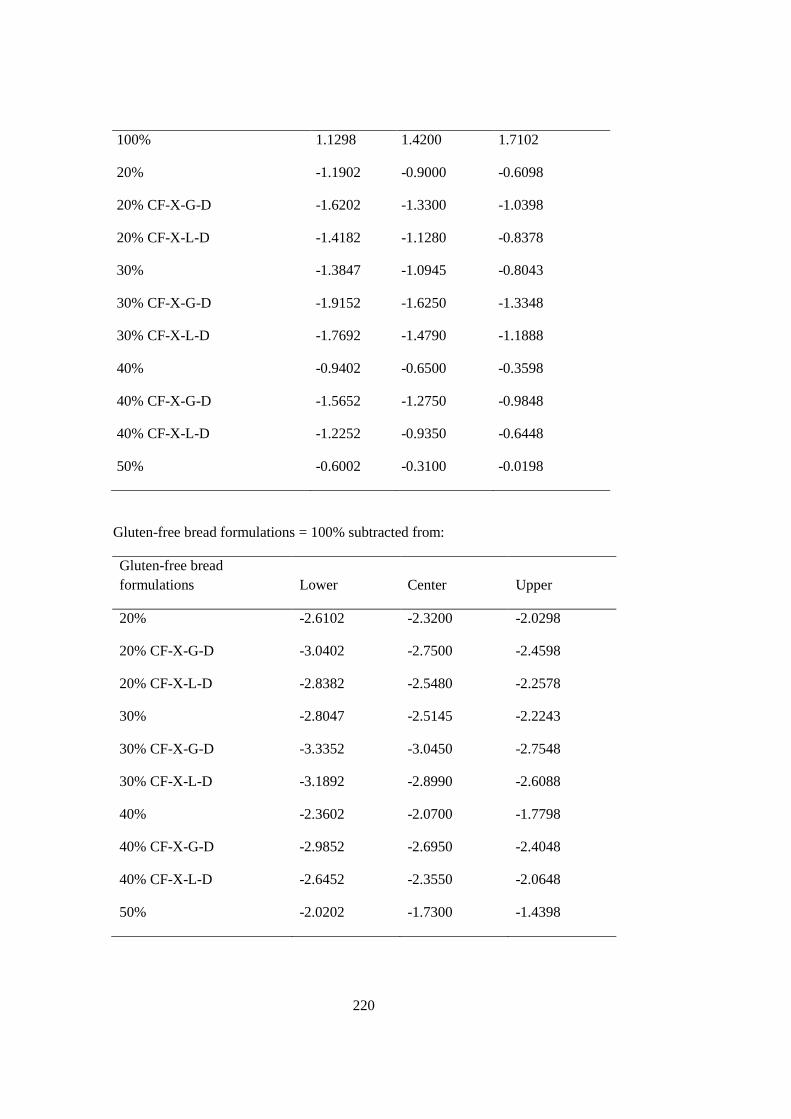
220
100% 1.1298 1.4200 1.7102
20% -1.1902 -0.9000 -0.6098
20% CF-X-G-D -1.6202 -1.3300 -1.0398
20% CF-X-L-D -1.4182 -1.1280 -0.8378
30% -1.3847 -1.0945 -0.8043
30% CF-X-G-D -1.9152 -1.6250 -1.3348
30% CF-X-L-D -1.7692 -1.4790 -1.1888
40% -0.9402 -0.6500 -0.3598
40% CF-X-G-D -1.5652 -1.2750 -0.9848
40% CF-X-L-D -1.2252 -0.9350 -0.6448
50% -0.6002 -0.3100 -0.0198
Gluten-free bread formulations = 100% subtracted from:
Gluten-free bread
formulations Lower Center Upper
20% -2.6102 -2.3200 -2.0298
20% CF-X-G-D -3.0402 -2.7500 -2.4598
20% CF-X-L-D -2.8382 -2.5480 -2.2578
30% -2.8047 -2.5145 -2.2243
30% CF-X-G-D -3.3352 -3.0450 -2.7548
30% CF-X-L-D -3.1892 -2.8990 -2.6088
40% -2.3602 -2.0700 -1.7798
40% CF-X-G-D -2.9852 -2.6950 -2.4048
40% CF-X-L-D -2.6452 -2.3550 -2.0648
50% -2.0202 -1.7300 -1.4398
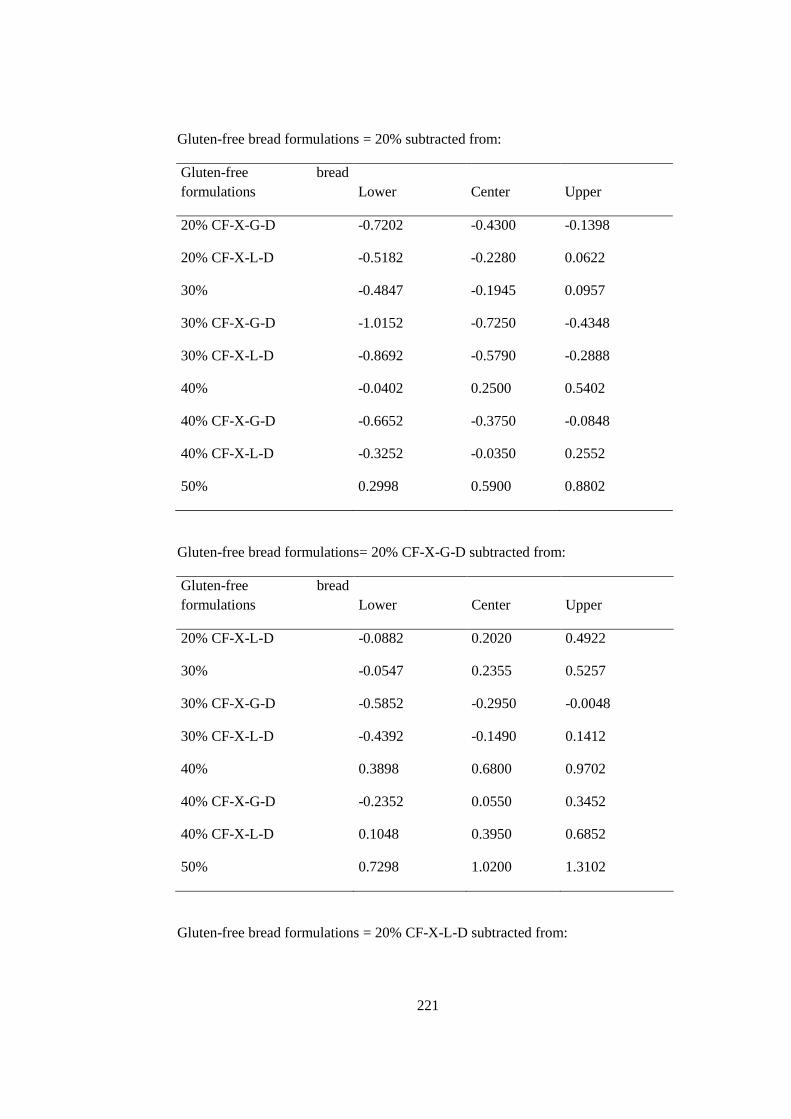
221
Gluten-free bread formulations = 20% subtracted from:
Gluten-free bread
formulations Lower Center Upper
20% CF-X-G-D -0.7202 -0.4300 -0.1398
20% CF-X-L-D -0.5182 -0.2280 0.0622
30% -0.4847 -0.1945 0.0957
30% CF-X-G-D -1.0152 -0.7250 -0.4348
30% CF-X-L-D -0.8692 -0.5790 -0.2888
40% -0.0402 0.2500 0.5402
40% CF-X-G-D -0.6652 -0.3750 -0.0848
40% CF-X-L-D -0.3252 -0.0350 0.2552
50% 0.2998 0.5900 0.8802
Gluten-free bread formulations= 20% CF-X-G-D subtracted from:
Gluten-free bread
formulations Lower Center Upper
20% CF-X-L-D -0.0882 0.2020 0.4922
30% -0.0547 0.2355 0.5257
30% CF-X-G-D -0.5852 -0.2950 -0.0048
30% CF-X-L-D -0.4392 -0.1490 0.1412
40% 0.3898 0.6800 0.9702
40% CF-X-G-D -0.2352 0.0550 0.3452
40% CF-X-L-D 0.1048 0.3950 0.6852
50% 0.7298 1.0200 1.3102
Gluten-free bread formulations = 20% CF-X-L-D subtracted from:
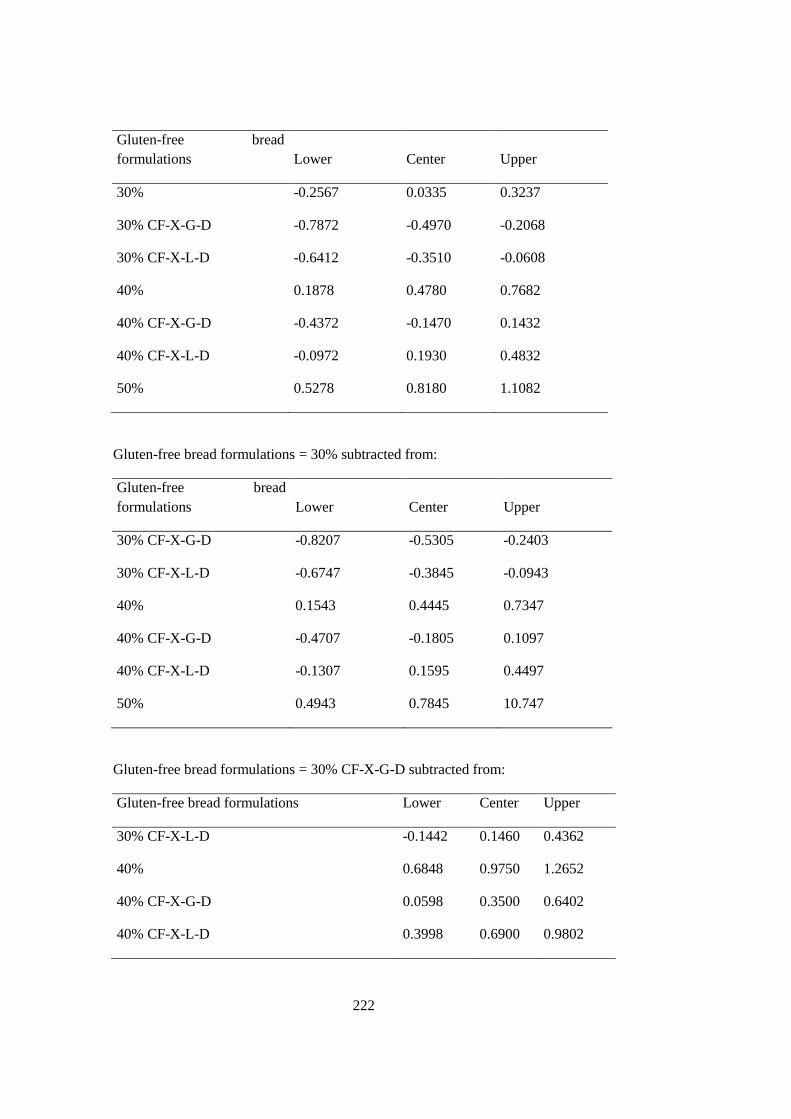
222
Gluten-free bread
formulations Lower Center Upper
30% -0.2567 0.0335 0.3237
30% CF-X-G-D -0.7872 -0.4970 -0.2068
30% CF-X-L-D -0.6412 -0.3510 -0.0608
40% 0.1878 0.4780 0.7682
40% CF-X-G-D -0.4372 -0.1470 0.1432
40% CF-X-L-D -0.0972 0.1930 0.4832
50% 0.5278 0.8180 1.1082
Gluten-free bread formulations = 30% subtracted from:
Gluten-free bread
formulations Lower Center Upper
30% CF-X-G-D -0.8207 -0.5305 -0.2403
30% CF-X-L-D -0.6747 -0.3845 -0.0943
40% 0.1543 0.4445 0.7347
40% CF-X-G-D -0.4707 -0.1805 0.1097
40% CF-X-L-D -0.1307 0.1595 0.4497
50% 0.4943 0.7845 10.747
Gluten-free bread formulations = 30% CF-X-G-D subtracted from:
Gluten-free bread formulations Lower Center Upper
30% CF-X-L-D -0.1442 0.1460 0.4362
40% 0.6848 0.9750 1.2652
40% CF-X-G-D 0.0598 0.3500 0.6402
40% CF-X-L-D 0.3998 0.6900 0.9802
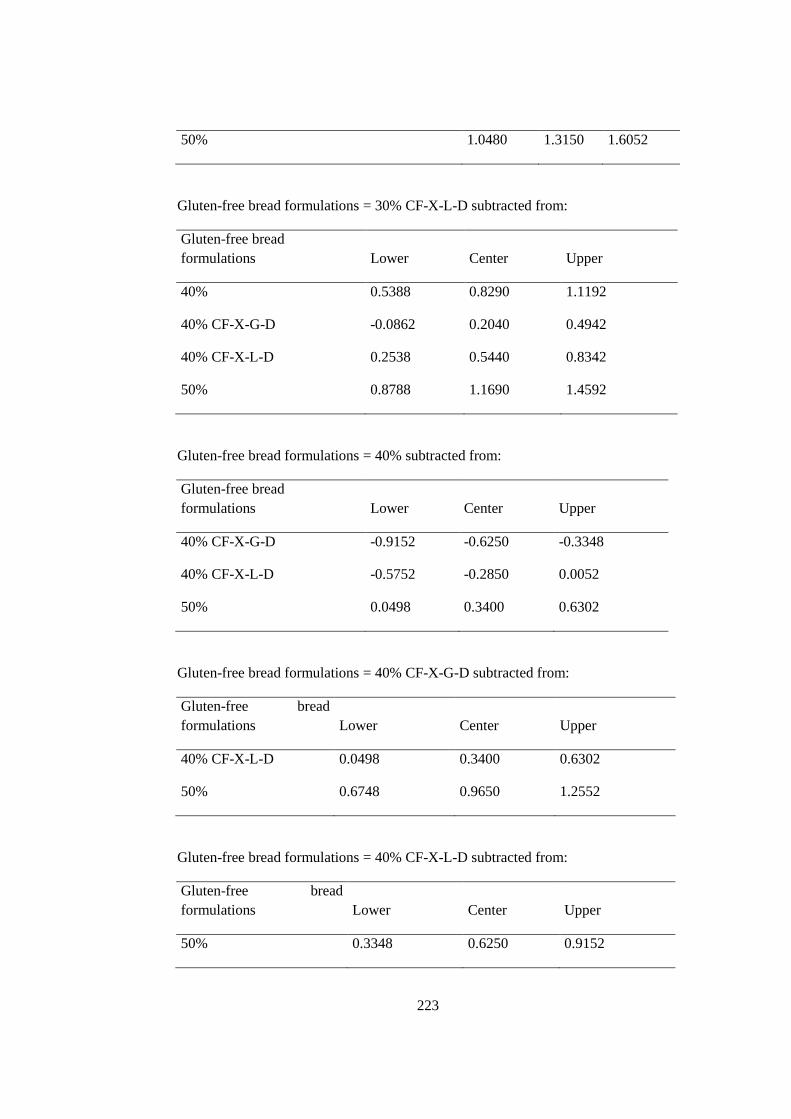
223
50% 1.0480 1.3150 1.6052
Gluten-free bread formulations = 30% CF-X-L-D subtracted from:
Gluten-free bread
formulations Lower Center Upper
40% 0.5388 0.8290 1.1192
40% CF-X-G-D -0.0862 0.2040 0.4942
40% CF-X-L-D 0.2538 0.5440 0.8342
50% 0.8788 1.1690 1.4592
Gluten-free bread formulations = 40% subtracted from:
Gluten-free bread
formulations Lower Center Upper
40% CF-X-G-D -0.9152 -0.6250 -0.3348
40% CF-X-L-D -0.5752 -0.2850 0.0052
50% 0.0498 0.3400 0.6302
Gluten-free bread formulations = 40% CF-X-G-D subtracted from:
Gluten-free bread
formulations Lower Center Upper
40% CF-X-L-D 0.0498 0.3400 0.6302
50% 0.6748 0.9650 1.2552
Gluten-free bread formulations = 40% CF-X-L-D subtracted from:
Gluten-free bread
formulations Lower Center Upper
50% 0.3348 0.6250 0.9152
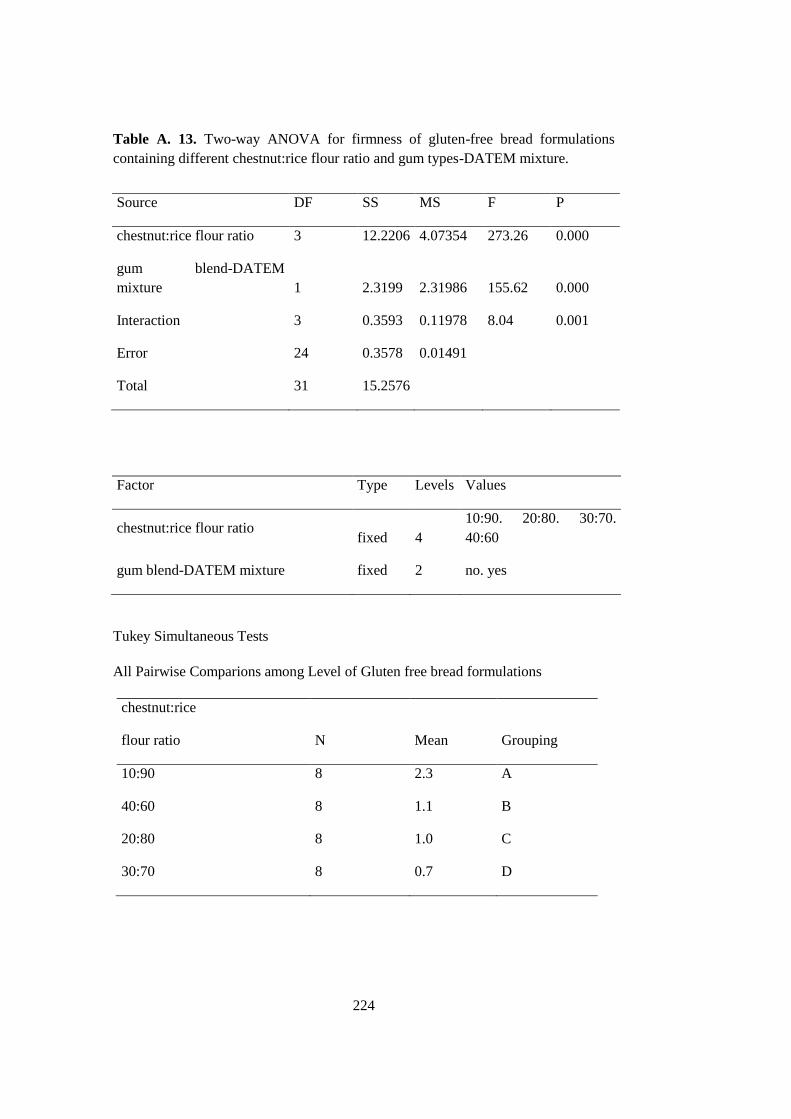
224
Table A. 13. Two-way ANOVA for firmness of gluten-free bread formulations
containing different chestnut:rice flour ratio and gum types-DATEM mixture.
Source DF SS MS F P
chestnut:rice flour ratio 3 12.2206 4.07354 273.26 0.000
gum blend-DATEM
mixture 1 2.3199 2.31986 155.62 0.000
Interaction 3 0.3593 0.11978 8.04 0.001
Error 24 0.3578 0.01491
Total 31 15.2576
Factor Type Levels Values
chestnut:rice flour ratio fixed 4
10:90. 20:80. 30:70.
40:60
gum blend-DATEM mixture fixed 2 no. yes
Tukey Simultaneous Tests
All Pairwise Comparions among Level of Gluten free bread formulations
chestnut:rice
flour ratio N Mean Grouping
10:90 8 2.3 A
40:60 8 1.1 B
20:80 8 1.0 C
30:70 8 0.7 D
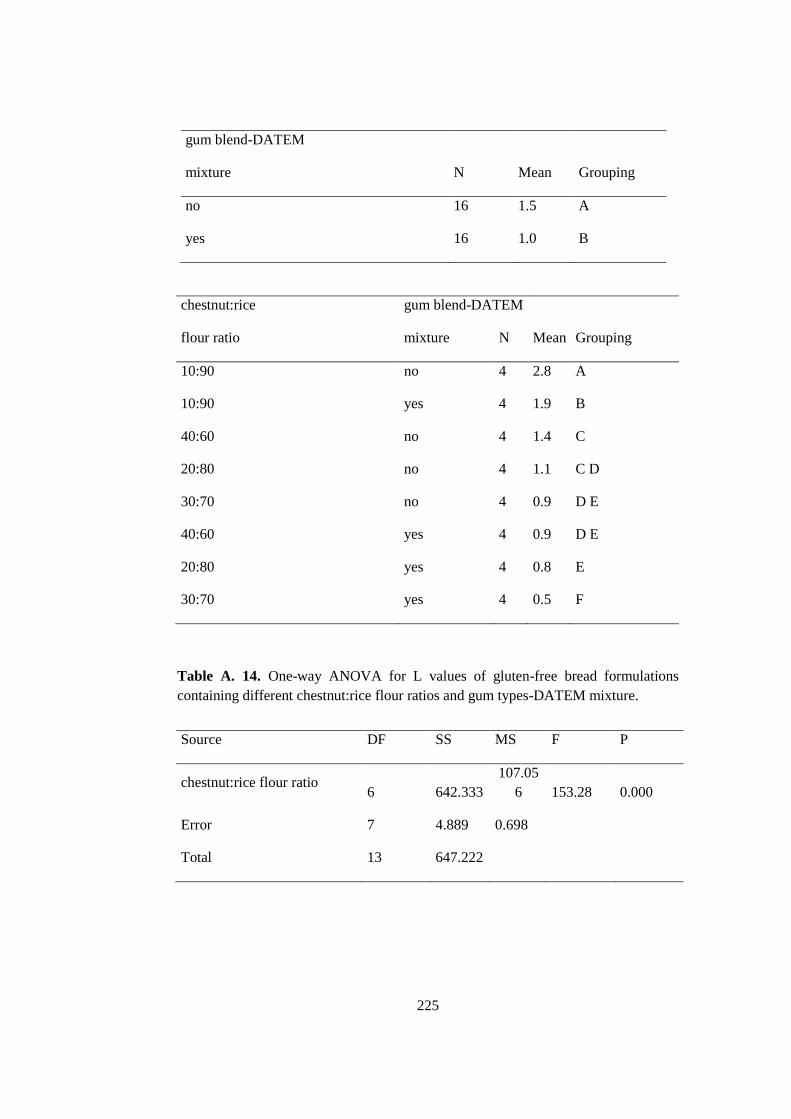
225
gum blend-DATEM
mixture N Mean Grouping
no 16 1.5 A
yes 16 1.0 B
chestnut:rice gum blend-DATEM
flour ratio mixture N Mean Grouping
10:90 no 4 2.8 A
10:90 yes 4 1.9 B
40:60 no 4 1.4 C
20:80 no 4 1.1 C D
30:70 no 4 0.9 D E
40:60 yes 4 0.9 D E
20:80 yes 4 0.8 E
30:70 yes 4 0.5 F
Table A. 14. One-way ANOVA for L values of gluten-free bread formulations
containing different chestnut:rice flour ratios and gum types-DATEM mixture.
Source DF SS MS F P
chestnut:rice flour ratio 6 642.333
107.05
6 153.28 0.000
Error 7 4.889 0.698
Total 13 647.222
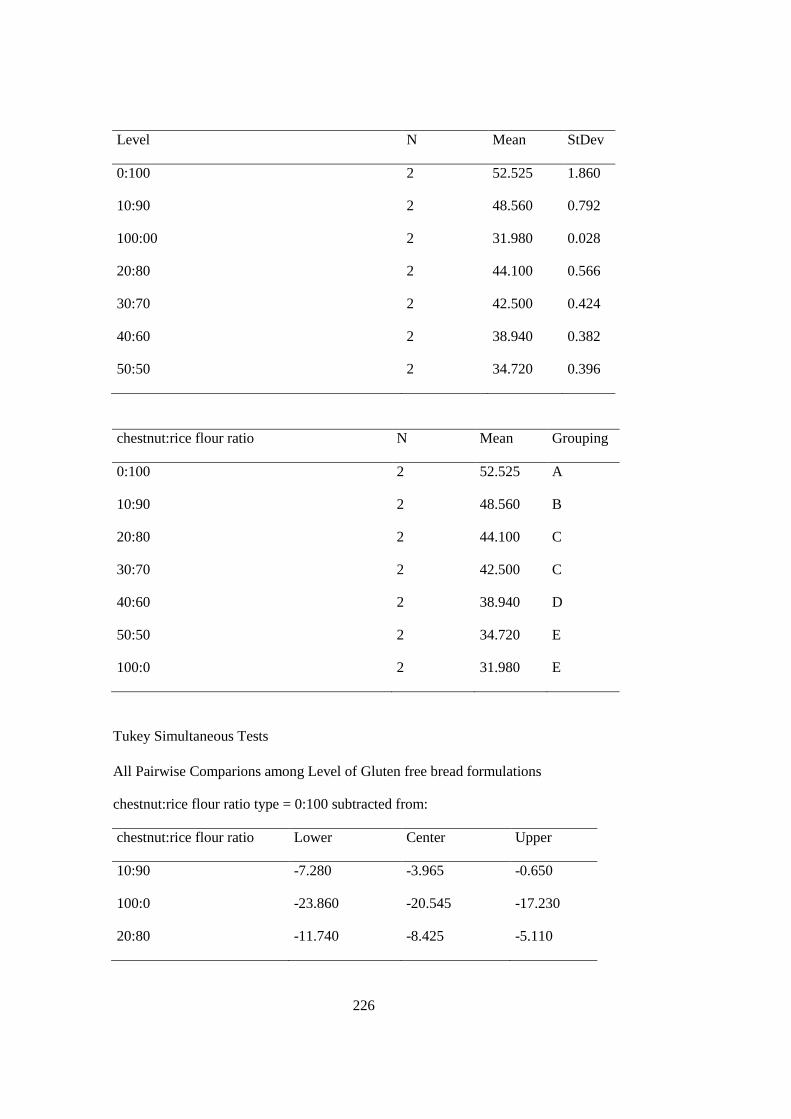
226
Level N Mean StDev
0:100 2 52.525 1.860
10:90 2 48.560 0.792
100:00 2 31.980 0.028
20:80 2 44.100 0.566
30:70 2 42.500 0.424
40:60 2 38.940 0.382
50:50 2 34.720 0.396
chestnut:rice flour ratio N Mean Grouping
0:100 2 52.525 A
10:90 2 48.560 B
20:80 2 44.100 C
30:70 2 42.500 C
40:60 2 38.940 D
50:50 2 34.720 E
100:0 2 31.980 E
Tukey Simultaneous Tests
All Pairwise Comparions among Level of Gluten free bread formulations
chestnut:rice flour ratio type = 0:100 subtracted from:
chestnut:rice flour ratio Lower Center Upper
10:90 -7.280 -3.965 -0.650
100:0 -23.860 -20.545 -17.230
20:80 -11.740 -8.425 -5.110
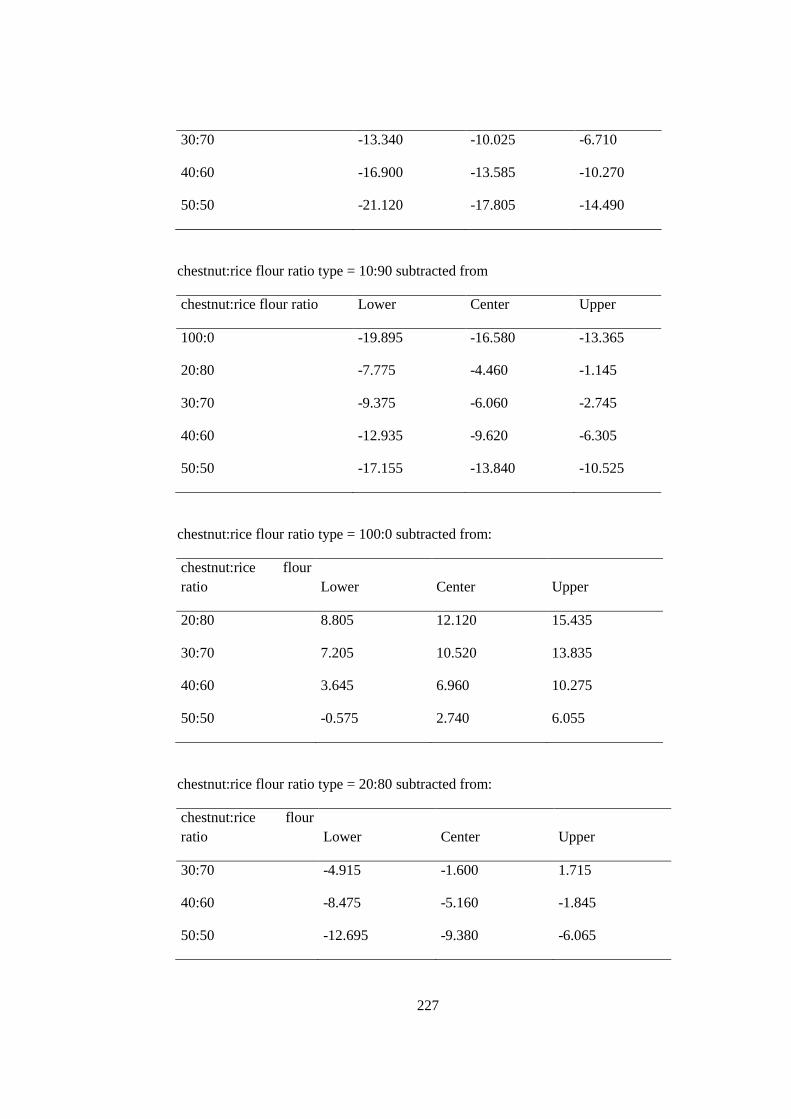
227
30:70 -13.340 -10.025 -6.710
40:60 -16.900 -13.585 -10.270
50:50 -21.120 -17.805 -14.490
chestnut:rice flour ratio type = 10:90 subtracted from
chestnut:rice flour ratio Lower Center Upper
100:0 -19.895 -16.580 -13.365
20:80 -7.775 -4.460 -1.145
30:70 -9.375 -6.060 -2.745
40:60 -12.935 -9.620 -6.305
50:50 -17.155 -13.840 -10.525
chestnut:rice flour ratio type = 100:0 subtracted from:
chestnut:rice flour
ratio Lower Center Upper
20:80 8.805 12.120 15.435
30:70 7.205 10.520 13.835
40:60 3.645 6.960 10.275
50:50 -0.575 2.740 6.055
chestnut:rice flour ratio type = 20:80 subtracted from:
chestnut:rice flour
ratio Lower Center Upper
30:70 -4.915 -1.600 1.715
40:60 -8.475 -5.160 -1.845
50:50 -12.695 -9.380 -6.065
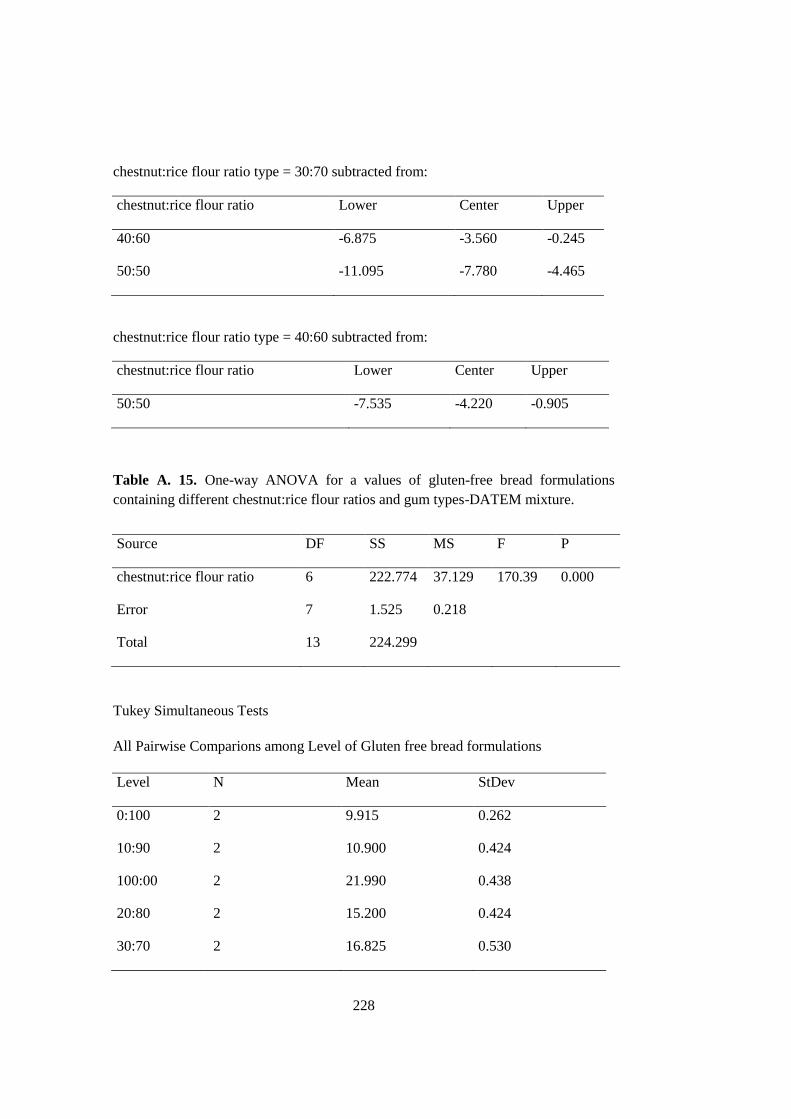
228
chestnut:rice flour ratio type = 30:70 subtracted from:
chestnut:rice flour ratio Lower Center Upper
40:60 -6.875 -3.560 -0.245
50:50 -11.095 -7.780 -4.465
chestnut:rice flour ratio type = 40:60 subtracted from:
chestnut:rice flour ratio Lower Center Upper
50:50 -7.535 -4.220 -0.905
Table A. 15. One-way ANOVA for a values of gluten-free bread formulations
containing different chestnut:rice flour ratios and gum types-DATEM mixture.
Source DF SS MS F P
chestnut:rice flour ratio 6 222.774 37.129 170.39 0.000
Error 7 1.525 0.218
Total 13 224.299
Tukey Simultaneous Tests
All Pairwise Comparions among Level of Gluten free bread formulations
Level N Mean StDev
0:100 2 9.915 0.262
10:90 2 10.900 0.424
100:00 2 21.990 0.438
20:80 2 15.200 0.424
30:70 2 16.825 0.530
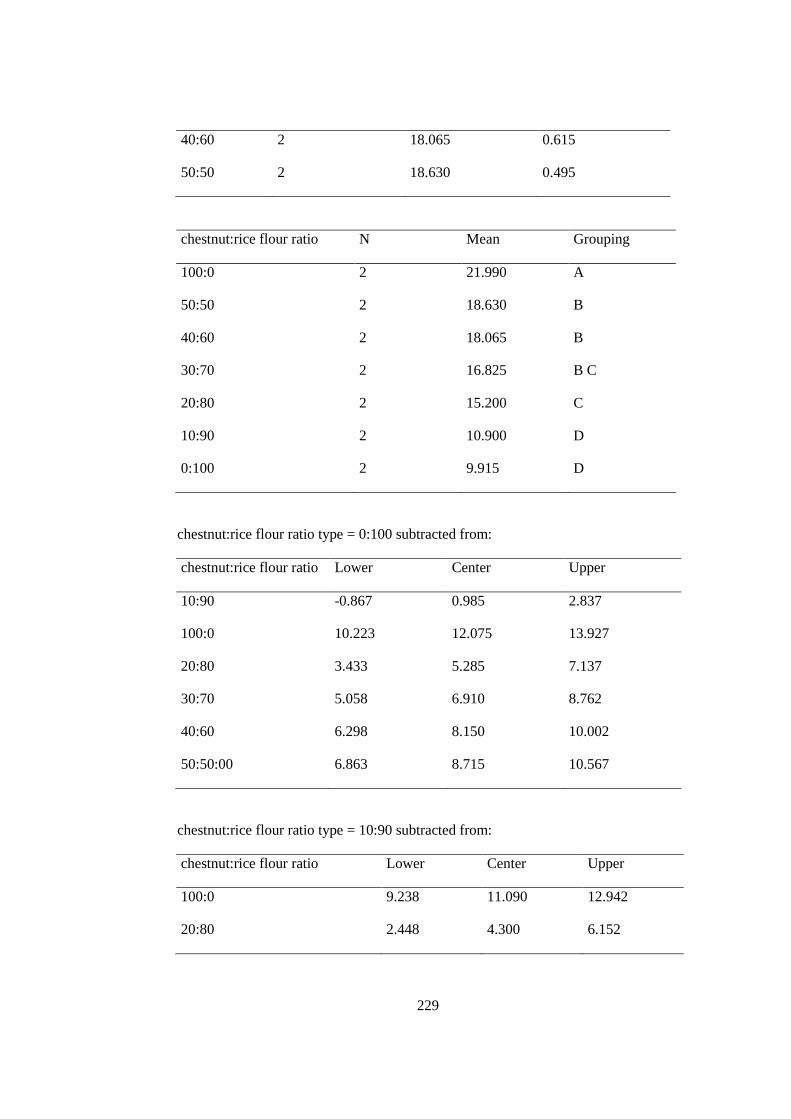
229
40:60 2 18.065 0.615
50:50 2 18.630 0.495
chestnut:rice flour ratio N Mean Grouping
100:0 2 21.990 A
50:50 2 18.630 B
40:60 2 18.065 B
30:70 2 16.825 B C
20:80 2 15.200 C
10:90 2 10.900 D
0:100 2 9.915 D
chestnut:rice flour ratio type = 0:100 subtracted from:
chestnut:rice flour ratio Lower Center Upper
10:90 -0.867 0.985 2.837
100:0 10.223 12.075 13.927
20:80 3.433 5.285 7.137
30:70 5.058 6.910 8.762
40:60 6.298 8.150 10.002
50:50:00 6.863 8.715 10.567
chestnut:rice flour ratio type = 10:90 subtracted from:
chestnut:rice flour ratio Lower Center Upper
100:0 9.238 11.090 12.942
20:80 2.448 4.300 6.152
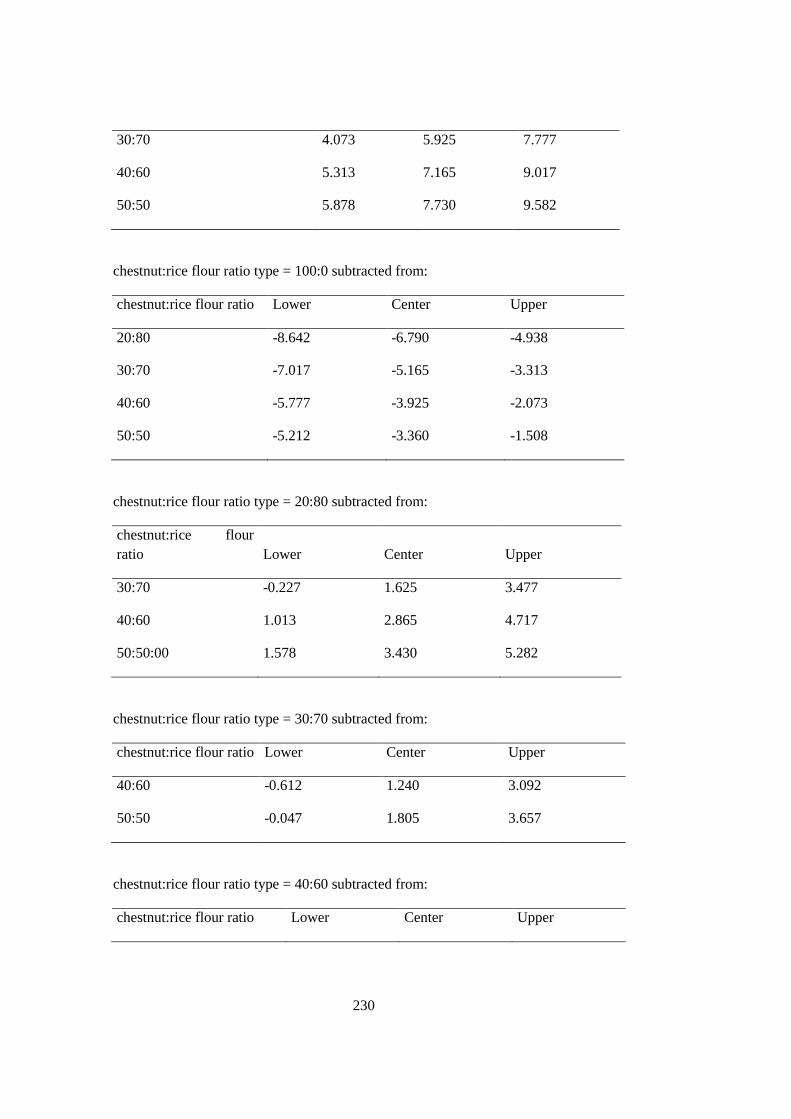
230
30:70 4.073 5.925 7.777
40:60 5.313 7.165 9.017
50:50 5.878 7.730 9.582
chestnut:rice flour ratio type = 100:0 subtracted from:
chestnut:rice flour ratio Lower Center Upper
20:80 -8.642 -6.790 -4.938
30:70 -7.017 -5.165 -3.313
40:60 -5.777 -3.925 -2.073
50:50 -5.212 -3.360 -1.508
chestnut:rice flour ratio type = 20:80 subtracted from:
chestnut:rice flour
ratio Lower Center Upper
30:70 -0.227 1.625 3.477
40:60 1.013 2.865 4.717
50:50:00 1.578 3.430 5.282
chestnut:rice flour ratio type = 30:70 subtracted from:
chestnut:rice flour ratio Lower Center Upper
40:60 -0.612 1.240 3.092
50:50 -0.047 1.805 3.657
chestnut:rice flour ratio type = 40:60 subtracted from:
chestnut:rice flour ratio Lower Center Upper
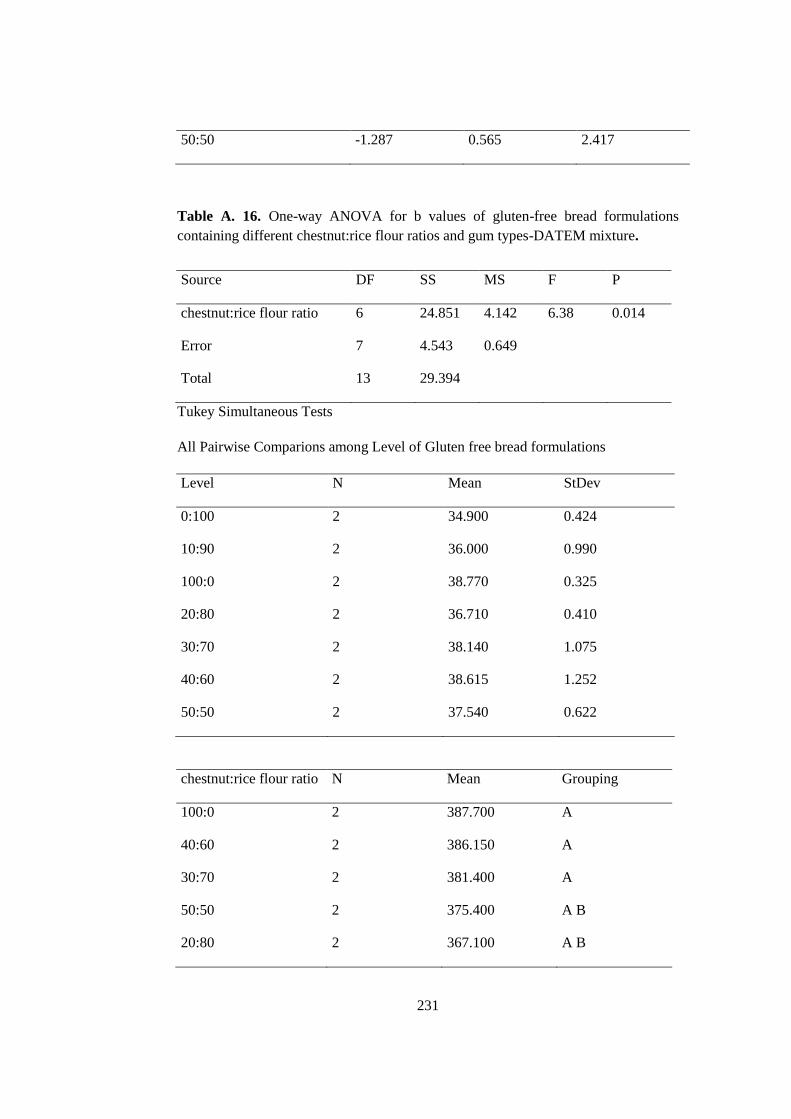
231
50:50 -1.287 0.565 2.417
Table A. 16. One-way ANOVA for b values of gluten-free bread formulations
containing different chestnut:rice flour ratios and gum types-DATEM mixture.
Source DF SS MS F P
chestnut:rice flour ratio 6 24.851 4.142 6.38 0.014
Error 7 4.543 0.649
Total 13 29.394
Tukey Simultaneous Tests
All Pairwise Comparions among Level of Gluten free bread formulations
Level N Mean StDev
0:100 2 34.900 0.424
10:90 2 36.000 0.990
100:0 2 38.770 0.325
20:80 2 36.710 0.410
30:70 2 38.140 1.075
40:60 2 38.615 1.252
50:50 2 37.540 0.622
chestnut:rice flour ratio N Mean Grouping
100:0 2 387.700 A
40:60 2 386.150 A
30:70 2 381.400 A
50:50 2 375.400 A B
20:80 2 367.100 A B
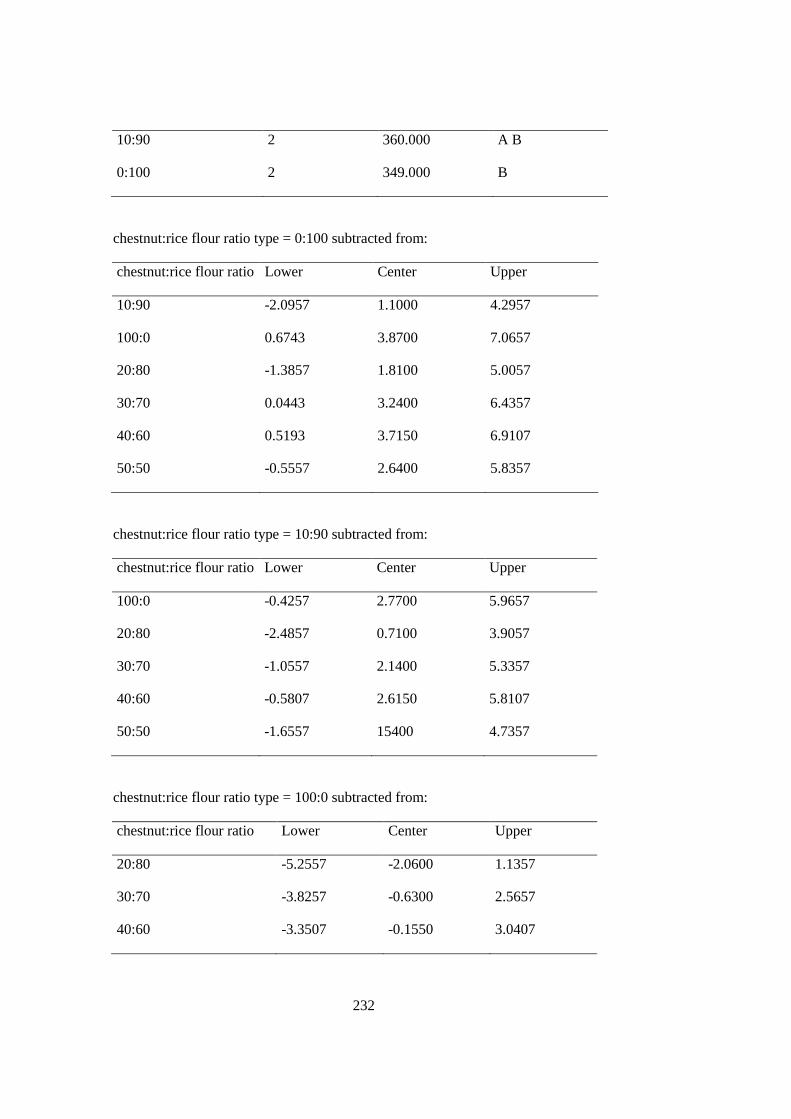
232
10:90 2 360.000 A B
0:100 2 349.000 B
chestnut:rice flour ratio type = 0:100 subtracted from:
chestnut:rice flour ratio Lower Center Upper
10:90 -2.0957 1.1000 4.2957
100:0 0.6743 3.8700 7.0657
20:80 -1.3857 1.8100 5.0057
30:70 0.0443 3.2400 6.4357
40:60 0.5193 3.7150 6.9107
50:50 -0.5557 2.6400 5.8357
chestnut:rice flour ratio type = 10:90 subtracted from:
chestnut:rice flour ratio Lower Center Upper
100:0 -0.4257 2.7700 5.9657
20:80 -2.4857 0.7100 3.9057
30:70 -1.0557 2.1400 5.3357
40:60 -0.5807 2.6150 5.8107
50:50 -1.6557 15400 4.7357
chestnut:rice flour ratio type = 100:0 subtracted from:
chestnut:rice flour ratio Lower Center Upper
20:80 -5.2557 -2.0600 1.1357
30:70 -3.8257 -0.6300 2.5657
40:60 -3.3507 -0.1550 3.0407
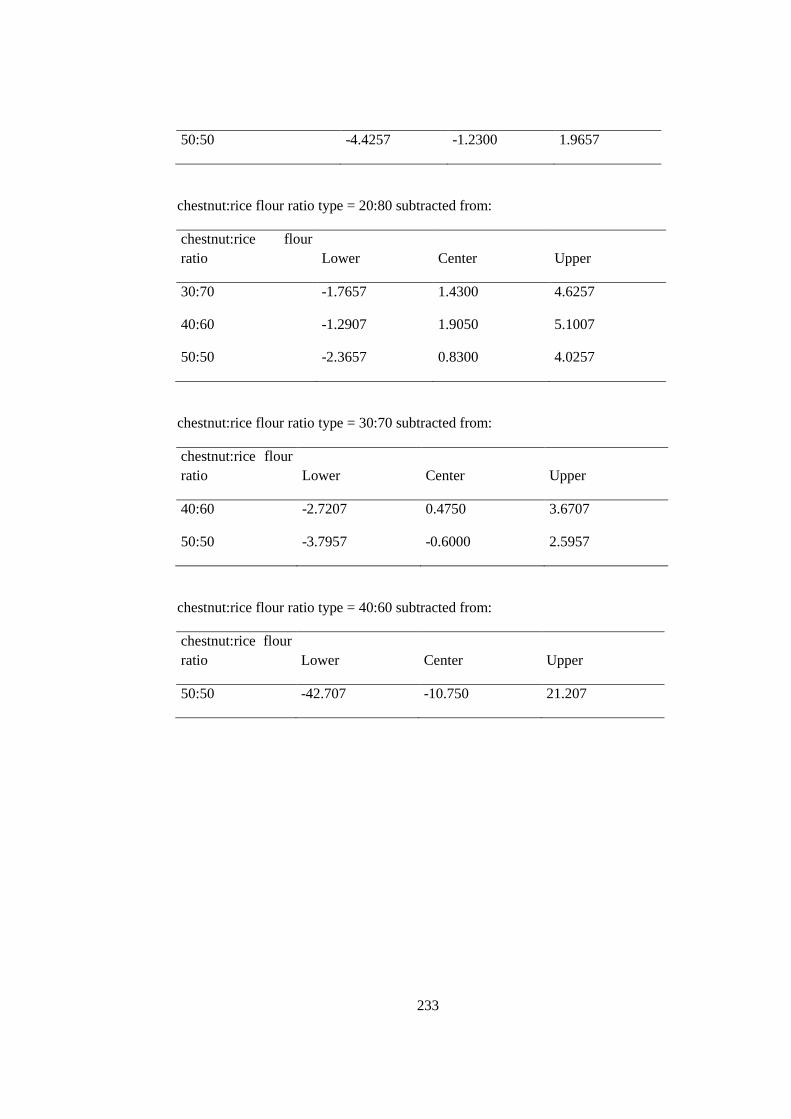
233
50:50 -4.4257 -1.2300 1.9657
chestnut:rice flour ratio type = 20:80 subtracted from:
chestnut:rice flour
ratio Lower Center Upper
30:70 -1.7657 1.4300 4.6257
40:60 -1.2907 1.9050 5.1007
50:50 -2.3657 0.8300 4.0257
chestnut:rice flour ratio type = 30:70 subtracted from:
chestnut:rice flour
ratio Lower Center Upper
40:60 -2.7207 0.4750 3.6707
50:50 -3.7957 -0.6000 2.5957
chestnut:rice flour ratio type = 40:60 subtracted from:
chestnut:rice flour
ratio Lower Center Upper
50:50 -42.707 -10.750 21.207
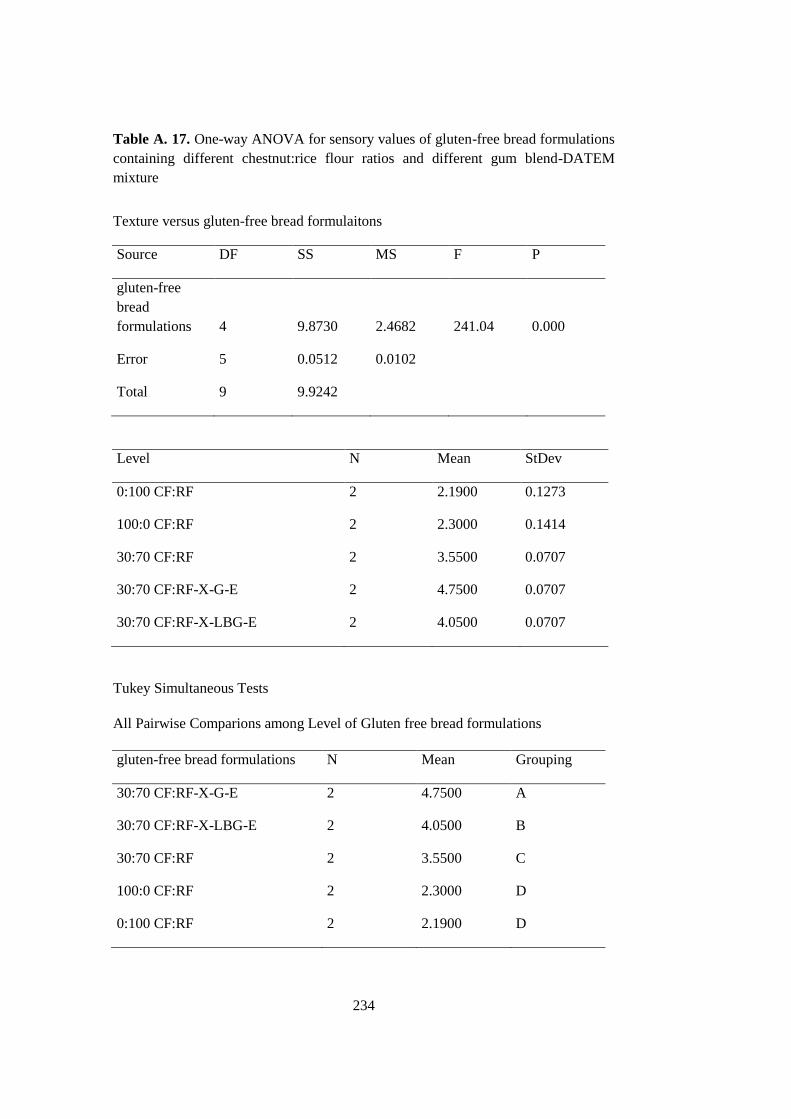
234
Table A. 17. One-way ANOVA for sensory values of gluten-free bread formulations
containing different chestnut:rice flour ratios and different gum blend-DATEM
mixture
Texture versus gluten-free bread formulaitons
Source DF SS MS F P
gluten-free
bread
formulations 4 9.8730 2.4682 241.04 0.000
Error 5 0.0512 0.0102
Total 9 9.9242
Level N Mean StDev
0:100 CF:RF 2 2.1900 0.1273
100:0 CF:RF 2 2.3000 0.1414
30:70 CF:RF 2 3.5500 0.0707
30:70 CF:RF-X-G-E 2 4.7500 0.0707
30:70 CF:RF-X-LBG-E 2 4.0500 0.0707
Tukey Simultaneous Tests
All Pairwise Comparions among Level of Gluten free bread formulations
gluten-free bread formulations N Mean Grouping
30:70 CF:RF-X-G-E 2 4.7500 A
30:70 CF:RF-X-LBG-E 2 4.0500 B
30:70 CF:RF 2 3.5500 C
100:0 CF:RF 2 2.3000 D
0:100 CF:RF 2 2.1900 D
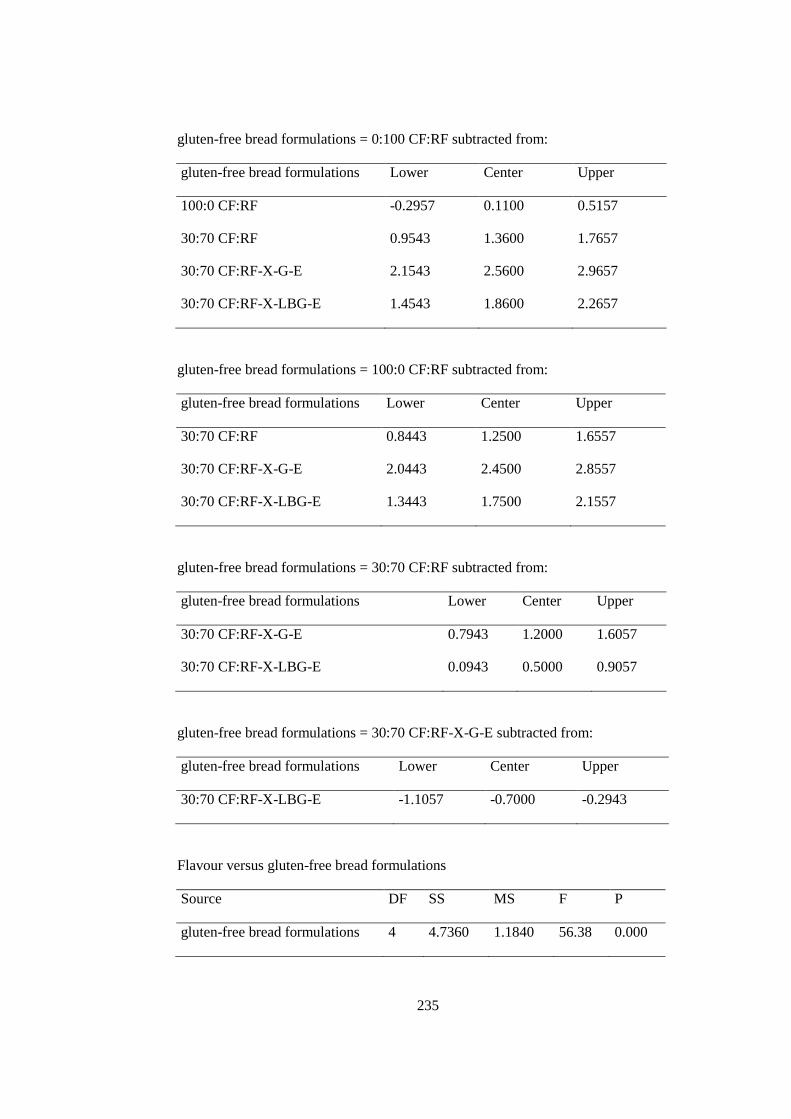
235
gluten-free bread formulations = 0:100 CF:RF subtracted from:
gluten-free bread formulations Lower Center Upper
100:0 CF:RF -0.2957 0.1100 0.5157
30:70 CF:RF 0.9543 1.3600 1.7657
30:70 CF:RF-X-G-E 2.1543 2.5600 2.9657
30:70 CF:RF-X-LBG-E 1.4543 1.8600 2.2657
gluten-free bread formulations = 100:0 CF:RF subtracted from:
gluten-free bread formulations Lower Center Upper
30:70 CF:RF 0.8443 1.2500 1.6557
30:70 CF:RF-X-G-E 2.0443 2.4500 2.8557
30:70 CF:RF-X-LBG-E 1.3443 1.7500 2.1557
gluten-free bread formulations = 30:70 CF:RF subtracted from:
gluten-free bread formulations Lower Center Upper
30:70 CF:RF-X-G-E 0.7943 1.2000 1.6057
30:70 CF:RF-X-LBG-E 0.0943 0.5000 0.9057
gluten-free bread formulations = 30:70 CF:RF-X-G-E subtracted from:
gluten-free bread formulations Lower Center Upper
30:70 CF:RF-X-LBG-E -1.1057 -0.7000 -0.2943
Flavour versus gluten-free bread formulations
Source DF SS MS F P
gluten-free bread formulations 4 4.7360 1.1840 56.38 0.000
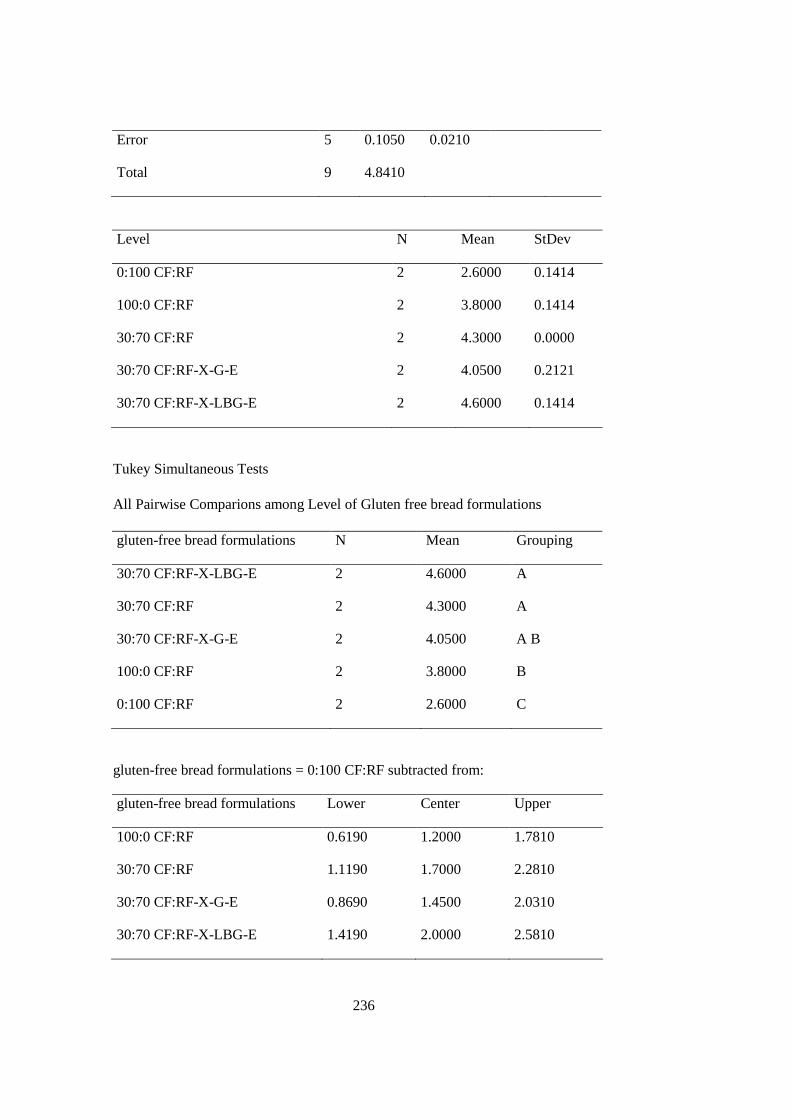
236
Error 5 0.1050 0.0210
Total 9 4.8410
Level N Mean StDev
0:100 CF:RF 2 2.6000 0.1414
100:0 CF:RF 2 3.8000 0.1414
30:70 CF:RF 2 4.3000 0.0000
30:70 CF:RF-X-G-E 2 4.0500 0.2121
30:70 CF:RF-X-LBG-E 2 4.6000 0.1414
Tukey Simultaneous Tests
All Pairwise Comparions among Level of Gluten free bread formulations
gluten-free bread formulations N Mean Grouping
30:70 CF:RF-X-LBG-E 2 4.6000 A
30:70 CF:RF 2 4.3000 A
30:70 CF:RF-X-G-E 2 4.0500 A B
100:0 CF:RF 2 3.8000 B
0:100 CF:RF 2 2.6000 C
gluten-free bread formulations = 0:100 CF:RF subtracted from:
gluten-free bread formulations Lower Center Upper
100:0 CF:RF 0.6190 1.2000 1.7810
30:70 CF:RF 1.1190 1.7000 2.2810
30:70 CF:RF-X-G-E 0.8690 1.4500 2.0310
30:70 CF:RF-X-LBG-E 1.4190 2.0000 2.5810
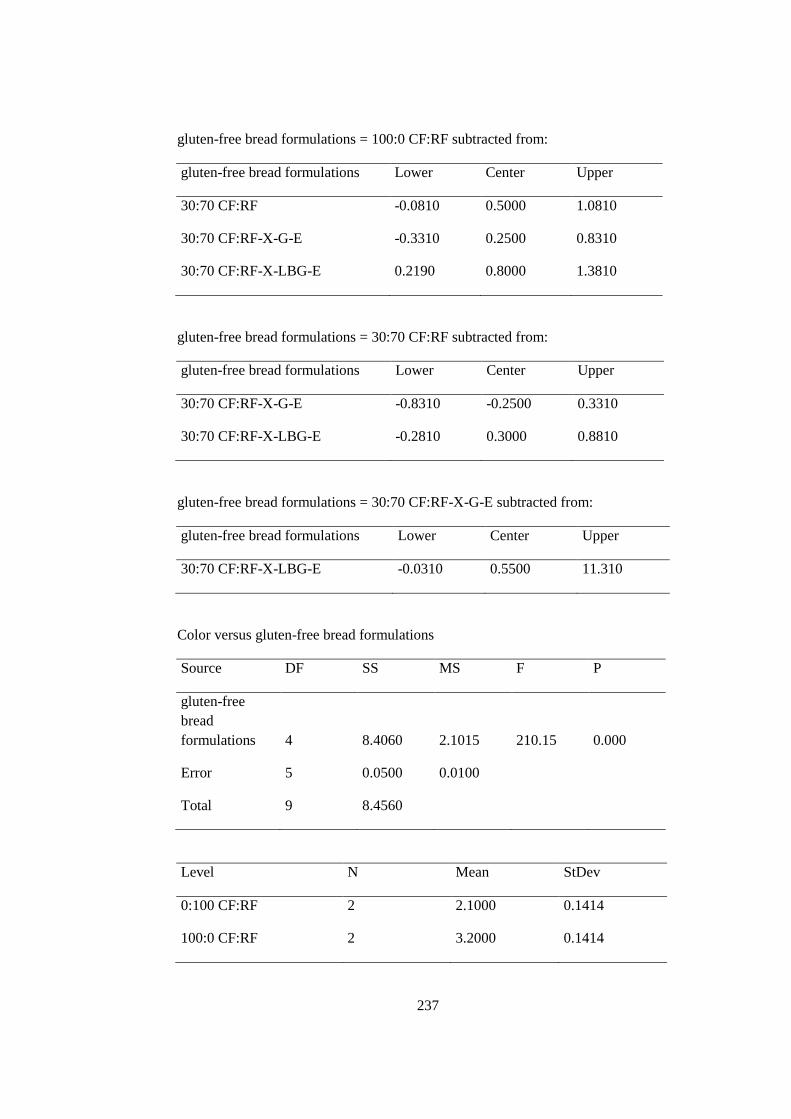
237
gluten-free bread formulations = 100:0 CF:RF subtracted from:
gluten-free bread formulations Lower Center Upper
30:70 CF:RF -0.0810 0.5000 1.0810
30:70 CF:RF-X-G-E -0.3310 0.2500 0.8310
30:70 CF:RF-X-LBG-E 0.2190 0.8000 1.3810
gluten-free bread formulations = 30:70 CF:RF subtracted from:
gluten-free bread formulations Lower Center Upper
30:70 CF:RF-X-G-E -0.8310 -0.2500 0.3310
30:70 CF:RF-X-LBG-E -0.2810 0.3000 0.8810
gluten-free bread formulations = 30:70 CF:RF-X-G-E subtracted from:
gluten-free bread formulations Lower Center Upper
30:70 CF:RF-X-LBG-E -0.0310 0.5500 11.310
Color versus gluten-free bread formulations
Source DF SS MS F P
gluten-free
bread
formulations 4 8.4060 2.1015 210.15 0.000
Error 5 0.0500 0.0100
Total 9 8.4560
Level N Mean StDev
0:100 CF:RF 2 2.1000 0.1414
100:0 CF:RF 2 3.2000 0.1414
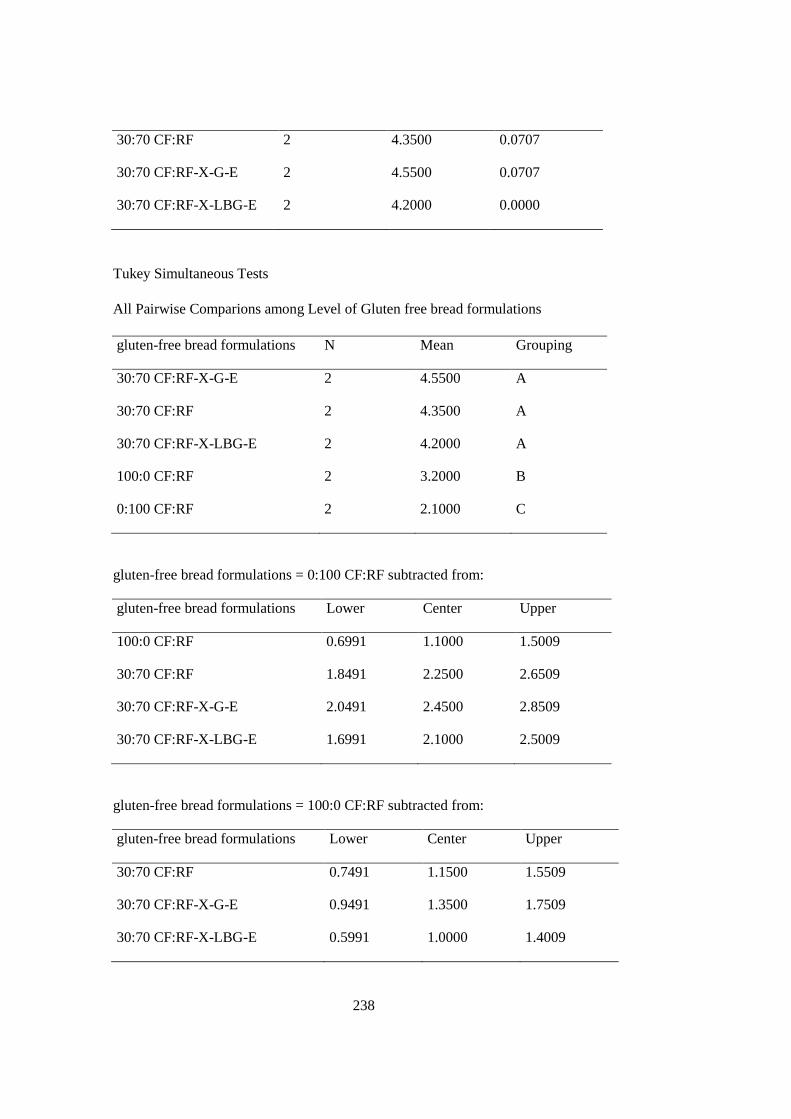
238
30:70 CF:RF 2 4.3500 0.0707
30:70 CF:RF-X-G-E 2 4.5500 0.0707
30:70 CF:RF-X-LBG-E 2 4.2000 0.0000
Tukey Simultaneous Tests
All Pairwise Comparions among Level of Gluten free bread formulations
gluten-free bread formulations N Mean Grouping
30:70 CF:RF-X-G-E 2 4.5500 A
30:70 CF:RF 2 4.3500 A
30:70 CF:RF-X-LBG-E 2 4.2000 A
100:0 CF:RF 2 3.2000 B
0:100 CF:RF 2 2.1000 C
gluten-free bread formulations = 0:100 CF:RF subtracted from:
gluten-free bread formulations Lower Center Upper
100:0 CF:RF 0.6991 1.1000 1.5009
30:70 CF:RF 1.8491 2.2500 2.6509
30:70 CF:RF-X-G-E 2.0491 2.4500 2.8509
30:70 CF:RF-X-LBG-E 1.6991 2.1000 2.5009
gluten-free bread formulations = 100:0 CF:RF subtracted from:
gluten-free bread formulations Lower Center Upper
30:70 CF:RF 0.7491 1.1500 1.5509
30:70 CF:RF-X-G-E 0.9491 1.3500 1.7509
30:70 CF:RF-X-LBG-E 0.5991 1.0000 1.4009
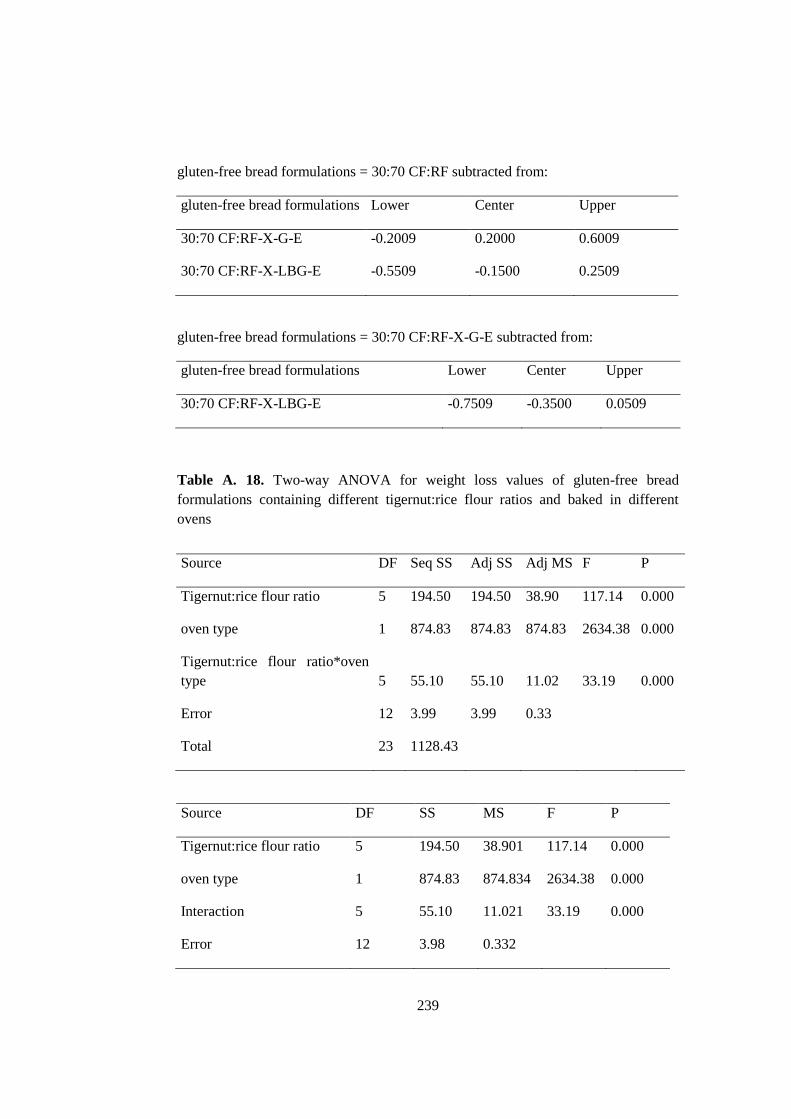
239
gluten-free bread formulations = 30:70 CF:RF subtracted from:
gluten-free bread formulations Lower Center Upper
30:70 CF:RF-X-G-E -0.2009 0.2000 0.6009
30:70 CF:RF-X-LBG-E -0.5509 -0.1500 0.2509
gluten-free bread formulations = 30:70 CF:RF-X-G-E subtracted from:
gluten-free bread formulations Lower Center Upper
30:70 CF:RF-X-LBG-E -0.7509 -0.3500 0.0509
Table A. 18. Two-way ANOVA for weight loss values of gluten-free bread
formulations containing different tigernut:rice flour ratios and baked in different
ovens
Source DF Seq SS Adj SS Adj MS F P
Tigernut:rice flour ratio 5 194.50 194.50 38.90 117.14 0.000
oven type 1 874.83 874.83 874.83 2634.38 0.000
Tigernut:rice flour ratio*oven
type 5 55.10 55.10 11.02 33.19 0.000
Error 12 3.99 3.99 0.33
Total 23 1128.43
Source DF SS MS F P
Tigernut:rice flour ratio 5 194.50 38.901 117.14 0.000
oven type 1 874.83 874.834 2634.38 0.000
Interaction 5 55.10 11.021 33.19 0.000
Error 12 3.98 0.332
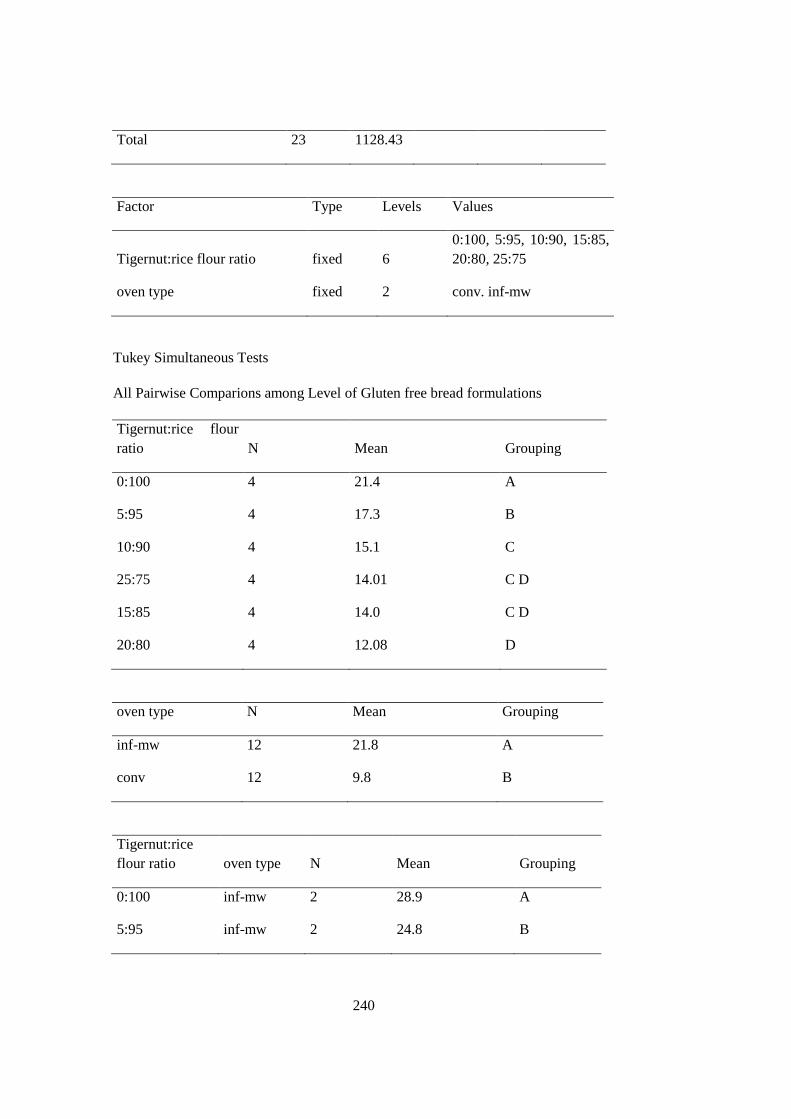
240
Total 23 1128.43
Factor Type Levels Values
Tigernut:rice flour ratio fixed 6
0:100, 5:95, 10:90, 15:85,
20:80, 25:75
oven type fixed 2 conv. inf-mw
Tukey Simultaneous Tests
All Pairwise Comparions among Level of Gluten free bread formulations
Tigernut:rice flour
ratio N Mean Grouping
0:100 4 21.4 A
5:95 4 17.3 B
10:90 4 15.1 C
25:75 4 14.01 C D
15:85 4 14.0 C D
20:80 4 12.08 D
oven type N Mean Grouping
inf-mw 12 21.8 A
conv 12 9.8 B
Tigernut:rice
flour ratio oven type N Mean Grouping
0:100 inf-mw 2 28.9 A
5:95 inf-mw 2 24.8 B
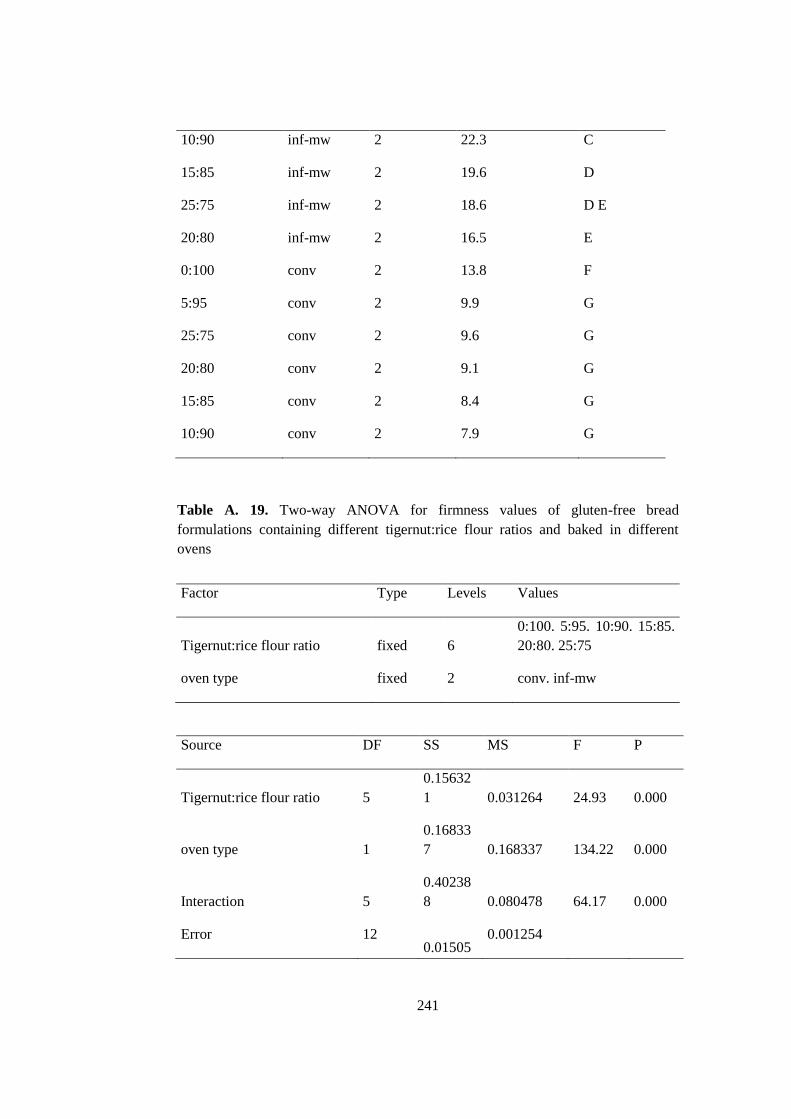
241
10:90 inf-mw 2 22.3 C
15:85 inf-mw 2 19.6 D
25:75 inf-mw 2 18.6 D E
20:80 inf-mw 2 16.5 E
0:100 conv 2 13.8 F
5:95 conv 2 9.9 G
25:75 conv 2 9.6 G
20:80 conv 2 9.1 G
15:85 conv 2 8.4 G
10:90 conv 2 7.9 G
Table A. 19. Two-way ANOVA for firmness values of gluten-free bread
formulations containing different tigernut:rice flour ratios and baked in different
ovens
Factor Type Levels Values
Tigernut:rice flour ratio fixed 6
0:100. 5:95. 10:90. 15:85.
20:80. 25:75
oven type fixed 2 conv. inf-mw
Source DF SS MS F P
Tigernut:rice flour ratio 5
0.15632
1 0.031264 24.93 0.000
oven type 1
0.16833
7 0.168337 134.22 0.000
Interaction 5
0.40238
8 0.080478 64.17 0.000
Error 12 0.01505
0.001254
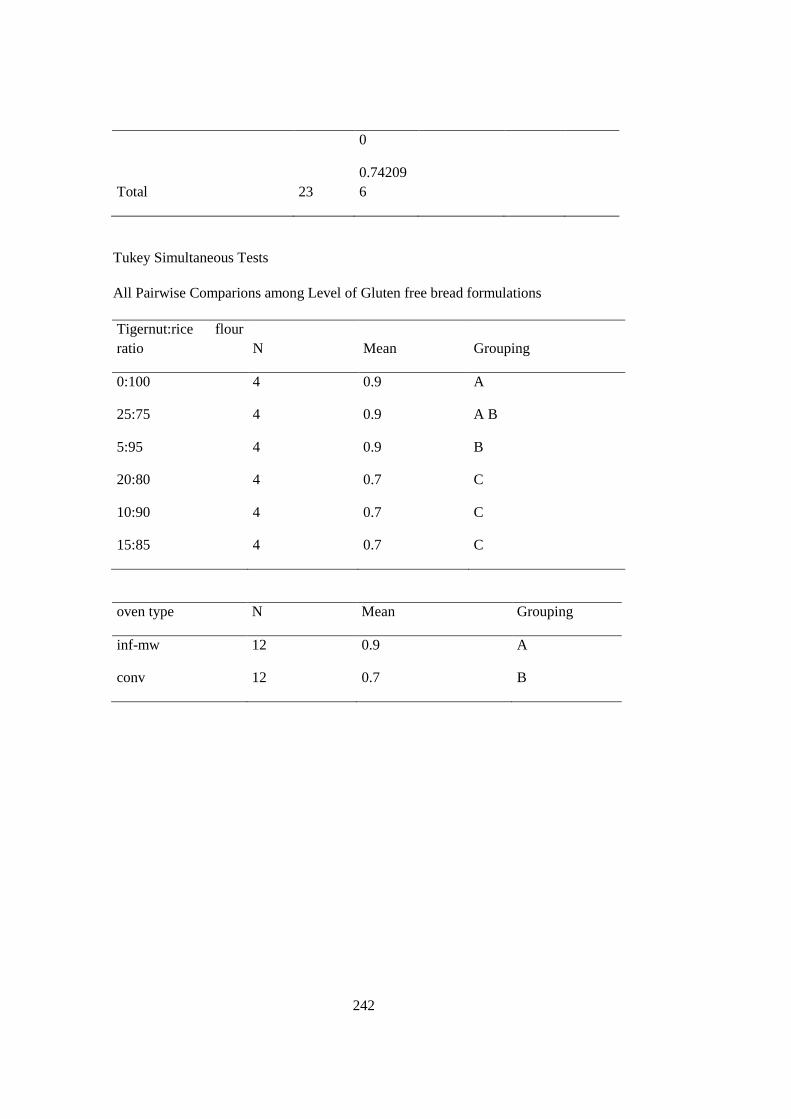
242
0
Total 23
0.74209
6
Tukey Simultaneous Tests
All Pairwise Comparions among Level of Gluten free bread formulations
Tigernut:rice flour
ratio N Mean Grouping
0:100 4 0.9 A
25:75 4 0.9 A B
5:95 4 0.9 B
20:80 4 0.7 C
10:90 4 0.7 C
15:85 4 0.7 C
oven type N Mean Grouping
inf-mw 12 0.9 A
conv 12 0.7 B
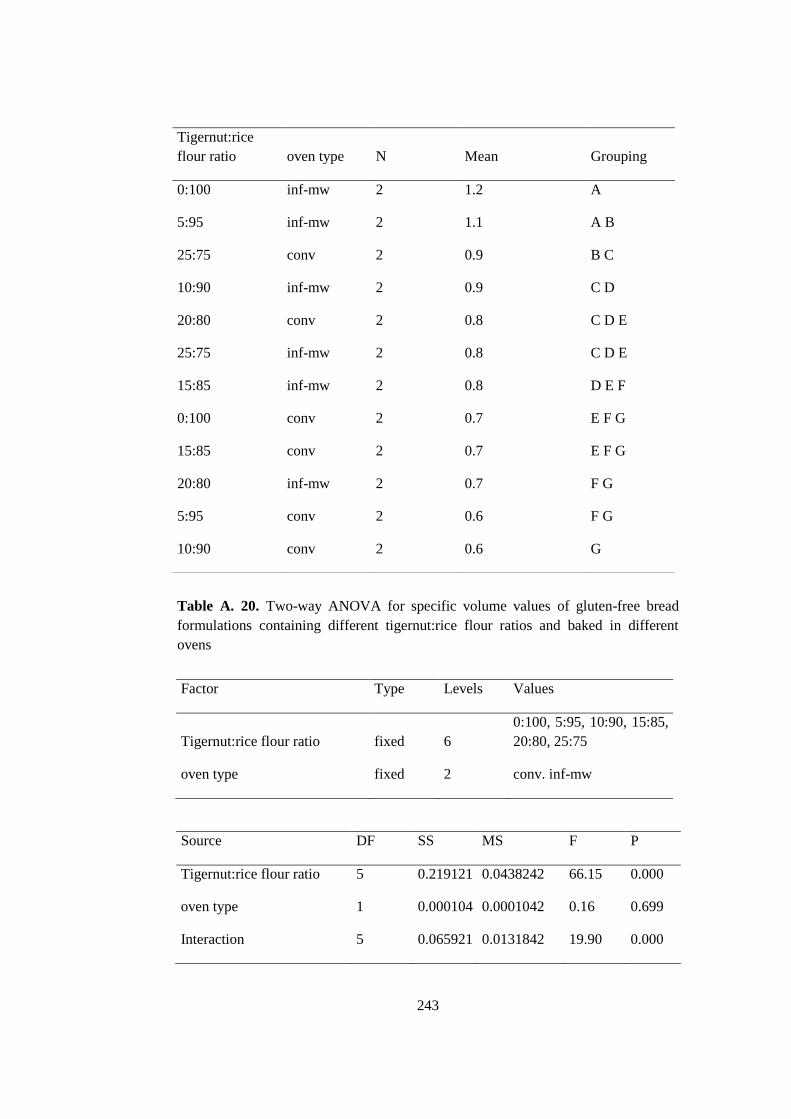
243
Table A. 20. Two-way ANOVA for specific volume values of gluten-free bread
formulations containing different tigernut:rice flour ratios and baked in different
ovens
Factor Type Levels Values
Tigernut:rice flour ratio fixed 6
0:100, 5:95, 10:90, 15:85,
20:80, 25:75
oven type fixed 2 conv. inf-mw
Source DF SS MS F P
Tigernut:rice flour ratio 5 0.219121 0.0438242 66.15 0.000
oven type 1 0.000104 0.0001042 0.16 0.699
Interaction 5 0.065921 0.0131842 19.90 0.000
Tigernut:rice
flour ratio oven type N Mean Grouping
0:100 inf-mw 2 1.2 A
5:95 inf-mw 2 1.1 A B
25:75 conv 2 0.9 B C
10:90 inf-mw 2 0.9 C D
20:80 conv 2 0.8 C D E
25:75 inf-mw 2 0.8 C D E
15:85 inf-mw 2 0.8 D E F
0:100 conv 2 0.7 E F G
15:85 conv 2 0.7 E F G
20:80 inf-mw 2 0.7 F G
5:95 conv 2 0.6 F G
10:90 conv 2 0.6 G
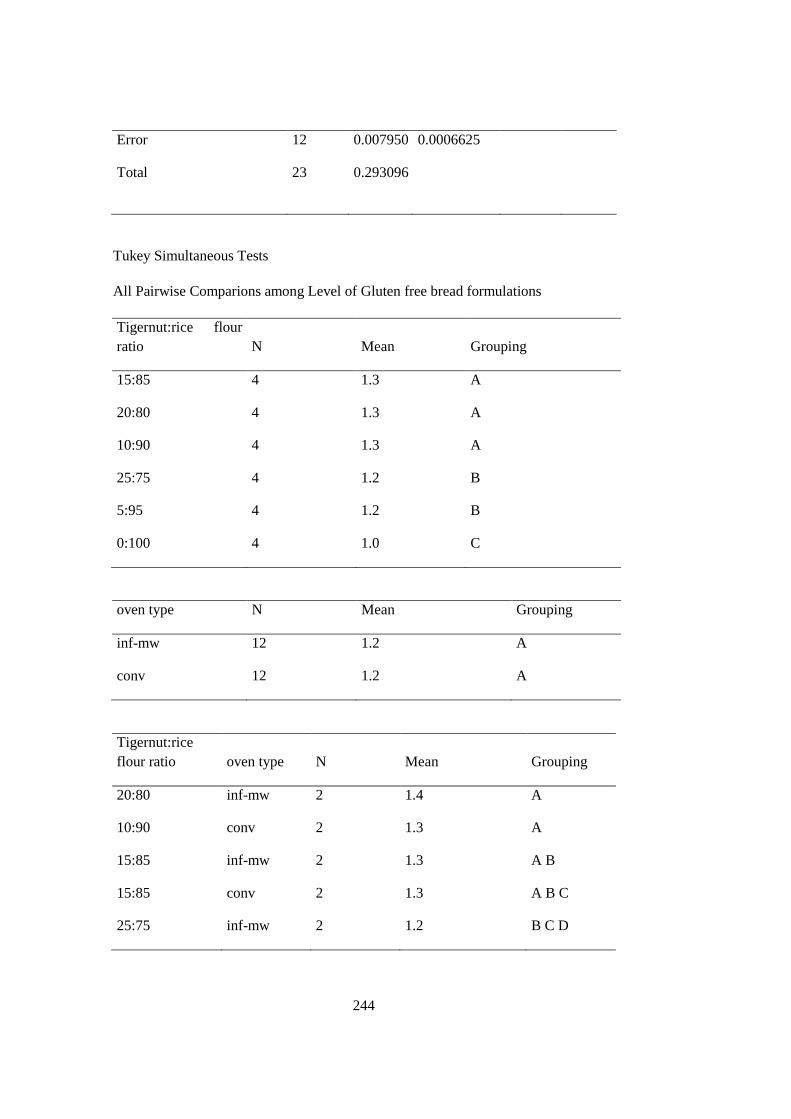
244
Error 12 0.007950 0.0006625
Total 23 0.293096
Tukey Simultaneous Tests
All Pairwise Comparions among Level of Gluten free bread formulations
Tigernut:rice flour
ratio N Mean Grouping
15:85 4 1.3 A
20:80 4 1.3 A
10:90 4 1.3 A
25:75 4 1.2 B
5:95 4 1.2 B
0:100 4 1.0 C
oven type N Mean Grouping
inf-mw 12 1.2 A
conv 12 1.2 A
Tigernut:rice
flour ratio oven type N Mean Grouping
20:80 inf-mw 2 1.4 A
10:90 conv 2 1.3 A
15:85 inf-mw 2 1.3 A B
15:85 conv 2 1.3 A B C
25:75 inf-mw 2 1.2 B C D
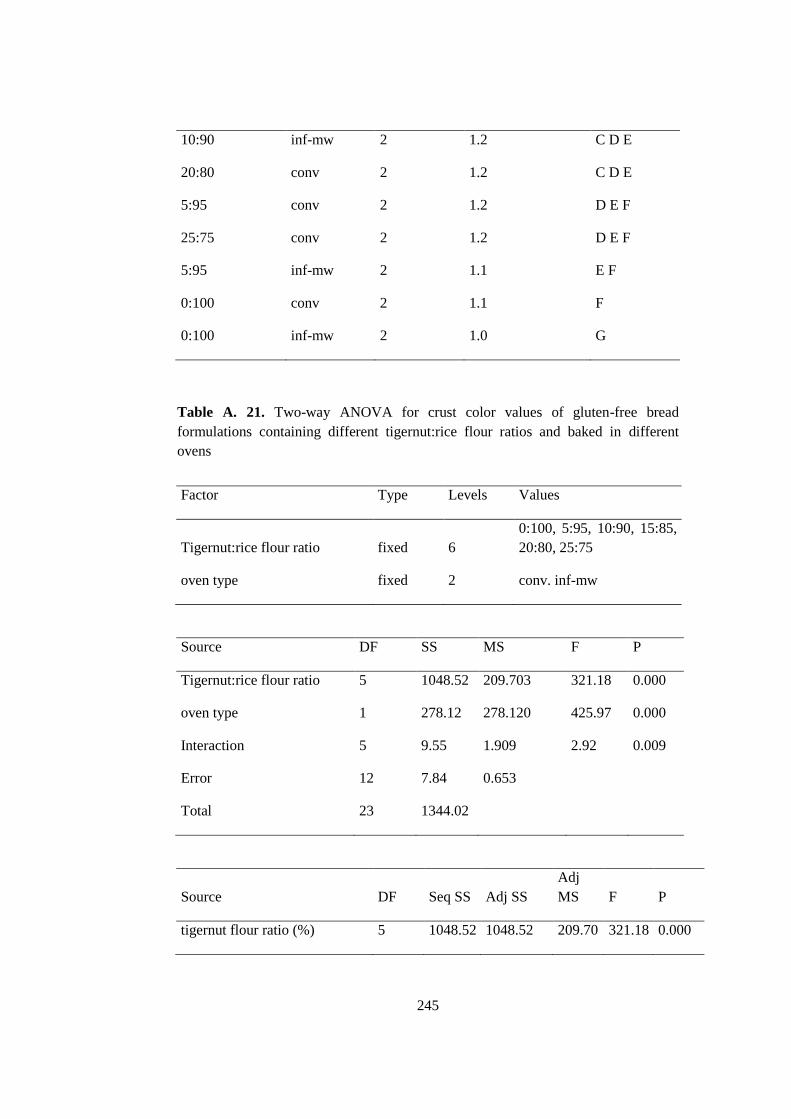
245
10:90 inf-mw 2 1.2 C D E
20:80 conv 2 1.2 C D E
5:95 conv 2 1.2 D E F
25:75 conv 2 1.2 D E F
5:95 inf-mw 2 1.1 E F
0:100 conv 2 1.1 F
0:100 inf-mw 2 1.0 G
Table A. 21. Two-way ANOVA for crust color values of gluten-free bread
formulations containing different tigernut:rice flour ratios and baked in different
ovens
Factor Type Levels Values
Tigernut:rice flour ratio fixed 6
0:100, 5:95, 10:90, 15:85,
20:80, 25:75
oven type fixed 2 conv. inf-mw
Source DF SS MS F P
Tigernut:rice flour ratio 5 1048.52 209.703 321.18 0.000
oven type 1 278.12 278.120 425.97 0.000
Interaction 5 9.55 1.909 2.92 0.009
Error 12 7.84 0.653
Total 23 1344.02
Source DF Seq SS Adj SS
Adj
MS F P
tigernut flour ratio (%) 5 1048.52 1048.52 209.70 321.18 0.000
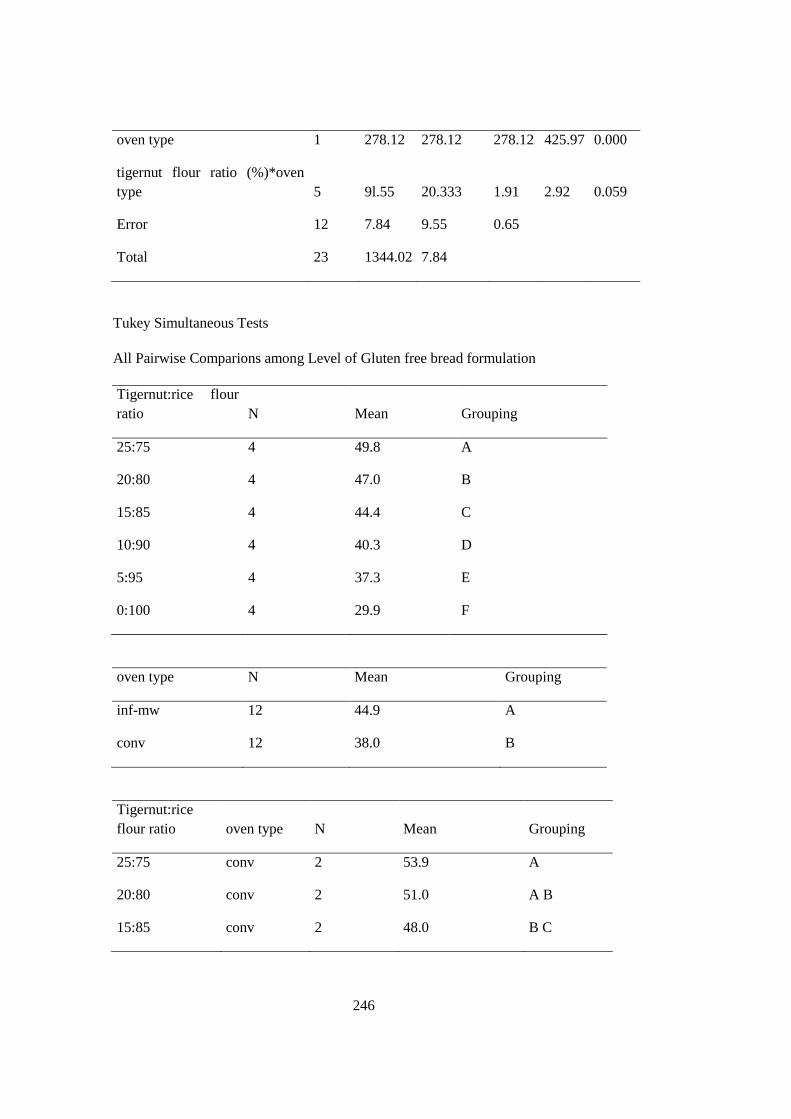
246
oven type 1 278.12 278.12 278.12 425.97 0.000
tigernut flour ratio (%)*oven
type 5 9l.55 20.333 1.91 2.92 0.059
Error 12 7.84 9.55 0.65
Total 23 1344.02 7.84
Tukey Simultaneous Tests
All Pairwise Comparions among Level of Gluten free bread formulation
Tigernut:rice flour
ratio N Mean Grouping
25:75 4 49.8 A
20:80 4 47.0 B
15:85 4 44.4 C
10:90 4 40.3 D
5:95 4 37.3 E
0:100 4 29.9 F
oven type N Mean Grouping
inf-mw 12 44.9 A
conv 12 38.0 B
Tigernut:rice
flour ratio oven type N Mean Grouping
25:75 conv 2 53.9 A
20:80 conv 2 51.0 A B
15:85 conv 2 48.0 B C
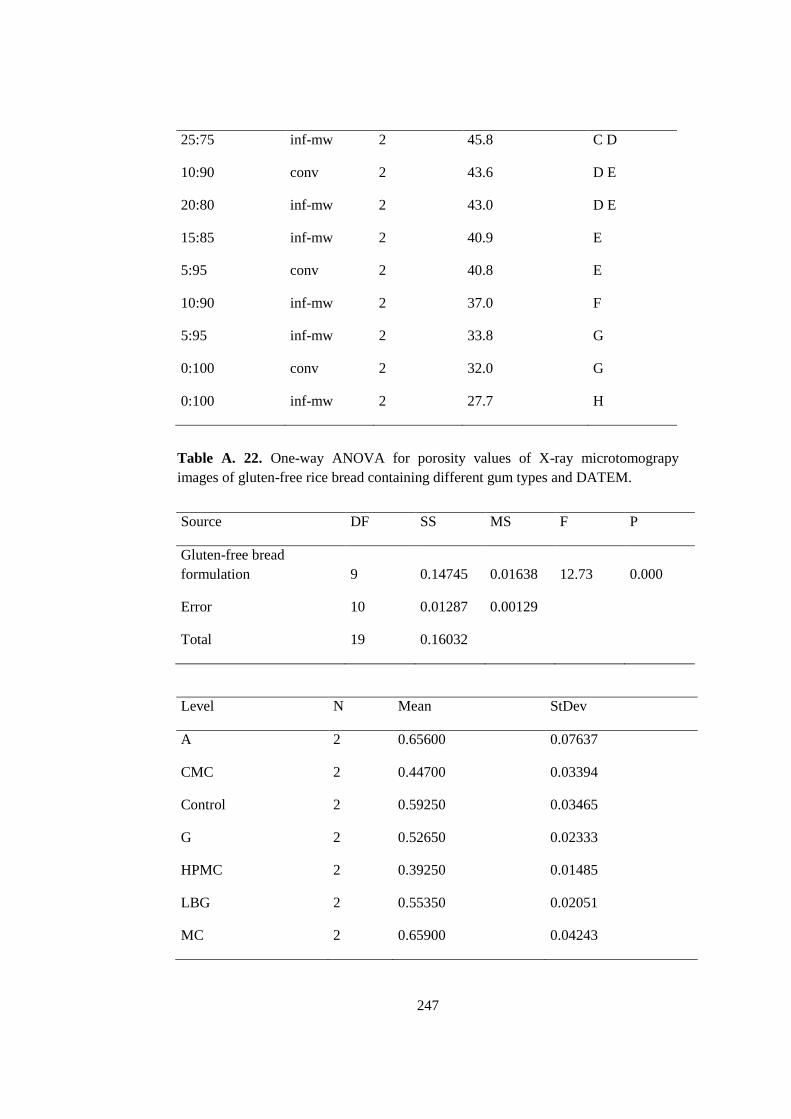
247
25:75 inf-mw 2 45.8 C D
10:90 conv 2 43.6 D E
20:80 inf-mw 2 43.0 D E
15:85 inf-mw 2 40.9 E
5:95 conv 2 40.8 E
10:90 inf-mw 2 37.0 F
5:95 inf-mw 2 33.8 G
0:100 conv 2 32.0 G
0:100 inf-mw 2 27.7 H
Table A. 22. One-way ANOVA for porosity values of X-ray microtomograpy
images of gluten-free rice bread containing different gum types and DATEM.
Source DF SS MS F P
Gluten-free bread
formulation 9 0.14745 0.01638 12.73 0.000
Error 10 0.01287 0.00129
Total 19 0.16032
Level N Mean StDev
A 2 0.65600 0.07637
CMC 2 0.44700 0.03394
Control 2 0.59250 0.03465
G 2 0.52650 0.02333
HPMC 2 0.39250 0.01485
LBG 2 0.55350 0.02051
MC 2 0.65900 0.04243
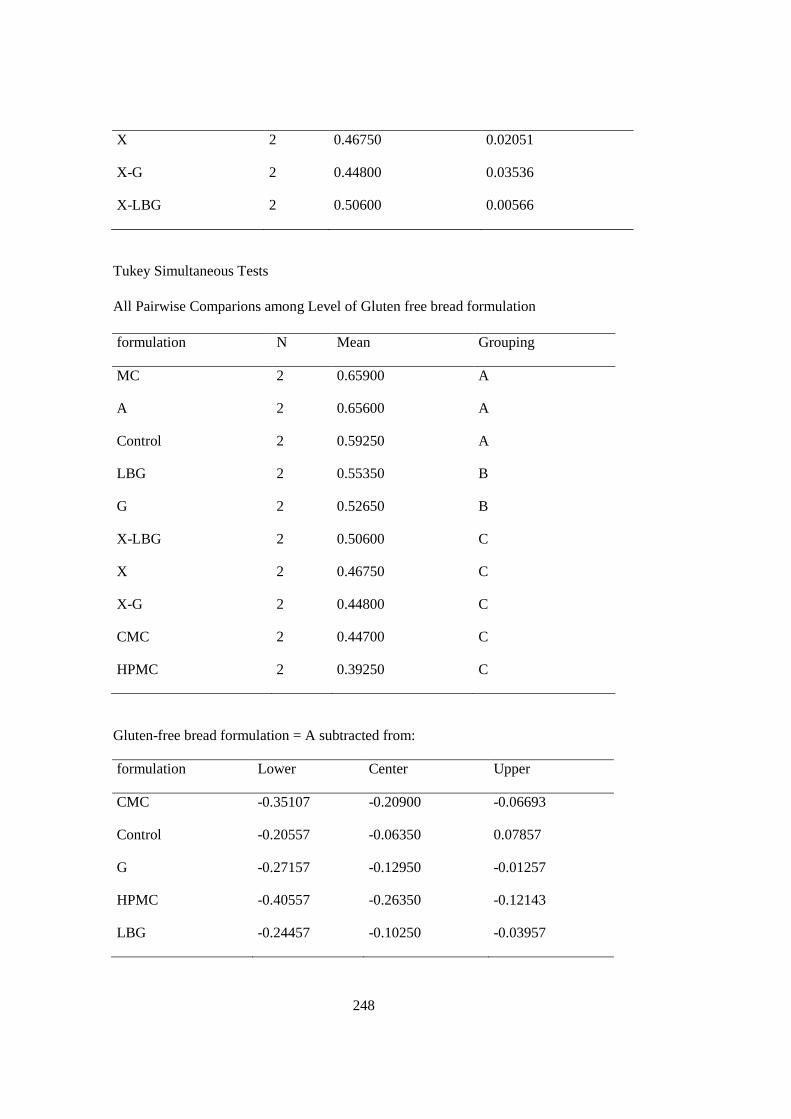
248
X 2 0.46750 0.02051
X-G 2 0.44800 0.03536
X-LBG 2 0.50600 0.00566
Tukey Simultaneous Tests
All Pairwise Comparions among Level of Gluten free bread formulation
formulation N Mean Grouping
MC 2 0.65900 A
A 2 0.65600 A
Control 2 0.59250 A
LBG 2 0.55350 B
G 2 0.52650 B
X-LBG 2 0.50600 C
X 2 0.46750 C
X-G 2 0.44800 C
CMC 2 0.44700 C
HPMC 2 0.39250 C
Gluten-free bread formulation = A subtracted from:
formulation Lower Center Upper
CMC -0.35107 -0.20900 -0.06693
Control -0.20557 -0.06350 0.07857
G -0.27157 -0.12950 -0.01257
HPMC -0.40557 -0.26350 -0.12143
LBG -0.24457 -0.10250 -0.03957
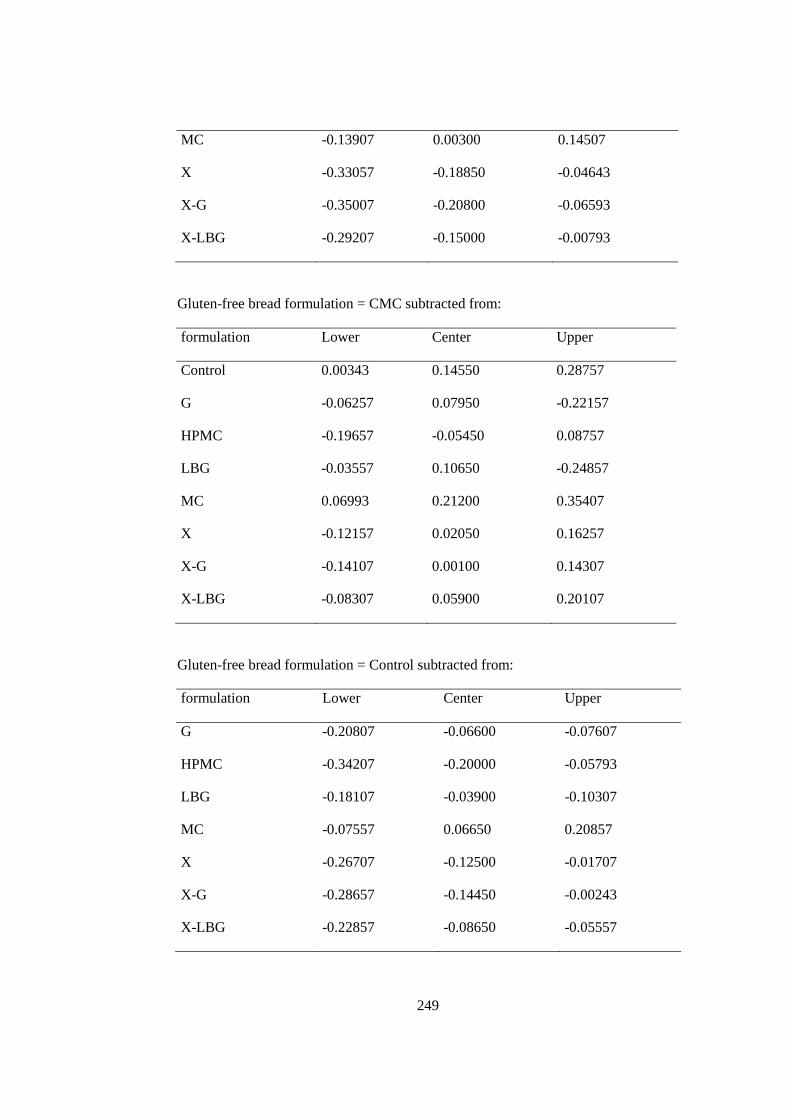
249
MC -0.13907 0.00300 0.14507
X -0.33057 -0.18850 -0.04643
X-G -0.35007 -0.20800 -0.06593
X-LBG -0.29207 -0.15000 -0.00793
Gluten-free bread formulation = CMC subtracted from:
formulation Lower Center Upper
Control 0.00343 0.14550 0.28757
G -0.06257 0.07950 -0.22157
HPMC -0.19657 -0.05450 0.08757
LBG -0.03557 0.10650 -0.24857
MC 0.06993 0.21200 0.35407
X -0.12157 0.02050 0.16257
X-G -0.14107 0.00100 0.14307
X-LBG -0.08307 0.05900 0.20107
Gluten-free bread formulation = Control subtracted from:
formulation Lower Center Upper
G -0.20807 -0.06600 -0.07607
HPMC -0.34207 -0.20000 -0.05793
LBG -0.18107 -0.03900 -0.10307
MC -0.07557 0.06650 0.20857
X -0.26707 -0.12500 -0.01707
X-G -0.28657 -0.14450 -0.00243
X-LBG -0.22857 -0.08650 -0.05557
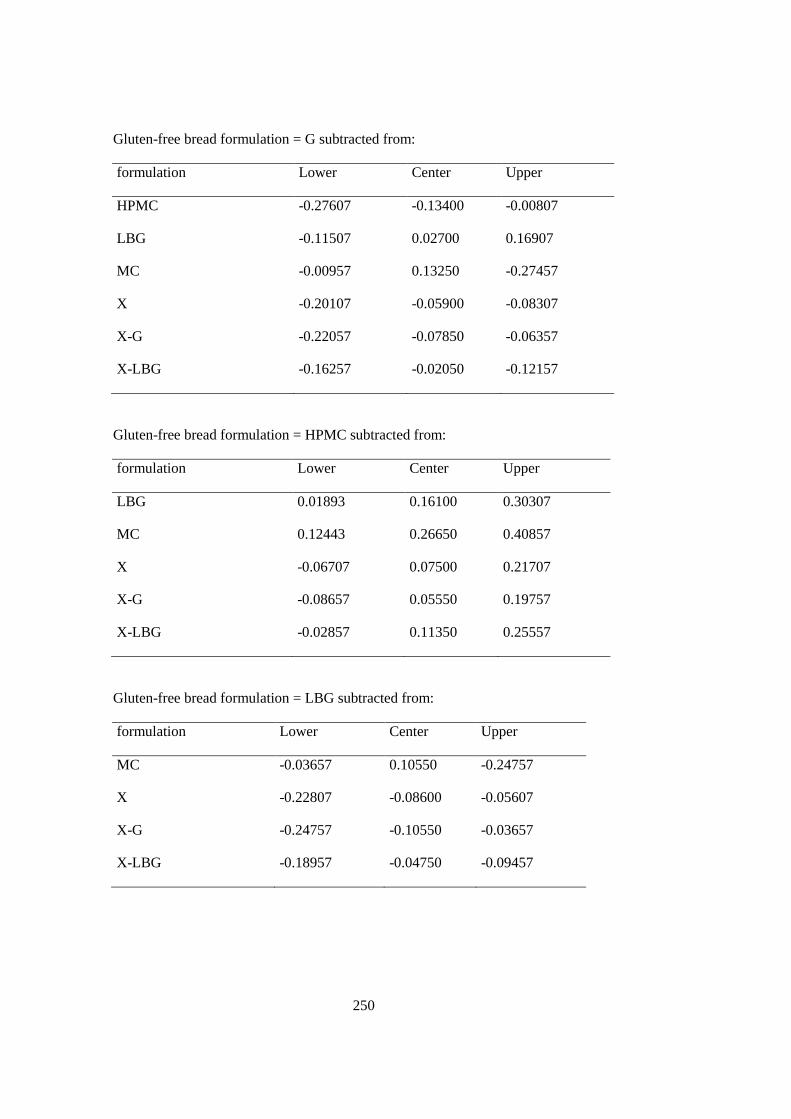
250
Gluten-free bread formulation = G subtracted from:
formulation Lower Center Upper
HPMC -0.27607 -0.13400 -0.00807
LBG -0.11507 0.02700 0.16907
MC -0.00957 0.13250 -0.27457
X -0.20107 -0.05900 -0.08307
X-G -0.22057 -0.07850 -0.06357
X-LBG -0.16257 -0.02050 -0.12157
Gluten-free bread formulation = HPMC subtracted from:
formulation Lower Center Upper
LBG 0.01893 0.16100 0.30307
MC 0.12443 0.26650 0.40857
X -0.06707 0.07500 0.21707
X-G -0.08657 0.05550 0.19757
X-LBG -0.02857 0.11350 0.25557
Gluten-free bread formulation = LBG subtracted from:
formulation Lower Center Upper
MC -0.03657 0.10550 -0.24757
X -0.22807 -0.08600 -0.05607
X-G -0.24757 -0.10550 -0.03657
X-LBG -0.18957 -0.04750 -0.09457
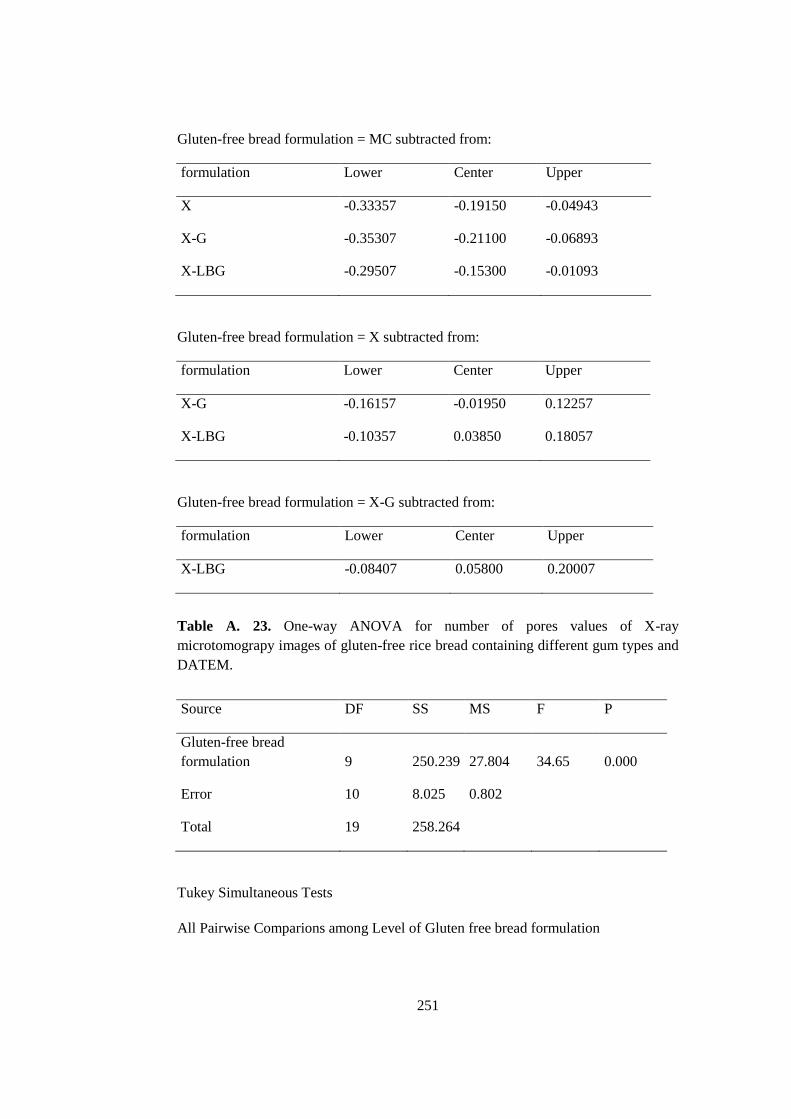
251
Gluten-free bread formulation = MC subtracted from:
formulation Lower Center Upper
X -0.33357 -0.19150 -0.04943
X-G -0.35307 -0.21100 -0.06893
X-LBG -0.29507 -0.15300 -0.01093
Gluten-free bread formulation = X subtracted from:
formulation Lower Center Upper
X-G -0.16157 -0.01950 0.12257
X-LBG -0.10357 0.03850 0.18057
Gluten-free bread formulation = X-G subtracted from:
formulation Lower Center Upper
X-LBG -0.08407 0.05800 0.20007
Table A. 23. One-way ANOVA for number of pores values of X-ray
microtomograpy images of gluten-free rice bread containing different gum types and
DATEM.
Source DF SS MS F P
Gluten-free bread
formulation 9 250.239 27.804 34.65 0.000
Error 10 8.025 0.802
Total 19 258.264
Tukey Simultaneous Tests
All Pairwise Comparions among Level of Gluten free bread formulation
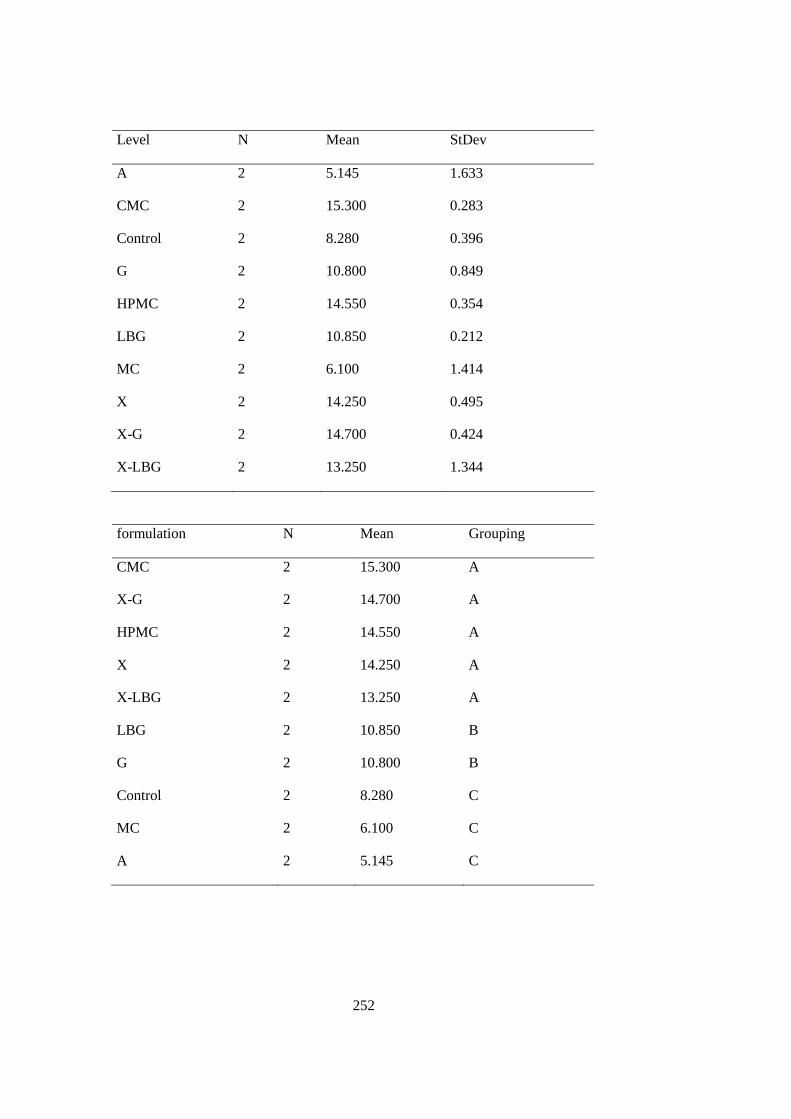
252
Level N Mean StDev
A 2 5.145 1.633
CMC 2 15.300 0.283
Control 2 8.280 0.396
G 2 10.800 0.849
HPMC 2 14.550 0.354
LBG 2 10.850 0.212
MC 2 6.100 1.414
X 2 14.250 0.495
X-G 2 14.700 0.424
X-LBG 2 13.250 1.344
formulation N Mean Grouping
CMC 2 15.300 A
X-G 2 14.700 A
HPMC 2 14.550 A
X 2 14.250 A
X-LBG 2 13.250 A
LBG 2 10.850 B
G 2 10.800 B
Control 2 8.280 C
MC 2 6.100 C
A 2 5.145 C
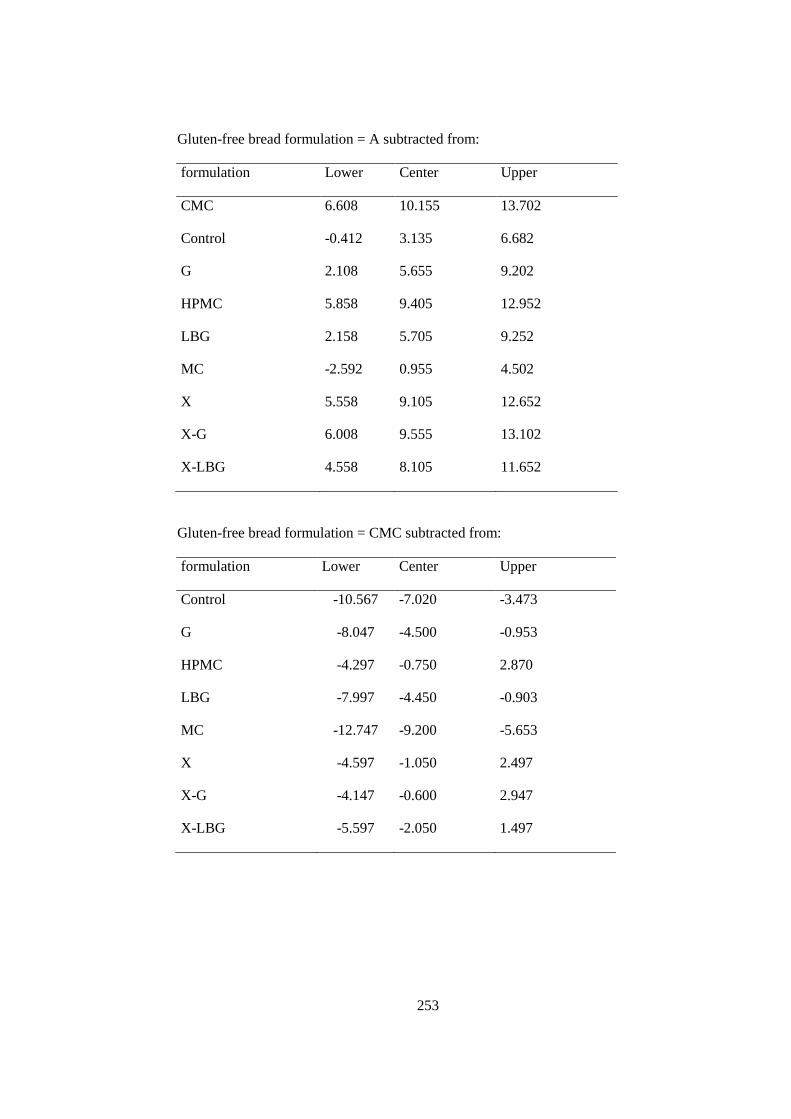
253
Gluten-free bread formulation = A subtracted from:
formulation Lower Center Upper
CMC 6.608 10.155 13.702
Control -0.412 3.135 6.682
G 2.108 5.655 9.202
HPMC 5.858 9.405 12.952
LBG 2.158 5.705 9.252
MC -2.592 0.955 4.502
X 5.558 9.105 12.652
X-G 6.008 9.555 13.102
X-LBG 4.558 8.105 11.652
Gluten-free bread formulation = CMC subtracted from:
formulation Lower Center Upper
Control -10.567 -7.020 -3.473
G -8.047 -4.500 -0.953
HPMC -4.297 -0.750 2.870
LBG -7.997 -4.450 -0.903
MC -12.747 -9.200 -5.653
X -4.597 -1.050 2.497
X-G -4.147 -0.600 2.947
X-LBG -5.597 -2.050 1.497
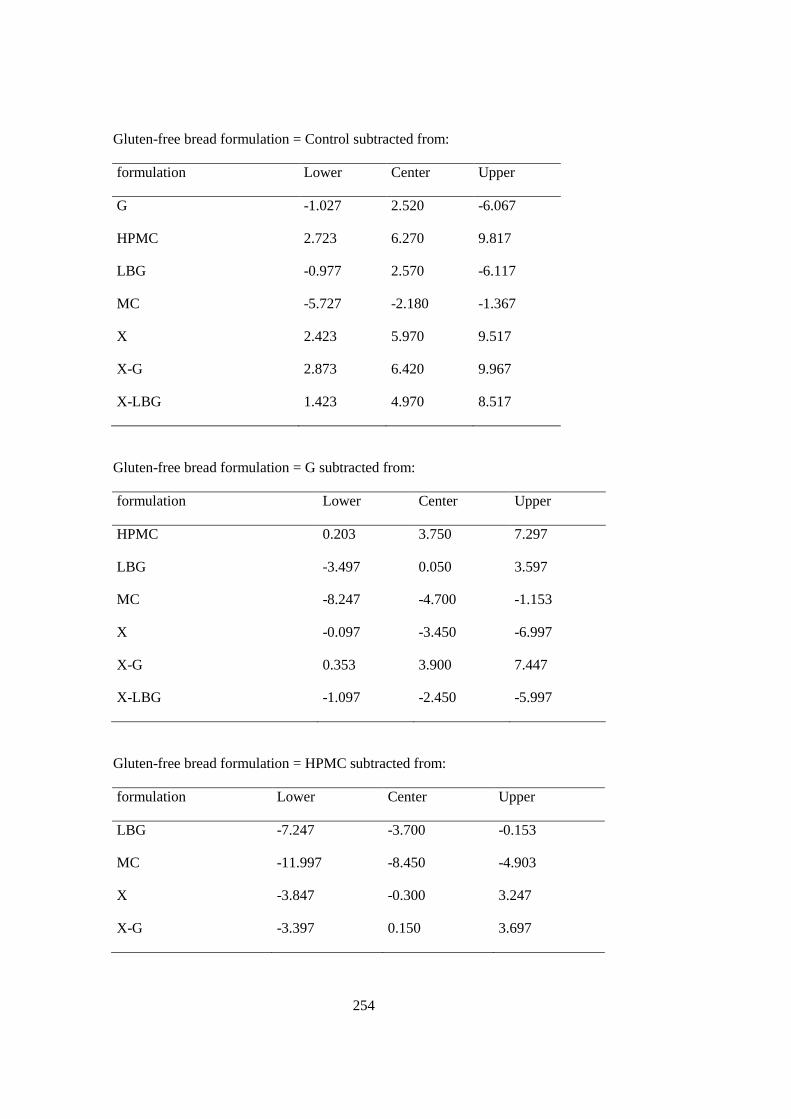
254
Gluten-free bread formulation = Control subtracted from:
formulation Lower Center Upper
G -1.027 2.520 -6.067
HPMC 2.723 6.270 9.817
LBG -0.977 2.570 -6.117
MC -5.727 -2.180 -1.367
X 2.423 5.970 9.517
X-G 2.873 6.420 9.967
X-LBG 1.423 4.970 8.517
Gluten-free bread formulation = G subtracted from:
formulation Lower Center Upper
HPMC 0.203 3.750 7.297
LBG -3.497 0.050 3.597
MC -8.247 -4.700 -1.153
X -0.097 -3.450 -6.997
X-G 0.353 3.900 7.447
X-LBG -1.097 -2.450 -5.997
Gluten-free bread formulation = HPMC subtracted from:
formulation Lower Center Upper
LBG -7.247 -3.700 -0.153
MC -11.997 -8.450 -4.903
X -3.847 -0.300 3.247
X-G -3.397 0.150 3.697
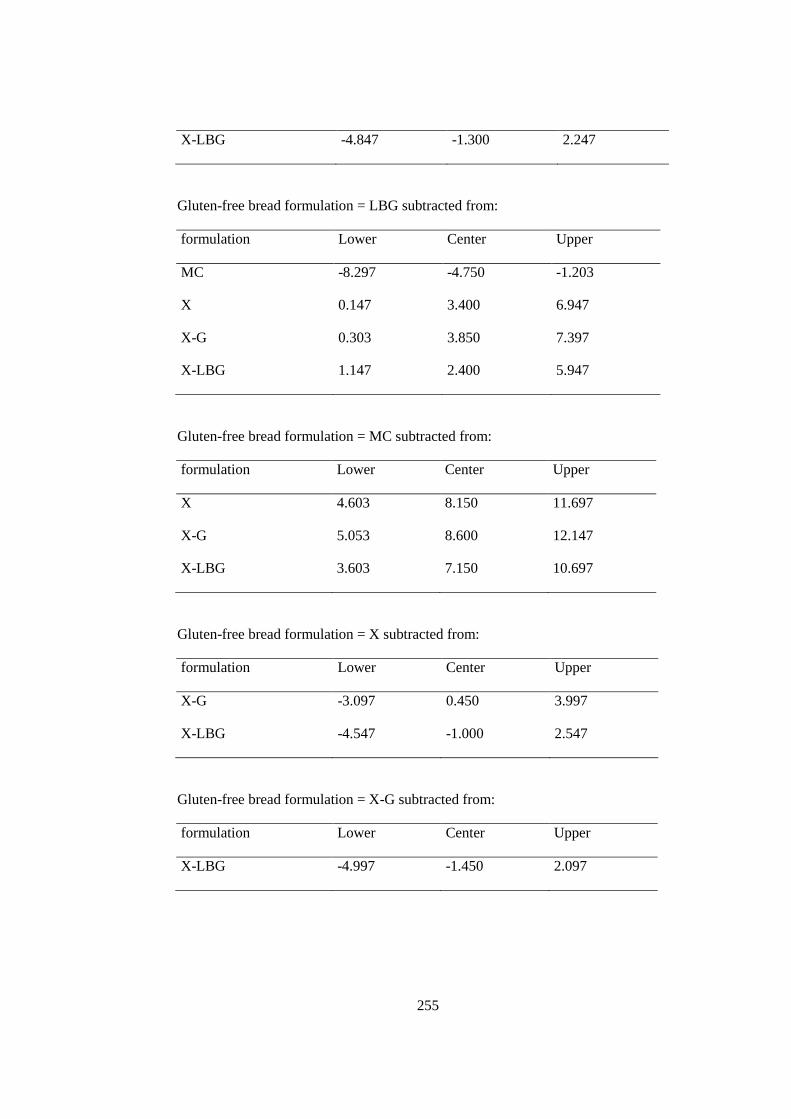
255
X-LBG -4.847 -1.300 2.247
Gluten-free bread formulation = LBG subtracted from:
formulation Lower Center Upper
MC -8.297 -4.750 -1.203
X 0.147 3.400 6.947
X-G 0.303 3.850 7.397
X-LBG 1.147 2.400 5.947
Gluten-free bread formulation = MC subtracted from:
formulation Lower Center Upper
X 4.603 8.150 11.697
X-G 5.053 8.600 12.147
X-LBG 3.603 7.150 10.697
Gluten-free bread formulation = X subtracted from:
formulation Lower Center Upper
X-G -3.097 0.450 3.997
X-LBG -4.547 -1.000 2.547
Gluten-free bread formulation = X-G subtracted from:
formulation Lower Center Upper
X-LBG -4.997 -1.450 2.097
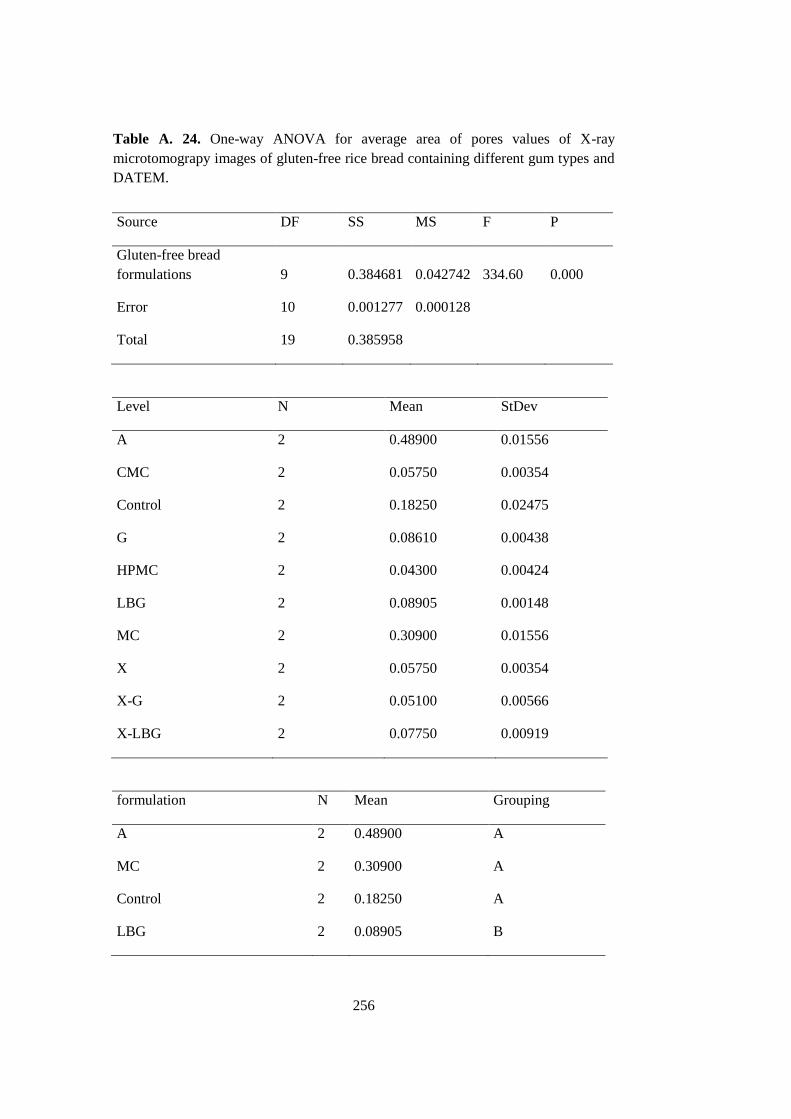
256
Table A. 24. One-way ANOVA for average area of pores values of X-ray
microtomograpy images of gluten-free rice bread containing different gum types and
DATEM.
Source DF SS MS F P
Gluten-free bread
formulations 9 0.384681 0.042742 334.60 0.000
Error 10 0.001277 0.000128
Total 19 0.385958
Level N Mean StDev
A 2 0.48900 0.01556
CMC 2 0.05750 0.00354
Control 2 0.18250 0.02475
G 2 0.08610 0.00438
HPMC 2 0.04300 0.00424
LBG 2 0.08905 0.00148
MC 2 0.30900 0.01556
X 2 0.05750 0.00354
X-G 2 0.05100 0.00566
X-LBG 2 0.07750 0.00919
formulation N Mean Grouping
A 2 0.48900 A
MC 2 0.30900 A
Control 2 0.18250 A
LBG 2 0.08905 B
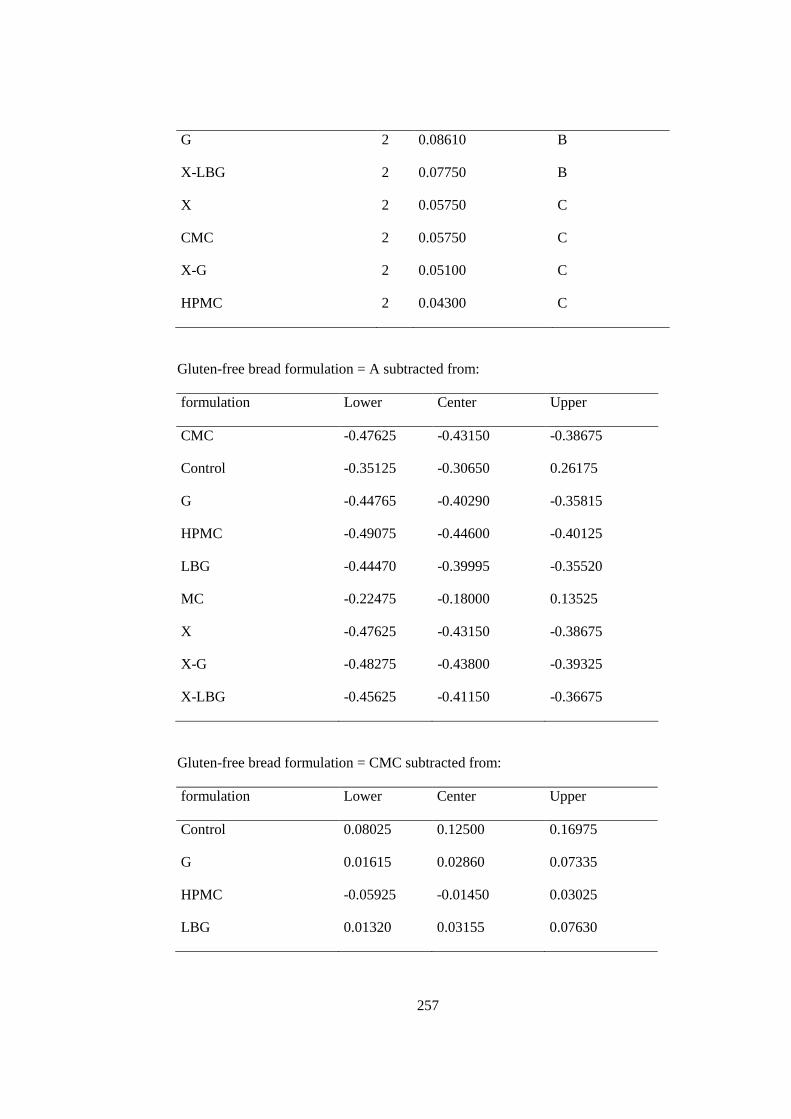
257
G 2 0.08610 B
X-LBG 2 0.07750 B
X 2 0.05750 C
CMC 2 0.05750 C
X-G 2 0.05100 C
HPMC 2 0.04300 C
Gluten-free bread formulation = A subtracted from:
formulation Lower Center Upper
CMC -0.47625 -0.43150 -0.38675
Control -0.35125 -0.30650 0.26175
G -0.44765 -0.40290 -0.35815
HPMC -0.49075 -0.44600 -0.40125
LBG -0.44470 -0.39995 -0.35520
MC -0.22475 -0.18000 0.13525
X -0.47625 -0.43150 -0.38675
X-G -0.48275 -0.43800 -0.39325
X-LBG -0.45625 -0.41150 -0.36675
Gluten-free bread formulation = CMC subtracted from:
formulation Lower Center Upper
Control 0.08025 0.12500 0.16975
G 0.01615 0.02860 0.07335
HPMC -0.05925 -0.01450 0.03025
LBG 0.01320 0.03155 0.07630
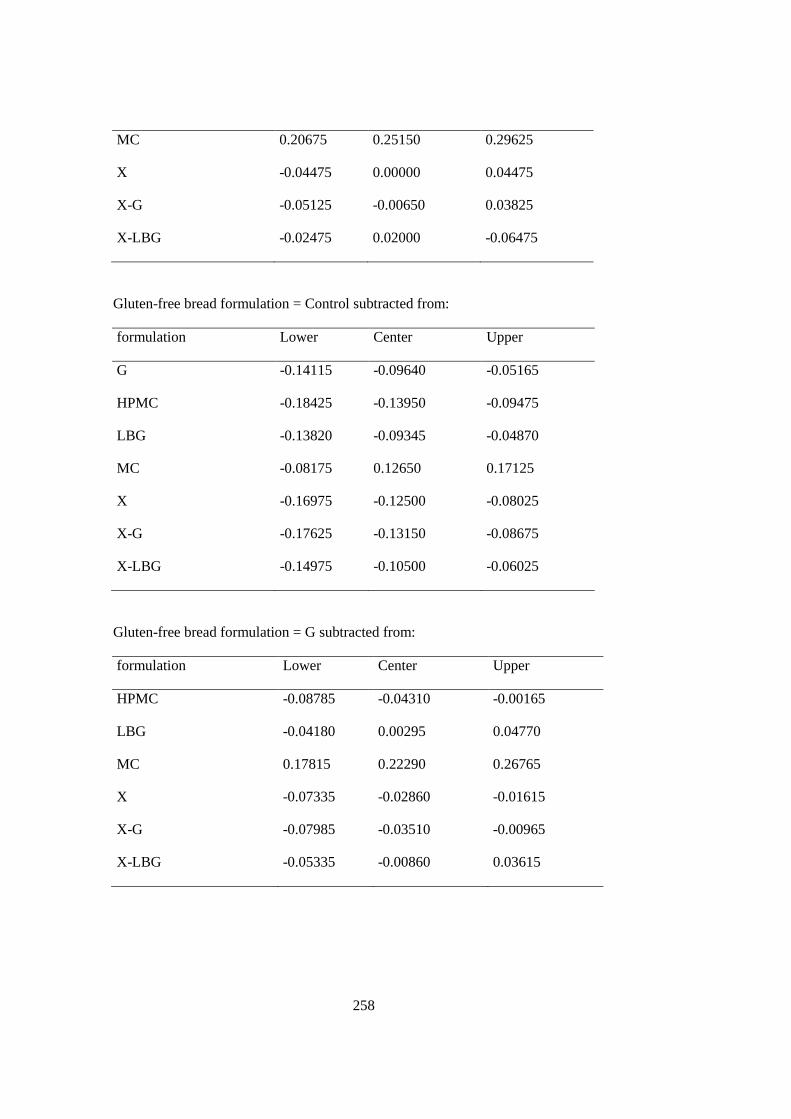
258
MC 0.20675 0.25150 0.29625
X -0.04475 0.00000 0.04475
X-G -0.05125 -0.00650 0.03825
X-LBG -0.02475 0.02000 -0.06475
Gluten-free bread formulation = Control subtracted from:
formulation Lower Center Upper
G -0.14115 -0.09640 -0.05165
HPMC -0.18425 -0.13950 -0.09475
LBG -0.13820 -0.09345 -0.04870
MC -0.08175 0.12650 0.17125
X -0.16975 -0.12500 -0.08025
X-G -0.17625 -0.13150 -0.08675
X-LBG -0.14975 -0.10500 -0.06025
Gluten-free bread formulation = G subtracted from:
formulation Lower Center Upper
HPMC -0.08785 -0.04310 -0.00165
LBG -0.04180 0.00295 0.04770
MC 0.17815 0.22290 0.26765
X -0.07335 -0.02860 -0.01615
X-G -0.07985 -0.03510 -0.00965
X-LBG -0.05335 -0.00860 0.03615
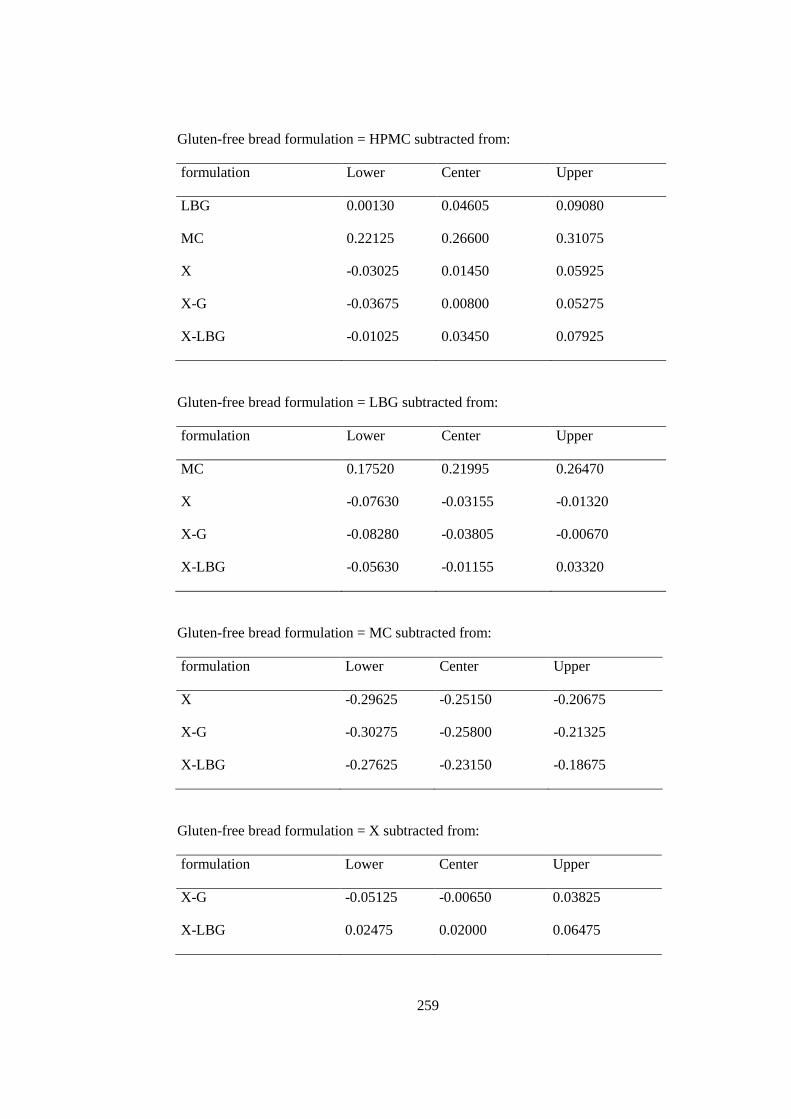
259
Gluten-free bread formulation = HPMC subtracted from:
formulation Lower Center Upper
LBG 0.00130 0.04605 0.09080
MC 0.22125 0.26600 0.31075
X -0.03025 0.01450 0.05925
X-G -0.03675 0.00800 0.05275
X-LBG -0.01025 0.03450 0.07925
Gluten-free bread formulation = LBG subtracted from:
formulation Lower Center Upper
MC 0.17520 0.21995 0.26470
X -0.07630 -0.03155 -0.01320
X-G -0.08280 -0.03805 -0.00670
X-LBG -0.05630 -0.01155 0.03320
Gluten-free bread formulation = MC subtracted from:
formulation Lower Center Upper
X -0.29625 -0.25150 -0.20675
X-G -0.30275 -0.25800 -0.21325
X-LBG -0.27625 -0.23150 -0.18675
Gluten-free bread formulation = X subtracted from:
formulation Lower Center Upper
X-G -0.05125 -0.00650 0.03825
X-LBG 0.02475 0.02000 0.06475

260
Gluten-free bread formulation = X-G subtracted from:
formulation Lower Center Upper
X-LBG 0.01825 0.02650 0.07125
Table A. 25. One-way ANOVA for aspect ratio values of pores of X-ray
microtomograpy images of gluten-free rice bread containing different gum types and
DATEM.
Source DF SS MS F P
Gluten-free bread
formulation 9 0.0117 0.0013 0.11 0.999
Error 10 0.1170 0.0117
Total 19 0.1287
Level N Mean StDev
A 2 1.7615 0.0544
CMC 2 1.7675 0.0955
Control 2 1.7400 0.0990
G 2 1.8110 0.1853
HPMC 2 1.7970 0.0240
LBG 2 1.7645 0.2044
MC 2 1.7910 0.0127
X 2 1.8075 0.0389
X-G 2 1.8025 0.0742
X-LBG 2 1.8150 0.1061
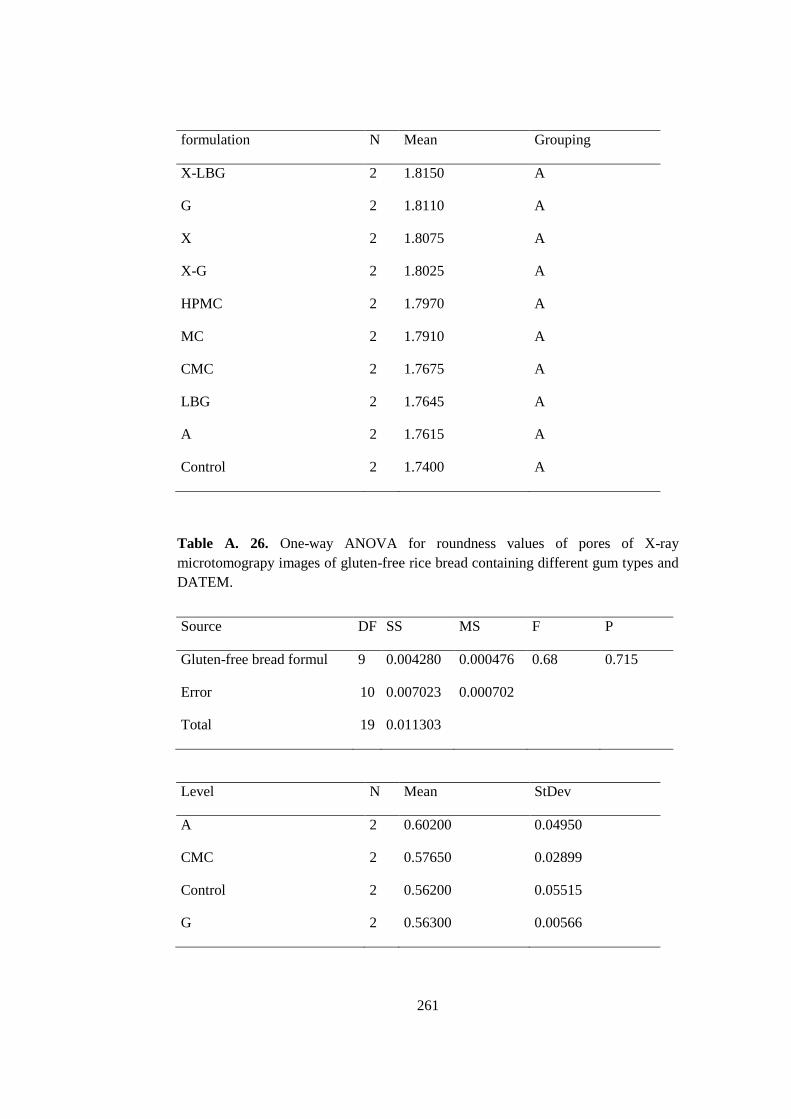
261
formulation N Mean Grouping
X-LBG 2 1.8150 A
G 2 1.8110 A
X 2 1.8075 A
X-G 2 1.8025 A
HPMC 2 1.7970 A
MC 2 1.7910 A
CMC 2 1.7675 A
LBG 2 1.7645 A
A 2 1.7615 A
Control 2 1.7400 A
Table A. 26. One-way ANOVA for roundness values of pores of X-ray
microtomograpy images of gluten-free rice bread containing different gum types and
DATEM.
Source DF SS MS F P
Gluten-free bread formul 9 0.004280 0.000476 0.68 0.715
Error 10 0.007023 0.000702
Total 19 0.011303
Level N Mean StDev
A 2 0.60200 0.04950
CMC 2 0.57650 0.02899
Control 2 0.56200 0.05515
G 2 0.56300 0.00566
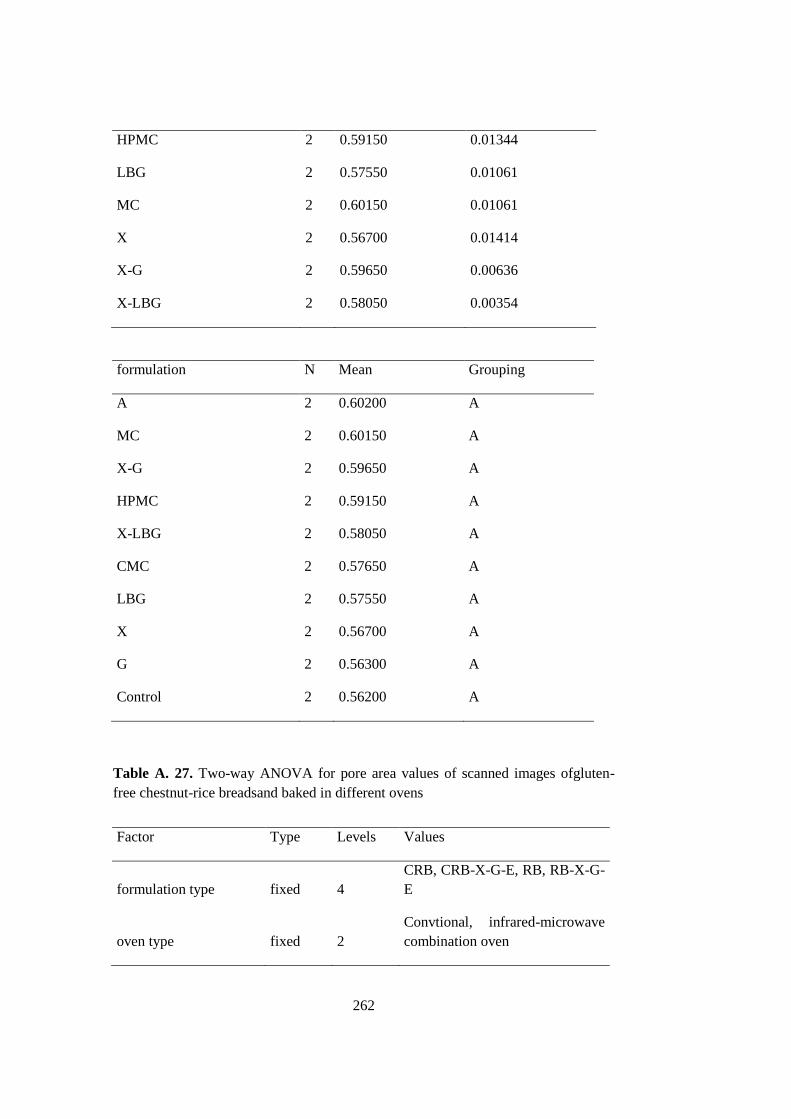
262
HPMC 2 0.59150 0.01344
LBG 2 0.57550 0.01061
MC 2 0.60150 0.01061
X 2 0.56700 0.01414
X-G 2 0.59650 0.00636
X-LBG 2 0.58050 0.00354
formulation N Mean Grouping
A 2 0.60200 A
MC 2 0.60150 A
X-G 2 0.59650 A
HPMC 2 0.59150 A
X-LBG 2 0.58050 A
CMC 2 0.57650 A
LBG 2 0.57550 A
X 2 0.56700 A
G 2 0.56300 A
Control 2 0.56200 A
Table A. 27. Two-way ANOVA for pore area values of scanned images ofgluten-
free chestnut-rice breadsand baked in different ovens
Factor Type Levels Values
formulation type fixed 4
CRB, CRB-X-G-E, RB, RB-X-G-
E
oven type fixed 2
Convtional, infrared-microwave
combination oven
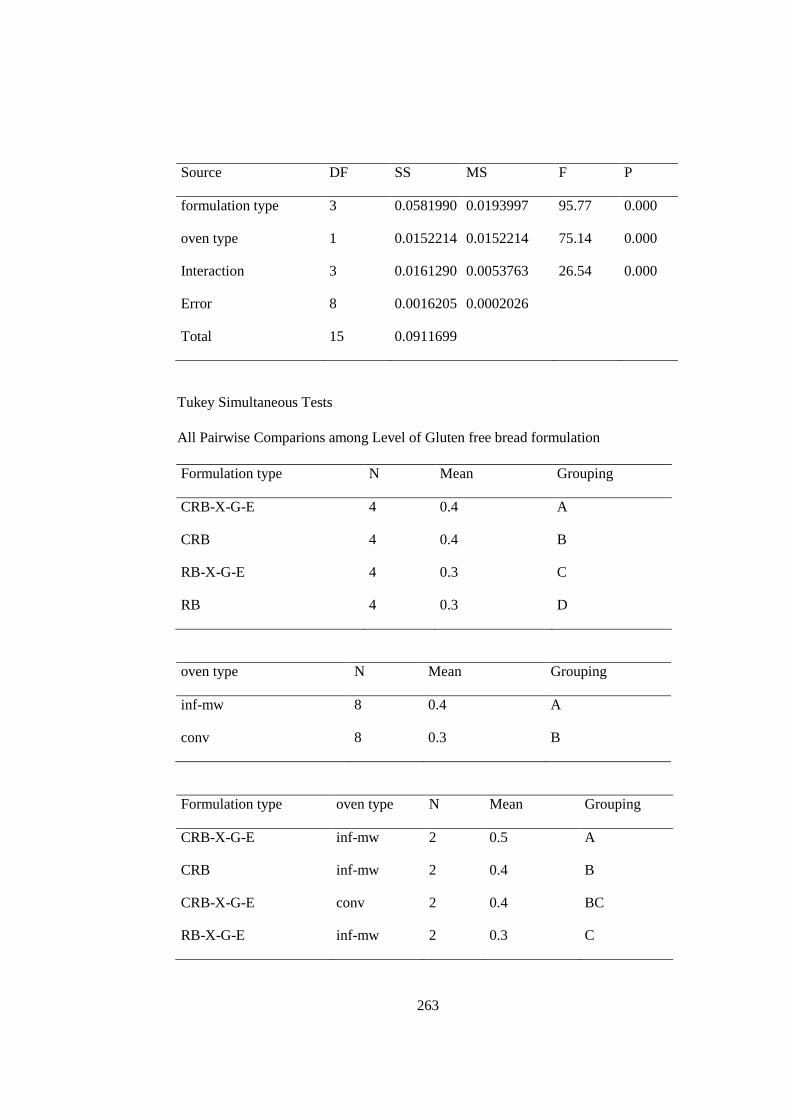
263
Source DF SS MS F P
formulation type 3 0.0581990 0.0193997 95.77 0.000
oven type 1 0.0152214 0.0152214 75.14 0.000
Interaction 3 0.0161290 0.0053763 26.54 0.000
Error 8 0.0016205 0.0002026
Total 15 0.0911699
Tukey Simultaneous Tests
All Pairwise Comparions among Level of Gluten free bread formulation
Formulation type N Mean Grouping
CRB-X-G-E 4 0.4 A
CRB 4 0.4 B
RB-X-G-E 4 0.3 C
RB 4 0.3 D
oven type N Mean Grouping
inf-mw 8 0.4 A
conv 8 0.3 B
Formulation type oven type N Mean Grouping
CRB-X-G-E inf-mw 2 0.5 A
CRB inf-mw 2 0.4 B
CRB-X-G-E conv 2 0.4 BC
RB-X-G-E inf-mw 2 0.3 C
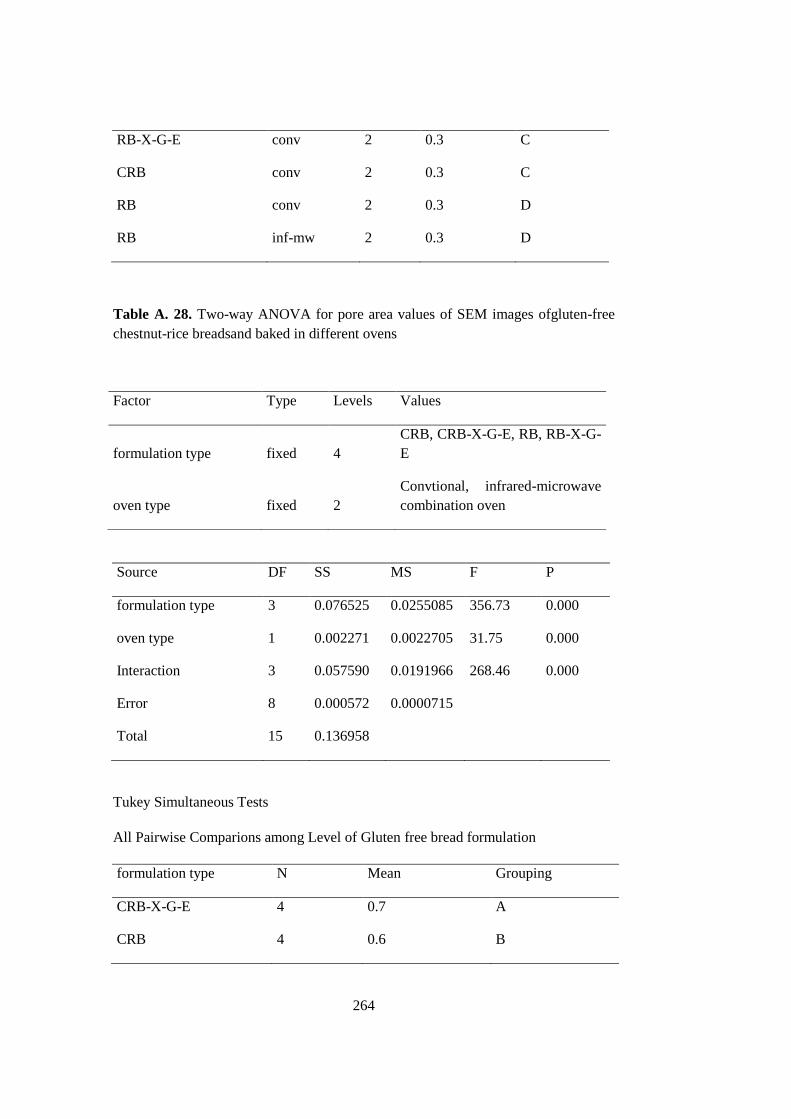
264
RB-X-G-E conv 2 0.3 C
CRB conv 2 0.3 C
RB conv 2 0.3 D
RB inf-mw 2 0.3 D
Table A. 28. Two-way ANOVA for pore area values of SEM images ofgluten-free
chestnut-rice breadsand baked in different ovens
Source DF SS MS F P
formulation type 3 0.076525 0.0255085 356.73 0.000
oven type 1 0.002271 0.0022705 31.75 0.000
Interaction 3 0.057590 0.0191966 268.46 0.000
Error 8 0.000572 0.0000715
Total 15 0.136958
Tukey Simultaneous Tests
All Pairwise Comparions among Level of Gluten free bread formulation
formulation type N Mean Grouping
CRB-X-G-E 4 0.7 A
CRB 4 0.6 B
Factor Type Levels Values
formulation type fixed 4
CRB, CRB-X-G-E, RB, RB-X-G-
E
oven type fixed 2
Convtional, infrared-microwave
combination oven
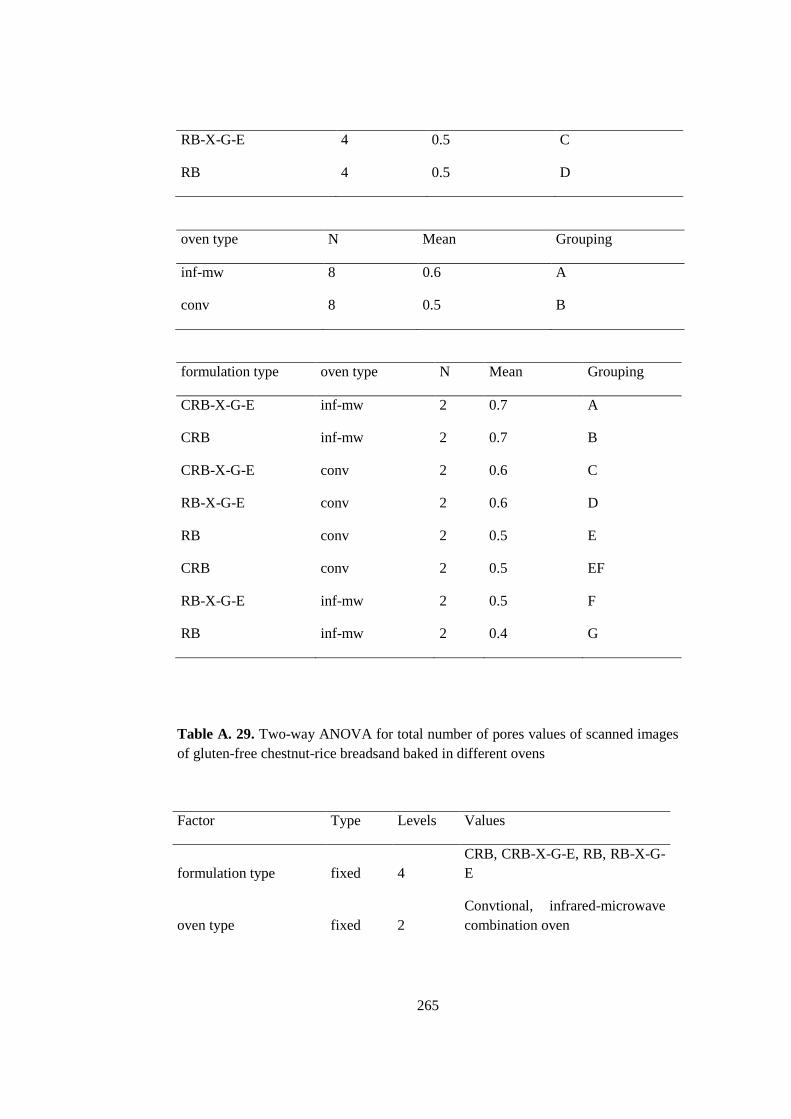
265
RB-X-G-E 4 0.5 C
RB 4 0.5 D
oven type N Mean Grouping
inf-mw 8 0.6 A
conv 8 0.5 B
formulation type oven type N Mean Grouping
CRB-X-G-E inf-mw 2 0.7 A
CRB inf-mw 2 0.7 B
CRB-X-G-E conv 2 0.6 C
RB-X-G-E conv 2 0.6 D
RB conv 2 0.5 E
CRB conv 2 0.5 EF
RB-X-G-E inf-mw 2 0.5 F
RB inf-mw 2 0.4 G
Table A. 29. Two-way ANOVA for total number of pores values of scanned images
of gluten-free chestnut-rice breadsand baked in different ovens
Factor Type Levels Values
formulation type fixed 4
CRB, CRB-X-G-E, RB, RB-X-G-
E
oven type fixed 2
Convtional, infrared-microwave
combination oven
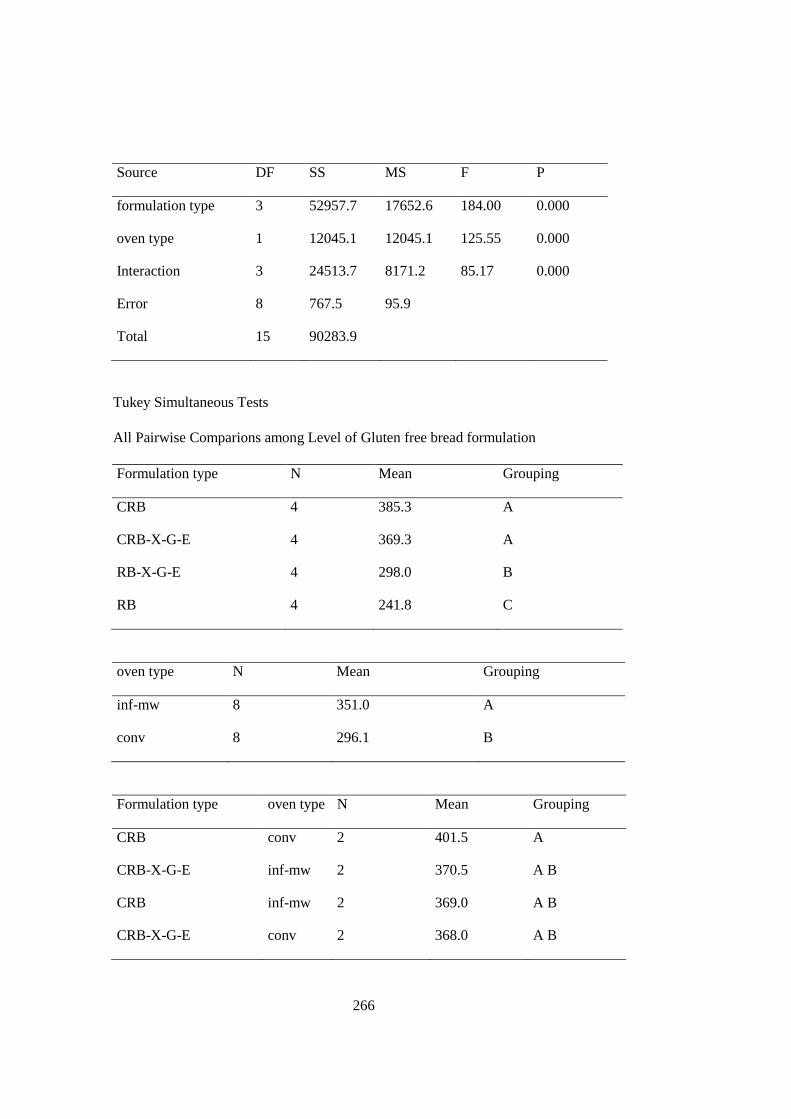
266
Source DF SS MS F P
formulation type 3 52957.7 17652.6 184.00 0.000
oven type 1 12045.1 12045.1 125.55 0.000
Interaction 3 24513.7 8171.2 85.17 0.000
Error 8 767.5 95.9
Total 15 90283.9
Tukey Simultaneous Tests
All Pairwise Comparions among Level of Gluten free bread formulation
Formulation type N Mean Grouping
CRB 4 385.3 A
CRB-X-G-E 4 369.3 A
RB-X-G-E 4 298.0 B
RB 4 241.8 C
oven type N Mean Grouping
inf-mw 8 351.0 A
conv 8 296.1 B
Formulation type oven type N Mean Grouping
CRB conv 2 401.5 A
CRB-X-G-E inf-mw 2 370.5 A B
CRB inf-mw 2 369.0 A B
CRB-X-G-E conv 2 368.0 A B
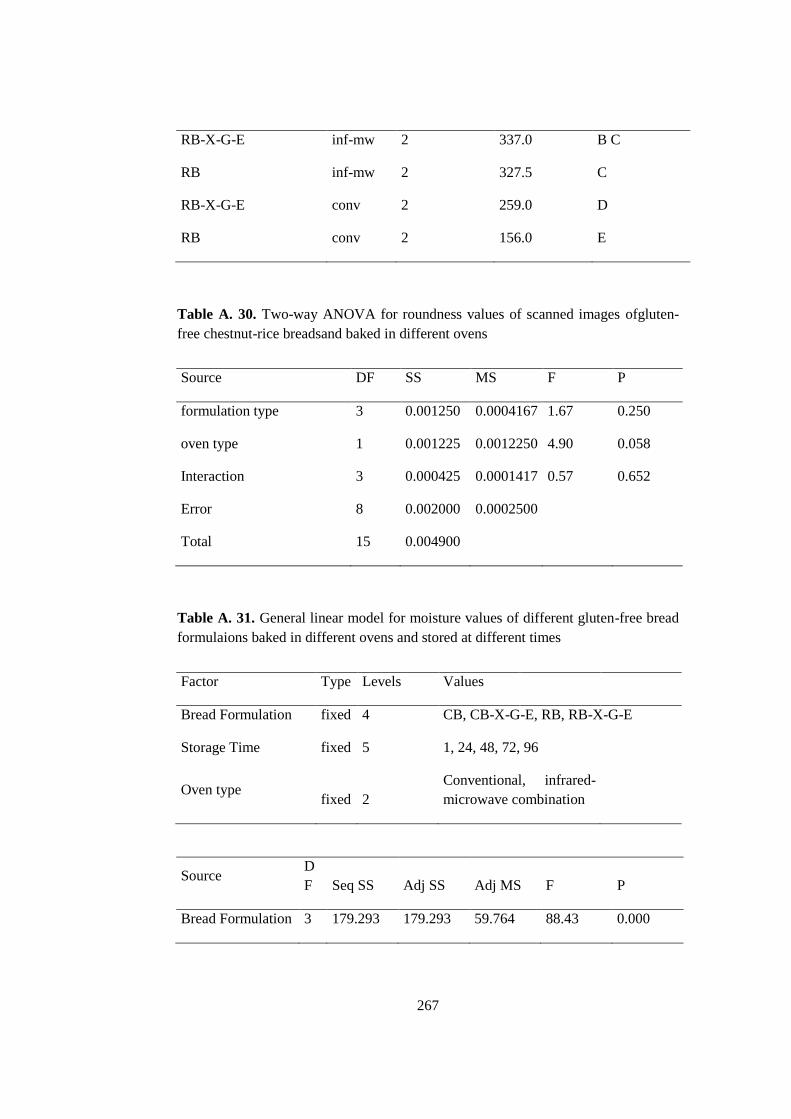
267
RB-X-G-E inf-mw 2 337.0 B C
RB inf-mw 2 327.5 C
RB-X-G-E conv 2 259.0 D
RB conv 2 156.0 E
Table A. 30. Two-way ANOVA for roundness values of scanned images ofgluten-
free chestnut-rice breadsand baked in different ovens
Source DF SS MS F P
formulation type 3 0.001250 0.0004167 1.67 0.250
oven type 1 0.001225 0.0012250 4.90 0.058
Interaction 3 0.000425 0.0001417 0.57 0.652
Error 8 0.002000 0.0002500
Total 15 0.004900
Table A. 31. General linear model for moisture values of different gluten-free bread
formulaions baked in different ovens and stored at different times
Factor Type Levels Values
Bread Formulation fixed 4 CB, CB-X-G-E, RB, RB-X-G-E
Storage Time fixed 5 1, 24, 48, 72, 96
Oven type
fixed 2
Conventional, infrared-
microwave combination
Source D
F Seq SS Adj SS Adj MS F P
Bread Formulation 3 179.293 179.293 59.764 88.43 0.000
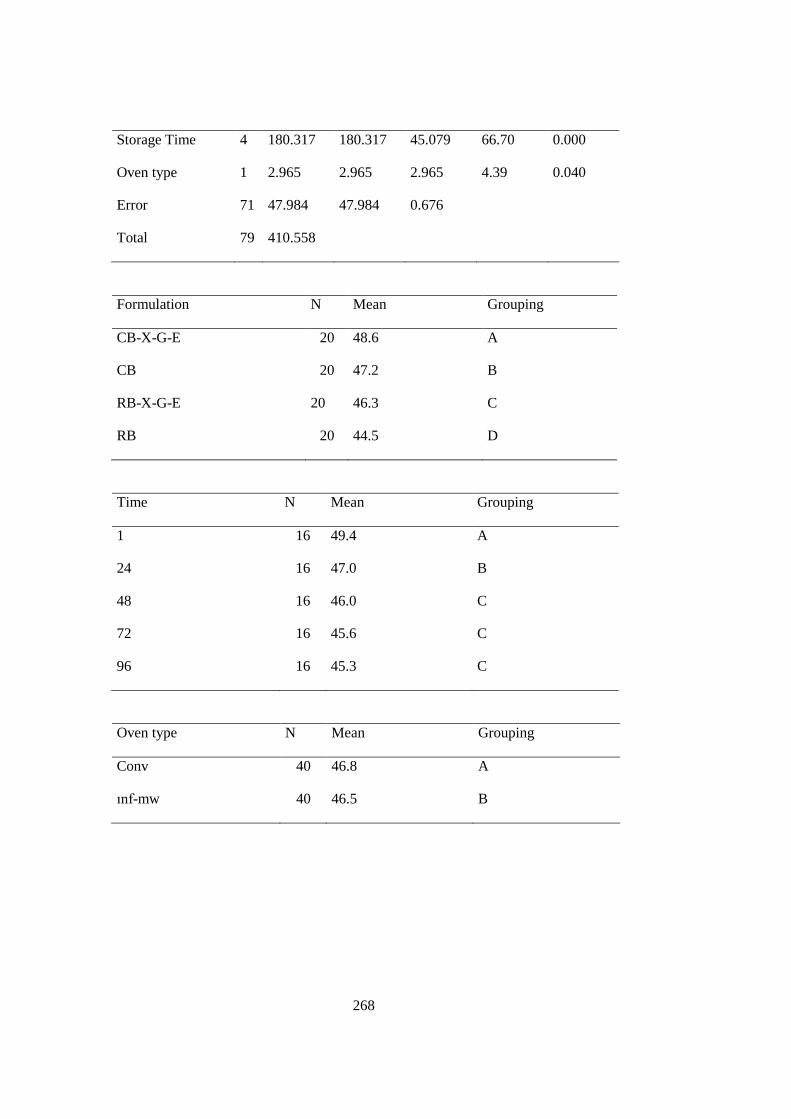
268
Storage Time 4 180.317 180.317 45.079 66.70 0.000
Oven type 1 2.965 2.965 2.965 4.39 0.040
Error 71 47.984 47.984 0.676
Total 79 410.558
Formulation N Mean Grouping
CB-X-G-E 20 48.6 A
CB 20 47.2 B
RB-X-G-E 20 46.3 C
RB 20 44.5 D
Time N Mean Grouping
1 16 49.4 A
24 16 47.0 B
48 16 46.0 C
72 16 45.6 C
96 16 45.3 C
Oven type N Mean Grouping
Conv 40 46.8 A
ınf-mw 40 46.5 B
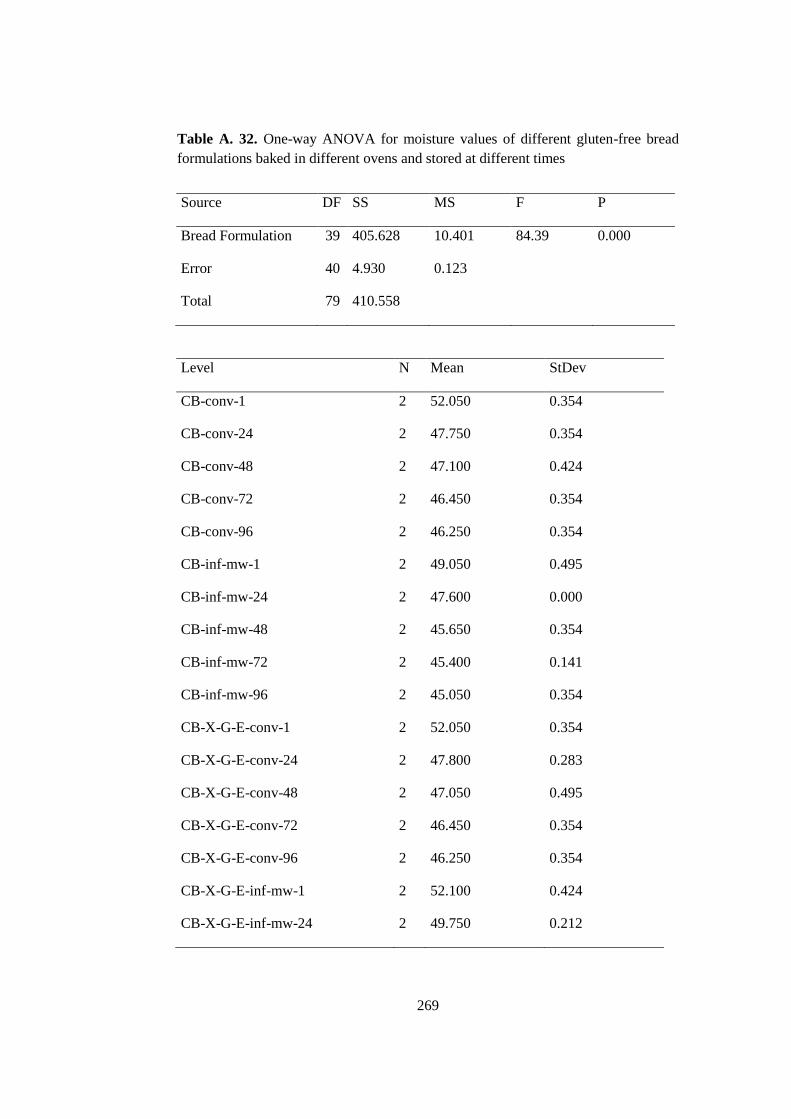
269
Table A. 32. One-way ANOVA for moisture values of different gluten-free bread
formulations baked in different ovens and stored at different times
Source DF SS MS F P
Bread Formulation 39 405.628 10.401 84.39 0.000
Error 40 4.930 0.123
Total 79 410.558
Level N Mean StDev
CB-conv-1 2 52.050 0.354
CB-conv-24 2 47.750 0.354
CB-conv-48 2 47.100 0.424
CB-conv-72 2 46.450 0.354
CB-conv-96 2 46.250 0.354
CB-inf-mw-1 2 49.050 0.495
CB-inf-mw-24 2 47.600 0.000
CB-inf-mw-48 2 45.650 0.354
CB-inf-mw-72 2 45.400 0.141
CB-inf-mw-96 2 45.050 0.354
CB-X-G-E-conv-1 2 52.050 0.354
CB-X-G-E-conv-24 2 47.800 0.283
CB-X-G-E-conv-48 2 47.050 0.495
CB-X-G-E-conv-72 2 46.450 0.354
CB-X-G-E-conv-96 2 46.250 0.354
CB-X-G-E-inf-mw-1 2 52.100 0.424
CB-X-G-E-inf-mw-24 2 49.750 0.212
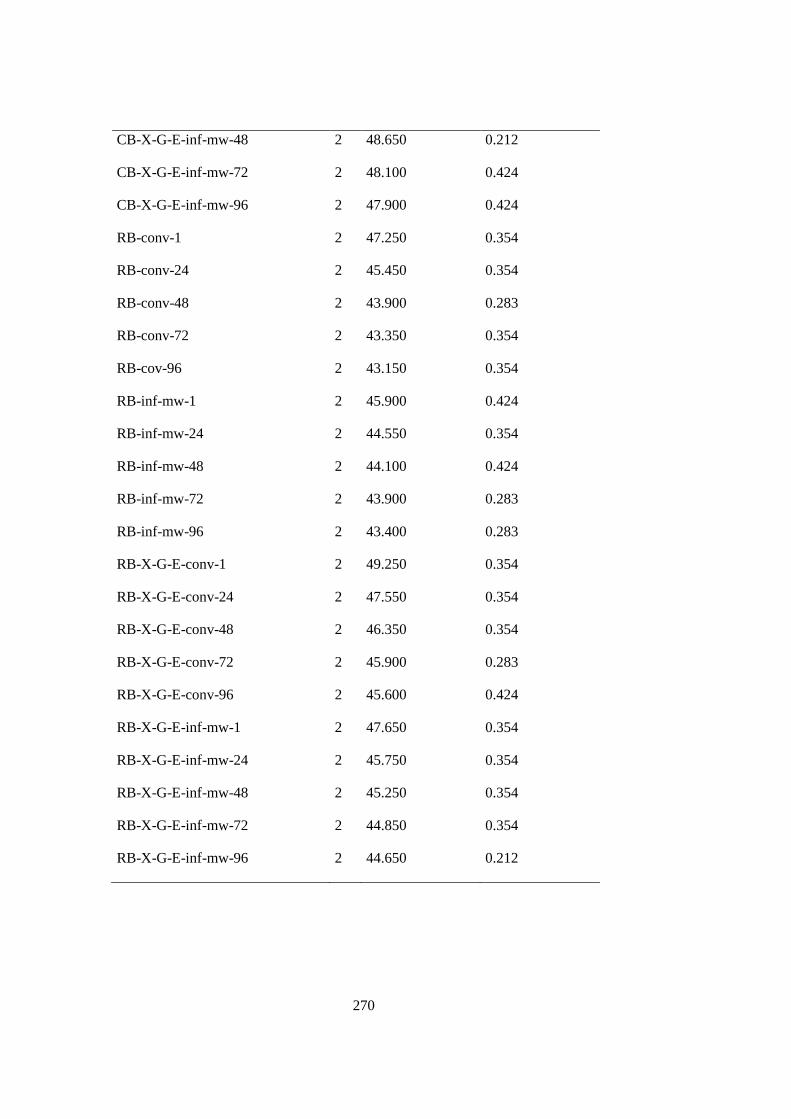
270
CB-X-G-E-inf-mw-48 2 48.650 0.212
CB-X-G-E-inf-mw-72 2 48.100 0.424
CB-X-G-E-inf-mw-96 2 47.900 0.424
RB-conv-1 2 47.250 0.354
RB-conv-24 2 45.450 0.354
RB-conv-48 2 43.900 0.283
RB-conv-72 2 43.350 0.354
RB-cov-96 2 43.150 0.354
RB-inf-mw-1 2 45.900 0.424
RB-inf-mw-24 2 44.550 0.354
RB-inf-mw-48 2 44.100 0.424
RB-inf-mw-72 2 43.900 0.283
RB-inf-mw-96 2 43.400 0.283
RB-X-G-E-conv-1 2 49.250 0.354
RB-X-G-E-conv-24 2 47.550 0.354
RB-X-G-E-conv-48 2 46.350 0.354
RB-X-G-E-conv-72 2 45.900 0.283
RB-X-G-E-conv-96 2 45.600 0.424
RB-X-G-E-inf-mw-1 2 47.650 0.354
RB-X-G-E-inf-mw-24 2 45.750 0.354
RB-X-G-E-inf-mw-48 2 45.250 0.354
RB-X-G-E-inf-mw-72 2 44.850 0.354
RB-X-G-E-inf-mw-96 2 44.650 0.212
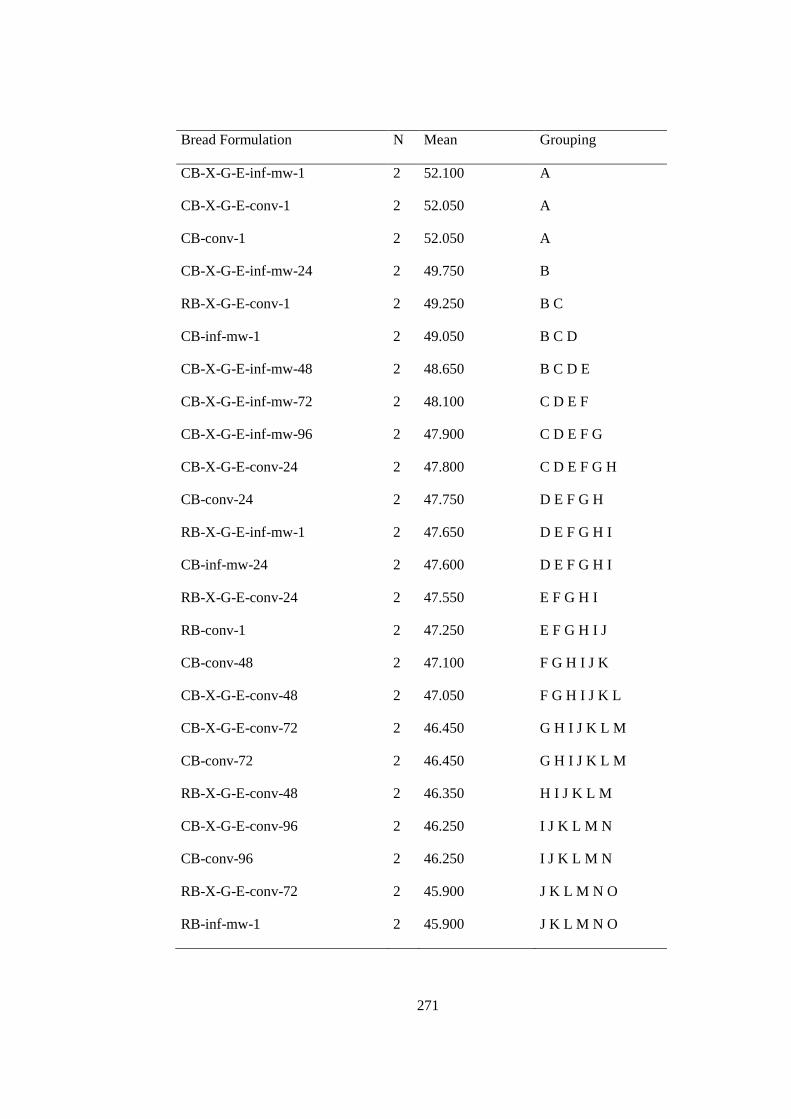
271
Bread Formulation N Mean Grouping
CB-X-G-E-inf-mw-1 2 52.100 A
CB-X-G-E-conv-1 2 52.050 A
CB-conv-1 2 52.050 A
CB-X-G-E-inf-mw-24 2 49.750 B
RB-X-G-E-conv-1 2 49.250 B C
CB-inf-mw-1 2 49.050 B C D
CB-X-G-E-inf-mw-48 2 48.650 B C D E
CB-X-G-E-inf-mw-72 2 48.100 C D E F
CB-X-G-E-inf-mw-96 2 47.900 C D E F G
CB-X-G-E-conv-24 2 47.800 C D E F G H
CB-conv-24 2 47.750 D E F G H
RB-X-G-E-inf-mw-1 2 47.650 D E F G H I
CB-inf-mw-24 2 47.600 D E F G H I
RB-X-G-E-conv-24 2 47.550 E F G H I
RB-conv-1 2 47.250 E F G H I J
CB-conv-48 2 47.100 F G H I J K
CB-X-G-E-conv-48 2 47.050 F G H I J K L
CB-X-G-E-conv-72 2 46.450 G H I J K L M
CB-conv-72 2 46.450 G H I J K L M
RB-X-G-E-conv-48 2 46.350 H I J K L M
CB-X-G-E-conv-96 2 46.250 I J K L M N
CB-conv-96 2 46.250 I J K L M N
RB-X-G-E-conv-72 2 45.900 J K L M N O
RB-inf-mw-1 2 45.900 J K L M N O
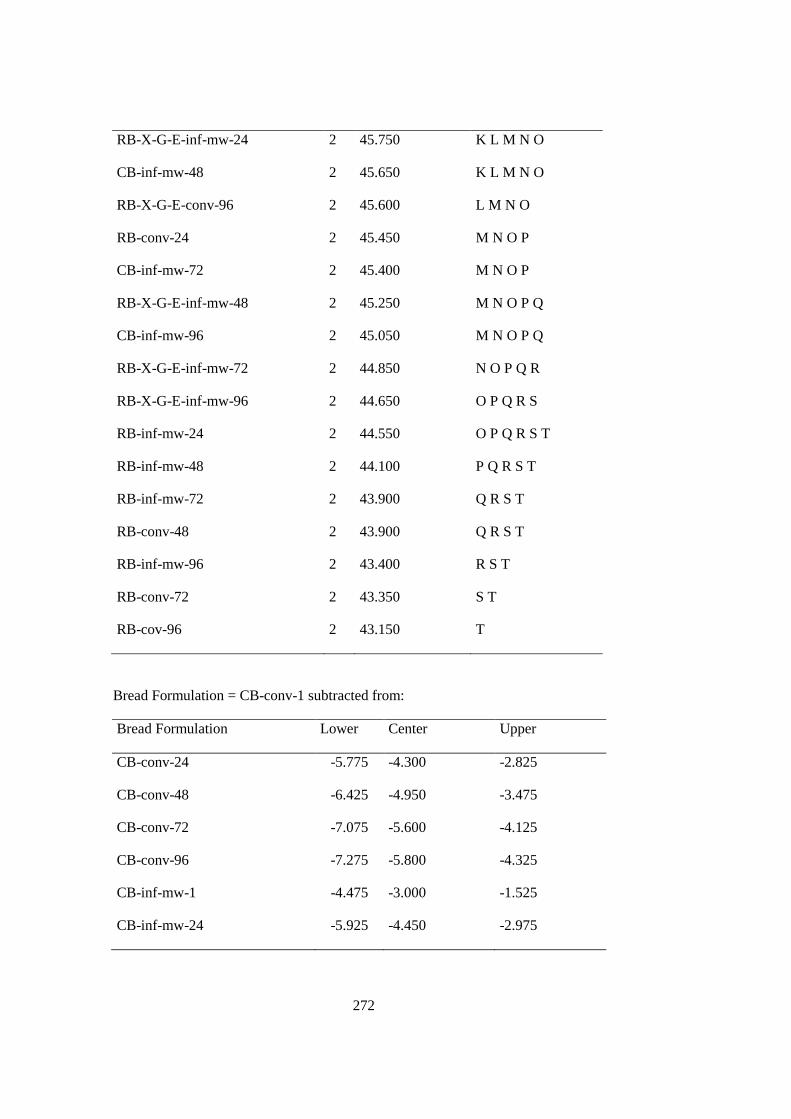
272
RB-X-G-E-inf-mw-24 2 45.750 K L M N O
CB-inf-mw-48 2 45.650 K L M N O
RB-X-G-E-conv-96 2 45.600 L M N O
RB-conv-24 2 45.450 M N O P
CB-inf-mw-72 2 45.400 M N O P
RB-X-G-E-inf-mw-48 2 45.250 M N O P Q
CB-inf-mw-96 2 45.050 M N O P Q
RB-X-G-E-inf-mw-72 2 44.850 N O P Q R
RB-X-G-E-inf-mw-96 2 44.650 O P Q R S
RB-inf-mw-24 2 44.550 O P Q R S T
RB-inf-mw-48 2 44.100 P Q R S T
RB-inf-mw-72 2 43.900 Q R S T
RB-conv-48 2 43.900 Q R S T
RB-inf-mw-96 2 43.400 R S T
RB-conv-72 2 43.350 S T
RB-cov-96 2 43.150 T
Bread Formulation = CB-conv-1 subtracted from:
Bread Formulation Lower Center Upper
CB-conv-24 -5.775 -4.300 -2.825
CB-conv-48 -6.425 -4.950 -3.475
CB-conv-72 -7.075 -5.600 -4.125
CB-conv-96 -7.275 -5.800 -4.325
CB-inf-mw-1 -4.475 -3.000 -1.525
CB-inf-mw-24 -5.925 -4.450 -2.975
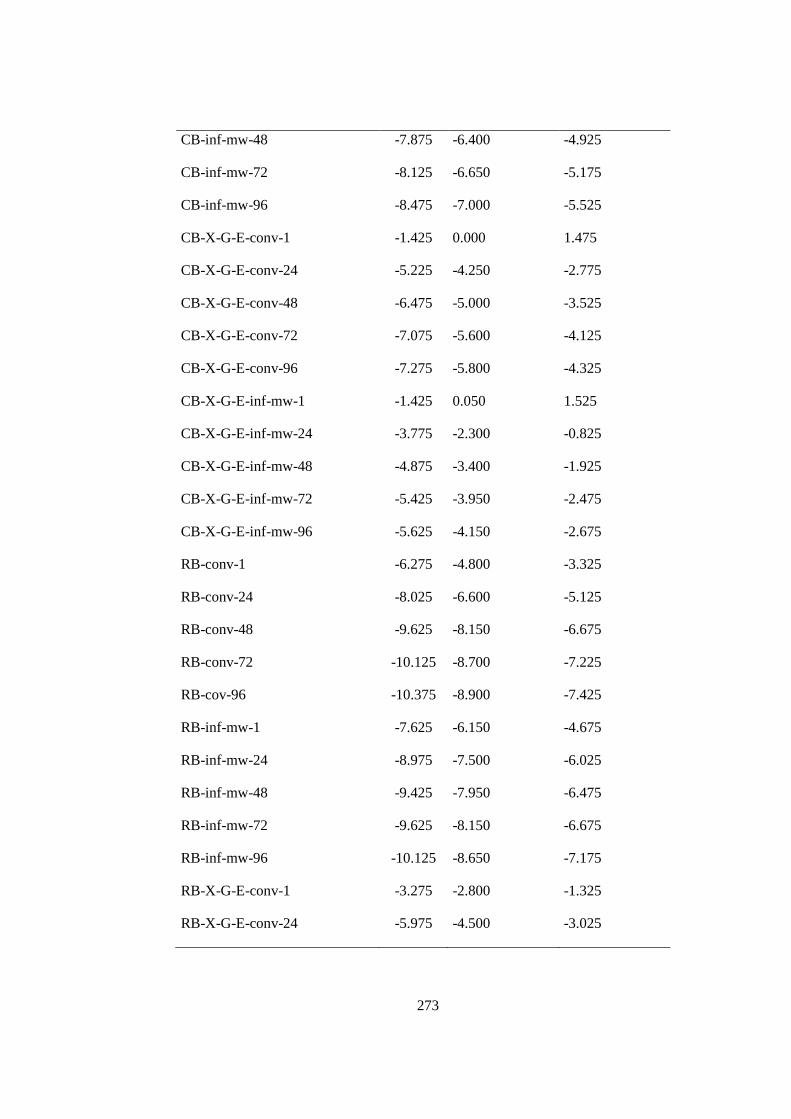
273
CB-inf-mw-48 -7.875 -6.400 -4.925
CB-inf-mw-72 -8.125 -6.650 -5.175
CB-inf-mw-96 -8.475 -7.000 -5.525
CB-X-G-E-conv-1 -1.425 0.000 1.475
CB-X-G-E-conv-24 -5.225 -4.250 -2.775
CB-X-G-E-conv-48 -6.475 -5.000 -3.525
CB-X-G-E-conv-72 -7.075 -5.600 -4.125
CB-X-G-E-conv-96 -7.275 -5.800 -4.325
CB-X-G-E-inf-mw-1 -1.425 0.050 1.525
CB-X-G-E-inf-mw-24 -3.775 -2.300 -0.825
CB-X-G-E-inf-mw-48 -4.875 -3.400 -1.925
CB-X-G-E-inf-mw-72 -5.425 -3.950 -2.475
CB-X-G-E-inf-mw-96 -5.625 -4.150 -2.675
RB-conv-1 -6.275 -4.800 -3.325
RB-conv-24 -8.025 -6.600 -5.125
RB-conv-48 -9.625 -8.150 -6.675
RB-conv-72 -10.125 -8.700 -7.225
RB-cov-96 -10.375 -8.900 -7.425
RB-inf-mw-1 -7.625 -6.150 -4.675
RB-inf-mw-24 -8.975 -7.500 -6.025
RB-inf-mw-48 -9.425 -7.950 -6.475
RB-inf-mw-72 -9.625 -8.150 -6.675
RB-inf-mw-96 -10.125 -8.650 -7.175
RB-X-G-E-conv-1 -3.275 -2.800 -1.325
RB-X-G-E-conv-24 -5.975 -4.500 -3.025
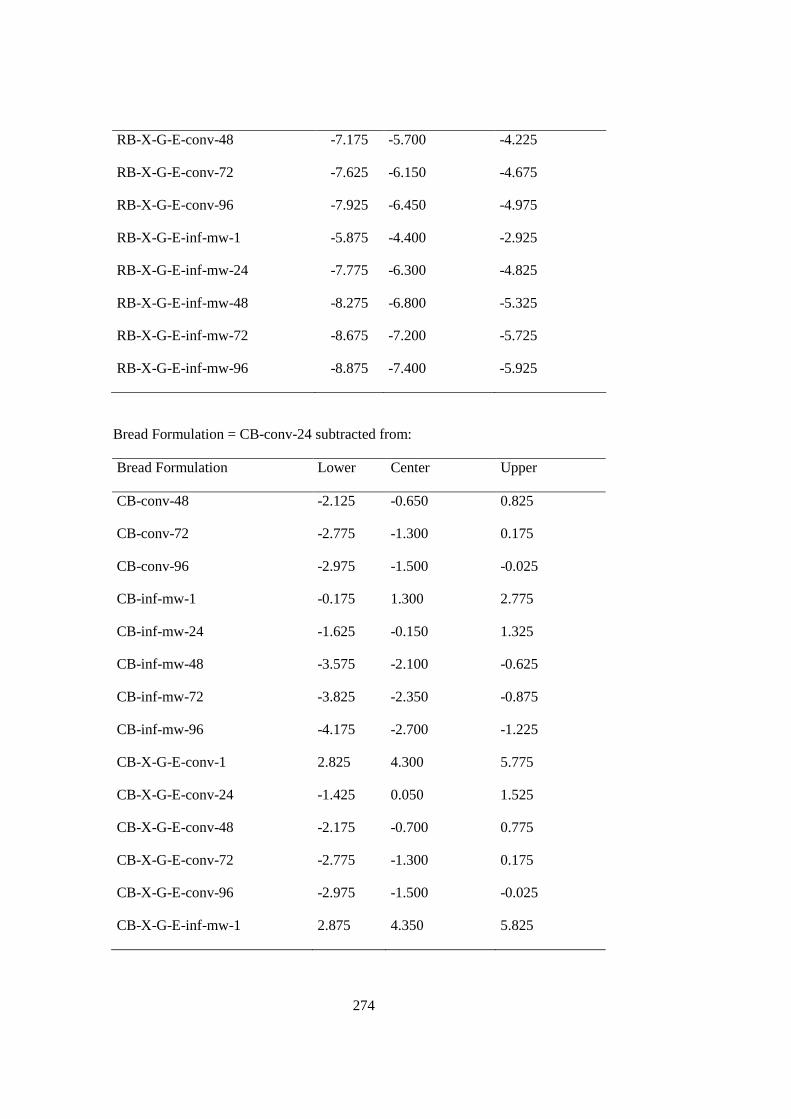
274
RB-X-G-E-conv-48 -7.175 -5.700 -4.225
RB-X-G-E-conv-72 -7.625 -6.150 -4.675
RB-X-G-E-conv-96 -7.925 -6.450 -4.975
RB-X-G-E-inf-mw-1 -5.875 -4.400 -2.925
RB-X-G-E-inf-mw-24 -7.775 -6.300 -4.825
RB-X-G-E-inf-mw-48 -8.275 -6.800 -5.325
RB-X-G-E-inf-mw-72 -8.675 -7.200 -5.725
RB-X-G-E-inf-mw-96 -8.875 -7.400 -5.925
Bread Formulation = CB-conv-24 subtracted from:
Bread Formulation Lower Center Upper
CB-conv-48 -2.125 -0.650 0.825
CB-conv-72 -2.775 -1.300 0.175
CB-conv-96 -2.975 -1.500 -0.025
CB-inf-mw-1 -0.175 1.300 2.775
CB-inf-mw-24 -1.625 -0.150 1.325
CB-inf-mw-48 -3.575 -2.100 -0.625
CB-inf-mw-72 -3.825 -2.350 -0.875
CB-inf-mw-96 -4.175 -2.700 -1.225
CB-X-G-E-conv-1 2.825 4.300 5.775
CB-X-G-E-conv-24 -1.425 0.050 1.525
CB-X-G-E-conv-48 -2.175 -0.700 0.775
CB-X-G-E-conv-72 -2.775 -1.300 0.175
CB-X-G-E-conv-96 -2.975 -1.500 -0.025
CB-X-G-E-inf-mw-1 2.875 4.350 5.825

275
CB-X-G-E-inf-mw-24 0.525 2.000 3.475
CB-X-G-E-inf-mw-48 -0.575 0.900 2.375
CB-X-G-E-inf-mw-72 -1.125 0.350 1.825
CB-X-G-E-inf-mw-96 -1.325 0.150 1.625
RB-conv-1 -1.975 -0.500 0.975
RB-conv-24 -3.775 -2.300 -0.825
RB-conv-48 -5.325 -3.850 -2.375
RB-conv-72 -5.875 -4.400 -2.925
RB-cov-96 -6.075 -4.600 -3.125
RB-inf-mw-1 -3.325 -1.850 -0.375
RB-inf-mw-24 -4.675 -3.200 -1.725
RB-inf-mw-48 -5.125 -3.650 -2.175
RB-inf-mw-72 -5.325 -3.850 -2.375
RB-inf-mw-96 -5.825 -4.350 -2.875
RB-X-G-E-conv-1 0.025 1.500 2.975
RB-X-G-E-conv-24 -1.675 -0.200 1.275
RB-X-G-E-conv-48 -2.875 -1.400 0.075
RB-X-G-E-conv-72 -3.325 -1.850 -0.375
RB-X-G-E-conv-96 -3.625 -2.150 -0.675
RB-X-G-E-inf-mw-1 -1.575 -0.100 1.375
RB-X-G-E-inf-mw-24 -3.475 -2.000 -0.525
RB-X-G-E-inf-mw-48 -3.975 -2.500 -1.025
RB-X-G-E-inf-mw-72 -4.375 -2.900 -1.425
RB-X-G-E-inf-mw-96 -4.575 -3.100 -1.625
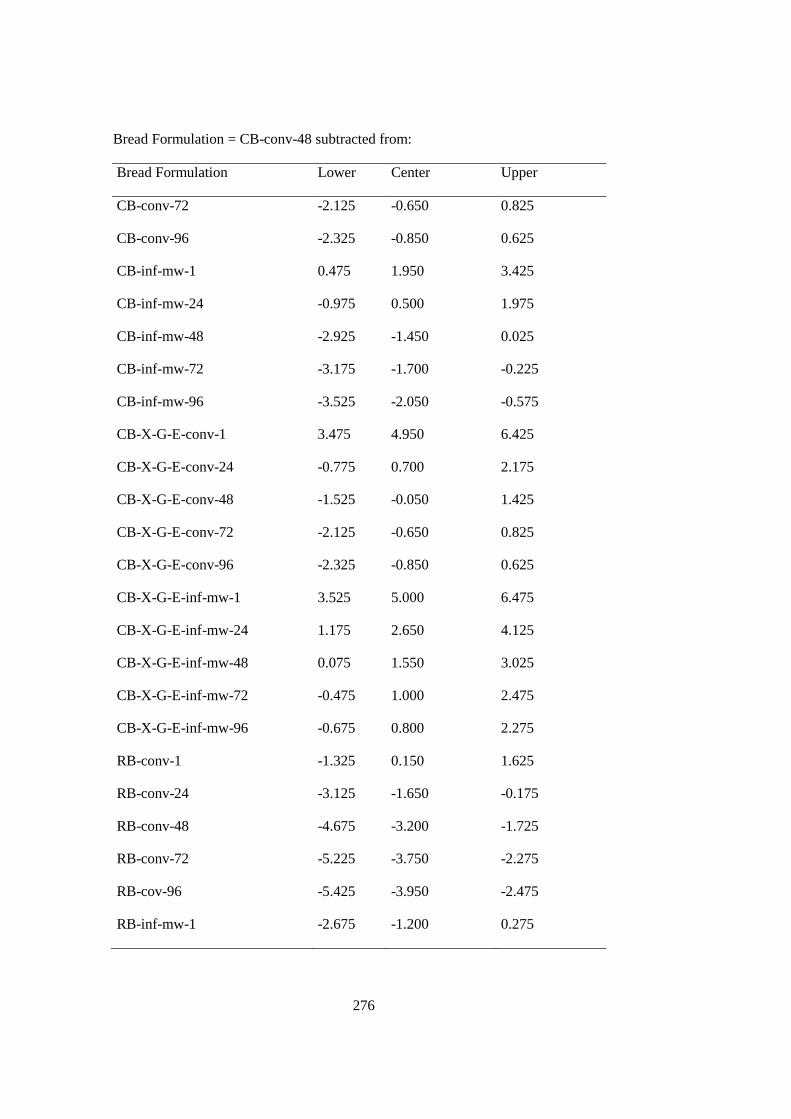
276
Bread Formulation = CB-conv-48 subtracted from:
Bread Formulation Lower Center Upper
CB-conv-72 -2.125 -0.650 0.825
CB-conv-96 -2.325 -0.850 0.625
CB-inf-mw-1 0.475 1.950 3.425
CB-inf-mw-24 -0.975 0.500 1.975
CB-inf-mw-48 -2.925 -1.450 0.025
CB-inf-mw-72 -3.175 -1.700 -0.225
CB-inf-mw-96 -3.525 -2.050 -0.575
CB-X-G-E-conv-1 3.475 4.950 6.425
CB-X-G-E-conv-24 -0.775 0.700 2.175
CB-X-G-E-conv-48 -1.525 -0.050 1.425
CB-X-G-E-conv-72 -2.125 -0.650 0.825
CB-X-G-E-conv-96 -2.325 -0.850 0.625
CB-X-G-E-inf-mw-1 3.525 5.000 6.475
CB-X-G-E-inf-mw-24 1.175 2.650 4.125
CB-X-G-E-inf-mw-48 0.075 1.550 3.025
CB-X-G-E-inf-mw-72 -0.475 1.000 2.475
CB-X-G-E-inf-mw-96 -0.675 0.800 2.275
RB-conv-1 -1.325 0.150 1.625
RB-conv-24 -3.125 -1.650 -0.175
RB-conv-48 -4.675 -3.200 -1.725
RB-conv-72 -5.225 -3.750 -2.275
RB-cov-96 -5.425 -3.950 -2.475
RB-inf-mw-1 -2.675 -1.200 0.275
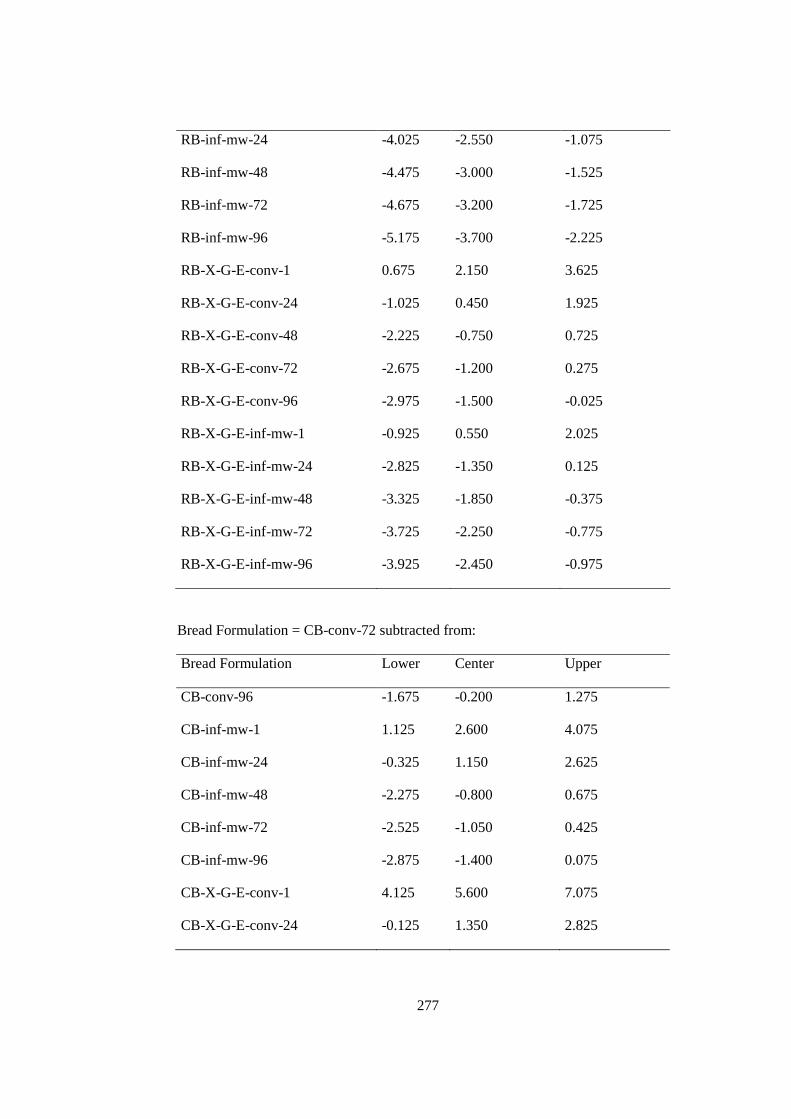
277
RB-inf-mw-24 -4.025 -2.550 -1.075
RB-inf-mw-48 -4.475 -3.000 -1.525
RB-inf-mw-72 -4.675 -3.200 -1.725
RB-inf-mw-96 -5.175 -3.700 -2.225
RB-X-G-E-conv-1 0.675 2.150 3.625
RB-X-G-E-conv-24 -1.025 0.450 1.925
RB-X-G-E-conv-48 -2.225 -0.750 0.725
RB-X-G-E-conv-72 -2.675 -1.200 0.275
RB-X-G-E-conv-96 -2.975 -1.500 -0.025
RB-X-G-E-inf-mw-1 -0.925 0.550 2.025
RB-X-G-E-inf-mw-24 -2.825 -1.350 0.125
RB-X-G-E-inf-mw-48 -3.325 -1.850 -0.375
RB-X-G-E-inf-mw-72 -3.725 -2.250 -0.775
RB-X-G-E-inf-mw-96 -3.925 -2.450 -0.975
Bread Formulation = CB-conv-72 subtracted from:
Bread Formulation Lower Center Upper
CB-conv-96 -1.675 -0.200 1.275
CB-inf-mw-1 1.125 2.600 4.075
CB-inf-mw-24 -0.325 1.150 2.625
CB-inf-mw-48 -2.275 -0.800 0.675
CB-inf-mw-72 -2.525 -1.050 0.425
CB-inf-mw-96 -2.875 -1.400 0.075
CB-X-G-E-conv-1 4.125 5.600 7.075
CB-X-G-E-conv-24 -0.125 1.350 2.825
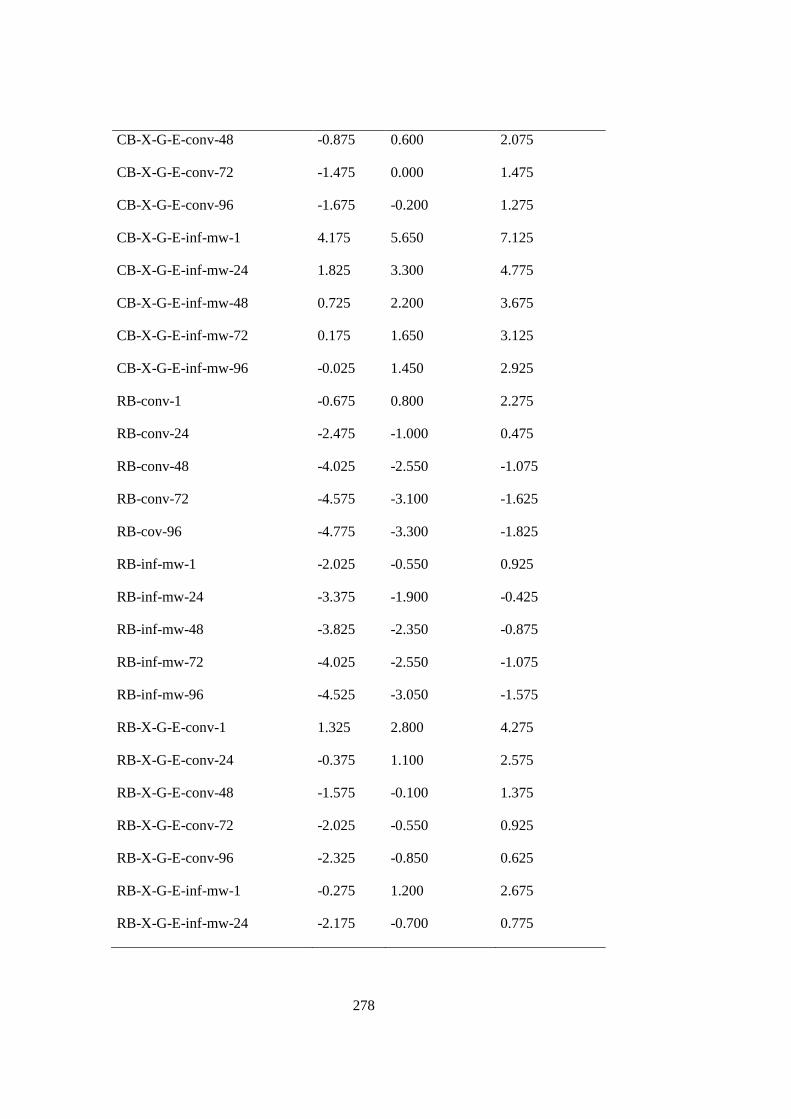
278
CB-X-G-E-conv-48 -0.875 0.600 2.075
CB-X-G-E-conv-72 -1.475 0.000 1.475
CB-X-G-E-conv-96 -1.675 -0.200 1.275
CB-X-G-E-inf-mw-1 4.175 5.650 7.125
CB-X-G-E-inf-mw-24 1.825 3.300 4.775
CB-X-G-E-inf-mw-48 0.725 2.200 3.675
CB-X-G-E-inf-mw-72 0.175 1.650 3.125
CB-X-G-E-inf-mw-96 -0.025 1.450 2.925
RB-conv-1 -0.675 0.800 2.275
RB-conv-24 -2.475 -1.000 0.475
RB-conv-48 -4.025 -2.550 -1.075
RB-conv-72 -4.575 -3.100 -1.625
RB-cov-96 -4.775 -3.300 -1.825
RB-inf-mw-1 -2.025 -0.550 0.925
RB-inf-mw-24 -3.375 -1.900 -0.425
RB-inf-mw-48 -3.825 -2.350 -0.875
RB-inf-mw-72 -4.025 -2.550 -1.075
RB-inf-mw-96 -4.525 -3.050 -1.575
RB-X-G-E-conv-1 1.325 2.800 4.275
RB-X-G-E-conv-24 -0.375 1.100 2.575
RB-X-G-E-conv-48 -1.575 -0.100 1.375
RB-X-G-E-conv-72 -2.025 -0.550 0.925
RB-X-G-E-conv-96 -2.325 -0.850 0.625
RB-X-G-E-inf-mw-1 -0.275 1.200 2.675
RB-X-G-E-inf-mw-24 -2.175 -0.700 0.775
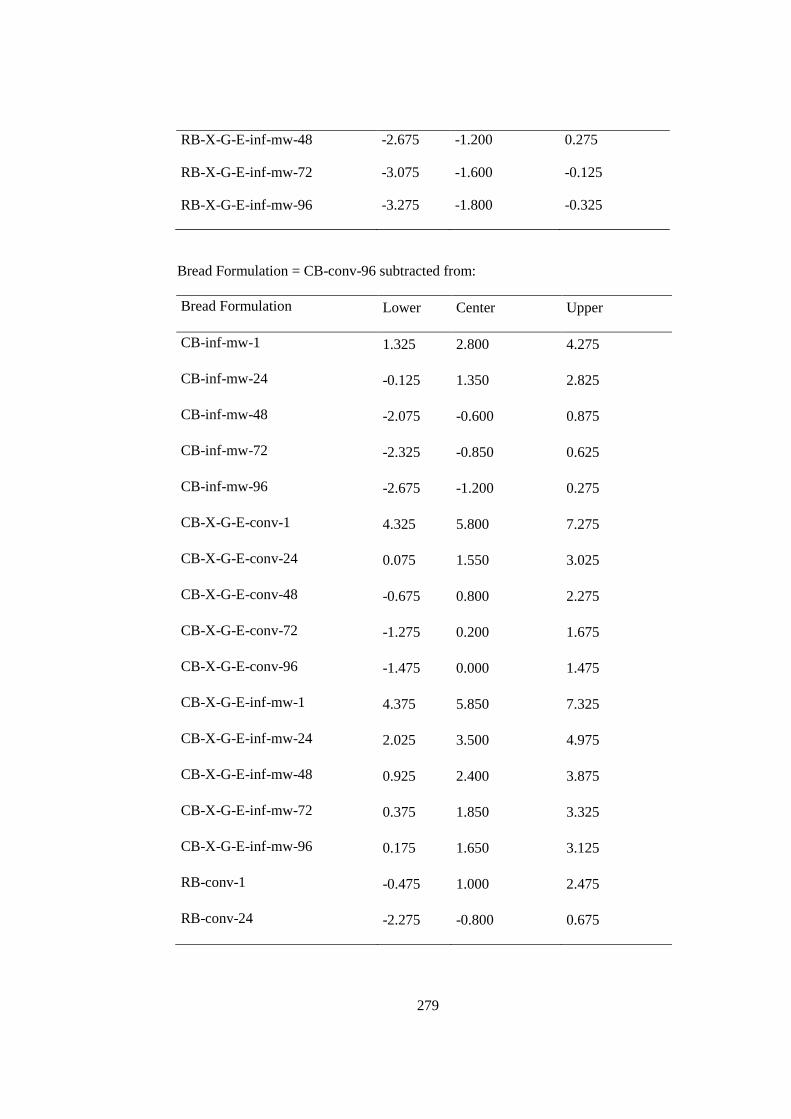
279
RB-X-G-E-inf-mw-48 -2.675 -1.200 0.275
RB-X-G-E-inf-mw-72 -3.075 -1.600 -0.125
RB-X-G-E-inf-mw-96 -3.275 -1.800 -0.325
Bread Formulation = CB-conv-96 subtracted from:
Bread Formulation Lower Center Upper
CB-inf-mw-1 1.325 2.800 4.275
CB-inf-mw-24 -0.125 1.350 2.825
CB-inf-mw-48 -2.075 -0.600 0.875
CB-inf-mw-72 -2.325 -0.850 0.625
CB-inf-mw-96 -2.675 -1.200 0.275
CB-X-G-E-conv-1 4.325 5.800 7.275
CB-X-G-E-conv-24 0.075 1.550 3.025
CB-X-G-E-conv-48 -0.675 0.800 2.275
CB-X-G-E-conv-72 -1.275 0.200 1.675
CB-X-G-E-conv-96 -1.475 0.000 1.475
CB-X-G-E-inf-mw-1 4.375 5.850 7.325
CB-X-G-E-inf-mw-24 2.025 3.500 4.975
CB-X-G-E-inf-mw-48 0.925 2.400 3.875
CB-X-G-E-inf-mw-72 0.375 1.850 3.325
CB-X-G-E-inf-mw-96 0.175 1.650 3.125
RB-conv-1 -0.475 1.000 2.475
RB-conv-24 -2.275 -0.800 0.675
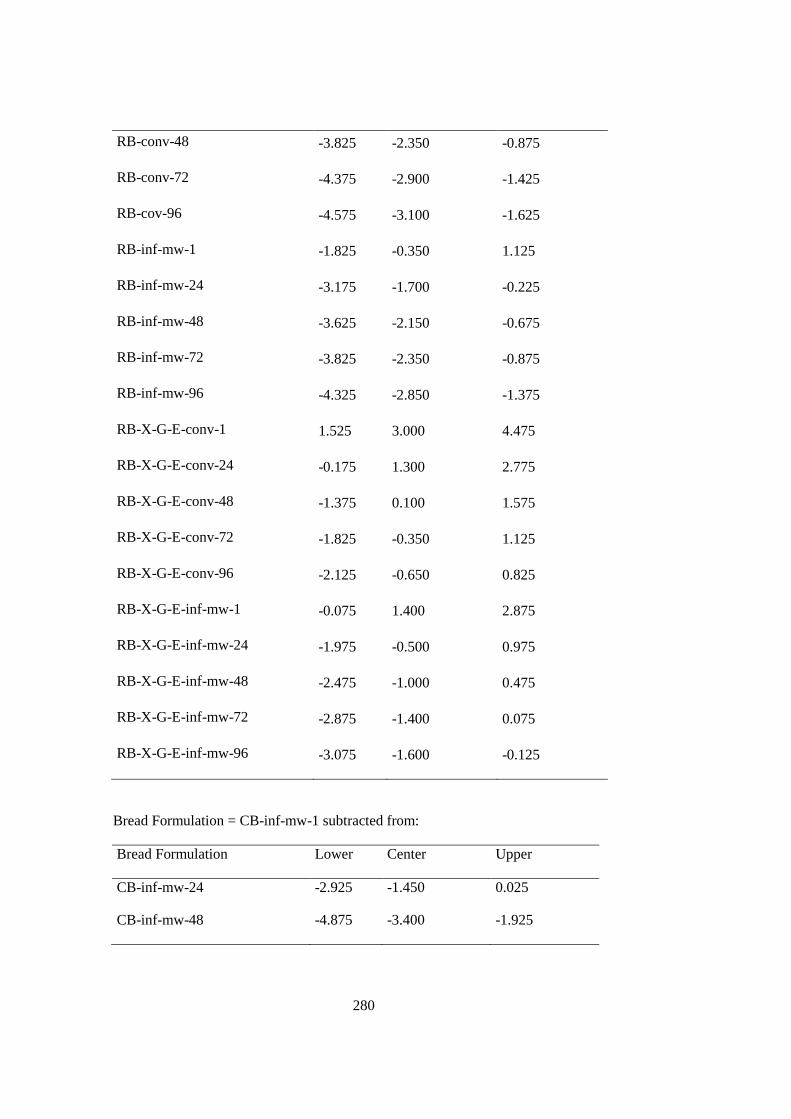
280
RB-conv-48 -3.825 -2.350 -0.875
RB-conv-72 -4.375 -2.900 -1.425
RB-cov-96 -4.575 -3.100 -1.625
RB-inf-mw-1 -1.825 -0.350 1.125
RB-inf-mw-24 -3.175 -1.700 -0.225
RB-inf-mw-48 -3.625 -2.150 -0.675
RB-inf-mw-72 -3.825 -2.350 -0.875
RB-inf-mw-96 -4.325 -2.850 -1.375
RB-X-G-E-conv-1 1.525 3.000 4.475
RB-X-G-E-conv-24 -0.175 1.300 2.775
RB-X-G-E-conv-48 -1.375 0.100 1.575
RB-X-G-E-conv-72 -1.825 -0.350 1.125
RB-X-G-E-conv-96 -2.125 -0.650 0.825
RB-X-G-E-inf-mw-1 -0.075 1.400 2.875
RB-X-G-E-inf-mw-24 -1.975 -0.500 0.975
RB-X-G-E-inf-mw-48 -2.475 -1.000 0.475
RB-X-G-E-inf-mw-72 -2.875 -1.400 0.075
RB-X-G-E-inf-mw-96 -3.075 -1.600 -0.125
Bread Formulation = CB-inf-mw-1 subtracted from:
Bread Formulation Lower Center Upper
CB-inf-mw-24 -2.925 -1.450 0.025
CB-inf-mw-48 -4.875 -3.400 -1.925
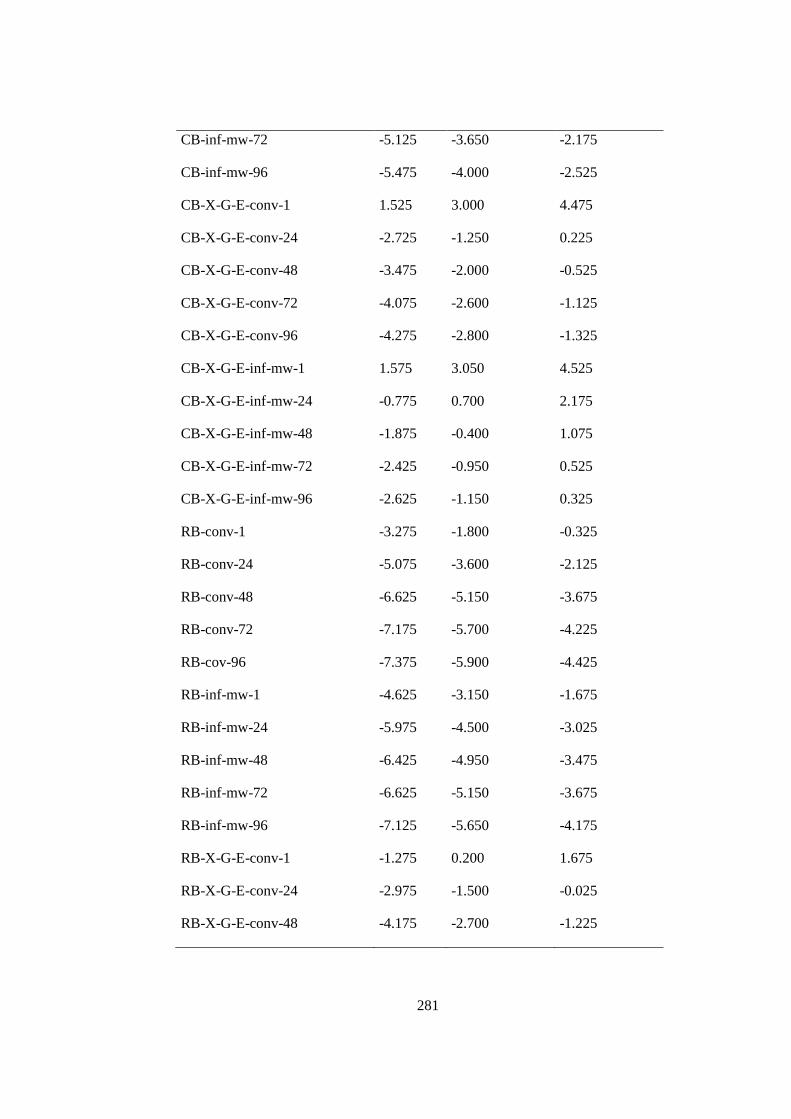
281
CB-inf-mw-72 -5.125 -3.650 -2.175
CB-inf-mw-96 -5.475 -4.000 -2.525
CB-X-G-E-conv-1 1.525 3.000 4.475
CB-X-G-E-conv-24 -2.725 -1.250 0.225
CB-X-G-E-conv-48 -3.475 -2.000 -0.525
CB-X-G-E-conv-72 -4.075 -2.600 -1.125
CB-X-G-E-conv-96 -4.275 -2.800 -1.325
CB-X-G-E-inf-mw-1 1.575 3.050 4.525
CB-X-G-E-inf-mw-24 -0.775 0.700 2.175
CB-X-G-E-inf-mw-48 -1.875 -0.400 1.075
CB-X-G-E-inf-mw-72 -2.425 -0.950 0.525
CB-X-G-E-inf-mw-96 -2.625 -1.150 0.325
RB-conv-1 -3.275 -1.800 -0.325
RB-conv-24 -5.075 -3.600 -2.125
RB-conv-48 -6.625 -5.150 -3.675
RB-conv-72 -7.175 -5.700 -4.225
RB-cov-96 -7.375 -5.900 -4.425
RB-inf-mw-1 -4.625 -3.150 -1.675
RB-inf-mw-24 -5.975 -4.500 -3.025
RB-inf-mw-48 -6.425 -4.950 -3.475
RB-inf-mw-72 -6.625 -5.150 -3.675
RB-inf-mw-96 -7.125 -5.650 -4.175
RB-X-G-E-conv-1 -1.275 0.200 1.675
RB-X-G-E-conv-24 -2.975 -1.500 -0.025
RB-X-G-E-conv-48 -4.175 -2.700 -1.225
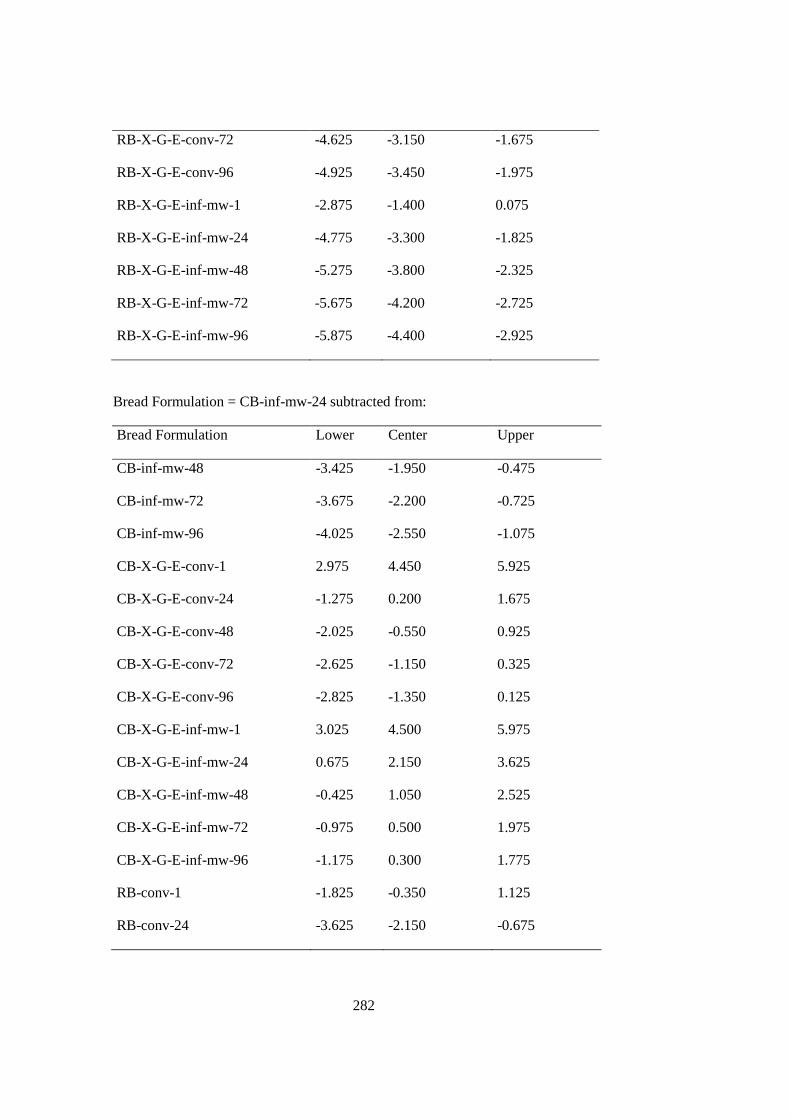
282
RB-X-G-E-conv-72 -4.625 -3.150 -1.675
RB-X-G-E-conv-96 -4.925 -3.450 -1.975
RB-X-G-E-inf-mw-1 -2.875 -1.400 0.075
RB-X-G-E-inf-mw-24 -4.775 -3.300 -1.825
RB-X-G-E-inf-mw-48 -5.275 -3.800 -2.325
RB-X-G-E-inf-mw-72 -5.675 -4.200 -2.725
RB-X-G-E-inf-mw-96 -5.875 -4.400 -2.925
Bread Formulation = CB-inf-mw-24 subtracted from:
Bread Formulation Lower Center Upper
CB-inf-mw-48 -3.425 -1.950 -0.475
CB-inf-mw-72 -3.675 -2.200 -0.725
CB-inf-mw-96 -4.025 -2.550 -1.075
CB-X-G-E-conv-1 2.975 4.450 5.925
CB-X-G-E-conv-24 -1.275 0.200 1.675
CB-X-G-E-conv-48 -2.025 -0.550 0.925
CB-X-G-E-conv-72 -2.625 -1.150 0.325
CB-X-G-E-conv-96 -2.825 -1.350 0.125
CB-X-G-E-inf-mw-1 3.025 4.500 5.975
CB-X-G-E-inf-mw-24 0.675 2.150 3.625
CB-X-G-E-inf-mw-48 -0.425 1.050 2.525
CB-X-G-E-inf-mw-72 -0.975 0.500 1.975
CB-X-G-E-inf-mw-96 -1.175 0.300 1.775
RB-conv-1 -1.825 -0.350 1.125
RB-conv-24 -3.625 -2.150 -0.675
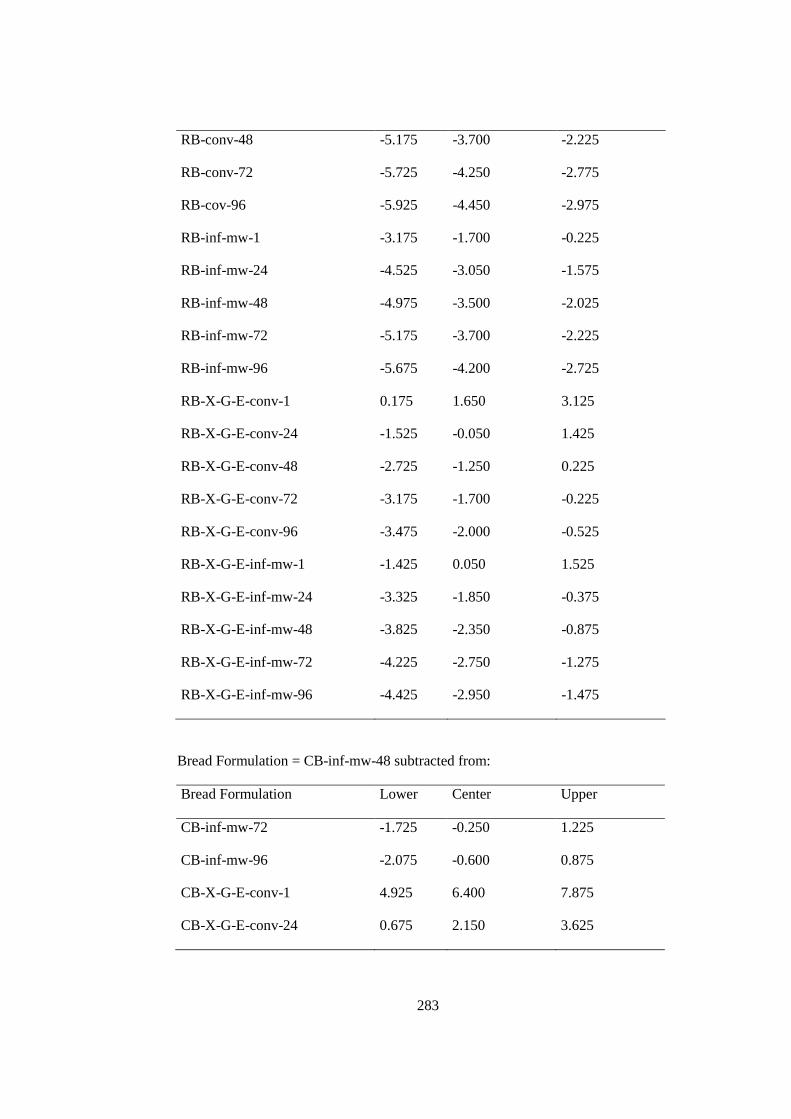
283
RB-conv-48 -5.175 -3.700 -2.225
RB-conv-72 -5.725 -4.250 -2.775
RB-cov-96 -5.925 -4.450 -2.975
RB-inf-mw-1 -3.175 -1.700 -0.225
RB-inf-mw-24 -4.525 -3.050 -1.575
RB-inf-mw-48 -4.975 -3.500 -2.025
RB-inf-mw-72 -5.175 -3.700 -2.225
RB-inf-mw-96 -5.675 -4.200 -2.725
RB-X-G-E-conv-1 0.175 1.650 3.125
RB-X-G-E-conv-24 -1.525 -0.050 1.425
RB-X-G-E-conv-48 -2.725 -1.250 0.225
RB-X-G-E-conv-72 -3.175 -1.700 -0.225
RB-X-G-E-conv-96 -3.475 -2.000 -0.525
RB-X-G-E-inf-mw-1 -1.425 0.050 1.525
RB-X-G-E-inf-mw-24 -3.325 -1.850 -0.375
RB-X-G-E-inf-mw-48 -3.825 -2.350 -0.875
RB-X-G-E-inf-mw-72 -4.225 -2.750 -1.275
RB-X-G-E-inf-mw-96 -4.425 -2.950 -1.475
Bread Formulation = CB-inf-mw-48 subtracted from:
Bread Formulation Lower Center Upper
CB-inf-mw-72 -1.725 -0.250 1.225
CB-inf-mw-96 -2.075 -0.600 0.875
CB-X-G-E-conv-1 4.925 6.400 7.875
CB-X-G-E-conv-24 0.675 2.150 3.625
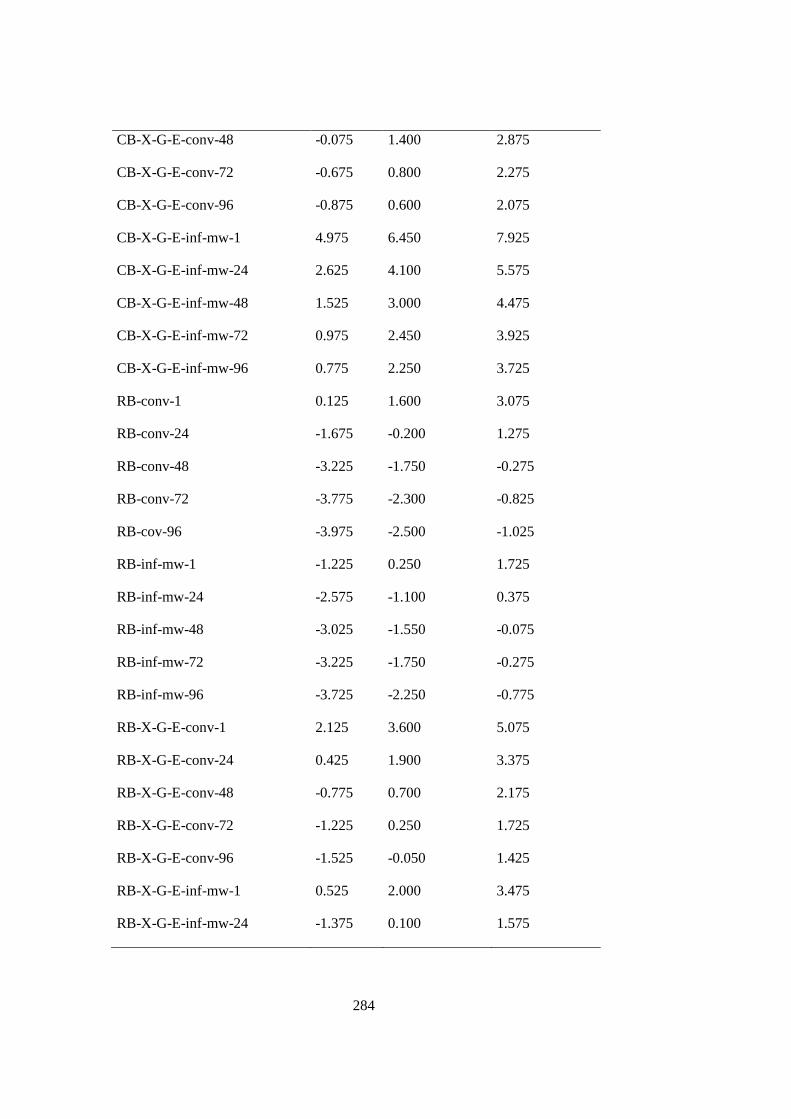
284
CB-X-G-E-conv-48 -0.075 1.400 2.875
CB-X-G-E-conv-72 -0.675 0.800 2.275
CB-X-G-E-conv-96 -0.875 0.600 2.075
CB-X-G-E-inf-mw-1 4.975 6.450 7.925
CB-X-G-E-inf-mw-24 2.625 4.100 5.575
CB-X-G-E-inf-mw-48 1.525 3.000 4.475
CB-X-G-E-inf-mw-72 0.975 2.450 3.925
CB-X-G-E-inf-mw-96 0.775 2.250 3.725
RB-conv-1 0.125 1.600 3.075
RB-conv-24 -1.675 -0.200 1.275
RB-conv-48 -3.225 -1.750 -0.275
RB-conv-72 -3.775 -2.300 -0.825
RB-cov-96 -3.975 -2.500 -1.025
RB-inf-mw-1 -1.225 0.250 1.725
RB-inf-mw-24 -2.575 -1.100 0.375
RB-inf-mw-48 -3.025 -1.550 -0.075
RB-inf-mw-72 -3.225 -1.750 -0.275
RB-inf-mw-96 -3.725 -2.250 -0.775
RB-X-G-E-conv-1 2.125 3.600 5.075
RB-X-G-E-conv-24 0.425 1.900 3.375
RB-X-G-E-conv-48 -0.775 0.700 2.175
RB-X-G-E-conv-72 -1.225 0.250 1.725
RB-X-G-E-conv-96 -1.525 -0.050 1.425
RB-X-G-E-inf-mw-1 0.525 2.000 3.475
RB-X-G-E-inf-mw-24 -1.375 0.100 1.575
285
RB-X-G-E-inf-mw-48 -1.875 -0.400 1.075
RB-X-G-E-inf-mw-72 -2.275 -0.800 0.675
RB-X-G-E-inf-mw-96 -2.475 -1.000 0.475
Bread Formulation = CB-inf-mw-72 subtracted from:
Bread Formulation Lower Center Upper
CB-inf-mw-96 -1.825 -0.350 1.125
CB-X-G-E-conv-1 5.175 6.650 8.125
CB-X-G-E-conv-24 0.925 2.400 3.875
CB-X-G-E-conv-48 0.175 1.650 3.125
CB-X-G-E-conv-72 -0.425 1.050 2.525
CB-X-G-E-conv-96 -0.625 0.850 2.325
CB-X-G-E-inf-mw-1 5.225 6.700 8.175
CB-X-G-E-inf-mw-24 2.875 4.350 5.825
CB-X-G-E-inf-mw-48 1.775 3.250 4.725
CB-X-G-E-inf-mw-72 1.225 2.700 4.175
CB-X-G-E-inf-mw-96 1.025 2.500 3.975
RB-conv-1 0.375 1.850 3.325
RB-conv-24 -1.425 0.050 1.525
RB-conv-48 -2.975 -1.500 -0.025
RB-conv-72 -3.525 -2.050 -0.575
RB-cov-96 -3.725 -2.250 -0.775
RB-inf-mw-1 -0.975 0.500 1.975
RB-inf-mw-24 -2.325 -0.850 0.625
RB-inf-mw-48 -2.775 -1.300 0.175
286
RB-inf-mw-72 -2.975 -1.500 -0.025
RB-inf-mw-96 -3.475 -2.000 -0.525
RB-X-G-E-conv-1 2.375 3.850 5.325
RB-X-G-E-conv-24 0.675 2.150 3.625
RB-X-G-E-conv-48 -0.525 0.950 2.425
RB-X-G-E-conv-72 -0.975 0.500 1.975
RB-X-G-E-conv-96 -1.275 0.200 1.675
RB-X-G-E-inf-mw-1 0.775 2.250 3.725
RB-X-G-E-inf-mw-24 -1.125 0.350 1.825
RB-X-G-E-inf-mw-48 -1.625 -0.150 1.325
RB-X-G-E-inf-mw-72 -2.025 -0.550 0.925
RB-X-G-E-inf-mw-96 -2.225 -0.750 0.725
Bread Formulation = CB-inf-mw-96 subtracted from:
Bread Formulation Lower Center Upper
CB-X-G-E-conv-1 5.525 7.000 8.475
CB-X-G-E-conv-24 1.275 2.750 4.225
CB-X-G-E-conv-48 0.525 2.000 3.475
CB-X-G-E-conv-72 -0.075 1.400 2.875
CB-X-G-E-conv-96 -0.275 1.200 2.675
CB-X-G-E-inf-mw-1 5.575 7.050 8.525
CB-X-G-E-inf-mw-24 3.225 4.700 6.175
CB-X-G-E-inf-mw-48 2.125 3.600 5.075
CB-X-G-E-inf-mw-72 1.575 3.050 4.525
CB-X-G-E-inf-mw-96 1.375 2.850 4.325
287
RB-conv-1 0.725 2.200 3.675
RB-conv-24 -1.075 0.400 1.875
RB-conv-48 -2.625 -1.150 0.325
RB-conv-72 -3.175 -1.700 -0.225
RB-cov-96 -3.375 -1.900 -0.425
RB-inf-mw-1 -0.625 0.850 2.325
RB-inf-mw-24 -1.975 -0.500 0.975
RB-inf-mw-48 -2.425 -0.950 0.525
RB-inf-mw-72 -2.625 -1.150 0.325
RB-inf-mw-96 -3.125 -1.650 -0.175
RB-X-G-E-conv-1 2.725 4.200 5.675
RB-X-G-E-conv-24 1.025 2.500 3.975
RB-X-G-E-conv-48 -0.175 1.300 2.775
RB-X-G-E-conv-72 -0.625 0.850 2.325
RB-X-G-E-conv-96 -0.925 0.550 2.025
RB-X-G-E-inf-mw-1 1.125 2.600 4.075
RB-X-G-E-inf-mw-24 -0.775 0.700 2.175
RB-X-G-E-inf-mw-48 -1.275 0.200 1.675
RB-X-G-E-inf-mw-72 -1.675 -0.200 1.275
RB-X-G-E-inf-mw-96 -1.875 -0.400 1.075
Bread Formulation = CB-X-G-E-conv-1 subtracted from:
Bread Formulation Lower Center Upper
CB-X-G-E-conv-24 -5.725 -4.250 -2.775
CB-X-G-E-conv-48 -6.475 -5.000 -3.525
288
CB-X-G-E-conv-72 -7.075 -5.600 -4.125
CB-X-G-E-conv-96 -7.275 -5.800 -4.325
CB-X-G-E-inf-mw-1 -1.425 0.050 1.525
CB-X-G-E-inf-mw-24 -3.775 -2.300 -0.825
CB-X-G-E-inf-mw-48 -4.875 -3.400 -1.925
CB-X-G-E-inf-mw-72 -5.425 -3.950 -2.475
CB-X-G-E-inf-mw-96 -5.625 -4.150 -2.675
RB-conv-1 -6.275 -4.800 -3.325
RB-conv-24 -8.075 -6.600 -5.125
RB-conv-48 -9.625 -8.150 -6.675
RB-conv-72 -9.379 -8.700 -7.225
RB-cov-96 -9.234 -8.900 -7.425
RB-inf-mw-1 -7.625 -6.150 -4.675
RB-inf-mw-24 -8.975 -7.500 -6.025
RB-inf-mw-48 -9.425 -7.950 -6.475
RB-inf-mw-72 -9.625 -8.150 -6.675
RB-inf-mw-96 -9.569 -8.650 -7.175
RB-X-G-E-conv-1 -4.275 -2.800 -1.325
RB-X-G-E-conv-24 -5.975 -4.500 -3.025
RB-X-G-E-conv-48 -7.175 -5.700 -4.225
RB-X-G-E-conv-72 -7.625 -6.150 -4.675
RB-X-G-E-conv-96 -7.925 -6.450 -4.975
RB-X-G-E-inf-mw-1 -5.875 -4.400 -2.925
RB-X-G-E-inf-mw-24 -7.775 -6.300 -4.825
RB-X-G-E-inf-mw-48 -8.275 -6.800 -5.325
289
RB-X-G-E-inf-mw-72 -8.675 -7.200 -5.725
RB-X-G-E-inf-mw-96 -8.875 -7.400 -5.925
Bread Formulation = CB-X-G-E-conv-24 subtracted from:
Bread Formulation Lower Center Upper
CB-X-G-E-conv-48 -2.225 -0.750 0.725
CB-X-G-E-conv-72 -2.825 -1.350 0.125
CB-X-G-E-conv-96 -3.025 -1.550 -0.075
CB-X-G-E-inf-mw-1 2.825 4.300 5.775
CB-X-G-E-inf-mw-24 0.475 1.950 3.425
CB-X-G-E-inf-mw-48 -0.625 0.850 2.325
CB-X-G-E-inf-mw-72 -1.175 0.300 1.775
CB-X-G-E-inf-mw-96 -1.375 0.100 1.575
RB-conv-1 -2.025 -0.550 0.925
RB-conv-24 -3.825 -2.350 -0.875
RB-conv-48 -5.375 -3.900 -2.425
RB-conv-72 -5.925 -4.450 -2.975
RB-cov-96 -6.125 -4.650 -3.175
RB-inf-mw-1 -3.375 -1.900 -0.425
RB-inf-mw-24 -4.725 -3.250 -1.775
RB-inf-mw-48 -5.175 -3.700 -2.225
RB-inf-mw-72 -5.375 -3.900 -2.425
RB-inf-mw-96 -5.875 -4.400 -2.925
RB-X-G-E-conv-1 -0.025 1.450 2.925
RB-X-G-E-conv-24 -1.725 -0.250 1.225
290
RB-X-G-E-conv-48 -2.925 -1.450 0.025
RB-X-G-E-conv-72 -3.375 -1.900 -0.425
RB-X-G-E-conv-96 -3.675 -2.200 -0.725
RB-X-G-E-inf-mw-1 -1.625 -0.150 1.325
RB-X-G-E-inf-mw-24 -3.525 -2.050 -0.575
RB-X-G-E-inf-mw-48 -4.025 -2.550 -1.075
RB-X-G-E-inf-mw-72 -4.425 -2.950 -1.475
RB-X-G-E-inf-mw-96 -4.625 -3.150 -1.675
Bread Formulation = CB-X-G-E-conv-48 subtracted from:
Bread Formulation Lower Center Upper
CB-X-G-E-conv-72 -2.075 -0.600 0.875
CB-X-G-E-conv-96 -2.275 -0.800 0.675
CB-X-G-E-inf-mw-1 3.575 5.050 6.525
CB-X-G-E-inf-mw-24 1.225 2.700 4.175
CB-X-G-E-inf-mw-48 0.125 1.600 3.075
CB-X-G-E-inf-mw-72 -0.425 1.050 2.525
CB-X-G-E-inf-mw-96 -0.625 0.850 2.325
RB-conv-1 -1.275 0.200 1.675
RB-conv-24 -3.075 -1.600 -0.125
RB-conv-48 -4.625 -3.150 -1.675
RB-conv-72 -5.175 -3.700 -2.225
RB-cov-96 -5.375 -3.900 -2.425
RB-inf-mw-1 -2.625 -1.150 0.325
RB-inf-mw-24 -3.975 -2.500 -1.025
291
RB-inf-mw-48 -4.425 -2.950 -1.475
RB-inf-mw-72 -4.625 -3.150 -1.675
RB-inf-mw-96 -5.125 -3.650 -2.175
RB-X-G-E-conv-1 0.725 2.200 3.675
RB-X-G-E-conv-24 -0.975 0.500 1.975
RB-X-G-E-conv-48 -2.175 -0.700 0.775
RB-X-G-E-conv-72 -2.625 -1.150 0.325
RB-X-G-E-conv-96 -2.925 -1.450 0.025
RB-X-G-E-inf-mw-1 -0.875 0.600 2.075
RB-X-G-E-inf-mw-24 -2.775 -1.300 0.175
RB-X-G-E-inf-mw-48 -3.275 -1.800 -0.325
RB-X-G-E-inf-mw-72 -3.675 -2.200 -0.725
RB-X-G-E-inf-mw-96 -3.875 -2.400 -0.925
Bread Formulation = CB-X-G-E-conv-72 subtracted from:
Bread Formulation Lower Center Upper
CB-X-G-E-conv-96 -1.675 -0.200 1.275
CB-X-G-E-inf-mw-1 4.175 5.650 7.125
CB-X-G-E-inf-mw-24 1.825 3.300 4.775
CB-X-G-E-inf-mw-48 0.725 2.200 3.675
CB-X-G-E-inf-mw-72 0.175 1.650 3.125
CB-X-G-E-inf-mw-96 -0.025 1.450 2.925
RB-conv-1 -0.675 0.800 2.275
RB-conv-24 -2.475 -1.000 0.475
RB-conv-48 -4.025 -2.550 -1.075
292
RB-conv-72 -4.575 -3.100 -1.625
RB-cov-96 -4.775 -3.300 -1.825
RB-inf-mw-1 -2.025 -0.550 0.925
RB-inf-mw-24 -3.375 -1.900 -0.425
RB-inf-mw-48 -3.825 -2.350 -0.875
RB-inf-mw-72 -4.025 -2.550 -1.075
RB-inf-mw-96 -4.525 -3.050 -1.575
RB-X-G-E-conv-1 1.325 2.800 4.275
RB-X-G-E-conv-24 -0.375 1.100 2.575
RB-X-G-E-conv-48 -1.575 -0.100 1.375
RB-X-G-E-conv-72 -2.025 -0.550 0.925
RB-X-G-E-conv-96 -2.325 -0.850 0.625
RB-X-G-E-inf-mw-1 -0.275 1.200 2.675
RB-X-G-E-inf-mw-24 -2.175 -0.700 0.775
RB-X-G-E-inf-mw-48 -2.675 -1.200 0.275
RB-X-G-E-inf-mw-72 -3.075 -1.600 -0.125
RB-X-G-E-inf-mw-96 -3.275 -1.800 -0.325
Bread Formulation = CB-X-G-E-conv-96 subtracted from:
Bread Formulation Lower Center Upper
CB-X-G-E-inf-mw-1 4.375 5.850 7.325
CB-X-G-E-inf-mw-24 2.025 3.500 4.975
CB-X-G-E-inf-mw-48 0.925 2.400 3.875
CB-X-G-E-inf-mw-72 0.375 1.850 3.325
CB-X-G-E-inf-mw-96 0.175 1.650 3.125
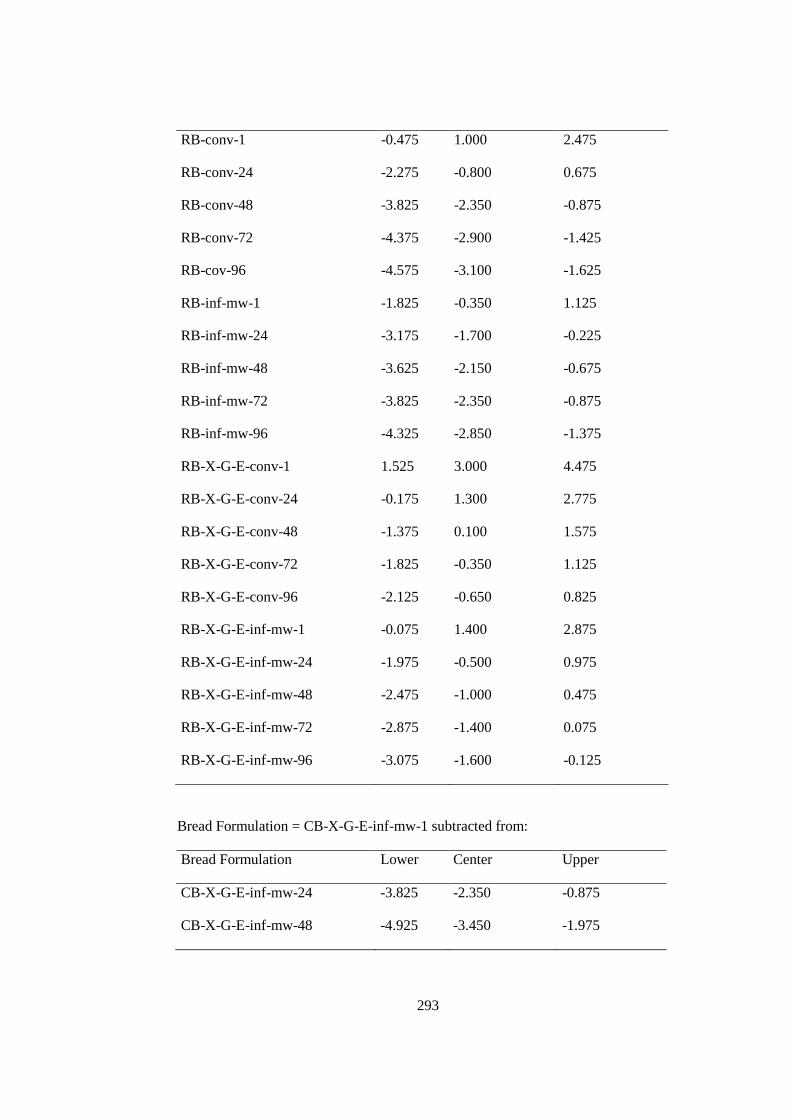
293
RB-conv-1 -0.475 1.000 2.475
RB-conv-24 -2.275 -0.800 0.675
RB-conv-48 -3.825 -2.350 -0.875
RB-conv-72 -4.375 -2.900 -1.425
RB-cov-96 -4.575 -3.100 -1.625
RB-inf-mw-1 -1.825 -0.350 1.125
RB-inf-mw-24 -3.175 -1.700 -0.225
RB-inf-mw-48 -3.625 -2.150 -0.675
RB-inf-mw-72 -3.825 -2.350 -0.875
RB-inf-mw-96 -4.325 -2.850 -1.375
RB-X-G-E-conv-1 1.525 3.000 4.475
RB-X-G-E-conv-24 -0.175 1.300 2.775
RB-X-G-E-conv-48 -1.375 0.100 1.575
RB-X-G-E-conv-72 -1.825 -0.350 1.125
RB-X-G-E-conv-96 -2.125 -0.650 0.825
RB-X-G-E-inf-mw-1 -0.075 1.400 2.875
RB-X-G-E-inf-mw-24 -1.975 -0.500 0.975
RB-X-G-E-inf-mw-48 -2.475 -1.000 0.475
RB-X-G-E-inf-mw-72 -2.875 -1.400 0.075
RB-X-G-E-inf-mw-96 -3.075 -1.600 -0.125
Bread Formulation = CB-X-G-E-inf-mw-1 subtracted from:
Bread Formulation Lower Center Upper
CB-X-G-E-inf-mw-24 -3.825 -2.350 -0.875
CB-X-G-E-inf-mw-48 -4.925 -3.450 -1.975
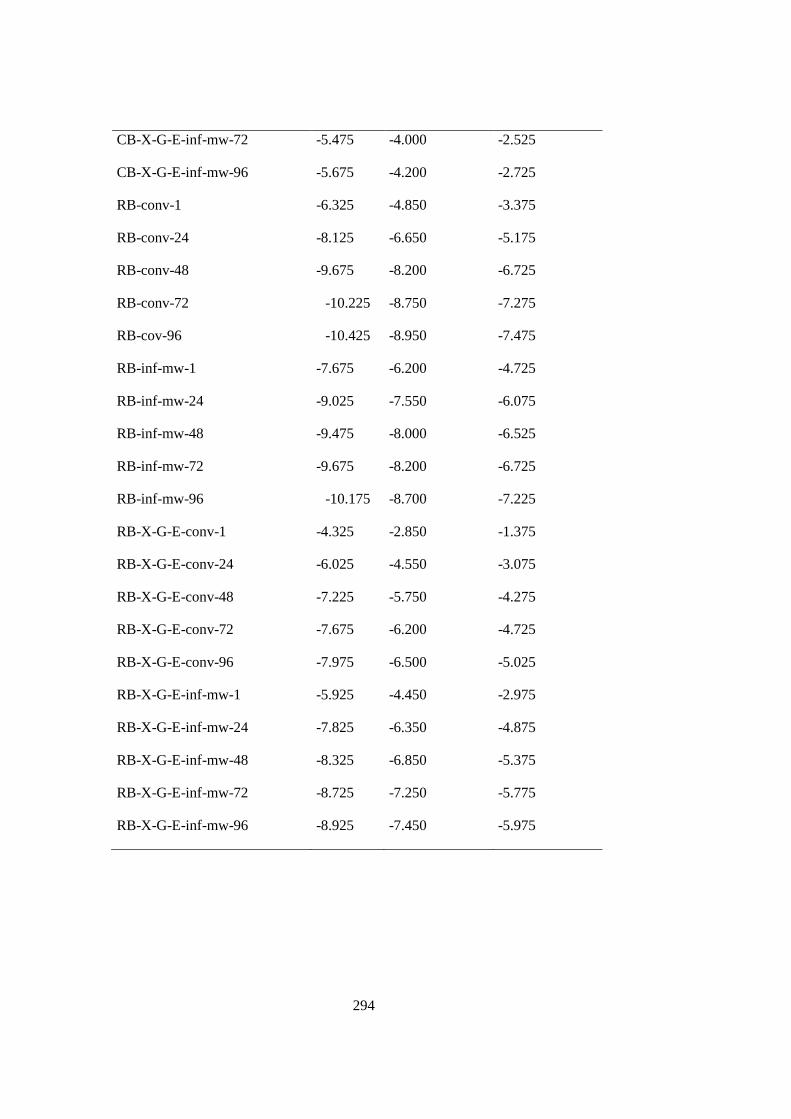
294
CB-X-G-E-inf-mw-72 -5.475 -4.000 -2.525
CB-X-G-E-inf-mw-96 -5.675 -4.200 -2.725
RB-conv-1 -6.325 -4.850 -3.375
RB-conv-24 -8.125 -6.650 -5.175
RB-conv-48 -9.675 -8.200 -6.725
RB-conv-72 -10.225 -8.750 -7.275
RB-cov-96 -10.425 -8.950 -7.475
RB-inf-mw-1 -7.675 -6.200 -4.725
RB-inf-mw-24 -9.025 -7.550 -6.075
RB-inf-mw-48 -9.475 -8.000 -6.525
RB-inf-mw-72 -9.675 -8.200 -6.725
RB-inf-mw-96 -10.175 -8.700 -7.225
RB-X-G-E-conv-1 -4.325 -2.850 -1.375
RB-X-G-E-conv-24 -6.025 -4.550 -3.075
RB-X-G-E-conv-48 -7.225 -5.750 -4.275
RB-X-G-E-conv-72 -7.675 -6.200 -4.725
RB-X-G-E-conv-96 -7.975 -6.500 -5.025
RB-X-G-E-inf-mw-1 -5.925 -4.450 -2.975
RB-X-G-E-inf-mw-24 -7.825 -6.350 -4.875
RB-X-G-E-inf-mw-48 -8.325 -6.850 -5.375
RB-X-G-E-inf-mw-72 -8.725 -7.250 -5.775
RB-X-G-E-inf-mw-96 -8.925 -7.450 -5.975
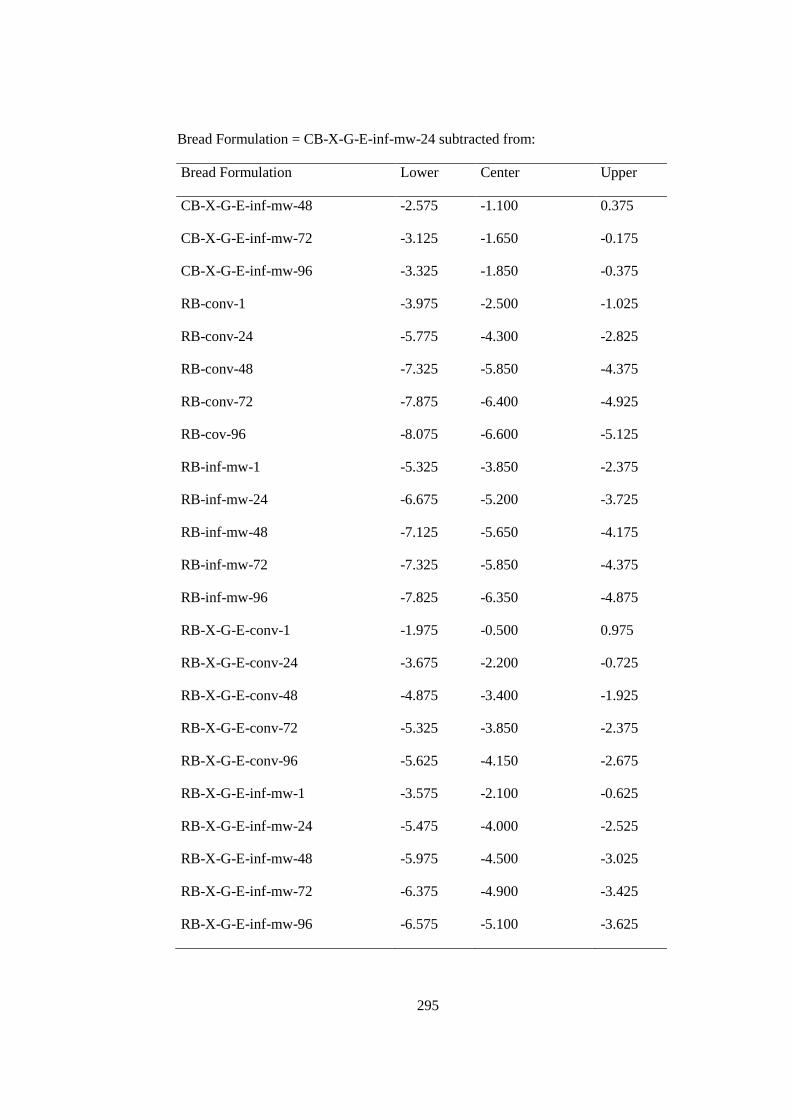
295
Bread Formulation = CB-X-G-E-inf-mw-24 subtracted from:
Bread Formulation Lower Center Upper
CB-X-G-E-inf-mw-48 -2.575 -1.100 0.375
CB-X-G-E-inf-mw-72 -3.125 -1.650 -0.175
CB-X-G-E-inf-mw-96 -3.325 -1.850 -0.375
RB-conv-1 -3.975 -2.500 -1.025
RB-conv-24 -5.775 -4.300 -2.825
RB-conv-48 -7.325 -5.850 -4.375
RB-conv-72 -7.875 -6.400 -4.925
RB-cov-96 -8.075 -6.600 -5.125
RB-inf-mw-1 -5.325 -3.850 -2.375
RB-inf-mw-24 -6.675 -5.200 -3.725
RB-inf-mw-48 -7.125 -5.650 -4.175
RB-inf-mw-72 -7.325 -5.850 -4.375
RB-inf-mw-96 -7.825 -6.350 -4.875
RB-X-G-E-conv-1 -1.975 -0.500 0.975
RB-X-G-E-conv-24 -3.675 -2.200 -0.725
RB-X-G-E-conv-48 -4.875 -3.400 -1.925
RB-X-G-E-conv-72 -5.325 -3.850 -2.375
RB-X-G-E-conv-96 -5.625 -4.150 -2.675
RB-X-G-E-inf-mw-1 -3.575 -2.100 -0.625
RB-X-G-E-inf-mw-24 -5.475 -4.000 -2.525
RB-X-G-E-inf-mw-48 -5.975 -4.500 -3.025
RB-X-G-E-inf-mw-72 -6.375 -4.900 -3.425
RB-X-G-E-inf-mw-96 -6.575 -5.100 -3.625
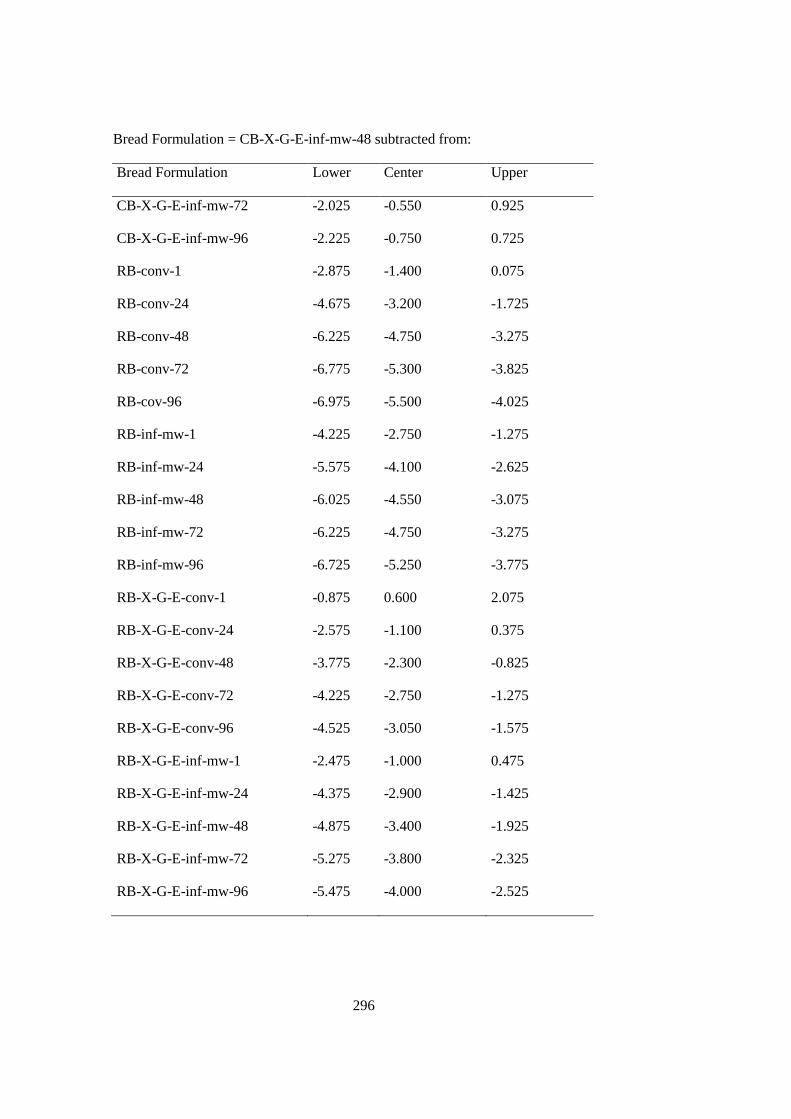
296
Bread Formulation = CB-X-G-E-inf-mw-48 subtracted from:
Bread Formulation Lower Center Upper
CB-X-G-E-inf-mw-72 -2.025 -0.550 0.925
CB-X-G-E-inf-mw-96 -2.225 -0.750 0.725
RB-conv-1 -2.875 -1.400 0.075
RB-conv-24 -4.675 -3.200 -1.725
RB-conv-48 -6.225 -4.750 -3.275
RB-conv-72 -6.775 -5.300 -3.825
RB-cov-96 -6.975 -5.500 -4.025
RB-inf-mw-1 -4.225 -2.750 -1.275
RB-inf-mw-24 -5.575 -4.100 -2.625
RB-inf-mw-48 -6.025 -4.550 -3.075
RB-inf-mw-72 -6.225 -4.750 -3.275
RB-inf-mw-96 -6.725 -5.250 -3.775
RB-X-G-E-conv-1 -0.875 0.600 2.075
RB-X-G-E-conv-24 -2.575 -1.100 0.375
RB-X-G-E-conv-48 -3.775 -2.300 -0.825
RB-X-G-E-conv-72 -4.225 -2.750 -1.275
RB-X-G-E-conv-96 -4.525 -3.050 -1.575
RB-X-G-E-inf-mw-1 -2.475 -1.000 0.475
RB-X-G-E-inf-mw-24 -4.375 -2.900 -1.425
RB-X-G-E-inf-mw-48 -4.875 -3.400 -1.925
RB-X-G-E-inf-mw-72 -5.275 -3.800 -2.325
RB-X-G-E-inf-mw-96 -5.475 -4.000 -2.525
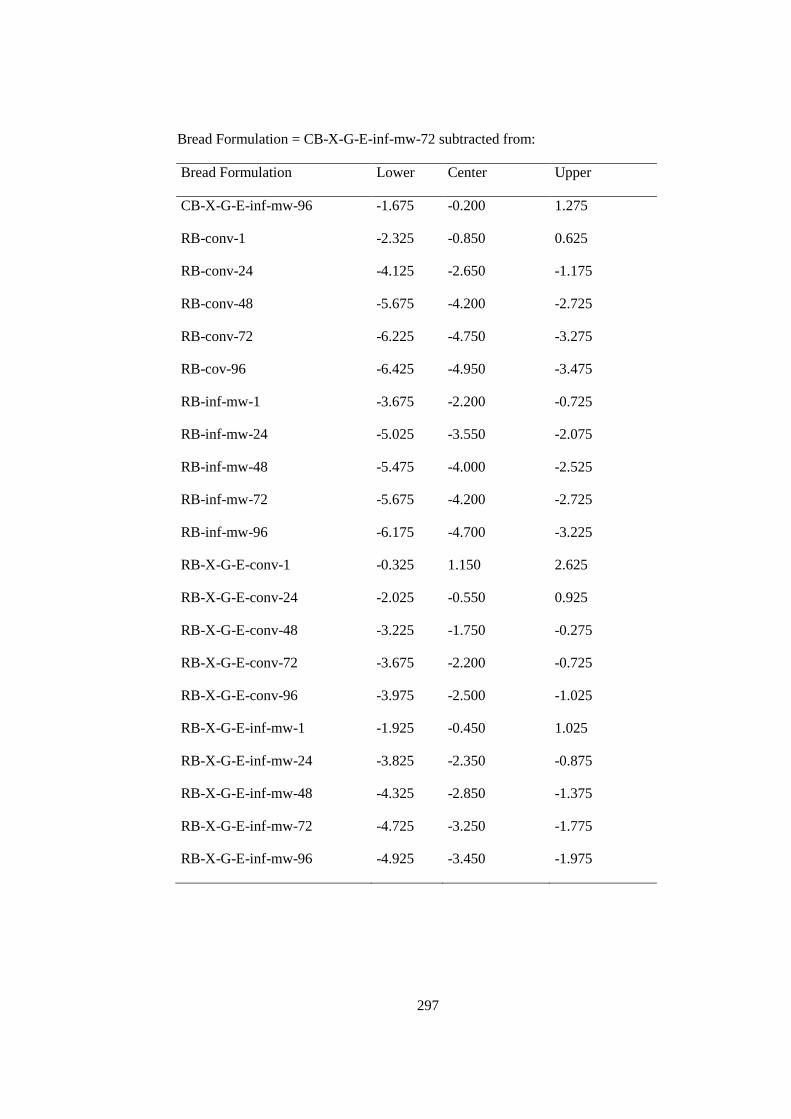
297
Bread Formulation = CB-X-G-E-inf-mw-72 subtracted from:
Bread Formulation Lower Center Upper
CB-X-G-E-inf-mw-96 -1.675 -0.200 1.275
RB-conv-1 -2.325 -0.850 0.625
RB-conv-24 -4.125 -2.650 -1.175
RB-conv-48 -5.675 -4.200 -2.725
RB-conv-72 -6.225 -4.750 -3.275
RB-cov-96 -6.425 -4.950 -3.475
RB-inf-mw-1 -3.675 -2.200 -0.725
RB-inf-mw-24 -5.025 -3.550 -2.075
RB-inf-mw-48 -5.475 -4.000 -2.525
RB-inf-mw-72 -5.675 -4.200 -2.725
RB-inf-mw-96 -6.175 -4.700 -3.225
RB-X-G-E-conv-1 -0.325 1.150 2.625
RB-X-G-E-conv-24 -2.025 -0.550 0.925
RB-X-G-E-conv-48 -3.225 -1.750 -0.275
RB-X-G-E-conv-72 -3.675 -2.200 -0.725
RB-X-G-E-conv-96 -3.975 -2.500 -1.025
RB-X-G-E-inf-mw-1 -1.925 -0.450 1.025
RB-X-G-E-inf-mw-24 -3.825 -2.350 -0.875
RB-X-G-E-inf-mw-48 -4.325 -2.850 -1.375
RB-X-G-E-inf-mw-72 -4.725 -3.250 -1.775
RB-X-G-E-inf-mw-96 -4.925 -3.450 -1.975
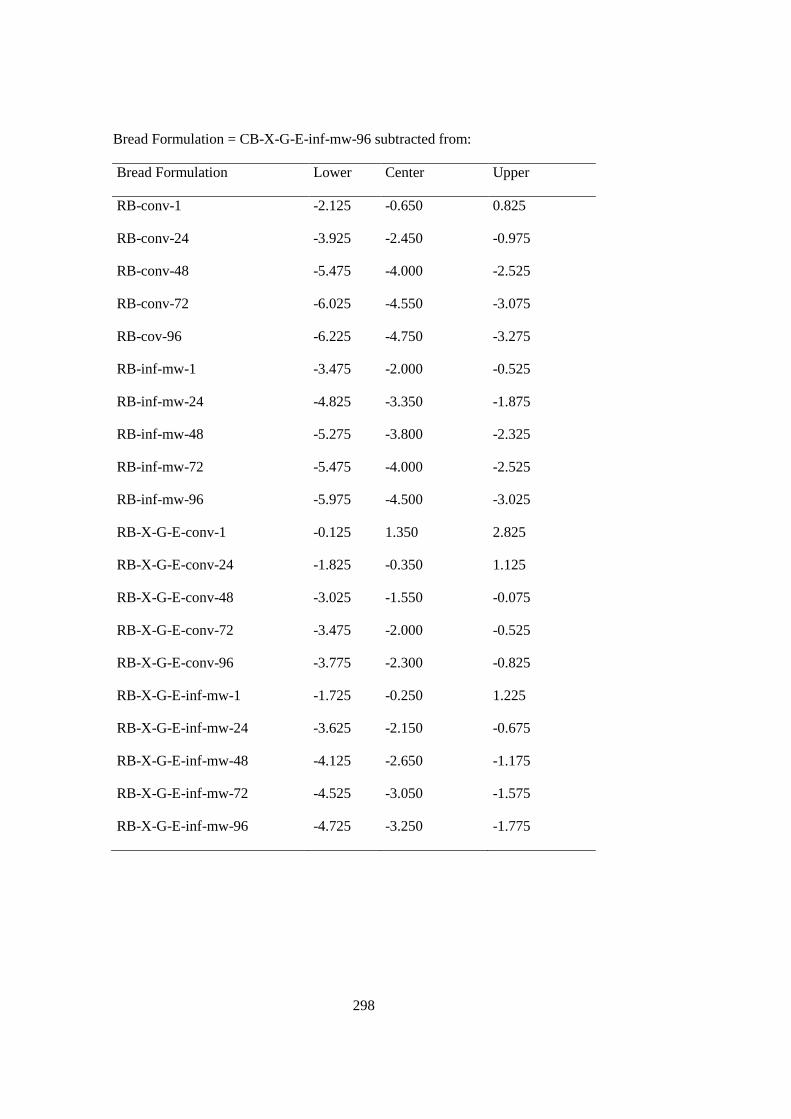
298
Bread Formulation = CB-X-G-E-inf-mw-96 subtracted from:
Bread Formulation Lower Center Upper
RB-conv-1 -2.125 -0.650 0.825
RB-conv-24 -3.925 -2.450 -0.975
RB-conv-48 -5.475 -4.000 -2.525
RB-conv-72 -6.025 -4.550 -3.075
RB-cov-96 -6.225 -4.750 -3.275
RB-inf-mw-1 -3.475 -2.000 -0.525
RB-inf-mw-24 -4.825 -3.350 -1.875
RB-inf-mw-48 -5.275 -3.800 -2.325
RB-inf-mw-72 -5.475 -4.000 -2.525
RB-inf-mw-96 -5.975 -4.500 -3.025
RB-X-G-E-conv-1 -0.125 1.350 2.825
RB-X-G-E-conv-24 -1.825 -0.350 1.125
RB-X-G-E-conv-48 -3.025 -1.550 -0.075
RB-X-G-E-conv-72 -3.475 -2.000 -0.525
RB-X-G-E-conv-96 -3.775 -2.300 -0.825
RB-X-G-E-inf-mw-1 -1.725 -0.250 1.225
RB-X-G-E-inf-mw-24 -3.625 -2.150 -0.675
RB-X-G-E-inf-mw-48 -4.125 -2.650 -1.175
RB-X-G-E-inf-mw-72 -4.525 -3.050 -1.575
RB-X-G-E-inf-mw-96 -4.725 -3.250 -1.775
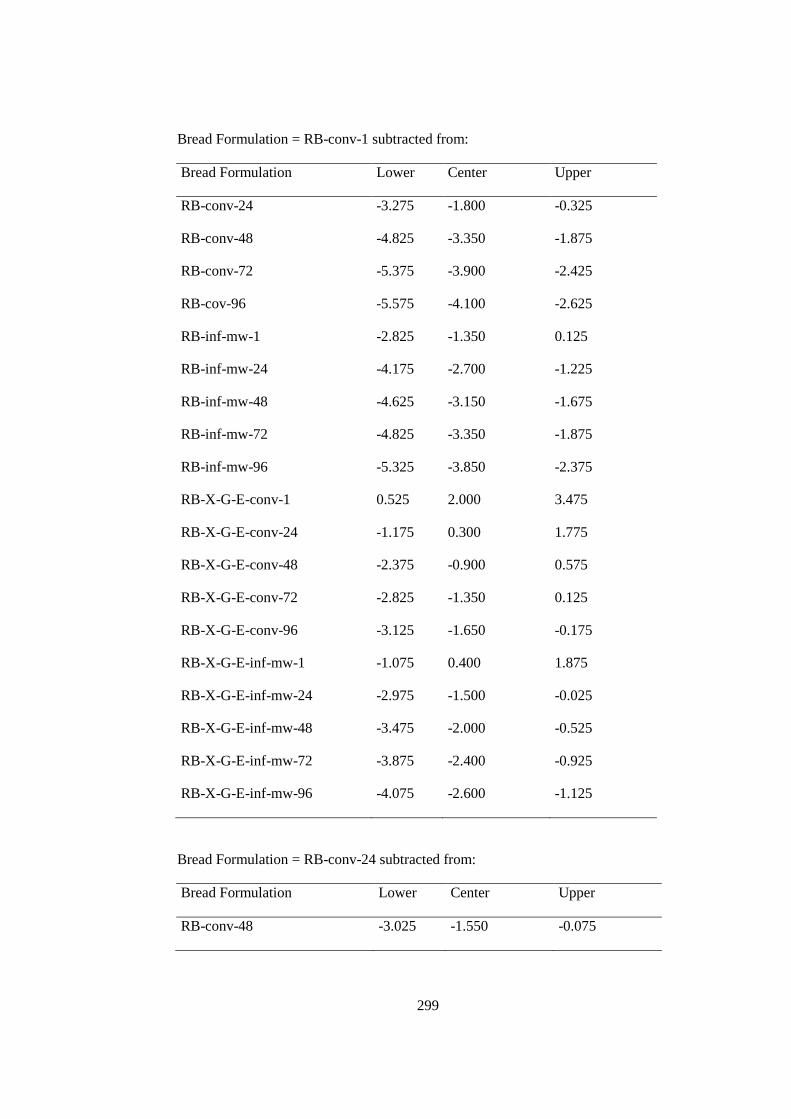
299
Bread Formulation = RB-conv-1 subtracted from:
Bread Formulation Lower Center Upper
RB-conv-24 -3.275 -1.800 -0.325
RB-conv-48 -4.825 -3.350 -1.875
RB-conv-72 -5.375 -3.900 -2.425
RB-cov-96 -5.575 -4.100 -2.625
RB-inf-mw-1 -2.825 -1.350 0.125
RB-inf-mw-24 -4.175 -2.700 -1.225
RB-inf-mw-48 -4.625 -3.150 -1.675
RB-inf-mw-72 -4.825 -3.350 -1.875
RB-inf-mw-96 -5.325 -3.850 -2.375
RB-X-G-E-conv-1 0.525 2.000 3.475
RB-X-G-E-conv-24 -1.175 0.300 1.775
RB-X-G-E-conv-48 -2.375 -0.900 0.575
RB-X-G-E-conv-72 -2.825 -1.350 0.125
RB-X-G-E-conv-96 -3.125 -1.650 -0.175
RB-X-G-E-inf-mw-1 -1.075 0.400 1.875
RB-X-G-E-inf-mw-24 -2.975 -1.500 -0.025
RB-X-G-E-inf-mw-48 -3.475 -2.000 -0.525
RB-X-G-E-inf-mw-72 -3.875 -2.400 -0.925
RB-X-G-E-inf-mw-96 -4.075 -2.600 -1.125
Bread Formulation = RB-conv-24 subtracted from:
Bread Formulation Lower Center Upper
RB-conv-48 -3.025 -1.550 -0.075
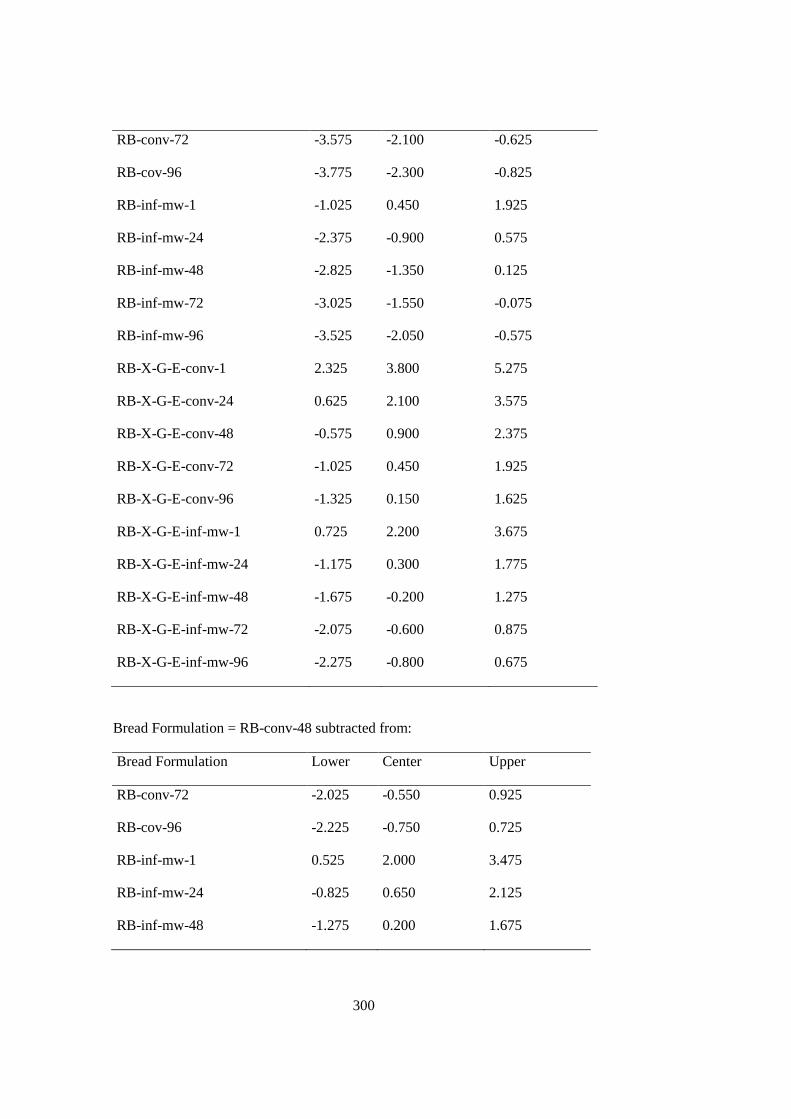
300
RB-conv-72 -3.575 -2.100 -0.625
RB-cov-96 -3.775 -2.300 -0.825
RB-inf-mw-1 -1.025 0.450 1.925
RB-inf-mw-24 -2.375 -0.900 0.575
RB-inf-mw-48 -2.825 -1.350 0.125
RB-inf-mw-72 -3.025 -1.550 -0.075
RB-inf-mw-96 -3.525 -2.050 -0.575
RB-X-G-E-conv-1 2.325 3.800 5.275
RB-X-G-E-conv-24 0.625 2.100 3.575
RB-X-G-E-conv-48 -0.575 0.900 2.375
RB-X-G-E-conv-72 -1.025 0.450 1.925
RB-X-G-E-conv-96 -1.325 0.150 1.625
RB-X-G-E-inf-mw-1 0.725 2.200 3.675
RB-X-G-E-inf-mw-24 -1.175 0.300 1.775
RB-X-G-E-inf-mw-48 -1.675 -0.200 1.275
RB-X-G-E-inf-mw-72 -2.075 -0.600 0.875
RB-X-G-E-inf-mw-96 -2.275 -0.800 0.675
Bread Formulation = RB-conv-48 subtracted from:
Bread Formulation Lower Center Upper
RB-conv-72 -2.025 -0.550 0.925
RB-cov-96 -2.225 -0.750 0.725
RB-inf-mw-1 0.525 2.000 3.475
RB-inf-mw-24 -0.825 0.650 2.125
RB-inf-mw-48 -1.275 0.200 1.675
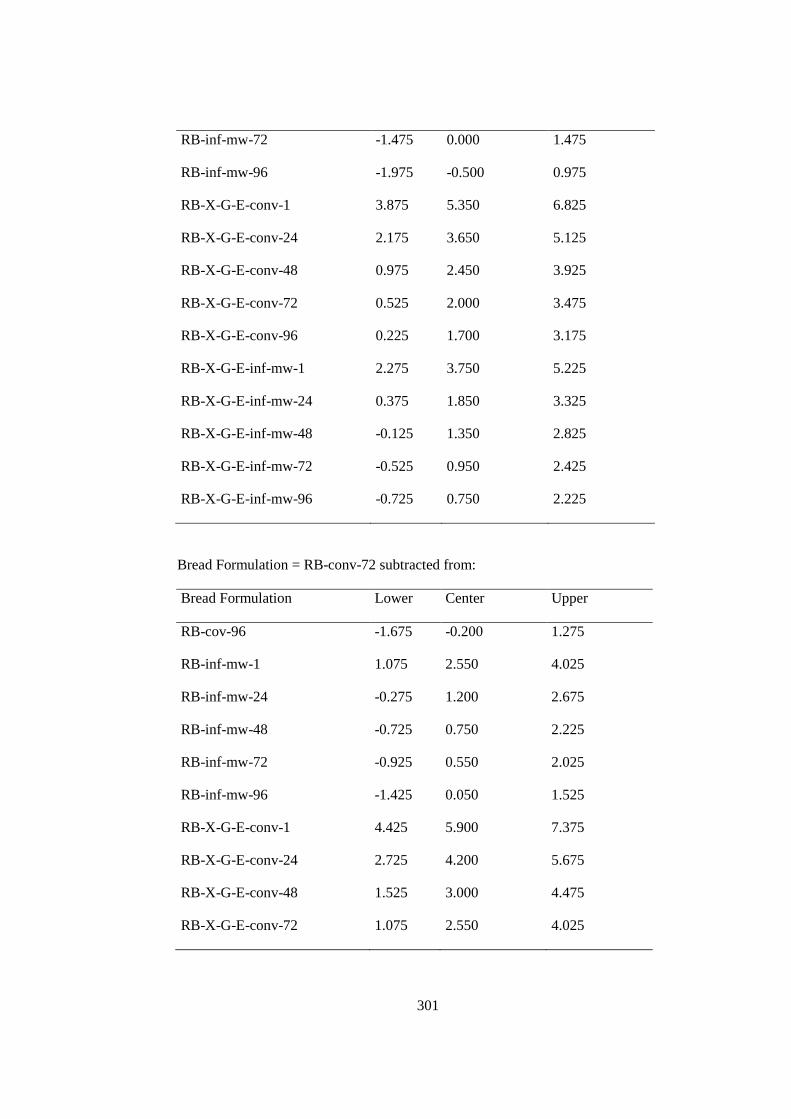
301
RB-inf-mw-72 -1.475 0.000 1.475
RB-inf-mw-96 -1.975 -0.500 0.975
RB-X-G-E-conv-1 3.875 5.350 6.825
RB-X-G-E-conv-24 2.175 3.650 5.125
RB-X-G-E-conv-48 0.975 2.450 3.925
RB-X-G-E-conv-72 0.525 2.000 3.475
RB-X-G-E-conv-96 0.225 1.700 3.175
RB-X-G-E-inf-mw-1 2.275 3.750 5.225
RB-X-G-E-inf-mw-24 0.375 1.850 3.325
RB-X-G-E-inf-mw-48 -0.125 1.350 2.825
RB-X-G-E-inf-mw-72 -0.525 0.950 2.425
RB-X-G-E-inf-mw-96 -0.725 0.750 2.225
Bread Formulation = RB-conv-72 subtracted from:
Bread Formulation Lower Center Upper
RB-cov-96 -1.675 -0.200 1.275
RB-inf-mw-1 1.075 2.550 4.025
RB-inf-mw-24 -0.275 1.200 2.675
RB-inf-mw-48 -0.725 0.750 2.225
RB-inf-mw-72 -0.925 0.550 2.025
RB-inf-mw-96 -1.425 0.050 1.525
RB-X-G-E-conv-1 4.425 5.900 7.375
RB-X-G-E-conv-24 2.725 4.200 5.675
RB-X-G-E-conv-48 1.525 3.000 4.475
RB-X-G-E-conv-72 1.075 2.550 4.025
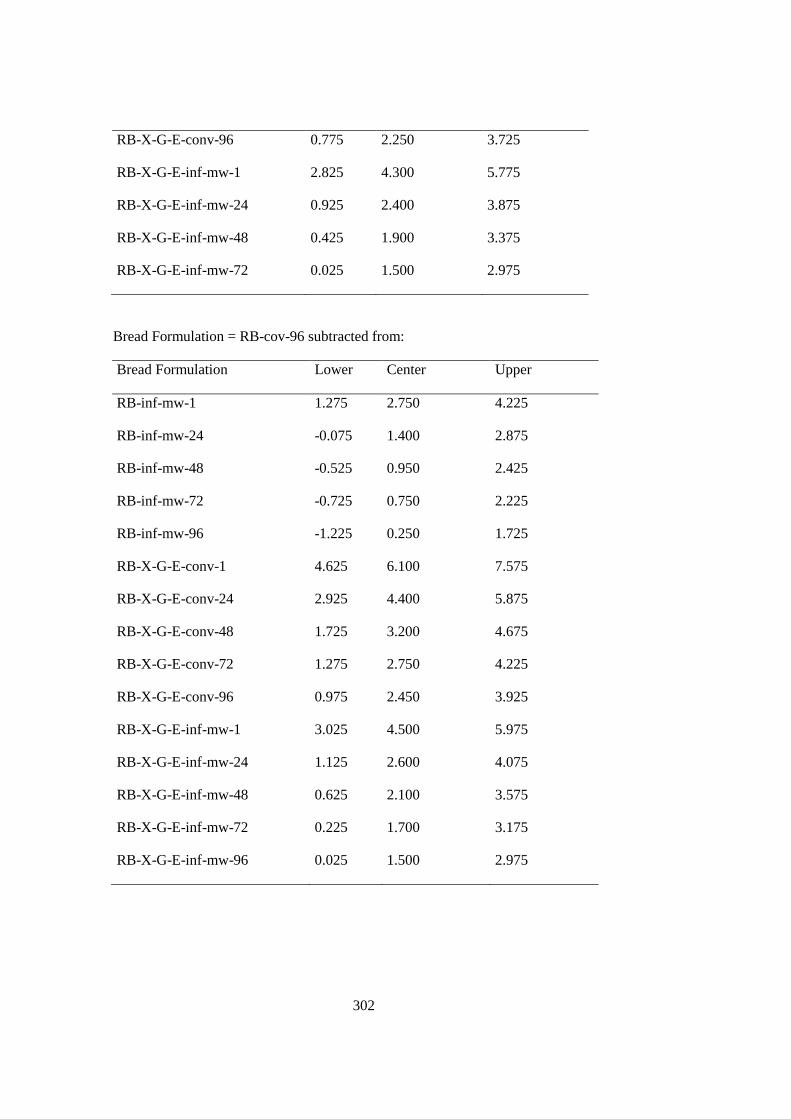
302
RB-X-G-E-conv-96 0.775 2.250 3.725
RB-X-G-E-inf-mw-1 2.825 4.300 5.775
RB-X-G-E-inf-mw-24 0.925 2.400 3.875
RB-X-G-E-inf-mw-48 0.425 1.900 3.375
RB-X-G-E-inf-mw-72 0.025 1.500 2.975
Bread Formulation = RB-cov-96 subtracted from:
Bread Formulation Lower Center Upper
RB-inf-mw-1 1.275 2.750 4.225
RB-inf-mw-24 -0.075 1.400 2.875
RB-inf-mw-48 -0.525 0.950 2.425
RB-inf-mw-72 -0.725 0.750 2.225
RB-inf-mw-96 -1.225 0.250 1.725
RB-X-G-E-conv-1 4.625 6.100 7.575
RB-X-G-E-conv-24 2.925 4.400 5.875
RB-X-G-E-conv-48 1.725 3.200 4.675
RB-X-G-E-conv-72 1.275 2.750 4.225
RB-X-G-E-conv-96 0.975 2.450 3.925
RB-X-G-E-inf-mw-1 3.025 4.500 5.975
RB-X-G-E-inf-mw-24 1.125 2.600 4.075
RB-X-G-E-inf-mw-48 0.625 2.100 3.575
RB-X-G-E-inf-mw-72 0.225 1.700 3.175
RB-X-G-E-inf-mw-96 0.025 1.500 2.975
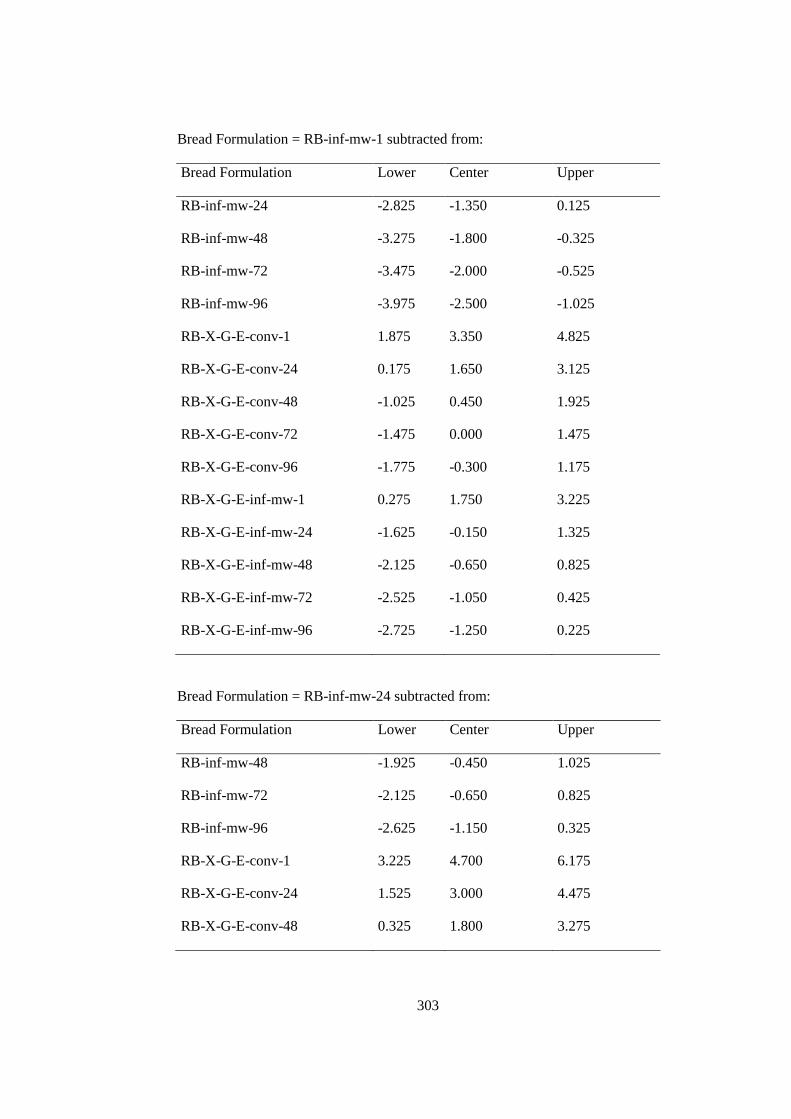
303
Bread Formulation = RB-inf-mw-1 subtracted from:
Bread Formulation Lower Center Upper
RB-inf-mw-24 -2.825 -1.350 0.125
RB-inf-mw-48 -3.275 -1.800 -0.325
RB-inf-mw-72 -3.475 -2.000 -0.525
RB-inf-mw-96 -3.975 -2.500 -1.025
RB-X-G-E-conv-1 1.875 3.350 4.825
RB-X-G-E-conv-24 0.175 1.650 3.125
RB-X-G-E-conv-48 -1.025 0.450 1.925
RB-X-G-E-conv-72 -1.475 0.000 1.475
RB-X-G-E-conv-96 -1.775 -0.300 1.175
RB-X-G-E-inf-mw-1 0.275 1.750 3.225
RB-X-G-E-inf-mw-24 -1.625 -0.150 1.325
RB-X-G-E-inf-mw-48 -2.125 -0.650 0.825
RB-X-G-E-inf-mw-72 -2.525 -1.050 0.425
RB-X-G-E-inf-mw-96 -2.725 -1.250 0.225
Bread Formulation = RB-inf-mw-24 subtracted from:
Bread Formulation Lower Center Upper
RB-inf-mw-48 -1.925 -0.450 1.025
RB-inf-mw-72 -2.125 -0.650 0.825
RB-inf-mw-96 -2.625 -1.150 0.325
RB-X-G-E-conv-1 3.225 4.700 6.175
RB-X-G-E-conv-24 1.525 3.000 4.475
RB-X-G-E-conv-48 0.325 1.800 3.275
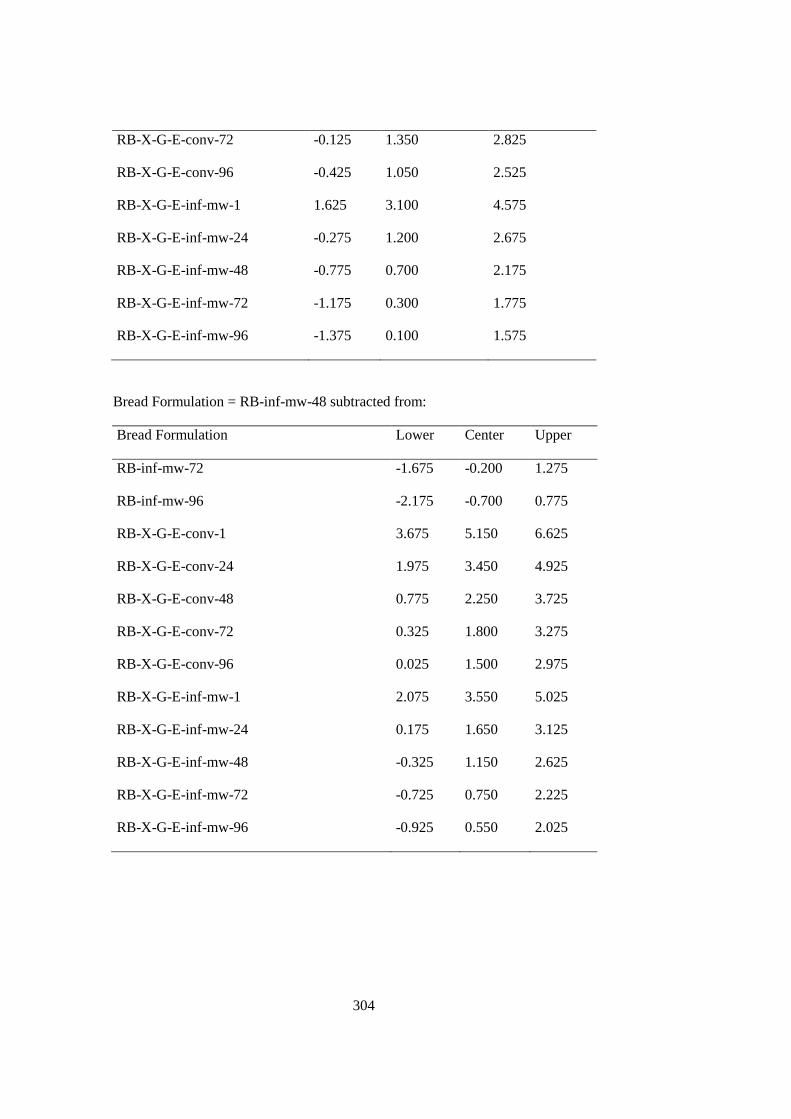
304
RB-X-G-E-conv-72 -0.125 1.350 2.825
RB-X-G-E-conv-96 -0.425 1.050 2.525
RB-X-G-E-inf-mw-1 1.625 3.100 4.575
RB-X-G-E-inf-mw-24 -0.275 1.200 2.675
RB-X-G-E-inf-mw-48 -0.775 0.700 2.175
RB-X-G-E-inf-mw-72 -1.175 0.300 1.775
RB-X-G-E-inf-mw-96 -1.375 0.100 1.575
Bread Formulation = RB-inf-mw-48 subtracted from:
Bread Formulation Lower Center Upper
RB-inf-mw-72 -1.675 -0.200 1.275
RB-inf-mw-96 -2.175 -0.700 0.775
RB-X-G-E-conv-1 3.675 5.150 6.625
RB-X-G-E-conv-24 1.975 3.450 4.925
RB-X-G-E-conv-48 0.775 2.250 3.725
RB-X-G-E-conv-72 0.325 1.800 3.275
RB-X-G-E-conv-96 0.025 1.500 2.975
RB-X-G-E-inf-mw-1 2.075 3.550 5.025
RB-X-G-E-inf-mw-24 0.175 1.650 3.125
RB-X-G-E-inf-mw-48 -0.325 1.150 2.625
RB-X-G-E-inf-mw-72 -0.725 0.750 2.225
RB-X-G-E-inf-mw-96 -0.925 0.550 2.025
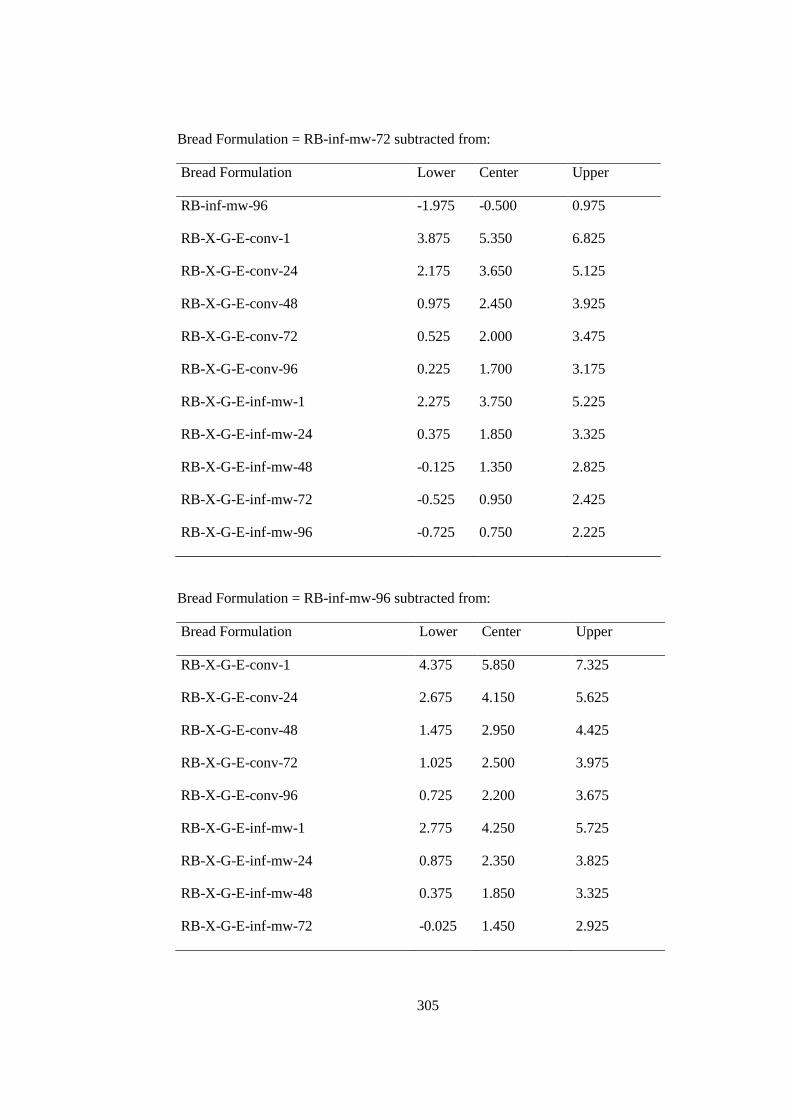
305
Bread Formulation = RB-inf-mw-72 subtracted from:
Bread Formulation Lower Center Upper
RB-inf-mw-96 -1.975 -0.500 0.975
RB-X-G-E-conv-1 3.875 5.350 6.825
RB-X-G-E-conv-24 2.175 3.650 5.125
RB-X-G-E-conv-48 0.975 2.450 3.925
RB-X-G-E-conv-72 0.525 2.000 3.475
RB-X-G-E-conv-96 0.225 1.700 3.175
RB-X-G-E-inf-mw-1 2.275 3.750 5.225
RB-X-G-E-inf-mw-24 0.375 1.850 3.325
RB-X-G-E-inf-mw-48 -0.125 1.350 2.825
RB-X-G-E-inf-mw-72 -0.525 0.950 2.425
RB-X-G-E-inf-mw-96 -0.725 0.750 2.225
Bread Formulation = RB-inf-mw-96 subtracted from:
Bread Formulation Lower Center Upper
RB-X-G-E-conv-1 4.375 5.850 7.325
RB-X-G-E-conv-24 2.675 4.150 5.625
RB-X-G-E-conv-48 1.475 2.950 4.425
RB-X-G-E-conv-72 1.025 2.500 3.975
RB-X-G-E-conv-96 0.725 2.200 3.675
RB-X-G-E-inf-mw-1 2.775 4.250 5.725
RB-X-G-E-inf-mw-24 0.875 2.350 3.825
RB-X-G-E-inf-mw-48 0.375 1.850 3.325
RB-X-G-E-inf-mw-72 -0.025 1.450 2.925
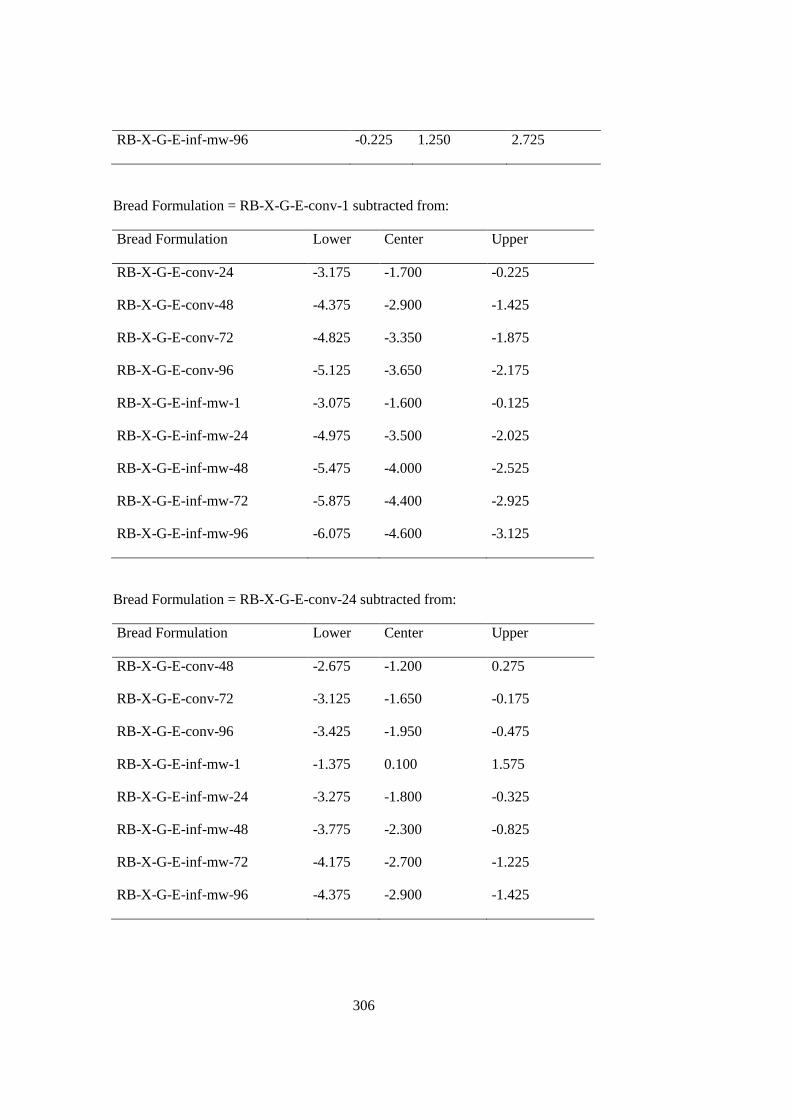
306
RB-X-G-E-inf-mw-96 -0.225 1.250 2.725
Bread Formulation = RB-X-G-E-conv-1 subtracted from:
Bread Formulation Lower Center Upper
RB-X-G-E-conv-24 -3.175 -1.700 -0.225
RB-X-G-E-conv-48 -4.375 -2.900 -1.425
RB-X-G-E-conv-72 -4.825 -3.350 -1.875
RB-X-G-E-conv-96 -5.125 -3.650 -2.175
RB-X-G-E-inf-mw-1 -3.075 -1.600 -0.125
RB-X-G-E-inf-mw-24 -4.975 -3.500 -2.025
RB-X-G-E-inf-mw-48 -5.475 -4.000 -2.525
RB-X-G-E-inf-mw-72 -5.875 -4.400 -2.925
RB-X-G-E-inf-mw-96 -6.075 -4.600 -3.125
Bread Formulation = RB-X-G-E-conv-24 subtracted from:
Bread Formulation Lower Center Upper
RB-X-G-E-conv-48 -2.675 -1.200 0.275
RB-X-G-E-conv-72 -3.125 -1.650 -0.175
RB-X-G-E-conv-96 -3.425 -1.950 -0.475
RB-X-G-E-inf-mw-1 -1.375 0.100 1.575
RB-X-G-E-inf-mw-24 -3.275 -1.800 -0.325
RB-X-G-E-inf-mw-48 -3.775 -2.300 -0.825
RB-X-G-E-inf-mw-72 -4.175 -2.700 -1.225
RB-X-G-E-inf-mw-96 -4.375 -2.900 -1.425
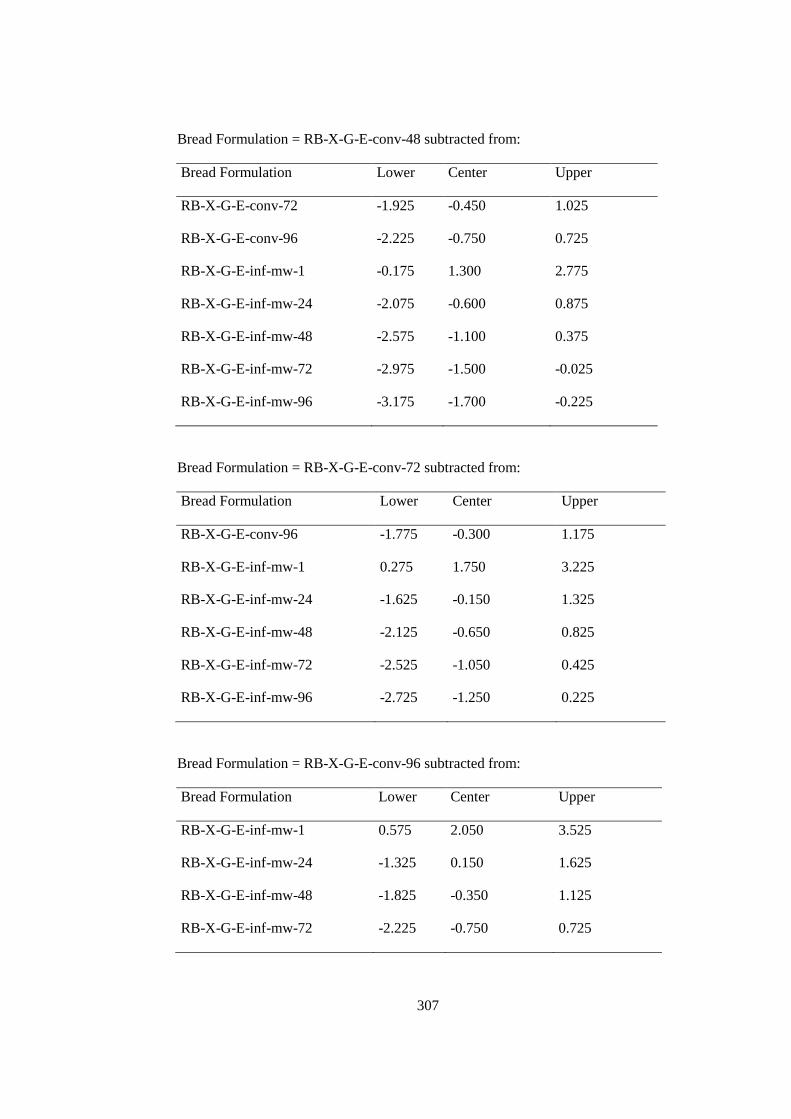
307
Bread Formulation = RB-X-G-E-conv-48 subtracted from:
Bread Formulation Lower Center Upper
RB-X-G-E-conv-72 -1.925 -0.450 1.025
RB-X-G-E-conv-96 -2.225 -0.750 0.725
RB-X-G-E-inf-mw-1 -0.175 1.300 2.775
RB-X-G-E-inf-mw-24 -2.075 -0.600 0.875
RB-X-G-E-inf-mw-48 -2.575 -1.100 0.375
RB-X-G-E-inf-mw-72 -2.975 -1.500 -0.025
RB-X-G-E-inf-mw-96 -3.175 -1.700 -0.225
Bread Formulation = RB-X-G-E-conv-72 subtracted from:
Bread Formulation Lower Center Upper
RB-X-G-E-conv-96 -1.775 -0.300 1.175
RB-X-G-E-inf-mw-1 0.275 1.750 3.225
RB-X-G-E-inf-mw-24 -1.625 -0.150 1.325
RB-X-G-E-inf-mw-48 -2.125 -0.650 0.825
RB-X-G-E-inf-mw-72 -2.525 -1.050 0.425
RB-X-G-E-inf-mw-96 -2.725 -1.250 0.225
Bread Formulation = RB-X-G-E-conv-96 subtracted from:
Bread Formulation Lower Center Upper
RB-X-G-E-inf-mw-1 0.575 2.050 3.525
RB-X-G-E-inf-mw-24 -1.325 0.150 1.625
RB-X-G-E-inf-mw-48 -1.825 -0.350 1.125
RB-X-G-E-inf-mw-72 -2.225 -0.750 0.725
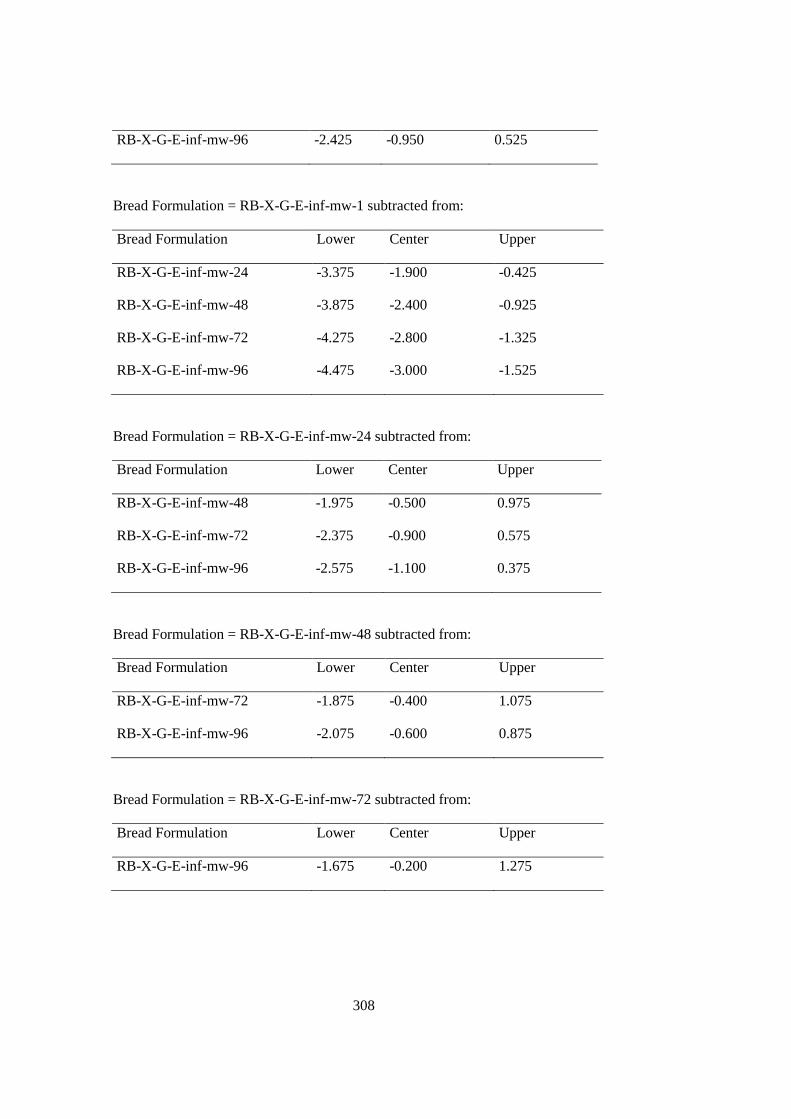
308
RB-X-G-E-inf-mw-96 -2.425 -0.950 0.525
Bread Formulation = RB-X-G-E-inf-mw-1 subtracted from:
Bread Formulation Lower Center Upper
RB-X-G-E-inf-mw-24 -3.375 -1.900 -0.425
RB-X-G-E-inf-mw-48 -3.875 -2.400 -0.925
RB-X-G-E-inf-mw-72 -4.275 -2.800 -1.325
RB-X-G-E-inf-mw-96 -4.475 -3.000 -1.525
Bread Formulation = RB-X-G-E-inf-mw-24 subtracted from:
Bread Formulation Lower Center Upper
RB-X-G-E-inf-mw-48 -1.975 -0.500 0.975
RB-X-G-E-inf-mw-72 -2.375 -0.900 0.575
RB-X-G-E-inf-mw-96 -2.575 -1.100 0.375
Bread Formulation = RB-X-G-E-inf-mw-48 subtracted from:
Bread Formulation Lower Center Upper
RB-X-G-E-inf-mw-72 -1.875 -0.400 1.075
RB-X-G-E-inf-mw-96 -2.075 -0.600 0.875
Bread Formulation = RB-X-G-E-inf-mw-72 subtracted from:
Bread Formulation Lower Center Upper
RB-X-G-E-inf-mw-96 -1.675 -0.200 1.275

309
Table A. 33. General linear model for firmness values of different gluten-free bread
formulations baked in different ovens and stored at different times
Factor Type Levels Values
Bread Formulation fixed 4 CB, CB-X-G-E, R, RB-X-G-E
Storage Time fixed 5 1, 24, 48, 72,96
Oven type fixed 2 Conv, ınf-mw
Source DF Seq SS Adj SS Adj MS F P
Bread
Formulation 3 159.682 159.682 53.227 582.98 0.000
Storage Time 4 233.607 233.607 58.402 639.65 0.000
Oven type 1 4.508 4.508 4.508 49.37 0.000
Error 71 6.482 6.482 0.091
Total 79 404.280
Formulation N Mean Grouping
RB 20 41.339 A
CB 20 41.489 B
RB-X-G-E 20 41.308 C
CB-X-G-E 20 41.396 D
Time N Mean Grouping
96 16 5.9 A
72 16 5.5 B
48 16 4.1 C
24 16 2.8 D
310
1 16 1.3 E
Oven type N Mean Grouping
ınf-mw 40 4.2 A
Conv 40 3.7 B
Table A. 34. One-way for firmness values of different gluten-free bread formulaions
baked in different ovens and stored at different times
Source DF SS MS F P
Bread Formulation 39 403.9962 103.589 1461.83 0.000
Error 40 0.2835 0.0071
Total 79 404.2796
Level N Mean StDev
CB-conv-1 2 0.9050 0.0495
CB-conv-24 2 2.3600 0.0707
CB-conv-48 2 3.4650 0.0778
CB-conv-72 2 5.2900 0.1131
CB-conv-96 2 5.7700 0.0424
CB-inf-mw-1 2 1.3150 0.0354
CB-inf-mw-24 2 3.0600 0.0849
CB-inf-mw-48 2 4.2850 0.0354
CB-inf-mw-72 2 5.6700 0.0707
CB-inf-mw-96 2 5.9550 0.0919
CB-X-G-E-conv-1 2 0.4150 0.0212
311
CB-X-G-E-conv-24 2 1.2200 0.0849
CB-X-G-E-conv-48 2 2.0550 0.1061
CB-X-G-E-conv-72 2 3.5900 0.0990
CB-X-G-E-conv-96 2 4.1050 0.1344
CB-X-G-E-inf-mw-1 2 0.6550 0.0495
CB-X-G-E-inf-mw-24 2 1.7150 0.0354
CB-X-G-E-inf-mw-48 2 2.8850 0.0636
CB-X-G-E-inf-mw-72 2 3.9900 0.1414
CB-X-G-E-inf-mw-96 2 4.4150 0.0495
RB-conv-1 2 2.7800 0.0707
RB-conv-24 2 4.9000 0.0707
RB-conv-48 2 6.7300 0.0707
RB-conv-72 2 7.7700 0.0707
RB-cov-96 2 8.0800 0.0849
RB-inf-mw-1 2 3.1750 0.1061
RB-inf-mw-24 2 5.2950 0.1202
RB-inf-mw-48 2 6.8050 0.0636
RB-inf-mw-72 2 8.4200 0.0849
RB-inf-mw-96 2 8.5850 0.1202
RB-X-G-E-conv-1 2 0.5400 0.0566
RB-X-G-E-conv-24 2 1.6200 0.0707
RB-X-G-E-conv-48 2 2.8050 0.0636
RB-X-G-E-conv-72 2 4.5850 0.0636
RB-X-G-E-conv-96 2 5.0850 0.1626
RB-X-G-E-inf-mw-1 2 0.9200 0.0707
312
RB-X-G-E-inf-mw-24 2 2.3700 0.0424
RB-X-G-E-inf-mw-48 2 3.5200 0.0990
RB-X-G-E-inf-mw-72 2 5.0650 0.1061
RB-X-G-E-inf-mw-96 2 5.4650 0.0778
Bread Formulation N Mean
RB-inf-mw-96 2 8.5850
RB-inf-mw-72 2 8.4200
RB-cov-96 2 8.0800
RB-conv-72 2 7.7700
RB-inf-mw-48 2 6.8050
RB-conv-48 2 6.7300
CB-inf-mw-96 2 5.9550
CB-conv-96 2 5.7700
CB-inf-mw-72 2 5.6700
RB-X-G-E-inf-mw-96 2 5.4650
RB-inf-mw-24 2 5.2950
CB-conv-72 2 5.2900
RB-X-G-E-conv-96 2 5.0850
RB-X-G-E-inf-mw-72 2 5.0650
RB-conv-24 2 4.9000
RB-X-G-E-conv-72 2 4.5850
CB-X-G-E-inf-mw-96 2 4.4150
CB-inf-mw-48 2 4.2850
CB-X-G-E-conv-96 2 4.1050
313
CB-X-G-E-inf-mw-72 2 3.9900
CB-X-G-E-conv-72 2 3.5900
RB-X-G-E-inf-mw-48 2 3.5200
CB-conv-48 2 3.4650
RB-inf-mw-1 2 3.1750
CB-inf-mw-24 2 3.0600
CB-X-G-E-inf-mw-48 2 2.8850
RB-X-G-E-conv-48 2 2.8050
RB-conv-1 2 2.7800
RB-X-G-E-inf-mw-24 2 2.3700
CB-conv-24 2 2.3600
CB-X-G-E-conv-48 2 2.0550
CB-X-G-E-inf-mw-24 2 1.7150
RB-X-G-E-conv-24 2 1.6200
CB-inf-mw-1 2 1.3150
CB-X-G-E-conv-24 2 1.2200
RB-X-G-E-inf-mw-1 2 0.9200
CB-conv-1 2 0.9050
CB-X-G-E-inf-mw-1 2 0.6550
RB-X-G-E-conv-1 2 0.5400
CB-X-G-E-conv-1 2 0.4150
Bread Formulation Grouping
RB-inf-mw-96 A
RB-inf-mw-72 A B
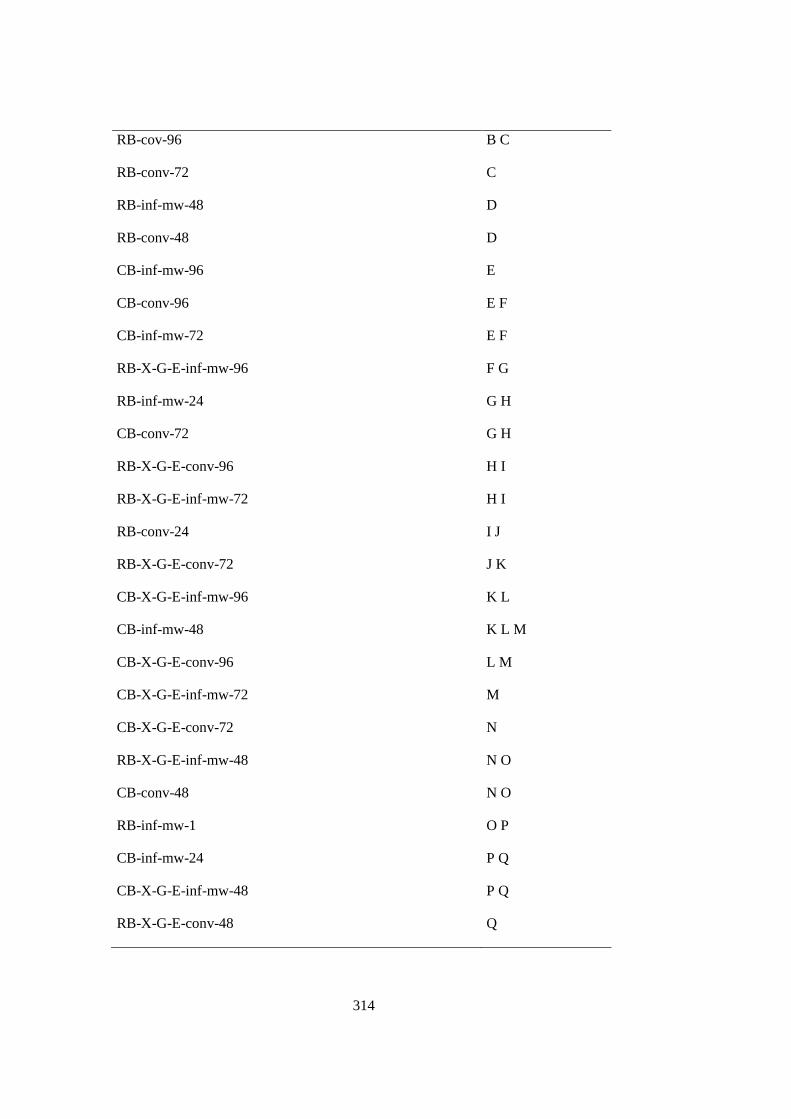
314
RB-cov-96 B C
RB-conv-72 C
RB-inf-mw-48 D
RB-conv-48 D
CB-inf-mw-96 E
CB-conv-96 E F
CB-inf-mw-72 E F
RB-X-G-E-inf-mw-96 F G
RB-inf-mw-24 G H
CB-conv-72 G H
RB-X-G-E-conv-96 H I
RB-X-G-E-inf-mw-72 H I
RB-conv-24 I J
RB-X-G-E-conv-72 J K
CB-X-G-E-inf-mw-96 K L
CB-inf-mw-48 K L M
CB-X-G-E-conv-96 L M
CB-X-G-E-inf-mw-72 M
CB-X-G-E-conv-72 N
RB-X-G-E-inf-mw-48 N O
CB-conv-48 N O
RB-inf-mw-1 O P
CB-inf-mw-24 P Q
CB-X-G-E-inf-mw-48 P Q
RB-X-G-E-conv-48 Q
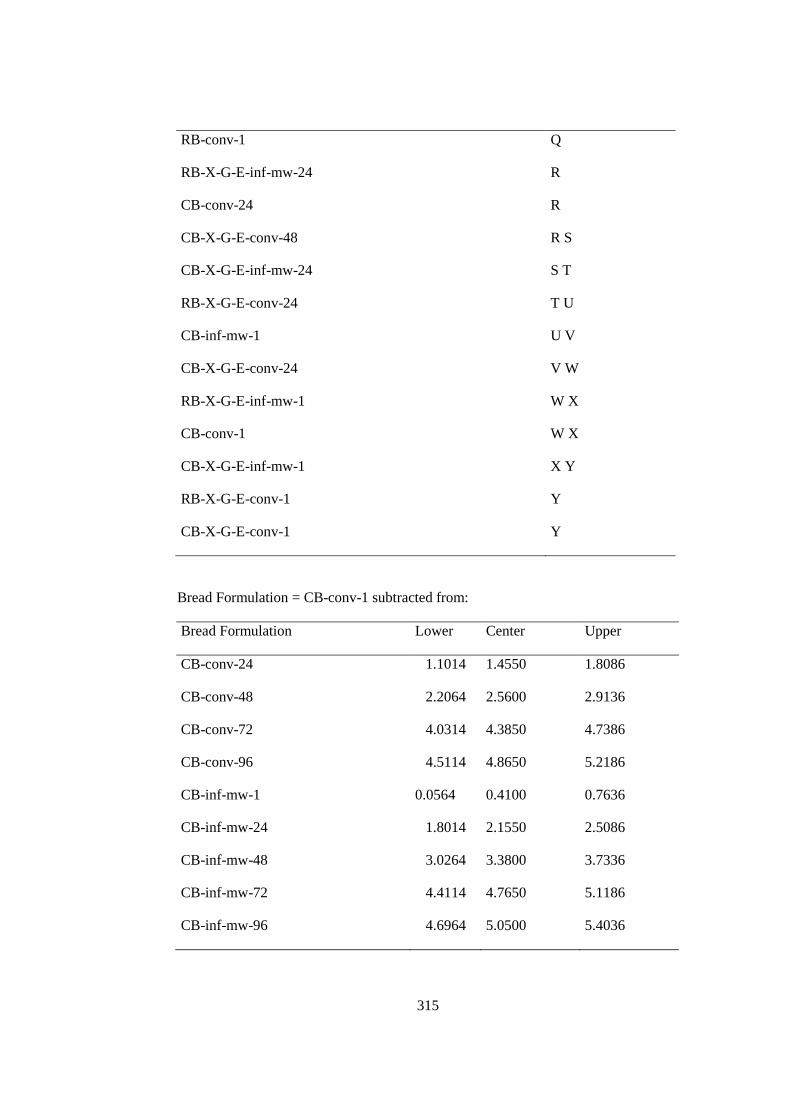
315
RB-conv-1 Q
RB-X-G-E-inf-mw-24 R
CB-conv-24 R
CB-X-G-E-conv-48 R S
CB-X-G-E-inf-mw-24 S T
RB-X-G-E-conv-24 T U
CB-inf-mw-1 U V
CB-X-G-E-conv-24 V W
RB-X-G-E-inf-mw-1 W X
CB-conv-1 W X
CB-X-G-E-inf-mw-1 X Y
RB-X-G-E-conv-1 Y
CB-X-G-E-conv-1 Y
Bread Formulation = CB-conv-1 subtracted from:
Bread Formulation Lower Center Upper
CB-conv-24 1.1014 1.4550 1.8086
CB-conv-48 2.2064 2.5600 2.9136
CB-conv-72 4.0314 4.3850 4.7386
CB-conv-96 4.5114 4.8650 5.2186
CB-inf-mw-1 0.0564 0.4100 0.7636
CB-inf-mw-24 1.8014 2.1550 2.5086
CB-inf-mw-48 3.0264 3.3800 3.7336
CB-inf-mw-72 4.4114 4.7650 5.1186
CB-inf-mw-96 4.6964 5.0500 5.4036
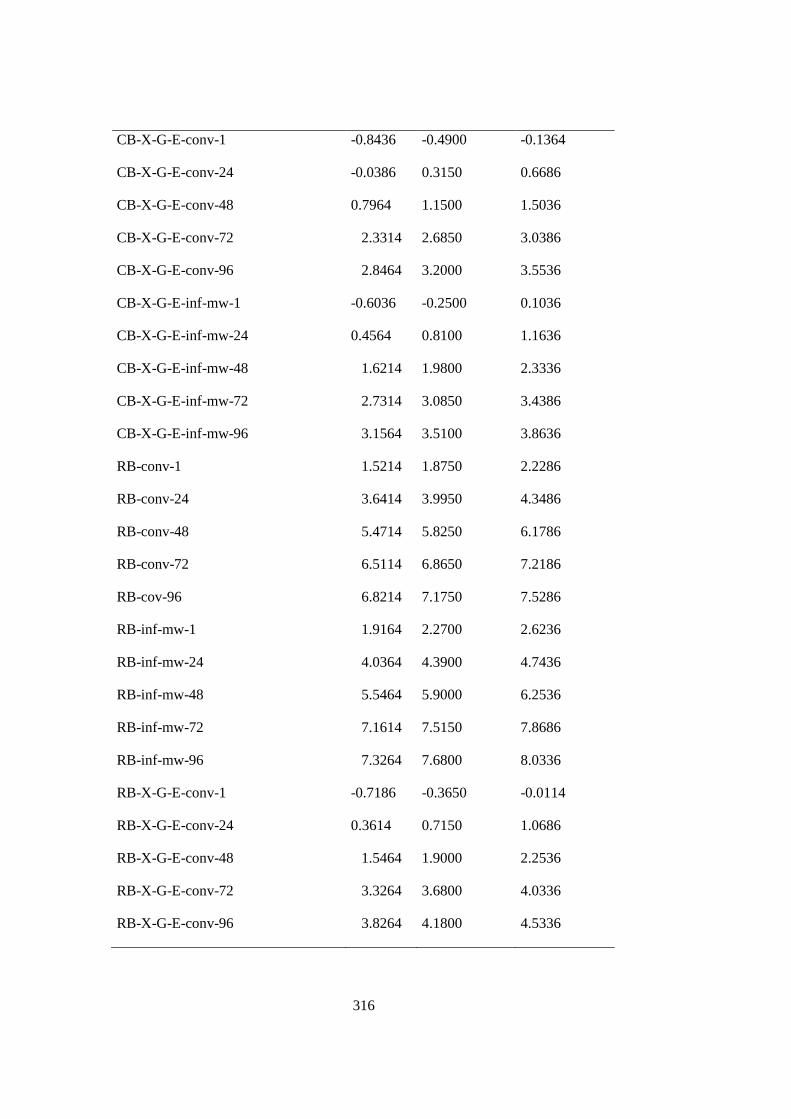
316
CB-X-G-E-conv-1 -0.8436 -0.4900 -0.1364
CB-X-G-E-conv-24 -0.0386 0.3150 0.6686
CB-X-G-E-conv-48 0.7964 1.1500 1.5036
CB-X-G-E-conv-72 2.3314 2.6850 3.0386
CB-X-G-E-conv-96 2.8464 3.2000 3.5536
CB-X-G-E-inf-mw-1 -0.6036 -0.2500 0.1036
CB-X-G-E-inf-mw-24 0.4564 0.8100 1.1636
CB-X-G-E-inf-mw-48 1.6214 1.9800 2.3336
CB-X-G-E-inf-mw-72 2.7314 3.0850 3.4386
CB-X-G-E-inf-mw-96 3.1564 3.5100 3.8636
RB-conv-1 1.5214 1.8750 2.2286
RB-conv-24 3.6414 3.9950 4.3486
RB-conv-48 5.4714 5.8250 6.1786
RB-conv-72 6.5114 6.8650 7.2186
RB-cov-96 6.8214 7.1750 7.5286
RB-inf-mw-1 1.9164 2.2700 2.6236
RB-inf-mw-24 4.0364 4.3900 4.7436
RB-inf-mw-48 5.5464 5.9000 6.2536
RB-inf-mw-72 7.1614 7.5150 7.8686
RB-inf-mw-96 7.3264 7.6800 8.0336
RB-X-G-E-conv-1 -0.7186 -0.3650 -0.0114
RB-X-G-E-conv-24 0.3614 0.7150 1.0686
RB-X-G-E-conv-48 1.5464 1.9000 2.2536
RB-X-G-E-conv-72 3.3264 3.6800 4.0336
RB-X-G-E-conv-96 3.8264 4.1800 4.5336
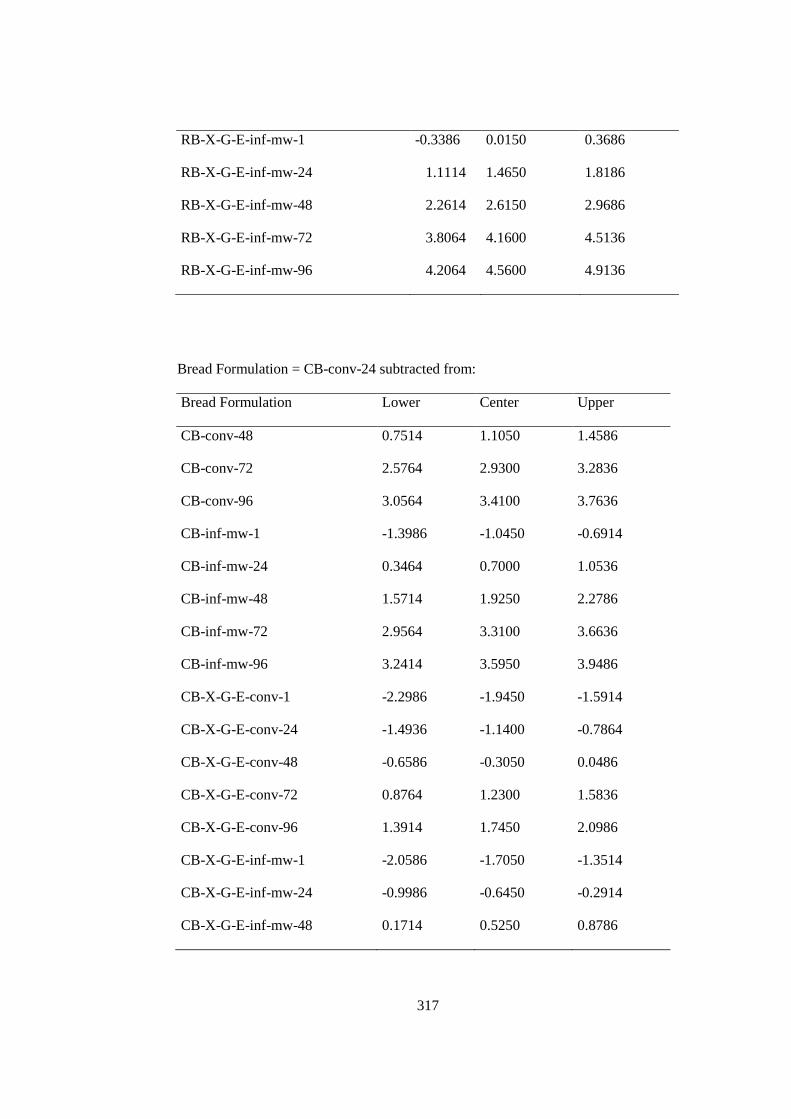
317
RB-X-G-E-inf-mw-1 -0.3386 0.0150 0.3686
RB-X-G-E-inf-mw-24 1.1114 1.4650 1.8186
RB-X-G-E-inf-mw-48 2.2614 2.6150 2.9686
RB-X-G-E-inf-mw-72 3.8064 4.1600 4.5136
RB-X-G-E-inf-mw-96 4.2064 4.5600 4.9136
Bread Formulation = CB-conv-24 subtracted from:
Bread Formulation Lower Center Upper
CB-conv-48 0.7514 1.1050 1.4586
CB-conv-72 2.5764 2.9300 3.2836
CB-conv-96 3.0564 3.4100 3.7636
CB-inf-mw-1 -1.3986 -1.0450 -0.6914
CB-inf-mw-24 0.3464 0.7000 1.0536
CB-inf-mw-48 1.5714 1.9250 2.2786
CB-inf-mw-72 2.9564 3.3100 3.6636
CB-inf-mw-96 3.2414 3.5950 3.9486
CB-X-G-E-conv-1 -2.2986 -1.9450 -1.5914
CB-X-G-E-conv-24 -1.4936 -1.1400 -0.7864
CB-X-G-E-conv-48 -0.6586 -0.3050 0.0486
CB-X-G-E-conv-72 0.8764 1.2300 1.5836
CB-X-G-E-conv-96 1.3914 1.7450 2.0986
CB-X-G-E-inf-mw-1 -2.0586 -1.7050 -1.3514
CB-X-G-E-inf-mw-24 -0.9986 -0.6450 -0.2914
CB-X-G-E-inf-mw-48 0.1714 0.5250 0.8786
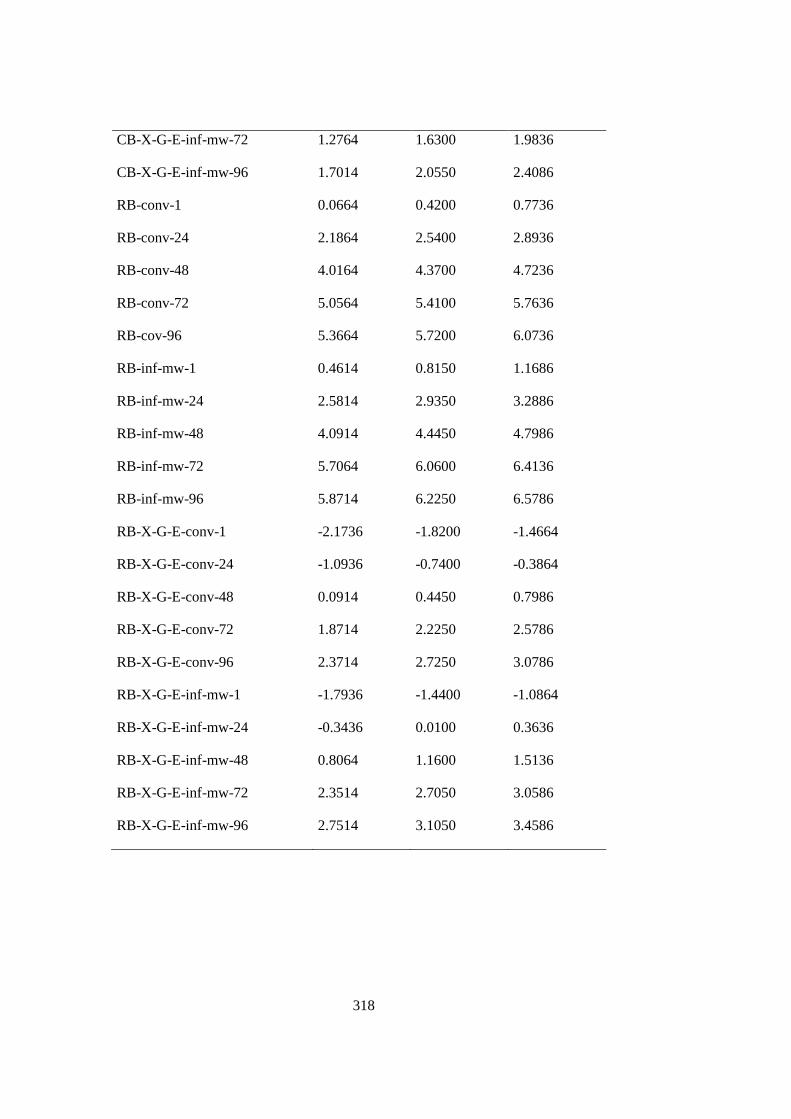
318
CB-X-G-E-inf-mw-72 1.2764 1.6300 1.9836
CB-X-G-E-inf-mw-96 1.7014 2.0550 2.4086
RB-conv-1 0.0664 0.4200 0.7736
RB-conv-24 2.1864 2.5400 2.8936
RB-conv-48 4.0164 4.3700 4.7236
RB-conv-72 5.0564 5.4100 5.7636
RB-cov-96 5.3664 5.7200 6.0736
RB-inf-mw-1 0.4614 0.8150 1.1686
RB-inf-mw-24 2.5814 2.9350 3.2886
RB-inf-mw-48 4.0914 4.4450 4.7986
RB-inf-mw-72 5.7064 6.0600 6.4136
RB-inf-mw-96 5.8714 6.2250 6.5786
RB-X-G-E-conv-1 -2.1736 -1.8200 -1.4664
RB-X-G-E-conv-24 -1.0936 -0.7400 -0.3864
RB-X-G-E-conv-48 0.0914 0.4450 0.7986
RB-X-G-E-conv-72 1.8714 2.2250 2.5786
RB-X-G-E-conv-96 2.3714 2.7250 3.0786
RB-X-G-E-inf-mw-1 -1.7936 -1.4400 -1.0864
RB-X-G-E-inf-mw-24 -0.3436 0.0100 0.3636
RB-X-G-E-inf-mw-48 0.8064 1.1600 1.5136
RB-X-G-E-inf-mw-72 2.3514 2.7050 3.0586
RB-X-G-E-inf-mw-96 2.7514 3.1050 3.4586
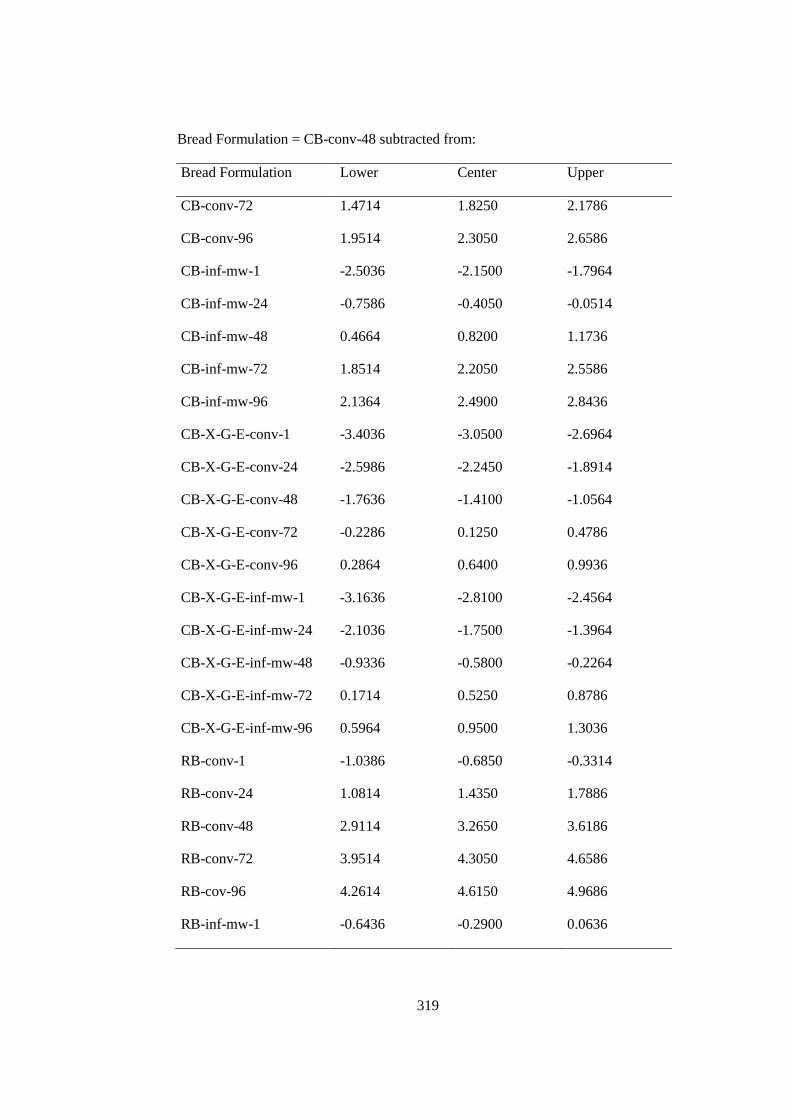
319
Bread Formulation = CB-conv-48 subtracted from:
Bread Formulation Lower Center Upper
CB-conv-72 1.4714 1.8250 2.1786
CB-conv-96 1.9514 2.3050 2.6586
CB-inf-mw-1 -2.5036 -2.1500 -1.7964
CB-inf-mw-24 -0.7586 -0.4050 -0.0514
CB-inf-mw-48 0.4664 0.8200 1.1736
CB-inf-mw-72 1.8514 2.2050 2.5586
CB-inf-mw-96 2.1364 2.4900 2.8436
CB-X-G-E-conv-1 -3.4036 -3.0500 -2.6964
CB-X-G-E-conv-24 -2.5986 -2.2450 -1.8914
CB-X-G-E-conv-48 -1.7636 -1.4100 -1.0564
CB-X-G-E-conv-72 -0.2286 0.1250 0.4786
CB-X-G-E-conv-96 0.2864 0.6400 0.9936
CB-X-G-E-inf-mw-1 -3.1636 -2.8100 -2.4564
CB-X-G-E-inf-mw-24 -2.1036 -1.7500 -1.3964
CB-X-G-E-inf-mw-48 -0.9336 -0.5800 -0.2264
CB-X-G-E-inf-mw-72 0.1714 0.5250 0.8786
CB-X-G-E-inf-mw-96 0.5964 0.9500 1.3036
RB-conv-1 -1.0386 -0.6850 -0.3314
RB-conv-24 1.0814 1.4350 1.7886
RB-conv-48 2.9114 3.2650 3.6186
RB-conv-72 3.9514 4.3050 4.6586
RB-cov-96 4.2614 4.6150 4.9686
RB-inf-mw-1 -0.6436 -0.2900 0.0636
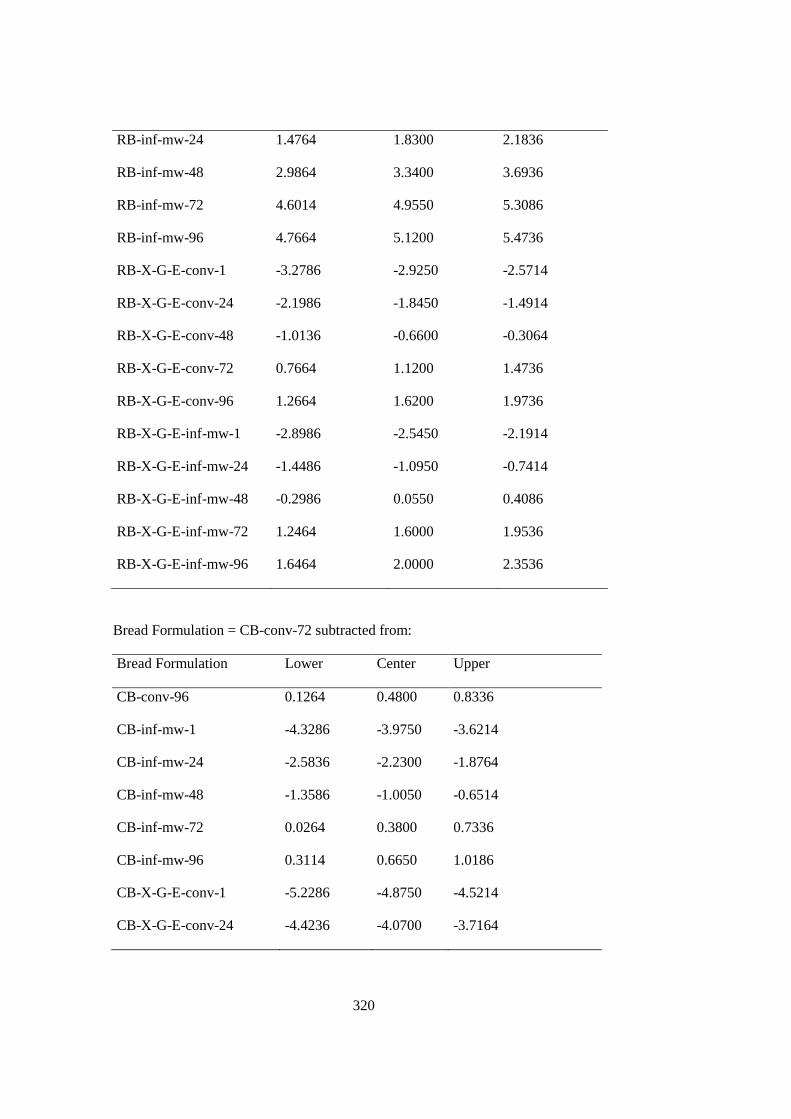
320
RB-inf-mw-24 1.4764 1.8300 2.1836
RB-inf-mw-48 2.9864 3.3400 3.6936
RB-inf-mw-72 4.6014 4.9550 5.3086
RB-inf-mw-96 4.7664 5.1200 5.4736
RB-X-G-E-conv-1 -3.2786 -2.9250 -2.5714
RB-X-G-E-conv-24 -2.1986 -1.8450 -1.4914
RB-X-G-E-conv-48 -1.0136 -0.6600 -0.3064
RB-X-G-E-conv-72 0.7664 1.1200 1.4736
RB-X-G-E-conv-96 1.2664 1.6200 1.9736
RB-X-G-E-inf-mw-1 -2.8986 -2.5450 -2.1914
RB-X-G-E-inf-mw-24 -1.4486 -1.0950 -0.7414
RB-X-G-E-inf-mw-48 -0.2986 0.0550 0.4086
RB-X-G-E-inf-mw-72 1.2464 1.6000 1.9536
RB-X-G-E-inf-mw-96 1.6464 2.0000 2.3536
Bread Formulation = CB-conv-72 subtracted from:
Bread Formulation Lower Center Upper
CB-conv-96 0.1264 0.4800 0.8336
CB-inf-mw-1 -4.3286 -3.9750 -3.6214
CB-inf-mw-24 -2.5836 -2.2300 -1.8764
CB-inf-mw-48 -1.3586 -1.0050 -0.6514
CB-inf-mw-72 0.0264 0.3800 0.7336
CB-inf-mw-96 0.3114 0.6650 1.0186
CB-X-G-E-conv-1 -5.2286 -4.8750 -4.5214
CB-X-G-E-conv-24 -4.4236 -4.0700 -3.7164
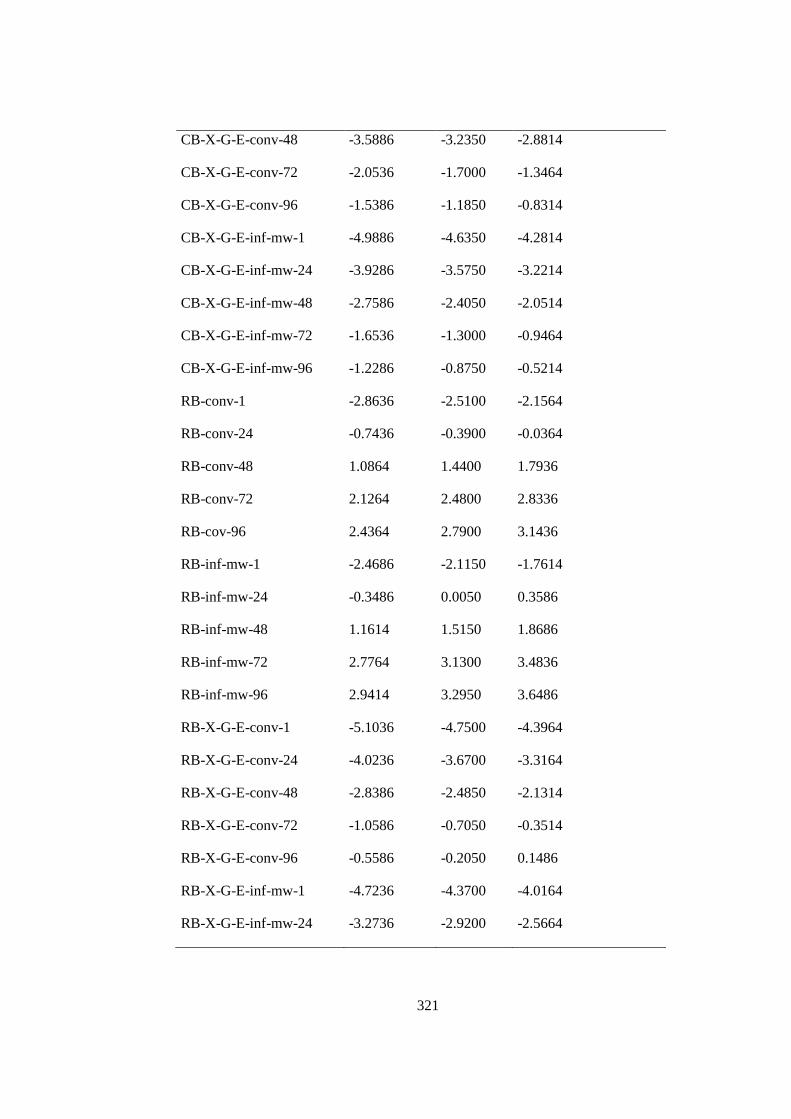
321
CB-X-G-E-conv-48 -3.5886 -3.2350 -2.8814
CB-X-G-E-conv-72 -2.0536 -1.7000 -1.3464
CB-X-G-E-conv-96 -1.5386 -1.1850 -0.8314
CB-X-G-E-inf-mw-1 -4.9886 -4.6350 -4.2814
CB-X-G-E-inf-mw-24 -3.9286 -3.5750 -3.2214
CB-X-G-E-inf-mw-48 -2.7586 -2.4050 -2.0514
CB-X-G-E-inf-mw-72 -1.6536 -1.3000 -0.9464
CB-X-G-E-inf-mw-96 -1.2286 -0.8750 -0.5214
RB-conv-1 -2.8636 -2.5100 -2.1564
RB-conv-24 -0.7436 -0.3900 -0.0364
RB-conv-48 1.0864 1.4400 1.7936
RB-conv-72 2.1264 2.4800 2.8336
RB-cov-96 2.4364 2.7900 3.1436
RB-inf-mw-1 -2.4686 -2.1150 -1.7614
RB-inf-mw-24 -0.3486 0.0050 0.3586
RB-inf-mw-48 1.1614 1.5150 1.8686
RB-inf-mw-72 2.7764 3.1300 3.4836
RB-inf-mw-96 2.9414 3.2950 3.6486
RB-X-G-E-conv-1 -5.1036 -4.7500 -4.3964
RB-X-G-E-conv-24 -4.0236 -3.6700 -3.3164
RB-X-G-E-conv-48 -2.8386 -2.4850 -2.1314
RB-X-G-E-conv-72 -1.0586 -0.7050 -0.3514
RB-X-G-E-conv-96 -0.5586 -0.2050 0.1486
RB-X-G-E-inf-mw-1 -4.7236 -4.3700 -4.0164
RB-X-G-E-inf-mw-24 -3.2736 -2.9200 -2.5664
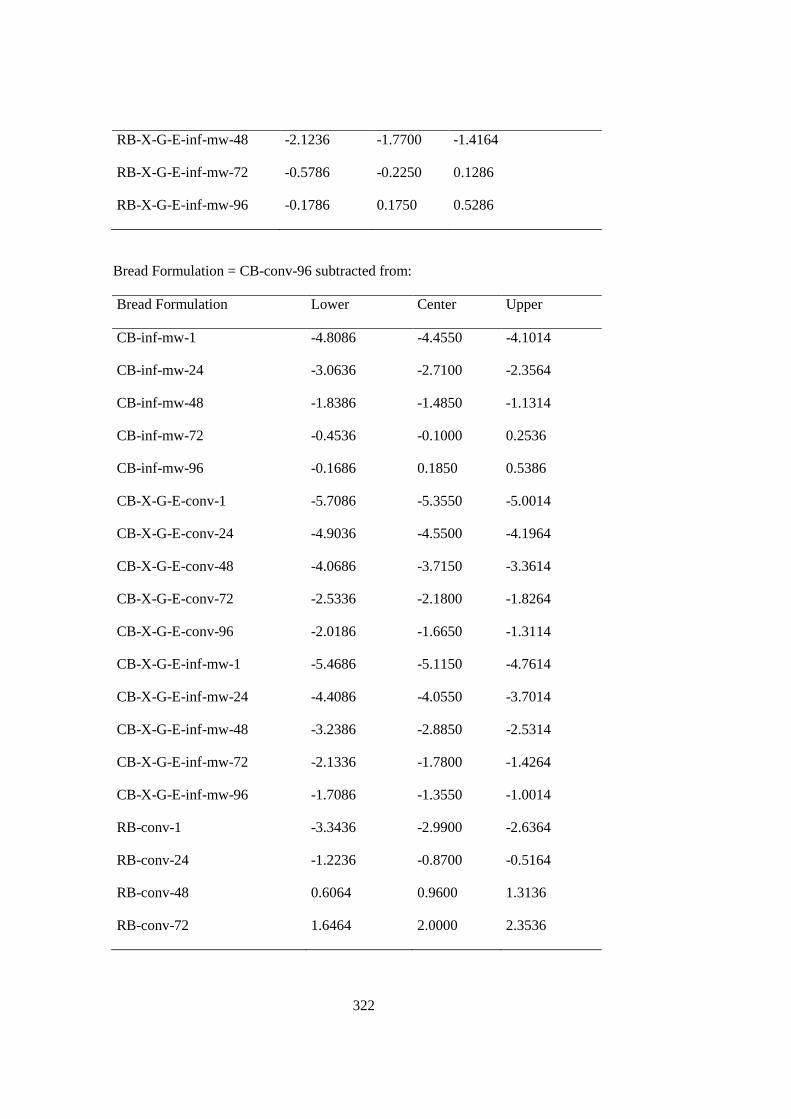
322
RB-X-G-E-inf-mw-48 -2.1236 -1.7700 -1.4164
RB-X-G-E-inf-mw-72 -0.5786 -0.2250 0.1286
RB-X-G-E-inf-mw-96 -0.1786 0.1750 0.5286
Bread Formulation = CB-conv-96 subtracted from:
Bread Formulation Lower Center Upper
CB-inf-mw-1 -4.8086 -4.4550 -4.1014
CB-inf-mw-24 -3.0636 -2.7100 -2.3564
CB-inf-mw-48 -1.8386 -1.4850 -1.1314
CB-inf-mw-72 -0.4536 -0.1000 0.2536
CB-inf-mw-96 -0.1686 0.1850 0.5386
CB-X-G-E-conv-1 -5.7086 -5.3550 -5.0014
CB-X-G-E-conv-24 -4.9036 -4.5500 -4.1964
CB-X-G-E-conv-48 -4.0686 -3.7150 -3.3614
CB-X-G-E-conv-72 -2.5336 -2.1800 -1.8264
CB-X-G-E-conv-96 -2.0186 -1.6650 -1.3114
CB-X-G-E-inf-mw-1 -5.4686 -5.1150 -4.7614
CB-X-G-E-inf-mw-24 -4.4086 -4.0550 -3.7014
CB-X-G-E-inf-mw-48 -3.2386 -2.8850 -2.5314
CB-X-G-E-inf-mw-72 -2.1336 -1.7800 -1.4264
CB-X-G-E-inf-mw-96 -1.7086 -1.3550 -1.0014
RB-conv-1 -3.3436 -2.9900 -2.6364
RB-conv-24 -1.2236 -0.8700 -0.5164
RB-conv-48 0.6064 0.9600 1.3136
RB-conv-72 1.6464 2.0000 2.3536
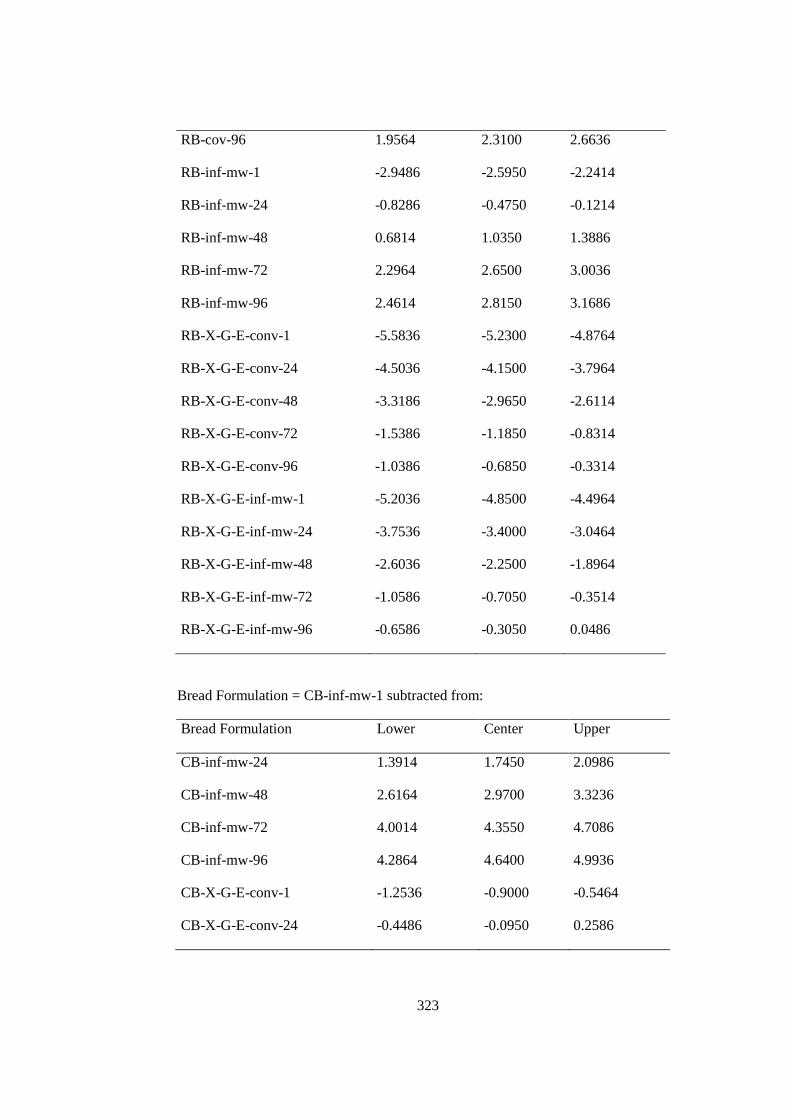
323
RB-cov-96 1.9564 2.3100 2.6636
RB-inf-mw-1 -2.9486 -2.5950 -2.2414
RB-inf-mw-24 -0.8286 -0.4750 -0.1214
RB-inf-mw-48 0.6814 1.0350 1.3886
RB-inf-mw-72 2.2964 2.6500 3.0036
RB-inf-mw-96 2.4614 2.8150 3.1686
RB-X-G-E-conv-1 -5.5836 -5.2300 -4.8764
RB-X-G-E-conv-24 -4.5036 -4.1500 -3.7964
RB-X-G-E-conv-48 -3.3186 -2.9650 -2.6114
RB-X-G-E-conv-72 -1.5386 -1.1850 -0.8314
RB-X-G-E-conv-96 -1.0386 -0.6850 -0.3314
RB-X-G-E-inf-mw-1 -5.2036 -4.8500 -4.4964
RB-X-G-E-inf-mw-24 -3.7536 -3.4000 -3.0464
RB-X-G-E-inf-mw-48 -2.6036 -2.2500 -1.8964
RB-X-G-E-inf-mw-72 -1.0586 -0.7050 -0.3514
RB-X-G-E-inf-mw-96 -0.6586 -0.3050 0.0486
Bread Formulation = CB-inf-mw-1 subtracted from:
Bread Formulation Lower Center Upper
CB-inf-mw-24 1.3914 1.7450 2.0986
CB-inf-mw-48 2.6164 2.9700 3.3236
CB-inf-mw-72 4.0014 4.3550 4.7086
CB-inf-mw-96 4.2864 4.6400 4.9936
CB-X-G-E-conv-1 -1.2536 -0.9000 -0.5464
CB-X-G-E-conv-24 -0.4486 -0.0950 0.2586
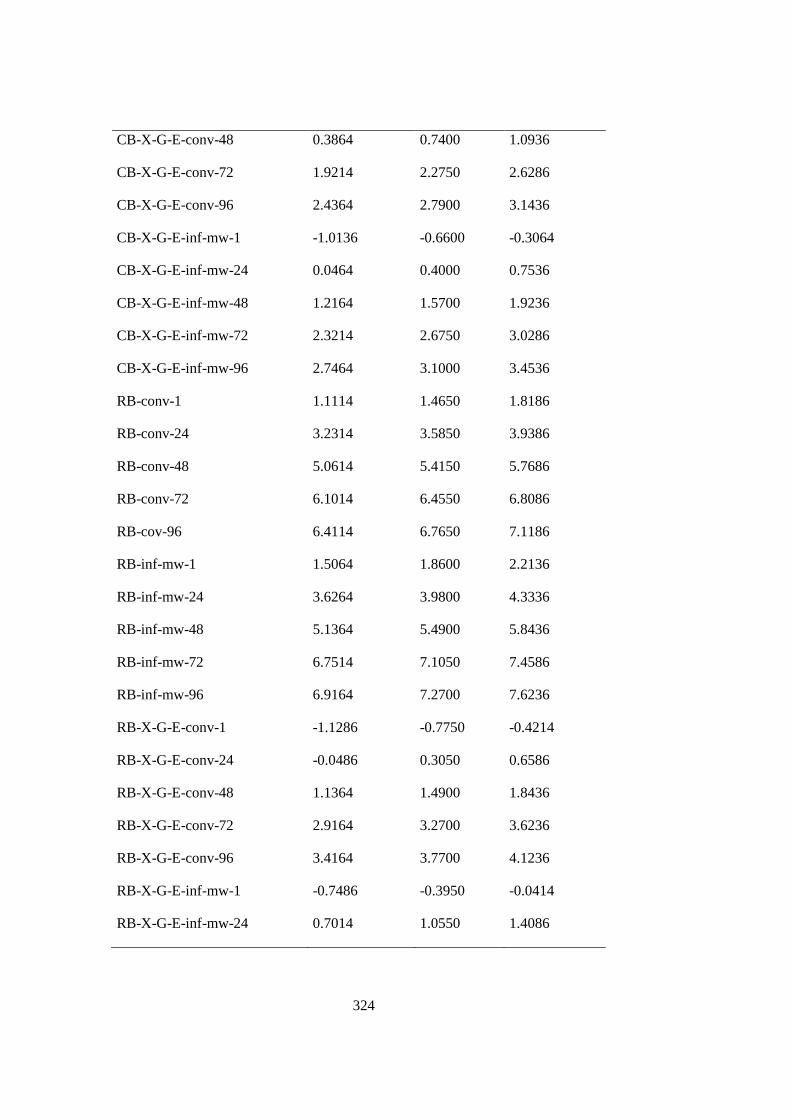
324
CB-X-G-E-conv-48 0.3864 0.7400 1.0936
CB-X-G-E-conv-72 1.9214 2.2750 2.6286
CB-X-G-E-conv-96 2.4364 2.7900 3.1436
CB-X-G-E-inf-mw-1 -1.0136 -0.6600 -0.3064
CB-X-G-E-inf-mw-24 0.0464 0.4000 0.7536
CB-X-G-E-inf-mw-48 1.2164 1.5700 1.9236
CB-X-G-E-inf-mw-72 2.3214 2.6750 3.0286
CB-X-G-E-inf-mw-96 2.7464 3.1000 3.4536
RB-conv-1 1.1114 1.4650 1.8186
RB-conv-24 3.2314 3.5850 3.9386
RB-conv-48 5.0614 5.4150 5.7686
RB-conv-72 6.1014 6.4550 6.8086
RB-cov-96 6.4114 6.7650 7.1186
RB-inf-mw-1 1.5064 1.8600 2.2136
RB-inf-mw-24 3.6264 3.9800 4.3336
RB-inf-mw-48 5.1364 5.4900 5.8436
RB-inf-mw-72 6.7514 7.1050 7.4586
RB-inf-mw-96 6.9164 7.2700 7.6236
RB-X-G-E-conv-1 -1.1286 -0.7750 -0.4214
RB-X-G-E-conv-24 -0.0486 0.3050 0.6586
RB-X-G-E-conv-48 1.1364 1.4900 1.8436
RB-X-G-E-conv-72 2.9164 3.2700 3.6236
RB-X-G-E-conv-96 3.4164 3.7700 4.1236
RB-X-G-E-inf-mw-1 -0.7486 -0.3950 -0.0414
RB-X-G-E-inf-mw-24 0.7014 1.0550 1.4086
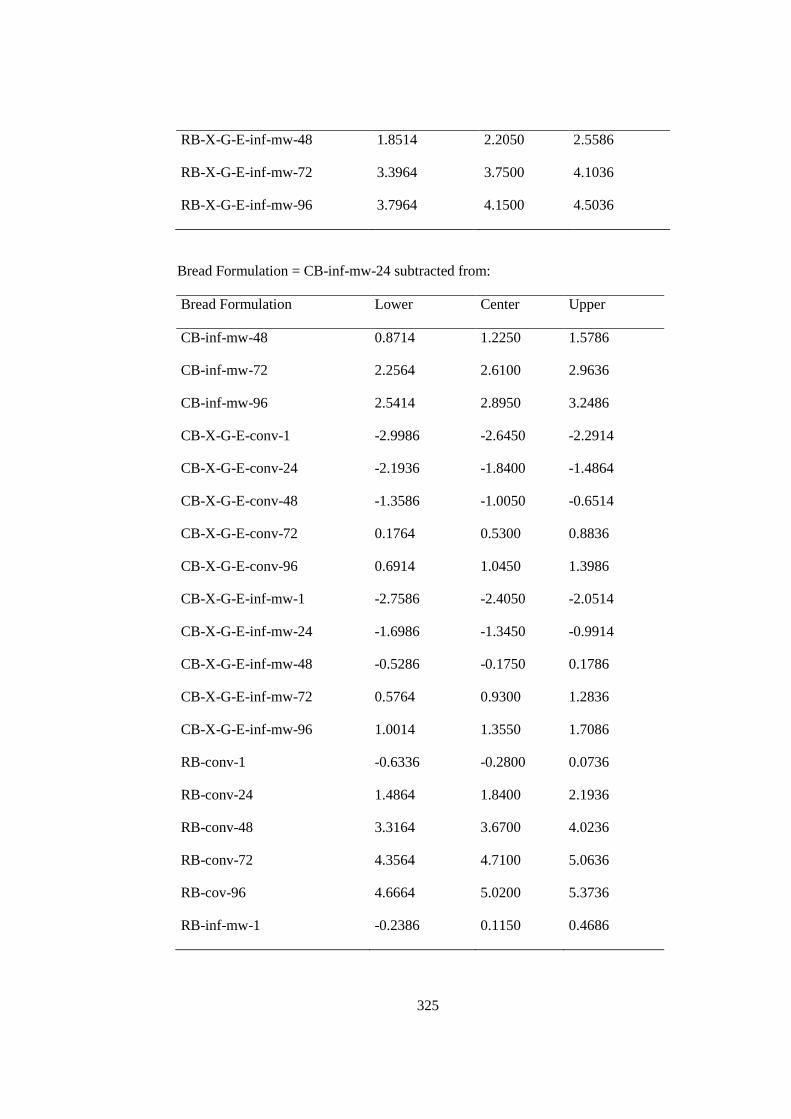
325
RB-X-G-E-inf-mw-48 1.8514 2.2050 2.5586
RB-X-G-E-inf-mw-72 3.3964 3.7500 4.1036
RB-X-G-E-inf-mw-96 3.7964 4.1500 4.5036
Bread Formulation = CB-inf-mw-24 subtracted from:
Bread Formulation Lower Center Upper
CB-inf-mw-48 0.8714 1.2250 1.5786
CB-inf-mw-72 2.2564 2.6100 2.9636
CB-inf-mw-96 2.5414 2.8950 3.2486
CB-X-G-E-conv-1 -2.9986 -2.6450 -2.2914
CB-X-G-E-conv-24 -2.1936 -1.8400 -1.4864
CB-X-G-E-conv-48 -1.3586 -1.0050 -0.6514
CB-X-G-E-conv-72 0.1764 0.5300 0.8836
CB-X-G-E-conv-96 0.6914 1.0450 1.3986
CB-X-G-E-inf-mw-1 -2.7586 -2.4050 -2.0514
CB-X-G-E-inf-mw-24 -1.6986 -1.3450 -0.9914
CB-X-G-E-inf-mw-48 -0.5286 -0.1750 0.1786
CB-X-G-E-inf-mw-72 0.5764 0.9300 1.2836
CB-X-G-E-inf-mw-96 1.0014 1.3550 1.7086
RB-conv-1 -0.6336 -0.2800 0.0736
RB-conv-24 1.4864 1.8400 2.1936
RB-conv-48 3.3164 3.6700 4.0236
RB-conv-72 4.3564 4.7100 5.0636
RB-cov-96 4.6664 5.0200 5.3736
RB-inf-mw-1 -0.2386 0.1150 0.4686
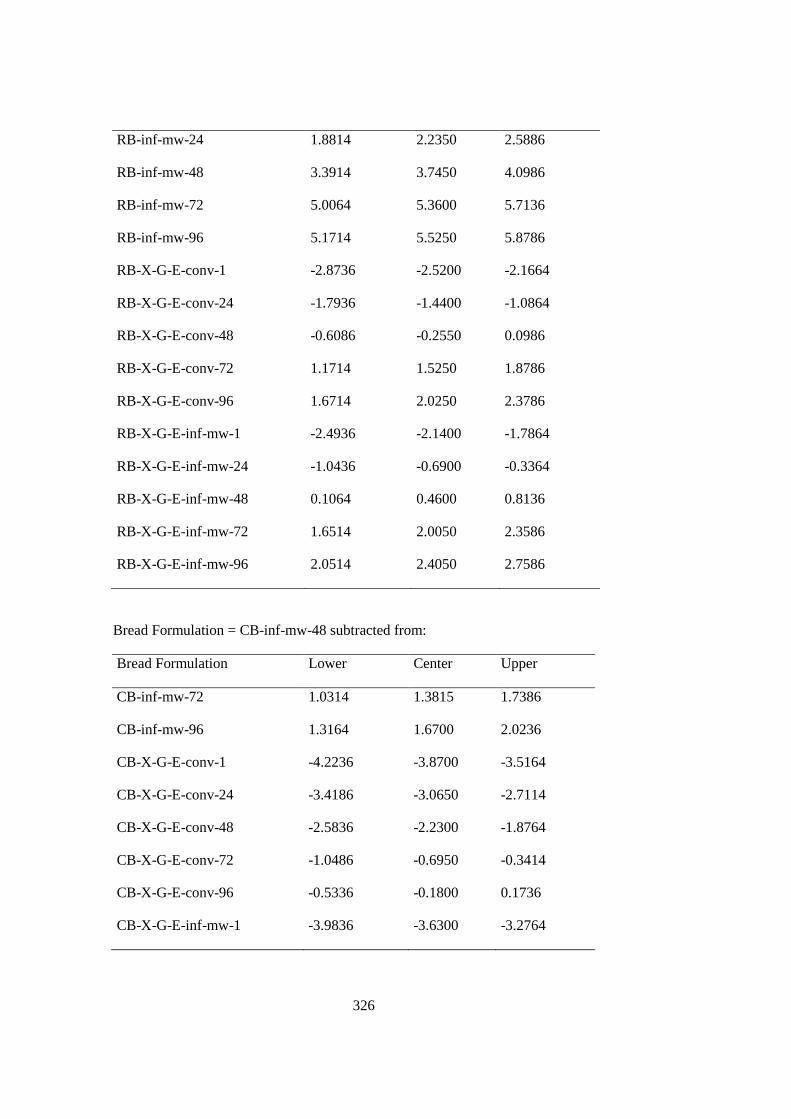
326
RB-inf-mw-24 1.8814 2.2350 2.5886
RB-inf-mw-48 3.3914 3.7450 4.0986
RB-inf-mw-72 5.0064 5.3600 5.7136
RB-inf-mw-96 5.1714 5.5250 5.8786
RB-X-G-E-conv-1 -2.8736 -2.5200 -2.1664
RB-X-G-E-conv-24 -1.7936 -1.4400 -1.0864
RB-X-G-E-conv-48 -0.6086 -0.2550 0.0986
RB-X-G-E-conv-72 1.1714 1.5250 1.8786
RB-X-G-E-conv-96 1.6714 2.0250 2.3786
RB-X-G-E-inf-mw-1 -2.4936 -2.1400 -1.7864
RB-X-G-E-inf-mw-24 -1.0436 -0.6900 -0.3364
RB-X-G-E-inf-mw-48 0.1064 0.4600 0.8136
RB-X-G-E-inf-mw-72 1.6514 2.0050 2.3586
RB-X-G-E-inf-mw-96 2.0514 2.4050 2.7586
Bread Formulation = CB-inf-mw-48 subtracted from:
Bread Formulation Lower Center Upper
CB-inf-mw-72 1.0314 1.3815 1.7386
CB-inf-mw-96 1.3164 1.6700 2.0236
CB-X-G-E-conv-1 -4.2236 -3.8700 -3.5164
CB-X-G-E-conv-24 -3.4186 -3.0650 -2.7114
CB-X-G-E-conv-48 -2.5836 -2.2300 -1.8764
CB-X-G-E-conv-72 -1.0486 -0.6950 -0.3414
CB-X-G-E-conv-96 -0.5336 -0.1800 0.1736
CB-X-G-E-inf-mw-1 -3.9836 -3.6300 -3.2764
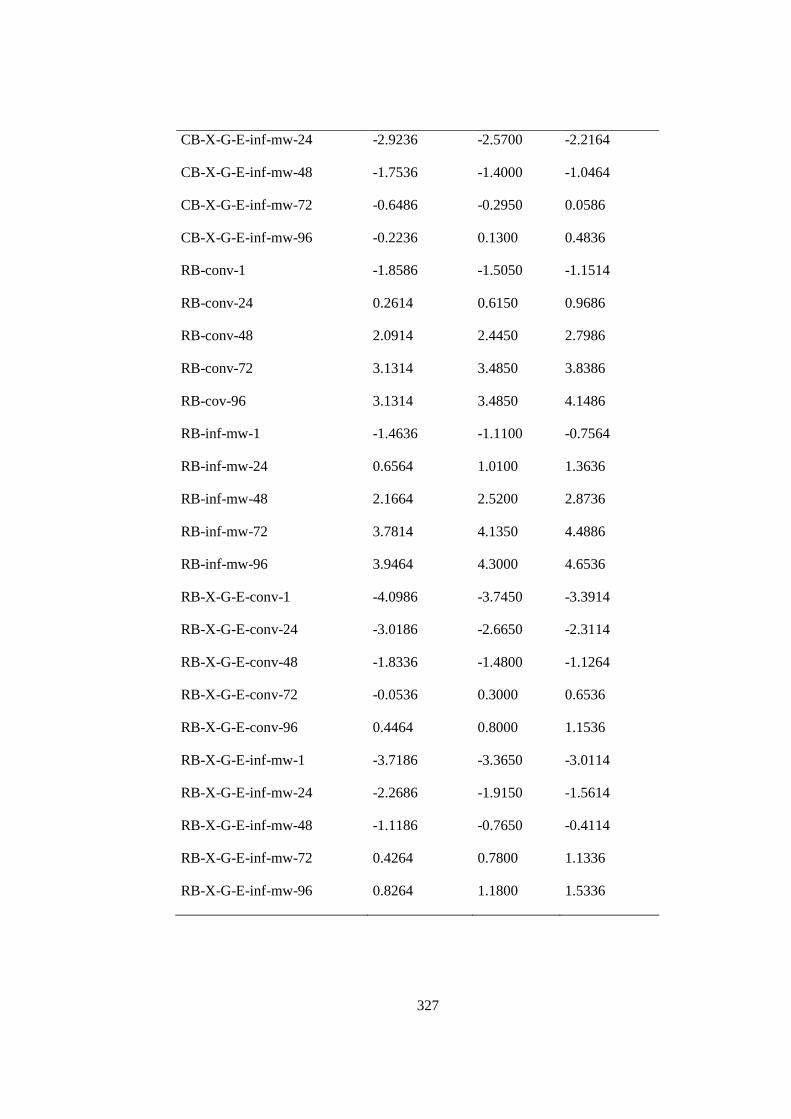
327
CB-X-G-E-inf-mw-24 -2.9236 -2.5700 -2.2164
CB-X-G-E-inf-mw-48 -1.7536 -1.4000 -1.0464
CB-X-G-E-inf-mw-72 -0.6486 -0.2950 0.0586
CB-X-G-E-inf-mw-96 -0.2236 0.1300 0.4836
RB-conv-1 -1.8586 -1.5050 -1.1514
RB-conv-24 0.2614 0.6150 0.9686
RB-conv-48 2.0914 2.4450 2.7986
RB-conv-72 3.1314 3.4850 3.8386
RB-cov-96 3.1314 3.4850 4.1486
RB-inf-mw-1 -1.4636 -1.1100 -0.7564
RB-inf-mw-24 0.6564 1.0100 1.3636
RB-inf-mw-48 2.1664 2.5200 2.8736
RB-inf-mw-72 3.7814 4.1350 4.4886
RB-inf-mw-96 3.9464 4.3000 4.6536
RB-X-G-E-conv-1 -4.0986 -3.7450 -3.3914
RB-X-G-E-conv-24 -3.0186 -2.6650 -2.3114
RB-X-G-E-conv-48 -1.8336 -1.4800 -1.1264
RB-X-G-E-conv-72 -0.0536 0.3000 0.6536
RB-X-G-E-conv-96 0.4464 0.8000 1.1536
RB-X-G-E-inf-mw-1 -3.7186 -3.3650 -3.0114
RB-X-G-E-inf-mw-24 -2.2686 -1.9150 -1.5614
RB-X-G-E-inf-mw-48 -1.1186 -0.7650 -0.4114
RB-X-G-E-inf-mw-72 0.4264 0.7800 1.1336
RB-X-G-E-inf-mw-96 0.8264 1.1800 1.5336
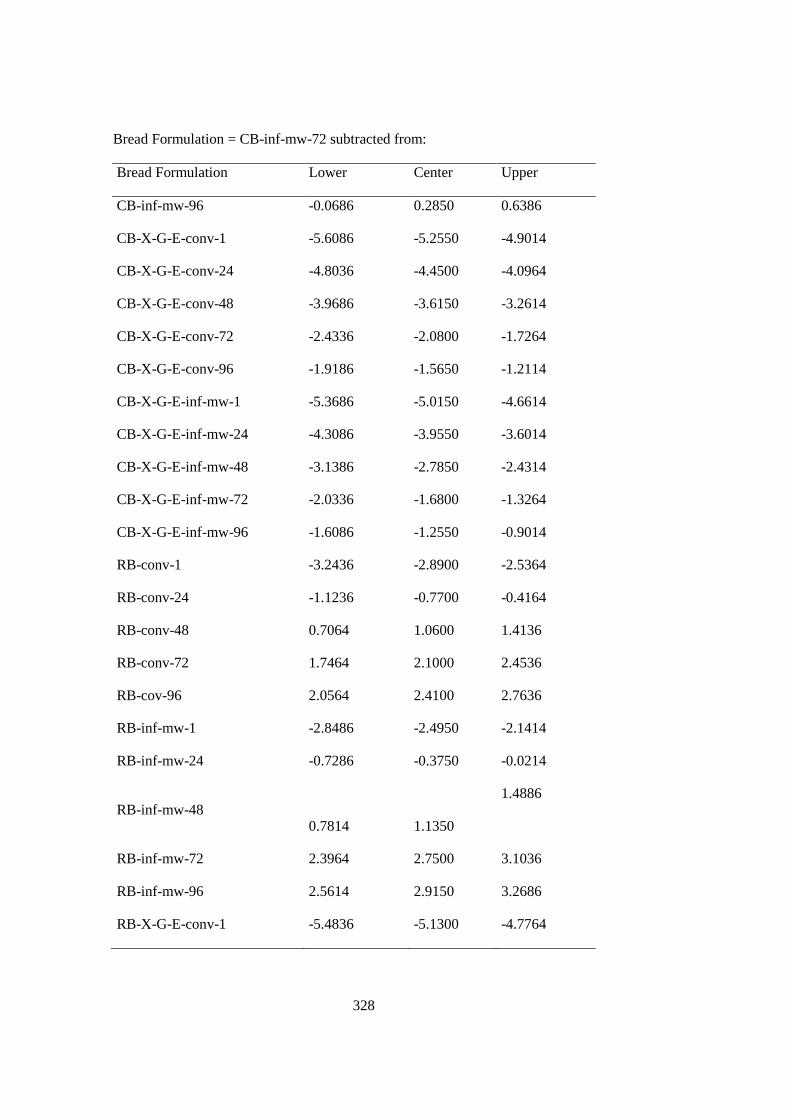
328
Bread Formulation = CB-inf-mw-72 subtracted from:
Bread Formulation Lower Center Upper
CB-inf-mw-96 -0.0686 0.2850 0.6386
CB-X-G-E-conv-1 -5.6086 -5.2550 -4.9014
CB-X-G-E-conv-24 -4.8036 -4.4500 -4.0964
CB-X-G-E-conv-48 -3.9686 -3.6150 -3.2614
CB-X-G-E-conv-72 -2.4336 -2.0800 -1.7264
CB-X-G-E-conv-96 -1.9186 -1.5650 -1.2114
CB-X-G-E-inf-mw-1 -5.3686 -5.0150 -4.6614
CB-X-G-E-inf-mw-24 -4.3086 -3.9550 -3.6014
CB-X-G-E-inf-mw-48 -3.1386 -2.7850 -2.4314
CB-X-G-E-inf-mw-72 -2.0336 -1.6800 -1.3264
CB-X-G-E-inf-mw-96 -1.6086 -1.2550 -0.9014
RB-conv-1 -3.2436 -2.8900 -2.5364
RB-conv-24 -1.1236 -0.7700 -0.4164
RB-conv-48 0.7064 1.0600 1.4136
RB-conv-72 1.7464 2.1000 2.4536
RB-cov-96 2.0564 2.4100 2.7636
RB-inf-mw-1 -2.8486 -2.4950 -2.1414
RB-inf-mw-24 -0.7286 -0.3750 -0.0214
RB-inf-mw-48 0.7814 1.1350
1.4886
RB-inf-mw-72 2.3964 2.7500 3.1036
RB-inf-mw-96 2.5614 2.9150 3.2686
RB-X-G-E-conv-1 -5.4836 -5.1300 -4.7764
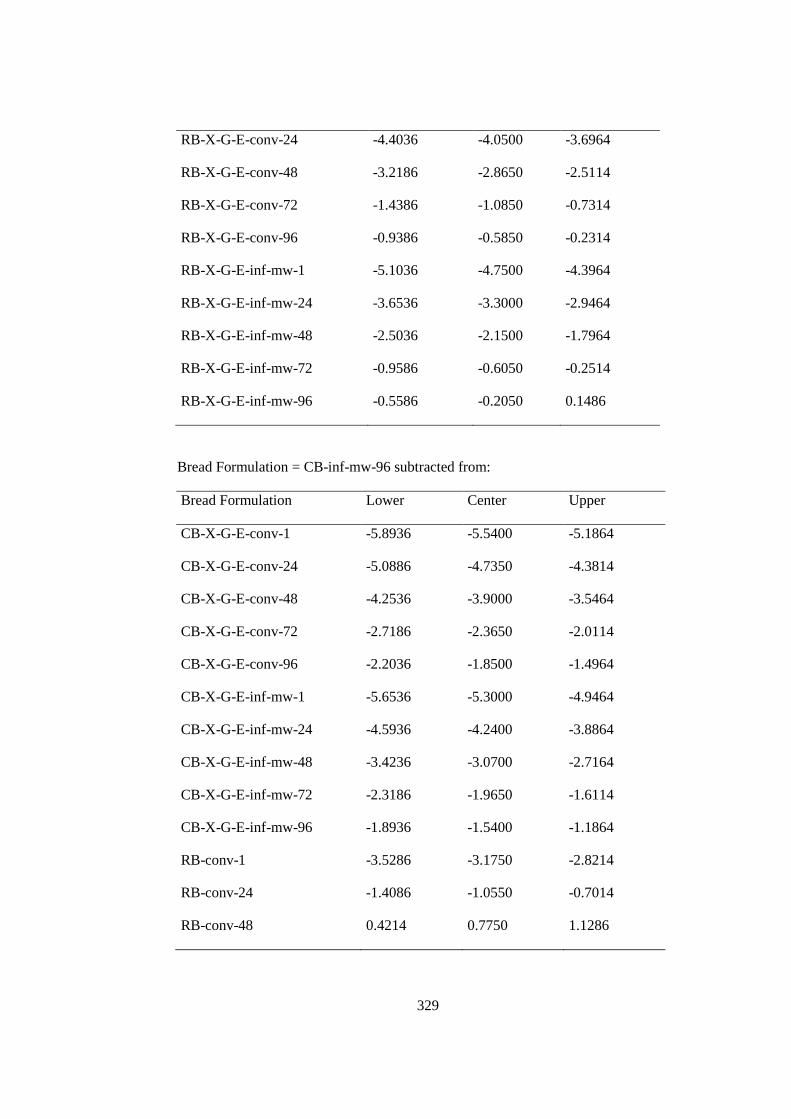
329
RB-X-G-E-conv-24 -4.4036 -4.0500 -3.6964
RB-X-G-E-conv-48 -3.2186 -2.8650 -2.5114
RB-X-G-E-conv-72 -1.4386 -1.0850 -0.7314
RB-X-G-E-conv-96 -0.9386 -0.5850 -0.2314
RB-X-G-E-inf-mw-1 -5.1036 -4.7500 -4.3964
RB-X-G-E-inf-mw-24 -3.6536 -3.3000 -2.9464
RB-X-G-E-inf-mw-48 -2.5036 -2.1500 -1.7964
RB-X-G-E-inf-mw-72 -0.9586 -0.6050 -0.2514
RB-X-G-E-inf-mw-96 -0.5586 -0.2050 0.1486
Bread Formulation = CB-inf-mw-96 subtracted from:
Bread Formulation Lower Center Upper
CB-X-G-E-conv-1 -5.8936 -5.5400 -5.1864
CB-X-G-E-conv-24 -5.0886 -4.7350 -4.3814
CB-X-G-E-conv-48 -4.2536 -3.9000 -3.5464
CB-X-G-E-conv-72 -2.7186 -2.3650 -2.0114
CB-X-G-E-conv-96 -2.2036 -1.8500 -1.4964
CB-X-G-E-inf-mw-1 -5.6536 -5.3000 -4.9464
CB-X-G-E-inf-mw-24 -4.5936 -4.2400 -3.8864
CB-X-G-E-inf-mw-48 -3.4236 -3.0700 -2.7164
CB-X-G-E-inf-mw-72 -2.3186 -1.9650 -1.6114
CB-X-G-E-inf-mw-96 -1.8936 -1.5400 -1.1864
RB-conv-1 -3.5286 -3.1750 -2.8214
RB-conv-24 -1.4086 -1.0550 -0.7014
RB-conv-48 0.4214 0.7750 1.1286
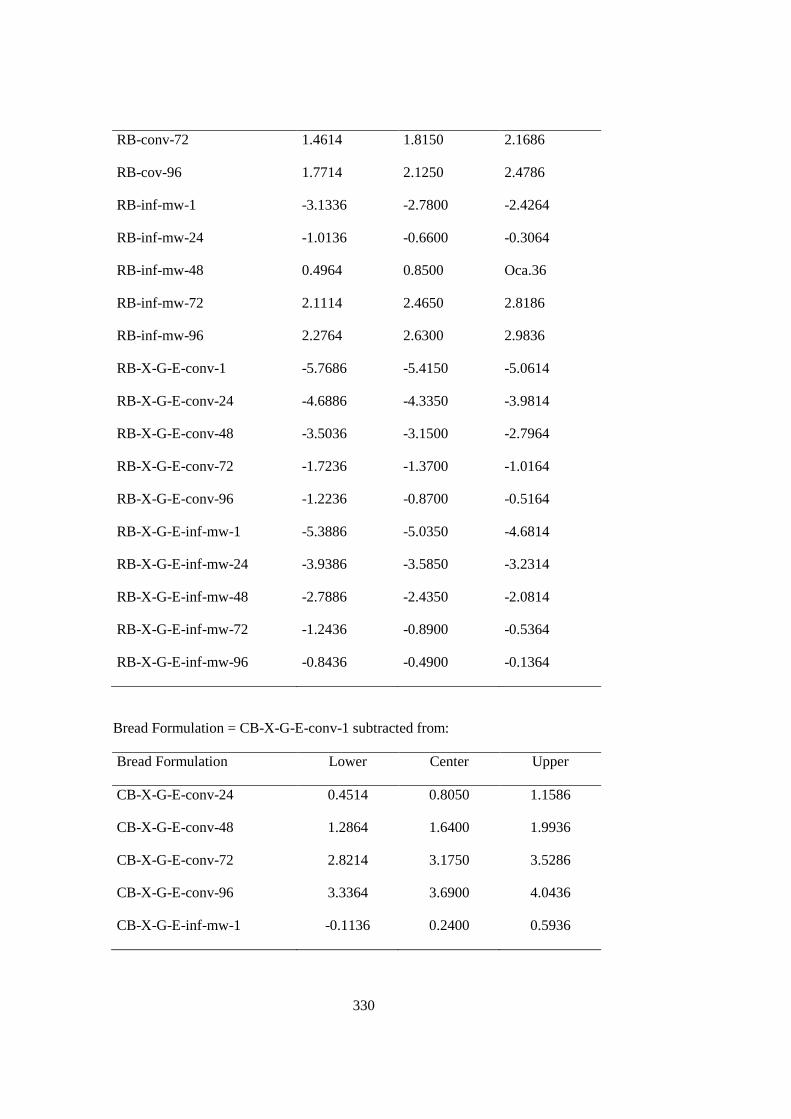
330
RB-conv-72 1.4614 1.8150 2.1686
RB-cov-96 1.7714 2.1250 2.4786
RB-inf-mw-1 -3.1336 -2.7800 -2.4264
RB-inf-mw-24 -1.0136 -0.6600 -0.3064
RB-inf-mw-48 0.4964 0.8500 Oca.36
RB-inf-mw-72 2.1114 2.4650 2.8186
RB-inf-mw-96 2.2764 2.6300 2.9836
RB-X-G-E-conv-1 -5.7686 -5.4150 -5.0614
RB-X-G-E-conv-24 -4.6886 -4.3350 -3.9814
RB-X-G-E-conv-48 -3.5036 -3.1500 -2.7964
RB-X-G-E-conv-72 -1.7236 -1.3700 -1.0164
RB-X-G-E-conv-96 -1.2236 -0.8700 -0.5164
RB-X-G-E-inf-mw-1 -5.3886 -5.0350 -4.6814
RB-X-G-E-inf-mw-24 -3.9386 -3.5850 -3.2314
RB-X-G-E-inf-mw-48 -2.7886 -2.4350 -2.0814
RB-X-G-E-inf-mw-72 -1.2436 -0.8900 -0.5364
RB-X-G-E-inf-mw-96 -0.8436 -0.4900 -0.1364
Bread Formulation = CB-X-G-E-conv-1 subtracted from:
Bread Formulation Lower Center Upper
CB-X-G-E-conv-24 0.4514 0.8050 1.1586
CB-X-G-E-conv-48 1.2864 1.6400 1.9936
CB-X-G-E-conv-72 2.8214 3.1750 3.5286
CB-X-G-E-conv-96 3.3364 3.6900 4.0436
CB-X-G-E-inf-mw-1 -0.1136 0.2400 0.5936
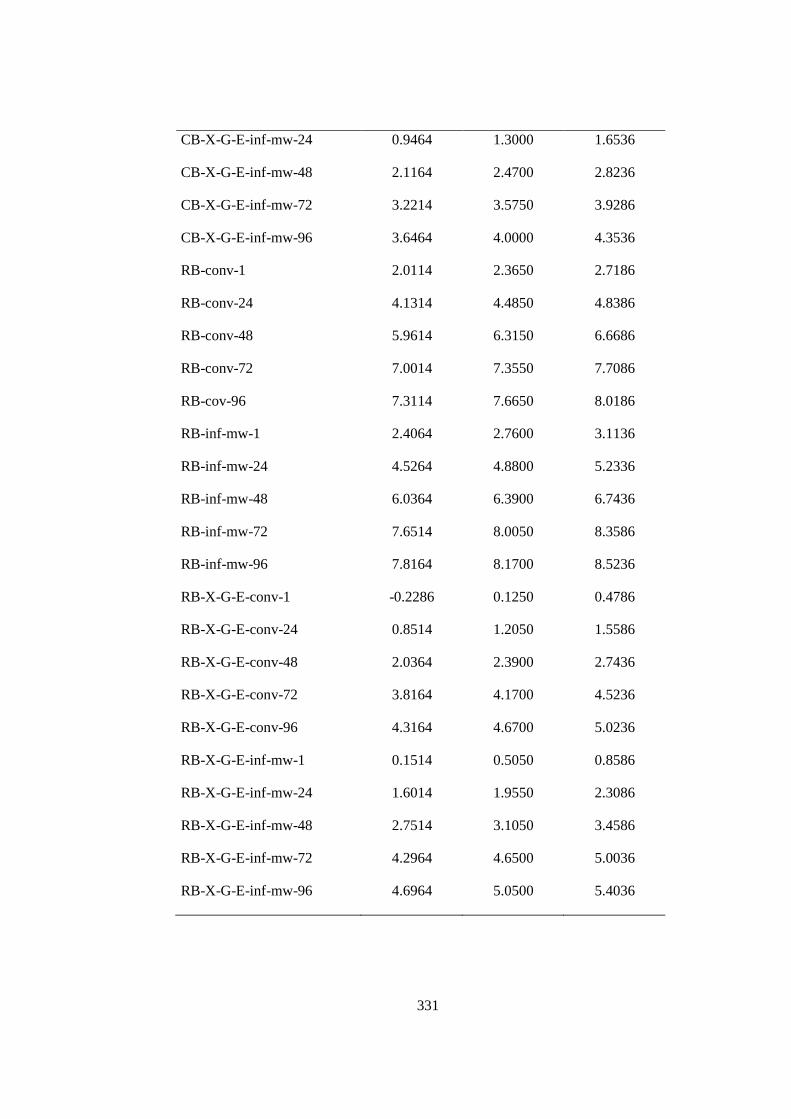
331
CB-X-G-E-inf-mw-24 0.9464 1.3000 1.6536
CB-X-G-E-inf-mw-48 2.1164 2.4700 2.8236
CB-X-G-E-inf-mw-72 3.2214 3.5750 3.9286
CB-X-G-E-inf-mw-96 3.6464 4.0000 4.3536
RB-conv-1 2.0114 2.3650 2.7186
RB-conv-24 4.1314 4.4850 4.8386
RB-conv-48 5.9614 6.3150 6.6686
RB-conv-72 7.0014 7.3550 7.7086
RB-cov-96 7.3114 7.6650 8.0186
RB-inf-mw-1 2.4064 2.7600 3.1136
RB-inf-mw-24 4.5264 4.8800 5.2336
RB-inf-mw-48 6.0364 6.3900 6.7436
RB-inf-mw-72 7.6514 8.0050 8.3586
RB-inf-mw-96 7.8164 8.1700 8.5236
RB-X-G-E-conv-1 -0.2286 0.1250 0.4786
RB-X-G-E-conv-24 0.8514 1.2050 1.5586
RB-X-G-E-conv-48 2.0364 2.3900 2.7436
RB-X-G-E-conv-72 3.8164 4.1700 4.5236
RB-X-G-E-conv-96 4.3164 4.6700 5.0236
RB-X-G-E-inf-mw-1 0.1514 0.5050 0.8586
RB-X-G-E-inf-mw-24 1.6014 1.9550 2.3086
RB-X-G-E-inf-mw-48 2.7514 3.1050 3.4586
RB-X-G-E-inf-mw-72 4.2964 4.6500 5.0036
RB-X-G-E-inf-mw-96 4.6964 5.0500 5.4036

332
Bread Formulation = CB-X-G-E-conv-24 subtracted from:
Bread Formulation Lower Center Upper
CB-X-G-E-conv-48 0.4814 0.8350 1.1886
CB-X-G-E-conv-72 2.0164 2.3700 2.7236
CB-X-G-E-conv-96 2.5314 2.8850 3.2386
CB-X-G-E-inf-mw-1 -0.9186 -0.5650 -0.2114
CB-X-G-E-inf-mw-24 0.1414 0.4950 0.8486
CB-X-G-E-inf-mw-48 1.3114 1.6650 2.0186
CB-X-G-E-inf-mw-72 2.4164 2.7700 3.1236
CB-X-G-E-inf-mw-96 2.8414 3.1950 3.5486
RB-conv-1 1.2064 1.5600 1.9136
RB-conv-24 3.3264 3.6800 4.0336
RB-conv-48 5.1564 5.5100 5.8636
RB-conv-72 6.1964 6.5500 6.9036
RB-cov-96 6.5064 6.8600 7.2136
RB-inf-mw-1 1.6014 1.9550 2.3086
RB-inf-mw-24 3.7214 4.0750 4.4286
RB-inf-mw-48 5.2314 5.5850 5.9386
RB-inf-mw-72 6.8464 7.2000 7.5536
RB-inf-mw-96 7.0114 7.3650 7.7186
RB-X-G-E-conv-1 -1.0336 -0.6800 -0.3264
RB-X-G-E-conv-24 0.0464 0.4000 0.7536
RB-X-G-E-conv-48 1.2314 1.5850 1.9386
RB-X-G-E-conv-72 3.0114 3.3650 3.7186
RB-X-G-E-conv-96 3.5114 3.8650 4.2186
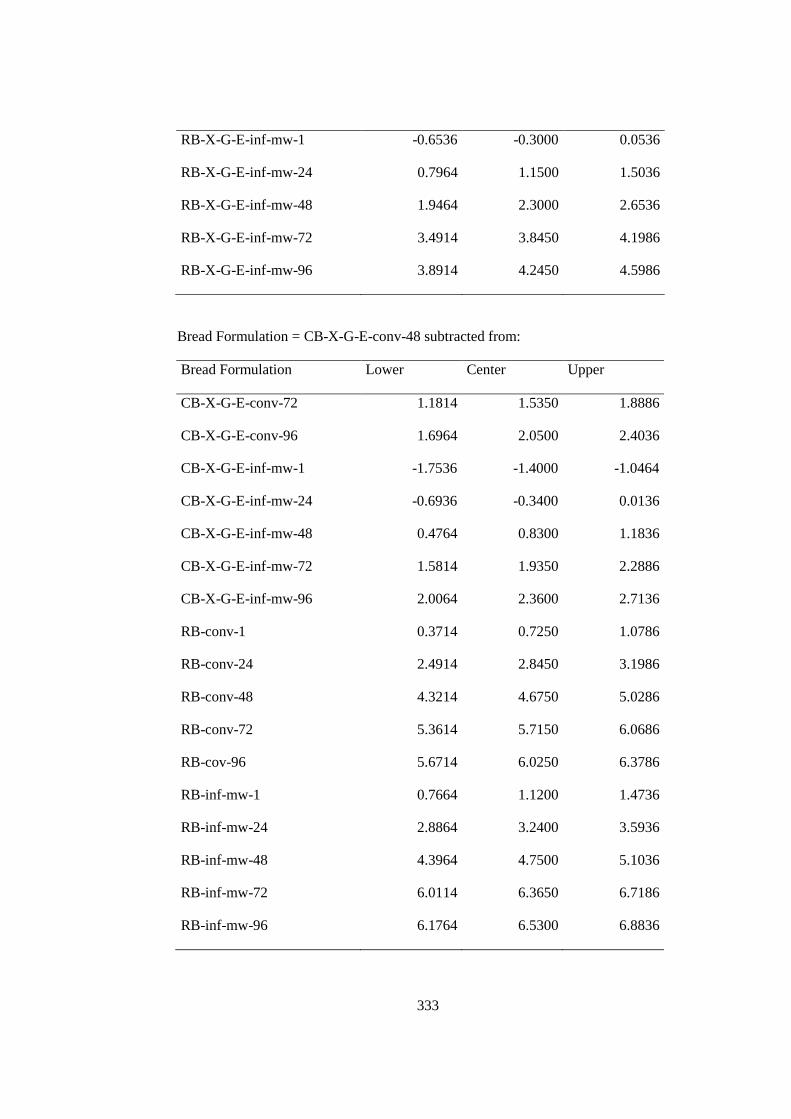
333
RB-X-G-E-inf-mw-1 -0.6536 -0.3000 0.0536
RB-X-G-E-inf-mw-24 0.7964 1.1500 1.5036
RB-X-G-E-inf-mw-48 1.9464 2.3000 2.6536
RB-X-G-E-inf-mw-72 3.4914 3.8450 4.1986
RB-X-G-E-inf-mw-96 3.8914 4.2450 4.5986
Bread Formulation = CB-X-G-E-conv-48 subtracted from:
Bread Formulation Lower Center Upper
CB-X-G-E-conv-72 1.1814 1.5350 1.8886
CB-X-G-E-conv-96 1.6964 2.0500 2.4036
CB-X-G-E-inf-mw-1 -1.7536 -1.4000 -1.0464
CB-X-G-E-inf-mw-24 -0.6936 -0.3400 0.0136
CB-X-G-E-inf-mw-48 0.4764 0.8300 1.1836
CB-X-G-E-inf-mw-72 1.5814 1.9350 2.2886
CB-X-G-E-inf-mw-96 2.0064 2.3600 2.7136
RB-conv-1 0.3714 0.7250 1.0786
RB-conv-24 2.4914 2.8450 3.1986
RB-conv-48 4.3214 4.6750 5.0286
RB-conv-72 5.3614 5.7150 6.0686
RB-cov-96 5.6714 6.0250 6.3786
RB-inf-mw-1 0.7664 1.1200 1.4736
RB-inf-mw-24 2.8864 3.2400 3.5936
RB-inf-mw-48 4.3964 4.7500 5.1036
RB-inf-mw-72 6.0114 6.3650 6.7186
RB-inf-mw-96 6.1764 6.5300 6.8836
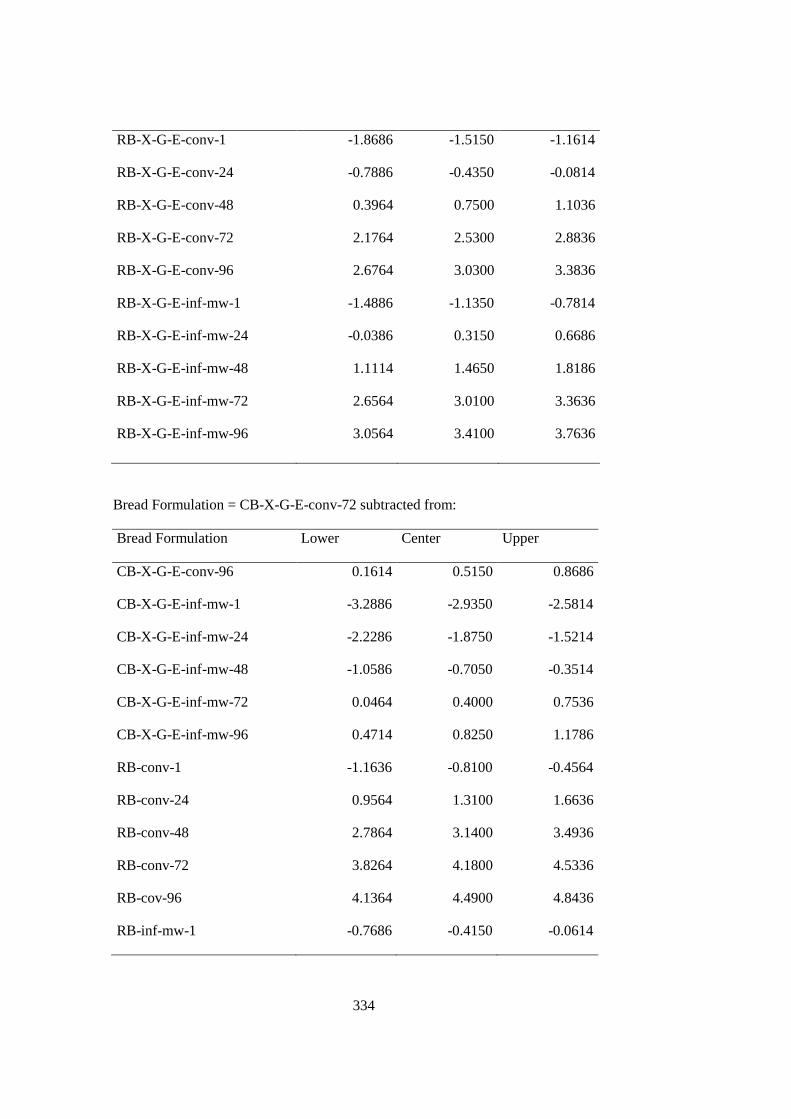
334
RB-X-G-E-conv-1 -1.8686 -1.5150 -1.1614
RB-X-G-E-conv-24 -0.7886 -0.4350 -0.0814
RB-X-G-E-conv-48 0.3964 0.7500 1.1036
RB-X-G-E-conv-72 2.1764 2.5300 2.8836
RB-X-G-E-conv-96 2.6764 3.0300 3.3836
RB-X-G-E-inf-mw-1 -1.4886 -1.1350 -0.7814
RB-X-G-E-inf-mw-24 -0.0386 0.3150 0.6686
RB-X-G-E-inf-mw-48 1.1114 1.4650 1.8186
RB-X-G-E-inf-mw-72 2.6564 3.0100 3.3636
RB-X-G-E-inf-mw-96 3.0564 3.4100 3.7636
Bread Formulation = CB-X-G-E-conv-72 subtracted from:
Bread Formulation Lower Center Upper
CB-X-G-E-conv-96 0.1614 0.5150 0.8686
CB-X-G-E-inf-mw-1 -3.2886 -2.9350 -2.5814
CB-X-G-E-inf-mw-24 -2.2286 -1.8750 -1.5214
CB-X-G-E-inf-mw-48 -1.0586 -0.7050 -0.3514
CB-X-G-E-inf-mw-72 0.0464 0.4000 0.7536
CB-X-G-E-inf-mw-96 0.4714 0.8250 1.1786
RB-conv-1 -1.1636 -0.8100 -0.4564
RB-conv-24 0.9564 1.3100 1.6636
RB-conv-48 2.7864 3.1400 3.4936
RB-conv-72 3.8264 4.1800 4.5336
RB-cov-96 4.1364 4.4900 4.8436
RB-inf-mw-1 -0.7686 -0.4150 -0.0614
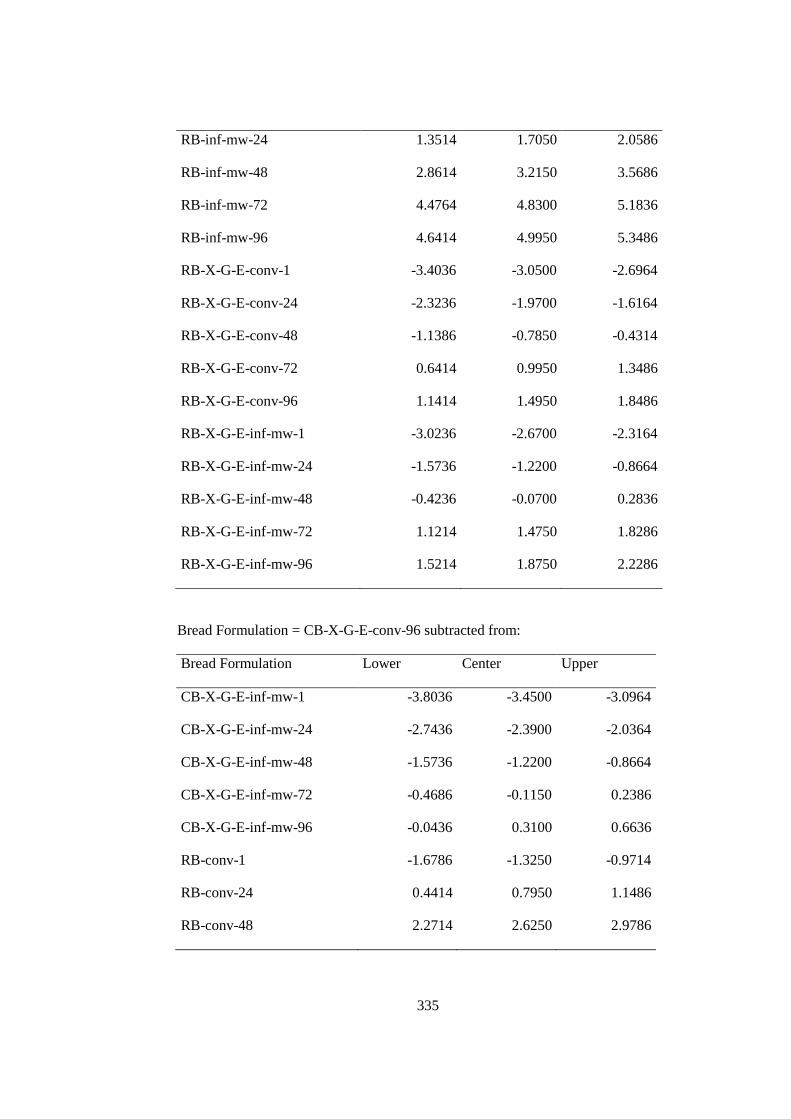
335
RB-inf-mw-24 1.3514 1.7050 2.0586
RB-inf-mw-48 2.8614 3.2150 3.5686
RB-inf-mw-72 4.4764 4.8300 5.1836
RB-inf-mw-96 4.6414 4.9950 5.3486
RB-X-G-E-conv-1 -3.4036 -3.0500 -2.6964
RB-X-G-E-conv-24 -2.3236 -1.9700 -1.6164
RB-X-G-E-conv-48 -1.1386 -0.7850 -0.4314
RB-X-G-E-conv-72 0.6414 0.9950 1.3486
RB-X-G-E-conv-96 1.1414 1.4950 1.8486
RB-X-G-E-inf-mw-1 -3.0236 -2.6700 -2.3164
RB-X-G-E-inf-mw-24 -1.5736 -1.2200 -0.8664
RB-X-G-E-inf-mw-48 -0.4236 -0.0700 0.2836
RB-X-G-E-inf-mw-72 1.1214 1.4750 1.8286
RB-X-G-E-inf-mw-96 1.5214 1.8750 2.2286
Bread Formulation = CB-X-G-E-conv-96 subtracted from:
Bread Formulation Lower Center Upper
CB-X-G-E-inf-mw-1 -3.8036 -3.4500 -3.0964
CB-X-G-E-inf-mw-24 -2.7436 -2.3900 -2.0364
CB-X-G-E-inf-mw-48 -1.5736 -1.2200 -0.8664
CB-X-G-E-inf-mw-72 -0.4686 -0.1150 0.2386
CB-X-G-E-inf-mw-96 -0.0436 0.3100 0.6636
RB-conv-1 -1.6786 -1.3250 -0.9714
RB-conv-24 0.4414 0.7950 1.1486
RB-conv-48 2.2714 2.6250 2.9786
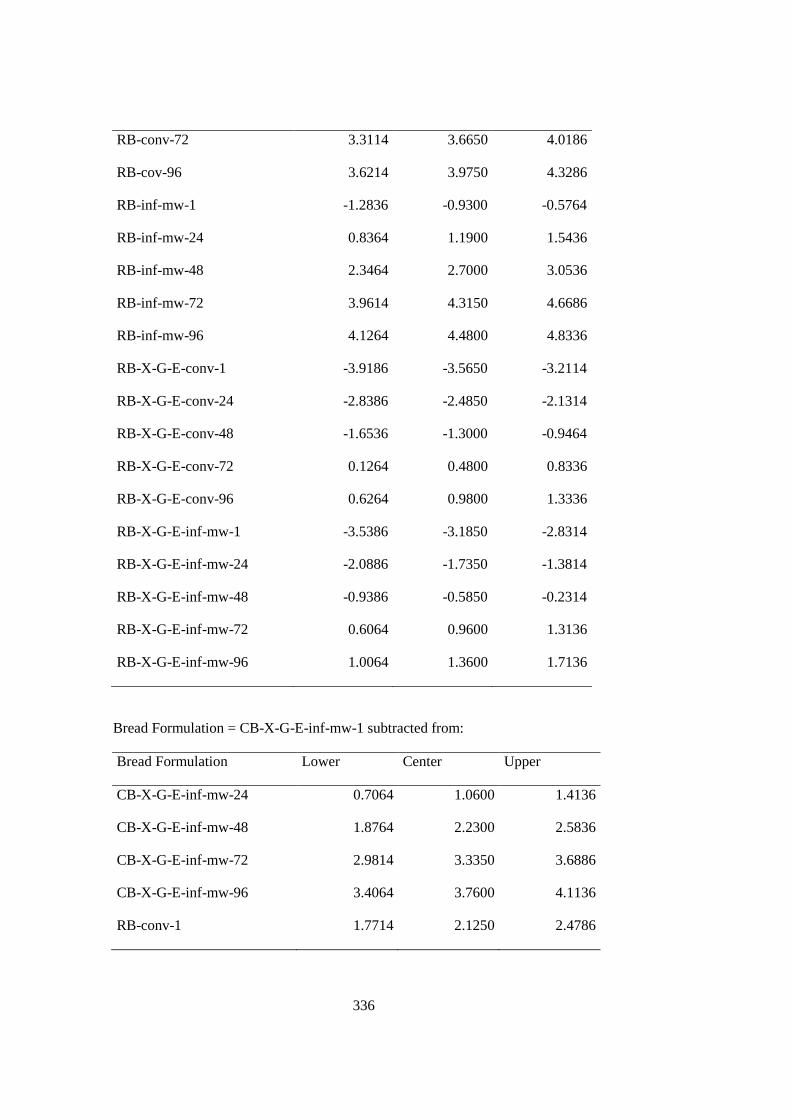
336
RB-conv-72 3.3114 3.6650 4.0186
RB-cov-96 3.6214 3.9750 4.3286
RB-inf-mw-1 -1.2836 -0.9300 -0.5764
RB-inf-mw-24 0.8364 1.1900 1.5436
RB-inf-mw-48 2.3464 2.7000 3.0536
RB-inf-mw-72 3.9614 4.3150 4.6686
RB-inf-mw-96 4.1264 4.4800 4.8336
RB-X-G-E-conv-1 -3.9186 -3.5650 -3.2114
RB-X-G-E-conv-24 -2.8386 -2.4850 -2.1314
RB-X-G-E-conv-48 -1.6536 -1.3000 -0.9464
RB-X-G-E-conv-72 0.1264 0.4800 0.8336
RB-X-G-E-conv-96 0.6264 0.9800 1.3336
RB-X-G-E-inf-mw-1 -3.5386 -3.1850 -2.8314
RB-X-G-E-inf-mw-24 -2.0886 -1.7350 -1.3814
RB-X-G-E-inf-mw-48 -0.9386 -0.5850 -0.2314
RB-X-G-E-inf-mw-72 0.6064 0.9600 1.3136
RB-X-G-E-inf-mw-96 1.0064 1.3600 1.7136
Bread Formulation = CB-X-G-E-inf-mw-1 subtracted from:
Bread Formulation Lower Center Upper
CB-X-G-E-inf-mw-24 0.7064 1.0600 1.4136
CB-X-G-E-inf-mw-48 1.8764 2.2300 2.5836
CB-X-G-E-inf-mw-72 2.9814 3.3350 3.6886
CB-X-G-E-inf-mw-96 3.4064 3.7600 4.1136
RB-conv-1 1.7714 2.1250 2.4786
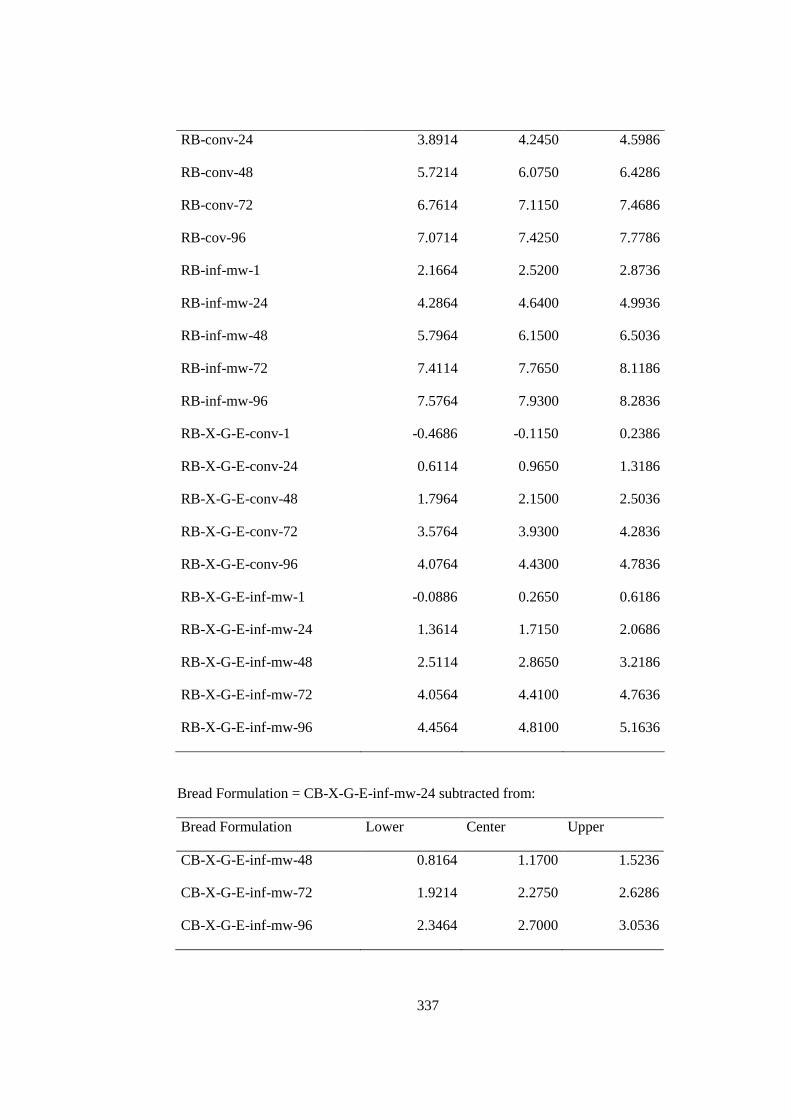
337
RB-conv-24 3.8914 4.2450 4.5986
RB-conv-48 5.7214 6.0750 6.4286
RB-conv-72 6.7614 7.1150 7.4686
RB-cov-96 7.0714 7.4250 7.7786
RB-inf-mw-1 2.1664 2.5200 2.8736
RB-inf-mw-24 4.2864 4.6400 4.9936
RB-inf-mw-48 5.7964 6.1500 6.5036
RB-inf-mw-72 7.4114 7.7650 8.1186
RB-inf-mw-96 7.5764 7.9300 8.2836
RB-X-G-E-conv-1 -0.4686 -0.1150 0.2386
RB-X-G-E-conv-24 0.6114 0.9650 1.3186
RB-X-G-E-conv-48 1.7964 2.1500 2.5036
RB-X-G-E-conv-72 3.5764 3.9300 4.2836
RB-X-G-E-conv-96 4.0764 4.4300 4.7836
RB-X-G-E-inf-mw-1 -0.0886 0.2650 0.6186
RB-X-G-E-inf-mw-24 1.3614 1.7150 2.0686
RB-X-G-E-inf-mw-48 2.5114 2.8650 3.2186
RB-X-G-E-inf-mw-72 4.0564 4.4100 4.7636
RB-X-G-E-inf-mw-96 4.4564 4.8100 5.1636
Bread Formulation = CB-X-G-E-inf-mw-24 subtracted from:
Bread Formulation Lower Center Upper
CB-X-G-E-inf-mw-48 0.8164 1.1700 1.5236
CB-X-G-E-inf-mw-72 1.9214 2.2750 2.6286
CB-X-G-E-inf-mw-96 2.3464 2.7000 3.0536
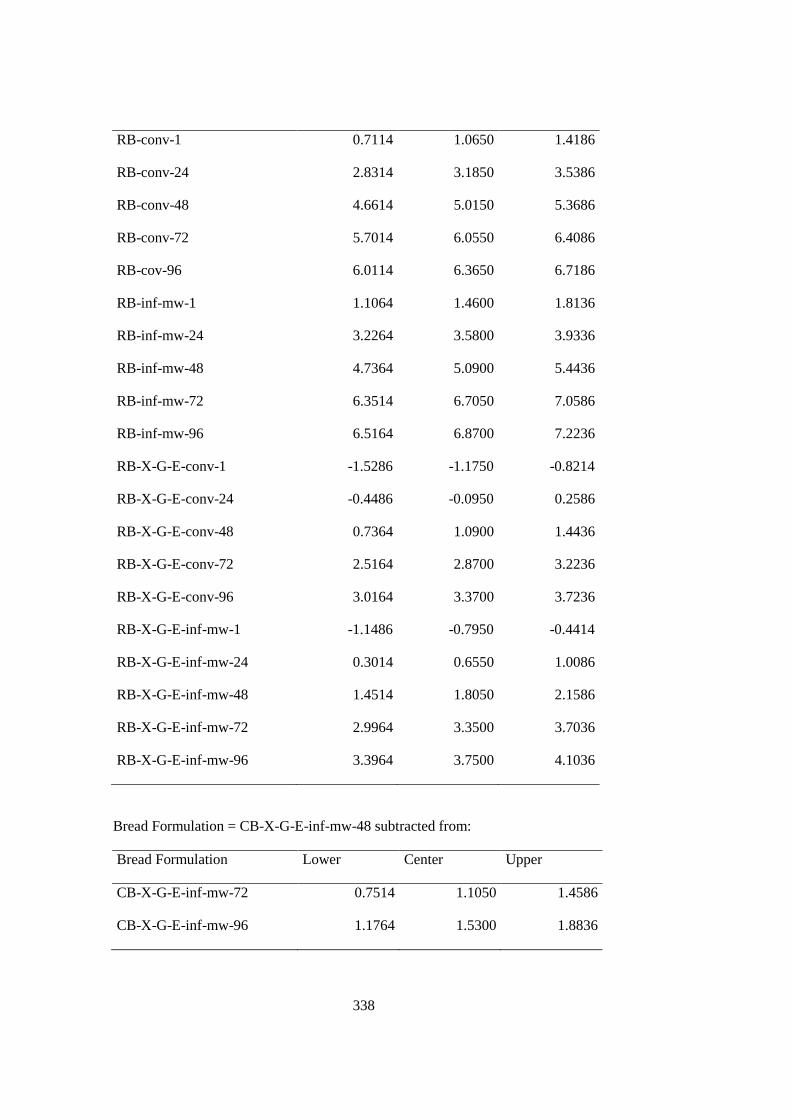
338
RB-conv-1 0.7114 1.0650 1.4186
RB-conv-24 2.8314 3.1850 3.5386
RB-conv-48 4.6614 5.0150 5.3686
RB-conv-72 5.7014 6.0550 6.4086
RB-cov-96 6.0114 6.3650 6.7186
RB-inf-mw-1 1.1064 1.4600 1.8136
RB-inf-mw-24 3.2264 3.5800 3.9336
RB-inf-mw-48 4.7364 5.0900 5.4436
RB-inf-mw-72 6.3514 6.7050 7.0586
RB-inf-mw-96 6.5164 6.8700 7.2236
RB-X-G-E-conv-1 -1.5286 -1.1750 -0.8214
RB-X-G-E-conv-24 -0.4486 -0.0950 0.2586
RB-X-G-E-conv-48 0.7364 1.0900 1.4436
RB-X-G-E-conv-72 2.5164 2.8700 3.2236
RB-X-G-E-conv-96 3.0164 3.3700 3.7236
RB-X-G-E-inf-mw-1 -1.1486 -0.7950 -0.4414
RB-X-G-E-inf-mw-24 0.3014 0.6550 1.0086
RB-X-G-E-inf-mw-48 1.4514 1.8050 2.1586
RB-X-G-E-inf-mw-72 2.9964 3.3500 3.7036
RB-X-G-E-inf-mw-96 3.3964 3.7500 4.1036
Bread Formulation = CB-X-G-E-inf-mw-48 subtracted from:
Bread Formulation Lower Center Upper
CB-X-G-E-inf-mw-72 0.7514 1.1050 1.4586
CB-X-G-E-inf-mw-96 1.1764 1.5300 1.8836
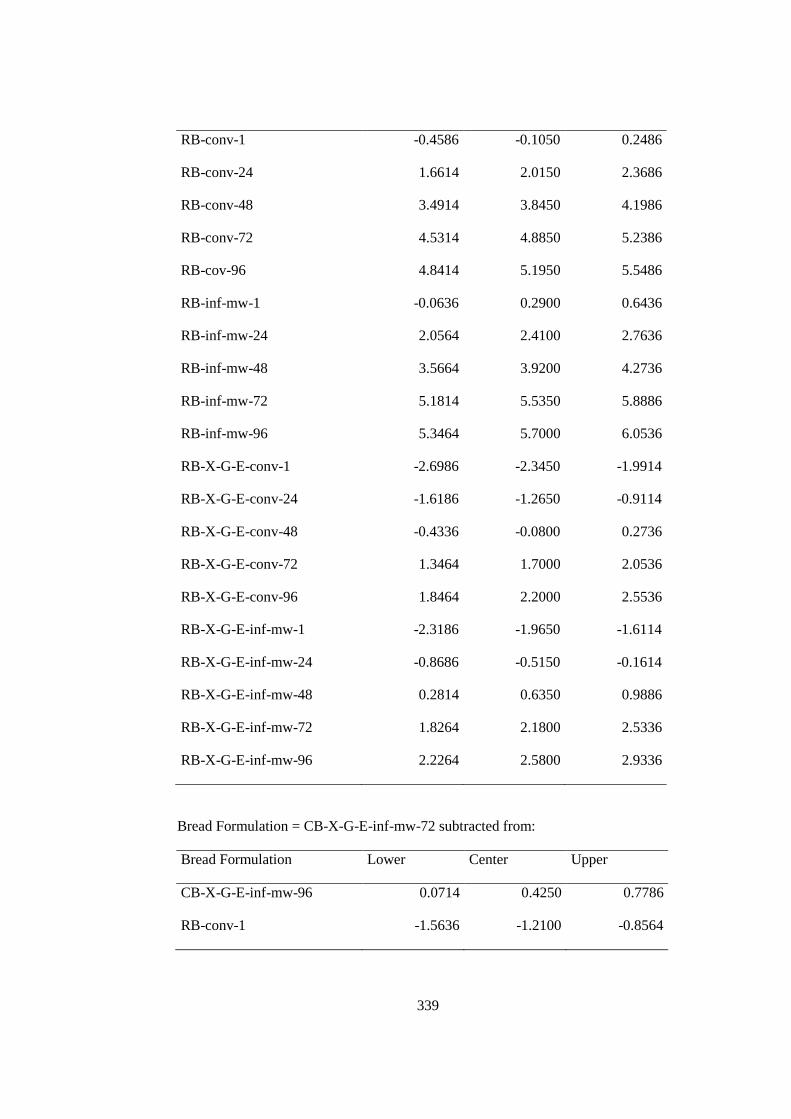
339
RB-conv-1 -0.4586 -0.1050 0.2486
RB-conv-24 1.6614 2.0150 2.3686
RB-conv-48 3.4914 3.8450 4.1986
RB-conv-72 4.5314 4.8850 5.2386
RB-cov-96 4.8414 5.1950 5.5486
RB-inf-mw-1 -0.0636 0.2900 0.6436
RB-inf-mw-24 2.0564 2.4100 2.7636
RB-inf-mw-48 3.5664 3.9200 4.2736
RB-inf-mw-72 5.1814 5.5350 5.8886
RB-inf-mw-96 5.3464 5.7000 6.0536
RB-X-G-E-conv-1 -2.6986 -2.3450 -1.9914
RB-X-G-E-conv-24 -1.6186 -1.2650 -0.9114
RB-X-G-E-conv-48 -0.4336 -0.0800 0.2736
RB-X-G-E-conv-72 1.3464 1.7000 2.0536
RB-X-G-E-conv-96 1.8464 2.2000 2.5536
RB-X-G-E-inf-mw-1 -2.3186 -1.9650 -1.6114
RB-X-G-E-inf-mw-24 -0.8686 -0.5150 -0.1614
RB-X-G-E-inf-mw-48 0.2814 0.6350 0.9886
RB-X-G-E-inf-mw-72 1.8264 2.1800 2.5336
RB-X-G-E-inf-mw-96 2.2264 2.5800 2.9336
Bread Formulation = CB-X-G-E-inf-mw-72 subtracted from:
Bread Formulation Lower Center Upper
CB-X-G-E-inf-mw-96 0.0714 0.4250 0.7786
RB-conv-1 -1.5636 -1.2100 -0.8564
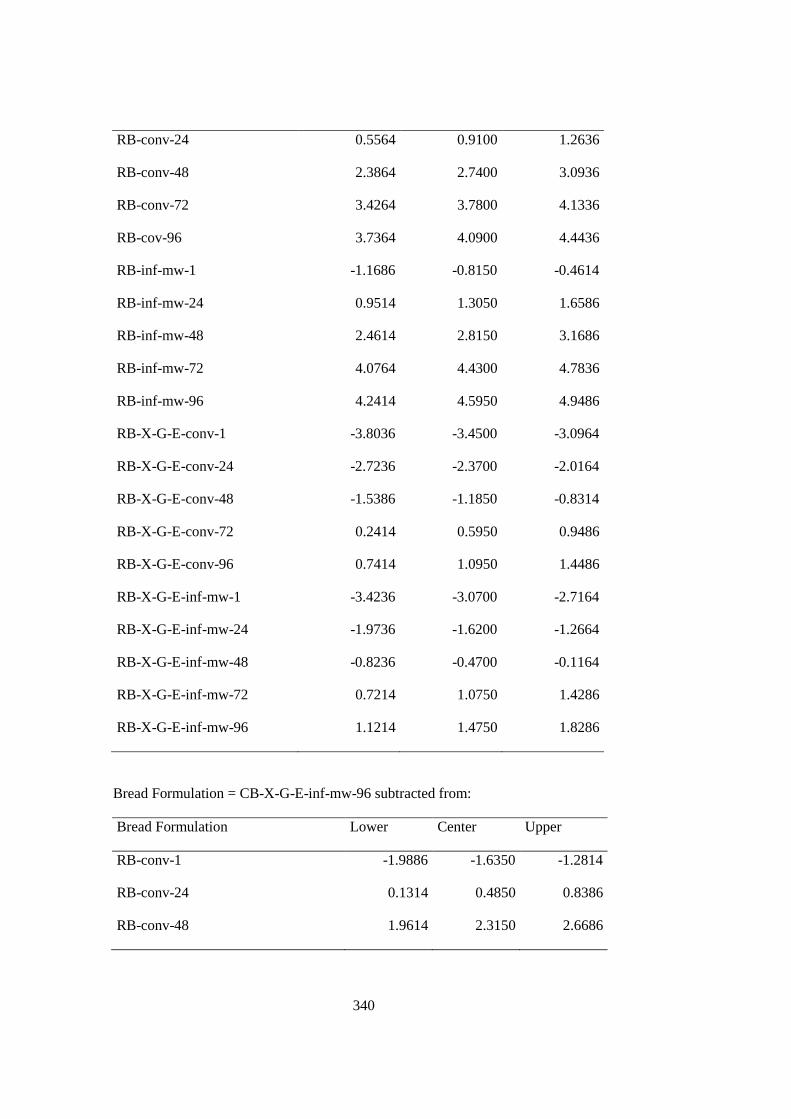
340
RB-conv-24 0.5564 0.9100 1.2636
RB-conv-48 2.3864 2.7400 3.0936
RB-conv-72 3.4264 3.7800 4.1336
RB-cov-96 3.7364 4.0900 4.4436
RB-inf-mw-1 -1.1686 -0.8150 -0.4614
RB-inf-mw-24 0.9514 1.3050 1.6586
RB-inf-mw-48 2.4614 2.8150 3.1686
RB-inf-mw-72 4.0764 4.4300 4.7836
RB-inf-mw-96 4.2414 4.5950 4.9486
RB-X-G-E-conv-1 -3.8036 -3.4500 -3.0964
RB-X-G-E-conv-24 -2.7236 -2.3700 -2.0164
RB-X-G-E-conv-48 -1.5386 -1.1850 -0.8314
RB-X-G-E-conv-72 0.2414 0.5950 0.9486
RB-X-G-E-conv-96 0.7414 1.0950 1.4486
RB-X-G-E-inf-mw-1 -3.4236 -3.0700 -2.7164
RB-X-G-E-inf-mw-24 -1.9736 -1.6200 -1.2664
RB-X-G-E-inf-mw-48 -0.8236 -0.4700 -0.1164
RB-X-G-E-inf-mw-72 0.7214 1.0750 1.4286
RB-X-G-E-inf-mw-96 1.1214 1.4750 1.8286
Bread Formulation = CB-X-G-E-inf-mw-96 subtracted from:
Bread Formulation Lower Center Upper
RB-conv-1 -1.9886 -1.6350 -1.2814
RB-conv-24 0.1314 0.4850 0.8386
RB-conv-48 1.9614 2.3150 2.6686
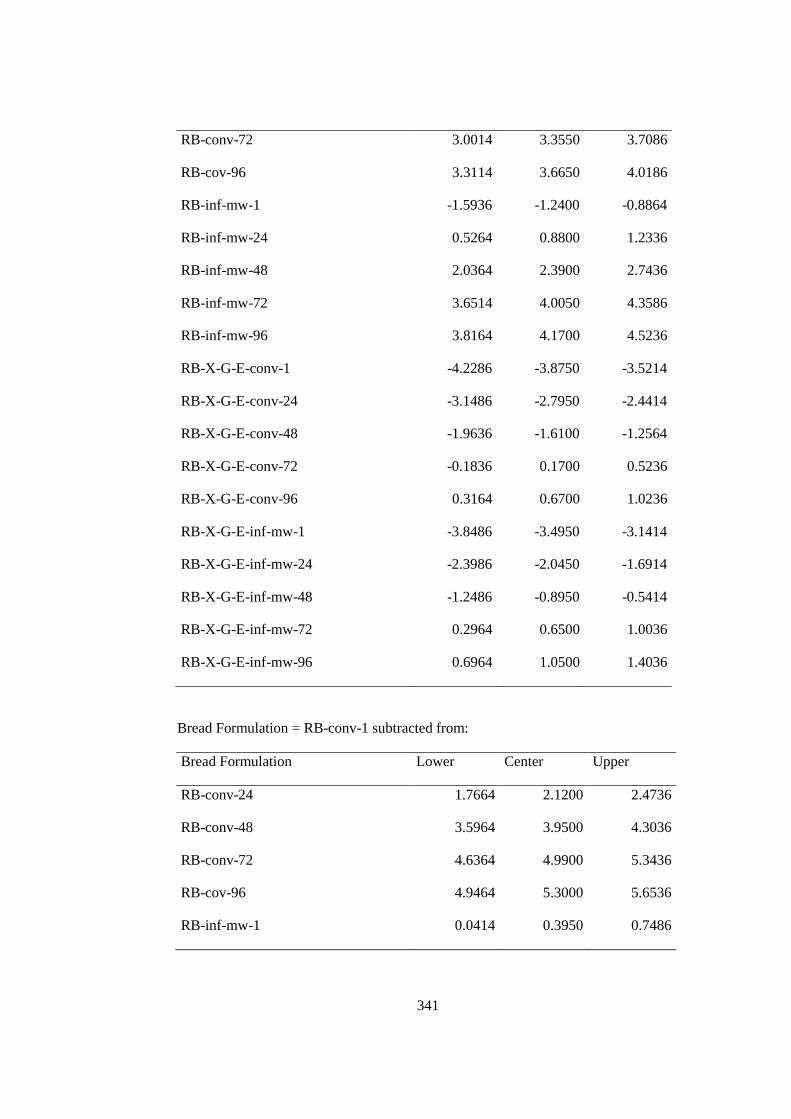
341
RB-conv-72 3.0014 3.3550 3.7086
RB-cov-96 3.3114 3.6650 4.0186
RB-inf-mw-1 -1.5936 -1.2400 -0.8864
RB-inf-mw-24 0.5264 0.8800 1.2336
RB-inf-mw-48 2.0364 2.3900 2.7436
RB-inf-mw-72 3.6514 4.0050 4.3586
RB-inf-mw-96 3.8164 4.1700 4.5236
RB-X-G-E-conv-1 -4.2286 -3.8750 -3.5214
RB-X-G-E-conv-24 -3.1486 -2.7950 -2.4414
RB-X-G-E-conv-48 -1.9636 -1.6100 -1.2564
RB-X-G-E-conv-72 -0.1836 0.1700 0.5236
RB-X-G-E-conv-96 0.3164 0.6700 1.0236
RB-X-G-E-inf-mw-1 -3.8486 -3.4950 -3.1414
RB-X-G-E-inf-mw-24 -2.3986 -2.0450 -1.6914
RB-X-G-E-inf-mw-48 -1.2486 -0.8950 -0.5414
RB-X-G-E-inf-mw-72 0.2964 0.6500 1.0036
RB-X-G-E-inf-mw-96 0.6964 1.0500 1.4036
Bread Formulation = RB-conv-1 subtracted from:
Bread Formulation Lower Center Upper
RB-conv-24 1.7664 2.1200 2.4736
RB-conv-48 3.5964 3.9500 4.3036
RB-conv-72 4.6364 4.9900 5.3436
RB-cov-96 4.9464 5.3000 5.6536
RB-inf-mw-1 0.0414 0.3950 0.7486
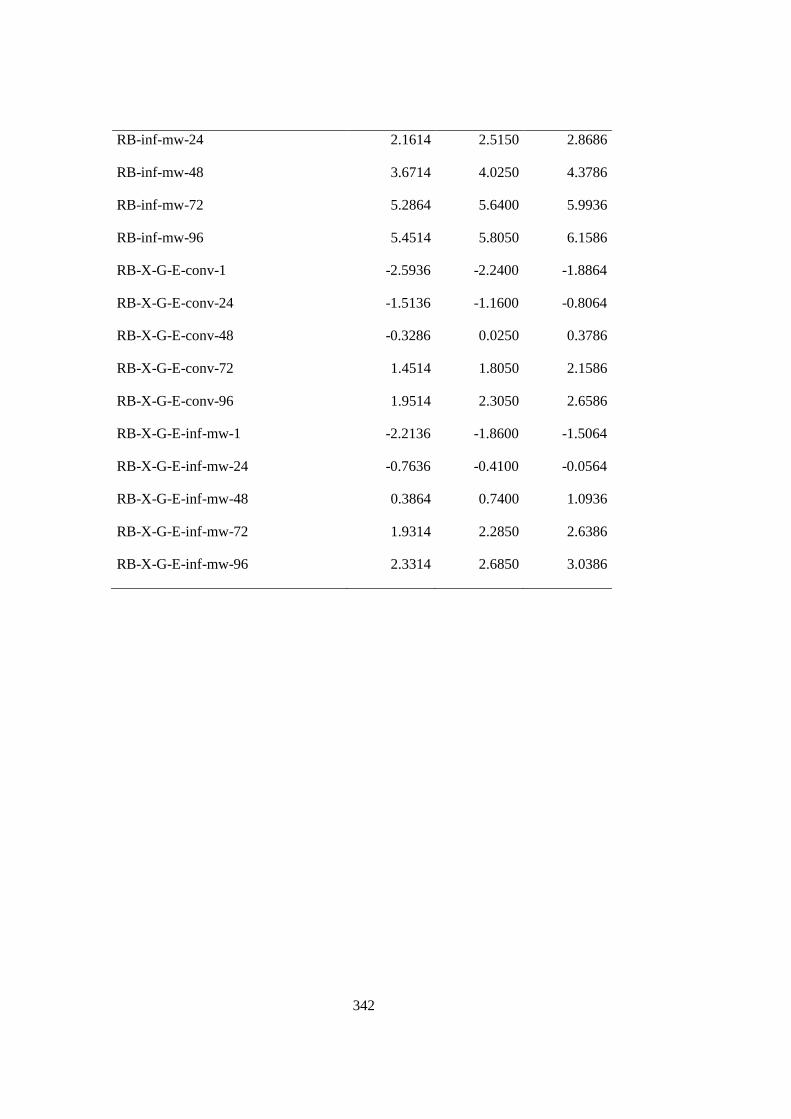
342
RB-inf-mw-24 2.1614 2.5150 2.8686
RB-inf-mw-48 3.6714 4.0250 4.3786
RB-inf-mw-72 5.2864 5.6400 5.9936
RB-inf-mw-96 5.4514 5.8050 6.1586
RB-X-G-E-conv-1 -2.5936 -2.2400 -1.8864
RB-X-G-E-conv-24 -1.5136 -1.1600 -0.8064
RB-X-G-E-conv-48 -0.3286 0.0250 0.3786
RB-X-G-E-conv-72 1.4514 1.8050 2.1586
RB-X-G-E-conv-96 1.9514 2.3050 2.6586
RB-X-G-E-inf-mw-1 -2.2136 -1.8600 -1.5064
RB-X-G-E-inf-mw-24 -0.7636 -0.4100 -0.0564
RB-X-G-E-inf-mw-48 0.3864 0.7400 1.0936
RB-X-G-E-inf-mw-72 1.9314 2.2850 2.6386
RB-X-G-E-inf-mw-96 2.3314 2.6850 3.0386
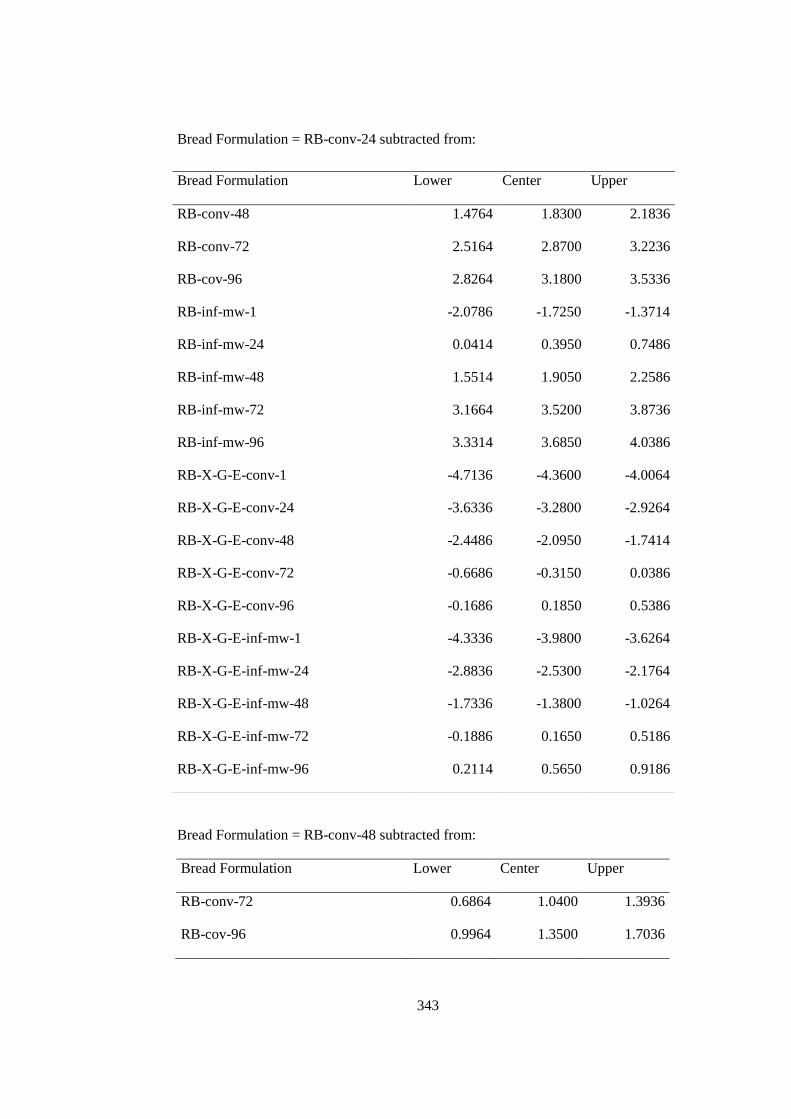
343
Bread Formulation = RB-conv-24 subtracted from:
Bread Formulation = RB-conv-48 subtracted from:
Bread Formulation Lower Center Upper
RB-conv-72 0.6864 1.0400 1.3936
RB-cov-96 0.9964 1.3500 1.7036
Bread Formulation Lower Center Upper
RB-conv-48 1.4764 1.8300 2.1836
RB-conv-72 2.5164 2.8700 3.2236
RB-cov-96 2.8264 3.1800 3.5336
RB-inf-mw-1 -2.0786 -1.7250 -1.3714
RB-inf-mw-24 0.0414 0.3950 0.7486
RB-inf-mw-48 1.5514 1.9050 2.2586
RB-inf-mw-72 3.1664 3.5200 3.8736
RB-inf-mw-96 3.3314 3.6850 4.0386
RB-X-G-E-conv-1 -4.7136 -4.3600 -4.0064
RB-X-G-E-conv-24 -3.6336 -3.2800 -2.9264
RB-X-G-E-conv-48 -2.4486 -2.0950 -1.7414
RB-X-G-E-conv-72 -0.6686 -0.3150 0.0386
RB-X-G-E-conv-96 -0.1686 0.1850 0.5386
RB-X-G-E-inf-mw-1 -4.3336 -3.9800 -3.6264
RB-X-G-E-inf-mw-24 -2.8836 -2.5300 -2.1764
RB-X-G-E-inf-mw-48 -1.7336 -1.3800 -1.0264
RB-X-G-E-inf-mw-72 -0.1886 0.1650 0.5186
RB-X-G-E-inf-mw-96 0.2114 0.5650 0.9186
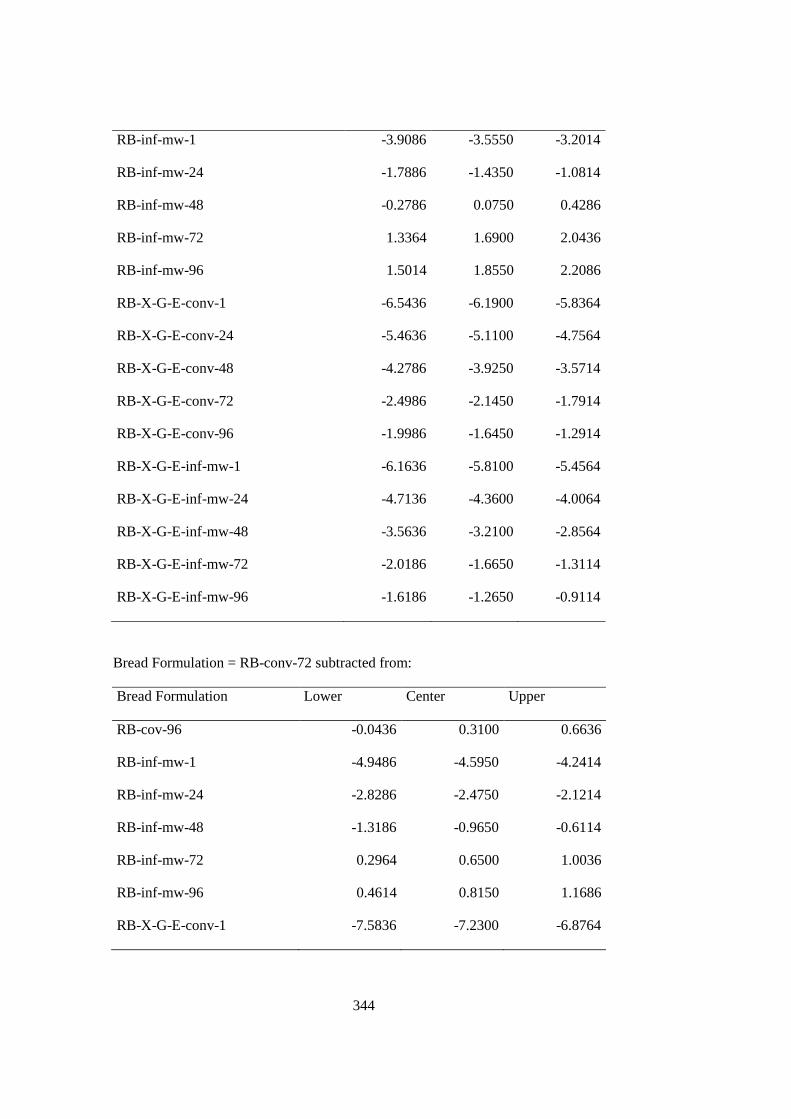
344
RB-inf-mw-1 -3.9086 -3.5550 -3.2014
RB-inf-mw-24 -1.7886 -1.4350 -1.0814
RB-inf-mw-48 -0.2786 0.0750 0.4286
RB-inf-mw-72 1.3364 1.6900 2.0436
RB-inf-mw-96 1.5014 1.8550 2.2086
RB-X-G-E-conv-1 -6.5436 -6.1900 -5.8364
RB-X-G-E-conv-24 -5.4636 -5.1100 -4.7564
RB-X-G-E-conv-48 -4.2786 -3.9250 -3.5714
RB-X-G-E-conv-72 -2.4986 -2.1450 -1.7914
RB-X-G-E-conv-96 -1.9986 -1.6450 -1.2914
RB-X-G-E-inf-mw-1 -6.1636 -5.8100 -5.4564
RB-X-G-E-inf-mw-24 -4.7136 -4.3600 -4.0064
RB-X-G-E-inf-mw-48 -3.5636 -3.2100 -2.8564
RB-X-G-E-inf-mw-72 -2.0186 -1.6650 -1.3114
RB-X-G-E-inf-mw-96 -1.6186 -1.2650 -0.9114
Bread Formulation = RB-conv-72 subtracted from:
Bread Formulation Lower Center Upper
RB-cov-96 -0.0436 0.3100 0.6636
RB-inf-mw-1 -4.9486 -4.5950 -4.2414
RB-inf-mw-24 -2.8286 -2.4750 -2.1214
RB-inf-mw-48 -1.3186 -0.9650 -0.6114
RB-inf-mw-72 0.2964 0.6500 1.0036
RB-inf-mw-96 0.4614 0.8150 1.1686
RB-X-G-E-conv-1 -7.5836 -7.2300 -6.8764
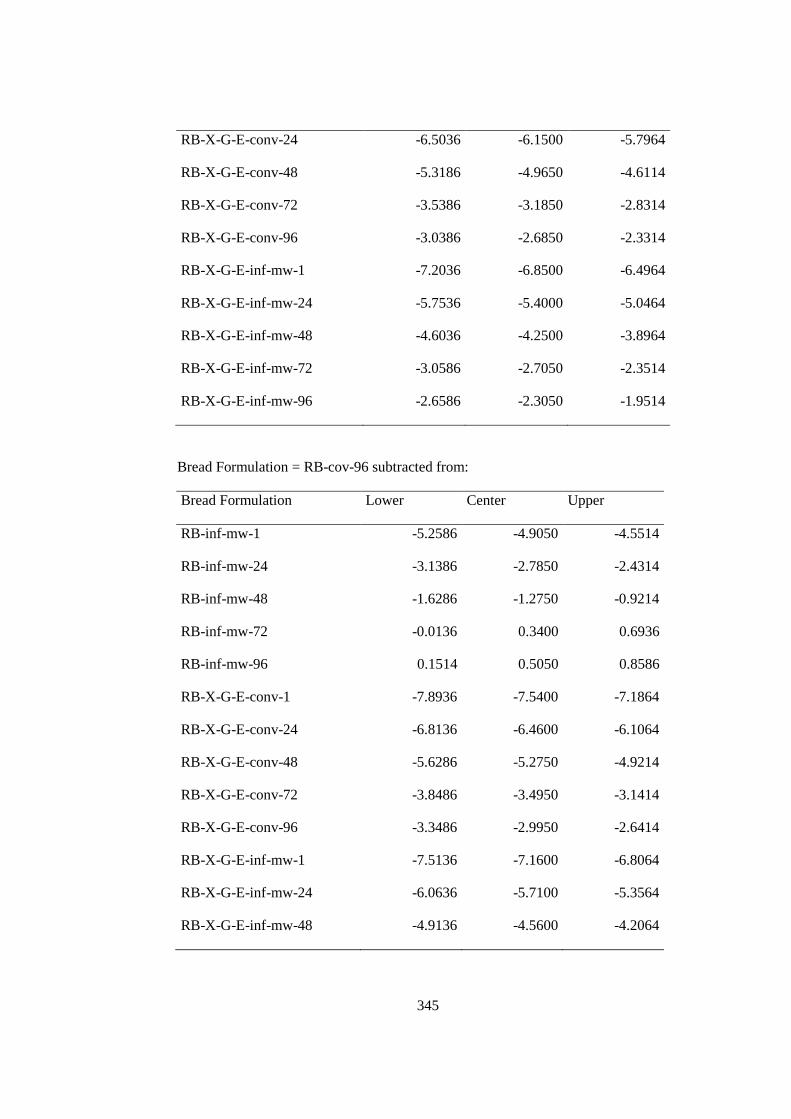
345
RB-X-G-E-conv-24 -6.5036 -6.1500 -5.7964
RB-X-G-E-conv-48 -5.3186 -4.9650 -4.6114
RB-X-G-E-conv-72 -3.5386 -3.1850 -2.8314
RB-X-G-E-conv-96 -3.0386 -2.6850 -2.3314
RB-X-G-E-inf-mw-1 -7.2036 -6.8500 -6.4964
RB-X-G-E-inf-mw-24 -5.7536 -5.4000 -5.0464
RB-X-G-E-inf-mw-48 -4.6036 -4.2500 -3.8964
RB-X-G-E-inf-mw-72 -3.0586 -2.7050 -2.3514
RB-X-G-E-inf-mw-96 -2.6586 -2.3050 -1.9514
Bread Formulation = RB-cov-96 subtracted from:
Bread Formulation Lower Center Upper
RB-inf-mw-1 -5.2586 -4.9050 -4.5514
RB-inf-mw-24 -3.1386 -2.7850 -2.4314
RB-inf-mw-48 -1.6286 -1.2750 -0.9214
RB-inf-mw-72 -0.0136 0.3400 0.6936
RB-inf-mw-96 0.1514 0.5050 0.8586
RB-X-G-E-conv-1 -7.8936 -7.5400 -7.1864
RB-X-G-E-conv-24 -6.8136 -6.4600 -6.1064
RB-X-G-E-conv-48 -5.6286 -5.2750 -4.9214
RB-X-G-E-conv-72 -3.8486 -3.4950 -3.1414
RB-X-G-E-conv-96 -3.3486 -2.9950 -2.6414
RB-X-G-E-inf-mw-1 -7.5136 -7.1600 -6.8064
RB-X-G-E-inf-mw-24 -6.0636 -5.7100 -5.3564
RB-X-G-E-inf-mw-48 -4.9136 -4.5600 -4.2064
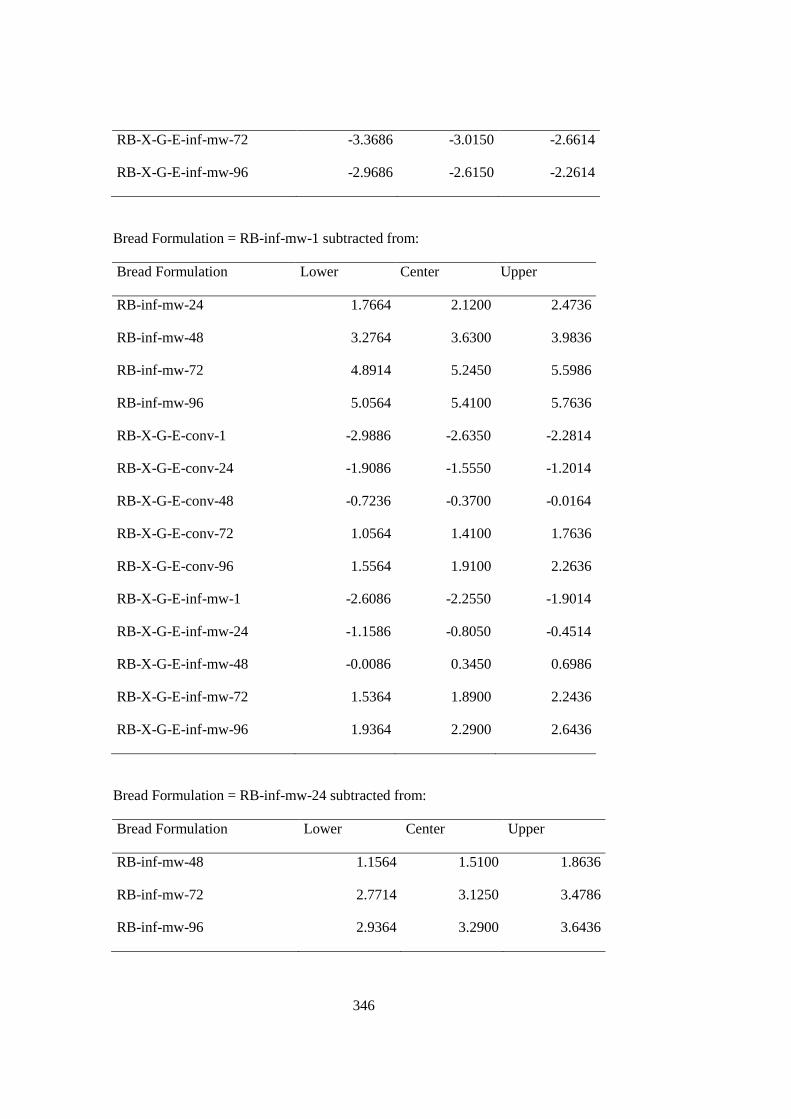
346
RB-X-G-E-inf-mw-72 -3.3686 -3.0150 -2.6614
RB-X-G-E-inf-mw-96 -2.9686 -2.6150 -2.2614
Bread Formulation = RB-inf-mw-1 subtracted from:
Bread Formulation Lower Center Upper
RB-inf-mw-24 1.7664 2.1200 2.4736
RB-inf-mw-48 3.2764 3.6300 3.9836
RB-inf-mw-72 4.8914 5.2450 5.5986
RB-inf-mw-96 5.0564 5.4100 5.7636
RB-X-G-E-conv-1 -2.9886 -2.6350 -2.2814
RB-X-G-E-conv-24 -1.9086 -1.5550 -1.2014
RB-X-G-E-conv-48 -0.7236 -0.3700 -0.0164
RB-X-G-E-conv-72 1.0564 1.4100 1.7636
RB-X-G-E-conv-96 1.5564 1.9100 2.2636
RB-X-G-E-inf-mw-1 -2.6086 -2.2550 -1.9014
RB-X-G-E-inf-mw-24 -1.1586 -0.8050 -0.4514
RB-X-G-E-inf-mw-48 -0.0086 0.3450 0.6986
RB-X-G-E-inf-mw-72 1.5364 1.8900 2.2436
RB-X-G-E-inf-mw-96 1.9364 2.2900 2.6436
Bread Formulation = RB-inf-mw-24 subtracted from:
Bread Formulation Lower Center Upper
RB-inf-mw-48 1.1564 1.5100 1.8636
RB-inf-mw-72 2.7714 3.1250 3.4786
RB-inf-mw-96 2.9364 3.2900 3.6436
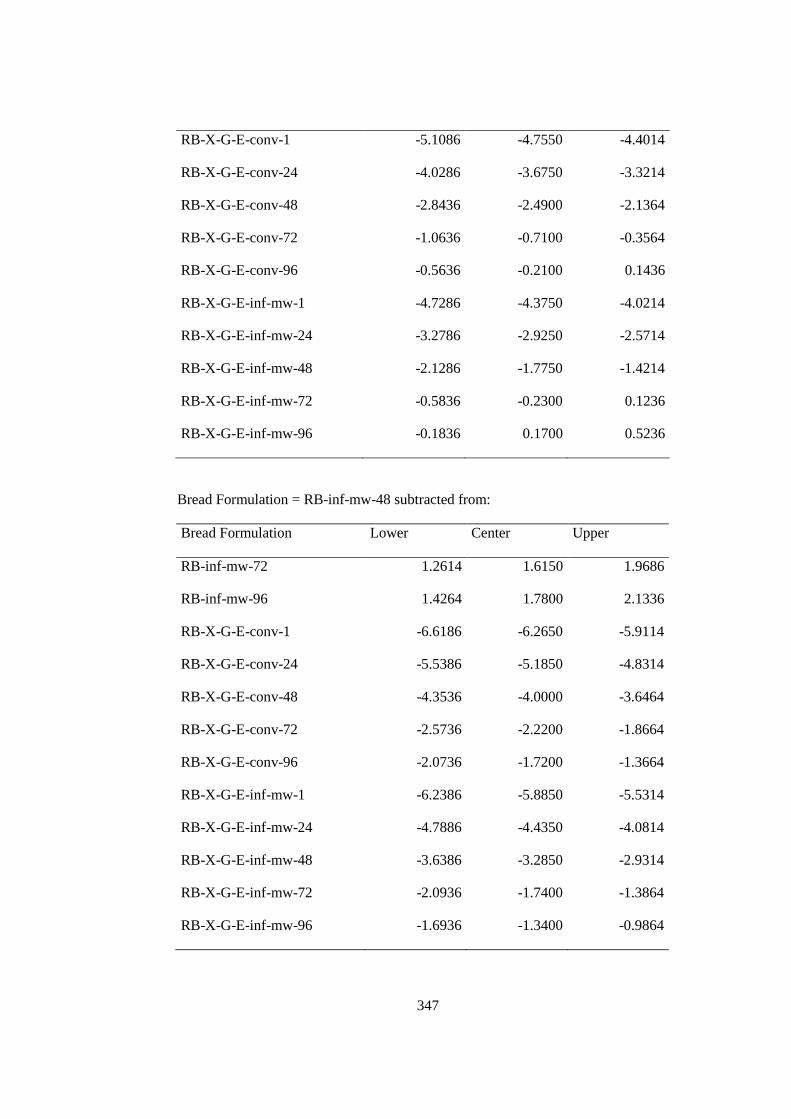
347
RB-X-G-E-conv-1 -5.1086 -4.7550 -4.4014
RB-X-G-E-conv-24 -4.0286 -3.6750 -3.3214
RB-X-G-E-conv-48 -2.8436 -2.4900 -2.1364
RB-X-G-E-conv-72 -1.0636 -0.7100 -0.3564
RB-X-G-E-conv-96 -0.5636 -0.2100 0.1436
RB-X-G-E-inf-mw-1 -4.7286 -4.3750 -4.0214
RB-X-G-E-inf-mw-24 -3.2786 -2.9250 -2.5714
RB-X-G-E-inf-mw-48 -2.1286 -1.7750 -1.4214
RB-X-G-E-inf-mw-72 -0.5836 -0.2300 0.1236
RB-X-G-E-inf-mw-96 -0.1836 0.1700 0.5236
Bread Formulation = RB-inf-mw-48 subtracted from:
Bread Formulation Lower Center Upper
RB-inf-mw-72 1.2614 1.6150 1.9686
RB-inf-mw-96 1.4264 1.7800 2.1336
RB-X-G-E-conv-1 -6.6186 -6.2650 -5.9114
RB-X-G-E-conv-24 -5.5386 -5.1850 -4.8314
RB-X-G-E-conv-48 -4.3536 -4.0000 -3.6464
RB-X-G-E-conv-72 -2.5736 -2.2200 -1.8664
RB-X-G-E-conv-96 -2.0736 -1.7200 -1.3664
RB-X-G-E-inf-mw-1 -6.2386 -5.8850 -5.5314
RB-X-G-E-inf-mw-24 -4.7886 -4.4350 -4.0814
RB-X-G-E-inf-mw-48 -3.6386 -3.2850 -2.9314
RB-X-G-E-inf-mw-72 -2.0936 -1.7400 -1.3864
RB-X-G-E-inf-mw-96 -1.6936 -1.3400 -0.9864
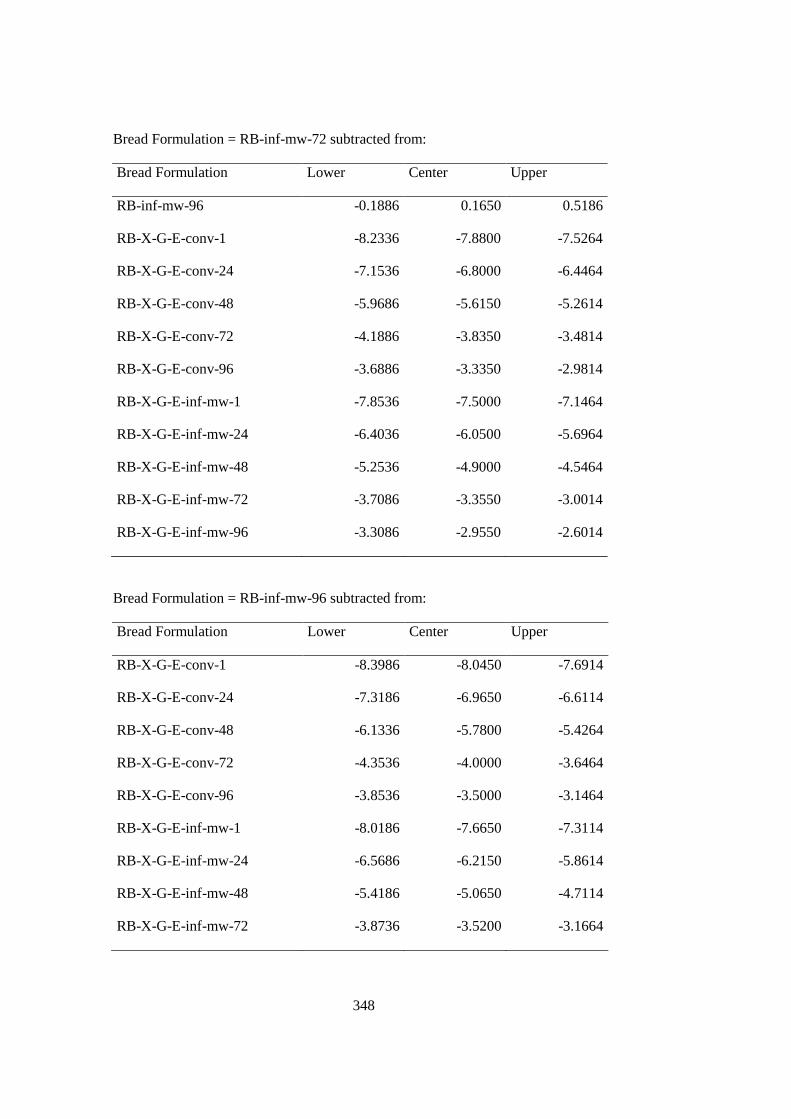
348
Bread Formulation = RB-inf-mw-72 subtracted from:
Bread Formulation Lower Center Upper
RB-inf-mw-96 -0.1886 0.1650 0.5186
RB-X-G-E-conv-1 -8.2336 -7.8800 -7.5264
RB-X-G-E-conv-24 -7.1536 -6.8000 -6.4464
RB-X-G-E-conv-48 -5.9686 -5.6150 -5.2614
RB-X-G-E-conv-72 -4.1886 -3.8350 -3.4814
RB-X-G-E-conv-96 -3.6886 -3.3350 -2.9814
RB-X-G-E-inf-mw-1 -7.8536 -7.5000 -7.1464
RB-X-G-E-inf-mw-24 -6.4036 -6.0500 -5.6964
RB-X-G-E-inf-mw-48 -5.2536 -4.9000 -4.5464
RB-X-G-E-inf-mw-72 -3.7086 -3.3550 -3.0014
RB-X-G-E-inf-mw-96 -3.3086 -2.9550 -2.6014
Bread Formulation = RB-inf-mw-96 subtracted from:
Bread Formulation Lower Center Upper
RB-X-G-E-conv-1 -8.3986 -8.0450 -7.6914
RB-X-G-E-conv-24 -7.3186 -6.9650 -6.6114
RB-X-G-E-conv-48 -6.1336 -5.7800 -5.4264
RB-X-G-E-conv-72 -4.3536 -4.0000 -3.6464
RB-X-G-E-conv-96 -3.8536 -3.5000 -3.1464
RB-X-G-E-inf-mw-1 -8.0186 -7.6650 -7.3114
RB-X-G-E-inf-mw-24 -6.5686 -6.2150 -5.8614
RB-X-G-E-inf-mw-48 -5.4186 -5.0650 -4.7114
RB-X-G-E-inf-mw-72 -3.8736 -3.5200 -3.1664
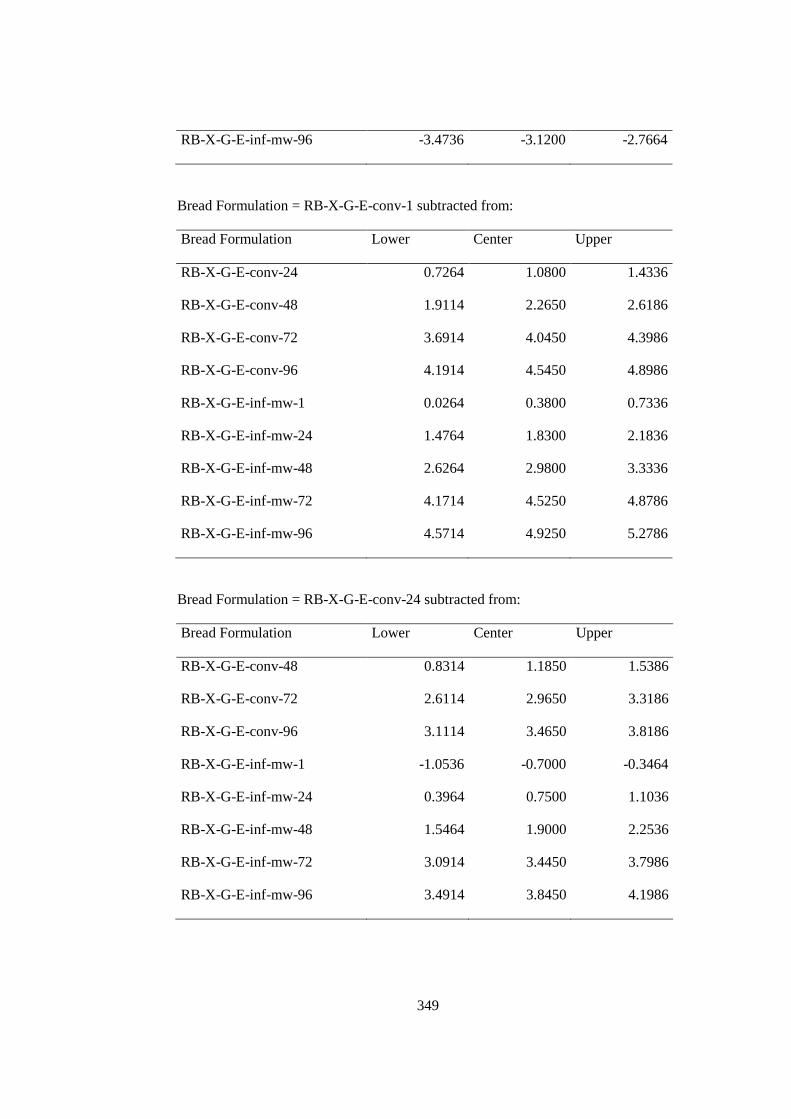
349
RB-X-G-E-inf-mw-96 -3.4736 -3.1200 -2.7664
Bread Formulation = RB-X-G-E-conv-1 subtracted from:
Bread Formulation Lower Center Upper
RB-X-G-E-conv-24 0.7264 1.0800 1.4336
RB-X-G-E-conv-48 1.9114 2.2650 2.6186
RB-X-G-E-conv-72 3.6914 4.0450 4.3986
RB-X-G-E-conv-96 4.1914 4.5450 4.8986
RB-X-G-E-inf-mw-1 0.0264 0.3800 0.7336
RB-X-G-E-inf-mw-24 1.4764 1.8300 2.1836
RB-X-G-E-inf-mw-48 2.6264 2.9800 3.3336
RB-X-G-E-inf-mw-72 4.1714 4.5250 4.8786
RB-X-G-E-inf-mw-96 4.5714 4.9250 5.2786
Bread Formulation = RB-X-G-E-conv-24 subtracted from:
Bread Formulation Lower Center Upper
RB-X-G-E-conv-48 0.8314 1.1850 1.5386
RB-X-G-E-conv-72 2.6114 2.9650 3.3186
RB-X-G-E-conv-96 3.1114 3.4650 3.8186
RB-X-G-E-inf-mw-1 -1.0536 -0.7000 -0.3464
RB-X-G-E-inf-mw-24 0.3964 0.7500 1.1036
RB-X-G-E-inf-mw-48 1.5464 1.9000 2.2536
RB-X-G-E-inf-mw-72 3.0914 3.4450 3.7986
RB-X-G-E-inf-mw-96 3.4914 3.8450 4.1986
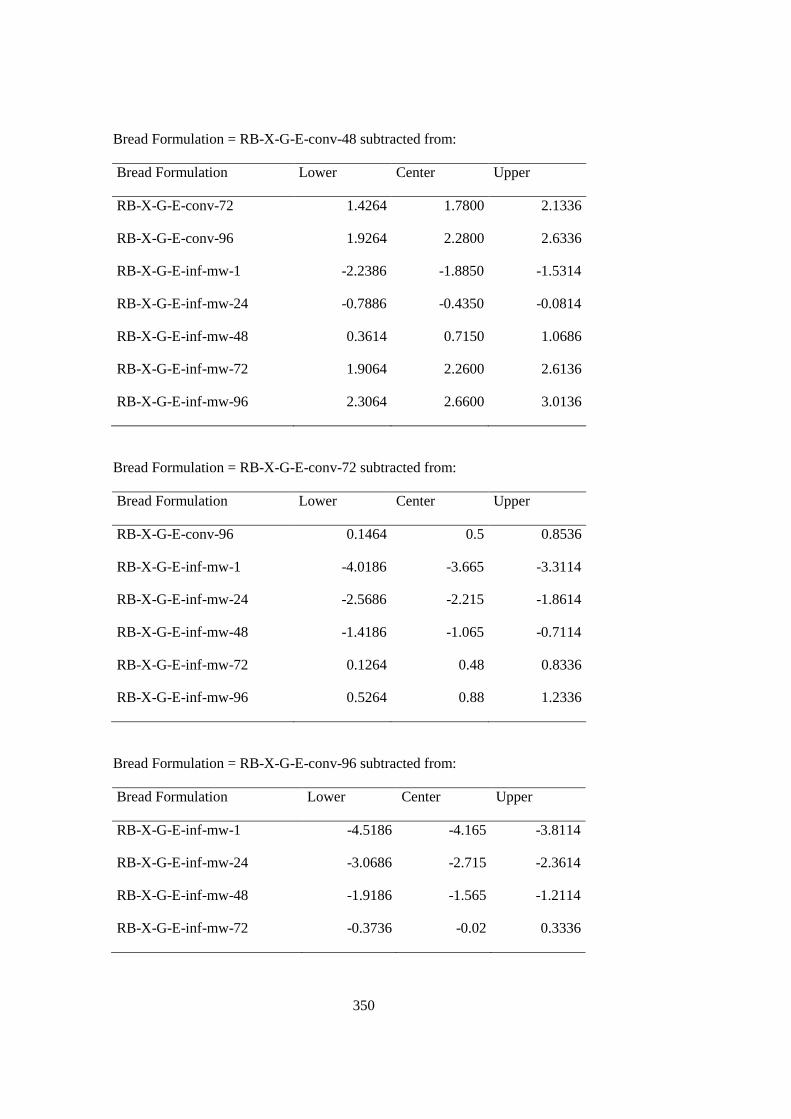
350
Bread Formulation = RB-X-G-E-conv-48 subtracted from:
Bread Formulation Lower Center Upper
RB-X-G-E-conv-72 1.4264 1.7800 2.1336
RB-X-G-E-conv-96 1.9264 2.2800 2.6336
RB-X-G-E-inf-mw-1 -2.2386 -1.8850 -1.5314
RB-X-G-E-inf-mw-24 -0.7886 -0.4350 -0.0814
RB-X-G-E-inf-mw-48 0.3614 0.7150 1.0686
RB-X-G-E-inf-mw-72 1.9064 2.2600 2.6136
RB-X-G-E-inf-mw-96 2.3064 2.6600 3.0136
Bread Formulation = RB-X-G-E-conv-72 subtracted from:
Bread Formulation Lower Center Upper
RB-X-G-E-conv-96 0.1464 0.5 0.8536
RB-X-G-E-inf-mw-1 -4.0186 -3.665 -3.3114
RB-X-G-E-inf-mw-24 -2.5686 -2.215 -1.8614
RB-X-G-E-inf-mw-48 -1.4186 -1.065 -0.7114
RB-X-G-E-inf-mw-72 0.1264 0.48 0.8336
RB-X-G-E-inf-mw-96 0.5264 0.88 1.2336
Bread Formulation = RB-X-G-E-conv-96 subtracted from:
Bread Formulation Lower Center Upper
RB-X-G-E-inf-mw-1 -4.5186 -4.165 -3.8114
RB-X-G-E-inf-mw-24 -3.0686 -2.715 -2.3614
RB-X-G-E-inf-mw-48 -1.9186 -1.565 -1.2114
RB-X-G-E-inf-mw-72 -0.3736 -0.02 0.3336
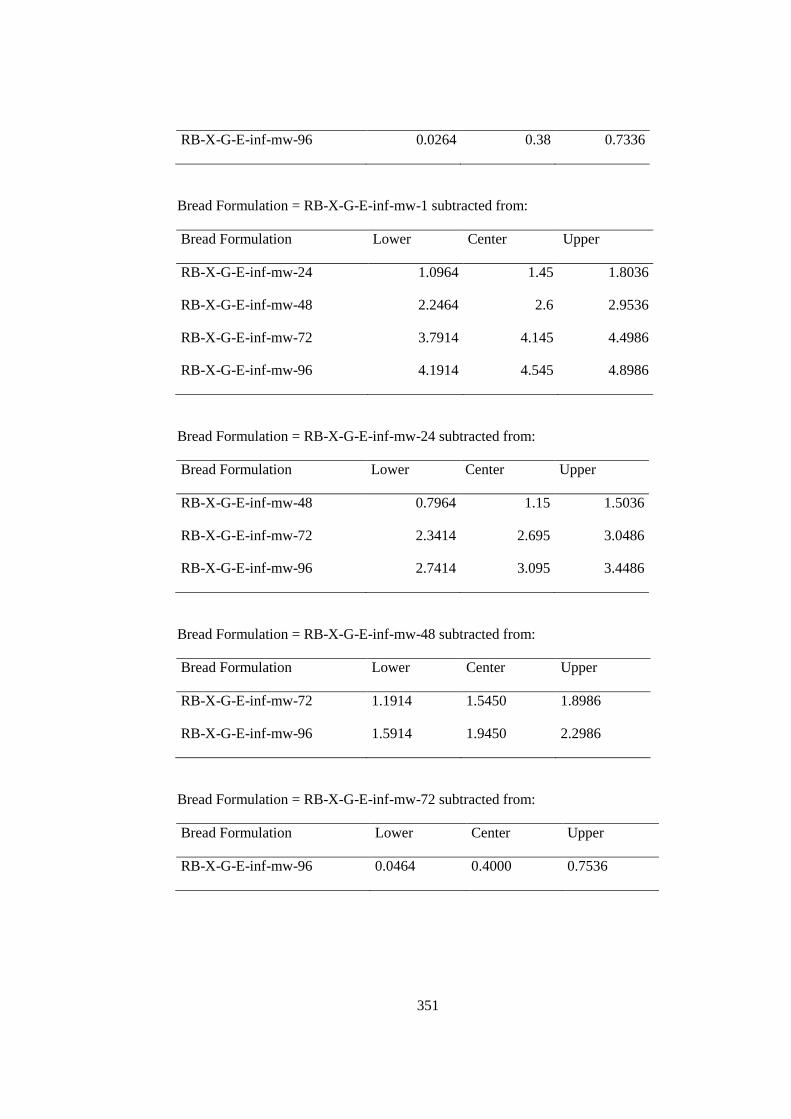
351
RB-X-G-E-inf-mw-96 0.0264 0.38 0.7336
Bread Formulation = RB-X-G-E-inf-mw-1 subtracted from:
Bread Formulation Lower Center Upper
RB-X-G-E-inf-mw-24 1.0964 1.45 1.8036
RB-X-G-E-inf-mw-48 2.2464 2.6 2.9536
RB-X-G-E-inf-mw-72 3.7914 4.145 4.4986
RB-X-G-E-inf-mw-96 4.1914 4.545 4.8986
Bread Formulation = RB-X-G-E-inf-mw-24 subtracted from:
Bread Formulation Lower Center Upper
RB-X-G-E-inf-mw-48 0.7964 1.15 1.5036
RB-X-G-E-inf-mw-72 2.3414 2.695 3.0486
RB-X-G-E-inf-mw-96 2.7414 3.095 3.4486
Bread Formulation = RB-X-G-E-inf-mw-48 subtracted from:
Bread Formulation Lower Center Upper
RB-X-G-E-inf-mw-72 1.1914 1.5450 1.8986
RB-X-G-E-inf-mw-96 1.5914 1.9450 2.2986
Bread Formulation = RB-X-G-E-inf-mw-72 subtracted from:
Bread Formulation Lower Center Upper
RB-X-G-E-inf-mw-96 0.0464 0.4000 0.7536
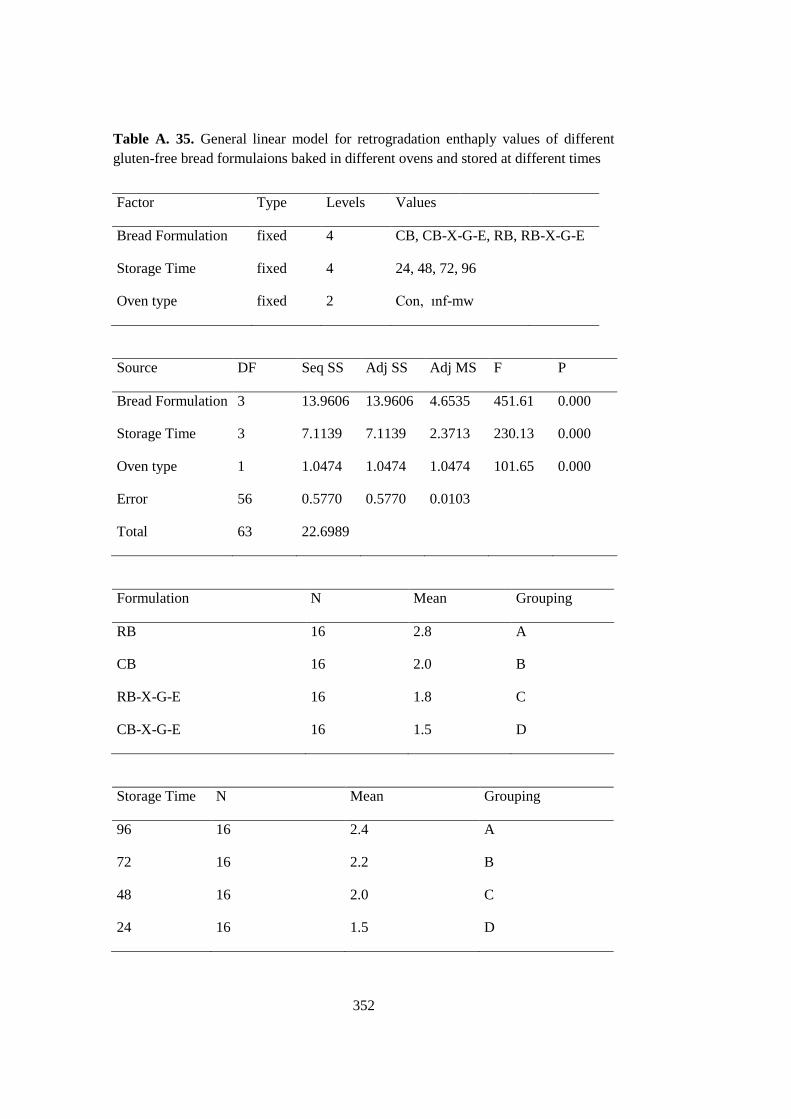
352
Table A. 35. General linear model for retrogradation enthaply values of different
gluten-free bread formulaions baked in different ovens and stored at different times
Factor Type Levels Values
Bread Formulation fixed 4 CB, CB-X-G-E, RB, RB-X-G-E
Storage Time fixed 4 24, 48, 72, 96
Oven type fixed 2 Con, ınf-mw
Source DF Seq SS Adj SS Adj MS F P
Bread Formulation 3 13.9606 13.9606 4.6535 451.61 0.000
Storage Time 3 7.1139 7.1139 2.3713 230.13 0.000
Oven type 1 1.0474 1.0474 1.0474 101.65 0.000
Error 56 0.5770 0.5770 0.0103
Total 63 22.6989
Formulation N Mean Grouping
RB 16 2.8 A
CB 16 2.0 B
RB-X-G-E 16 1.8 C
CB-X-G-E 16 1.5 D
Storage Time N Mean Grouping
96 16 2.4 A
72 16 2.2 B
48 16 2.0 C
24 16 1.5 D
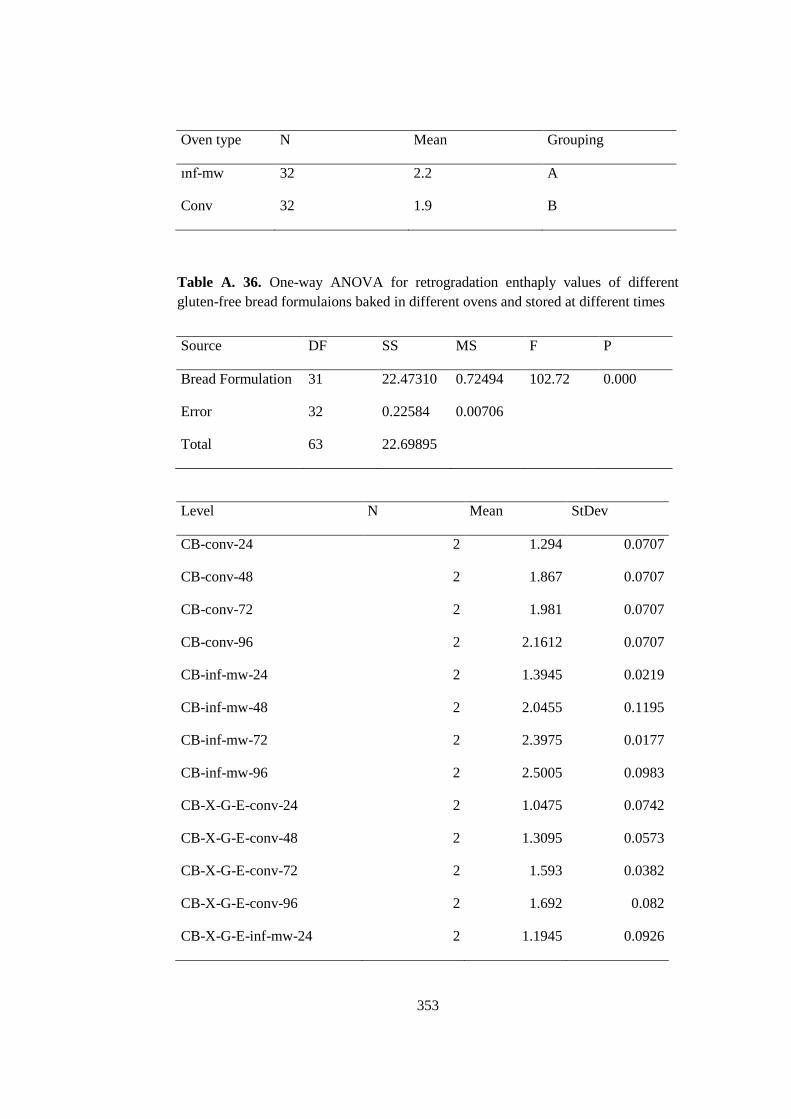
353
Oven type N Mean Grouping
ınf-mw 32 2.2 A
Conv 32 1.9 B
Table A. 36. One-way ANOVA for retrogradation enthaply values of different
gluten-free bread formulaions baked in different ovens and stored at different times
Source DF SS MS F P
Bread Formulation 31 22.47310 0.72494 102.72 0.000
Error 32 0.22584 0.00706
Total 63 22.69895
Level N Mean StDev
CB-conv-24 2 1.294 0.0707
CB-conv-48 2 1.867 0.0707
CB-conv-72 2 1.981 0.0707
CB-conv-96 2 2.1612 0.0707
CB-inf-mw-24 2 1.3945 0.0219
CB-inf-mw-48 2 2.0455 0.1195
CB-inf-mw-72 2 2.3975 0.0177
CB-inf-mw-96 2 2.5005 0.0983
CB-X-G-E-conv-24 2 1.0475 0.0742
CB-X-G-E-conv-48 2 1.3095 0.0573
CB-X-G-E-conv-72 2 1.593 0.0382
CB-X-G-E-conv-96 2 1.692 0.082
CB-X-G-E-inf-mw-24 2 1.1945 0.0926
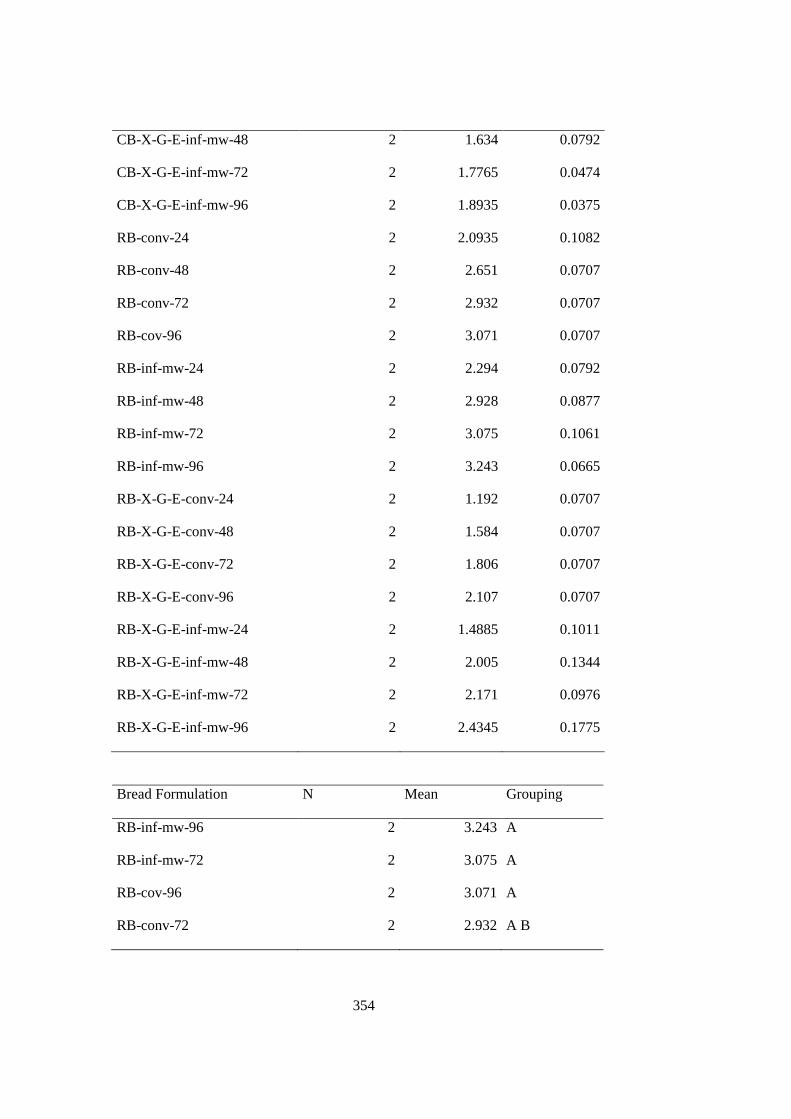
354
CB-X-G-E-inf-mw-48 2 1.634 0.0792
CB-X-G-E-inf-mw-72 2 1.7765 0.0474
CB-X-G-E-inf-mw-96 2 1.8935 0.0375
RB-conv-24 2 2.0935 0.1082
RB-conv-48 2 2.651 0.0707
RB-conv-72 2 2.932 0.0707
RB-cov-96 2 3.071 0.0707
RB-inf-mw-24 2 2.294 0.0792
RB-inf-mw-48 2 2.928 0.0877
RB-inf-mw-72 2 3.075 0.1061
RB-inf-mw-96 2 3.243 0.0665
RB-X-G-E-conv-24 2 1.192 0.0707
RB-X-G-E-conv-48 2 1.584 0.0707
RB-X-G-E-conv-72 2 1.806 0.0707
RB-X-G-E-conv-96 2 2.107 0.0707
RB-X-G-E-inf-mw-24 2 1.4885 0.1011
RB-X-G-E-inf-mw-48 2 2.005 0.1344
RB-X-G-E-inf-mw-72 2 2.171 0.0976
RB-X-G-E-inf-mw-96 2 2.4345 0.1775
Bread Formulation N Mean Grouping
RB-inf-mw-96 2 3.243 A
RB-inf-mw-72 2 3.075 A
RB-cov-96 2 3.071 A
RB-conv-72 2 2.932 A B
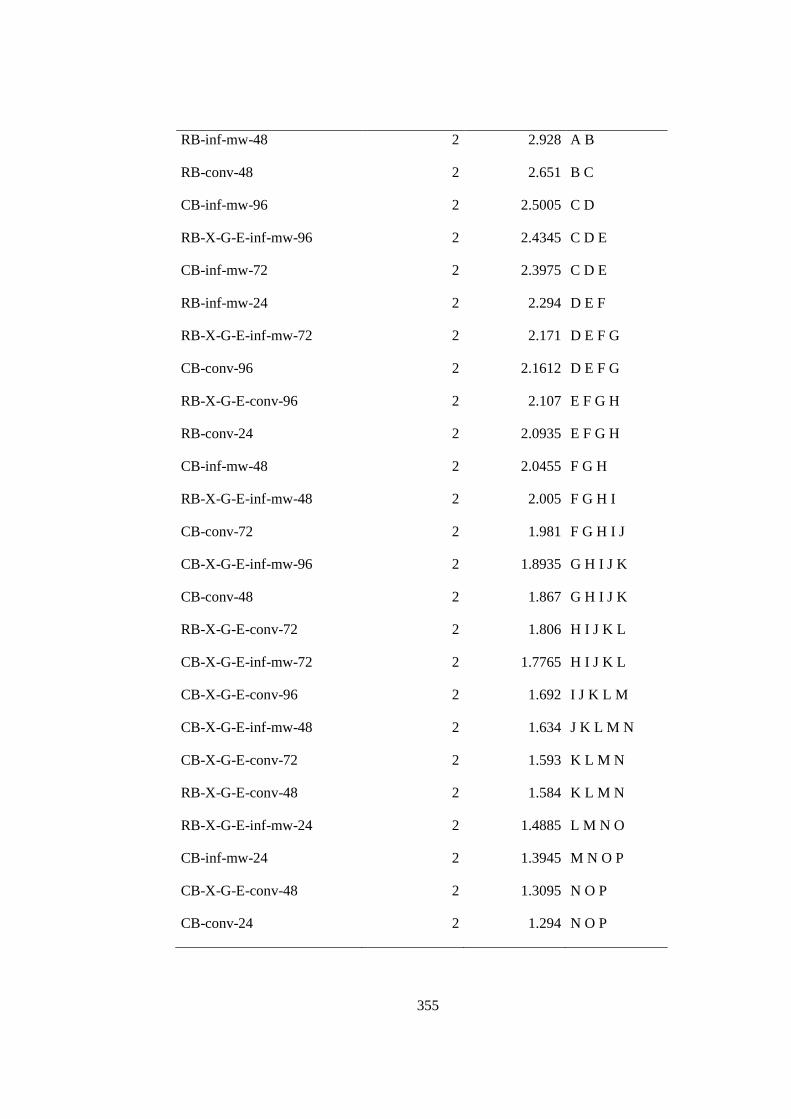
355
RB-inf-mw-48 2 2.928 A B
RB-conv-48 2 2.651 B C
CB-inf-mw-96 2 2.5005 C D
RB-X-G-E-inf-mw-96 2 2.4345 C D E
CB-inf-mw-72 2 2.3975 C D E
RB-inf-mw-24 2 2.294 D E F
RB-X-G-E-inf-mw-72 2 2.171 D E F G
CB-conv-96 2 2.1612 D E F G
RB-X-G-E-conv-96 2 2.107 E F G H
RB-conv-24 2 2.0935 E F G H
CB-inf-mw-48 2 2.0455 F G H
RB-X-G-E-inf-mw-48 2 2.005 F G H I
CB-conv-72 2 1.981 F G H I J
CB-X-G-E-inf-mw-96 2 1.8935 G H I J K
CB-conv-48 2 1.867 G H I J K
RB-X-G-E-conv-72 2 1.806 H I J K L
CB-X-G-E-inf-mw-72 2 1.7765 H I J K L
CB-X-G-E-conv-96 2 1.692 I J K L M
CB-X-G-E-inf-mw-48 2 1.634 J K L M N
CB-X-G-E-conv-72 2 1.593 K L M N
RB-X-G-E-conv-48 2 1.584 K L M N
RB-X-G-E-inf-mw-24 2 1.4885 L M N O
CB-inf-mw-24 2 1.3945 M N O P
CB-X-G-E-conv-48 2 1.3095 N O P
CB-conv-24 2 1.294 N O P
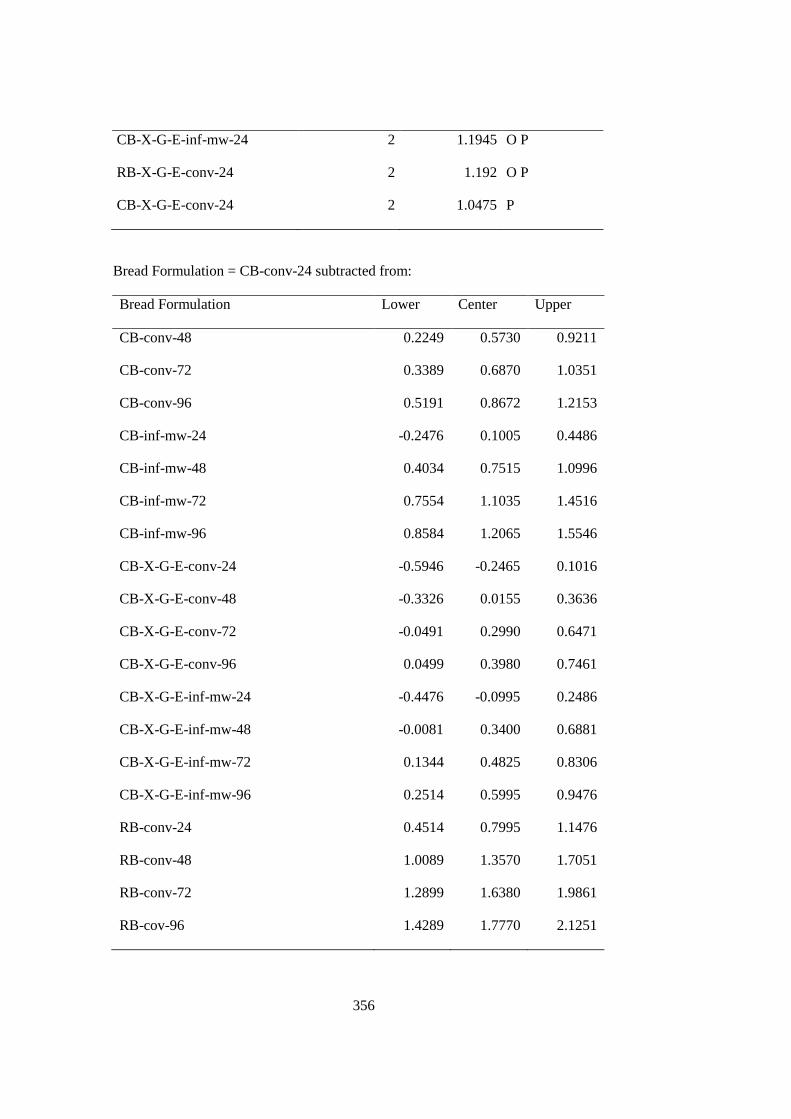
356
CB-X-G-E-inf-mw-24 2 1.1945 O P
RB-X-G-E-conv-24 2 1.192 O P
CB-X-G-E-conv-24 2 1.0475 P
Bread Formulation = CB-conv-24 subtracted from:
Bread Formulation Lower Center Upper
CB-conv-48 0.2249 0.5730 0.9211
CB-conv-72 0.3389 0.6870 1.0351
CB-conv-96 0.5191 0.8672 1.2153
CB-inf-mw-24 -0.2476 0.1005 0.4486
CB-inf-mw-48 0.4034 0.7515 1.0996
CB-inf-mw-72 0.7554 1.1035 1.4516
CB-inf-mw-96 0.8584 1.2065 1.5546
CB-X-G-E-conv-24 -0.5946 -0.2465 0.1016
CB-X-G-E-conv-48 -0.3326 0.0155 0.3636
CB-X-G-E-conv-72 -0.0491 0.2990 0.6471
CB-X-G-E-conv-96 0.0499 0.3980 0.7461
CB-X-G-E-inf-mw-24 -0.4476 -0.0995 0.2486
CB-X-G-E-inf-mw-48 -0.0081 0.3400 0.6881
CB-X-G-E-inf-mw-72 0.1344 0.4825 0.8306
CB-X-G-E-inf-mw-96 0.2514 0.5995 0.9476
RB-conv-24 0.4514 0.7995 1.1476
RB-conv-48 1.0089 1.3570 1.7051
RB-conv-72 1.2899 1.6380 1.9861
RB-cov-96 1.4289 1.7770 2.1251
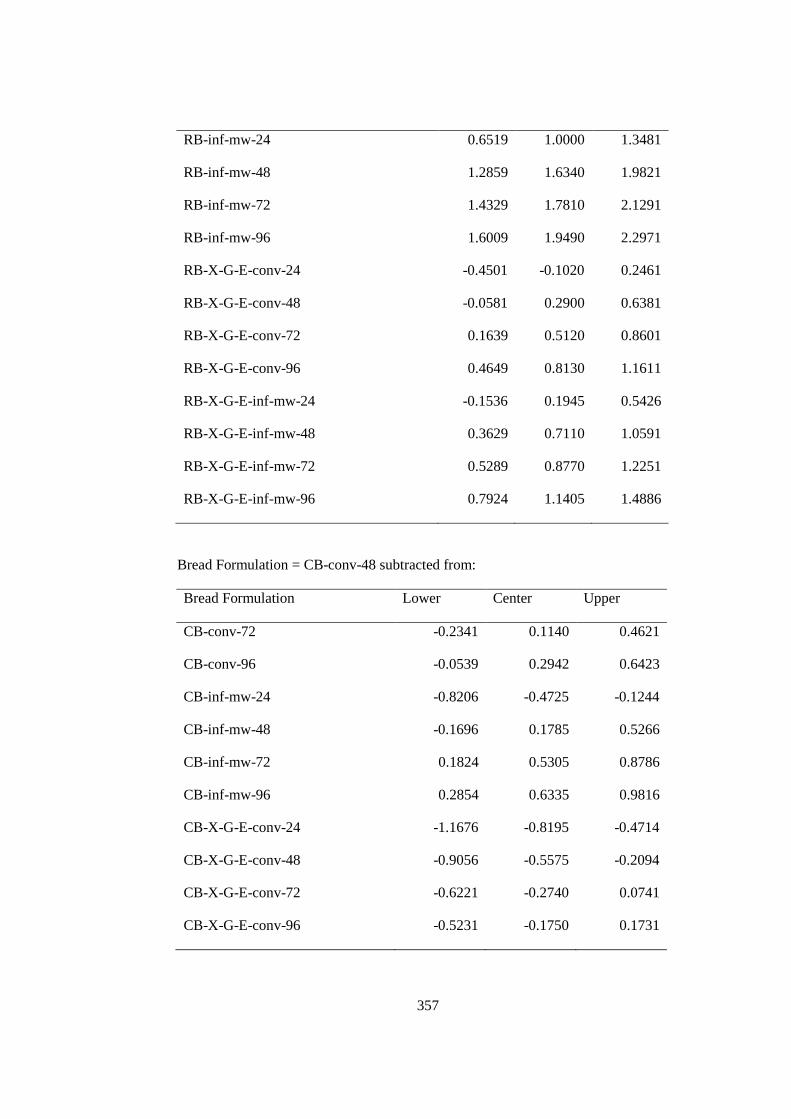
357
RB-inf-mw-24 0.6519 1.0000 1.3481
RB-inf-mw-48 1.2859 1.6340 1.9821
RB-inf-mw-72 1.4329 1.7810 2.1291
RB-inf-mw-96 1.6009 1.9490 2.2971
RB-X-G-E-conv-24 -0.4501 -0.1020 0.2461
RB-X-G-E-conv-48 -0.0581 0.2900 0.6381
RB-X-G-E-conv-72 0.1639 0.5120 0.8601
RB-X-G-E-conv-96 0.4649 0.8130 1.1611
RB-X-G-E-inf-mw-24 -0.1536 0.1945 0.5426
RB-X-G-E-inf-mw-48 0.3629 0.7110 1.0591
RB-X-G-E-inf-mw-72 0.5289 0.8770 1.2251
RB-X-G-E-inf-mw-96 0.7924 1.1405 1.4886
Bread Formulation = CB-conv-48 subtracted from:
Bread Formulation Lower Center Upper
CB-conv-72 -0.2341 0.1140 0.4621
CB-conv-96 -0.0539 0.2942 0.6423
CB-inf-mw-24 -0.8206 -0.4725 -0.1244
CB-inf-mw-48 -0.1696 0.1785 0.5266
CB-inf-mw-72 0.1824 0.5305 0.8786
CB-inf-mw-96 0.2854 0.6335 0.9816
CB-X-G-E-conv-24 -1.1676 -0.8195 -0.4714
CB-X-G-E-conv-48 -0.9056 -0.5575 -0.2094
CB-X-G-E-conv-72 -0.6221 -0.2740 0.0741
CB-X-G-E-conv-96 -0.5231 -0.1750 0.1731
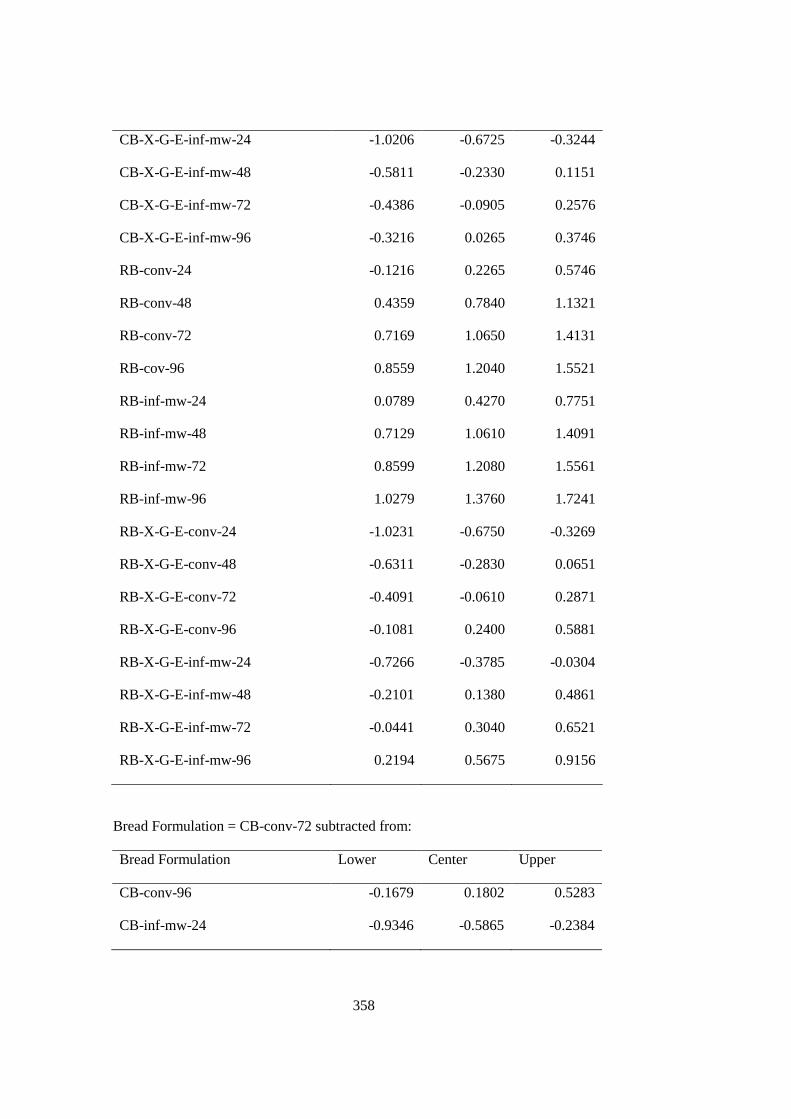
358
CB-X-G-E-inf-mw-24 -1.0206 -0.6725 -0.3244
CB-X-G-E-inf-mw-48 -0.5811 -0.2330 0.1151
CB-X-G-E-inf-mw-72 -0.4386 -0.0905 0.2576
CB-X-G-E-inf-mw-96 -0.3216 0.0265 0.3746
RB-conv-24 -0.1216 0.2265 0.5746
RB-conv-48 0.4359 0.7840 1.1321
RB-conv-72 0.7169 1.0650 1.4131
RB-cov-96 0.8559 1.2040 1.5521
RB-inf-mw-24 0.0789 0.4270 0.7751
RB-inf-mw-48 0.7129 1.0610 1.4091
RB-inf-mw-72 0.8599 1.2080 1.5561
RB-inf-mw-96 1.0279 1.3760 1.7241
RB-X-G-E-conv-24 -1.0231 -0.6750 -0.3269
RB-X-G-E-conv-48 -0.6311 -0.2830 0.0651
RB-X-G-E-conv-72 -0.4091 -0.0610 0.2871
RB-X-G-E-conv-96 -0.1081 0.2400 0.5881
RB-X-G-E-inf-mw-24 -0.7266 -0.3785 -0.0304
RB-X-G-E-inf-mw-48 -0.2101 0.1380 0.4861
RB-X-G-E-inf-mw-72 -0.0441 0.3040 0.6521
RB-X-G-E-inf-mw-96 0.2194 0.5675 0.9156
Bread Formulation = CB-conv-72 subtracted from:
Bread Formulation Lower Center Upper
CB-conv-96 -0.1679 0.1802 0.5283
CB-inf-mw-24 -0.9346 -0.5865 -0.2384
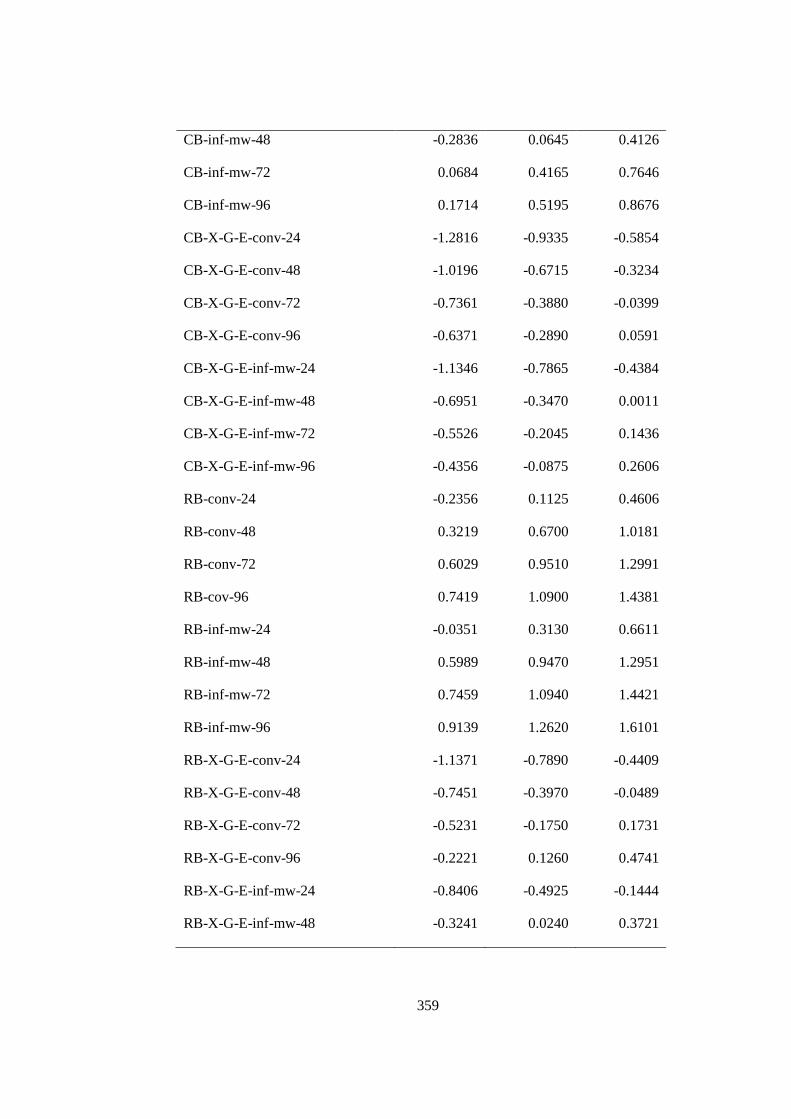
359
CB-inf-mw-48 -0.2836 0.0645 0.4126
CB-inf-mw-72 0.0684 0.4165 0.7646
CB-inf-mw-96 0.1714 0.5195 0.8676
CB-X-G-E-conv-24 -1.2816 -0.9335 -0.5854
CB-X-G-E-conv-48 -1.0196 -0.6715 -0.3234
CB-X-G-E-conv-72 -0.7361 -0.3880 -0.0399
CB-X-G-E-conv-96 -0.6371 -0.2890 0.0591
CB-X-G-E-inf-mw-24 -1.1346 -0.7865 -0.4384
CB-X-G-E-inf-mw-48 -0.6951 -0.3470 0.0011
CB-X-G-E-inf-mw-72 -0.5526 -0.2045 0.1436
CB-X-G-E-inf-mw-96 -0.4356 -0.0875 0.2606
RB-conv-24 -0.2356 0.1125 0.4606
RB-conv-48 0.3219 0.6700 1.0181
RB-conv-72 0.6029 0.9510 1.2991
RB-cov-96 0.7419 1.0900 1.4381
RB-inf-mw-24 -0.0351 0.3130 0.6611
RB-inf-mw-48 0.5989 0.9470 1.2951
RB-inf-mw-72 0.7459 1.0940 1.4421
RB-inf-mw-96 0.9139 1.2620 1.6101
RB-X-G-E-conv-24 -1.1371 -0.7890 -0.4409
RB-X-G-E-conv-48 -0.7451 -0.3970 -0.0489
RB-X-G-E-conv-72 -0.5231 -0.1750 0.1731
RB-X-G-E-conv-96 -0.2221 0.1260 0.4741
RB-X-G-E-inf-mw-24 -0.8406 -0.4925 -0.1444
RB-X-G-E-inf-mw-48 -0.3241 0.0240 0.3721
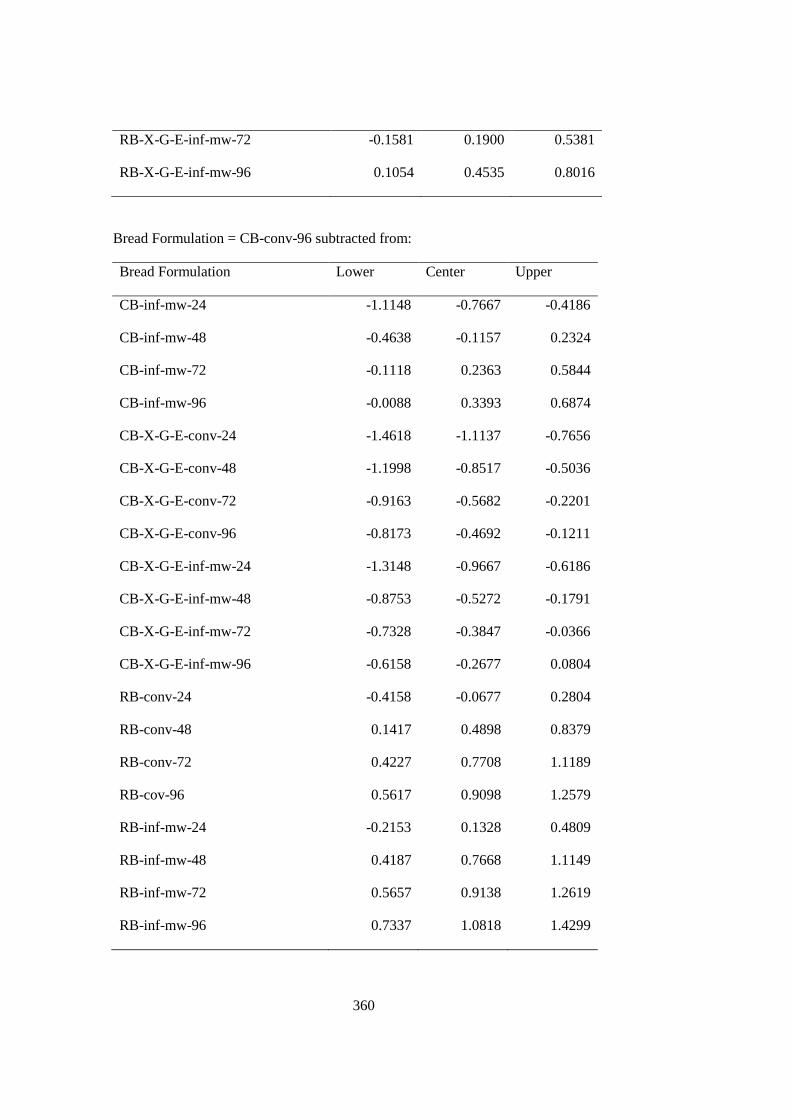
360
RB-X-G-E-inf-mw-72 -0.1581 0.1900 0.5381
RB-X-G-E-inf-mw-96 0.1054 0.4535 0.8016
Bread Formulation = CB-conv-96 subtracted from:
Bread Formulation Lower Center Upper
CB-inf-mw-24 -1.1148 -0.7667 -0.4186
CB-inf-mw-48 -0.4638 -0.1157 0.2324
CB-inf-mw-72 -0.1118 0.2363 0.5844
CB-inf-mw-96 -0.0088 0.3393 0.6874
CB-X-G-E-conv-24 -1.4618 -1.1137 -0.7656
CB-X-G-E-conv-48 -1.1998 -0.8517 -0.5036
CB-X-G-E-conv-72 -0.9163 -0.5682 -0.2201
CB-X-G-E-conv-96 -0.8173 -0.4692 -0.1211
CB-X-G-E-inf-mw-24 -1.3148 -0.9667 -0.6186
CB-X-G-E-inf-mw-48 -0.8753 -0.5272 -0.1791
CB-X-G-E-inf-mw-72 -0.7328 -0.3847 -0.0366
CB-X-G-E-inf-mw-96 -0.6158 -0.2677 0.0804
RB-conv-24 -0.4158 -0.0677 0.2804
RB-conv-48 0.1417 0.4898 0.8379
RB-conv-72 0.4227 0.7708 1.1189
RB-cov-96 0.5617 0.9098 1.2579
RB-inf-mw-24 -0.2153 0.1328 0.4809
RB-inf-mw-48 0.4187 0.7668 1.1149
RB-inf-mw-72 0.5657 0.9138 1.2619
RB-inf-mw-96 0.7337 1.0818 1.4299
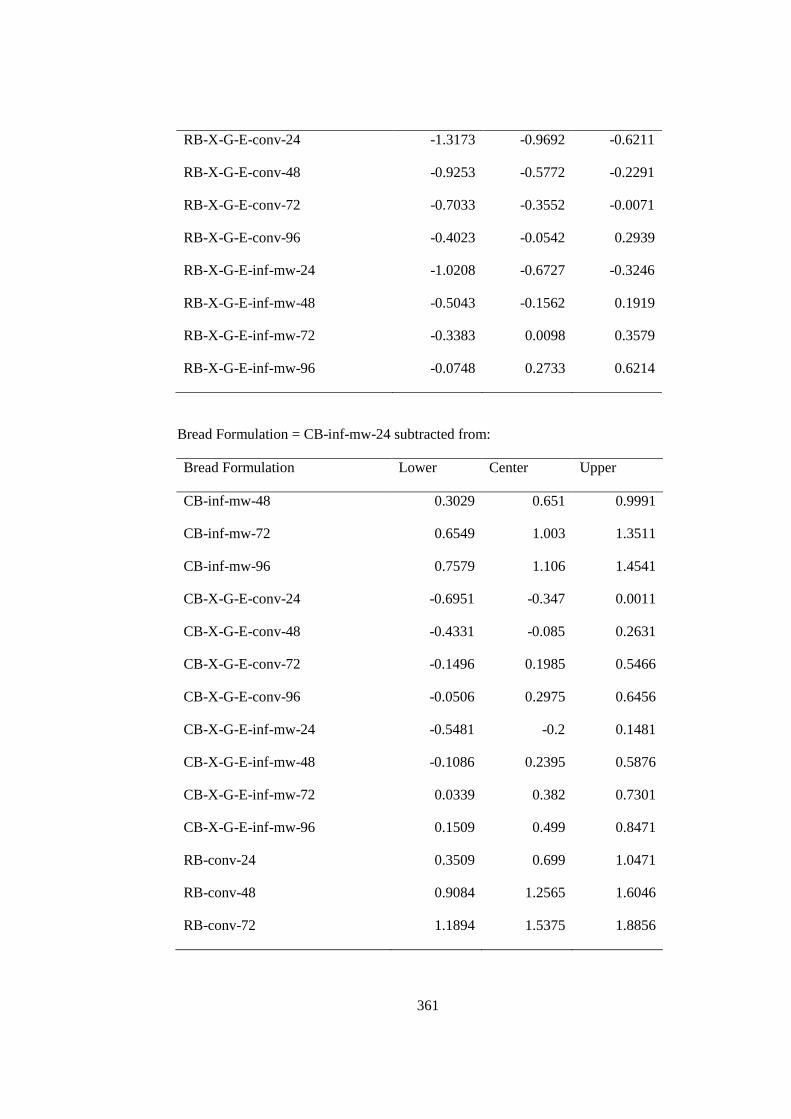
361
RB-X-G-E-conv-24 -1.3173 -0.9692 -0.6211
RB-X-G-E-conv-48 -0.9253 -0.5772 -0.2291
RB-X-G-E-conv-72 -0.7033 -0.3552 -0.0071
RB-X-G-E-conv-96 -0.4023 -0.0542 0.2939
RB-X-G-E-inf-mw-24 -1.0208 -0.6727 -0.3246
RB-X-G-E-inf-mw-48 -0.5043 -0.1562 0.1919
RB-X-G-E-inf-mw-72 -0.3383 0.0098 0.3579
RB-X-G-E-inf-mw-96 -0.0748 0.2733 0.6214
Bread Formulation = CB-inf-mw-24 subtracted from:
Bread Formulation Lower Center Upper
CB-inf-mw-48 0.3029 0.651 0.9991
CB-inf-mw-72 0.6549 1.003 1.3511
CB-inf-mw-96 0.7579 1.106 1.4541
CB-X-G-E-conv-24 -0.6951 -0.347 0.0011
CB-X-G-E-conv-48 -0.4331 -0.085 0.2631
CB-X-G-E-conv-72 -0.1496 0.1985 0.5466
CB-X-G-E-conv-96 -0.0506 0.2975 0.6456
CB-X-G-E-inf-mw-24 -0.5481 -0.2 0.1481
CB-X-G-E-inf-mw-48 -0.1086 0.2395 0.5876
CB-X-G-E-inf-mw-72 0.0339 0.382 0.7301
CB-X-G-E-inf-mw-96 0.1509 0.499 0.8471
RB-conv-24 0.3509 0.699 1.0471
RB-conv-48 0.9084 1.2565 1.6046
RB-conv-72 1.1894 1.5375 1.8856
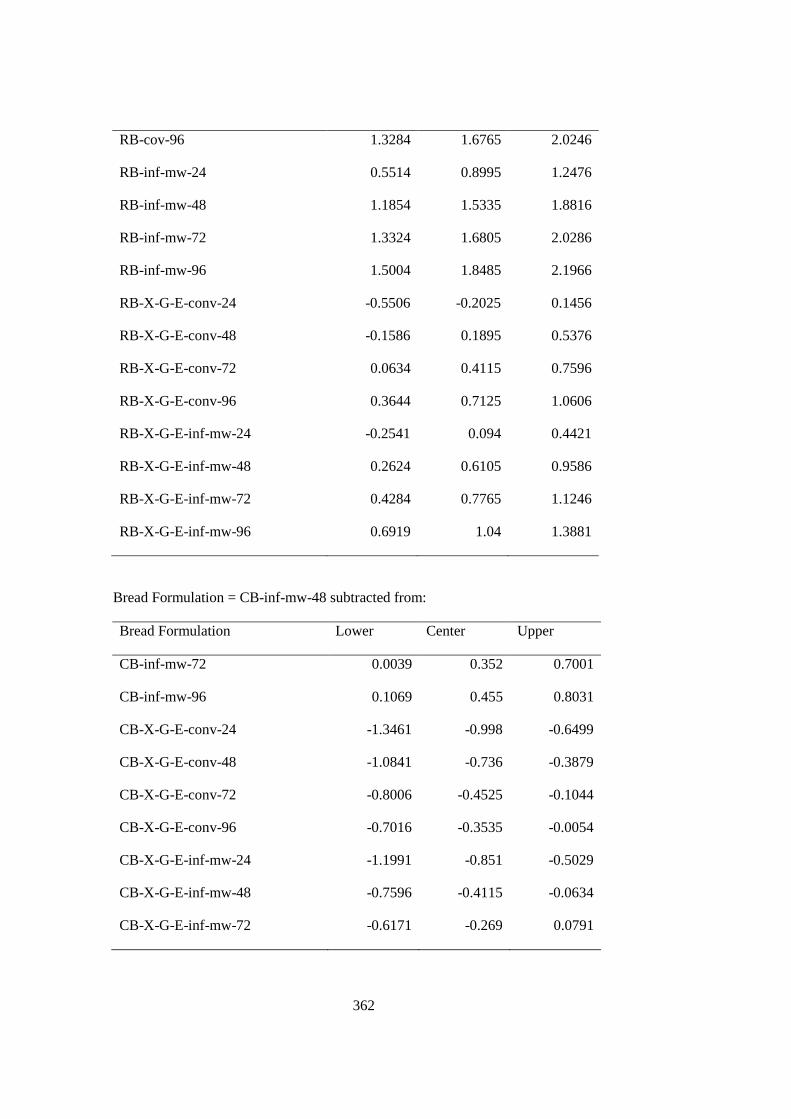
362
RB-cov-96 1.3284 1.6765 2.0246
RB-inf-mw-24 0.5514 0.8995 1.2476
RB-inf-mw-48 1.1854 1.5335 1.8816
RB-inf-mw-72 1.3324 1.6805 2.0286
RB-inf-mw-96 1.5004 1.8485 2.1966
RB-X-G-E-conv-24 -0.5506 -0.2025 0.1456
RB-X-G-E-conv-48 -0.1586 0.1895 0.5376
RB-X-G-E-conv-72 0.0634 0.4115 0.7596
RB-X-G-E-conv-96 0.3644 0.7125 1.0606
RB-X-G-E-inf-mw-24 -0.2541 0.094 0.4421
RB-X-G-E-inf-mw-48 0.2624 0.6105 0.9586
RB-X-G-E-inf-mw-72 0.4284 0.7765 1.1246
RB-X-G-E-inf-mw-96 0.6919 1.04 1.3881
Bread Formulation = CB-inf-mw-48 subtracted from:
Bread Formulation Lower Center Upper
CB-inf-mw-72 0.0039 0.352 0.7001
CB-inf-mw-96 0.1069 0.455 0.8031
CB-X-G-E-conv-24 -1.3461 -0.998 -0.6499
CB-X-G-E-conv-48 -1.0841 -0.736 -0.3879
CB-X-G-E-conv-72 -0.8006 -0.4525 -0.1044
CB-X-G-E-conv-96 -0.7016 -0.3535 -0.0054
CB-X-G-E-inf-mw-24 -1.1991 -0.851 -0.5029
CB-X-G-E-inf-mw-48 -0.7596 -0.4115 -0.0634
CB-X-G-E-inf-mw-72 -0.6171 -0.269 0.0791
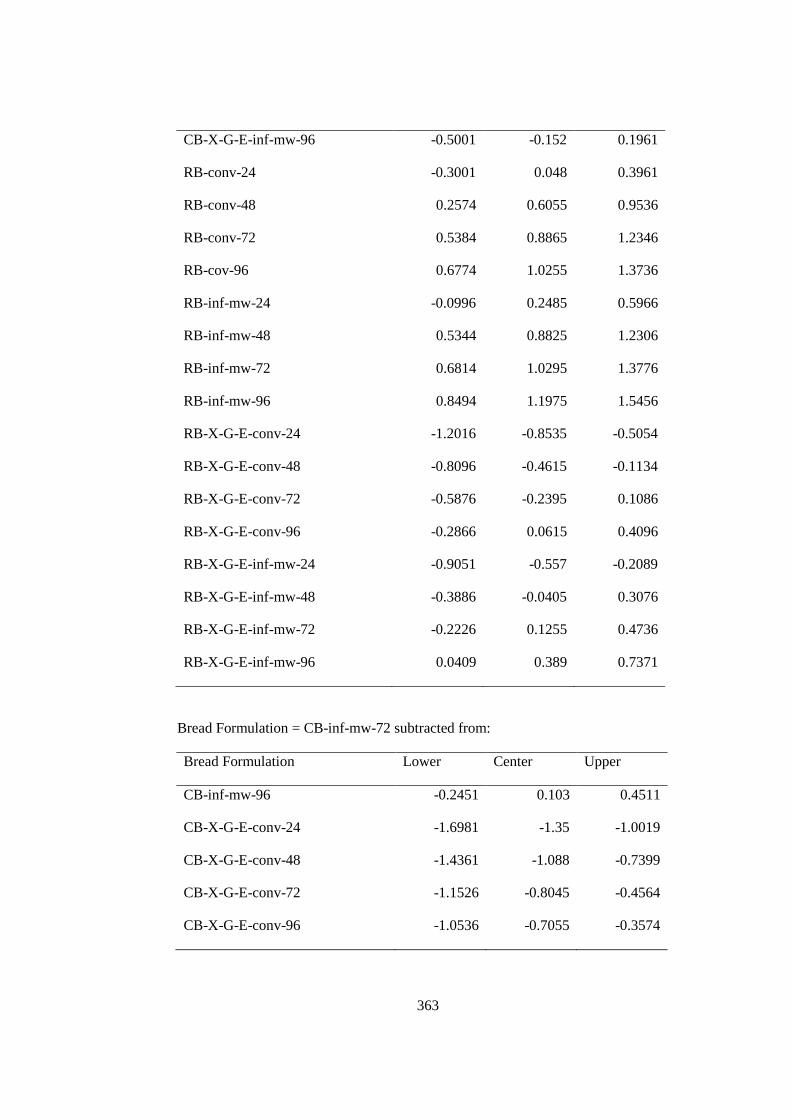
363
CB-X-G-E-inf-mw-96 -0.5001 -0.152 0.1961
RB-conv-24 -0.3001 0.048 0.3961
RB-conv-48 0.2574 0.6055 0.9536
RB-conv-72 0.5384 0.8865 1.2346
RB-cov-96 0.6774 1.0255 1.3736
RB-inf-mw-24 -0.0996 0.2485 0.5966
RB-inf-mw-48 0.5344 0.8825 1.2306
RB-inf-mw-72 0.6814 1.0295 1.3776
RB-inf-mw-96 0.8494 1.1975 1.5456
RB-X-G-E-conv-24 -1.2016 -0.8535 -0.5054
RB-X-G-E-conv-48 -0.8096 -0.4615 -0.1134
RB-X-G-E-conv-72 -0.5876 -0.2395 0.1086
RB-X-G-E-conv-96 -0.2866 0.0615 0.4096
RB-X-G-E-inf-mw-24 -0.9051 -0.557 -0.2089
RB-X-G-E-inf-mw-48 -0.3886 -0.0405 0.3076
RB-X-G-E-inf-mw-72 -0.2226 0.1255 0.4736
RB-X-G-E-inf-mw-96 0.0409 0.389 0.7371
Bread Formulation = CB-inf-mw-72 subtracted from:
Bread Formulation Lower Center Upper
CB-inf-mw-96 -0.2451 0.103 0.4511
CB-X-G-E-conv-24 -1.6981 -1.35 -1.0019
CB-X-G-E-conv-48 -1.4361 -1.088 -0.7399
CB-X-G-E-conv-72 -1.1526 -0.8045 -0.4564
CB-X-G-E-conv-96 -1.0536 -0.7055 -0.3574
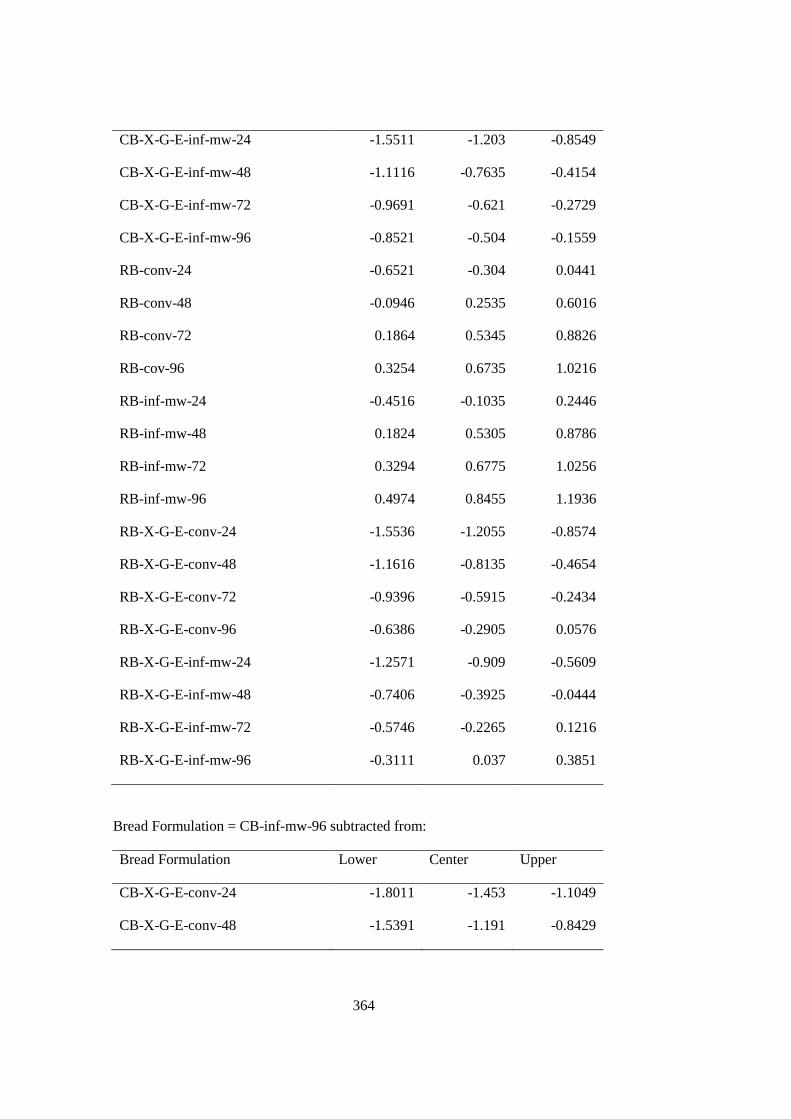
364
CB-X-G-E-inf-mw-24 -1.5511 -1.203 -0.8549
CB-X-G-E-inf-mw-48 -1.1116 -0.7635 -0.4154
CB-X-G-E-inf-mw-72 -0.9691 -0.621 -0.2729
CB-X-G-E-inf-mw-96 -0.8521 -0.504 -0.1559
RB-conv-24 -0.6521 -0.304 0.0441
RB-conv-48 -0.0946 0.2535 0.6016
RB-conv-72 0.1864 0.5345 0.8826
RB-cov-96 0.3254 0.6735 1.0216
RB-inf-mw-24 -0.4516 -0.1035 0.2446
RB-inf-mw-48 0.1824 0.5305 0.8786
RB-inf-mw-72 0.3294 0.6775 1.0256
RB-inf-mw-96 0.4974 0.8455 1.1936
RB-X-G-E-conv-24 -1.5536 -1.2055 -0.8574
RB-X-G-E-conv-48 -1.1616 -0.8135 -0.4654
RB-X-G-E-conv-72 -0.9396 -0.5915 -0.2434
RB-X-G-E-conv-96 -0.6386 -0.2905 0.0576
RB-X-G-E-inf-mw-24 -1.2571 -0.909 -0.5609
RB-X-G-E-inf-mw-48 -0.7406 -0.3925 -0.0444
RB-X-G-E-inf-mw-72 -0.5746 -0.2265 0.1216
RB-X-G-E-inf-mw-96 -0.3111 0.037 0.3851
Bread Formulation = CB-inf-mw-96 subtracted from:
Bread Formulation Lower Center Upper
CB-X-G-E-conv-24 -1.8011 -1.453 -1.1049
CB-X-G-E-conv-48 -1.5391 -1.191 -0.8429
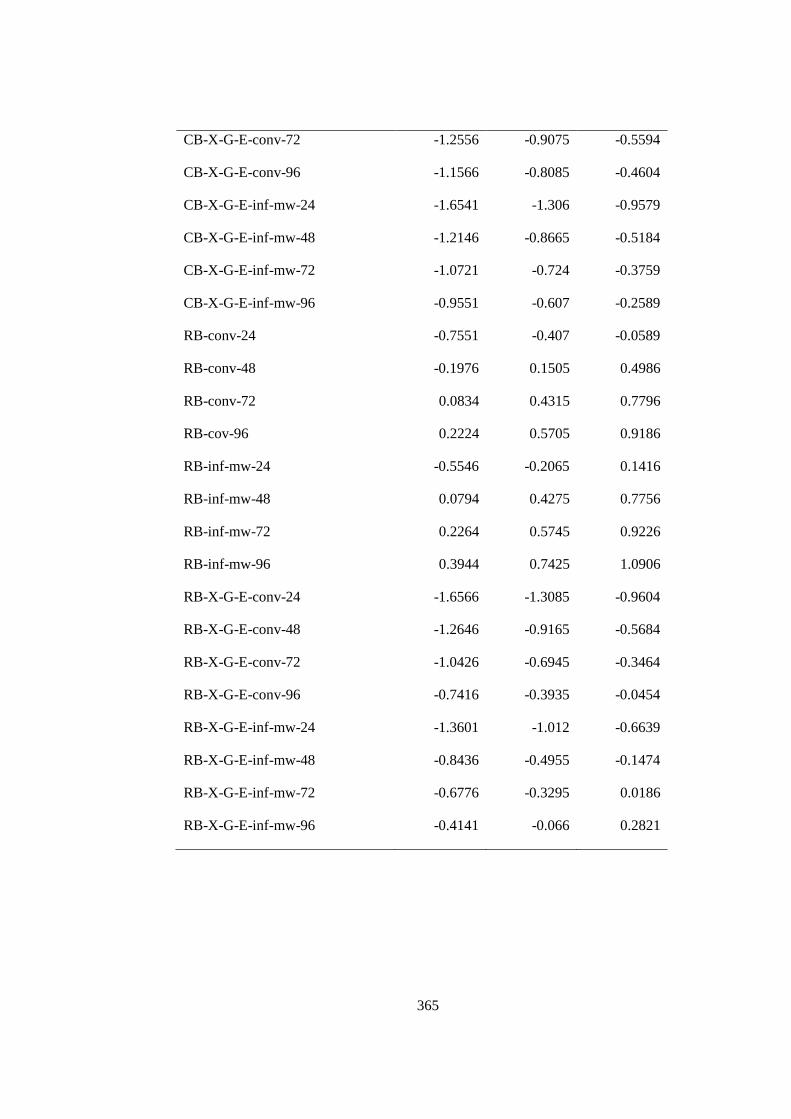
365
CB-X-G-E-conv-72 -1.2556 -0.9075 -0.5594
CB-X-G-E-conv-96 -1.1566 -0.8085 -0.4604
CB-X-G-E-inf-mw-24 -1.6541 -1.306 -0.9579
CB-X-G-E-inf-mw-48 -1.2146 -0.8665 -0.5184
CB-X-G-E-inf-mw-72 -1.0721 -0.724 -0.3759
CB-X-G-E-inf-mw-96 -0.9551 -0.607 -0.2589
RB-conv-24 -0.7551 -0.407 -0.0589
RB-conv-48 -0.1976 0.1505 0.4986
RB-conv-72 0.0834 0.4315 0.7796
RB-cov-96 0.2224 0.5705 0.9186
RB-inf-mw-24 -0.5546 -0.2065 0.1416
RB-inf-mw-48 0.0794 0.4275 0.7756
RB-inf-mw-72 0.2264 0.5745 0.9226
RB-inf-mw-96 0.3944 0.7425 1.0906
RB-X-G-E-conv-24 -1.6566 -1.3085 -0.9604
RB-X-G-E-conv-48 -1.2646 -0.9165 -0.5684
RB-X-G-E-conv-72 -1.0426 -0.6945 -0.3464
RB-X-G-E-conv-96 -0.7416 -0.3935 -0.0454
RB-X-G-E-inf-mw-24 -1.3601 -1.012 -0.6639
RB-X-G-E-inf-mw-48 -0.8436 -0.4955 -0.1474
RB-X-G-E-inf-mw-72 -0.6776 -0.3295 0.0186
RB-X-G-E-inf-mw-96 -0.4141 -0.066 0.2821
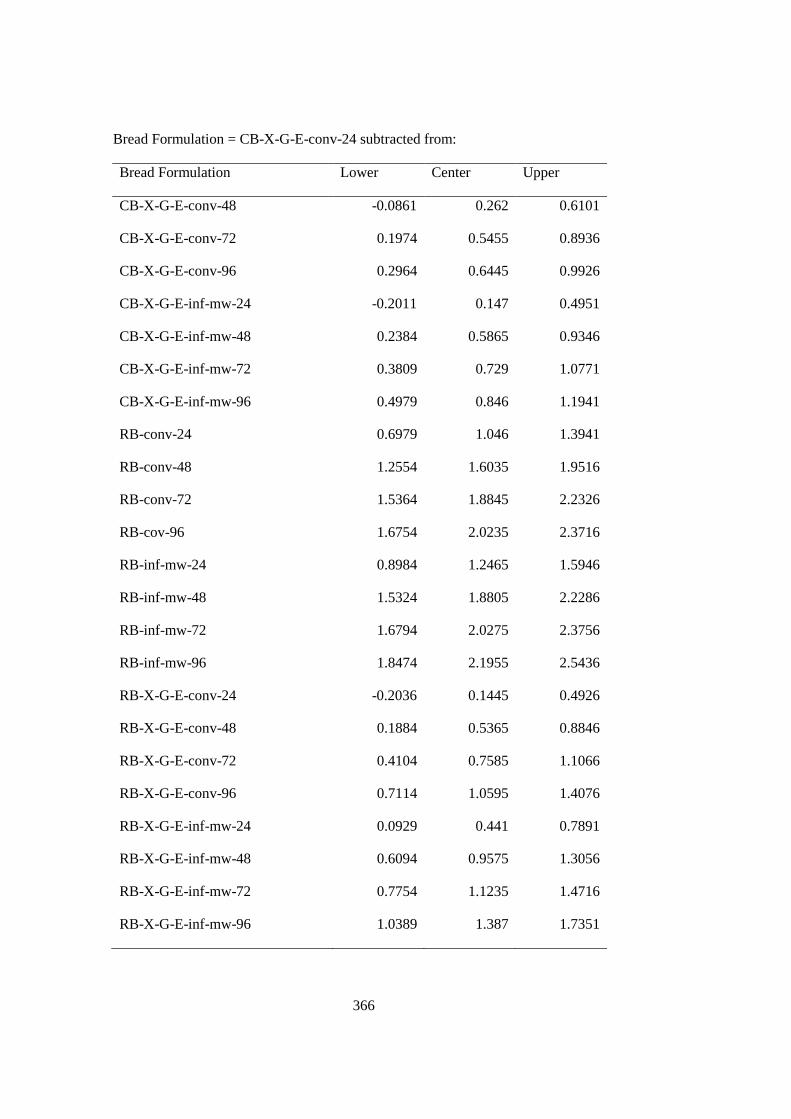
366
Bread Formulation = CB-X-G-E-conv-24 subtracted from:
Bread Formulation Lower Center Upper
CB-X-G-E-conv-48 -0.0861 0.262 0.6101
CB-X-G-E-conv-72 0.1974 0.5455 0.8936
CB-X-G-E-conv-96 0.2964 0.6445 0.9926
CB-X-G-E-inf-mw-24 -0.2011 0.147 0.4951
CB-X-G-E-inf-mw-48 0.2384 0.5865 0.9346
CB-X-G-E-inf-mw-72 0.3809 0.729 1.0771
CB-X-G-E-inf-mw-96 0.4979 0.846 1.1941
RB-conv-24 0.6979 1.046 1.3941
RB-conv-48 1.2554 1.6035 1.9516
RB-conv-72 1.5364 1.8845 2.2326
RB-cov-96 1.6754 2.0235 2.3716
RB-inf-mw-24 0.8984 1.2465 1.5946
RB-inf-mw-48 1.5324 1.8805 2.2286
RB-inf-mw-72 1.6794 2.0275 2.3756
RB-inf-mw-96 1.8474 2.1955 2.5436
RB-X-G-E-conv-24 -0.2036 0.1445 0.4926
RB-X-G-E-conv-48 0.1884 0.5365 0.8846
RB-X-G-E-conv-72 0.4104 0.7585 1.1066
RB-X-G-E-conv-96 0.7114 1.0595 1.4076
RB-X-G-E-inf-mw-24 0.0929 0.441 0.7891
RB-X-G-E-inf-mw-48 0.6094 0.9575 1.3056
RB-X-G-E-inf-mw-72 0.7754 1.1235 1.4716
RB-X-G-E-inf-mw-96 1.0389 1.387 1.7351
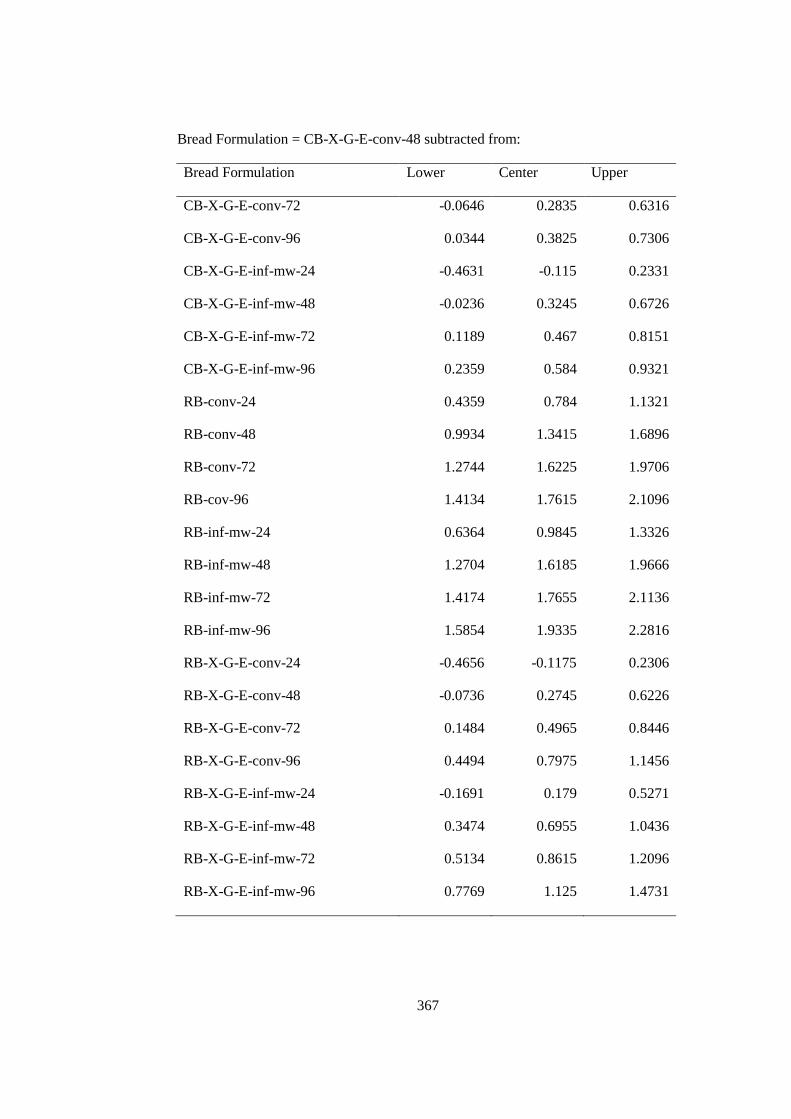
367
Bread Formulation = CB-X-G-E-conv-48 subtracted from:
Bread Formulation Lower Center Upper
CB-X-G-E-conv-72 -0.0646 0.2835 0.6316
CB-X-G-E-conv-96 0.0344 0.3825 0.7306
CB-X-G-E-inf-mw-24 -0.4631 -0.115 0.2331
CB-X-G-E-inf-mw-48 -0.0236 0.3245 0.6726
CB-X-G-E-inf-mw-72 0.1189 0.467 0.8151
CB-X-G-E-inf-mw-96 0.2359 0.584 0.9321
RB-conv-24 0.4359 0.784 1.1321
RB-conv-48 0.9934 1.3415 1.6896
RB-conv-72 1.2744 1.6225 1.9706
RB-cov-96 1.4134 1.7615 2.1096
RB-inf-mw-24 0.6364 0.9845 1.3326
RB-inf-mw-48 1.2704 1.6185 1.9666
RB-inf-mw-72 1.4174 1.7655 2.1136
RB-inf-mw-96 1.5854 1.9335 2.2816
RB-X-G-E-conv-24 -0.4656 -0.1175 0.2306
RB-X-G-E-conv-48 -0.0736 0.2745 0.6226
RB-X-G-E-conv-72 0.1484 0.4965 0.8446
RB-X-G-E-conv-96 0.4494 0.7975 1.1456
RB-X-G-E-inf-mw-24 -0.1691 0.179 0.5271
RB-X-G-E-inf-mw-48 0.3474 0.6955 1.0436
RB-X-G-E-inf-mw-72 0.5134 0.8615 1.2096
RB-X-G-E-inf-mw-96 0.7769 1.125 1.4731
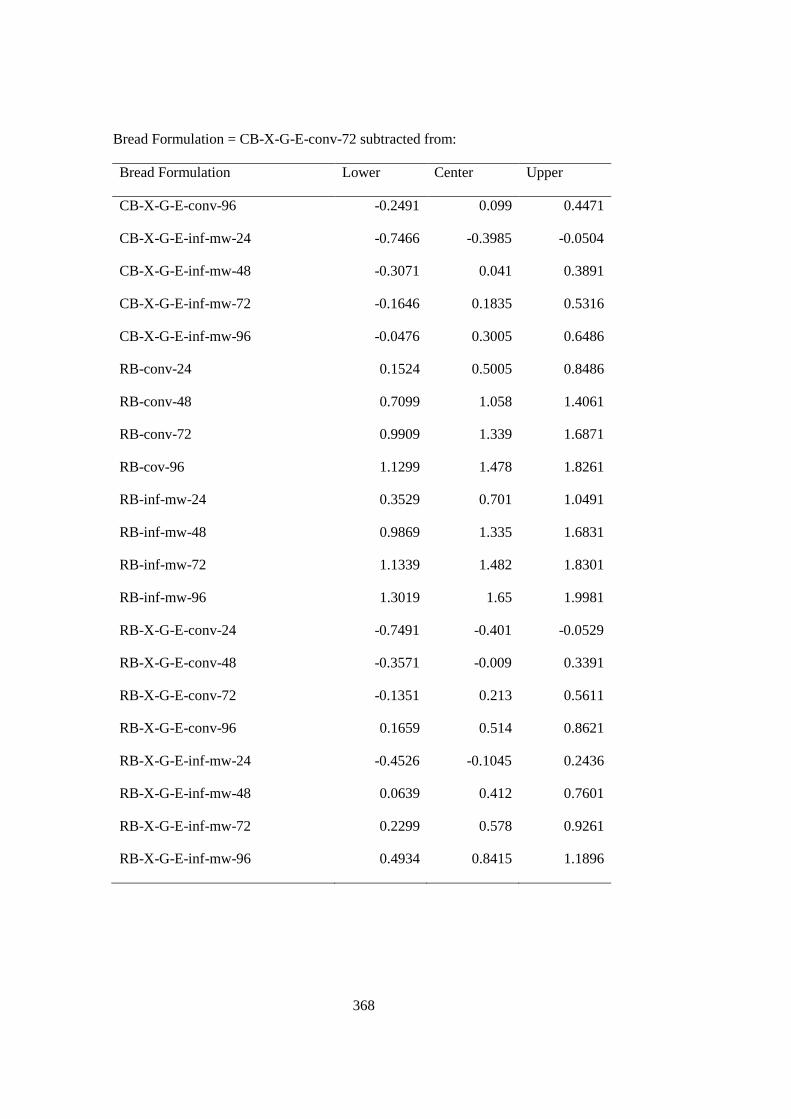
368
Bread Formulation = CB-X-G-E-conv-72 subtracted from:
Bread Formulation Lower Center Upper
CB-X-G-E-conv-96 -0.2491 0.099 0.4471
CB-X-G-E-inf-mw-24 -0.7466 -0.3985 -0.0504
CB-X-G-E-inf-mw-48 -0.3071 0.041 0.3891
CB-X-G-E-inf-mw-72 -0.1646 0.1835 0.5316
CB-X-G-E-inf-mw-96 -0.0476 0.3005 0.6486
RB-conv-24 0.1524 0.5005 0.8486
RB-conv-48 0.7099 1.058 1.4061
RB-conv-72 0.9909 1.339 1.6871
RB-cov-96 1.1299 1.478 1.8261
RB-inf-mw-24 0.3529 0.701 1.0491
RB-inf-mw-48 0.9869 1.335 1.6831
RB-inf-mw-72 1.1339 1.482 1.8301
RB-inf-mw-96 1.3019 1.65 1.9981
RB-X-G-E-conv-24 -0.7491 -0.401 -0.0529
RB-X-G-E-conv-48 -0.3571 -0.009 0.3391
RB-X-G-E-conv-72 -0.1351 0.213 0.5611
RB-X-G-E-conv-96 0.1659 0.514 0.8621
RB-X-G-E-inf-mw-24 -0.4526 -0.1045 0.2436
RB-X-G-E-inf-mw-48 0.0639 0.412 0.7601
RB-X-G-E-inf-mw-72 0.2299 0.578 0.9261
RB-X-G-E-inf-mw-96 0.4934 0.8415 1.1896
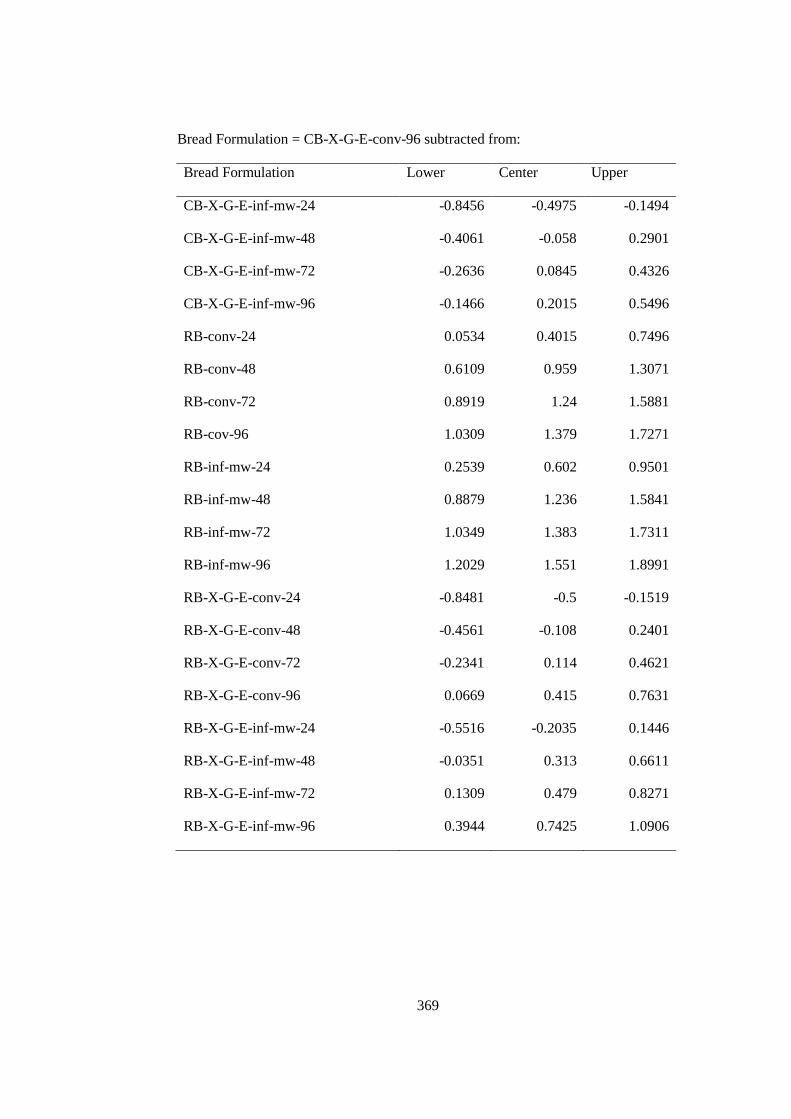
369
Bread Formulation = CB-X-G-E-conv-96 subtracted from:
Bread Formulation Lower Center Upper
CB-X-G-E-inf-mw-24 -0.8456 -0.4975 -0.1494
CB-X-G-E-inf-mw-48 -0.4061 -0.058 0.2901
CB-X-G-E-inf-mw-72 -0.2636 0.0845 0.4326
CB-X-G-E-inf-mw-96 -0.1466 0.2015 0.5496
RB-conv-24 0.0534 0.4015 0.7496
RB-conv-48 0.6109 0.959 1.3071
RB-conv-72 0.8919 1.24 1.5881
RB-cov-96 1.0309 1.379 1.7271
RB-inf-mw-24 0.2539 0.602 0.9501
RB-inf-mw-48 0.8879 1.236 1.5841
RB-inf-mw-72 1.0349 1.383 1.7311
RB-inf-mw-96 1.2029 1.551 1.8991
RB-X-G-E-conv-24 -0.8481 -0.5 -0.1519
RB-X-G-E-conv-48 -0.4561 -0.108 0.2401
RB-X-G-E-conv-72 -0.2341 0.114 0.4621
RB-X-G-E-conv-96 0.0669 0.415 0.7631
RB-X-G-E-inf-mw-24 -0.5516 -0.2035 0.1446
RB-X-G-E-inf-mw-48 -0.0351 0.313 0.6611
RB-X-G-E-inf-mw-72 0.1309 0.479 0.8271
RB-X-G-E-inf-mw-96 0.3944 0.7425 1.0906
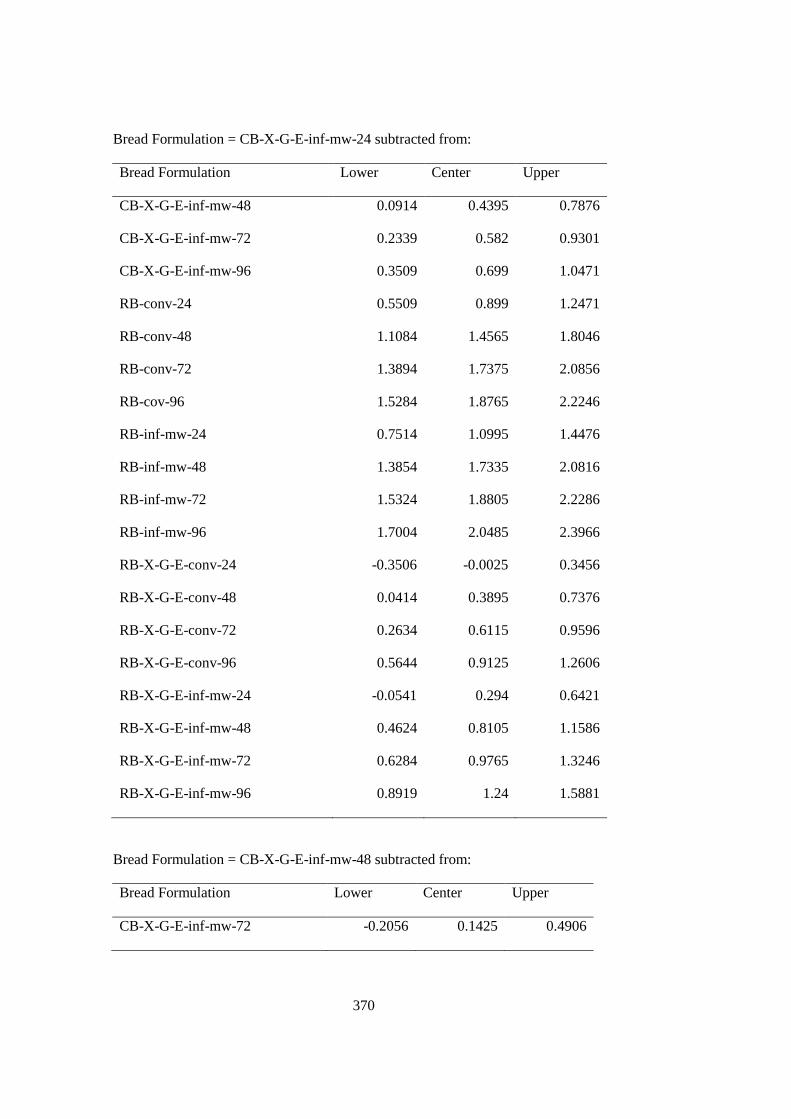
370
Bread Formulation = CB-X-G-E-inf-mw-24 subtracted from:
Bread Formulation Lower Center Upper
CB-X-G-E-inf-mw-48 0.0914 0.4395 0.7876
CB-X-G-E-inf-mw-72 0.2339 0.582 0.9301
CB-X-G-E-inf-mw-96 0.3509 0.699 1.0471
RB-conv-24 0.5509 0.899 1.2471
RB-conv-48 1.1084 1.4565 1.8046
RB-conv-72 1.3894 1.7375 2.0856
RB-cov-96 1.5284 1.8765 2.2246
RB-inf-mw-24 0.7514 1.0995 1.4476
RB-inf-mw-48 1.3854 1.7335 2.0816
RB-inf-mw-72 1.5324 1.8805 2.2286
RB-inf-mw-96 1.7004 2.0485 2.3966
RB-X-G-E-conv-24 -0.3506 -0.0025 0.3456
RB-X-G-E-conv-48 0.0414 0.3895 0.7376
RB-X-G-E-conv-72 0.2634 0.6115 0.9596
RB-X-G-E-conv-96 0.5644 0.9125 1.2606
RB-X-G-E-inf-mw-24 -0.0541 0.294 0.6421
RB-X-G-E-inf-mw-48 0.4624 0.8105 1.1586
RB-X-G-E-inf-mw-72 0.6284 0.9765 1.3246
RB-X-G-E-inf-mw-96 0.8919 1.24 1.5881
Bread Formulation = CB-X-G-E-inf-mw-48 subtracted from:
Bread Formulation Lower Center Upper
CB-X-G-E-inf-mw-72 -0.2056 0.1425 0.4906
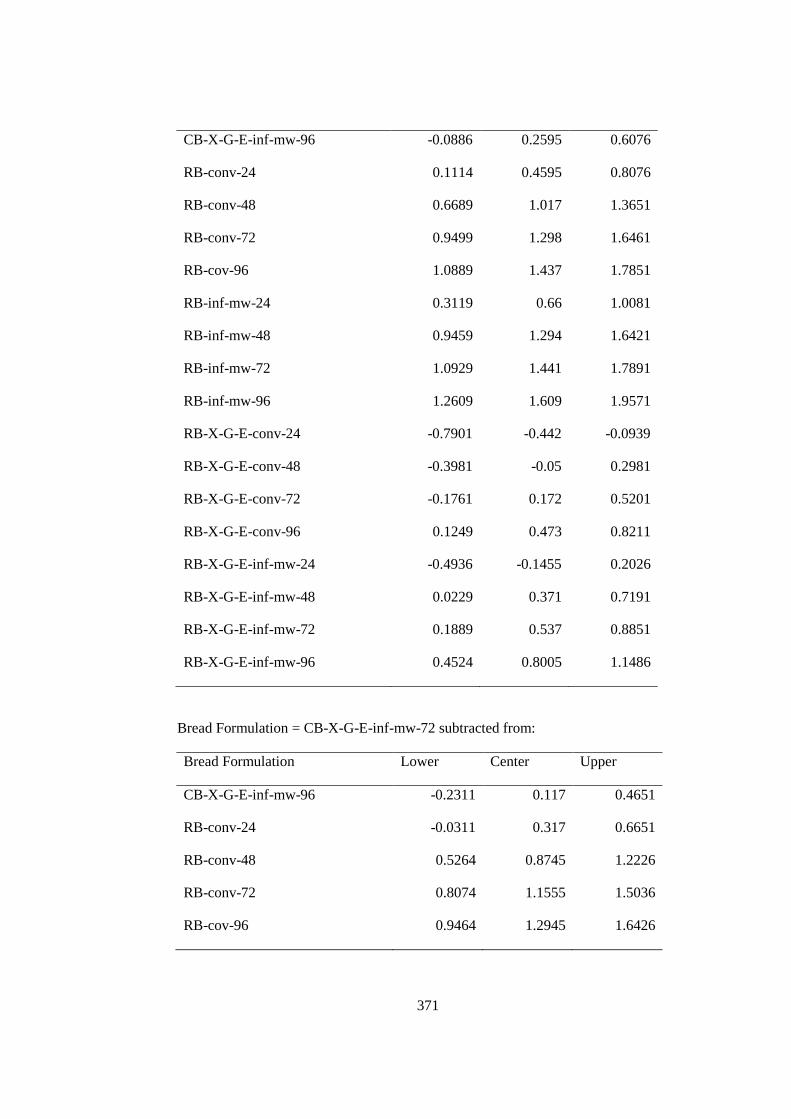
371
CB-X-G-E-inf-mw-96 -0.0886 0.2595 0.6076
RB-conv-24 0.1114 0.4595 0.8076
RB-conv-48 0.6689 1.017 1.3651
RB-conv-72 0.9499 1.298 1.6461
RB-cov-96 1.0889 1.437 1.7851
RB-inf-mw-24 0.3119 0.66 1.0081
RB-inf-mw-48 0.9459 1.294 1.6421
RB-inf-mw-72 1.0929 1.441 1.7891
RB-inf-mw-96 1.2609 1.609 1.9571
RB-X-G-E-conv-24 -0.7901 -0.442 -0.0939
RB-X-G-E-conv-48 -0.3981 -0.05 0.2981
RB-X-G-E-conv-72 -0.1761 0.172 0.5201
RB-X-G-E-conv-96 0.1249 0.473 0.8211
RB-X-G-E-inf-mw-24 -0.4936 -0.1455 0.2026
RB-X-G-E-inf-mw-48 0.0229 0.371 0.7191
RB-X-G-E-inf-mw-72 0.1889 0.537 0.8851
RB-X-G-E-inf-mw-96 0.4524 0.8005 1.1486
Bread Formulation = CB-X-G-E-inf-mw-72 subtracted from:
Bread Formulation Lower Center Upper
CB-X-G-E-inf-mw-96 -0.2311 0.117 0.4651
RB-conv-24 -0.0311 0.317 0.6651
RB-conv-48 0.5264 0.8745 1.2226
RB-conv-72 0.8074 1.1555 1.5036
RB-cov-96 0.9464 1.2945 1.6426
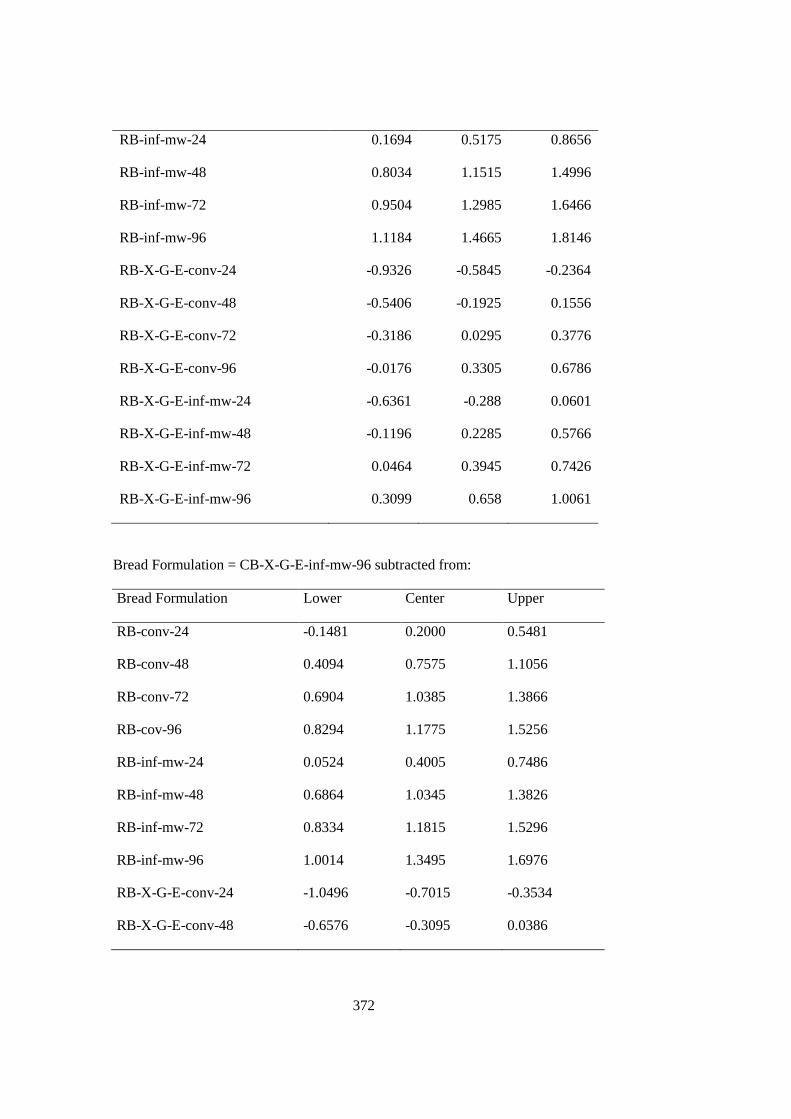
372
RB-inf-mw-24 0.1694 0.5175 0.8656
RB-inf-mw-48 0.8034 1.1515 1.4996
RB-inf-mw-72 0.9504 1.2985 1.6466
RB-inf-mw-96 1.1184 1.4665 1.8146
RB-X-G-E-conv-24 -0.9326 -0.5845 -0.2364
RB-X-G-E-conv-48 -0.5406 -0.1925 0.1556
RB-X-G-E-conv-72 -0.3186 0.0295 0.3776
RB-X-G-E-conv-96 -0.0176 0.3305 0.6786
RB-X-G-E-inf-mw-24 -0.6361 -0.288 0.0601
RB-X-G-E-inf-mw-48 -0.1196 0.2285 0.5766
RB-X-G-E-inf-mw-72 0.0464 0.3945 0.7426
RB-X-G-E-inf-mw-96 0.3099 0.658 1.0061
Bread Formulation = CB-X-G-E-inf-mw-96 subtracted from:
Bread Formulation Lower Center Upper
RB-conv-24 -0.1481 0.2000 0.5481
RB-conv-48 0.4094 0.7575 1.1056
RB-conv-72 0.6904 1.0385 1.3866
RB-cov-96 0.8294 1.1775 1.5256
RB-inf-mw-24 0.0524 0.4005 0.7486
RB-inf-mw-48 0.6864 1.0345 1.3826
RB-inf-mw-72 0.8334 1.1815 1.5296
RB-inf-mw-96 1.0014 1.3495 1.6976
RB-X-G-E-conv-24 -1.0496 -0.7015 -0.3534
RB-X-G-E-conv-48 -0.6576 -0.3095 0.0386
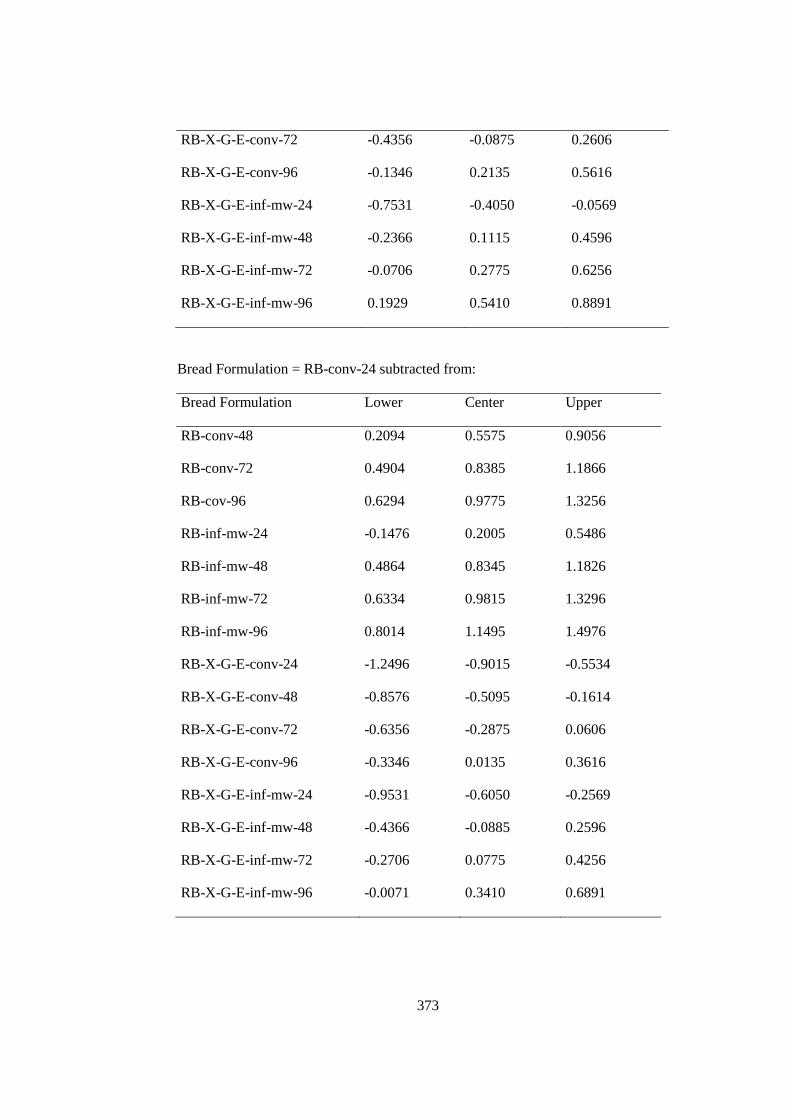
373
RB-X-G-E-conv-72 -0.4356 -0.0875 0.2606
RB-X-G-E-conv-96 -0.1346 0.2135 0.5616
RB-X-G-E-inf-mw-24 -0.7531 -0.4050 -0.0569
RB-X-G-E-inf-mw-48 -0.2366 0.1115 0.4596
RB-X-G-E-inf-mw-72 -0.0706 0.2775 0.6256
RB-X-G-E-inf-mw-96 0.1929 0.5410 0.8891
Bread Formulation = RB-conv-24 subtracted from:
Bread Formulation Lower Center Upper
RB-conv-48 0.2094 0.5575 0.9056
RB-conv-72 0.4904 0.8385 1.1866
RB-cov-96 0.6294 0.9775 1.3256
RB-inf-mw-24 -0.1476 0.2005 0.5486
RB-inf-mw-48 0.4864 0.8345 1.1826
RB-inf-mw-72 0.6334 0.9815 1.3296
RB-inf-mw-96 0.8014 1.1495 1.4976
RB-X-G-E-conv-24 -1.2496 -0.9015 -0.5534
RB-X-G-E-conv-48 -0.8576 -0.5095 -0.1614
RB-X-G-E-conv-72 -0.6356 -0.2875 0.0606
RB-X-G-E-conv-96 -0.3346 0.0135 0.3616
RB-X-G-E-inf-mw-24 -0.9531 -0.6050 -0.2569
RB-X-G-E-inf-mw-48 -0.4366 -0.0885 0.2596
RB-X-G-E-inf-mw-72 -0.2706 0.0775 0.4256
RB-X-G-E-inf-mw-96 -0.0071 0.3410 0.6891
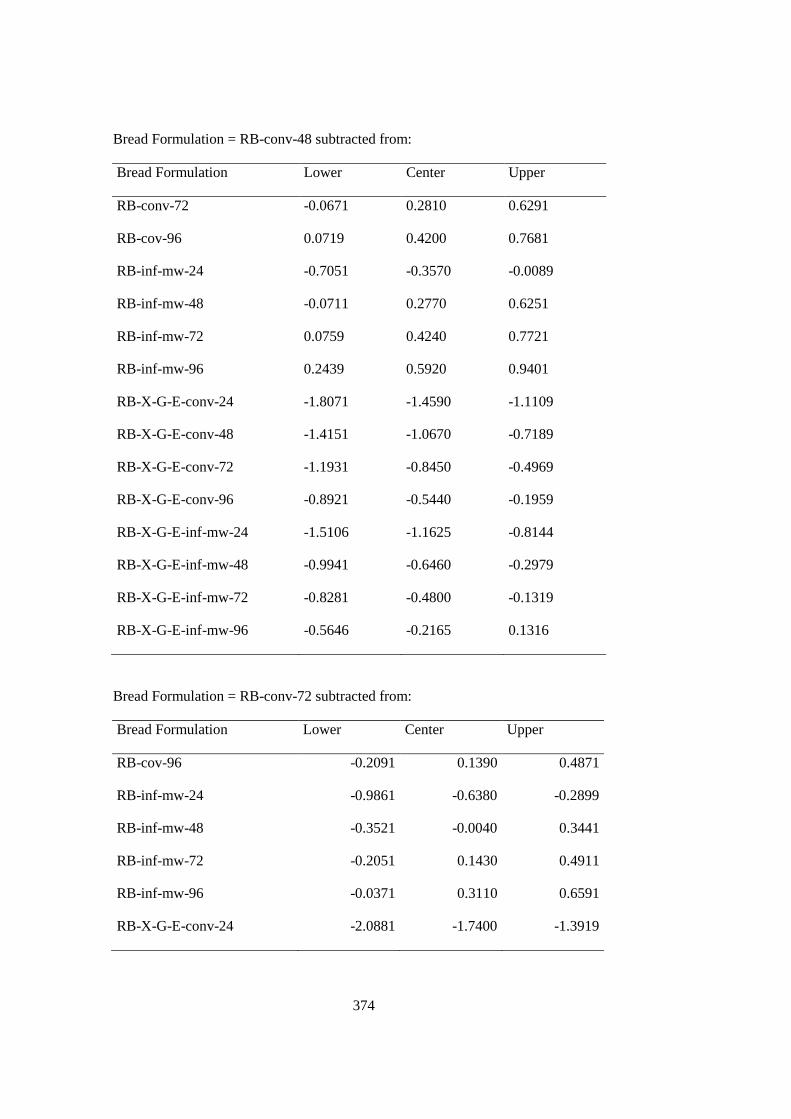
374
Bread Formulation = RB-conv-48 subtracted from:
Bread Formulation Lower Center Upper
RB-conv-72 -0.0671 0.2810 0.6291
RB-cov-96 0.0719 0.4200 0.7681
RB-inf-mw-24 -0.7051 -0.3570 -0.0089
RB-inf-mw-48 -0.0711 0.2770 0.6251
RB-inf-mw-72 0.0759 0.4240 0.7721
RB-inf-mw-96 0.2439 0.5920 0.9401
RB-X-G-E-conv-24 -1.8071 -1.4590 -1.1109
RB-X-G-E-conv-48 -1.4151 -1.0670 -0.7189
RB-X-G-E-conv-72 -1.1931 -0.8450 -0.4969
RB-X-G-E-conv-96 -0.8921 -0.5440 -0.1959
RB-X-G-E-inf-mw-24 -1.5106 -1.1625 -0.8144
RB-X-G-E-inf-mw-48 -0.9941 -0.6460 -0.2979
RB-X-G-E-inf-mw-72 -0.8281 -0.4800 -0.1319
RB-X-G-E-inf-mw-96 -0.5646 -0.2165 0.1316
Bread Formulation = RB-conv-72 subtracted from:
Bread Formulation Lower Center Upper
RB-cov-96 -0.2091 0.1390 0.4871
RB-inf-mw-24 -0.9861 -0.6380 -0.2899
RB-inf-mw-48 -0.3521 -0.0040 0.3441
RB-inf-mw-72 -0.2051 0.1430 0.4911
RB-inf-mw-96 -0.0371 0.3110 0.6591
RB-X-G-E-conv-24 -2.0881 -1.7400 -1.3919
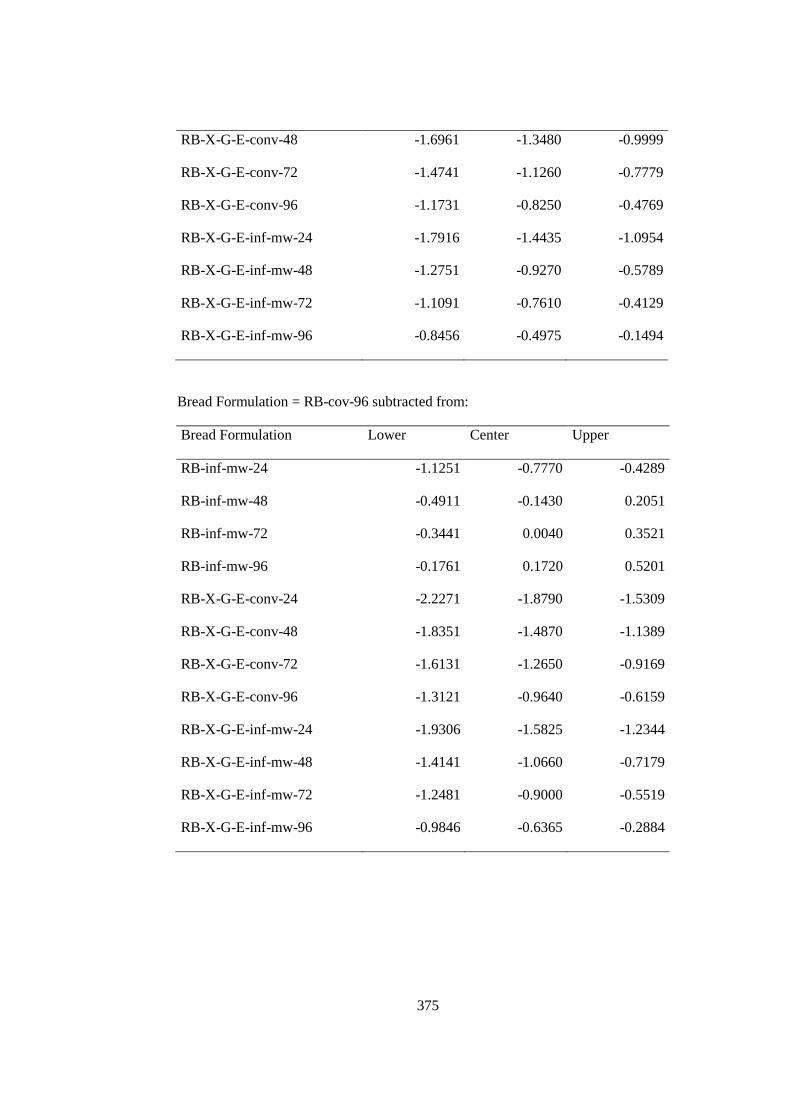
375
RB-X-G-E-conv-48 -1.6961 -1.3480 -0.9999
RB-X-G-E-conv-72 -1.4741 -1.1260 -0.7779
RB-X-G-E-conv-96 -1.1731 -0.8250 -0.4769
RB-X-G-E-inf-mw-24 -1.7916 -1.4435 -1.0954
RB-X-G-E-inf-mw-48 -1.2751 -0.9270 -0.5789
RB-X-G-E-inf-mw-72 -1.1091 -0.7610 -0.4129
RB-X-G-E-inf-mw-96 -0.8456 -0.4975 -0.1494
Bread Formulation = RB-cov-96 subtracted from:
Bread Formulation Lower Center Upper
RB-inf-mw-24 -1.1251 -0.7770 -0.4289
RB-inf-mw-48 -0.4911 -0.1430 0.2051
RB-inf-mw-72 -0.3441 0.0040 0.3521
RB-inf-mw-96 -0.1761 0.1720 0.5201
RB-X-G-E-conv-24 -2.2271 -1.8790 -1.5309
RB-X-G-E-conv-48 -1.8351 -1.4870 -1.1389
RB-X-G-E-conv-72 -1.6131 -1.2650 -0.9169
RB-X-G-E-conv-96 -1.3121 -0.9640 -0.6159
RB-X-G-E-inf-mw-24 -1.9306 -1.5825 -1.2344
RB-X-G-E-inf-mw-48 -1.4141 -1.0660 -0.7179
RB-X-G-E-inf-mw-72 -1.2481 -0.9000 -0.5519
RB-X-G-E-inf-mw-96 -0.9846 -0.6365 -0.2884
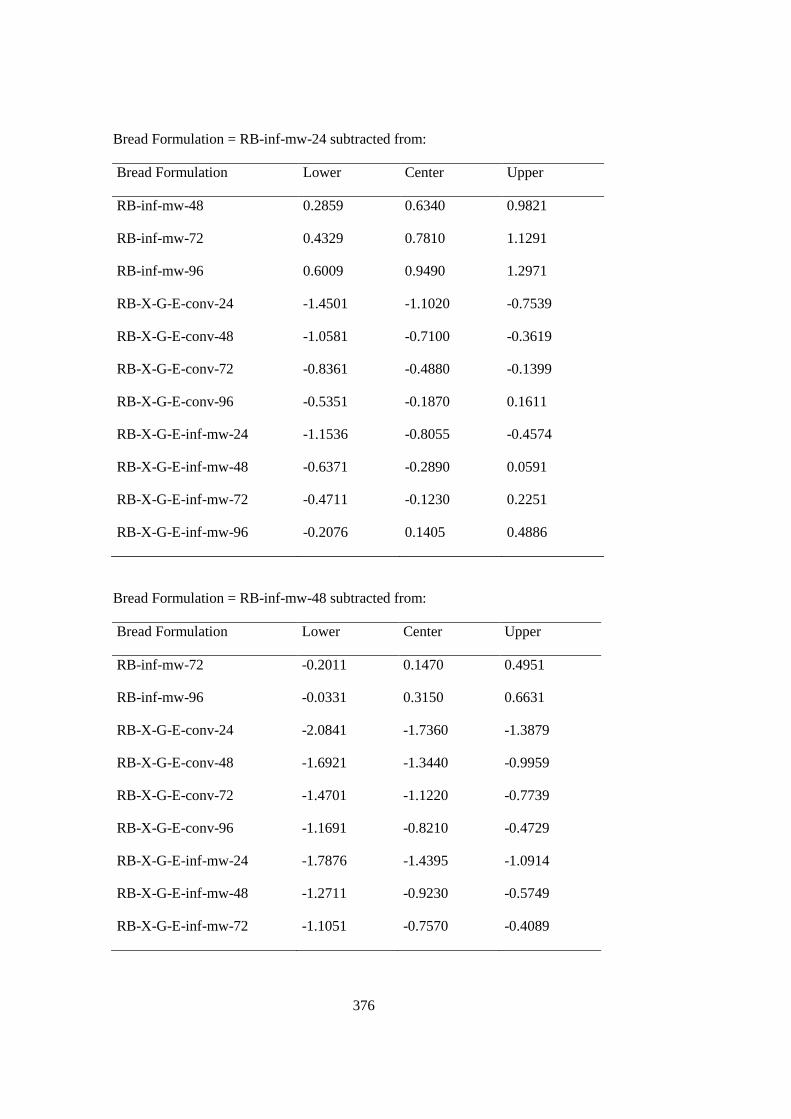
376
Bread Formulation = RB-inf-mw-24 subtracted from:
Bread Formulation Lower Center Upper
RB-inf-mw-48 0.2859 0.6340 0.9821
RB-inf-mw-72 0.4329 0.7810 1.1291
RB-inf-mw-96 0.6009 0.9490 1.2971
RB-X-G-E-conv-24 -1.4501 -1.1020 -0.7539
RB-X-G-E-conv-48 -1.0581 -0.7100 -0.3619
RB-X-G-E-conv-72 -0.8361 -0.4880 -0.1399
RB-X-G-E-conv-96 -0.5351 -0.1870 0.1611
RB-X-G-E-inf-mw-24 -1.1536 -0.8055 -0.4574
RB-X-G-E-inf-mw-48 -0.6371 -0.2890 0.0591
RB-X-G-E-inf-mw-72 -0.4711 -0.1230 0.2251
RB-X-G-E-inf-mw-96 -0.2076 0.1405 0.4886
Bread Formulation = RB-inf-mw-48 subtracted from:
Bread Formulation Lower Center Upper
RB-inf-mw-72 -0.2011 0.1470 0.4951
RB-inf-mw-96 -0.0331 0.3150 0.6631
RB-X-G-E-conv-24 -2.0841 -1.7360 -1.3879
RB-X-G-E-conv-48 -1.6921 -1.3440 -0.9959
RB-X-G-E-conv-72 -1.4701 -1.1220 -0.7739
RB-X-G-E-conv-96 -1.1691 -0.8210 -0.4729
RB-X-G-E-inf-mw-24 -1.7876 -1.4395 -1.0914
RB-X-G-E-inf-mw-48 -1.2711 -0.9230 -0.5749
RB-X-G-E-inf-mw-72 -1.1051 -0.7570 -0.4089
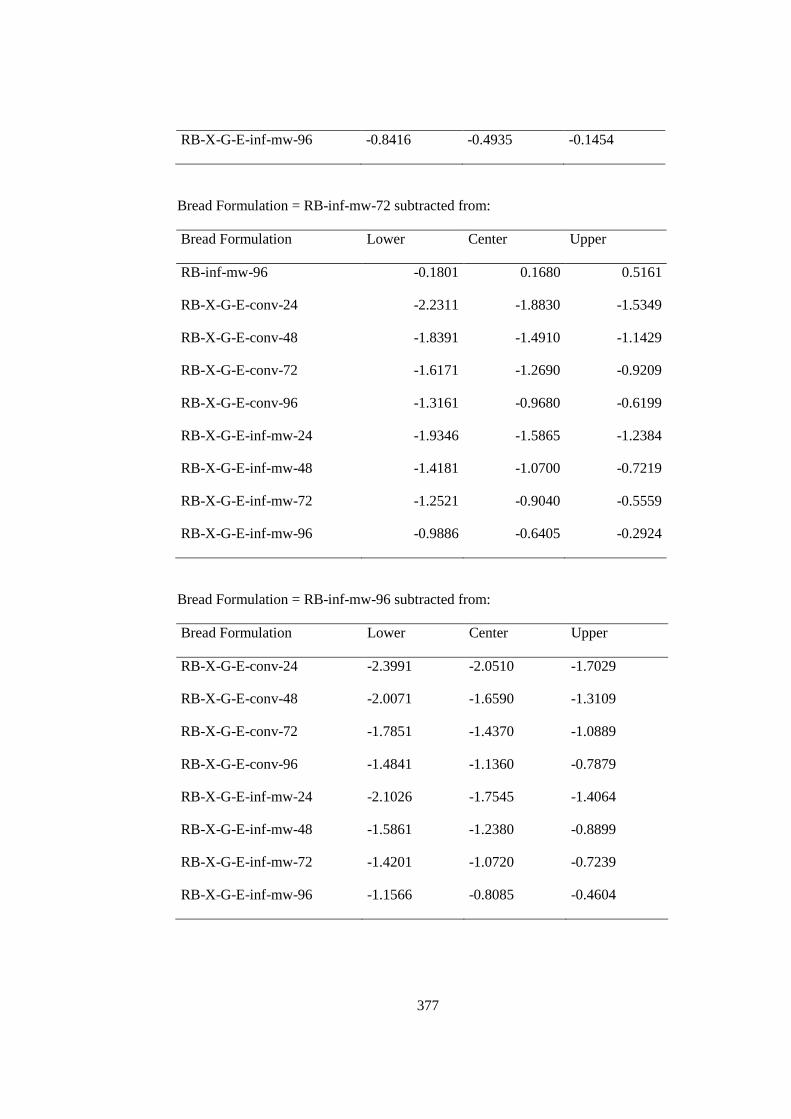
377
RB-X-G-E-inf-mw-96 -0.8416 -0.4935 -0.1454
Bread Formulation = RB-inf-mw-72 subtracted from:
Bread Formulation Lower Center Upper
RB-inf-mw-96 -0.1801 0.1680 0.5161
RB-X-G-E-conv-24 -2.2311 -1.8830 -1.5349
RB-X-G-E-conv-48 -1.8391 -1.4910 -1.1429
RB-X-G-E-conv-72 -1.6171 -1.2690 -0.9209
RB-X-G-E-conv-96 -1.3161 -0.9680 -0.6199
RB-X-G-E-inf-mw-24 -1.9346 -1.5865 -1.2384
RB-X-G-E-inf-mw-48 -1.4181 -1.0700 -0.7219
RB-X-G-E-inf-mw-72 -1.2521 -0.9040 -0.5559
RB-X-G-E-inf-mw-96 -0.9886 -0.6405 -0.2924
Bread Formulation = RB-inf-mw-96 subtracted from:
Bread Formulation Lower Center Upper
RB-X-G-E-conv-24 -2.3991 -2.0510 -1.7029
RB-X-G-E-conv-48 -2.0071 -1.6590 -1.3109
RB-X-G-E-conv-72 -1.7851 -1.4370 -1.0889
RB-X-G-E-conv-96 -1.4841 -1.1360 -0.7879
RB-X-G-E-inf-mw-24 -2.1026 -1.7545 -1.4064
RB-X-G-E-inf-mw-48 -1.5861 -1.2380 -0.8899
RB-X-G-E-inf-mw-72 -1.4201 -1.0720 -0.7239
RB-X-G-E-inf-mw-96 -1.1566 -0.8085 -0.4604
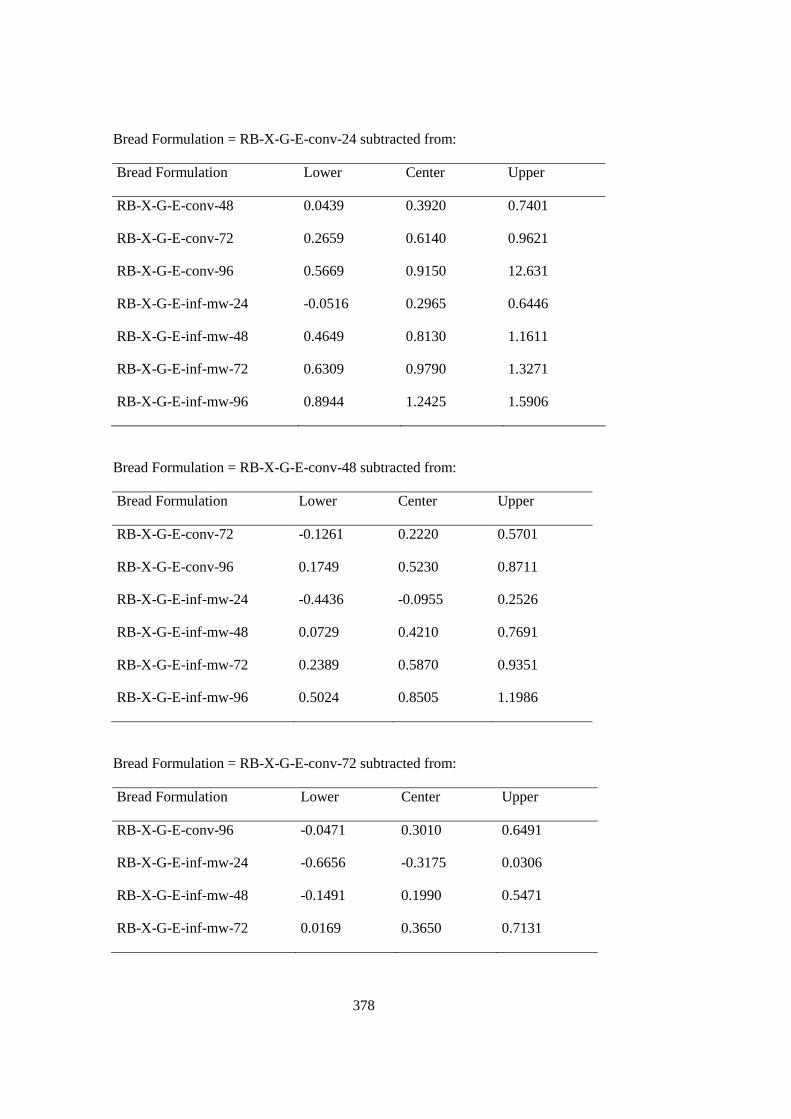
378
Bread Formulation = RB-X-G-E-conv-24 subtracted from:
Bread Formulation Lower Center Upper
RB-X-G-E-conv-48 0.0439 0.3920 0.7401
RB-X-G-E-conv-72 0.2659 0.6140 0.9621
RB-X-G-E-conv-96 0.5669 0.9150 12.631
RB-X-G-E-inf-mw-24 -0.0516 0.2965 0.6446
RB-X-G-E-inf-mw-48 0.4649 0.8130 1.1611
RB-X-G-E-inf-mw-72 0.6309 0.9790 1.3271
RB-X-G-E-inf-mw-96 0.8944 1.2425 1.5906
Bread Formulation = RB-X-G-E-conv-48 subtracted from:
Bread Formulation Lower Center Upper
RB-X-G-E-conv-72 -0.1261 0.2220 0.5701
RB-X-G-E-conv-96 0.1749 0.5230 0.8711
RB-X-G-E-inf-mw-24 -0.4436 -0.0955 0.2526
RB-X-G-E-inf-mw-48 0.0729 0.4210 0.7691
RB-X-G-E-inf-mw-72 0.2389 0.5870 0.9351
RB-X-G-E-inf-mw-96 0.5024 0.8505 1.1986
Bread Formulation = RB-X-G-E-conv-72 subtracted from:
Bread Formulation Lower Center Upper
RB-X-G-E-conv-96 -0.0471 0.3010 0.6491
RB-X-G-E-inf-mw-24 -0.6656 -0.3175 0.0306
RB-X-G-E-inf-mw-48 -0.1491 0.1990 0.5471
RB-X-G-E-inf-mw-72 0.0169 0.3650 0.7131
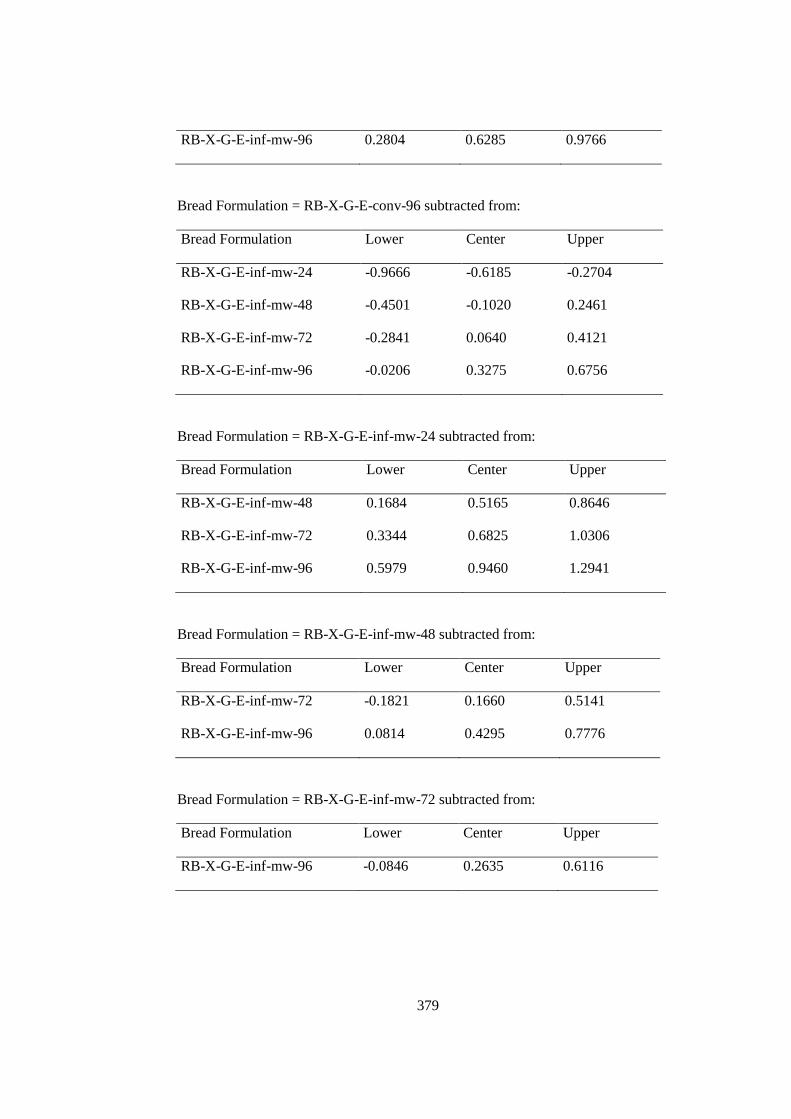
379
RB-X-G-E-inf-mw-96 0.2804 0.6285 0.9766
Bread Formulation = RB-X-G-E-conv-96 subtracted from:
Bread Formulation Lower Center Upper
RB-X-G-E-inf-mw-24 -0.9666 -0.6185 -0.2704
RB-X-G-E-inf-mw-48 -0.4501 -0.1020 0.2461
RB-X-G-E-inf-mw-72 -0.2841 0.0640 0.4121
RB-X-G-E-inf-mw-96 -0.0206 0.3275 0.6756
Bread Formulation = RB-X-G-E-inf-mw-24 subtracted from:
Bread Formulation Lower Center Upper
RB-X-G-E-inf-mw-48 0.1684 0.5165 0.8646
RB-X-G-E-inf-mw-72 0.3344 0.6825 1.0306
RB-X-G-E-inf-mw-96 0.5979 0.9460 1.2941
Bread Formulation = RB-X-G-E-inf-mw-48 subtracted from:
Bread Formulation Lower Center Upper
RB-X-G-E-inf-mw-72 -0.1821 0.1660 0.5141
RB-X-G-E-inf-mw-96 0.0814 0.4295 0.7776
Bread Formulation = RB-X-G-E-inf-mw-72 subtracted from:
Bread Formulation Lower Center Upper
RB-X-G-E-inf-mw-96 -0.0846 0.2635 0.6116
380
Table A. 37. General linear model for TMC grades values of different gluten-free
bread formulaions baked in different ovens and stored at different times
Factor Type Levels Values
Bread Formulation fixed 4 CB, CB-X-G-E, RB, RB-X-G-E
Storage Time fixed 5 1, 24, 48, 7, 96
Oven type
fixed 2
Convtional, infrared-
microwave
combination oven
Source DF Seq SS Adj SS Adj MS F P
Bread
Formulation 3 1.0412 1.0412 0.3471 2.86 0.003
Storage Time 4 0.4596 0.4596 0.1149 0.95 0.004
Oven type 1 0.2523 0.2523 0.2523 2.08 0.154
Error 71 8.6248 8.6248 0.1215
Total 79 10.3778
Formulation N Mean Grouping
CB-X-G-E 20 0.2 A
CB 20 0.2 BC
RB-X-G-E 20 0.2 BC
RB 20 0.5 D
Storage Time N Mean Grouping
96 16 0.4 CD
24 16 0.2 B
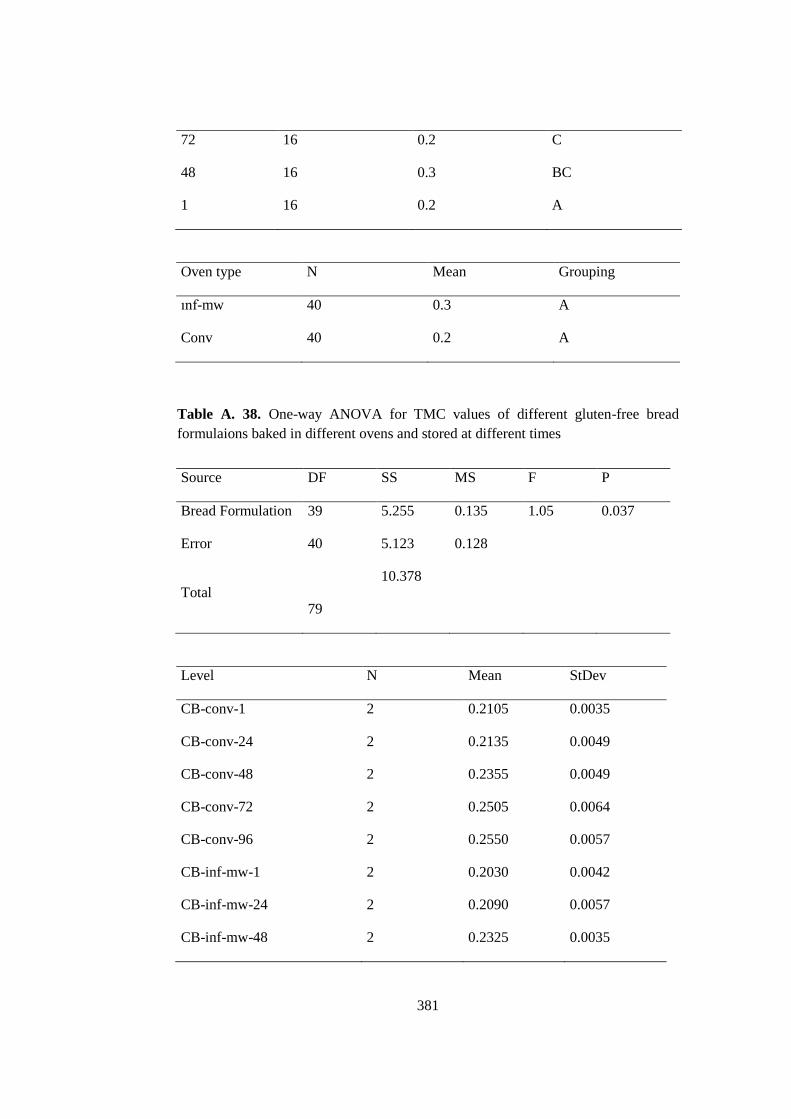
381
72 16 0.2 C
48 16 0.3 BC
1 16 0.2 A
Oven type N Mean Grouping
ınf-mw 40 0.3 A
Conv 40 0.2 A
Table A. 38. One-way ANOVA for TMC values of different gluten-free bread
formulaions baked in different ovens and stored at different times
Source DF SS MS F P
Bread Formulation 39 5.255 0.135 1.05 0.037
Error 40 5.123 0.128
Total
79
10.378
Level N Mean StDev
CB-conv-1 2 0.2105 0.0035
CB-conv-24 2 0.2135 0.0049
CB-conv-48 2 0.2355 0.0049
CB-conv-72 2 0.2505 0.0064
CB-conv-96 2 0.2550 0.0057
CB-inf-mw-1 2 0.2030 0.0042
CB-inf-mw-24 2 0.2090 0.0057
CB-inf-mw-48 2 0.2325 0.0035
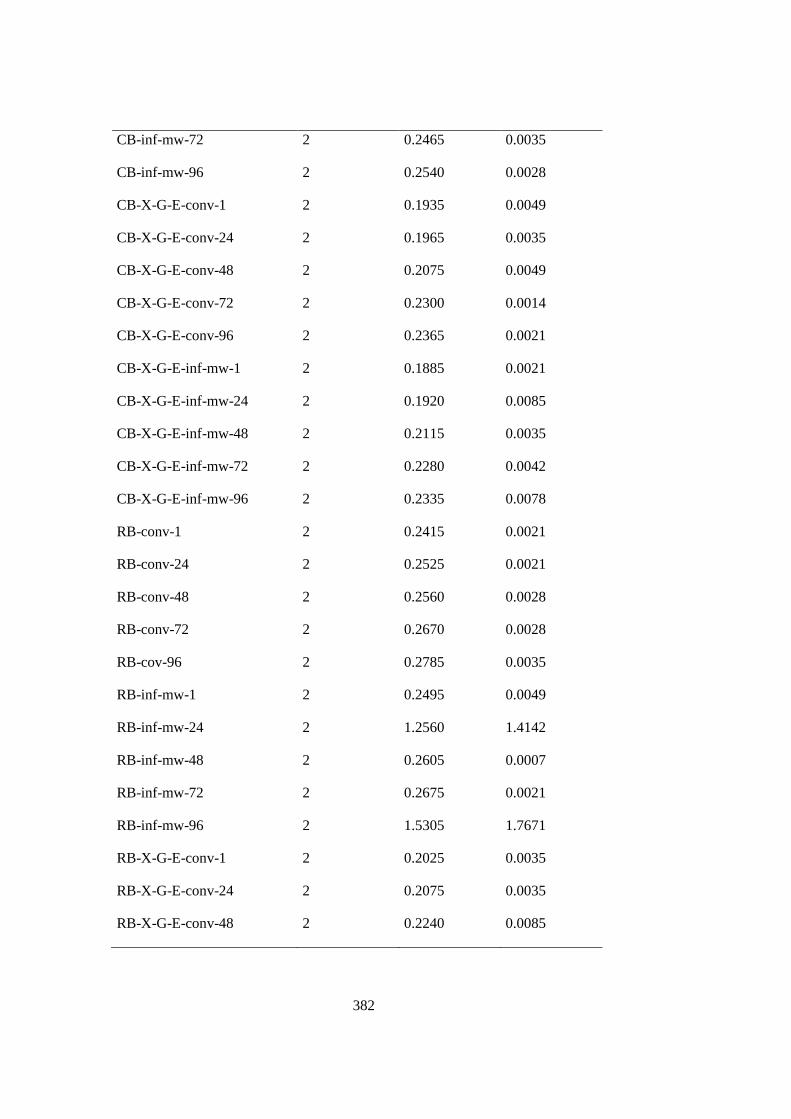
382
CB-inf-mw-72 2 0.2465 0.0035
CB-inf-mw-96 2 0.2540 0.0028
CB-X-G-E-conv-1 2 0.1935 0.0049
CB-X-G-E-conv-24 2 0.1965 0.0035
CB-X-G-E-conv-48 2 0.2075 0.0049
CB-X-G-E-conv-72 2 0.2300 0.0014
CB-X-G-E-conv-96 2 0.2365 0.0021
CB-X-G-E-inf-mw-1 2 0.1885 0.0021
CB-X-G-E-inf-mw-24 2 0.1920 0.0085
CB-X-G-E-inf-mw-48 2 0.2115 0.0035
CB-X-G-E-inf-mw-72 2 0.2280 0.0042
CB-X-G-E-inf-mw-96 2 0.2335 0.0078
RB-conv-1 2 0.2415 0.0021
RB-conv-24 2 0.2525 0.0021
RB-conv-48 2 0.2560 0.0028
RB-conv-72 2 0.2670 0.0028
RB-cov-96 2 0.2785 0.0035
RB-inf-mw-1 2 0.2495 0.0049
RB-inf-mw-24 2 1.2560 1.4142
RB-inf-mw-48 2 0.2605 0.0007
RB-inf-mw-72 2 0.2675 0.0021
RB-inf-mw-96 2 1.5305 1.7671
RB-X-G-E-conv-1 2 0.2025 0.0035
RB-X-G-E-conv-24 2 0.2075 0.0035
RB-X-G-E-conv-48 2 0.2240 0.0085
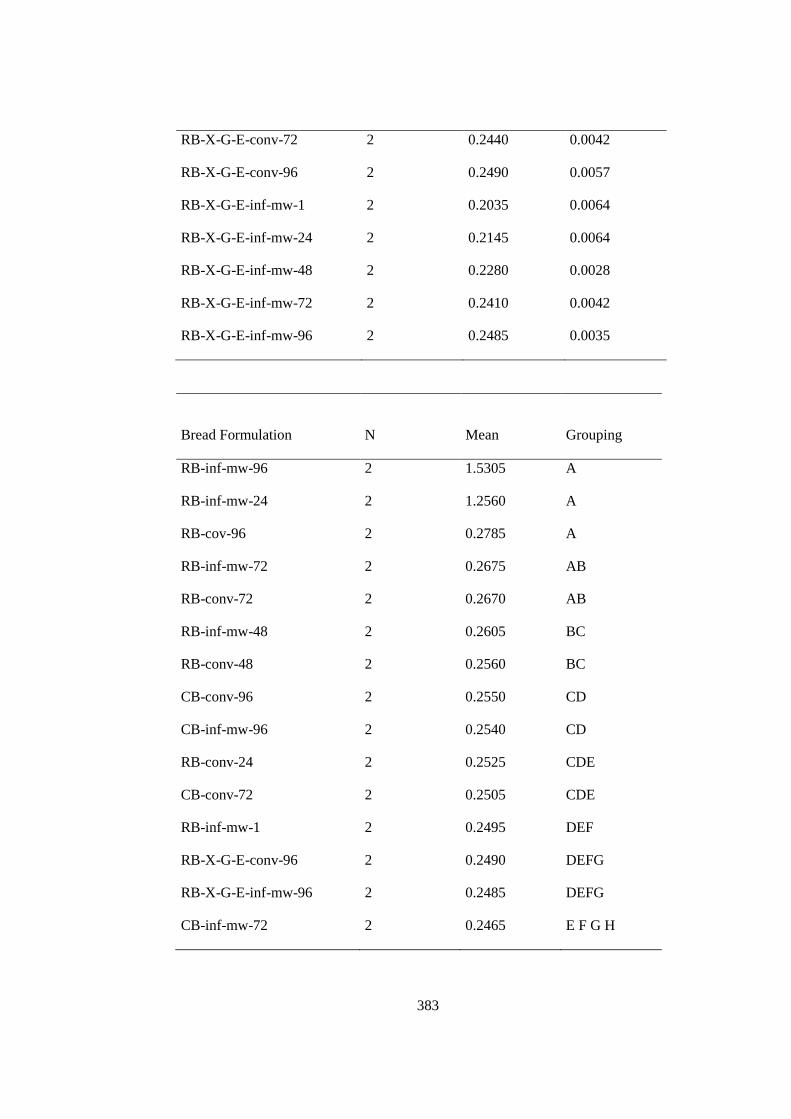
383
RB-X-G-E-conv-72 2 0.2440 0.0042
RB-X-G-E-conv-96 2 0.2490 0.0057
RB-X-G-E-inf-mw-1 2 0.2035 0.0064
RB-X-G-E-inf-mw-24 2 0.2145 0.0064
RB-X-G-E-inf-mw-48 2 0.2280 0.0028
RB-X-G-E-inf-mw-72 2 0.2410 0.0042
RB-X-G-E-inf-mw-96 2 0.2485 0.0035
Bread Formulation N Mean Grouping
RB-inf-mw-96 2 1.5305 A
RB-inf-mw-24 2 1.2560 A
RB-cov-96 2 0.2785 A
RB-inf-mw-72 2 0.2675 AB
RB-conv-72 2 0.2670 AB
RB-inf-mw-48 2 0.2605 BC
RB-conv-48 2 0.2560 BC
CB-conv-96 2 0.2550 CD
CB-inf-mw-96 2 0.2540 CD
RB-conv-24 2 0.2525 CDE
CB-conv-72 2 0.2505 CDE
RB-inf-mw-1 2 0.2495 DEF
RB-X-G-E-conv-96 2 0.2490 DEFG
RB-X-G-E-inf-mw-96 2 0.2485 DEFG
CB-inf-mw-72 2 0.2465 E F G H
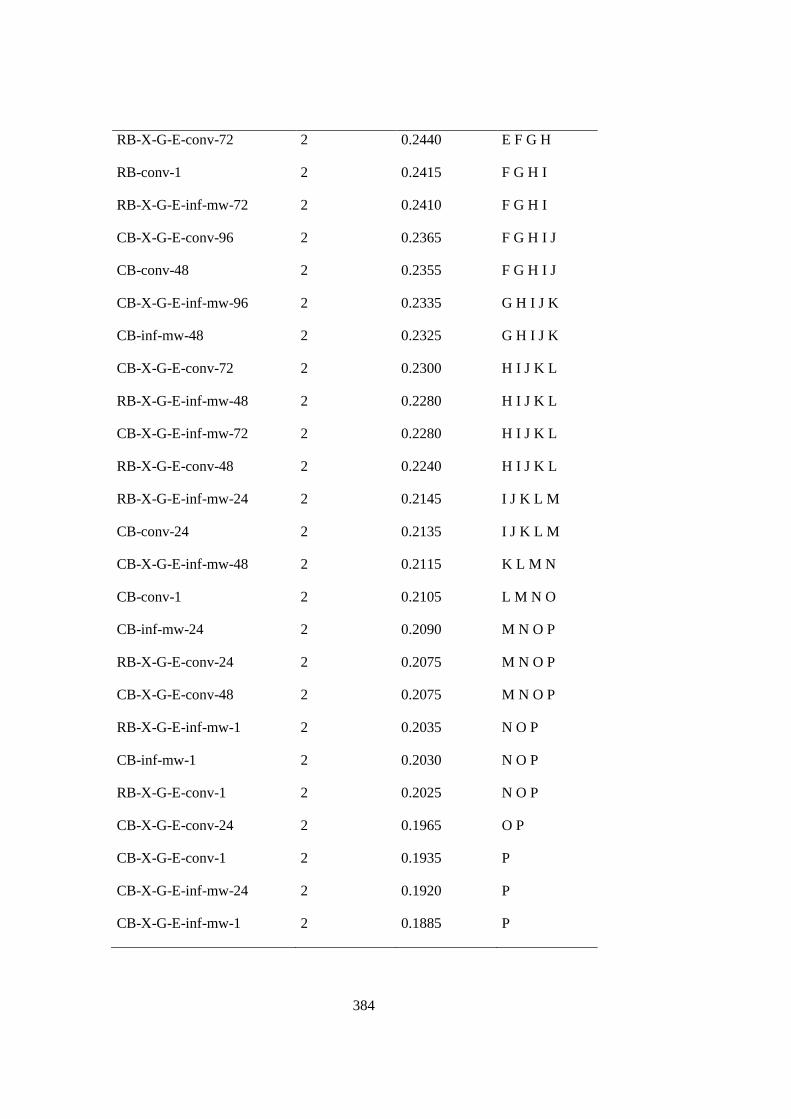
384
RB-X-G-E-conv-72 2 0.2440 E F G H
RB-conv-1 2 0.2415 F G H I
RB-X-G-E-inf-mw-72 2 0.2410 F G H I
CB-X-G-E-conv-96 2 0.2365 F G H I J
CB-conv-48 2 0.2355 F G H I J
CB-X-G-E-inf-mw-96 2 0.2335 G H I J K
CB-inf-mw-48 2 0.2325 G H I J K
CB-X-G-E-conv-72 2 0.2300 H I J K L
RB-X-G-E-inf-mw-48 2 0.2280 H I J K L
CB-X-G-E-inf-mw-72 2 0.2280 H I J K L
RB-X-G-E-conv-48 2 0.2240 H I J K L
RB-X-G-E-inf-mw-24 2 0.2145 I J K L M
CB-conv-24 2 0.2135 I J K L M
CB-X-G-E-inf-mw-48 2 0.2115 K L M N
CB-conv-1 2 0.2105 L M N O
CB-inf-mw-24 2 0.2090 M N O P
RB-X-G-E-conv-24 2 0.2075 M N O P
CB-X-G-E-conv-48 2 0.2075 M N O P
RB-X-G-E-inf-mw-1 2 0.2035 N O P
CB-inf-mw-1 2 0.2030 N O P
RB-X-G-E-conv-1 2 0.2025 N O P
CB-X-G-E-conv-24 2 0.1965 O P
CB-X-G-E-conv-1 2 0.1935 P
CB-X-G-E-inf-mw-24 2 0.1920 P
CB-X-G-E-inf-mw-1 2 0.1885 P
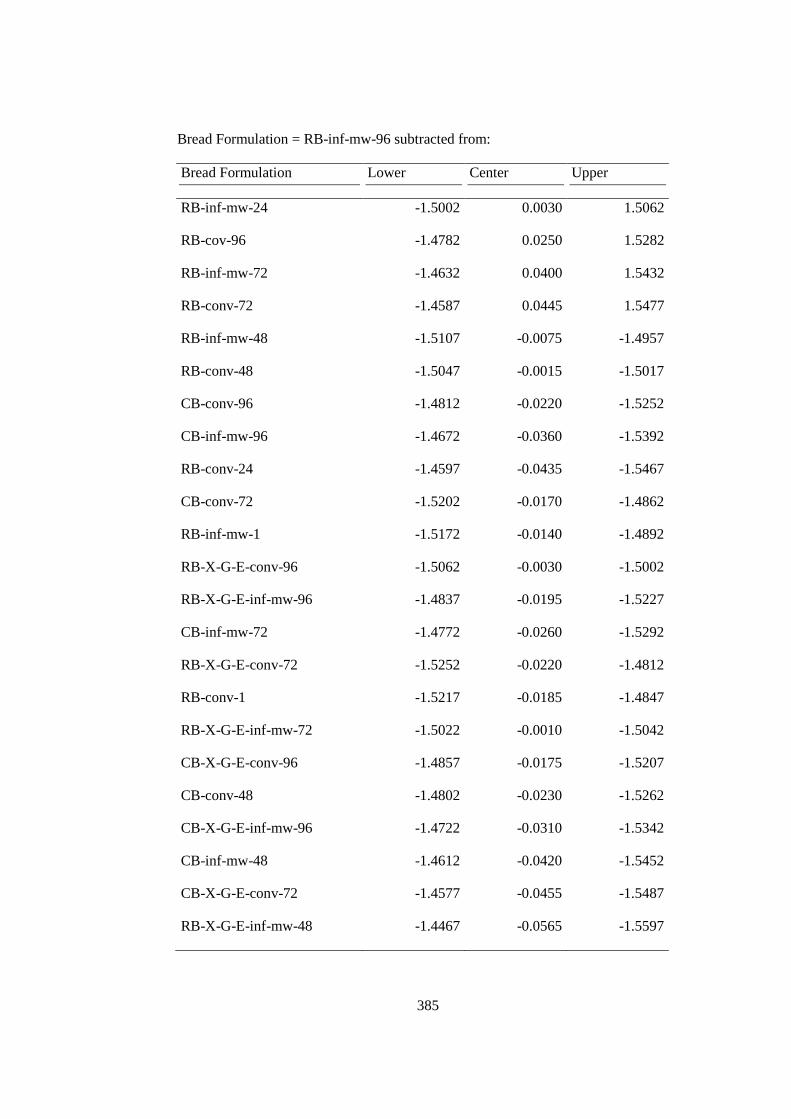
385
Bread Formulation = RB-inf-mw-96 subtracted from:
Bread Formulation Lower Center Upper
RB-inf-mw-24 -1.5002 0.0030 1.5062
RB-cov-96 -1.4782 0.0250 1.5282
RB-inf-mw-72 -1.4632 0.0400 1.5432
RB-conv-72 -1.4587 0.0445 1.5477
RB-inf-mw-48 -1.5107 -0.0075 -1.4957
RB-conv-48 -1.5047 -0.0015 -1.5017
CB-conv-96 -1.4812 -0.0220 -1.5252
CB-inf-mw-96 -1.4672 -0.0360 -1.5392
RB-conv-24 -1.4597 -0.0435 -1.5467
CB-conv-72 -1.5202 -0.0170 -1.4862
RB-inf-mw-1 -1.5172 -0.0140 -1.4892
RB-X-G-E-conv-96 -1.5062 -0.0030 -1.5002
RB-X-G-E-inf-mw-96 -1.4837 -0.0195 -1.5227
CB-inf-mw-72 -1.4772 -0.0260 -1.5292
RB-X-G-E-conv-72 -1.5252 -0.0220 -1.4812
RB-conv-1 -1.5217 -0.0185 -1.4847
RB-X-G-E-inf-mw-72 -1.5022 -0.0010 -1.5042
CB-X-G-E-conv-96 -1.4857 -0.0175 -1.5207
CB-conv-48 -1.4802 -0.0230 -1.5262
CB-X-G-E-inf-mw-96 -1.4722 -0.0310 -1.5342
CB-inf-mw-48 -1.4612 -0.0420 -1.5452
CB-X-G-E-conv-72 -1.4577 -0.0455 -1.5487
RB-X-G-E-inf-mw-48 -1.4467 -0.0565 -1.5597
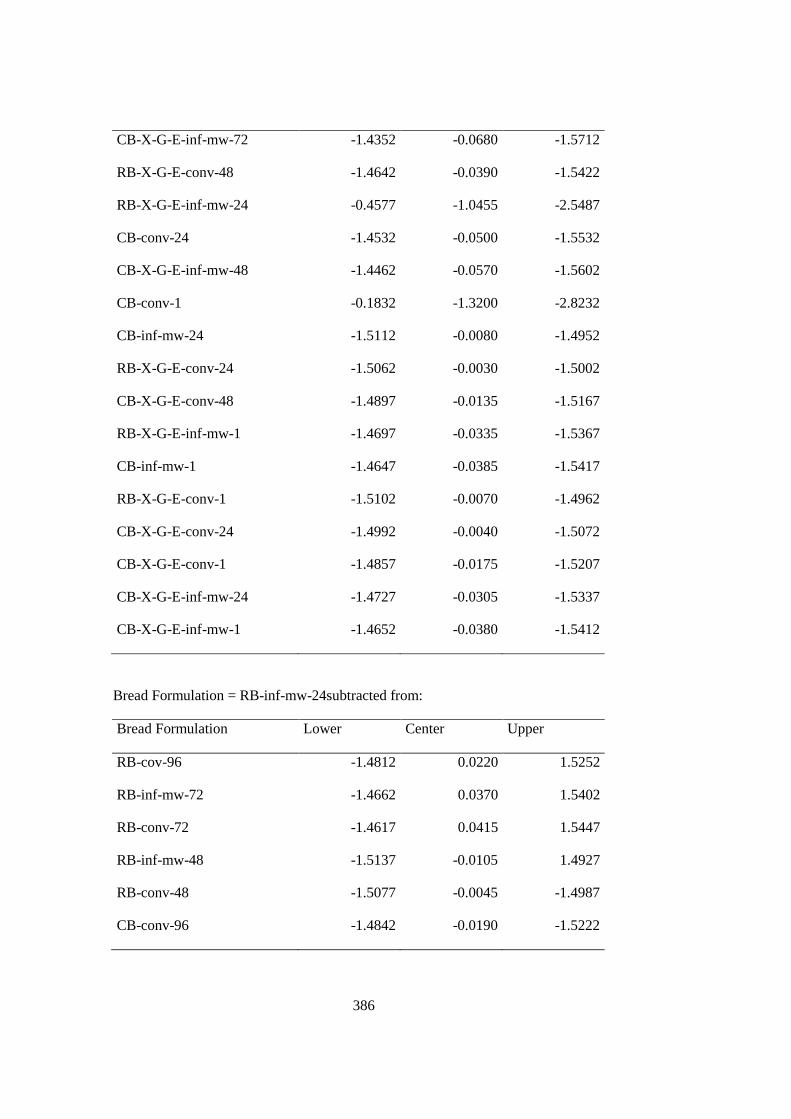
386
CB-X-G-E-inf-mw-72 -1.4352 -0.0680 -1.5712
RB-X-G-E-conv-48 -1.4642 -0.0390 -1.5422
RB-X-G-E-inf-mw-24 -0.4577 -1.0455 -2.5487
CB-conv-24 -1.4532 -0.0500 -1.5532
CB-X-G-E-inf-mw-48 -1.4462 -0.0570 -1.5602
CB-conv-1 -0.1832 -1.3200 -2.8232
CB-inf-mw-24 -1.5112 -0.0080 -1.4952
RB-X-G-E-conv-24 -1.5062 -0.0030 -1.5002
CB-X-G-E-conv-48 -1.4897 -0.0135 -1.5167
RB-X-G-E-inf-mw-1 -1.4697 -0.0335 -1.5367
CB-inf-mw-1 -1.4647 -0.0385 -1.5417
RB-X-G-E-conv-1 -1.5102 -0.0070 -1.4962
CB-X-G-E-conv-24 -1.4992 -0.0040 -1.5072
CB-X-G-E-conv-1 -1.4857 -0.0175 -1.5207
CB-X-G-E-inf-mw-24 -1.4727 -0.0305 -1.5337
CB-X-G-E-inf-mw-1 -1.4652 -0.0380 -1.5412
Bread Formulation = RB-inf-mw-24subtracted from:
Bread Formulation Lower Center Upper
RB-cov-96 -1.4812 0.0220 1.5252
RB-inf-mw-72 -1.4662 0.0370 1.5402
RB-conv-72 -1.4617 0.0415 1.5447
RB-inf-mw-48 -1.5137 -0.0105 1.4927
RB-conv-48 -1.5077 -0.0045 -1.4987
CB-conv-96 -1.4842 -0.0190 -1.5222
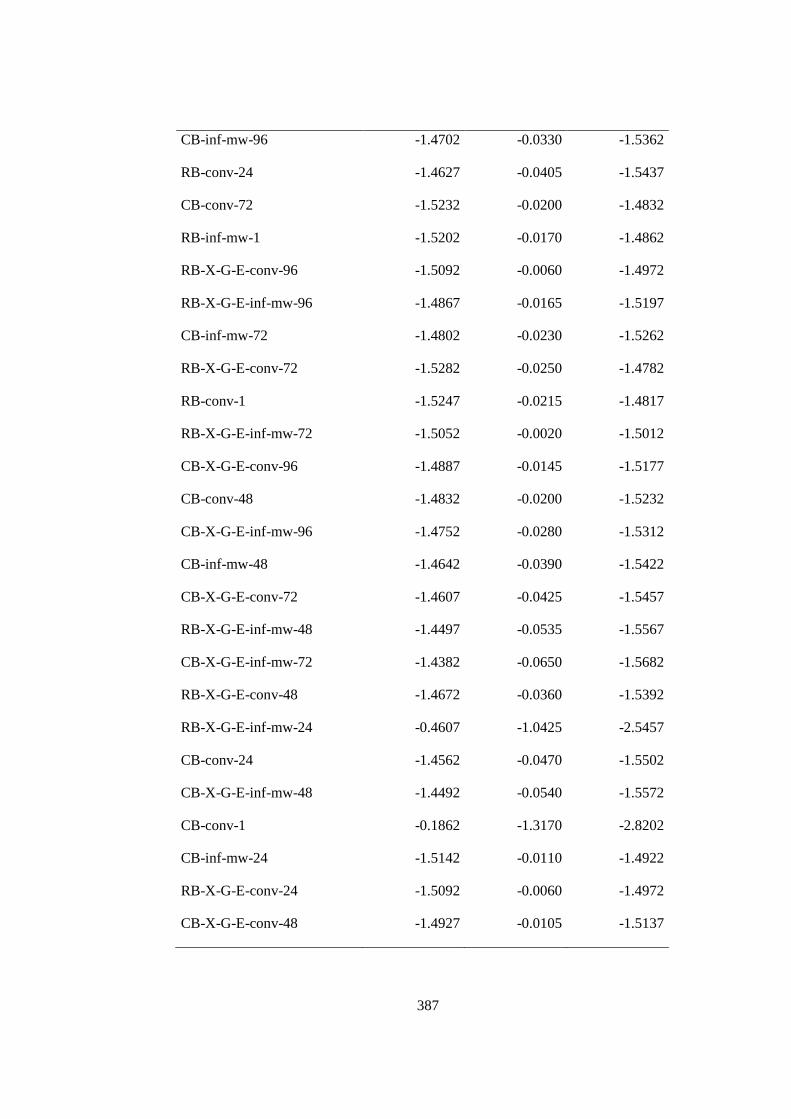
387
CB-inf-mw-96 -1.4702 -0.0330 -1.5362
RB-conv-24 -1.4627 -0.0405 -1.5437
CB-conv-72 -1.5232 -0.0200 -1.4832
RB-inf-mw-1 -1.5202 -0.0170 -1.4862
RB-X-G-E-conv-96 -1.5092 -0.0060 -1.4972
RB-X-G-E-inf-mw-96 -1.4867 -0.0165 -1.5197
CB-inf-mw-72 -1.4802 -0.0230 -1.5262
RB-X-G-E-conv-72 -1.5282 -0.0250 -1.4782
RB-conv-1 -1.5247 -0.0215 -1.4817
RB-X-G-E-inf-mw-72 -1.5052 -0.0020 -1.5012
CB-X-G-E-conv-96 -1.4887 -0.0145 -1.5177
CB-conv-48 -1.4832 -0.0200 -1.5232
CB-X-G-E-inf-mw-96 -1.4752 -0.0280 -1.5312
CB-inf-mw-48 -1.4642 -0.0390 -1.5422
CB-X-G-E-conv-72 -1.4607 -0.0425 -1.5457
RB-X-G-E-inf-mw-48 -1.4497 -0.0535 -1.5567
CB-X-G-E-inf-mw-72 -1.4382 -0.0650 -1.5682
RB-X-G-E-conv-48 -1.4672 -0.0360 -1.5392
RB-X-G-E-inf-mw-24 -0.4607 -1.0425 -2.5457
CB-conv-24 -1.4562 -0.0470 -1.5502
CB-X-G-E-inf-mw-48 -1.4492 -0.0540 -1.5572
CB-conv-1 -0.1862 -1.3170 -2.8202
CB-inf-mw-24 -1.5142 -0.0110 -1.4922
RB-X-G-E-conv-24 -1.5092 -0.0060 -1.4972
CB-X-G-E-conv-48 -1.4927 -0.0105 -1.5137
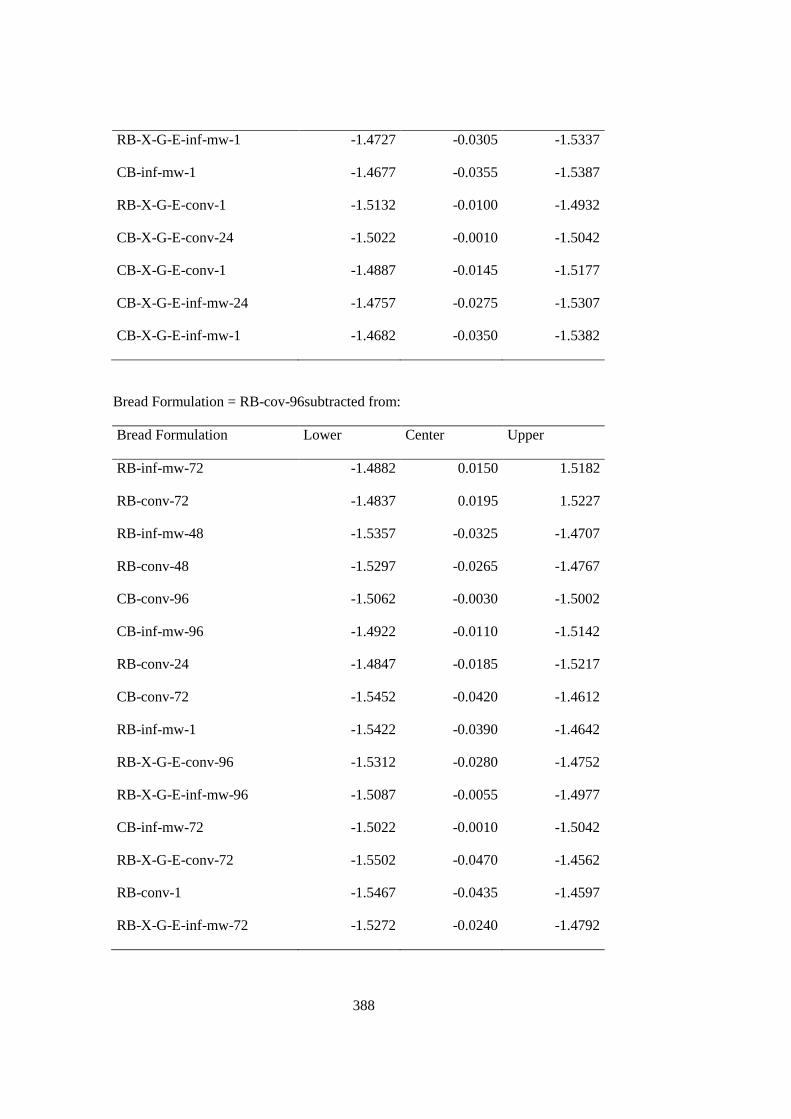
388
RB-X-G-E-inf-mw-1 -1.4727 -0.0305 -1.5337
CB-inf-mw-1 -1.4677 -0.0355 -1.5387
RB-X-G-E-conv-1 -1.5132 -0.0100 -1.4932
CB-X-G-E-conv-24 -1.5022 -0.0010 -1.5042
CB-X-G-E-conv-1 -1.4887 -0.0145 -1.5177
CB-X-G-E-inf-mw-24 -1.4757 -0.0275 -1.5307
CB-X-G-E-inf-mw-1 -1.4682 -0.0350 -1.5382
Bread Formulation = RB-cov-96subtracted from:
Bread Formulation Lower Center Upper
RB-inf-mw-72 -1.4882 0.0150 1.5182
RB-conv-72 -1.4837 0.0195 1.5227
RB-inf-mw-48 -1.5357 -0.0325 -1.4707
RB-conv-48 -1.5297 -0.0265 -1.4767
CB-conv-96 -1.5062 -0.0030 -1.5002
CB-inf-mw-96 -1.4922 -0.0110 -1.5142
RB-conv-24 -1.4847 -0.0185 -1.5217
CB-conv-72 -1.5452 -0.0420 -1.4612
RB-inf-mw-1 -1.5422 -0.0390 -1.4642
RB-X-G-E-conv-96 -1.5312 -0.0280 -1.4752
RB-X-G-E-inf-mw-96 -1.5087 -0.0055 -1.4977
CB-inf-mw-72 -1.5022 -0.0010 -1.5042
RB-X-G-E-conv-72 -1.5502 -0.0470 -1.4562
RB-conv-1 -1.5467 -0.0435 -1.4597
RB-X-G-E-inf-mw-72 -1.5272 -0.0240 -1.4792
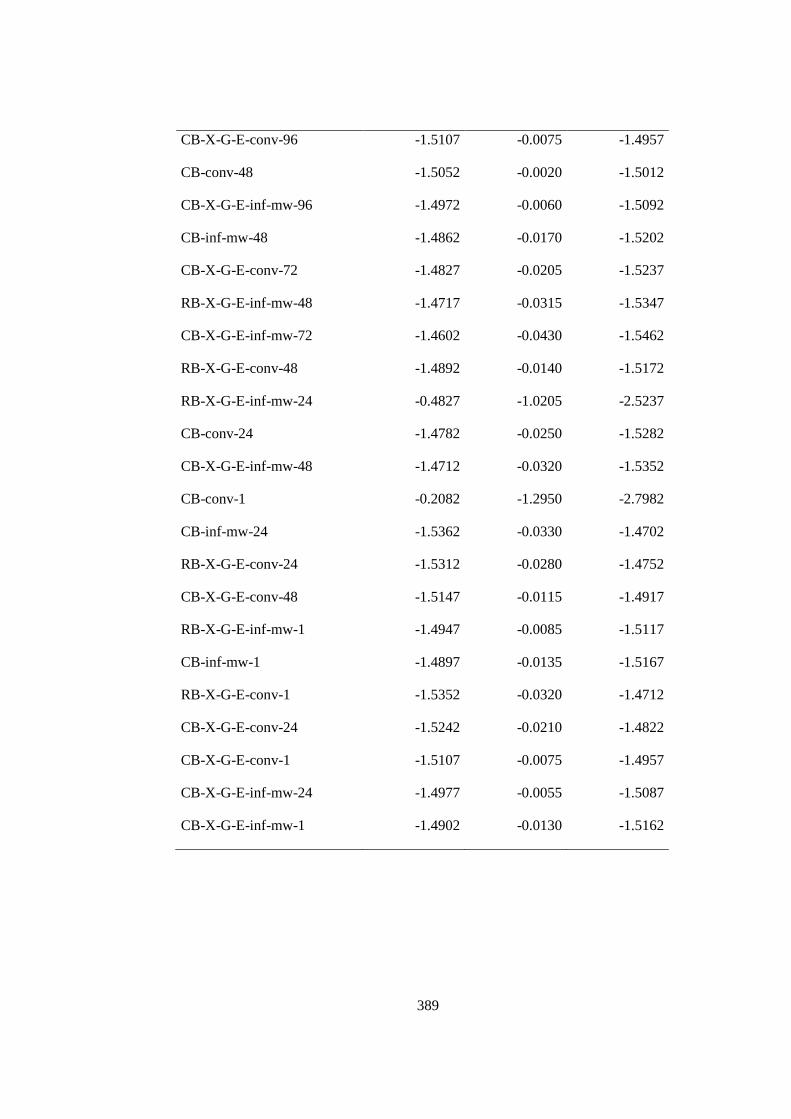
389
CB-X-G-E-conv-96 -1.5107 -0.0075 -1.4957
CB-conv-48 -1.5052 -0.0020 -1.5012
CB-X-G-E-inf-mw-96 -1.4972 -0.0060 -1.5092
CB-inf-mw-48 -1.4862 -0.0170 -1.5202
CB-X-G-E-conv-72 -1.4827 -0.0205 -1.5237
RB-X-G-E-inf-mw-48 -1.4717 -0.0315 -1.5347
CB-X-G-E-inf-mw-72 -1.4602 -0.0430 -1.5462
RB-X-G-E-conv-48 -1.4892 -0.0140 -1.5172
RB-X-G-E-inf-mw-24 -0.4827 -1.0205 -2.5237
CB-conv-24 -1.4782 -0.0250 -1.5282
CB-X-G-E-inf-mw-48 -1.4712 -0.0320 -1.5352
CB-conv-1 -0.2082 -1.2950 -2.7982
CB-inf-mw-24 -1.5362 -0.0330 -1.4702
RB-X-G-E-conv-24 -1.5312 -0.0280 -1.4752
CB-X-G-E-conv-48 -1.5147 -0.0115 -1.4917
RB-X-G-E-inf-mw-1 -1.4947 -0.0085 -1.5117
CB-inf-mw-1 -1.4897 -0.0135 -1.5167
RB-X-G-E-conv-1 -1.5352 -0.0320 -1.4712
CB-X-G-E-conv-24 -1.5242 -0.0210 -1.4822
CB-X-G-E-conv-1 -1.5107 -0.0075 -1.4957
CB-X-G-E-inf-mw-24 -1.4977 -0.0055 -1.5087
CB-X-G-E-inf-mw-1 -1.4902 -0.0130 -1.5162
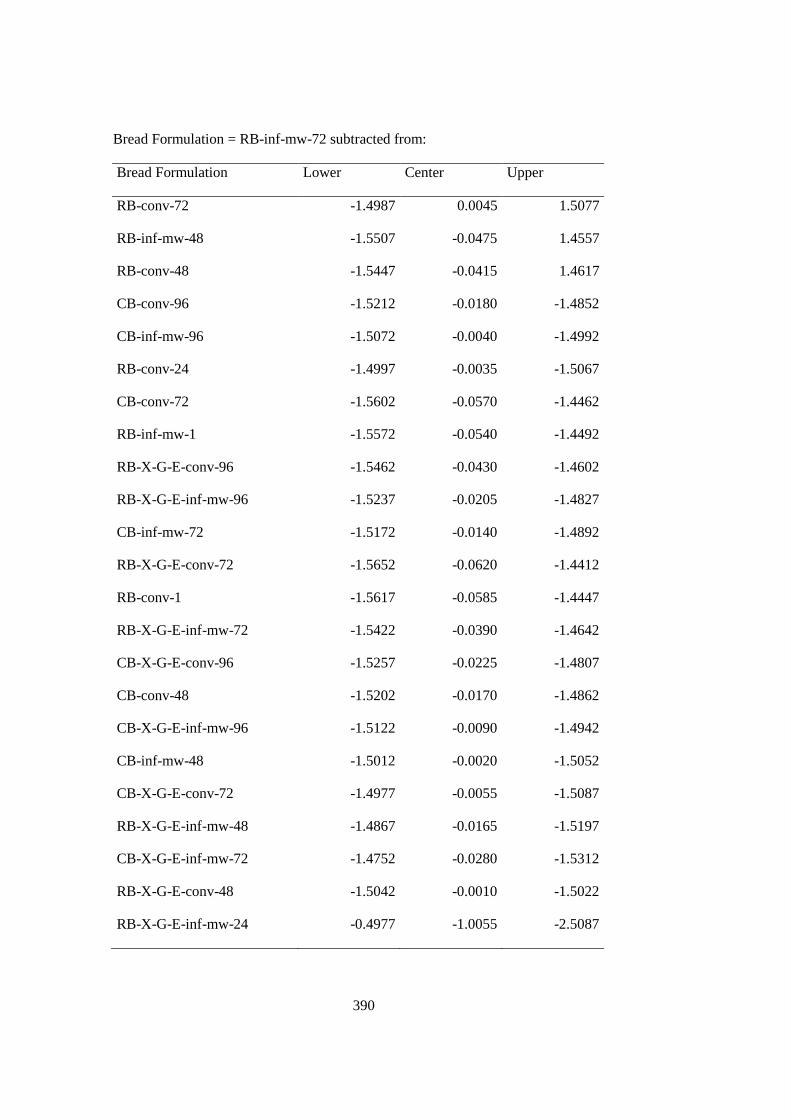
390
Bread Formulation = RB-inf-mw-72 subtracted from:
Bread Formulation Lower Center Upper
RB-conv-72 -1.4987 0.0045 1.5077
RB-inf-mw-48 -1.5507 -0.0475 1.4557
RB-conv-48 -1.5447 -0.0415 1.4617
CB-conv-96 -1.5212 -0.0180 -1.4852
CB-inf-mw-96 -1.5072 -0.0040 -1.4992
RB-conv-24 -1.4997 -0.0035 -1.5067
CB-conv-72 -1.5602 -0.0570 -1.4462
RB-inf-mw-1 -1.5572 -0.0540 -1.4492
RB-X-G-E-conv-96 -1.5462 -0.0430 -1.4602
RB-X-G-E-inf-mw-96 -1.5237 -0.0205 -1.4827
CB-inf-mw-72 -1.5172 -0.0140 -1.4892
RB-X-G-E-conv-72 -1.5652 -0.0620 -1.4412
RB-conv-1 -1.5617 -0.0585 -1.4447
RB-X-G-E-inf-mw-72 -1.5422 -0.0390 -1.4642
CB-X-G-E-conv-96 -1.5257 -0.0225 -1.4807
CB-conv-48 -1.5202 -0.0170 -1.4862
CB-X-G-E-inf-mw-96 -1.5122 -0.0090 -1.4942
CB-inf-mw-48 -1.5012 -0.0020 -1.5052
CB-X-G-E-conv-72 -1.4977 -0.0055 -1.5087
RB-X-G-E-inf-mw-48 -1.4867 -0.0165 -1.5197
CB-X-G-E-inf-mw-72 -1.4752 -0.0280 -1.5312
RB-X-G-E-conv-48 -1.5042 -0.0010 -1.5022
RB-X-G-E-inf-mw-24 -0.4977 -1.0055 -2.5087
391
CB-conv-24 -1.4932 -0.0100 -1.5132
CB-X-G-E-inf-mw-48 -1.4862 -0.0170 -1.5202
CB-conv-1 -0.2232 -1.2800 -2.7832
CB-inf-mw-24 -1.5512 -0.0480 -1.4552
RB-X-G-E-conv-24 -1.5462 -0.0430 -1.4602
CB-X-G-E-conv-48 -1.5297 -0.0265 -1.4767
RB-X-G-E-inf-mw-1 -1.5097 -0.0065 -1.4967
CB-inf-mw-1 -1.5047 -0.0015 -1.5017
RB-X-G-E-conv-1 -1.5502 -0.0470 -1.4562
CB-X-G-E-conv-24 -1.5392 -0.0360 -1.4672
CB-X-G-E-conv-1 -1.5257 -0.0225 -1.4807
CB-X-G-E-inf-mw-24 -1.5127 -0.0095 -1.4937
CB-X-G-E-inf-mw-1 -1.5052 -0.0020 -1.5012
Bread Formulation = RB-conv-72subtracted from:
Bread Formulation Lower Center Upper
RB-inf-mw-48 -1.5552 -0.0520 1.4512
RB-conv-48 -1.5492 -0.0460 1.4572
CB-conv-96 -1.5257 -0.0225 -1.4807
CB-inf-mw-96 -1.5117 -0.0085 -1.4947
RB-conv-24 -1.5042 -0.0010 -1.5022
CB-conv-72 -1.5647 -0.0615 -1.4417
RB-inf-mw-1 -1.5617 -0.0585 -1.4447
RB-X-G-E-conv-96 -1.5507 -0.0475 -1.4557
RB-X-G-E-inf-mw-96 -1.5282 -0.0250 -1.4782
392
CB-inf-mw-72 -1.5217 -0.0185 -1.4847
RB-X-G-E-conv-72 -1.5697 -0.0665 -1.4367
RB-conv-1 -1.5662 -0.0630 -1.4402
RB-X-G-E-inf-mw-72 -1.5467 -0.0435 -1.4597
CB-X-G-E-conv-96 -1.5302 -0.0270 -1.4762
CB-conv-48 -1.5247 -0.0215 -1.4817
CB-X-G-E-inf-mw-96 -1.5167 -0.0135 -1.4897
CB-inf-mw-48 -1.5057 -0.0025 -1.5007
CB-X-G-E-conv-72 -1.5022 -0.0010 -1.5042
RB-X-G-E-inf-mw-48 -1.4912 -0.0120 -1.5152
CB-X-G-E-inf-mw-72 -1.4797 -0.0235 -1.5267
RB-X-G-E-conv-48 -1.5087 -0.0055 -1.4977
RB-X-G-E-inf-mw-24 -0.5022 -1.0010 -2.5042
CB-conv-24 -1.4977 -0.0055 -1.5087
CB-X-G-E-inf-mw-48 -1.4907 -0.0125 -1.5157
CB-conv-1 -0.2277 -1.2755 -2.7787
CB-inf-mw-24 -1.5557 -0.0525 -1.4507
RB-X-G-E-conv-24 -1.5507 -0.0475 -1.4557
CB-X-G-E-conv-48 -1.5342 -0.0310 -1.4722
RB-X-G-E-inf-mw-1 -1.5142 -0.0110 -1.4922
CB-inf-mw-1 -1.5092 -0.0060 -1.4972
RB-X-G-E-conv-1 -1.5547 -0.0515 -1.4517
CB-X-G-E-conv-24 -1.5437 -0.0405 -1.4627
CB-X-G-E-conv-1 -1.5302 -0.0270 -1.4762
CB-X-G-E-inf-mw-24 -1.5172 -0.0140 -1.4892
393
CB-X-G-E-inf-mw-1 -1.5097 -0.0065 -1.4967
Bread Formulation = RB-inf-mw-48 subtracted from:
Bread Formulation Lower Center Upper
RB-conv-48 -1.4972 0.0060 1.5092
CB-conv-96 -1.4737 0.0295 1.5327
CB-inf-mw-96 -1.4597 0.0435 1.5467
RB-conv-24 -1.4522 0.0510 1.5542
CB-conv-72 -1.5127 -0.0095 1.4937
RB-inf-mw-1 -1.5097 -0.0065 -1.4967
RB-X-G-E-conv-96 -1.4987 -0.0045 -1.5077
RB-X-G-E-inf-mw-96 -1.4762 -0.0270 -1.5302
CB-inf-mw-72 -1.4697 -0.0335 -1.5367
RB-X-G-E-conv-72 -1.5177 -0.0145 -1.4887
RB-conv-1 -1.5142 -0.0110 -1.4922
RB-X-G-E-inf-mw-72 -1.4947 -0.0085 -1.5117
CB-X-G-E-conv-96 -1.4782 -0.0250 -1.5282
CB-conv-48 -1.4727 -0.0305 -1.5337
CB-X-G-E-inf-mw-96 -1.4647 -0.0385 -1.5417
CB-inf-mw-48 -1.4537 0.0495 -1.5527
CB-X-G-E-conv-72 -1.4502 -0.0530 -1.5562
RB-X-G-E-inf-mw-48 -1.4392 -0.0640 -1.5672
CB-X-G-E-inf-mw-72 -1.4277 0.0755 -1.5787
RB-X-G-E-conv-48 -1.4567 -0.0465 -1.5497
RB-X-G-E-inf-mw-24 -0.4502 -1.0530 -2.5562
394
CB-conv-24 -1.4457 -0.0575 -1.5607
CB-X-G-E-inf-mw-48 -1.4387 -0.0645 -1.5677
CB-conv-1 -0.1757 -1.3275 -2.8307
CB-inf-mw-24 -1.5037 -0.0005 -1.5027
RB-X-G-E-conv-24 -1.4987 -0.0045 -1.5077
CB-X-G-E-conv-48 -1.4822 -0.0210 -1.5242
RB-X-G-E-inf-mw-1 -1.4622 -0.0410 -1.5442
CB-inf-mw-1 -1.4572 -0.0460 -1.5492
RB-X-G-E-conv-1 -1.5027 -0.0005 -1.5037
CB-X-G-E-conv-24 -1.4917 -0.0115 -1.5147
CB-X-G-E-conv-1 -1.4782 -0.0250 -1.5282
CB-X-G-E-inf-mw-24 -1.4652 -0.0380 -1.5412
CB-X-G-E-inf-mw-1 -1.4577 -0.0455 -1.5487
Bread Formulation = RB-conv-48subtracted from:
Bread Formulation Lower Center Upper
CB-conv-96 -1.4797 0.0235 1.5267
CB-inf-mw-96 -1.4657 0.0375 1.5407
RB-conv-24 -1.4582 0.0450 1.5482
CB-conv-72 -1.5187 -0.0155 1.4877
RB-inf-mw-1 -1.5157 -0.0125 -1.4907
RB-X-G-E-conv-96 -1.5047 -0.0015 -1.5017
RB-X-G-E-inf-mw-96 -1.4822 -0.0210 -1.5242
CB-inf-mw-72 -1.4757 -0.0275 -1.5307
RB-X-G-E-conv-72 -1.5237 -0.0205 -1.4827
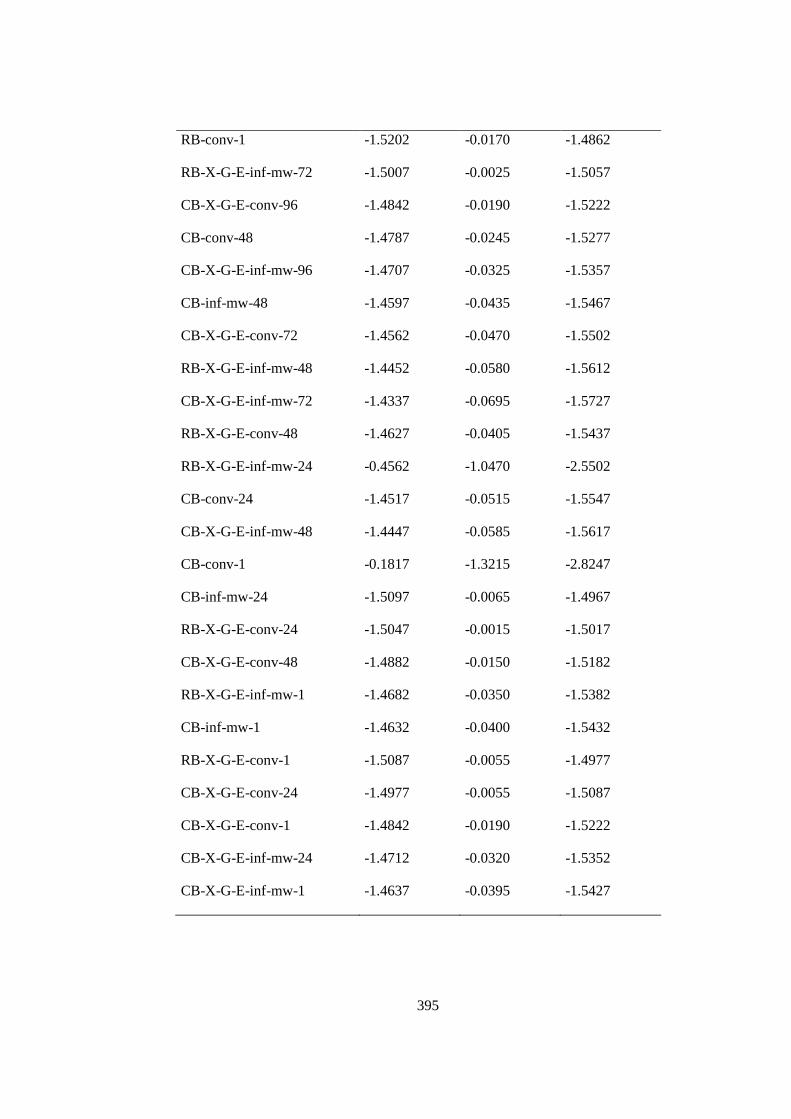
395
RB-conv-1 -1.5202 -0.0170 -1.4862
RB-X-G-E-inf-mw-72 -1.5007 -0.0025 -1.5057
CB-X-G-E-conv-96 -1.4842 -0.0190 -1.5222
CB-conv-48 -1.4787 -0.0245 -1.5277
CB-X-G-E-inf-mw-96 -1.4707 -0.0325 -1.5357
CB-inf-mw-48 -1.4597 -0.0435 -1.5467
CB-X-G-E-conv-72 -1.4562 -0.0470 -1.5502
RB-X-G-E-inf-mw-48 -1.4452 -0.0580 -1.5612
CB-X-G-E-inf-mw-72 -1.4337 -0.0695 -1.5727
RB-X-G-E-conv-48 -1.4627 -0.0405 -1.5437
RB-X-G-E-inf-mw-24 -0.4562 -1.0470 -2.5502
CB-conv-24 -1.4517 -0.0515 -1.5547
CB-X-G-E-inf-mw-48 -1.4447 -0.0585 -1.5617
CB-conv-1 -0.1817 -1.3215 -2.8247
CB-inf-mw-24 -1.5097 -0.0065 -1.4967
RB-X-G-E-conv-24 -1.5047 -0.0015 -1.5017
CB-X-G-E-conv-48 -1.4882 -0.0150 -1.5182
RB-X-G-E-inf-mw-1 -1.4682 -0.0350 -1.5382
CB-inf-mw-1 -1.4632 -0.0400 -1.5432
RB-X-G-E-conv-1 -1.5087 -0.0055 -1.4977
CB-X-G-E-conv-24 -1.4977 -0.0055 -1.5087
CB-X-G-E-conv-1 -1.4842 -0.0190 -1.5222
CB-X-G-E-inf-mw-24 -1.4712 -0.0320 -1.5352
CB-X-G-E-inf-mw-1 -1.4637 -0.0395 -1.5427
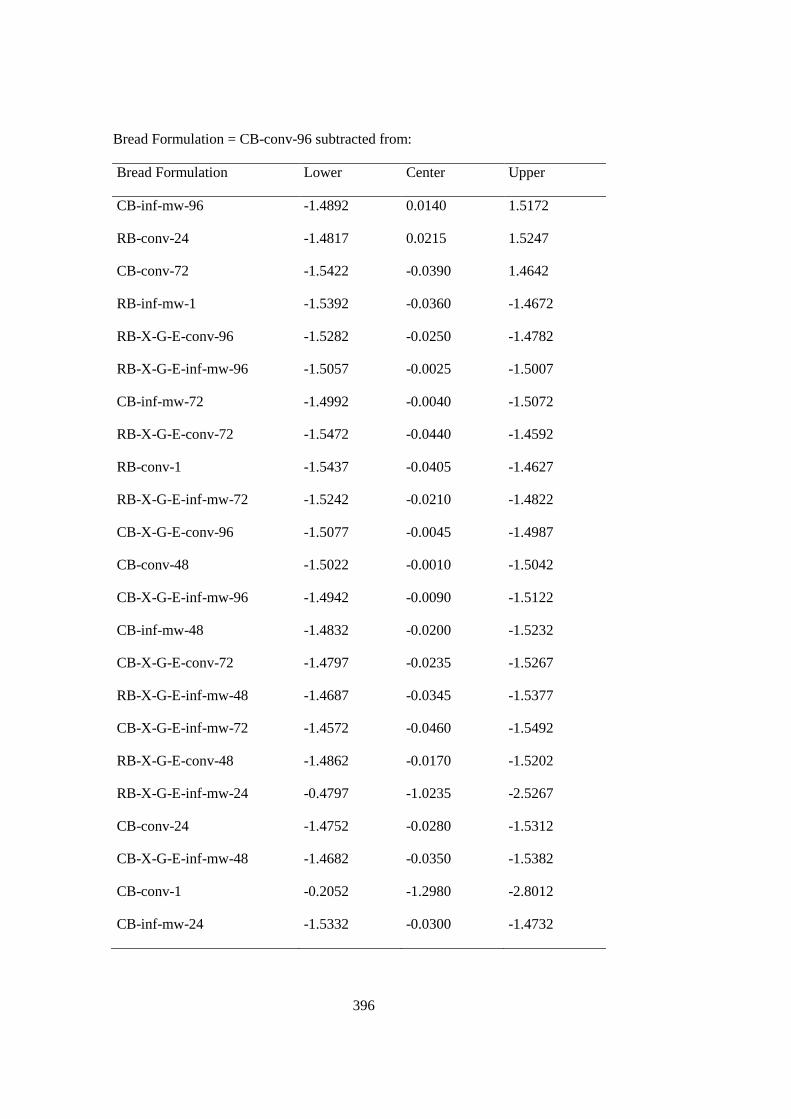
396
Bread Formulation = CB-conv-96 subtracted from:
Bread Formulation Lower Center Upper
CB-inf-mw-96 -1.4892 0.0140 1.5172
RB-conv-24 -1.4817 0.0215 1.5247
CB-conv-72 -1.5422 -0.0390 1.4642
RB-inf-mw-1 -1.5392 -0.0360 -1.4672
RB-X-G-E-conv-96 -1.5282 -0.0250 -1.4782
RB-X-G-E-inf-mw-96 -1.5057 -0.0025 -1.5007
CB-inf-mw-72 -1.4992 -0.0040 -1.5072
RB-X-G-E-conv-72 -1.5472 -0.0440 -1.4592
RB-conv-1 -1.5437 -0.0405 -1.4627
RB-X-G-E-inf-mw-72 -1.5242 -0.0210 -1.4822
CB-X-G-E-conv-96 -1.5077 -0.0045 -1.4987
CB-conv-48 -1.5022 -0.0010 -1.5042
CB-X-G-E-inf-mw-96 -1.4942 -0.0090 -1.5122
CB-inf-mw-48 -1.4832 -0.0200 -1.5232
CB-X-G-E-conv-72 -1.4797 -0.0235 -1.5267
RB-X-G-E-inf-mw-48 -1.4687 -0.0345 -1.5377
CB-X-G-E-inf-mw-72 -1.4572 -0.0460 -1.5492
RB-X-G-E-conv-48 -1.4862 -0.0170 -1.5202
RB-X-G-E-inf-mw-24 -0.4797 -1.0235 -2.5267
CB-conv-24 -1.4752 -0.0280 -1.5312
CB-X-G-E-inf-mw-48 -1.4682 -0.0350 -1.5382
CB-conv-1 -0.2052 -1.2980 -2.8012
CB-inf-mw-24 -1.5332 -0.0300 -1.4732
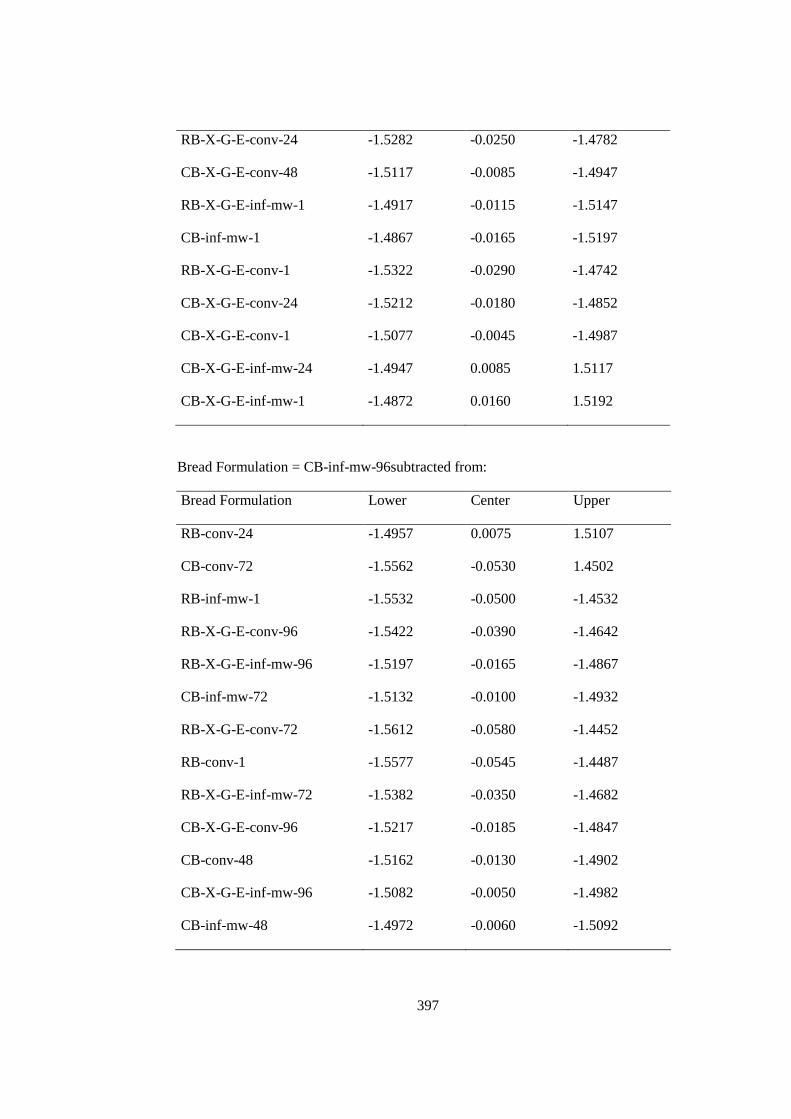
397
RB-X-G-E-conv-24 -1.5282 -0.0250 -1.4782
CB-X-G-E-conv-48 -1.5117 -0.0085 -1.4947
RB-X-G-E-inf-mw-1 -1.4917 -0.0115 -1.5147
CB-inf-mw-1 -1.4867 -0.0165 -1.5197
RB-X-G-E-conv-1 -1.5322 -0.0290 -1.4742
CB-X-G-E-conv-24 -1.5212 -0.0180 -1.4852
CB-X-G-E-conv-1 -1.5077 -0.0045 -1.4987
CB-X-G-E-inf-mw-24 -1.4947 0.0085 1.5117
CB-X-G-E-inf-mw-1 -1.4872 0.0160 1.5192
Bread Formulation = CB-inf-mw-96subtracted from:
Bread Formulation Lower Center Upper
RB-conv-24 -1.4957 0.0075 1.5107
CB-conv-72 -1.5562 -0.0530 1.4502
RB-inf-mw-1 -1.5532 -0.0500 -1.4532
RB-X-G-E-conv-96 -1.5422 -0.0390 -1.4642
RB-X-G-E-inf-mw-96 -1.5197 -0.0165 -1.4867
CB-inf-mw-72 -1.5132 -0.0100 -1.4932
RB-X-G-E-conv-72 -1.5612 -0.0580 -1.4452
RB-conv-1 -1.5577 -0.0545 -1.4487
RB-X-G-E-inf-mw-72 -1.5382 -0.0350 -1.4682
CB-X-G-E-conv-96 -1.5217 -0.0185 -1.4847
CB-conv-48 -1.5162 -0.0130 -1.4902
CB-X-G-E-inf-mw-96 -1.5082 -0.0050 -1.4982
CB-inf-mw-48 -1.4972 -0.0060 -1.5092
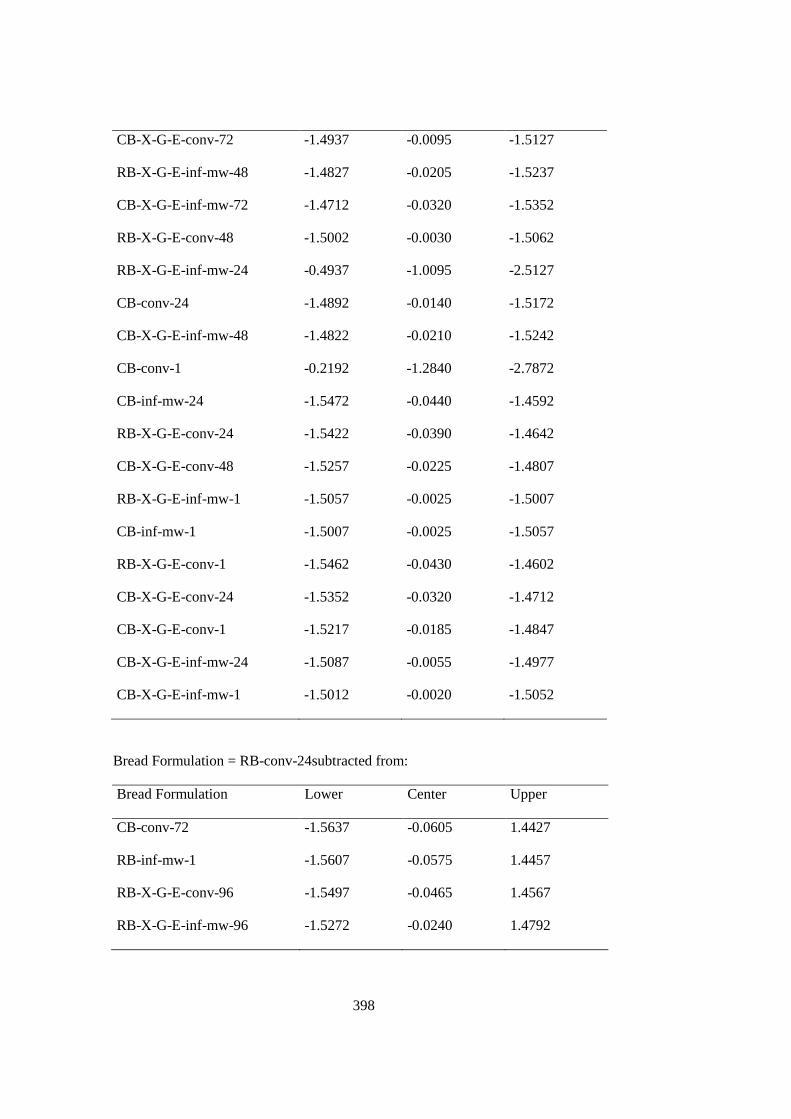
398
CB-X-G-E-conv-72 -1.4937 -0.0095 -1.5127
RB-X-G-E-inf-mw-48 -1.4827 -0.0205 -1.5237
CB-X-G-E-inf-mw-72 -1.4712 -0.0320 -1.5352
RB-X-G-E-conv-48 -1.5002 -0.0030 -1.5062
RB-X-G-E-inf-mw-24 -0.4937 -1.0095 -2.5127
CB-conv-24 -1.4892 -0.0140 -1.5172
CB-X-G-E-inf-mw-48 -1.4822 -0.0210 -1.5242
CB-conv-1 -0.2192 -1.2840 -2.7872
CB-inf-mw-24 -1.5472 -0.0440 -1.4592
RB-X-G-E-conv-24 -1.5422 -0.0390 -1.4642
CB-X-G-E-conv-48 -1.5257 -0.0225 -1.4807
RB-X-G-E-inf-mw-1 -1.5057 -0.0025 -1.5007
CB-inf-mw-1 -1.5007 -0.0025 -1.5057
RB-X-G-E-conv-1 -1.5462 -0.0430 -1.4602
CB-X-G-E-conv-24 -1.5352 -0.0320 -1.4712
CB-X-G-E-conv-1 -1.5217 -0.0185 -1.4847
CB-X-G-E-inf-mw-24 -1.5087 -0.0055 -1.4977
CB-X-G-E-inf-mw-1 -1.5012 -0.0020 -1.5052
Bread Formulation = RB-conv-24subtracted from:
Bread Formulation Lower Center Upper
CB-conv-72 -1.5637 -0.0605 1.4427
RB-inf-mw-1 -1.5607 -0.0575 1.4457
RB-X-G-E-conv-96 -1.5497 -0.0465 1.4567
RB-X-G-E-inf-mw-96 -1.5272 -0.0240 1.4792
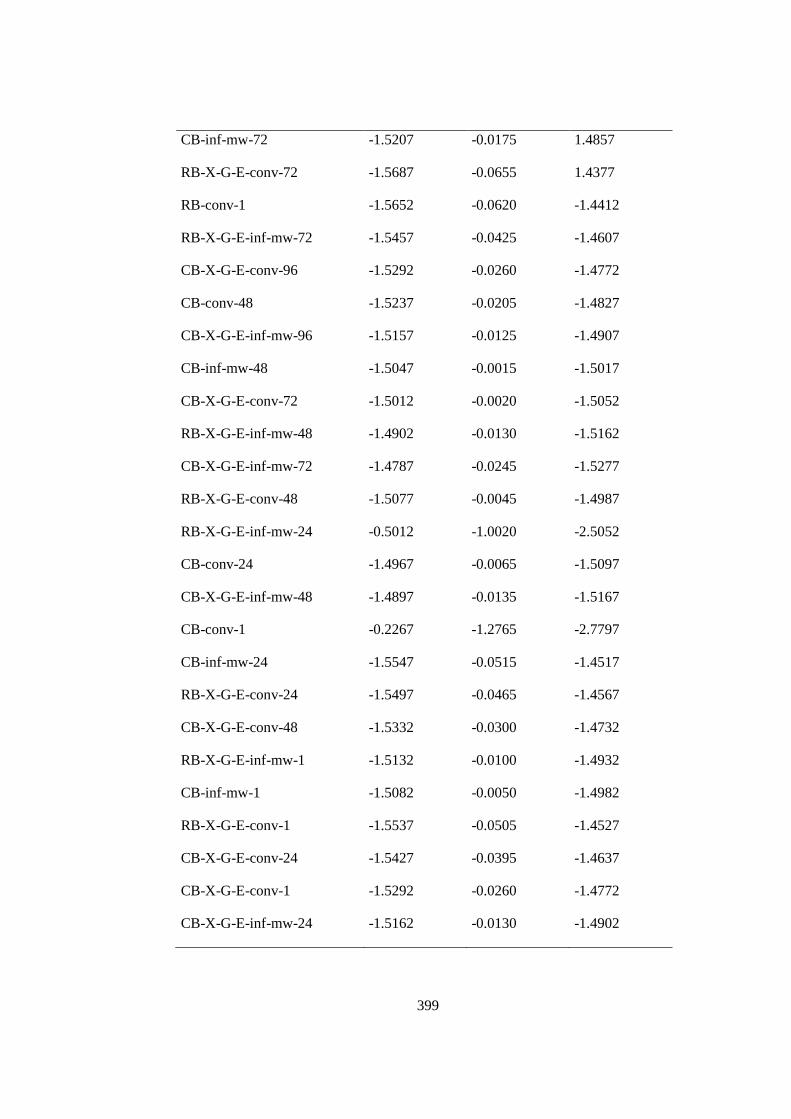
399
CB-inf-mw-72 -1.5207 -0.0175 1.4857
RB-X-G-E-conv-72 -1.5687 -0.0655 1.4377
RB-conv-1 -1.5652 -0.0620 -1.4412
RB-X-G-E-inf-mw-72 -1.5457 -0.0425 -1.4607
CB-X-G-E-conv-96 -1.5292 -0.0260 -1.4772
CB-conv-48 -1.5237 -0.0205 -1.4827
CB-X-G-E-inf-mw-96 -1.5157 -0.0125 -1.4907
CB-inf-mw-48 -1.5047 -0.0015 -1.5017
CB-X-G-E-conv-72 -1.5012 -0.0020 -1.5052
RB-X-G-E-inf-mw-48 -1.4902 -0.0130 -1.5162
CB-X-G-E-inf-mw-72 -1.4787 -0.0245 -1.5277
RB-X-G-E-conv-48 -1.5077 -0.0045 -1.4987
RB-X-G-E-inf-mw-24 -0.5012 -1.0020 -2.5052
CB-conv-24 -1.4967 -0.0065 -1.5097
CB-X-G-E-inf-mw-48 -1.4897 -0.0135 -1.5167
CB-conv-1 -0.2267 -1.2765 -2.7797
CB-inf-mw-24 -1.5547 -0.0515 -1.4517
RB-X-G-E-conv-24 -1.5497 -0.0465 -1.4567
CB-X-G-E-conv-48 -1.5332 -0.0300 -1.4732
RB-X-G-E-inf-mw-1 -1.5132 -0.0100 -1.4932
CB-inf-mw-1 -1.5082 -0.0050 -1.4982
RB-X-G-E-conv-1 -1.5537 -0.0505 -1.4527
CB-X-G-E-conv-24 -1.5427 -0.0395 -1.4637
CB-X-G-E-conv-1 -1.5292 -0.0260 -1.4772
CB-X-G-E-inf-mw-24 -1.5162 -0.0130 -1.4902
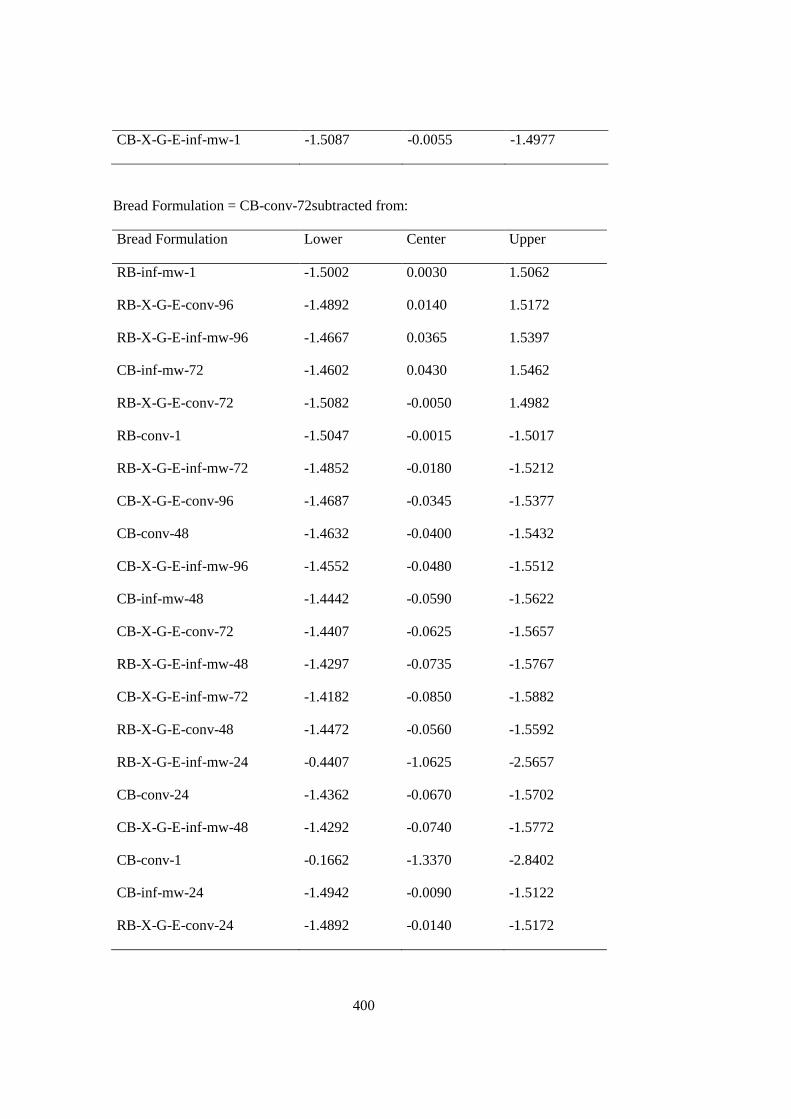
400
CB-X-G-E-inf-mw-1 -1.5087 -0.0055 -1.4977
Bread Formulation = CB-conv-72subtracted from:
Bread Formulation Lower Center Upper
RB-inf-mw-1 -1.5002 0.0030 1.5062
RB-X-G-E-conv-96 -1.4892 0.0140 1.5172
RB-X-G-E-inf-mw-96 -1.4667 0.0365 1.5397
CB-inf-mw-72 -1.4602 0.0430 1.5462
RB-X-G-E-conv-72 -1.5082 -0.0050 1.4982
RB-conv-1 -1.5047 -0.0015 -1.5017
RB-X-G-E-inf-mw-72 -1.4852 -0.0180 -1.5212
CB-X-G-E-conv-96 -1.4687 -0.0345 -1.5377
CB-conv-48 -1.4632 -0.0400 -1.5432
CB-X-G-E-inf-mw-96 -1.4552 -0.0480 -1.5512
CB-inf-mw-48 -1.4442 -0.0590 -1.5622
CB-X-G-E-conv-72 -1.4407 -0.0625 -1.5657
RB-X-G-E-inf-mw-48 -1.4297 -0.0735 -1.5767
CB-X-G-E-inf-mw-72 -1.4182 -0.0850 -1.5882
RB-X-G-E-conv-48 -1.4472 -0.0560 -1.5592
RB-X-G-E-inf-mw-24 -0.4407 -1.0625 -2.5657
CB-conv-24 -1.4362 -0.0670 -1.5702
CB-X-G-E-inf-mw-48 -1.4292 -0.0740 -1.5772
CB-conv-1 -0.1662 -1.3370 -2.8402
CB-inf-mw-24 -1.4942 -0.0090 -1.5122
RB-X-G-E-conv-24 -1.4892 -0.0140 -1.5172
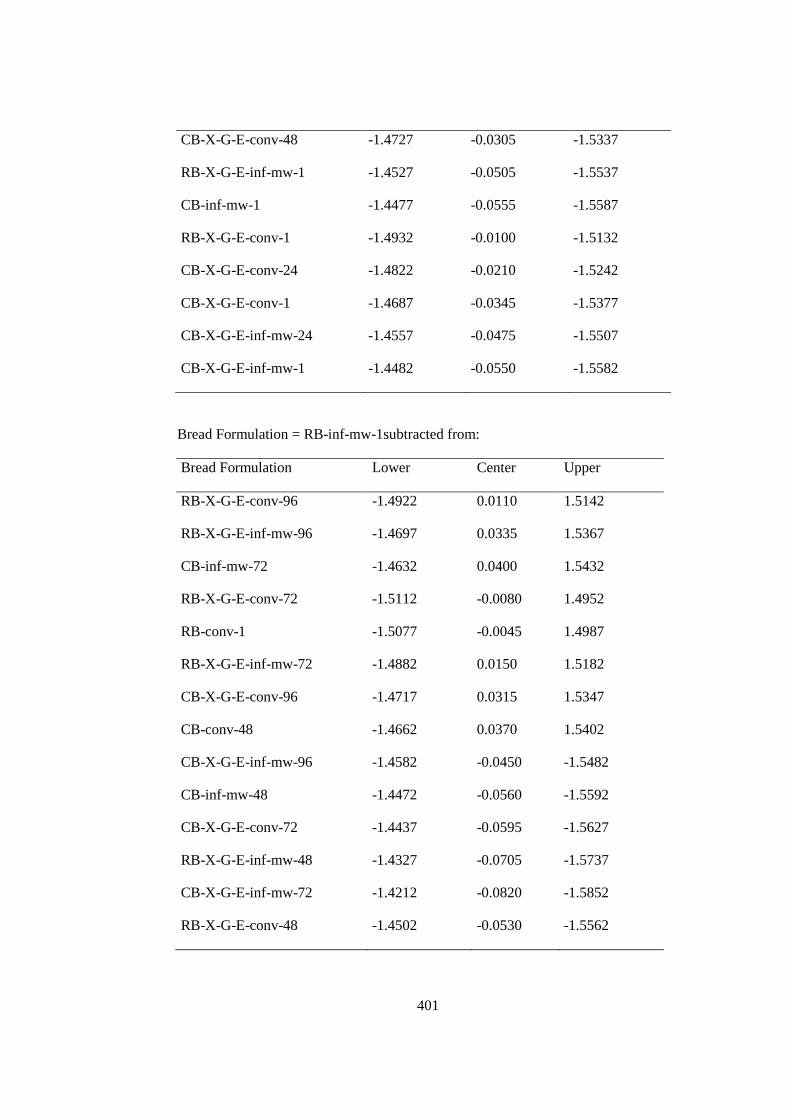
401
CB-X-G-E-conv-48 -1.4727 -0.0305 -1.5337
RB-X-G-E-inf-mw-1 -1.4527 -0.0505 -1.5537
CB-inf-mw-1 -1.4477 -0.0555 -1.5587
RB-X-G-E-conv-1 -1.4932 -0.0100 -1.5132
CB-X-G-E-conv-24 -1.4822 -0.0210 -1.5242
CB-X-G-E-conv-1 -1.4687 -0.0345 -1.5377
CB-X-G-E-inf-mw-24 -1.4557 -0.0475 -1.5507
CB-X-G-E-inf-mw-1 -1.4482 -0.0550 -1.5582
Bread Formulation = RB-inf-mw-1subtracted from:
Bread Formulation Lower Center Upper
RB-X-G-E-conv-96 -1.4922 0.0110 1.5142
RB-X-G-E-inf-mw-96 -1.4697 0.0335 1.5367
CB-inf-mw-72 -1.4632 0.0400 1.5432
RB-X-G-E-conv-72 -1.5112 -0.0080 1.4952
RB-conv-1 -1.5077 -0.0045 1.4987
RB-X-G-E-inf-mw-72 -1.4882 0.0150 1.5182
CB-X-G-E-conv-96 -1.4717 0.0315 1.5347
CB-conv-48 -1.4662 0.0370 1.5402
CB-X-G-E-inf-mw-96 -1.4582 -0.0450 -1.5482
CB-inf-mw-48 -1.4472 -0.0560 -1.5592
CB-X-G-E-conv-72 -1.4437 -0.0595 -1.5627
RB-X-G-E-inf-mw-48 -1.4327 -0.0705 -1.5737
CB-X-G-E-inf-mw-72 -1.4212 -0.0820 -1.5852
RB-X-G-E-conv-48 -1.4502 -0.0530 -1.5562
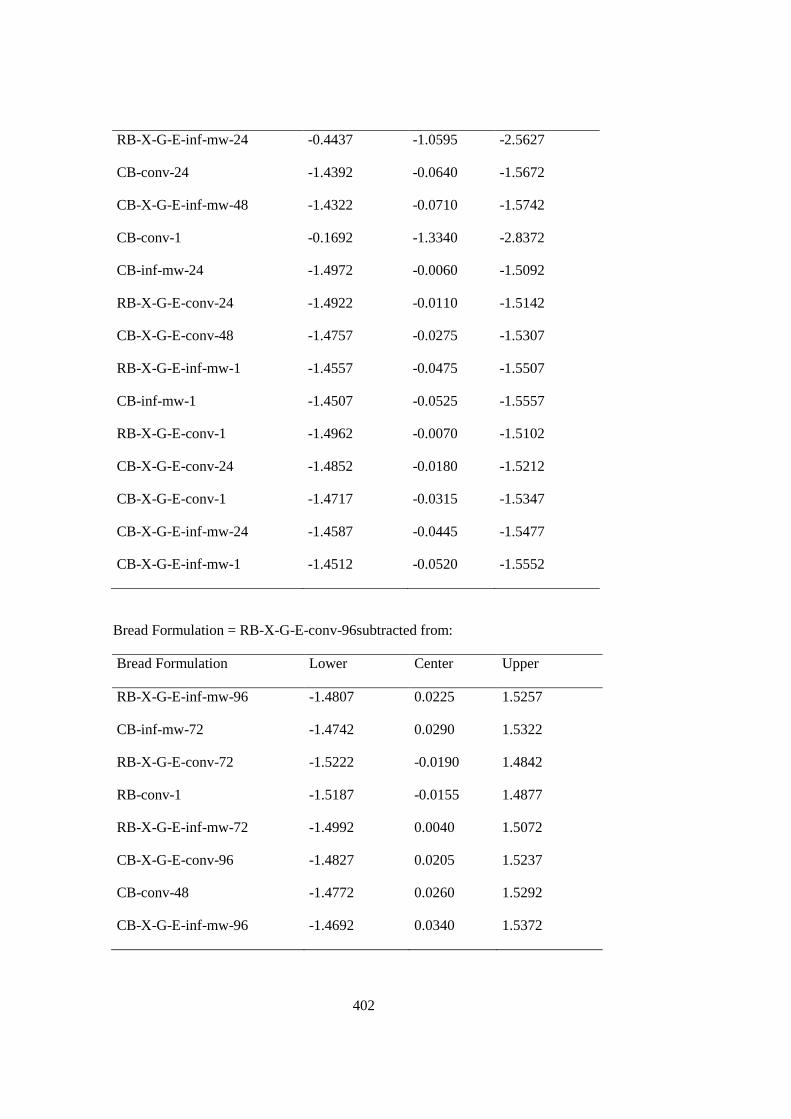
402
RB-X-G-E-inf-mw-24 -0.4437 -1.0595 -2.5627
CB-conv-24 -1.4392 -0.0640 -1.5672
CB-X-G-E-inf-mw-48 -1.4322 -0.0710 -1.5742
CB-conv-1 -0.1692 -1.3340 -2.8372
CB-inf-mw-24 -1.4972 -0.0060 -1.5092
RB-X-G-E-conv-24 -1.4922 -0.0110 -1.5142
CB-X-G-E-conv-48 -1.4757 -0.0275 -1.5307
RB-X-G-E-inf-mw-1 -1.4557 -0.0475 -1.5507
CB-inf-mw-1 -1.4507 -0.0525 -1.5557
RB-X-G-E-conv-1 -1.4962 -0.0070 -1.5102
CB-X-G-E-conv-24 -1.4852 -0.0180 -1.5212
CB-X-G-E-conv-1 -1.4717 -0.0315 -1.5347
CB-X-G-E-inf-mw-24 -1.4587 -0.0445 -1.5477
CB-X-G-E-inf-mw-1 -1.4512 -0.0520 -1.5552
Bread Formulation = RB-X-G-E-conv-96subtracted from:
Bread Formulation Lower Center Upper
RB-X-G-E-inf-mw-96 -1.4807 0.0225 1.5257
CB-inf-mw-72 -1.4742 0.0290 1.5322
RB-X-G-E-conv-72 -1.5222 -0.0190 1.4842
RB-conv-1 -1.5187 -0.0155 1.4877
RB-X-G-E-inf-mw-72 -1.4992 0.0040 1.5072
CB-X-G-E-conv-96 -1.4827 0.0205 1.5237
CB-conv-48 -1.4772 0.0260 1.5292
CB-X-G-E-inf-mw-96 -1.4692 0.0340 1.5372
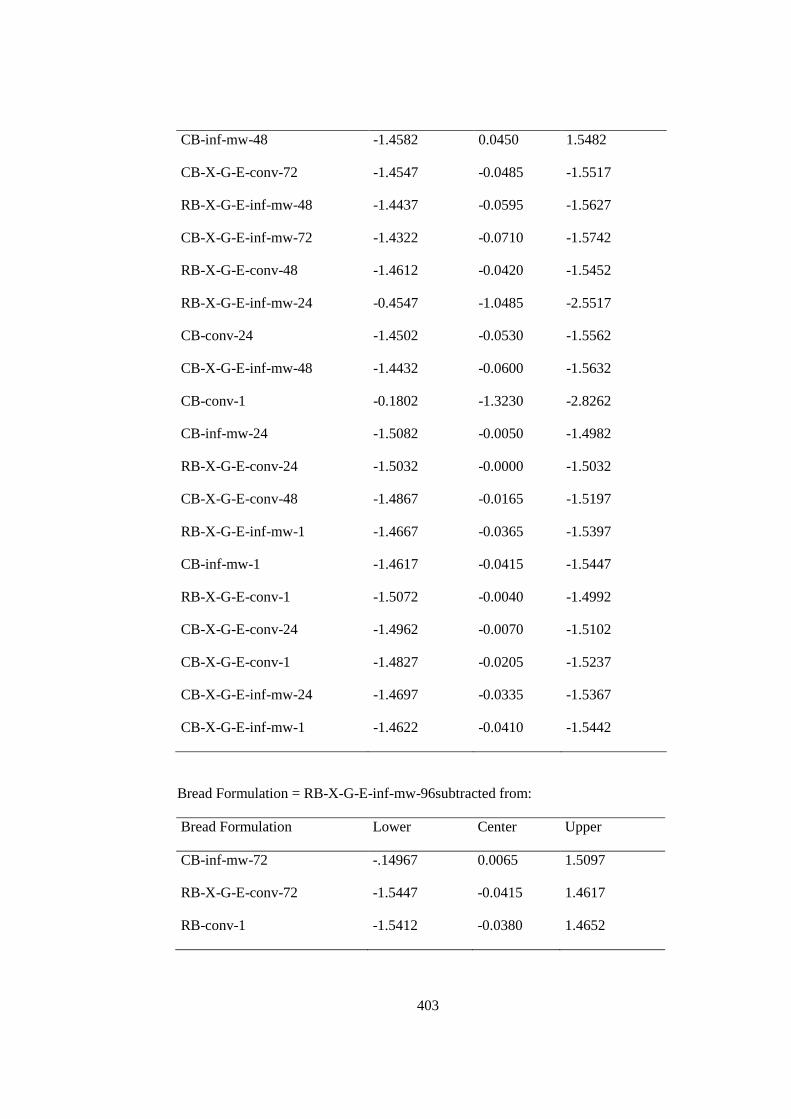
403
CB-inf-mw-48 -1.4582 0.0450 1.5482
CB-X-G-E-conv-72 -1.4547 -0.0485 -1.5517
RB-X-G-E-inf-mw-48 -1.4437 -0.0595 -1.5627
CB-X-G-E-inf-mw-72 -1.4322 -0.0710 -1.5742
RB-X-G-E-conv-48 -1.4612 -0.0420 -1.5452
RB-X-G-E-inf-mw-24 -0.4547 -1.0485 -2.5517
CB-conv-24 -1.4502 -0.0530 -1.5562
CB-X-G-E-inf-mw-48 -1.4432 -0.0600 -1.5632
CB-conv-1 -0.1802 -1.3230 -2.8262
CB-inf-mw-24 -1.5082 -0.0050 -1.4982
RB-X-G-E-conv-24 -1.5032 -0.0000 -1.5032
CB-X-G-E-conv-48 -1.4867 -0.0165 -1.5197
RB-X-G-E-inf-mw-1 -1.4667 -0.0365 -1.5397
CB-inf-mw-1 -1.4617 -0.0415 -1.5447
RB-X-G-E-conv-1 -1.5072 -0.0040 -1.4992
CB-X-G-E-conv-24 -1.4962 -0.0070 -1.5102
CB-X-G-E-conv-1 -1.4827 -0.0205 -1.5237
CB-X-G-E-inf-mw-24 -1.4697 -0.0335 -1.5367
CB-X-G-E-inf-mw-1 -1.4622 -0.0410 -1.5442
Bread Formulation = RB-X-G-E-inf-mw-96subtracted from:
Bread Formulation Lower Center Upper
CB-inf-mw-72 -.14967 0.0065 1.5097
RB-X-G-E-conv-72 -1.5447 -0.0415 1.4617
RB-conv-1 -1.5412 -0.0380 1.4652
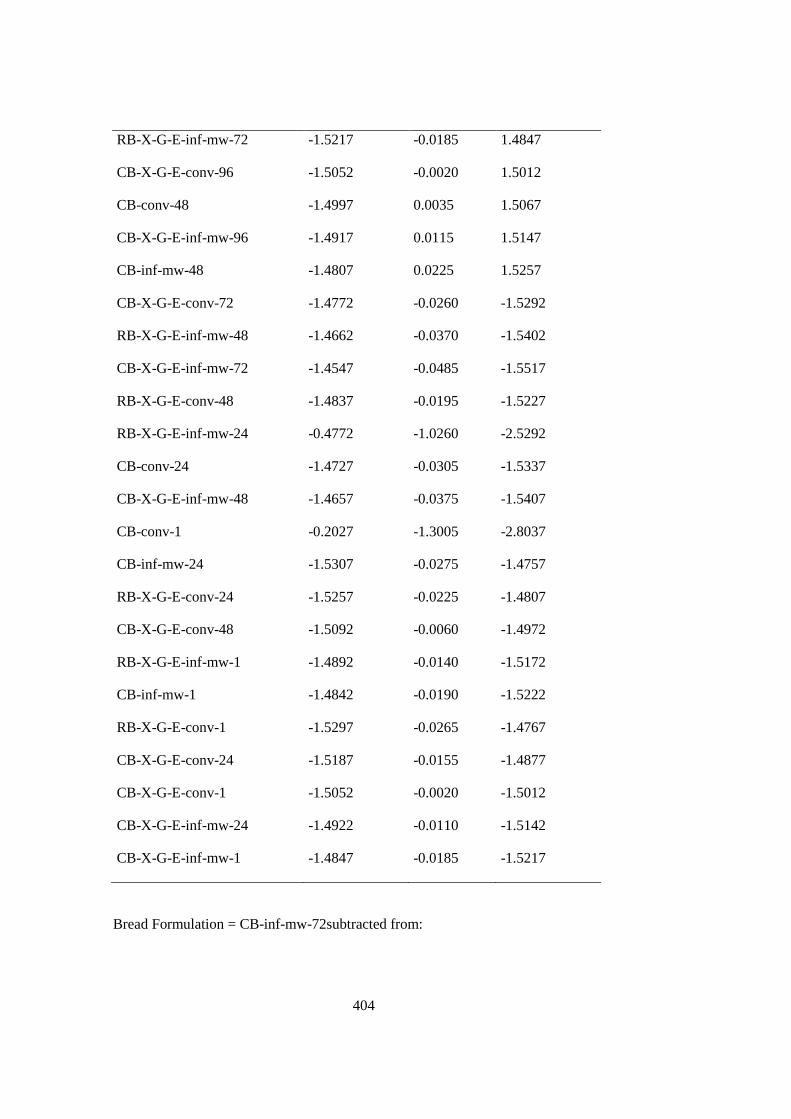
404
RB-X-G-E-inf-mw-72 -1.5217 -0.0185 1.4847
CB-X-G-E-conv-96 -1.5052 -0.0020 1.5012
CB-conv-48 -1.4997 0.0035 1.5067
CB-X-G-E-inf-mw-96 -1.4917 0.0115 1.5147
CB-inf-mw-48 -1.4807 0.0225 1.5257
CB-X-G-E-conv-72 -1.4772 -0.0260 -1.5292
RB-X-G-E-inf-mw-48 -1.4662 -0.0370 -1.5402
CB-X-G-E-inf-mw-72 -1.4547 -0.0485 -1.5517
RB-X-G-E-conv-48 -1.4837 -0.0195 -1.5227
RB-X-G-E-inf-mw-24 -0.4772 -1.0260 -2.5292
CB-conv-24 -1.4727 -0.0305 -1.5337
CB-X-G-E-inf-mw-48 -1.4657 -0.0375 -1.5407
CB-conv-1 -0.2027 -1.3005 -2.8037
CB-inf-mw-24 -1.5307 -0.0275 -1.4757
RB-X-G-E-conv-24 -1.5257 -0.0225 -1.4807
CB-X-G-E-conv-48 -1.5092 -0.0060 -1.4972
RB-X-G-E-inf-mw-1 -1.4892 -0.0140 -1.5172
CB-inf-mw-1 -1.4842 -0.0190 -1.5222
RB-X-G-E-conv-1 -1.5297 -0.0265 -1.4767
CB-X-G-E-conv-24 -1.5187 -0.0155 -1.4877
CB-X-G-E-conv-1 -1.5052 -0.0020 -1.5012
CB-X-G-E-inf-mw-24 -1.4922 -0.0110 -1.5142
CB-X-G-E-inf-mw-1 -1.4847 -0.0185 -1.5217
Bread Formulation = CB-inf-mw-72subtracted from:

405
Bread Formulation Lower Center Upper
RB-X-G-E-conv-72 -1.5512 -0.0480 1.4552
RB-conv-1 -1.5477 -0.0445 1.4587
RB-X-G-E-inf-mw-72 -1.5282 -0.0250 1.4782
CB-X-G-E-conv-96 -1.5117 -0.0085 1.4947
CB-conv-48 -1.5062 -0.0030 1.5002
CB-X-G-E-inf-mw-96 -1.4982 0.0050 1.5082
CB-inf-mw-48 -1.4872 0.0160 1.5192
CB-X-G-E-conv-72 -1.4837 0.0195 1.5227
RB-X-G-E-inf-mw-48 -1.4727 0.0305 1.5337
CB-X-G-E-inf-mw-72 -1.4612 0.0420 1.5452
RB-X-G-E-conv-48 -1.4902 0.0130 1.5162
RB-X-G-E-inf-mw-24 -0.4837 -1.0195 -2.5227
CB-conv-24 -1.4792 -0.0240 -1.5272
CB-X-G-E-inf-mw-48 -1.4722 -0.0310 -1.5342
CB-conv-1 -0.2092 -1.2940 -2.7972
CB-inf-mw-24 -1.5372 -0.0340 -1.4692
RB-X-G-E-conv-24 -1.5322 -0.0290 -1.4742
CB-X-G-E-conv-48 -1.5157 -0.0125 -1.4907
RB-X-G-E-inf-mw-1 -1.4957 -0.0075 -1.5107
CB-inf-mw-1 -1.4907 -0.0125 -1.5157
RB-X-G-E-conv-1 -1.5362 -0.0330 -1.4702
CB-X-G-E-conv-24 -1.5252 -0.0220 -1.4812
CB-X-G-E-conv-1 -1.5117 -0.0085 -1.4947
CB-X-G-E-inf-mw-24 -1.4987 -0.0045 -1.5077
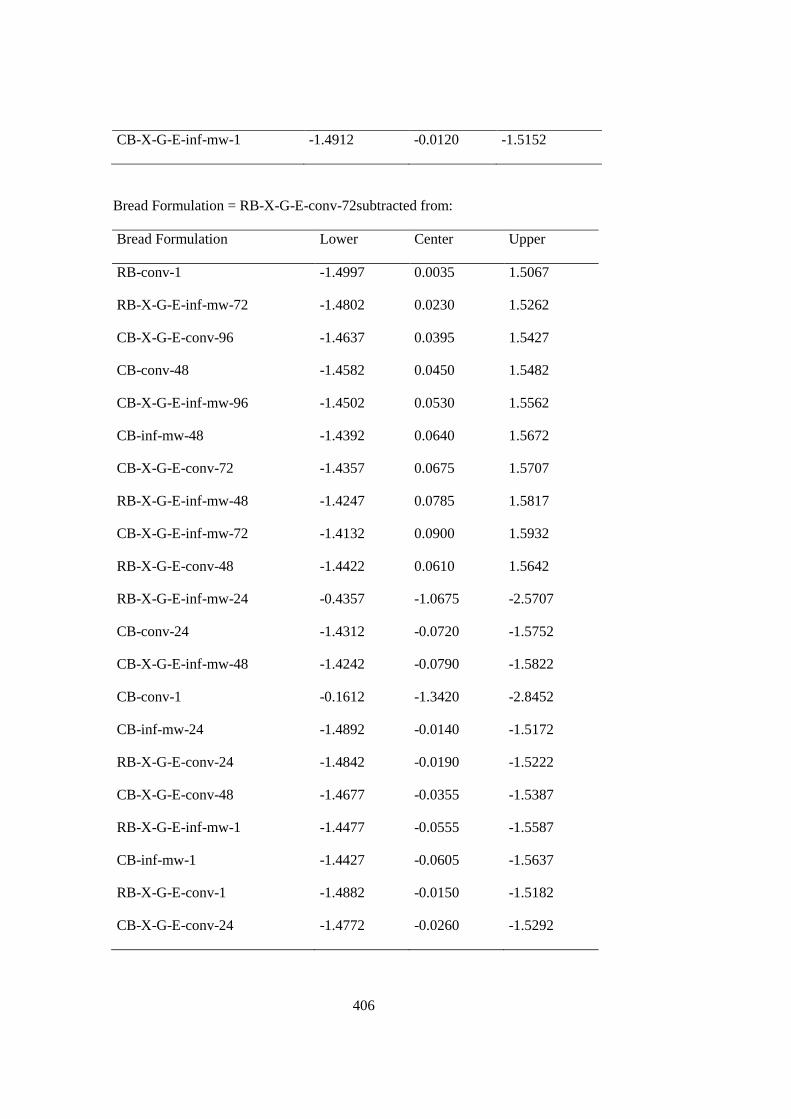
406
CB-X-G-E-inf-mw-1 -1.4912 -0.0120 -1.5152
Bread Formulation = RB-X-G-E-conv-72subtracted from:
Bread Formulation Lower Center Upper
RB-conv-1 -1.4997 0.0035 1.5067
RB-X-G-E-inf-mw-72 -1.4802 0.0230 1.5262
CB-X-G-E-conv-96 -1.4637 0.0395 1.5427
CB-conv-48 -1.4582 0.0450 1.5482
CB-X-G-E-inf-mw-96 -1.4502 0.0530 1.5562
CB-inf-mw-48 -1.4392 0.0640 1.5672
CB-X-G-E-conv-72 -1.4357 0.0675 1.5707
RB-X-G-E-inf-mw-48 -1.4247 0.0785 1.5817
CB-X-G-E-inf-mw-72 -1.4132 0.0900 1.5932
RB-X-G-E-conv-48 -1.4422 0.0610 1.5642
RB-X-G-E-inf-mw-24 -0.4357 -1.0675 -2.5707
CB-conv-24 -1.4312 -0.0720 -1.5752
CB-X-G-E-inf-mw-48 -1.4242 -0.0790 -1.5822
CB-conv-1 -0.1612 -1.3420 -2.8452
CB-inf-mw-24 -1.4892 -0.0140 -1.5172
RB-X-G-E-conv-24 -1.4842 -0.0190 -1.5222
CB-X-G-E-conv-48 -1.4677 -0.0355 -1.5387
RB-X-G-E-inf-mw-1 -1.4477 -0.0555 -1.5587
CB-inf-mw-1 -1.4427 -0.0605 -1.5637
RB-X-G-E-conv-1 -1.4882 -0.0150 -1.5182
CB-X-G-E-conv-24 -1.4772 -0.0260 -1.5292
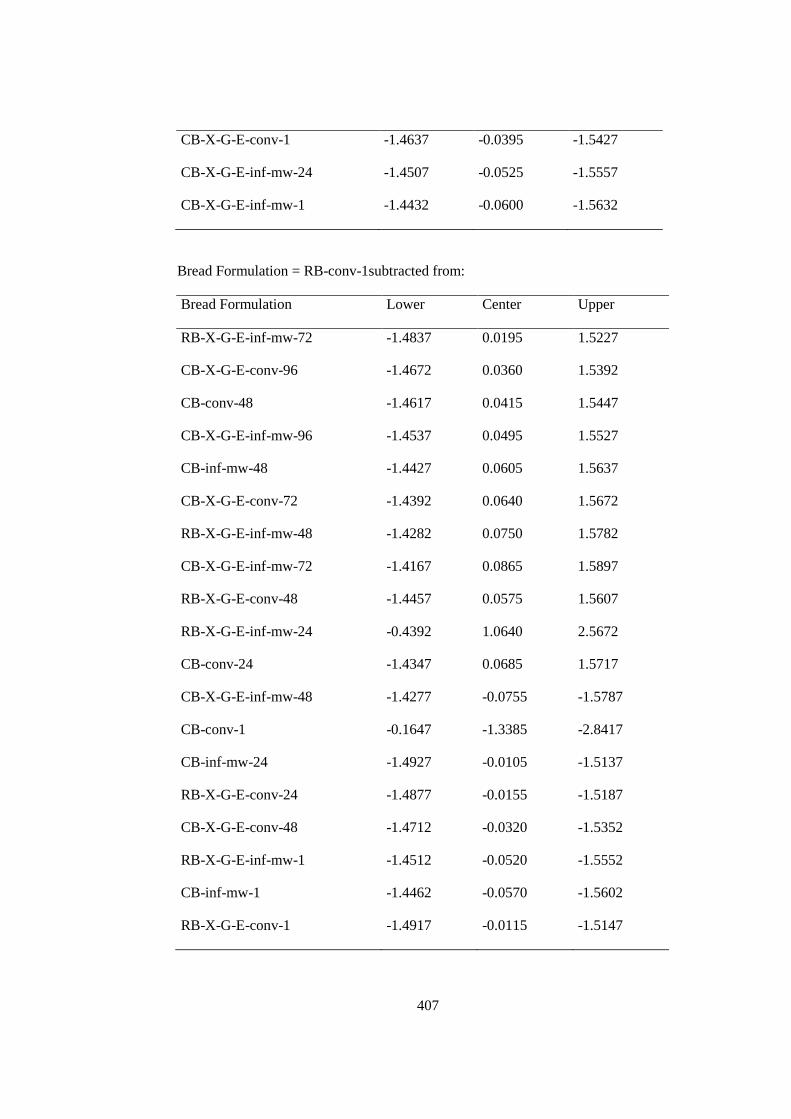
407
CB-X-G-E-conv-1 -1.4637 -0.0395 -1.5427
CB-X-G-E-inf-mw-24 -1.4507 -0.0525 -1.5557
CB-X-G-E-inf-mw-1 -1.4432 -0.0600 -1.5632
Bread Formulation = RB-conv-1subtracted from:
Bread Formulation Lower Center Upper
RB-X-G-E-inf-mw-72 -1.4837 0.0195 1.5227
CB-X-G-E-conv-96 -1.4672 0.0360 1.5392
CB-conv-48 -1.4617 0.0415 1.5447
CB-X-G-E-inf-mw-96 -1.4537 0.0495 1.5527
CB-inf-mw-48 -1.4427 0.0605 1.5637
CB-X-G-E-conv-72 -1.4392 0.0640 1.5672
RB-X-G-E-inf-mw-48 -1.4282 0.0750 1.5782
CB-X-G-E-inf-mw-72 -1.4167 0.0865 1.5897
RB-X-G-E-conv-48 -1.4457 0.0575 1.5607
RB-X-G-E-inf-mw-24 -0.4392 1.0640 2.5672
CB-conv-24 -1.4347 0.0685 1.5717
CB-X-G-E-inf-mw-48 -1.4277 -0.0755 -1.5787
CB-conv-1 -0.1647 -1.3385 -2.8417
CB-inf-mw-24 -1.4927 -0.0105 -1.5137
RB-X-G-E-conv-24 -1.4877 -0.0155 -1.5187
CB-X-G-E-conv-48 -1.4712 -0.0320 -1.5352
RB-X-G-E-inf-mw-1 -1.4512 -0.0520 -1.5552
CB-inf-mw-1 -1.4462 -0.0570 -1.5602
RB-X-G-E-conv-1 -1.4917 -0.0115 -1.5147
408
CB-X-G-E-conv-24 -1.4807 -0.0225 -1.5257
CB-X-G-E-conv-1 -1.4672 -0.0360 -1.5392
CB-X-G-E-inf-mw-24 -1.4542 -0.0490 -1.5522
CB-X-G-E-inf-mw-1 -1.4467 -0.0565 -1.5597
Bread Formulation = RB-X-G-E-inf-mw-72subtracted from:
Bread Formulation Lower Center Upper
CB-X-G-E-conv-96 -1.4867 0.0165 1.5197
CB-conv-48 -1.4812 0.0220 1.5252
CB-X-G-E-inf-mw-96 -1.4732 0.0300 1.5332
CB-inf-mw-48 -1.4622 0.0410 1.5442
CB-X-G-E-conv-72 -1.4587 0.0445 1.5477
RB-X-G-E-inf-mw-48 -1.4477 0.0555 1.5587
CB-X-G-E-inf-mw-72 -1.4362 0.0670 1.5702
RB-X-G-E-conv-48 -1.4652 0.0380 1.5412
RB-X-G-E-inf-mw-24 -0.4587 1.0445 2.5477
CB-conv-24 -1.4542 0.0490 1.5522
CB-X-G-E-inf-mw-48 -1.4472 -0.0560 -1.5592
CB-conv-1 -0.1842 -1.3190 -2.8222
CB-inf-mw-24 -1.5122 -0.0090 -1.4942
RB-X-G-E-conv-24 -1.5072 -0.0040 -1.4992
CB-X-G-E-conv-48 -1.4907 -0.0125 -1.5157
RB-X-G-E-inf-mw-1 -1.4707 -0.0325 -1.5357
CB-inf-mw-1 -1.4657 -0.0375 -1.5407
RB-X-G-E-conv-1 -1.5112 -0.0080 -1.4952
409
CB-X-G-E-conv-24 -1.5002 -0.0030 -1.5062
CB-X-G-E-conv-1 -1.4867 -0.0165 -1.5197
CB-X-G-E-inf-mw-24 -1.4737 -0.0295 -1.5327
CB-X-G-E-inf-mw-1 -1.4662 -0.0370 -1.5402
Bread Formulation = CB-X-G-E-conv-96subtracted from:
Bread Formulation Lower Center Upper
CB-conv-48 -1.4977 0.0055 1.5087
CB-X-G-E-inf-mw-96 -1.4897 0.0135 1.5167
CB-inf-mw-48 -1.4787 0.0245 1.5277
CB-X-G-E-conv-72 -1.4752 0.0280 1.5312
RB-X-G-E-inf-mw-48 -1.4642 0.0390 1.5422
CB-X-G-E-inf-mw-72 -1.4527 0.0505 1.5537
RB-X-G-E-conv-48 -1.4817 0.0215 1.5247
RB-X-G-E-inf-mw-24 -0.4752 1.0280 2.5312
CB-conv-24 -1.4707 0.0325 1.5357
CB-X-G-E-inf-mw-48 -1.4637 -0.0395 -1.5427
CB-conv-1 -0.2007 -1.3025 -2.8057
CB-inf-mw-24 -1.5287 -0.0255 -1.4777
RB-X-G-E-conv-24 -1.5237 -0.0205 -1.4827
CB-X-G-E-conv-48 -1.5072 -0.0040 -1.4992
RB-X-G-E-inf-mw-1 -1.4872 -0.0160 -1.5192
CB-inf-mw-1 -1.4822 -0.0210 -1.5242
RB-X-G-E-conv-1 -1.5277 -0.0245 -1.4787
CB-X-G-E-conv-24 -1.5167 -0.0135 -1.4897
CB-X-G-E-conv-1 -1.5032 -0.0000 -1.5032

410
CB-X-G-E-inf-mw-24 -1.4902 -0.0130 -1.5162
CB-X-G-E-inf-mw-1 -1.4827 -0.0205 -1.5237
Bread Formulation = CB-conv-48subtracted from:
Bread Formulation Lower Center Upper
CB-X-G-E-inf-mw-96 -1.4952 0.0080 1.5112
CB-inf-mw-48 -1.4842 0.0190 1.5222
CB-X-G-E-conv-72 -1.4807 0.0225 1.5257
RB-X-G-E-inf-mw-48 -1.4697 0.0335 1.5367
CB-X-G-E-inf-mw-72 -1.4582 0.0450 1.5482
RB-X-G-E-conv-48 -1.4872 0.0160 1.5192
RB-X-G-E-inf-mw-24 -0.4807 1.0225 2.5257
CB-conv-24 -1.4762 0.0270 1.5302
CB-X-G-E-inf-mw-48 -1.4692 -0.0340 -1.5372
CB-conv-1 -0.2062 -1.2970 -2.8002
CB-inf-mw-24 -1.5342 -0.0310 -1.4722
RB-X-G-E-conv-24 -1.5292 -0.0260 -1.4772
CB-X-G-E-conv-48 -1.5127 -0.0095 -1.4937
RB-X-G-E-inf-mw-1 -1.4927 -0.0105 -1.5137
CB-inf-mw-1 -1.4877 -0.0155 -1.5187
RB-X-G-E-conv-1 -1.5332 -0.0300 -1.4732
CB-X-G-E-conv-24 -1.5222 -0.0190 -1.4842
CB-X-G-E-conv-1 -1.5087 -0.0055 -1.4977
CB-X-G-E-inf-mw-24 -1.4957 -0.0075 -1.5107
CB-X-G-E-inf-mw-1 -1.4882 -0.0150 -1.5182
411
Bread Formulation = CB-X-G-E-inf-mw-96subtracted from:
Bread Formulation Lower Center Upper
CB-inf-mw-48 -1.4922 0.0110 1.5142
CB-X-G-E-conv-72 -1.4887 0.0145 1.5177
RB-X-G-E-inf-mw-48 -1.4777 0.0255 1.5287
CB-X-G-E-inf-mw-72 -1.4662 0.0370 1.5402
RB-X-G-E-conv-48 -1.4952 0.0080 1.5112
RB-X-G-E-inf-mw-24 -0.4887 1.0145 2.5177
CB-conv-24 -1.4842 0.0190 1.5222
CB-X-G-E-inf-mw-48 -1.4772 0.0260 1.5292
CB-conv-1 -0.2142 -1.2890 -2.7922
CB-inf-mw-24 -1.5422 -0.0390 -1.4642
RB-X-G-E-conv-24 -1.5372 -0.0340 -1.4692
CB-X-G-E-conv-48 -1.5207 -0.0175 -1.4857
RB-X-G-E-inf-mw-1 -1.5007 -0.0025 -1.5057
CB-inf-mw-1 -1.4957 -0.0075 -1.5107
RB-X-G-E-conv-1 -1.5412 -0.0380 -1.4652
CB-X-G-E-conv-24 -1.5302 -0.0270 -1.4762
CB-X-G-E-conv-1 -1.5167 -0.0135 -1.4897
CB-X-G-E-inf-mw-24 -1.5037 -0.0005 -1.5027
CB-X-G-E-inf-mw-1 -1.4962 -0.0070 -1.5102
Bread Formulation = CB-inf-mw-48subtracted from:
Bread Formulation Lower Center Upper
CB-X-G-E-conv-72 -1.4997 0.0035 1.5067
412
RB-X-G-E-inf-mw-48 -1.4887 0.0145 1.5177
CB-X-G-E-inf-mw-72 -1.4772 0.0260 1.5292
RB-X-G-E-conv-48 -1.5062 -0.0030 1.5002
RB-X-G-E-inf-mw-24 -0.4997 10.035 2.5067
CB-conv-24 -1.4952 0.0080 1.5112
CB-X-G-E-inf-mw-48 -1.4882 0.0150 1.5182
CB-conv-1 -0.2252 -1.2780 -2.7812
CB-inf-mw-24 -1.5532 -0.0500 -1.4532
RB-X-G-E-conv-24 -1.5482 -0.0450 -1.4582
CB-X-G-E-conv-48 -1.5317 -0.0285 -1.4747
RB-X-G-E-inf-mw-1 -1.5117 -0.0085 -1.4947
CB-inf-mw-1 -1.5067 -0.0035 -1.4997
RB-X-G-E-conv-1 -1.5522 -0.0490 -1.4542
CB-X-G-E-conv-24 -1.5412 -0.0380 -1.4652
CB-X-G-E-conv-1 -1.5277 -0.0245 -1.4787
CB-X-G-E-inf-mw-24 -1.5147 -0.0115 -1.4917
CB-X-G-E-inf-mw-1 -1.5072 -0.0040 -1.4992
Bread Formulation = CB-X-G-E-conv-72subtracted from:
Bread Formulation Lower Center Upper
RB-X-G-E-inf-mw-48 -1.4922 0.0110 1.5142
CB-X-G-E-inf-mw-72 -1.4807 0.0225 1.5257
RB-X-G-E-conv-48 -1.5097 -0.0065 1.4967
RB-X-G-E-inf-mw-24 -0.5032 1.0000 2.5032
CB-conv-24 -1.4987 0.0045 1.5077
413
CB-X-G-E-inf-mw-48 -1.4917 0.0115 1.5147
CB-conv-1 -0.2287 1.2745 2.7777
CB-inf-mw-24 -1.5567 -0.0535 -1.4497
RB-X-G-E-conv-24 -1.5517 -0.0485 -1.4547
CB-X-G-E-conv-48 -1.5352 -0.0320 -1.4712
RB-X-G-E-inf-mw-1 -1.5152 -0.0120 -1.4912
CB-inf-mw-1 -1.5102 -0.0070 -1.4962
RB-X-G-E-conv-1 -1.5557 -0.0525 -1.4507
CB-X-G-E-conv-24 -1.5447 -0.0415 -1.4617
CB-X-G-E-conv-1 -1.5312 -0.0280 -1.4752
CB-X-G-E-inf-mw-24 -1.5182 -0.0150 -1.4882
CB-X-G-E-inf-mw-1 -1.5107 -0.0075 -1.4957
Bread Formulation = RB-X-G-E-inf-mw-48subtracted from:
Bread Formulation Lower Center Upper
CB-X-G-E-inf-mw-72 -1.4917 0.0115 1.5147
RB-X-G-E-conv-48 -1.5207 -0.0175 1.4857
RB-X-G-E-inf-mw-24 -0.5142 0.9890 2.4922
CB-conv-24 -1.5097 -0.0065 1.4967
CB-X-G-E-inf-mw-48 -1.5027 0.0005 1.5037
CB-conv-1 -0.2397 1.2635 2.7667
CB-inf-mw-24 -1.5677 -0.0645 -1.4387
RB-X-G-E-conv-24 -1.5627 -0.0595 -1.4437
CB-X-G-E-conv-48 -1.5462 -0.0430 -1.4602
RB-X-G-E-inf-mw-1 -1.5262 -0.0230 -1.4802
414
CB-inf-mw-1 -1.5212 -0.0180 -1.4852
RB-X-G-E-conv-1 -1.5667 -0.0635 -1.4397
CB-X-G-E-conv-24 -1.5557 -0.0525 -1.4507
CB-X-G-E-conv-1 -1.5422 -0.0390 -1.4642
CB-X-G-E-inf-mw-24 -1.5292 -0.0260 -1.4772
CB-X-G-E-inf-mw-1 -1.5217 -0.0185 -1.4847
Bread Formulation = CB-X-G-E-inf-mw-72subtracted from:
Bread Formulation Lower Center Upper
RB-X-G-E-conv-48 -1.5322 -0.0290 1.4742
RB-X-G-E-inf-mw-24 -0.5257 0.9775 2.4807
CB-conv-24 -1.5212 -0.0180 1.4852
CB-X-G-E-inf-mw-48 -1.5142 -0.0110 1.4922
CB-conv-1 -0.2512 1.2520 2.7552
CB-inf-mw-24 -1.5792 -0.0760 1.4272
RB-X-G-E-conv-24 -1.5742 -0.0710 -1.4322
CB-X-G-E-conv-48 -1.5577 -0.0545 -1.4487
RB-X-G-E-inf-mw-1 -1.5377 -0.0345 -1.4687
CB-inf-mw-1 -1.5327 -0.0295 -1.4737
RB-X-G-E-conv-1 -1.5782 -0.0750 -1.4282
CB-X-G-E-conv-24 -1.5672 -0.0640 -1.4392
CB-X-G-E-conv-1 -1.5537 -0.0505 -1.4527
CB-X-G-E-inf-mw-24 -1.5407 -0.0375 -1.4657
CB-X-G-E-inf-mw-1 -1.5332 -0.0300 -1.4732
415
Bread Formulation = RB-X-G-E-conv-48subtracted from:
Bread Formulation Lower Center Upper
RB-X-G-E-inf-mw-24 -0.4967 1.0065 2.5097
CB-conv-24 -1.4922 0.0110 1.5142
CB-X-G-E-inf-mw-48 -1.4852 0.0180 1.5212
CB-conv-1 -0.2222 1.2810 2.7842
CB-inf-mw-24 -1.5502 -0.0470 -1.4562
RB-X-G-E-conv-24 -1.5452 -0.0420 -1.4612
CB-X-G-E-conv-48 -1.5287 -0.0255 -1.4777
RB-X-G-E-inf-mw-1 -1.5087 -0.0055 -1.4977
CB-inf-mw-1 -1.5037 -0.0005 -1.5027
RB-X-G-E-conv-1 -1.5492 -0.0460 -1.4572
CB-X-G-E-conv-24 -1.5382 -0.0350 -1.4682
CB-X-G-E-conv-1 -1.5247 -0.0215 -1.4817
CB-X-G-E-inf-mw-24 -1.5117 -0.0085 -1.4947
CB-X-G-E-inf-mw-1 -1.5042 -0.0010 -1.5022
Bread Formulation = RB-X-G-E-inf-mw-24subtracted from:
Bread Formulation Lower Center Upper
CB-conv-24 -2.4987 -0.9955 0.5077
CB-X-G-E-inf-mw-48 -2.4917 -0.9885 0.5147
CB-conv-1 -1.2287 0.2745 1.7777
CB-inf-mw-24 -2.5567 -1.0535 0.4497
RB-X-G-E-conv-24 -2.5517 -1.0485 0.4547
CB-X-G-E-conv-48 -2.5352 -1.0320 0.4712
416
RB-X-G-E-inf-mw-1 -2.5152 -1.0120 -0.4912
CB-inf-mw-1 -2.5102 -1.0070 -0.4962
RB-X-G-E-conv-1 -2.5557 -1.0525 -0.4507
CB-X-G-E-conv-24 -2.5447 -1.0415 -0.4617
CB-X-G-E-conv-1 -2.5312 -1.0280 -0.4752
CB-X-G-E-inf-mw-24 -2.5182 -1.0150 -0.4882
CB-X-G-E-inf-mw-1 -2.5107 -1.0075 -0.4957
Bread Formulation = CB-conv-24subtracted from:
Bread Formulation Lower Center Upper
CB-X-G-E-inf-mw-48 -1.4962 0.0070 1.5102
CB-conv-1 -0.2332 1.2700 2.7732
CB-inf-mw-24 -1.5612 -0.0580 1.4452
RB-X-G-E-conv-24 -1.5562 -0.0530 1.4502
CB-X-G-E-conv-48 -1.5397 -0.0365 1.4667
RB-X-G-E-inf-mw-1 -1.5197 -0.0165 -1.4867
CB-inf-mw-1 -1.5147 -0.0115 -1.4917
RB-X-G-E-conv-1 -1.5602 -0.0570 -1.4462
CB-X-G-E-conv-24 -1.5492 -0.0460 -1.4572
CB-X-G-E-conv-1 -1.5357 -0.0325 -1.4707
CB-X-G-E-inf-mw-24 -1.5227 -0.0195 -1.4837
CB-X-G-E-inf-mw-1 -1.5152 -0.0120 -1.4912
Bread Formulation = CB-X-G-E-inf-mw-48subtracted from:
Bread Formulation Lower Center Upper
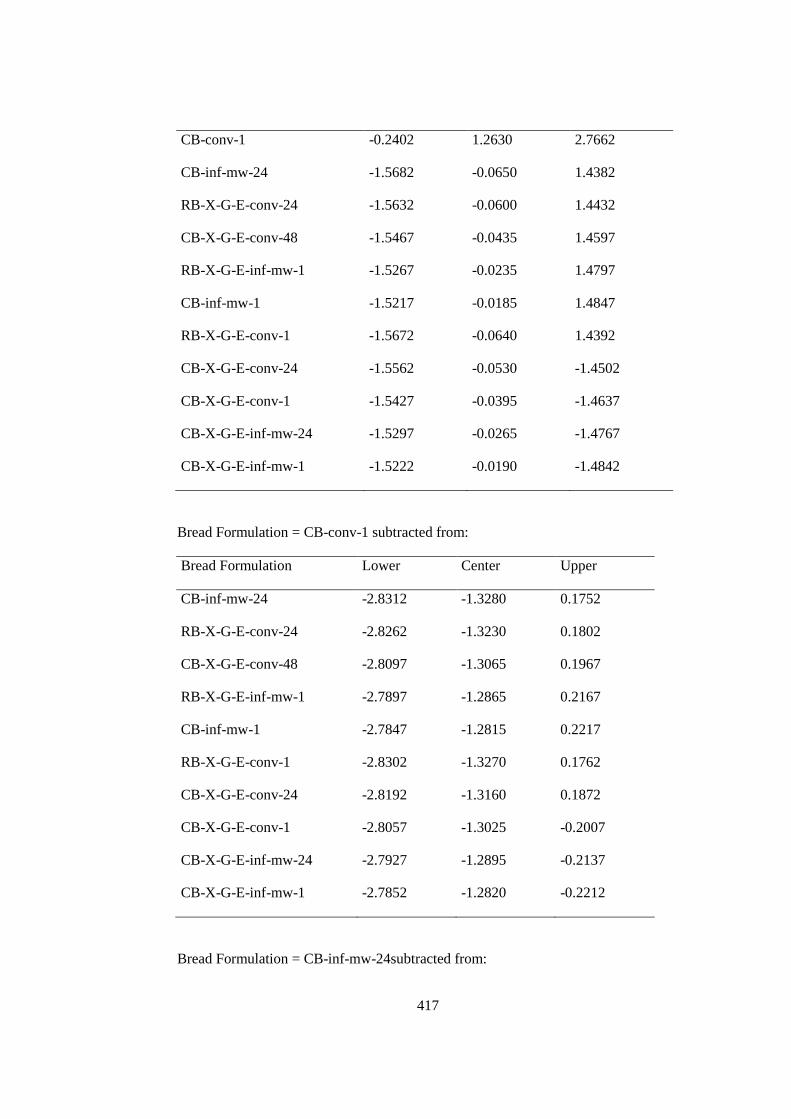
417
CB-conv-1 -0.2402 1.2630 2.7662
CB-inf-mw-24 -1.5682 -0.0650 1.4382
RB-X-G-E-conv-24 -1.5632 -0.0600 1.4432
CB-X-G-E-conv-48 -1.5467 -0.0435 1.4597
RB-X-G-E-inf-mw-1 -1.5267 -0.0235 1.4797
CB-inf-mw-1 -1.5217 -0.0185 1.4847
RB-X-G-E-conv-1 -1.5672 -0.0640 1.4392
CB-X-G-E-conv-24 -1.5562 -0.0530 -1.4502
CB-X-G-E-conv-1 -1.5427 -0.0395 -1.4637
CB-X-G-E-inf-mw-24 -1.5297 -0.0265 -1.4767
CB-X-G-E-inf-mw-1 -1.5222 -0.0190 -1.4842
Bread Formulation = CB-conv-1 subtracted from:
Bread Formulation Lower Center Upper
CB-inf-mw-24 -2.8312 -1.3280 0.1752
RB-X-G-E-conv-24 -2.8262 -1.3230 0.1802
CB-X-G-E-conv-48 -2.8097 -1.3065 0.1967
RB-X-G-E-inf-mw-1 -2.7897 -1.2865 0.2167
CB-inf-mw-1 -2.7847 -1.2815 0.2217
RB-X-G-E-conv-1 -2.8302 -1.3270 0.1762
CB-X-G-E-conv-24 -2.8192 -1.3160 0.1872
CB-X-G-E-conv-1 -2.8057 -1.3025 -0.2007
CB-X-G-E-inf-mw-24 -2.7927 -1.2895 -0.2137
CB-X-G-E-inf-mw-1 -2.7852 -1.2820 -0.2212
Bread Formulation = CB-inf-mw-24subtracted from:
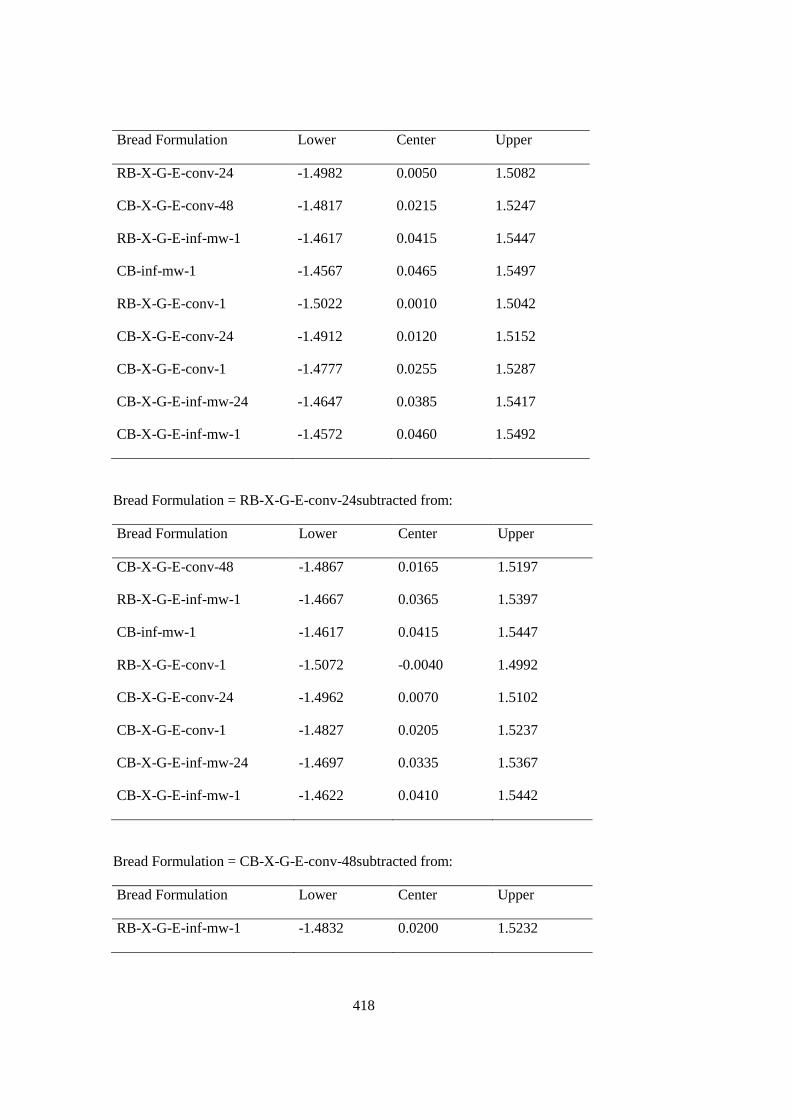
418
Bread Formulation Lower Center Upper
RB-X-G-E-conv-24 -1.4982 0.0050 1.5082
CB-X-G-E-conv-48 -1.4817 0.0215 1.5247
RB-X-G-E-inf-mw-1 -1.4617 0.0415 1.5447
CB-inf-mw-1 -1.4567 0.0465 1.5497
RB-X-G-E-conv-1 -1.5022 0.0010 1.5042
CB-X-G-E-conv-24 -1.4912 0.0120 1.5152
CB-X-G-E-conv-1 -1.4777 0.0255 1.5287
CB-X-G-E-inf-mw-24 -1.4647 0.0385 1.5417
CB-X-G-E-inf-mw-1 -1.4572 0.0460 1.5492
Bread Formulation = RB-X-G-E-conv-24subtracted from:
Bread Formulation Lower Center Upper
CB-X-G-E-conv-48 -1.4867 0.0165 1.5197
RB-X-G-E-inf-mw-1 -1.4667 0.0365 1.5397
CB-inf-mw-1 -1.4617 0.0415 1.5447
RB-X-G-E-conv-1 -1.5072 -0.0040 1.4992
CB-X-G-E-conv-24 -1.4962 0.0070 1.5102
CB-X-G-E-conv-1 -1.4827 0.0205 1.5237
CB-X-G-E-inf-mw-24 -1.4697 0.0335 1.5367
CB-X-G-E-inf-mw-1 -1.4622 0.0410 1.5442
Bread Formulation = CB-X-G-E-conv-48subtracted from:
Bread Formulation Lower Center Upper
RB-X-G-E-inf-mw-1 -1.4832 0.0200 1.5232
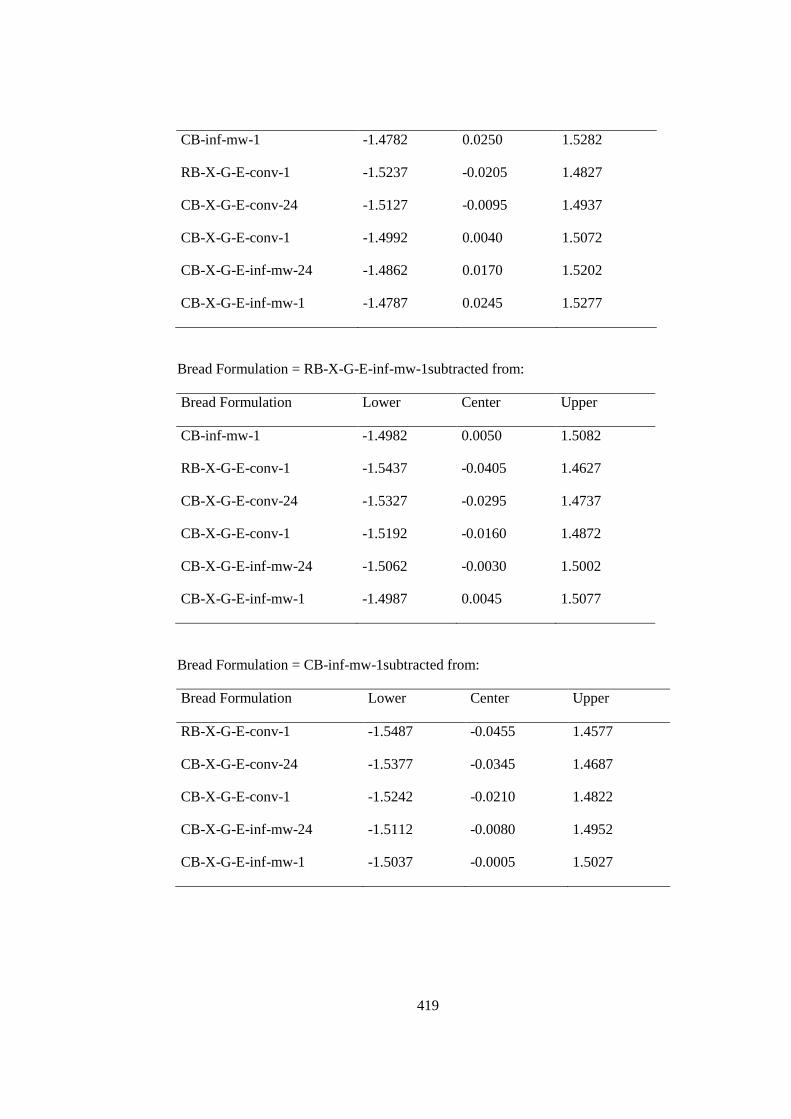
419
CB-inf-mw-1 -1.4782 0.0250 1.5282
RB-X-G-E-conv-1 -1.5237 -0.0205 1.4827
CB-X-G-E-conv-24 -1.5127 -0.0095 1.4937
CB-X-G-E-conv-1 -1.4992 0.0040 1.5072
CB-X-G-E-inf-mw-24 -1.4862 0.0170 1.5202
CB-X-G-E-inf-mw-1 -1.4787 0.0245 1.5277
Bread Formulation = RB-X-G-E-inf-mw-1subtracted from:
Bread Formulation Lower Center Upper
CB-inf-mw-1 -1.4982 0.0050 1.5082
RB-X-G-E-conv-1 -1.5437 -0.0405 1.4627
CB-X-G-E-conv-24 -1.5327 -0.0295 1.4737
CB-X-G-E-conv-1 -1.5192 -0.0160 1.4872
CB-X-G-E-inf-mw-24 -1.5062 -0.0030 1.5002
CB-X-G-E-inf-mw-1 -1.4987 0.0045 1.5077
Bread Formulation = CB-inf-mw-1subtracted from:
Bread Formulation Lower Center Upper
RB-X-G-E-conv-1 -1.5487 -0.0455 1.4577
CB-X-G-E-conv-24 -1.5377 -0.0345 1.4687
CB-X-G-E-conv-1 -1.5242 -0.0210 1.4822
CB-X-G-E-inf-mw-24 -1.5112 -0.0080 1.4952
CB-X-G-E-inf-mw-1 -1.5037 -0.0005 1.5027
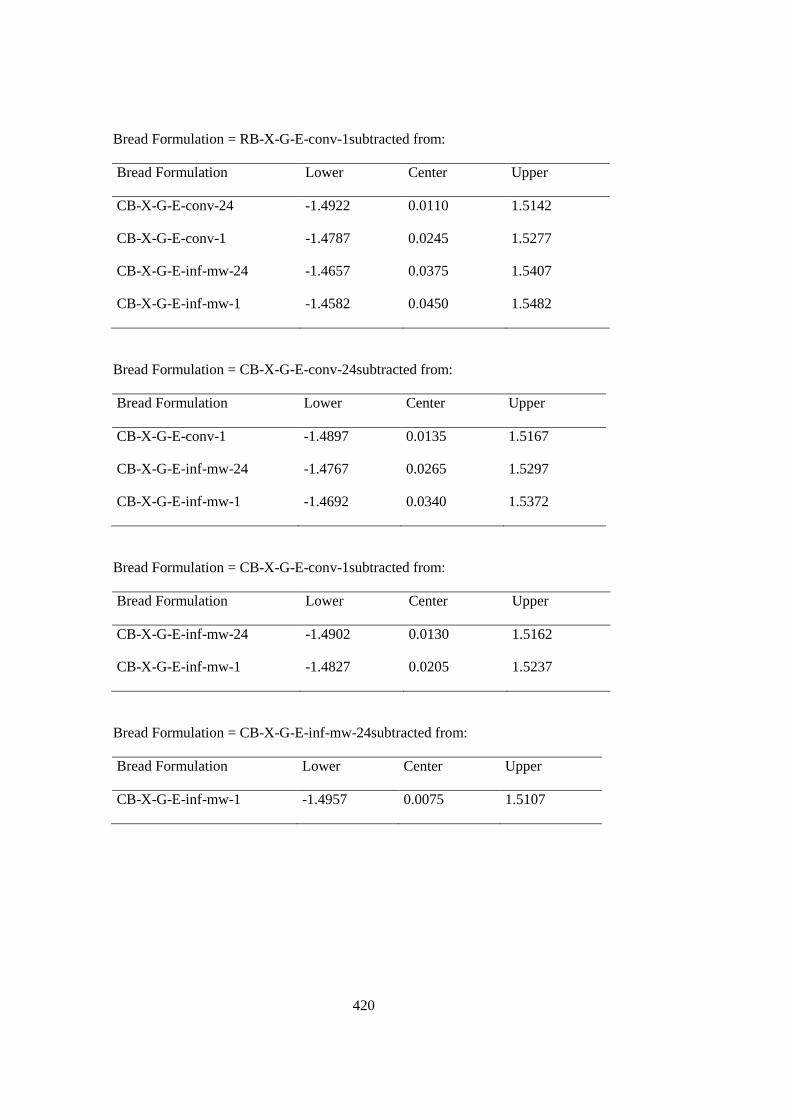
420
Bread Formulation = RB-X-G-E-conv-1subtracted from:
Bread Formulation Lower Center Upper
CB-X-G-E-conv-24 -1.4922 0.0110 1.5142
CB-X-G-E-conv-1 -1.4787 0.0245 1.5277
CB-X-G-E-inf-mw-24 -1.4657 0.0375 1.5407
CB-X-G-E-inf-mw-1 -1.4582 0.0450 1.5482
Bread Formulation = CB-X-G-E-conv-24subtracted from:
Bread Formulation Lower Center Upper
CB-X-G-E-conv-1 -1.4897 0.0135 1.5167
CB-X-G-E-inf-mw-24 -1.4767 0.0265 1.5297
CB-X-G-E-inf-mw-1 -1.4692 0.0340 1.5372
Bread Formulation = CB-X-G-E-conv-1subtracted from:
Bread Formulation Lower Center Upper
CB-X-G-E-inf-mw-24 -1.4902 0.0130 1.5162
CB-X-G-E-inf-mw-1 -1.4827 0.0205 1.5237
Bread Formulation = CB-X-G-E-inf-mw-24subtracted from:
Bread Formulation Lower Center Upper
CB-X-G-E-inf-mw-1 -1.4957 0.0075 1.5107
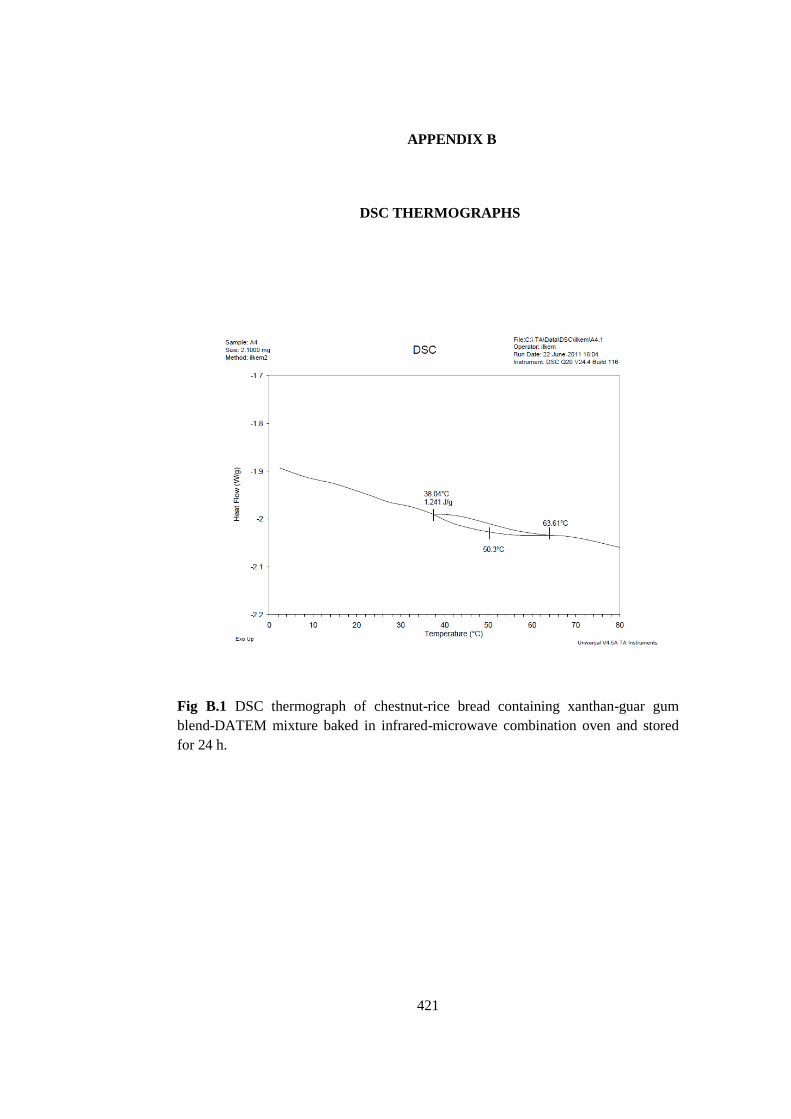
421
APPENDIX B
7. DSC THERMOGRAPHS
Fig B.1 DSC thermograph of chestnut-rice bread containing xanthan-guar gum
blend-DATEM mixture baked in infrared-microwave combination oven and stored
for 24 h.
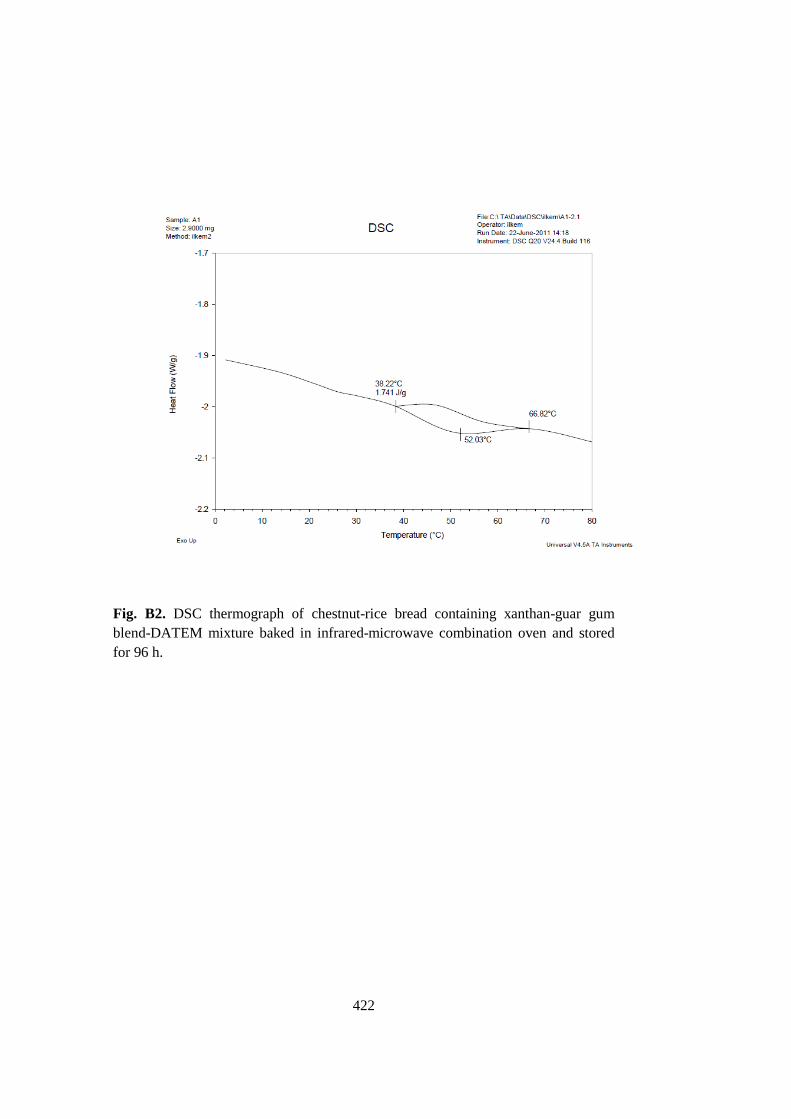
422
Fig. B2. DSC thermograph of chestnut-rice bread containing xanthan-guar gum
blend-DATEM mixture baked in infrared-microwave combination oven and stored
for 96 h.
423
8. CURRICULUM VITAE
İlkem Demirkesen Mert was born in Nevşehir on March 29, 1982. She was graduated
from Food Engineering Department of Ankara University in 2005. She worked as a
research assistant in Food Engineering Department of Middle East Technical
University for eight years (September 2005-June 2013). She continued the research
at Purdue University, USA between august 2011-august 2012. She has been working
in Republic of Turkey Ministry of Food, Agriculture and Livestock, since May 2013.
Her publications are listed below:
A. Full Paper Published In International Journals
Demirkesen, I., Kelkar, S., Campanella O. H., Sumnu, G., Sahin, S., Okos, M.
Characterization of structure of gluten-free breads by using X-ray microtomography:
Relationship between microstructure and quality characteristics. Food Hydrocolloids,
in review.
Demirkesen, I., Campanella O. H., Sumnu, G., Sahin, S., Hamaker, B. A study on
staling characteristics of gluten free breads prepared with chestnut and rice flours.
Food and Bioprocess Technology. DOI:10.1007/s11947-013-1099-3.
Demirkesen, I., Sumnu, G., Sahin, S. Image analysis of gluten-free breads prepared
with chestnut and rice flour and baked in different ovens. Food and Bioprocess
Technology, DOI:10.1007/s11947-012-0850-5.
Demirkesen, I., Sumnu, G., Sahin, S, Eroğlu, M. M. Quality of gluten-free bread
formulations baked in different ovens. Food and Bioprocess Technology, DOI:
10.1007/s11947-011-0712-6.
Demirkesen, I., Sumnu, G., Sahin, S., Uysal., N., 2011. Optimization of
formulations and infrared-microwave combination baking conditions of chestnut-rice
breads. International Journal of Food Science and Technology, 46, 1809–1815.
Demirkesen, I., Mert, B., Sumnu, G., Sahin, S., 2010. Utilization of chestnut flour in
gluten-free bread formulations. Journal of Food Engineering, 101, 329-336.
Demirkesen, I., Mert, B., Sumnu, G., Sahin, S., 2010. Rheological properties of
gluten-free bread formulations. Journal of Food Engineering, 96, 295–303.
B. Conference Papers (National)
Demirkesen, I., Sumnu, G., Sahin, S. Farklı fırınlarda pişirilen kestane ve pirinç unu
içeren glütensiz ekmeklerin görüntü analiz yöntemi ile incelenmesi, 11. Türkiye Gıda
Kongresi, poster sunumu, Ekim 10-12, 2012, Hatay, Türkiye
424
Demirkesen, I., Mert, B., Sumnu, G., Sahin, S. Glutensiz ekmek hamurlarının
reolojik özellikleri, 6. Gıda Kongresi, sözlü bildiri, Aralık, 6-8, 2009, Antalya,
Türkiye.
B. Conference Papers (International)
Demirkesen, I., Campanella O. H., Sumnu, G., Sahin, S., Hamaker, B. Effects of
chestnut flour on staling characteristics of gluten-free breads. International
conference on food engineering and biotechnology (ICFEB), poster presentation,
May 19-20, 2013, Copenhagen, Denmark.
Demirkesen, I., Kelkar, S., Campanella O. H., Sumnu, G., Sahin, S., Okos, M.
Characterization of structure of gluten-free breads by using X-ray microtomography.
Euro FoodChem XVII, oral presentation, May, 07-10, 2013, Istanbul, Turkey.
Demirkesen, I., Sumnu, G., Sahin, S. Image analysis of gluten free breads prepared
with chestnut and rice flour and baked in infrared-microwave combination oven. 11
th International Food Hydrocolloids Conference (IFHC), poster presentation, May
14-18, 2012, Whistler Center for Carbohydrate Research, Purdue University, USA.
Demirkesen, I., Sumnu, G., Sahin, S. Utilization of chestnut flour in gluten-free
cakes. 6th International CIGR Technical Symposium, poster presentation, April 18-
20, 2011, Nantes, France.
Demirkesen, I., Sumnu, G., Sahin, S. Development of gluten-free bread
formulations using chestnut and rice flour combinations. International Food
Technology (IFT), poster presentation, July 17-20, 2010, Chicago, USA.
Demirkesen, I., Mert, B., Sumnu, G., Sahin. Rheological properties of gluten-free
bread formulations using chestnut and rice flour combinations. Second International
Symposium onGluten-free cereal products and beverages, poster presentation, June
8-11, 2010, Tampere, Finland.
Demirkesen, I., Sumnu, G., Sahin, S. Development of gluten-free rice breads to be
baked in infrared-microwave oven. 43rd Annual International Microwave Power
Symposium (IMPI), poster presentation, July 8-10, 2009, Washington DC, USA.
PROJECT WORK
Middle East Technical University, Department of Food Engineering, Research
Topic: “Optimization of gluten-free bread formulations to be baked in infrared-
microwave combination oven”, Researcher, BAP-08-11- DPT.2002K 120510, 2007-
2011.

425
HONORS-AWARDS-SCHOLARSHIPS
Project award, at the first place of Bas Döndüren Fikirler, Yıldız Holding, 2013.
Project Title: Sürekli Kızılötesi-Mikrodalga Fırınların Tasarım ve Uygulaması.
Scholarship from YOK (The Council of Higher Education), August 2011-August
2012, Visiting Scholar at Department of Agricultural and Biological Engineering,
Purdue University, West Lafayette, Indiana, USA.
Scholarship from TUBITAK (The Scientific and Technological Research Council of
Turkey) for PhD education, 2006-2010.
Dean’s High Honor Lists, 8 semesters, 2001-2005.
Graduation from B.Sc. at the first place of Food Enginnering Department and second
place of Faculty of Engineering, 2005 (GPA 3.86/4.00)


