Development of full carbon wheels for sport cars with high ... · Weight of cars increased...
12
See discussions, stats, and author profiles for this publication at: https://www.researchgate.net/publication/323577128 Development of full carbon wheels for sport cars with high-volume technology Article in Composite Structures · March 2018 DOI: 10.1016/j.compstruct.2018.02.083 CITATIONS 0 READS 123 8 authors, including: Some of the authors of this publication are also working on these related projects: Drilling of composite plates and pipes and measurement of residual (Tensile, Compression, Bending) strength after drilling View project Commercialization of a full carbon wheel manufactured with automated high- volume process for the automotive market (CARIM) View project Francesco Rondina University of Bologna 1 PUBLICATION 0 CITATIONS SEE PROFILE Laura Mazzocchetti University of Bologna 49 PUBLICATIONS 350 CITATIONS SEE PROFILE Lorenzo Donati University of Bologna 90 PUBLICATIONS 687 CITATIONS SEE PROFILE Giangiacomo Minak University of Bologna 157 PUBLICATIONS 1,750 CITATIONS SEE PROFILE All content following this page was uploaded by Giangiacomo Minak on 23 March 2018. The user has requested enhancement of the downloaded file.
Transcript of Development of full carbon wheels for sport cars with high ... · Weight of cars increased...
Seediscussions,stats,andauthorprofilesforthispublicationat:https://www.researchgate.net/publication/323577128
Developmentoffullcarbonwheelsforsportcarswithhigh-volumetechnology
ArticleinCompositeStructures·March2018DOI:10.1016/j.compstruct.2018.02.083
CITATIONS
0READS
123
8authors,including:
Someoftheauthorsofthispublicationarealsoworkingontheserelatedprojects:
Drillingofcompositeplatesandpipesandmeasurementofresidual(Tensile,Compression,Bending)strengthafterdrillingViewproject
Commercializationofafullcarbonwheelmanufacturedwithautomatedhigh-volumeprocessfortheautomotivemarket(CARIM)Viewproject
FrancescoRondinaUniversityofBologna1PUBLICATION0CITATIONS
SEEPROFILE
LauraMazzocchettiUniversityofBologna49PUBLICATIONS350CITATIONS
SEEPROFILE
LorenzoDonatiUniversityofBologna90PUBLICATIONS687CITATIONS
SEEPROFILE
GiangiacomoMinakUniversityofBologna157PUBLICATIONS1,750CITATIONS
SEEPROFILE
AllcontentfollowingthispagewasuploadedbyGiangiacomoMinakon23March2018.
Theuserhasrequestedenhancementofthedownloadedfile.

Contents lists available at ScienceDirect
Composite Structures
journal homepage: www.elsevier.com/locate/compstruct
Development of full carbon wheels for sport cars with high-volumetechnology
Francesco Rondinaa, Sara Taddiaa, Laura Mazzocchettia, Lorenzo Donatia, Giangiacomo Minaka,⁎,Philipp Rosenbergb, Andrea Bedeschic, Enrico Dolcinic
a CIRI MAM, Alma Mater Studiorum - Università di Bologna, Italyb Fraunhofer Institute for Chemical Technology, ICT Pfinztal, Germanyc Riba Composites S.r.l., Faenza, Italy
A B S T R A C T
Aim of the paper is to present the methodology used to develop a new process, based on high-pressure resintransfer molding (HP-RTM), to produce full carbon reinforced plastic rims for sports car. These components arenowadays made by pre-preg autoclave processing, which is expensive and time-consuming, so that they arebasically sold as aftermarket option. The proposed technology allows a manufacturing volume high enough to besuitable for series production. In this paper, the resin and fiber selection criteria and tests are shown, as regardsthe mechanical properties, durability and injection strategies.
1. Introduction
Weight of cars increased continuously through the years up to 2010,in relation to improvements in comfort, driving aid systems and themore challenging homologation passive safety requirements. Since2000 an increasing attention towards weight reduction in all car seg-ments was adopted by all OEM (Original Equipment Manufacturer) asconsequence of increasing requirements on pollution emissions reduc-tion. Indeed, despite the development of more efficient engines, thehigher fuel consumption, and consequently higher CO2 emissions, dueto weight have required the intervention from the governments (inparticular US and EU) to set a path for emission reduction through theyears [1].
Research into lightweight components, materials and the relatedprocesses, has therefore become one of the main challenges in the au-tomotive industry and has led to the substitution of standard steel withalternative materials in many components and systems. Typically, steelwas first substituted by aluminium, but OEM are now looking at carbonfibre-reinforced plastics (CFRP) technologies for their premium models,since they offer further weight reduction together with higher specificstiffness. This trend will also be particularly important for next-gen-eration hybrid or electric vehicles. Indeed, CFRP are not only light-weight and high-strength but they can also be tailored in order to im-prove structural, functional or cosmetic properties. The market size forCFRP composites accounted for $20.3 billion in 2014, and is projectedto register a compound annual growth rate (CAGR) of 9.9% between
2015 and 2020, to reach $35.8 billion [2]. CFRPs were traditionallyused in the aerospace, defence industry or in racing applications buttoday they are finding new uses in automotive, marine, energy (e.g. forwind blades), industrial components and other sectors [3]. Automotiveis the most promising application field for composites, and offers thehighest growth potential. Many leading automotive manufacturers,such as BMW and Mercedes, are planning or have already started toscale-up their production of fuel-efficient cars through weight reductionby using carbon fibres. These efforts are projected to drive the CFRPmarket in the automotive industry, making it the leading industry by2020 [2].
Several factors are driving the automotive market but the costs are,still today, a major barrier. If the cost of raw carbon fibre is following adecreasing trend, the manufacturing costs are instead almost constant ifconventional high-performance technologies are used (i.e. autoclaveprocessing). Moreover several composite technologies cannot provide acomponent cost reduction by increasing the production volume (seriesproduction). To achieve a reliable component-cost reduction, new out-of-autoclave technologies (like infusion technologies, prepreg com-pression technologies or short fibre compound processing) have beenrecently optimized and they are now ready for industrial use. Amongthe others High-Pressure Resin Transfer Moulding technology (HP-RTM) seems to be the most promising technologies to produce complexcomponents with high performance at high volume rates.
The “classic” Resin Transfer Moulding process (RTM) can be suc-cessfully applied for the manufacturing of high-performance structural
https://doi.org/10.1016/j.compstruct.2018.02.083Received 13 January 2018; Accepted 27 February 2018
⁎ Corresponding author.E-mail address: [email protected] (G. Minak).
Composite Structures 192 (2018) 368–378
Available online 06 March 20180263-8223/ © 2018 Elsevier Ltd. All rights reserved.
T
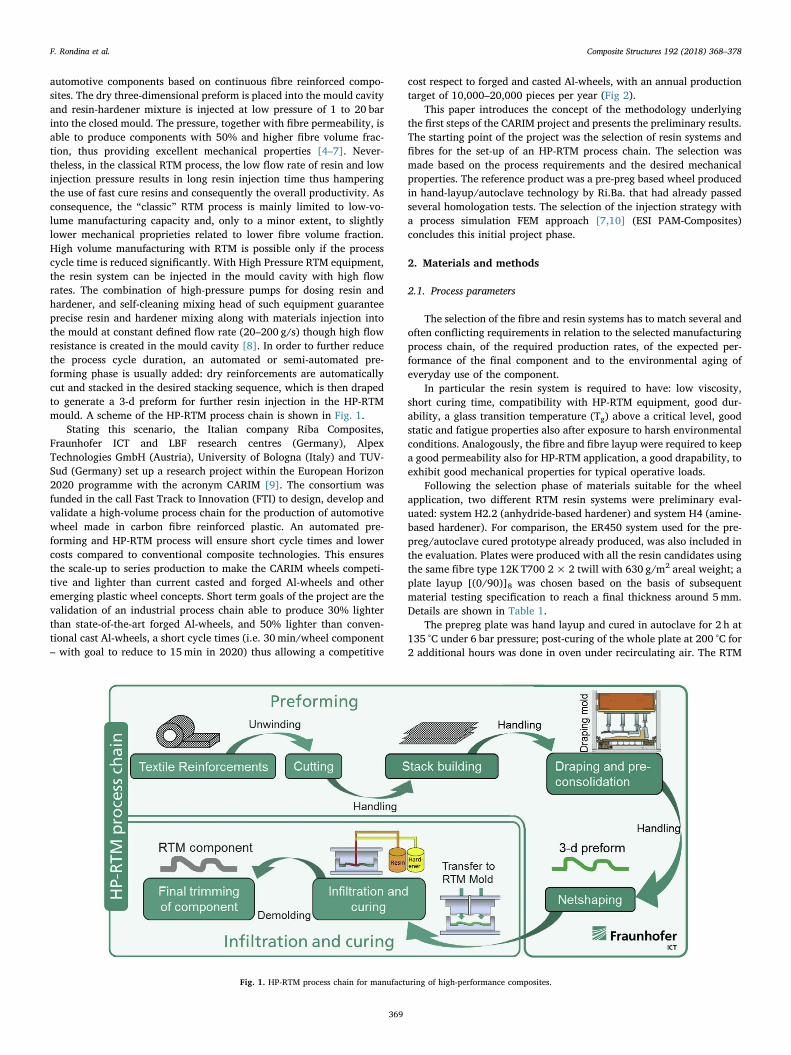
automotive components based on continuous fibre reinforced compo-sites. The dry three-dimensional preform is placed into the mould cavityand resin-hardener mixture is injected at low pressure of 1 to 20 barinto the closed mould. The pressure, together with fibre permeability, isable to produce components with 50% and higher fibre volume frac-tion, thus providing excellent mechanical properties [4–7]. Never-theless, in the classical RTM process, the low flow rate of resin and lowinjection pressure results in long resin injection time thus hamperingthe use of fast cure resins and consequently the overall productivity. Asconsequence, the “classic” RTM process is mainly limited to low-vo-lume manufacturing capacity and, only to a minor extent, to slightlylower mechanical proprieties related to lower fibre volume fraction.High volume manufacturing with RTM is possible only if the processcycle time is reduced significantly. With High Pressure RTM equipment,the resin system can be injected in the mould cavity with high flowrates. The combination of high-pressure pumps for dosing resin andhardener, and self-cleaning mixing head of such equipment guaranteeprecise resin and hardener mixing along with materials injection intothe mould at constant defined flow rate (20–200 g/s) though high flowresistance is created in the mould cavity [8]. In order to further reducethe process cycle duration, an automated or semi-automated pre-forming phase is usually added: dry reinforcements are automaticallycut and stacked in the desired stacking sequence, which is then drapedto generate a 3-d preform for further resin injection in the HP-RTMmould. A scheme of the HP-RTM process chain is shown in Fig. 1.
Stating this scenario, the Italian company Riba Composites,Fraunhofer ICT and LBF research centres (Germany), AlpexTechnologies GmbH (Austria), University of Bologna (Italy) and TUV-Sud (Germany) set up a research project within the European Horizon2020 programme with the acronym CARIM [9]. The consortium wasfunded in the call Fast Track to Innovation (FTI) to design, develop andvalidate a high-volume process chain for the production of automotivewheel made in carbon fibre reinforced plastic. An automated pre-forming and HP-RTM process will ensure short cycle times and lowercosts compared to conventional composite technologies. This ensuresthe scale-up to series production to make the CARIM wheels competi-tive and lighter than current casted and forged Al-wheels and otheremerging plastic wheel concepts. Short term goals of the project are thevalidation of an industrial process chain able to produce 30% lighterthan state-of-the-art forged Al-wheels, and 50% lighter than conven-tional cast Al-wheels, a short cycle times (i.e. 30min/wheel component– with goal to reduce to 15min in 2020) thus allowing a competitive
cost respect to forged and casted Al-wheels, with an annual productiontarget of 10,000–20,000 pieces per year (Fig 2).
This paper introduces the concept of the methodology underlyingthe first steps of the CARIM project and presents the preliminary results.The starting point of the project was the selection of resin systems andfibres for the set-up of an HP-RTM process chain. The selection wasmade based on the process requirements and the desired mechanicalproperties. The reference product was a pre-preg based wheel producedin hand-layup/autoclave technology by Ri.Ba. that had already passedseveral homologation tests. The selection of the injection strategy witha process simulation FEM approach [7,10] (ESI PAM-Composites)concludes this initial project phase.
2. Materials and methods
2.1. Process parameters
The selection of the fibre and resin systems has to match several andoften conflicting requirements in relation to the selected manufacturingprocess chain, of the required production rates, of the expected per-formance of the final component and to the environmental aging ofeveryday use of the component.
In particular the resin system is required to have: low viscosity,short curing time, compatibility with HP-RTM equipment, good dur-ability, a glass transition temperature (Tg) above a critical level, goodstatic and fatigue properties also after exposure to harsh environmentalconditions. Analogously, the fibre and fibre layup were required to keepa good permeability also for HP-RTM application, a good drapability, toexhibit good mechanical properties for typical operative loads.
Following the selection phase of materials suitable for the wheelapplication, two different RTM resin systems were preliminary eval-uated: system H2.2 (anhydride-based hardener) and system H4 (amine-based hardener). For comparison, the ER450 system used for the pre-preg/autoclave cured prototype already produced, was also included inthe evaluation. Plates were produced with all the resin candidates usingthe same fibre type 12K T700 2× 2 twill with 630 g/m2 areal weight; aplate layup [(0/90)]8 was chosen based on the basis of subsequentmaterial testing specification to reach a final thickness around 5mm.Details are shown in Table 1.
The prepreg plate was hand layup and cured in autoclave for 2 h at135 °C under 6 bar pressure; post-curing of the whole plate at 200 °C for2 additional hours was done in oven under recirculating air. The RTM
Fig. 1. HP-RTM process chain for manufacturing of high-performance composites.
F. Rondina et al. Composite Structures 192 (2018) 368–378
369

plates were produced as follows: the injection layout consists in a resintrack all around the plate and central vent. An injection pressure of5 bar was applied together with vacuum at the vent. Different curecycles were realized for systems H2.2 and H4 as reported in Table 1.The plates were finally waterjet cut for the extraction of the specimensof the required dimensions for testing.
The plates were characterized by Differential Scanning Calorimetry(DSC), Thermogravimetric analyses (TGA) and Dynamic-MechanicalAnalysis (DMA). Differential Scanning Calorimetry measurements werecarried out on a TA Instruments DSC Q2000 apparatus equipped withRCS cooling system, heating twice 3–5mg samples in aluminium pansfrom 0 °C to 350 °C at 10 °C/min, with intermediate cooling run carriedout at −10 °C/min. Thermogravimetric analyses were carried out on aTA Instruments SDT Q600, in air atmosphere (flow rate: 100ml/min)heating from 25 °C to 600 °C at 10 °C/min, followed by 30min isotherm.DMA was performed with a NETZSCH 242 E Artemis analyser in three-point bending configuration with a 40mm span, with 1 Hz oscillationfrequency and 20 μm oscillation amplitude, heating from RT up to250 °C at 3 °C/min heating rate; samples for DMA are about 50x5x5mm(the exact dimensions were measured for each coupon).
2.2. Mechanical and durability testing
Concerning the mechanical characterization, the most criticalfailure mechanisms for composite materials subjected to a complexloading history are the ones dominated by the matrix, both in-plane andout of plane (intra-ply) [11]. In real components’ life, many events candamage the matrix, such as low velocity impacts [12,13] or machining[14] and the residual strength of these components strongly depends onthe matrix properties. In order to compare efficiently a group of resinsfor CFRP a testing campaign that included only the most representativetests for the matrix behaviour was designed.
Moreover, to evaluate the exposure to harsh environmental condi-tions and high temperature exposure, several accelerated aging proto-cols were scheduled and mechanical properties were checked also afterconditioning. Two sets of thermal oxidation conditioning were planned:a long steady exposure at elevated sub-Tg temperature and several shortexposures at high temperature above Tg. Whereas the former is in-tended to stress the material to obtain the allowable loss factor over thewhole lifetime of the wheel, the latter is intended for the durability andresistance against bursts of temperature due to hot spots that couldappear on the wheel during critical sporadic events (e.g. during hardbreaking). [15] For this campaign, out of plane shear tests and com-pression after impact loading were selected: resistance to compressionwas verified both in pristine condition following ASTM D3410 standard[16] and after impact by drop weight, according to ASTM StandardD7137 [17] (CAI test).
Impact tests were conducted according to ASTM D7136 [18] on aninstrumented drop-weight machine [19] at different nominal energylevels (in the range 3–18 J).
Out of plane matrix shearing was tested in short beam geometryaccording to ASTM D2344 [20] (Inter Laminar Shear test, ILSS). in fact,the inter-laminar shear strength is a sensitive parameter for the eva-luation of a class of composite materials, particularly to evaluate themodifications of the matrix after oxidative and degradation phenomena[21]. CAI and ILSS tests were performed on specimens in the post-curedcondition and after accelerated aging protocols.
Fig. 2. Permeability characterization testing set-up.
Table 1Plate production, selection of materials.
Materials Process Cure cycle Post-cure cycle Finalthickness
ER450 Vacuum+6 barautoclave cure
2 h @135 °C
2 h @ 200 °C 5.02mm
H2.2 5 bar closed mouldRTM
30min @120 °C
24 h @ 180 °C 4.84mm
H4 5 bar closed mouldRTM
90min @80 °C
1 h @ 150 °C,3 h @ 180 °C,1 h @ 200 °C
4.83mm
Table 2Complete list of tests performed vs. aging conditioning.
Codename Ageing Protocol Resin system Tests
Temperature [°C] Time [h] ER450 H2.2 H4 ILSS Fatigue Compressive CAI DMA DSC TGA
Ref – – X X X X X X X X X Xh360 180 360 X X X X Xh720 180 720 X X X X X X X Xh1440 180 1440 X X X X Xh2160 180 2160 X X Xt200 200 72 X X X Xt210 210 72 X X X Xt220 220 72 X X X Xt230 230 72 X X X Xt240 240 72 X X X Xt250 250 72 X X X X
F. Rondina et al. Composite Structures 192 (2018) 368–378
370
A summary of the chemical and mechanical tested condition to-gether with aging cycles are reported in Table 2.
2.3. FEM simulation of injection strategies
The costs for HP-RTM mould processing can be extremely high inparticular if severe adjustment and re-working are required as a con-sequence of defects onset in the starting phase of production trials andprocess optimization. For this reason, a virtual simulation of the in-jection process was planned in order to identify, at the early stage of themould design, all the possible critical issues. The ESI PAM-COMPOSITEsuite was selected for the activity due to the presence of PAM-RTMmodule able to simulate the Resin Injection Technologies as alreadyvalidated by the authors in previous works [7,10]. Starting point of theactivity was the characterization of fibre permeability of the selectedmaterials. Three different fibres were tested i.e. A: unidirectional fibre12K T700 300 g/m2, B: triaxial fibre (30/90/−30) 24K T700 300 g/m2,C: Twill 2× 2 fabric 12K T700 630 g/m2. The permeability character-ization was realized and analyzed as described by Weitzenbock in [22].A sketch of the experimental equipment is reported in Fig. 3: the systemhas an internal cavity of 260× 130×6.2mm where plies of220x130mm were placed with a stacking sequence able to produce atarget fibre ratio of 55%. A pressure difference between injection andvent of 0.4 bar was applied. Plies were put in 0°, 45° and 90° direction inorder to retrieve the Principal Permeability values (K1 and K2) from thelocal permeability (K0, K45, K90) data [23–24]. The test was repeated 3times for each fibre thus bringing to 9 the number of the tests to beperformed for the characterization of each material.
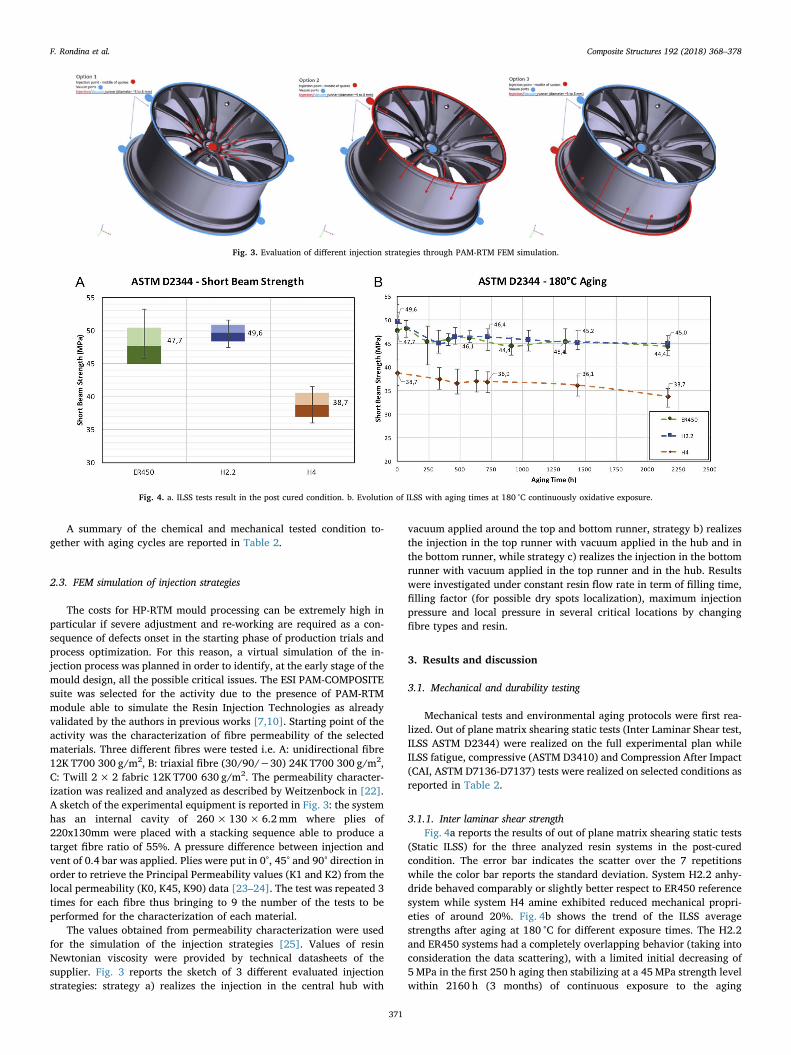
The values obtained from permeability characterization were usedfor the simulation of the injection strategies [25]. Values of resinNewtonian viscosity were provided by technical datasheets of thesupplier. Fig. 3 reports the sketch of 3 different evaluated injectionstrategies: strategy a) realizes the injection in the central hub with
vacuum applied around the top and bottom runner, strategy b) realizesthe injection in the top runner with vacuum applied in the hub and inthe bottom runner, while strategy c) realizes the injection in the bottomrunner with vacuum applied in the top runner and in the hub. Resultswere investigated under constant resin flow rate in term of filling time,filling factor (for possible dry spots localization), maximum injectionpressure and local pressure in several critical locations by changingfibre types and resin.
3. Results and discussion
3.1. Mechanical and durability testing
Mechanical tests and environmental aging protocols were first rea-lized. Out of plane matrix shearing static tests (Inter Laminar Shear test,ILSS ASTM D2344) were realized on the full experimental plan whileILSS fatigue, compressive (ASTM D3410) and Compression After Impact(CAI, ASTM D7136-D7137) tests were realized on selected conditions asreported in Table 2.
3.1.1. Inter laminar shear strengthFig. 4a reports the results of out of plane matrix shearing static tests
(Static ILSS) for the three analyzed resin systems in the post-curedcondition. The error bar indicates the scatter over the 7 repetitionswhile the color bar reports the standard deviation. System H2.2 anhy-dride behaved comparably or slightly better respect to ER450 referencesystem while system H4 amine exhibited reduced mechanical propri-eties of around 20%. Fig. 4b shows the trend of the ILSS averagestrengths after aging at 180 °C for different exposure times. The H2.2and ER450 systems had a completely overlapping behavior (taking intoconsideration the data scattering), with a limited initial decreasing of5MPa in the first 250 h aging then stabilizing at a 45MPa strength levelwithin 2160 h (3 months) of continuous exposure to the aging
Fig. 3. Evaluation of different injection strategies through PAM-RTM FEM simulation.
Fig. 4. a. ILSS tests result in the post cured condition. b. Evolution of ILSS with aging times at 180 °C continuously oxidative exposure.
F. Rondina et al. Composite Structures 192 (2018) 368–378
371
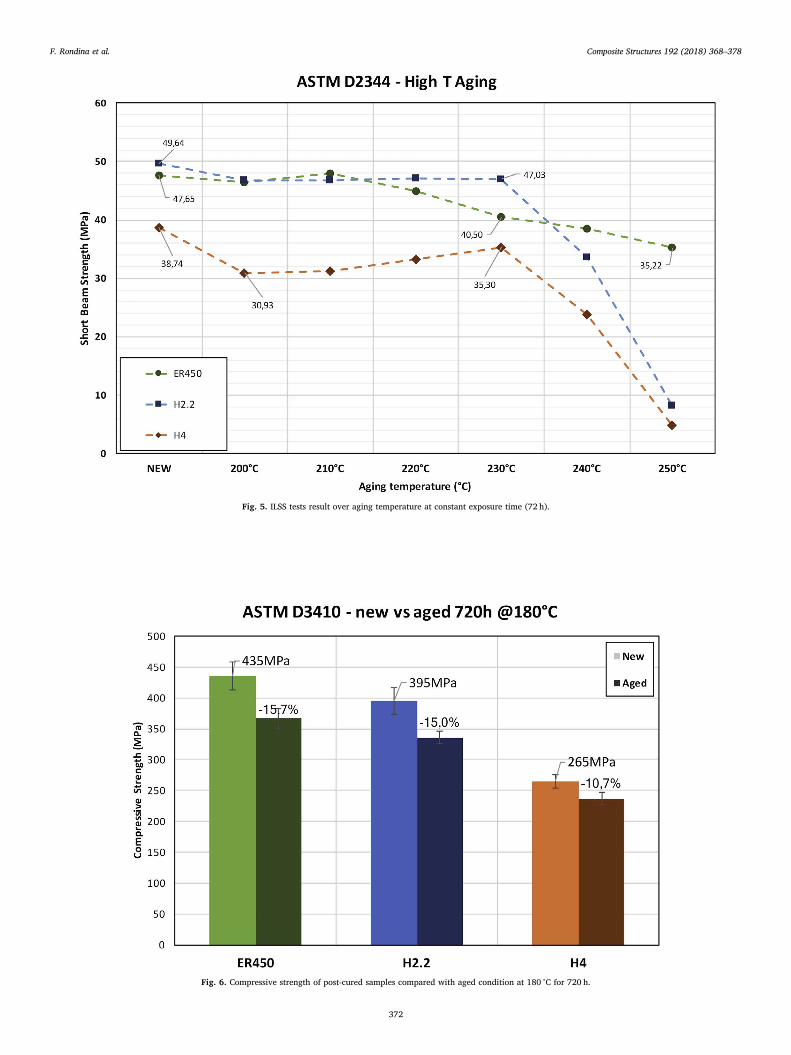
Fig. 5. ILSS tests result over aging temperature at constant exposure time (72 h).
Fig. 6. Compressive strength of post-cured samples compared with aged condition at 180 °C for 720 h.
F. Rondina et al. Composite Structures 192 (2018) 368–378
372

Fig. 7. Impact Load-Displacement curves: comparison between reference and hot aged conditions for the different resin systems.
Fig. 8. Detail of impact events, 0.5 m (left), 1 m (centre) and 2m (right) impact heights.
Fig. 9. a) Compressive force and bending displacement as a function of the in-plane displacement, b) DIC images corresponding to the indicated point on the graph a).
F. Rondina et al. Composite Structures 192 (2018) 368–378
373

temperature. The H4 system confirmed the lower values of strengthobtained at the post-cured condition also during thermal aging. Itshowed a lower decrement in the first week of aging respect to the othersystems, but the onset of a further decrement was visible after 1500 h ofaging.
Completely different results were obtained when the materials wereaged at higher temperature, above Tg, even for a shorter exposure time(72 h) as reported in Fig. 5. Here the effects are severe, as severalphenomena occurred when the material was exposed at these tem-peratures: the permeability to oxygen was higher, thus oxidative effectswere deeply accelerated, the internal stresses were recovered at hightemperature, then to be reintroduced in the form of thermal shrinkageduring cooling down. For system H2.2 there was almost no change after72 h exposure up to 230 °C, but when this temperature was overcome
static strength abruptly decreased to an almost zero value at 250 °Cexposure. Reference system ER450 behaved comparably respect to H2.2up to 220° exposure temperature, then it started decreasing its strengthbut with a less critical decrement thus keeping at 250°c exposure aresidual strength of 35MPa (it kept a 75% of the initial strength).System H4 started immediately its decrease: at 200 °C oxidation tem-perature specimen strength was as low as it was at 1500 h exposure at180 °C. A slight recovery is then visible in the range 210–230°, possiblydue to some post-curing phenomena occurring above Tg which helpsraising the glass transition of the system during the thermal treatment,followed by an abrupt decrement as was present for H2.2 system.
3.1.2. Compression testsCompressive tests were performed following ASTM D3410 standard,
Fig. 10. Compression after impact strengths on post-cured and thermal aged specimens.
Fig. 11. DSC thermograms of the first (A) and second (B) heating scans of: a) ER450 (red), b) H4 (blue) and c) H2.2 (green).
F. Rondina et al. Composite Structures 192 (2018) 368–378
374
with 25mm gage length and 15mm specimen width. Only the tests thatresulted in acceptable failure mechanism were considered in the cal-culation of average strength (Fig. 6). Data indicated that the pre-pregsystem can sustain the highest load before collapsing, with the H2.2system not far below. The third system analyzed, in analogy with theresults from ILSS tests, was 30% less resistant. The effect of thermaloxidation has a similar impact on the two best performing systems(ER450 and H2.2), while the third shows a less prominent effect.
3.1.3. Impact loadingIn the instrumented drop weight test a 1.3 kg mass impactor was
used. Different nominal energy levels were obtained by impact heights:
0.5, 1 and 2m (3m only for ER450). The actual kinetic energy wasmeasured by means of a laser device before impact and after rebound.
Examples of the Load-displacement curves obtained are shown inFig. 7, being the area inside the curve equal to the energy absorbed bythe specimen during the impact event.
In Fig. 8 a summary of the main features of the impact tests, i.e.peak force and time duration of the contact, are shown. It is quiteevident that system H4 behaved differently from the other two, havingboth lower peak forces and higher contact times for all the nominalenergy levels considered. This is an indication of higher damage level,respect to the other two systems.
3.1.4. Compression after impactThe CAI strength was measured on ASTM standard 100× 150 mm
specimen. The possible global plate buckling, that would invalidate thetest, was monitored during the CAI test by means of a Digital ImageCorrelation device, as shown as an example in Fig. 9.
A further evidence of a higher damage level of system H4 can befound also in the graph of Fig. 10, in which the residual compressivestrength (MPa) after impact is plotted versus the energy absorbed by thespecimen during the impact. The absorbed energy was calculated fromthe difference between the final kinetic energy immediately beforecontact and the re-bounce energy just after impact.
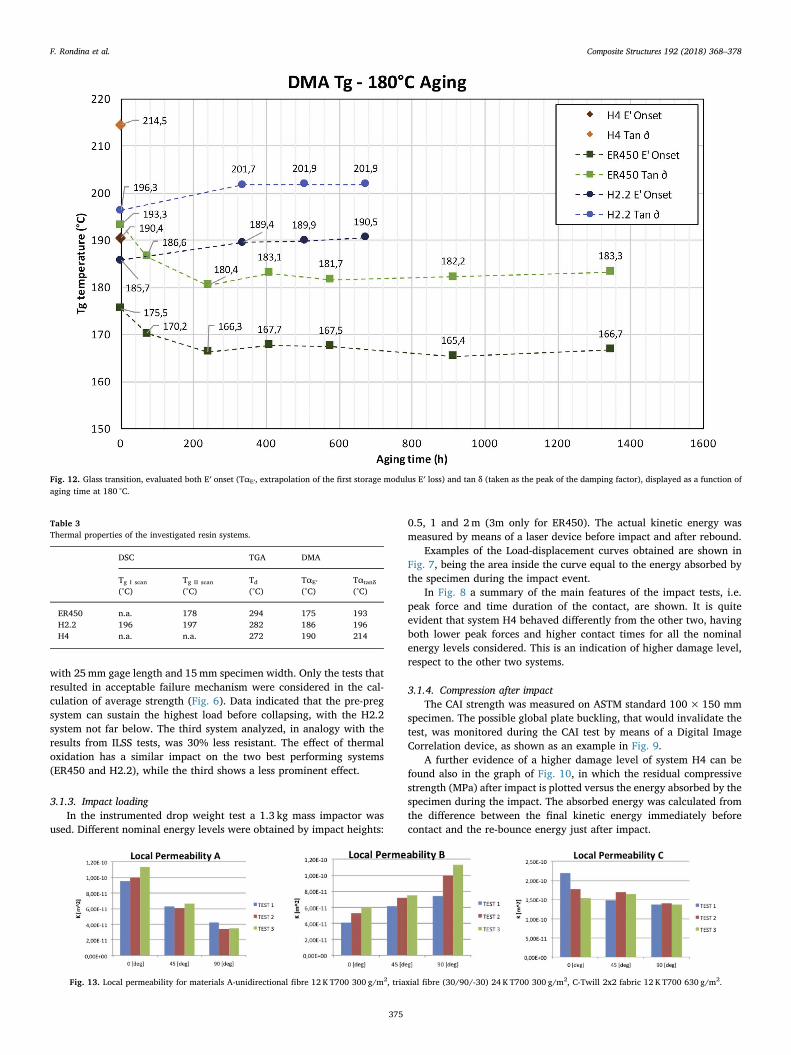
Fig. 12. Glass transition, evaluated both E′ onset (TαE′, extrapolation of the first storage modulus E′ loss) and tan δ (taken as the peak of the damping factor), displayed as a function ofaging time at 180 °C.
Table 3Thermal properties of the investigated resin systems.
DSC TGA DMA
Tg I scan
(°C)Tg II scan
(°C)Td
(°C)TαE′
(°C)Tαtanδ(°C)
ER450 n.a. 178 294 175 193H2.2 196 197 282 186 196H4 n.a. n.a. 272 190 214
Fig. 13. Local permeability for materials A-unidirectional fibre 12 K T700 300 g/m2, triaxial fibre (30/90/-30) 24 K T700 300 g/m2, C-Twill 2x2 fabric 12 K T700 630 g/m2.
F. Rondina et al. Composite Structures 192 (2018) 368–378
375

In the post-cured conditions, in contradiction with the compressivetests made following D3410 standard, H2.2 had the highest resistanceafter all impacts, followed by ER450 and by H4. After 1month aging @180 °C the behaviour of the three systems was quite different: the twoRTM systems reduced their respective residual strength, in particularH4 lost about 10MPa independently from the Impact Energy, whileH2.2 showed negligible effects of aging when impacted at lower energy,while lost up to 30MPa at higher impacts energies. Surprisingly ER450system increased its residual strength of an average value of 10MPa atall impact energies.
It is interesting to notice how the system H4 consistently showedhigher absorbed energies at every impact height. This is particularlyevident at the lowest impact level (0.5 m), for which the energy ab-sorbed during impact was more than double, compared with bothER450 and H2.2 systems.
3.1.5. Differential scanning calorimetry and dynamical mechanical analysisBefore any additional temperature aging treatment, all the speci-
mens were analyzed by DSC in order to assess the presence of residualexothermic phenomena when brought at high temperature, symptom ofuncomplete cure and, when detectable, the stability of the Tg after a
second heating scan. This assessment was carried out with the aim ofevaluating the thermal behavior in highly demanding thermal condi-tions, where the material should guarantee a good performance, even ifjust for a limited time span. As can be seen in Fig. 11, all the in-vestigated sample did not show any exotherm below 200 °C, accountingfor a fairly high thermal stability, while only H2.2 appeared to be fullycured (Fig 12).
Both ER450 and H4 displays in the first scan some hint of exo-thermic events, processes typical of crosslinking, above 200 °C, namelyjust above the glass transition, i.e. when the system regains mobilityand the ability to start reacting again, thus accounting for both beingvitrified systems. Since TGA analysis shows degradation temperature(Td), determined as the temperature at which a 1% weight loss occurs,well above 270 °C, it can be safely ruled out that such exotherms aredue to degradation processes. Hence some additional reactions mightoccur during the first heating in the DSC. Moreover, due to some en-thalpic relaxation, it is not possible to safely evaluate the glass transi-tion temperature for the investigated resins during the first scan, i.e.representing the situation as is. It is however possible to observe thatER450 Tg is just slightly affected by the first heating run, while H4system shows first a physical aging located around 220 °C and almost notransition within 250 °C in the second scan. This difference well sup-ports the previous ILSS results, where H4 displays some increase inpropertied during thermal treatments around 210–230 °C, where thecuring is significantly pushed. Owing to the inability of DSC thermo-grams to provide reliable Tg, the glass transition has thus been de-termined via DMA as reported in Table 3, assessing both E′ onset (TαE′,extrapolation of the first storage modulus E′ loss) and tan δ (Tαtanδ,taken as the peak of the damping factor). The span between the twovalues is an indication of the width of the relaxation phenomenon.While the H4 resin system appear to be the one with the highest per-formances as regarding the glass transition, the gap between TαE′ onsetand Tαtanδ is quite relevant, accounting for an unstable behavior pos-sibly due to the uncomplete curing of the system. The H2.2 resin, in-stead, though showing a glass transition phenomenon generally locatedat lower temperatures, display values closer on to the other, accounting
Table 4Experimentally determined local and principal permeability values.
Local permeability [m2] Principal permeability [m2] Angle [rad] Density [kg/m3]
K0 K45 K90 K1 K2 K3 Phi Rho
Plies A 1.03E−10 6.33E−11 3.70E−11 1.03E−10 3.63E−11 1.00E−09 0.0985 1800Plies B 5.09E−11 6.95E−11 9.59E−11 9.62E−11 5.06E−11 1.00E−10 1.484 1800Plies C 1.84E−10 1.61E−10 1.38E−10 1.84E−10 1.38E−10 1.00E−09 0.0118 1800
Fig. 14. Comparison of experimental and simulated filling time and injected resin quantity.
Table 5Summary of FEM injection strategies evaluation.
Strategy Flow Rate[m3/s]
Filling Time[s]
Max. Pressure[bar]
Dry Spots
a) 3.33e−5 52 21 –a) 4.45e−5 39 28 –b) 3.33e−5 51 7.6 Intersecting flows at
spokesb) 4.45e−5 39 10 Intersecting flows at
spokesc) 3.33e−5 50 17 At hub behind the
holesc) 4.45e−5 38 22 At hub behind the
holes
F. Rondina et al. Composite Structures 192 (2018) 368–378
376
for a system which is more stable. In order to assess the stability of thesesystems in terms of time and temperature, DMA measurements werealso carried out after aging at high temperature (Fig. 13). In these agedconditions, ER450 shows an initial decrease in the position of the maindissipation phenomenon, then reaching stability with aging times over200hrs, while system H2.2 shows a slight initial increase in Tg followedby a stabilization after more than 300hrs aging. Owing to the indicationof incomplete reaction and the poor mechanical proprieties displayedby H4 system, no further thermal treatment was applied to this resin. InTable 3 the details of the thermal properties are reported.
3.2. FEM simulation of injection strategies
Local permeability results for the three selected fibre types are re-ported in Fig. 13 including the scattering over three repetitions. Table 4reports the values of local and principal permeability to be inserted inthe FEM code.
FEM simulation of the permeability determination test showed agood agreement with experimental values providing an average error infilling time and injected resin quantity below 5% (Fig. 14).
Next step of the simulation activity was the evaluation of differentinjection strategies as already detailed in the previous paragraphs:strategy a) realizes the injection in the central hub with vacuum appliedaround the top and bottom runner, strategy b) realizes the injection inthe top runner with vacuum applied in the hub and in the bottomrunner, while strategy c) realizes the injection in the bottom runner
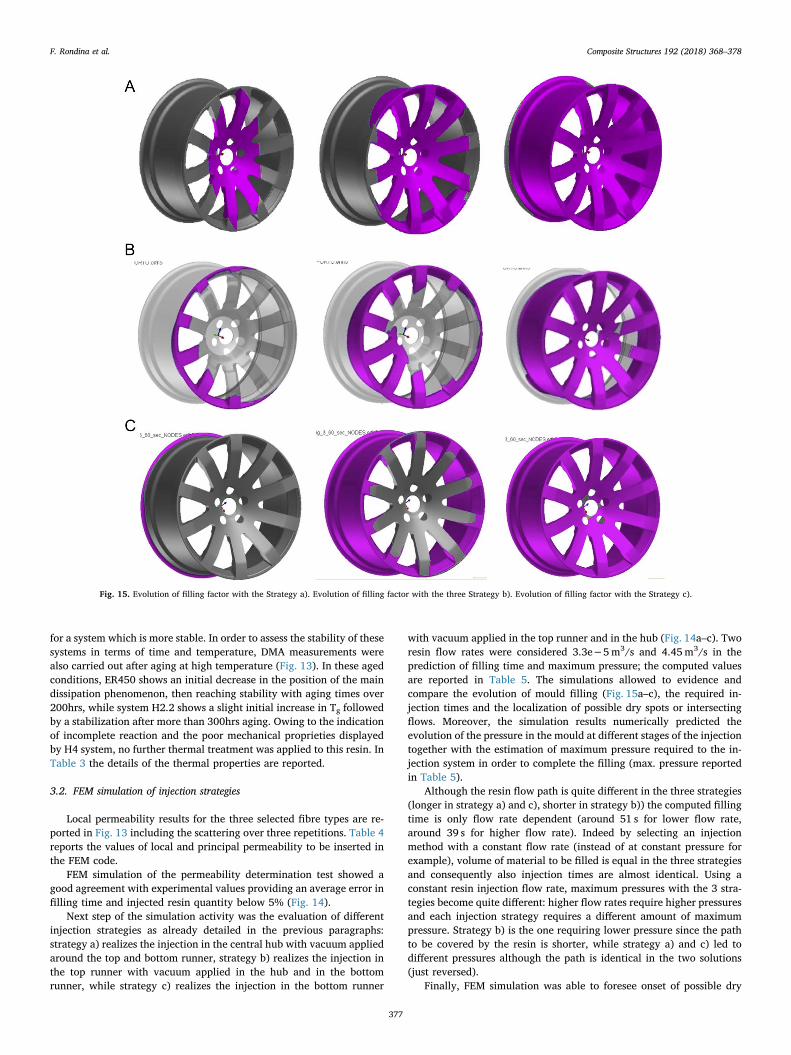
with vacuum applied in the top runner and in the hub (Fig. 14a–c). Tworesin flow rates were considered 3.3e−5m3/s and 4.45m3/s in theprediction of filling time and maximum pressure; the computed valuesare reported in Table 5. The simulations allowed to evidence andcompare the evolution of mould filling (Fig. 15a–c), the required in-jection times and the localization of possible dry spots or intersectingflows. Moreover, the simulation results numerically predicted theevolution of the pressure in the mould at different stages of the injectiontogether with the estimation of maximum pressure required to the in-jection system in order to complete the filling (max. pressure reportedin Table 5).
Although the resin flow path is quite different in the three strategies(longer in strategy a) and c), shorter in strategy b)) the computed fillingtime is only flow rate dependent (around 51 s for lower flow rate,around 39 s for higher flow rate). Indeed by selecting an injectionmethod with a constant flow rate (instead of at constant pressure forexample), volume of material to be filled is equal in the three strategiesand consequently also injection times are almost identical. Using aconstant resin injection flow rate, maximum pressures with the 3 stra-tegies become quite different: higher flow rates require higher pressuresand each injection strategy requires a different amount of maximumpressure. Strategy b) is the one requiring lower pressure since the pathto be covered by the resin is shorter, while strategy a) and c) led todifferent pressures although the path is identical in the two solutions(just reversed).
Finally, FEM simulation was able to foresee onset of possible dry
Fig. 15. Evolution of filling factor with the Strategy a). Evolution of filling factor with the three Strategy b). Evolution of filling factor with the Strategy c).
F. Rondina et al. Composite Structures 192 (2018) 368–378
377
spots (like in strategies c) or the intersection of different flow frontswithin the component (like in strategy b)) thus leading to possibleporosity or air/gas entrapment thus allowing the identification of tai-lored solutions in order to overcome them.
4. Conclusions
The preliminary results showed that the production a full carbonwheel through an automated preforming and HP-RTM process, that isthe aim of the CARIM project, was feasible and leaded to a sharp re-duction of manufacturing times. Moreover, the resin infusion systemH2.2 (anhydride) could be a valid substitute of the ER450 (pre-preg) forthe production of a full carbon wheel through HP-RTM processing withno decrement of material mechanical performances.
System H2.2 had, respect to ER450:
• an inter-laminar shear static strength comparable or even slightlysuperior;
• a limited decrease of ILSS over high temperature exposure below Tgbut also a safe behaviour when higher hot burst may occur;
• It maintained a good failure strength also under compressive loadsand the decrease related to damaging impacts was comparable re-spect to ER450 at both post-cured and thermal aging conditions;
• It exhibited a higher glass transition temperature onset (TαE′) thatinitially increased during thermal aging remaining then stable at190 °C;
System H4 showed a reduced mechanical performance respect toH2.2 and ER450 although a greater thermal stability was found.
Finally, FEM simulations allowed to properly predict injection phasewith particular reference to mould and process design thus evidencingstrength and weakness points and allowing the solution of critical as-pects at an early design stage.
Further results and the actual manufacturing process, including thefibre preform lay-out and the rims qualification mechanical test, will bepublished after the end of the project.
Acknowledgments
The research was funded by European Commission in the Horizon2020 research and innovation programme, under H2020-FTIPilot-2015-1 (Grant Agreement no. 690915). The authors thank DR. TommasoBrugo for the assistance in the Impact and CAI test.
References
[1] Mock P. EU CO2 standards for passenger cars and light-commercial vehicles.International Council on Clean Transportation (ICCT). Available on line fromtheicct.org; 2014.
[2] Badeghar T. Lightening up with carbon fiber-reinforced plastics, markets andmarkets; January 2016.
[3] Chung DDL. Processing-structure-property relationships of continuous carbon fiberpolymer-matrix composites. Mater Sci Eng R Rep 2017;113:1–29.
[4] Rosenberg P, Chaudhari R, Albrecht P, Karcher M, Henning F. Effects of Processparameters on cavity pressure and components performance in high-pressure RTMprocess variants. In: 14th-annual SPE Automotive Composites Conference &Exhibition, 2014; Novi (MI), USA.
[5] Rosenberg P, Thoma B. Henning F. Characterization of epoxy and polyurethaneresin systems for manufacturing of high-performance composites in high-pressureRTM process. In: 15th-annual SPE Automotive Composites Conference & Exhibition;2015: Novi (MI), USA.
[6] Laurenzi S, Marchetti M. Advanced Composite Materials by Resin Transfer Moldingfor Aerospace Applications, Composites and Their Properties. Prof. Ning Hu (Ed.),InTech; 2012. DOI: 10.5772/48172.
[7] Poodts E, Minak G, Mazzocchetti L, Giorgini L. Fabrication, process simulation andtesting of a thick CFRP component using the RTM process. Compos B Eng2014;56:673–80.
[8] Rosenberg P, Chaudhari R, Karcher M, Henning F, Elsner P. Investigating cavitypressure behavior in high-pressure RTM process variants. AIP Conf Proc2014;1593:463–6.
[9] http://www.carimproject.eu.[10] Poodts E, Minak G, Dolcini E, Donati L. FE analysis and production experience of a
sandwich structure component manufactured by means of vacuum assisted resininfusion process. Compos B Eng 2013;53:179–86.
[11] Talreja R. Damage and fatigue in composites – a personal account. Compos SciTechnol 2008;68(13):2585–91.
[12] Minak G, Abrate S, Ghelli D, Panciroli R, Zucchelli A. Low-velocity impact oncarbon/epoxy tubes subjected to torque – experimental results, analytical modelsand FEM analysis. Compos Struct 2010;92(3):623–32.
[13] Minak G, Abrate S, Ghelli D, Panciroli R, Zucchelli A. Residual torsional strengthafter impact of CFRP tubes. Compos B Eng 2010;41(8):637–45.
[14] Zarif Karimi N, Heidary H, Minak G, Ahmadi M. Effect of the drilling process on thecompression behavior of glass/epoxy laminates. Compos Struct 2013;98:59–68.
[15] Chandra Ray B, Rathore D. Durability and integrity studies of environmentallyconditioned interfaces in fibrous polymeric composites: critical concepts andcomments. Adv Colloid Interface Sci 2014;209:68–83.
[16] ASTM D3410/D3410M-16. Standard test method for compressive properties ofpolymer matrix composite materials with unsupported gage section by shearloading. ASTM International: West Conshohocken, PA; 2016, www.astm.org.
[17] ASTM D7137/D7137M-17. Standard test method for compressive residual strengthproperties of damaged polymer matrix composite plates. ASTM International: WestConshohocken, PA; 2017. www.astm.org.
[18] ASTM D7136/D7136M-2015. Standard test method for measuring the damage re-sistance of a fiber-reinforced polymer matrix composite to a drop-weight impactevent. ASTM International: West Conshohocken, PA; 2015. www.astm.org.
[19] Ghelli D, Minak G. Low velocity impact and compression after impact tests on thincarbon/epoxy laminates. Compos B Eng 2011;42(7):2067–79.
[20] ASTM D2344/D2344M-16. Standard test method for short-beam strength ofpolymer matrix composite materials and their laminates. ASTM International: WestConshohocken, PA; 2016. www.astm.org.
[21] Wolfrum J, Eibl S, Lietch L. Rapid evaluation of long-term thermal degradation ofcarbon fibre epoxy composites. Compos Sci Technol 2009;69(3–4):523–30.
[22] Weitzenbock JR, Shenoi RA, Wilson PA. A unified approach to determine principalpermeability of fibrous porous media. Polym Compos 2002;23(6):1132–50.
[23] Arbter R, Beraud JM, Binetruy C, Bizet L, Bréard J, Comas-Cardona S, Demaria C,Endruweit A, Ermanni P, Gommer F, Hasanovic S, Henrat P, Klunker F, Laine B,Lavanchy S, Lomov SV, Long A, Michaud V, Morren G, Ruiz E, Sol H, Trochu F,Verleye B, Wietgrefe M, Wu W, Ziegmann G. Experimental determination of thepermeability of textiles: a benchmark exercise. Compos A Appl Sci Manuf2011;42(9):1157–68.
[24] Vernet N, Ruiz E, Advani S, Alms JB, Aubert M, Barburski M, Barari B, Beraud JM,Berg DC, Correia N, Danzi M, Delavière T, Dickert M, Di Fratta C, Endruweit A,Ermanni P, Francucci G, Garcia JA, George A, Hahn C, Klunker F, Lomov SV, LongA, Louis B, Maldonado J, Meier R, Michaud V, Perrin H, Pillai K, Rodriguez E,Trochu F, Verheyden S, Wietgrefe M, Xiong W, Zaremba S, Ziegmann G.Experimental determination of the permeability of engineering textiles: benchmarkII. Compos A Appl Sci Manuf 2014;61:172–84.
[25] Demaría C, Ruiz E, Trochu F. In-plane anisotropic permeability characterization ofdeformed woven fabrics by unidirectional injection. Part II: prediction model andnumerical simulations. Polym Compos 2007;28:812–27.
F. Rondina et al. Composite Structures 192 (2018) 368–378
378
View publication statsView publication stats