DEVELOPMENT OF A PERFORMANCE RELATED CHEMICAL MODEL OF …web.anl.gov/PCS/acsfuel/preprint...
243
Development of a Performance Related Chemical Model of Petroleuiii Asphalt for SHRP Raymond E. Robertson, Jan F. Branthaver, and J. Clahe Petersen Western Research Institute P.O. Box 3395 Laramie, WY 82071 Keywords: Asphalt, Model. Aging INTRODUCTION In the three introductory papers for this symposium on petroleum asphalt used in roadway construction, the intent is to describe the current status of a comprehensive model of petroleum asphalt as developed during the Strategic Highway Research Program (SHRP). These papers are to lay out basic concepts which, in turn, are useful in describing the expected behavior of asphalt under various conditions in roadways. The prunary purpose of this paper is to describe the current SHRP model in terms of the chemical composition of asphalt. Any useful model must explain the observed behavioral characteristics as completely as possible for any given set of materials under any applicable set of conditions. In the case of petroleum asphalts, performance characteristics must include consideration of viscous and elastic properties at pavement service temperatures, nominally, -30 to +17O0F (-34OC to +77"C), over a wide range of shear conditions (high stress and rate under traffic to low rates associated with thermal stress) and must also describe the propensity to adhere to a wide variety of mineral aggregates under many conditions of temperature, stress, and moisture. Asphalts are chemically reactive with oxygen to the extent that their properties change upon oxidation, hence the model must also account for the effects of oxidation on their physical and perfomlance properties. The research that supports the model developed below has been conducted by numerous investigators and has been reported since the early part of this century. Much of the work during the Strategic Highway Research Program was refinement and validation to develop and report the current asphalt model. An extensive version of the research related to composition and physical properties of asphalt binders will appear within the next few months as the final report for SHRP Project A002A, "Binder Characterization and Evaluation." This report contains an extensive review and discussion of literature related to asphalt chemistry, physical behavior, and road performance as well as a review of the literature pertaining to petroleum. All of these areas were valuable in developing the current model, but too voluminous to cite here. 01dy selected publications of relevant SHRP studies are cited throughout the discussion of this paper. 1272
Transcript of DEVELOPMENT OF A PERFORMANCE RELATED CHEMICAL MODEL OF …web.anl.gov/PCS/acsfuel/preprint...
Development of a Performance Related Chemical Model of Petroleuiii Asphalt for SHRP
Raymond E. Robertson, Jan F. Branthaver, and J. Clahe Petersen Western Research Institute
P.O. Box 3395 Laramie, WY 82071
Keywords: Asphalt, Model. Aging
INTRODUCTION
In the three introductory papers for this symposium on petroleum asphalt used in roadway construction, the intent is to describe the current status of a comprehensive model of petroleum asphalt as developed during the Strategic Highway Research Program (SHRP). These papers are to lay out basic concepts which, in turn, are useful in describing the expected behavior of asphalt under various conditions in roadways. The prunary purpose of this paper is to describe the current SHRP model in terms of the chemical composition of asphalt.
Any useful model must explain the observed behavioral characteristics as completely as possible for any given set of materials under any applicable set of conditions. In the case of petroleum asphalts, performance characteristics must include consideration of viscous and elastic properties at pavement service temperatures, nominally, -30 to +17O0F (-34OC to +77"C), over a wide range of shear conditions (high stress and rate under traffic to low rates associated with thermal stress) and must also describe the propensity to adhere to a wide variety of mineral aggregates under many conditions of temperature, stress, and moisture. Asphalts are chemically reactive with oxygen to the extent that their properties change upon oxidation, hence the model must also account for the effects of oxidation on their physical and perfomlance properties.
The research that supports the model developed below has been conducted by numerous investigators and has been reported since the early part of this century. Much of the work during the Strategic Highway Research Program was refinement and validation to develop and report the current asphalt model. An extensive version of the research related to composition and physical properties of asphalt binders will appear within the next few months as the final report for SHRP Project A002A, "Binder Characterization and Evaluation." This report contains an extensive review and discussion of literature related to asphalt chemistry, physical behavior, and road performance as well as a review of the literature pertaining to petroleum. All of these areas were valuable in developing the current model, but too voluminous to cite here. 01dy selected publications of relevant SHRP studies are cited throughout the discussion of this paper.
1272
RESULTS AND DISCUSSION
The function of petroleum asphalts in roadways is to serve as an adhesive to hold well compacted, graded aggregate together into what is commonly described as flexible asphalt concrete. Asphalt concretes should flex (rather than crack) under traffic load, yet be capable of viscous flow under stresses of day and night as well as summer and winter thermal cycling. Certain physical properties are unquestionably important forfheir behavior and their (perceived) perfonnance in roadways. JJI order to understand and control physical properties, one must first understand what chemical structural units give rise to any given physical property, how the structure(s) change with various stresses, and finally what alterations in chemistry need to or can be made in order to adjust physical properties of asphalts to a desired performance.
The following discussion is devoted to a description of the chemistry of asphalts with reference to physical properties as necessary. The more detailed physical model of asphalts is presented in the following paper (I).
Current Model
The current SHRP version of a chemical description or model of petroleum asphalt can be stated rather simplistically as follows. Petroleum asphalts are roughly a half and half mixture of polar and nonpolar (neutral), relatively nonvolatile, organic compounds in which the polars are in such close proximity that a wide variety of interactions among polars occur. These interactions are presumed to be noncovalent bonds that range from a few to about 30 kilocalories per mole with a somewhat uniform distribution of bond energies. This is confirmed by rheological studies (1). Asphalts show rather uniform changes in viscoelastic properties with temperature suggesting again that a wide variety of low energy chemical bonds comprise some son of microstructure.
The association appears to form a three dimensional network, or microstructure, that is intimately mixed with the neutral materials which behave somewhat as a plasticizer. Nuclear magnetic resonance (NMR) data have shown that intermolecular distances among polars are small, Le. no major aggregations of polar species exist, but rather that polar species are relatively uniformly distributed within the neutral materials (2). A resulting whole asphalt is therefore somewhat elastic in nature but also has some viscous flow characteristics. The elastic nature is presumed to arise from the three dimensional network which behaves as if it is relatively high in molecular weight. However, under high shear and/or thermal stress, the molecular weight appears to decrease as viscous flow properties begin to appear. The viscous flow arises from the change in orientation of polars with respect to each other under thenllal stress or stress of shear. The latter occurs without changes in any molecular structure; i.e., no chemical degradation occurs. Asphalts can also be described as metastable arrangements of polar niolecules in a nonpolar medium, and the particular metastable state depends upon the thennal and shear history of each asphalt.
Elastic response, such as a rapid traffic loading, is the desirable characteristic in which the time of stress is too short for rearrangement of molecular orientation. Hence, an asphalt
1273

responds elastically, flexing under traffic load, but returns to its original shape upon passage of the traffic. This property is important in avoiding a common failure mode known as rutting. Flow pmpenies, or viscous flow commonly called "creep," are also desirable and occur under prolonged periods of stress in which asphalts experience day-night as well as summer-winter thermal cycling.
The evidence to support this model has been gathered from a variety of studies and experiments and is summarized as follows. Petroleum asphalts have been dissected into a series of compound types by ion exchange chromatography (IEC) (3.4) and by size exclusion chromatography (SEC) ( 5 ) . The component types are principally strong and weak acids, strong and weak bases, amphoterics (molecular species with acidic and basic sites), aid neutral materials. Isolated neutrals may occur as waxlike (pseudocrystalline) materials or as oily materials which do not solidify. All fractions have aromatic and aliphatic carbon and hydrogen, hut the carbon and hydrogen aromatic to aliphatic ratios vary among fractions ant1 among asphalts (6). The polars, as defined by IEC, are generally a few percent bases, 10-20% acids, and 10-20% amphoterics. The specific percentage of each polar type varies with crude oil source.
Model compound studies using neutral (linear hydrocarbons) and their analogous mnno and diamines, mono and dibasic carboxylic acids, and amphoterics (amino acids), show that addition of diacids and amphoterics had the most profound effect on physical properties. The viscosities of asphalts spiked with diacids and with amino acids rose sharply compared with all other model compounds. When naturally occurring amphoterics were isolated by IEC and then used to enrich tank asphalts, viscosities typically skyrocket with small levels of enrichment. Acids and bases have a similar but less pronounced effect. Neutrals reduce viscosities.
Further evidence for the existence of a microstructure was found using SEC experiments. The SHRP asphalts were separated into two major fractions (I and 11) by SEC. The SEC experiments were conducted in toluene as a solvent, but as concentrated solutions which were chromatographed rapidly so as to disturb any microstructure as little as practically possible, Both fractions, as shown by carbon-13 NMR ( 6 ) . contain sufficient condensed aromatic hydrocarbons to be highly fluorescent. Fraction I is nonfluorescent despite the significant amounts of condensed aromatic hydrocarbons. This quenching of fluorescence suggests strong association among the SEC I components. Further, the vapor phase osn~ometry (VPO) molecular weight of Fraction-I i s always higher in toluene, a nondissociating solvent, than in pyridine, a strongly dissociating solvent. Fraction-II, on the other hand, is always highly fluorescent, suggesting a lack of association. The ratio of Fraction-I to Fraction-II is indicative of the ratio of the viscous and elastic moduli (7).
The probable existence of a microstructure was further demonstrated by cross blending SEC Fractions I and 11. These experiments also demonstrated the sensitivity of each fraction to the other. Numerous examples were studied and one is cited here as a typical example. Asphalts AAD-1 and AAM-1 were separated into their SEC Fractions I and II, cross blends were prepared, and the viscosities of the resulting products measured. A portion of this experhiient is as follows. Asphalt AAD-1 contains 23.4 wt % SEC-I and 76.6 wt % SEC-11.
1274

When AAD-1 was reformulated from its own SEC-I and -II, the viscosity was 3,000 poises at 60'C. When a mixture of 23.4 wt % AAD-I SEC-I and 76.6 wt % AAM-I SEC-I1 was formulated, the 60°C viscosity was 234,000 poises. Asphalt AAM-I is 30.6 wt % SEC-I and 69.4 wt % SEC-I1 with a viscosity of 5,400 poises. The crossblend of 30.6 wt % AAM-I SEC-I and 69.4 wt % AAD-I SEC-I1 had a 60°C viscosity of 380 poises. It is apparent hnmediately that Fraction I of AAM-1 is more dissociated by Fraction II of AAK-I than by its own Fraction 11. The opposite effect is observed for Fraction I of AAK-I blended with Fraction I1 of AAM-I. In general the dispersive character of SEC Fraction I1 increases with decreasing average molecular weight. Molecular weight distributions of SEC Fractions 11 were determined by supercritical fluid chromatography (8).
Ion exchange chromatography is a time consuming and expensive process, so it was decided to investigate the use of nonaqueous potentiometric titration (NAPT) to detennine the quantities and strengths of acids and bases in petroleum asphalts. The development of a method for measurement of bases was rather straightforward (9). However, upon attempting to titrate petroleum asphalts in chlorobenzene for quantities and strengths of organic acids, it was observed that there were no endpoints. In fact pyridine had to be used to dissociate the acids before endpoints could be found. This is further evidence for the persistence of a microstructure, even into dilute solution.
Still another series of experiments was carried out to imply the metastable nature of asphalts. In this study, which is noted as steric hardening experiments, asphalts were stored for extensive periods of time in a well protected atmosphere. In this particular case no atmospheric oxygen was available so no chemical reaction could take place. Yet, upon examining the viscoelastic properties, it was observed that the viscosities as well as the elastic moduli of the asphalts continued to rise as the asphalts were examined periodically over a time of several months.
Oxidative Aging
Prediction of aging of asphalts, that process in which asphalts increase in stiffness, has been of primary interest during the program. Aging is an unavoidable conditioning step, and not necessarily a cause of failure. In extreme cases, increases in stiffness to the point of embrittlement leads to cracking in roadways which in turn leads to deterioration to an unusable structure. Oxidation takes place naturally in asphalts as they are exposed to the atmosphere and this is a major contributor to aging. But other phenomena under the collective nanie of compatibility have a major effect upon how oxidation products affect the age hardening in asphalts (IO). For clarity, the terms oxidation and aging are distinguished as follows. Oxidation is used to describe increases in oxygen-containing products while aging (age hardening) is used to describe increases in the viscoelastic properties. The prediction of aging for all asphalts then becomes oxidation plus some measure of the ability of asphalts to accommodate oxidation products. Said differently, the prediction of aging from analytical information becomes a constitutive relationship that includes, but cannot be limited to, the level of chemical oxidation. We have shown (1 I), as have others (e.g., 12, 13). that aging of some asphalts has a rather sharp temperature dependence at higher pavement service temperatures (60-85°C [140-185°Fl). Aging at any temperature is related to asphalt source.
1275

Age hardening in asphalts has been shown to correlate well with the concentration of ketones formed upon oxidation for asphalts from any given crude oil regardless of grade, but aging differs shnrply among mphalts from different crudes. The amount of ketone formed i n asphalt from one crude oil cannot be used to predict viscosity changes in asphalt from another crude oil based solely on ketone concentration (IO).
A substantial series of experiments was conducted during the program to oxidatively age harden asphalts artificially. These experiments were based on those reported earlier by D.Y. Lee (14) and are collectively referred to here as those conducted in a pressurized aging vessel (PAV). The PAV experiments demonstrated clearly that both an increase in temperature and/or an increase in time resulted in an increasingly stiffer (aged) products. However, asphalts are not used in roadways as petroleum asphalts alone, but rather in contact with mineral aggregate. Hence a series of PAV experiments was conducted with asphalts in contact with a variety of different mineral aggregates together with control experiments. Asphalts recovered from mineral aggregate after PAV treatment generally had aged less than neat asphalt controls. The chemistry of aging does not appear to change over limited temperature ranges whether neat or on aggregate, only the rate appears to be substantially affected. This is predictable from the model. Polar sites on aggregates should promote structuring of polars in asphalt. As asphalts age the oxidizable sites are consumed hence the oxidation rate diminishes. An increasingly polar environment evolves as oxidation products are formed. Polar aggregate surfaces should induce greater amounts of structuring and hence quench, or slow, the observed rates of reaction compared to aging of asphalts in neat fonn. Aggregate induced structuring is consistent with the thermodynamic data reponed in project A003B (15).
The effects of oxidation on aging can be explained further in tenns of aniphoterics ( 1 6). It is clearly understood that the oxidation of carbon and sulfur species, those that oxidize in asphalts, do not produce strong bases. More typically, highly oxidized products of carbon and sulfur are acidic. However, oxidation of asphalts at pavement service temperatures produces principally ketones and sulfoxides, both of which are weak bases. It follows then that new amphoteric materials will be formed by the introduction of new, weakly basic sites. This should proniote development of the niicrostructure with the accompanying increase in viscosity and elasticity as was also demonstrated by spiking asphalts with amphoterics isolated by IEC. Nonaqueous potentiometric titration was an invaluable tool in determining the increase in weakly basic materials produced during oxidative aging of asphalts.
Oxidized asphalts exhibit yet another interesting behavior. Consider steric hardening again. Steric hardening of tank asphalts results in rather minor increases in viscoelastic prvperties with prolonged periods of storage. However, asphalts aged under PAV conditions show rather substantial increases in viscosity upon storage for prolonged periods of t h e . 111 one example, viscosity of an asphalt rose 11 million poise (1.1 million Pa. s) over a period of seven ntonths while stored at 25 "C (77 O F ) . Again, this suggests the metastable nature of asphalts and further suggests that the particular state is sharply sensitive to oxidation products.
1276
SUMMARY AND CONCLUSIONS
In summary, petroleum asphalts can be defined as concentrated mixtures of polar materials dispersed in neutral materials so that the polars form continuous, rather homogeneous, three-dimensional networks. Some molecular species in petroleum asphalts are sensitive to oxidation. This increases the polar content and hence the size and strength of the three dimensional microstructure. In turn, the viscosity and elasticity increase as aging proceeds.
ACKNOWLEDGMENTS
The work reported herein has been conducted as a part of Project A002A of the Strategic Highway Research Program (SHRP). SHRP is a unit of the National Research Council that was authorized by Section 128 of the Surface Transportation and Uniform Relocation Assistance Act of 1987. This project is titled "Binder Characterization and Evaluation" and is being conducted by the Western Research Institute, Laramie, Wyoming, in cooperation with the Pennsylvania Transportation Institute, Texas Transportation Institute, and SRl International. Dr. Raymond E. Robertson is the principal investigator. Dawn Geldien is the project administrator. The support and encouragement of Dr. Edward Harrigan, SHRP Asphalt Program Manager, and Dr. Jack Youtcheff, SHRP Technical Contract Manager, are gratefully acknowledged.
LITERATURE CITED
Anderson, D.A., and Christensen, D.W., Presented at the Fall 1992 ACS Meeting, Div. Fuel Chem. Vander Hart, D.L., Manders, W.F. and Campbell, G.C., Preprints, Div. Petrol. Chem., ACS, 2J (3) 445 (1990). Branthaver, J.F., Catalfomo, M.W., and Petersen, J.C., Preprints, Div. Petrol. Chem., ACS, 2J (3) 376 (1990). Branthaver, J.F., Catalfomo, M.W.. and Petersen, J.C., Fuel Science and Technol. Int.,
Branthaver, J.F., Duvall, J.J., and Petersen. J.C., Preprints, Div. Petrol. Chem., ACS, 2 (3) 407 (1990). kMingS, P.W., Desando, M.A., Raub, M.F., Moats, R., Mendez, T.M., Stewart, F.F., Hoberg, J.O., Pribanic, J.A.S., and Smith, J.A., Fuel Science and Technol. Int., (4-6) 887 (1992). Branthaver, J.F., Duvall, J.J., Petersen, J.C., Plancher, H., and Robertson, R.E., Fuel Science and Technol. Int., 9 (4-6) 1003 (1992). Barbour, F.A.. and Branthaver, J.F., Preprints, Div. Petrol. Chem., ACS, 35 (3) 421 (1990). Robertson, R.E., Schabron, J.F., Gwin, A.A., and Branthaver, J.F., Preprints, Div. Petrol. Chem., ACS, 21 (3) 913 (1992). Petersen, J.C., Transport, Res. Rec., 999.13 (1984). Harnsberger, P.M., Petersen, J.C., Ensley, E.K., and Branthaver, J.F., in press, Fuel Science and Technol. Int.
- 10 (4-6) 855 (1992).
1217
I

(12) Oliver, J.W.H., Fuel Science and Technol. Int., g ( 4 - 6 ) 501 (1992). (13) Kemp, G.R. and Predoehl, N.H., Proc. Assoc. Asphalt Paving Technol. 2 4 9 2 (1981). (14) Lee, D.Y., Final Report, Project 717s and 8288. Iowa Highway Research Board HR-
124, Engineering Research Institute, Iowa State University (1972). (15) Curtis, C.W., Final Report, Strategic Highway Research Program, Project A003B
(1991). (16) Branthaver, J.F., Kim, S.S., Catalfomo, M.W., and Goray, D.C., Presented at the Pa11
1992 ACS Meeting, Div. Fuel Chem. (1992).
1278

Chemical-Physical Property Relationships for Asphalt Cements and the Dispersed Polar Fluid Model
D.W. Christensen and D.A. Anderson The Pennsylvania Transportation Institute
Research Office Building University Park. PA 16802
Keywords: Rheology, chemistry, asphalt
Introduction
A comprehensive, quantitative model relating chemical compositional parameters to the physical properties of asphalt cement is needed in order to optimize the production and modifications of asphalt cements in terms of costs and potential pavement performance. The chemical-physical property relationships presented in this paper, although only semi- empirical in nature, represent a significant step towards the achievement of this goal.
This paper presents the results of research carried out under the auspices of the Strategic Highway Research Program (SHRP), on the chemical and physical properties of asphalt cement and the development of performance-related specifications for asphalt binders. The body of the paper discusses the materials and equipment used in the rheological characterization of the asphalts studied, and then presents a mathematical model for describing the linear viscoelastic behavior of asphalt binders. A series of empirical chemical-physical property relationships are then presented, relating various chemical compositional parameters to the viscoelastic model parameters. The significance of these empirical relationships are then discussed within the context of the dispersed polar fluid (DPF) model for asphalt microstructure, previously proposed by the authors as a more appropriate molecular structure for explaining the mechanical behavior of commonly used asphalt binders, as compared to the traditional micellar or colloidal model (1).
The Dispersed Polar Fluid Model
The DPF model is a conceptual model of the molecular structure of paving grade asphalt binders (I). It is an alternative to the traditional colloidal or micellar model. The most important difference between these two models is that the DPF model considers asphalt binders to be essentially single-phase systems, whereas colloidal models presume that there are two phases present, a continuous, low-polar phase, and a dispersed highly polar phase. In the traditional model, the dispersed phase is approximately represented by asphaltenes (2,3). According to the proposed DPF model, the mechanical properties of asphalt cement are dependent not upon the relative abundance of dispersed and continuous phases, but upon the magnitude and dispersion in both molecular weights and intermolecular forces (I). The DPF model applies only to paving asphalts currently in use. The authors do consider it is possible that certain asphalt binders, having very high concentration of polar molecules, may
1279

be prone to phase separation, in which case a colloidal treatment of the microstructure would be entirely appropriate. It is however the authors' belief that the vast majority of asphalt binders now in use are best treated as single-phase systems.
Materials and Methods
The asphalt cements used in this research are those included in the Materials Reference Library (MRL) established for execution of various SHRP research projects. A total of 17 asphalts were included for study in the research presented in this paper.
Dynamic mechanical analysis was performed on these asphalts using a Rheometrics Mechanical Spectrometer, model RMS-803. In this type of characterization, the linear viscoelastic properties of asphalt cements are characterized by determination of the complex modulus (G*) and the phase. angle (6) as a function of frequency. In this research, the frequencies used ranged from 0.1 to 100 radls, at temperatures ranging from -35 to 60 "C. Time-temperature superposition was used to construct master curves of G* and 6, and to construct the associated plots of the shift factor ( a m ) as a function of temperature (4).
Use has been made in this research of various chemical data available in the SHRP database. These include Corbett fraction data and number average molecular weights determined by vapor pressure osmosis in toluene at 60 "C. These data are summarized in Table 1.
Results
The mechanical response of viscoelastic materials such as asphalt cement is generally both time (frequency) and temperature dependent. In order to mathematical describe the linear viscoelastic behavior of asphalt cement, it is necessary to separate these effects, and model them as independent phenomena.
The frequency dependence of the linear viscoelastic response of asphalt cement can be mathematically modeled using the following series of equations. For characterizing the complex modulus as a function of frequency:
I s 2 m G'=GI [1+ [f]']
where:
G* = complex dynamic modulus, in Pa, at frequency w, rad/s G, = glassy modulus, typically 1 GPa
1280
1)

w, = the crossover frequency, rad/s R = the rheological index
A similar equation can be used to predict the phase angle, which is not presented here in the interest of brevity. The temperature dependence at high temperatures can be modeled using the well known Williams-Landel-Ferry (WLF) equation:
- 19(T-T,) (92+T-T,)
log a(T) =
where:
a(T) = shift factor at temperature T (T in "C) T, = the defining temperature, "c
At low temperatures, below Td, an Arrhenius function is used to characterize the shift factors:
H log a(T) = -2-
2.303R [ 3)
where:
H, = flow activation energy, 250 kJlmol for paving grade asphalts R = ideal gas constant, 8.314 M/mol-"K
In applying equations 1 through 3, the frequency w in equation 1 must be shifted relative to the selected reference temperature, which in this analysis has been chosen as T,. This shifting simply involves multiplying the actual frequency at temperature T by the shift factor a(T). Additionally, the crossover frequency, w,, must be shifted to the reference temperature.
Another parameter of interest in evaluating the viscoelastic response of asphalt cements is the steady state viscosity, 11.. This represents the coefficient of newtonian viscosity, and is directly proportional to the resistance to flow under linear conditions.
Some explanation of the meaning of the various linear viscoelastic model parameters is in order at this point. The glassy modulus G, represents the limiting complex modulus for a given asphalt cement, obtained at low temperatures and/or high frequencies. It is generally very close to lo9 Pa for most asphalts; in the chemical-physical models presented below, G, was assumed to be lo9 Pa. The crossover frequency w, represents the frequency at which tan 6 is equal to one. It is called the crossover frequency because at this point, the storage (G'=G* cos 6) and loss moduli (G"=G* sin 6) are equal; at higher frequencies, the loss modulus will be lower than the storage modulus, and at lower frequencies, the storage modulus is the lower. Therefore, w, represents the point where G' and G" "crossover." The crossover frequency can be physically interpreted as representing the hardness of an asphalt;
1281
higher values of w, are indicative of harder asphalt binders, with greater resistance to flow. The steady-state viscosity qo, as mentioned above, simply represents the coefficient of viscosity under linear flow conditions. This parameter and the crossover frequency are closely related. The rheological index R is proportional to the broadness of the relaxation spectrum. As the relaxation processes of an asphalt become more disperse, the value of R will increase, and the transition from glassy to viscous behavior becomes more gradual. Typically, pitch type asphalts will have a low value of R (approaching l), whereas highly oxidized asphalts will have higher values, approaching or exceeding 3. The rheological index is numerically equivalent to the log of the ratio of the glassy modulus to the complex modulus at the crossover frequency. The meaning of these various parameters are graphically indicated in Figure 1, which depicts a typical plot of G* versus w for a paving grade asphalt binder. The values of these parameters for the asphalts used in this research are given in Table 2.
The defining temperature, T,, is a parameter characteristic of the temperature dependency of a selected asphalt. The value of Td ranges from about -20 to 0 "C for commonly used asphalts, and is thus in the same range as the glass transition. As the defining temperature increases, the change in the shift factor with respect to temperature becomes greater, indicating an increase in temperature dependency. This is shown in Figure 2, which shows a plot of the shift factors calculated from equations 1 and 2, using Td values of -20 and 0 "C. The defining temperature can be thought of as analogous to, or closely related to, the glass transition temperature. The authors however consider the glass transition to be a somewhat nebulous and controversial concept; if it exists for asphalt cements, it is certainly quite broad and poorly defined. Therefore, we suggest the use of the term "defining temperature," meaning a characteristic temperature which defines the temperature dependence of an asphalt, and which, as will be pointed out in the discussion, represents an approximately equivalent rheological point for comparison of the flow properties of asphalt cements.
Taken together, equations 1 through 3 allow the calculation of the complex modulus over a wide range of temperatures and frequencies. From such information, rational evaluation of the potential performance of an asphalt can be made, based upon its predicted mechanical response. These equations are generally valid at low to intermediate temperatures. At high temperatures, as viscous flow is approached, modifications are needed, which in the interest of brevity, are not presented here.
Chemical-Physical Property Relationships
According to the DPF model, asphalt cement should be considered to be a single phase system, though exceedingly complex in composition and interactions among chemical species. The temperature dependence is primarily controlled by free volume effects; increasing temperature results in an increase in free volume among the constituent molecules, which increases molecular mobility and decreases resistance to flow (5). According to the proposed theory, the time dependence of asphalt cements is a function of the overall strength of molecular interactions, and the distribution in strengths of these interactions.
1282

In developing chemical-physical property relationships, use was made of Corbett fraction data and number average molecular weights. Although these particular data should not be considered optimal for developing chemical-physical property relationships within the framework of the DPF model, they are adequate. Additionally, these are the only useful data available on all the SHRP asphalts at this time. Various linear regression models were proposed and evaluated, in which the rheological model parameters were predicted from one or two chemical parameters. Only those models which could be physically interpreted were considered. From this analysis, a series of empirical equations have been developed which can be used to predict the linear viscoelastic model parameters, and thus the stress-strain response, for a given asphalt cement. These equations are presented below.
For predicting the defining temperature, the following relationship was found (? = 0.53, adjusted for degrees of freedom):
12,400 T,= 16-0.57A-- M"
4)
where:
A = asphaltene content (n-heptane), weight percent M, = number average molecular weight, from VPO in toluene at 60 "C, Daltons
The following empirical equation was found to provide the best prediction of the crossover frequency w, at the defining temperature, T, (R2 = 0.47, adjusted for degrees of freedom):
10gw,pd) = -0.79-0.055A 5)
The equation developed for estimating the rheological index R from the chemical data is as follows (? = 0.81, adjusted for degrees of freedom):
R = -0.49+0.0018Mn+ 1 . 9 0 0 a) (p + N)
where
S = saturate content, weight percent P = polar aromatic content, weight percent N = napthene aromatic content, weight percent
Measured and predicted values of R are compared graphically in Figure 3.
The final model presented here, for predicting the steady-state viscosity at the defining temperature qO(Td), is given below (? = 0.71, adjusted for degrees of freedom):
1283
logq,(T,) = 7.42 +0.094A +O.O36P 3
Predicted values of the steady-state viscosity are plotted against measured values in Figure 4.
In estimating the linear viscoelastic response of a selected asphalt using these equations, the various rheological model parameters are first estimated from the empirical chemical- physical property relationship. Then, equations 1 through 3 can be used to predict the dynamic mechanical response at a n y given temperature. To provide an indication of the overall accuracy of these models, Figure 5 is presented, in measured values of G* at 10 radls, for various temperatures, are plotted against predicted values. The agreement is within about a factor of two, which although not suitable for engineering design purposes, is certainly useful for a semi-quantitative evaluation of the effect of chemical compositional variables on the mechanical behavior of asphalts. A similar plot is shown as Figure 6, where measured and predicted shift factors are compared. The agreement between measured and predicted values is similar to that Seen for G*. Predicted modulus values can be used to predict the potential performance of a given asphalt cement. For example, these equations can be used to estimate the limiting stiffness temperature, which represents the temperature at which at given stiffness is achieved at a selected loading time. This limiting stiffness temperature then represents the predicted cracking temperature for a pavement made with the given asphalt cement (4).
Discussion
The observed dependence of T, on asphaltene content and molecular weight (equation 4), can be explained using the concept of free volume. The WLF equation can itself be derived from free volume considerations; from this sort of analysis, it can be shown that for a given form of the WLF equation, and assuming similar coefficients of thermal expansion above and below the glass transition, the reference temperature (T, in this case) will approximately represent a point of equal free volume for a given family of materials (5). Therefore, for asphalt binders, factors which tend to increase free volume will decrease Td, whereas factors which act to decrease free volume will increase Td. For most viscoelastic systems, an increase in molecular weight will decrease free volume, which explains the observed dependence of T, on the number average molecular weight. The observed decrease in T, with increasing asphaltene content at first may Seem contradictory. This however can be justified if it is assumed that increasing concentration of polar functions groups, rather than resulting in a net attraction among constituent molecules, results in a net repulsive force. This would tend to increase free volume, thus resulting in a higher defining temperature. The assumption of a net repulsive force among polar molecules is reasonable, since this is required for a stable dispersion (6). However, if the concentration of highly polar species is increased to the point of phase separation, a net attractive force would then exist. This should be expected to increase T,, resulting in both a harder asphalt and an increase in temperature dependency. This may in fact explain the observed rapid failure of pavements constructed with asphalt cements having high asphaltene contents (6,7).
1284

In developing the empirical relationships for the crossover frequency and the steady-state viscosity, both parameters were defined with Td as the reference temperature. The discussion above concerning the effects of free volume should make the reason for this apparent to the reader. Since resistance to flow is so highly dependent on molecular mobility, and hence free volume, relating parameters such as o, and qo at random free volume states is pointless. By defining these parameters at T,, which represents an approximately equivalent point of free volume, these effects are reduced or eliminated. The major factor effecting resistance to flow under such equal free volume states will then be intermolecular friction (5). From both equation 5 and equation 7, it is clear that resistance to flow for asphalt cements, at equal free volume, increases directly with increasing concentration of highly polar molecules. This is an obvious result of the increased intermolecular friction resulting from greater concentration of highly polar function groups within an asphalt.
'
The empirical model for estimating the rheological index R from molecular weight and Corbett data can be explained as follows. From consideration of various molecular models for viscoelastic materials, it can be deduced that the complex modulus at tan 6 = 1 should decrease with increasing molecular weight. Additionally, data on the molecular weight distribution of asphalt cements suggests that higher molecular weights are normally consistent with broader molecular weight distributions, which would also tend to decrease the modulus at the crossover point (8). As G* at the crossover decreases, R will increase; thus, the observed increase in R with increasing molecular weight. The second term in equation 5 is a parameter suggested by the authors as being indicative of the dispersion in dipole strengths among an asphalt cements constituent molecules. This parameter, consisting of the sum of the asphaltenes and saturates, divided by the sum of the napthene and polar aromatic fractions, represents the ratio of the very strongly polar and non-polar fractions of the asphalt, divided by the fractions of intermediate polarity. As this parameter increases, the dispersion in the polar forces within an asphalt should increase. Increased dispersion in such intermolecular forces, according to the DPF model, should produce a broader relaxation spectrum, and hence a higher rheological index. This is in fact supported by the form of equation 5.
Although the above series of equations is empirical, each of these equations is based on clear assumptions about the nature of the molecular sources of viscoelastic behavior in asphalt binders. These assumptions stem from the primary hypotheses of the dispersed polar fluid model. In some cases, such as with the use of the Corbett fraction data in predicting viscosity and rheologic type, alternate explanations could be made using the standard colloidal model of asphalt. Therefore, the construction of the quantitative model for chemical-physical property relationships is unfortunately not irrefutable proof of the validity of the DPF model. However, the construction of the chemical-physical property model presented here was made possible only by discarding many of the aspects of the traditional colloidal theory of asphalt microstructure, and replacing them with concepts based upon a single-phased, though complex, model of molecular structure.
1285

Conclusions
1.
2.
3.
4.
5.
The temperature dependence of asphalt cements can be effectively explained using free volume concepts; increasing molecular weights decrease free volume, resulting in an increase in temperature dependency, whereas increasing polarity increases free volume, having the opposite effect.
Increasing amounts of highly polar material increase intermolecular friction in asphalt cements, increasing resistance to flow and overall hardness. This relationship can only be analyzed for a wide range of systems by comparison at a point of equal free volume, such as the defining temperature.
The rheologic type of an asphalt, or relaxation spectrum width, increases with increasing molecular weight and with increased dispersion in the strength of polar functional groups among constituent molecules.
The above relationships have been empirically quantified, and can be used in conjunction with a mathematical model to predict the linear viscoelastic response of a wide range of asphalts using chemical compositional parameters.
The results of this research lend significant support to the primary aspects of the dispersed polar fluid model of asphalt microstructure.
Literature Cited
(1) Christensen, D.W., and Anderson, D.A., International Symuosium on the Chemistrv of Bitumens, Rome, Italy (1991).
(2) Nellenstyn, F.J., J. Inst. Pet. Tech., 14, 134 (1928).
(3) Labout, J.W.A. In The Properties of Asuhaltic Bitumen, p. 13 (1950), Elsevier, New York.
(4) Christensen, D.W., and Anderson, D.A., Proc. AAPT, 61, 437-475 (1992).
(5) J. D. Ferry, Viscoelastic Properties of Polvmers, John Wiley & Sons, New York (1980).
(6) Zube, E, and Skog, E., Proc. AAPT, 3, 1-29 (1969).
(7) Halstead, W., Proc. AAPT, 3, 91-111 (1985).
(8) Barbour, F. A., and Branthaver, J. F., Chemistrv and Characterization of Asuhalts, ACS Preprints, 35(3), 421-430 (1990).
1286

Tab1
Asphalt
AAA- 1 A A E 1 AAC-1 AAD-1
AAE-1 AAF- 1 AAG-1 A M - 1
AAK-1 AAL-1 AAM- 1 AAN- 1
AAO- 1 AAP- 1 AAQ 1 AAR-1
AAS-1 AAT- 1 AAU- 1 AAV-1
AAW-1 AAX-1 AAY-1 AAZ-1
1. Corbel
4sphaltene Content
Wt. %
18.3 18.2 11.0 23.0
22.9 14.1 5.8
10.6
21.1 18.9 3.9
15.7
16.4 12.6 16.2 18.4
18.3 17.3 17.7 9.2
17.9 11.9 22.4 8.9
‘raction D
Polar Aromatics
Wt. %
37.3 38.3 37.4 41.3
30.5 38.3 51.2 41.5
41.8 37.3 50.3 33.9
32.9 36.9 25.9 30.5
34.1 42.5 40.5 39.5
35.7 41.3 31.4 42.0
I and Mo
Napthene 4romatics
Wt. %
31.8 33.4 37.1 25.1
31.6 37.7 32.5 35.9
30.0 30.3 41.9 40.1
41.8 36.4 44.8 41.1
39.7 32.3 33.6 38.9
37.1 39.6 35.4 43.1
:ular Wc
Saturates
Wt. %
10.6 8.6
12.9 8.6
12.7 9.6 8.5
10.9
5.1 12.1 1.9
10.3
8.6 13.2 12.5 10.0
5.9 7.7 7.9
10.9
9.3 7.9 9.4 6.8
Its.
M.
Daltons
790 840 870 700
820 840 710
1030
860 760
1300 890
930 1090 810 880
960 880 880 890
890 970 860 970
1287
c

I
-19.3 -11.6 -5.5
-17.1
-10.4 -7.0 -3.9 -4.7
-14.7 -15.7
1.0 -5.4
-10.1 -5.1 -5.6 -5.3
-9.5 -5.8 -3.9 -5.4
0.0 -0.9 -8.5 -1.0
Asphalt
-2.03 -1.97 -1.16 -2.01
-1.98 -2.07 -1.43 -1.67
-2.33 -1.28 -1.26 -1.32
-1.78 -1.77 -1.46 -1.54
-1.93 -1.96 -1.34 -0.93
-1.50 -1.24 -2.07 -1.09
AAA-1 AAB- 1 AAC- 1 AAD- 1
AAE- 1 AAF- 1 AAG- 1 A N - 1
AAK-1 AAL- 1 AAM- 1 AAN-1
AAO-1 AAP-I AAQ- 1 AAR-1
AAS-1 AAT- 1 AAU- 1 AAV- 1
AAW-I AAX-1 AAY-1 AAZ-1
I
del Parami
R
1.50 1.76 1.63 1.66
2.11 1.60 1.24 1.90
1 .a 1.61 1.93 1.68
1.66 2.14 1.66 1.89
1.79 1.72 1.72 1.53
1.97 1.66 2.04 1.44
!Is.
$0
at T,
Pa-s
10.98 10.57 9.82
11.05
10.60 10.50 9.95
10.00
11.31 10.37 9.60
10.09
10.33 10.14 9.94
10.08
10.49 10.50 9.94 9.60
9.97 9.85
10.62 9.52
1288

t
ti
10
5 -
0 -
--E(
-5 0 5 10 15
Reduced Frequency, radls
-Td = -20 C - - T d = O C
-
- - ~ ' ' ' ~ ' ~ ' * ' ~ ' ~
Figure 1. Typical master curve for asphalt binder, showing meaning of model parameters.
- -60 4 0 -20 0 20 40 60 80
Temperature, C
Figure 2. Shift factors as a function of temperature, for different T; values.
1289

50' " " I ' " " ' " " " " .50 1.00 1.50 2.00 2.50
R from Moster Curve
le11
le10
le9
Figure 3. Values of the rheological index, R, as predicted from chemical-physical model and determined from analysis of dynamic shear data.
r
7
I , , , , , , , , , , , , , , , L
le12 t
Figure 4. Values of qo at the defining temperature predicted from chemical-physical model, and as determined from analysis of dynamic shear data.
1290

le9
le8
le7
le6
le5
le4
le3
lelO e
Figure 5. Comparison of predicted and measured values of the complex modulus, G*, at 10 radls and at various temperatures.
10 -
5 -
0 -
-5' ' ' ' ' ' ' ' ' ' ' ' ' ' ' I ' ' ' ' -5 0 5 10 15
Log o(T) from Master Curve
Fire 6. Predicted and measured values of log am.
1291

INVESTIGATION OF ASPHALT-AGGREGATE INTERACTIONS IN ASPHALT PAVEMENTS
Christine W. Curtis Chemical Engineering Department
Auburn University, AL 36849-5127
ABSTRACT
Asphalt-aggregate interactions in asphalt pavements directly influence the adhesion of asphalt to aggregate and determine the strength of the bond between them. These interactions also determine how well the bond is maintained in the presence of water. This investigation examined the physicochemical phenomena that occur at the asphalt-aggregate interface as well as the long-range effect of the interstitial asphalt on the asphalt-aggregate bond. The adsorption behavior of model asphalt components, asphalt fractions and asphalts on aggregates of various petrography was evaluated. The effect of water on the bond between asphalt and aggregate was described through desorption studies. The adsorption and desorption behaviors between asphalt and aggregate were more strongly influenced by the aggregate chemistry and properties than those of the asphalt. Although the influence of asphalt chemistry was smaller than that of the aggregate, asphalt chemistry did affect asphalt-aggregate interactions. A test was developed that evaluated the affinity of different asphalt-aggregate pairs and their suspectibility to water.
INTRODUCTION
Asphalt-aggregate interactions are important in the adhesion of asphalt cement to aggregate because the asphalt must adhere to the aggregate for the adhesive binding action of asphalt to occur. In a road pavement, aggregate composes 94 to 95% by weight of the mix while asphalt makes up the other 5 to 6%. Any additives that are added to improve the performance of the pavement are typically added to the asphalt. The aggregate is present in a multiplicity of sizes ranging from 314 inch fraction to fines that are in the -200 mesh range. The larger aggregate sizes are distinct entities in the asphalt pavement while the finer particles can be visualized as an extended portion of the asphalt itself. As asphalt contacts aggregate and forms the mix that is used for the various road courses, the asphalt molecules interact directly with the active sites on the aggregate surface. The surfaces of the aggregates vary considerably in their chemistry, surface area, pore-size distributions, and rugosity. Hence, the aggregate, which can be limestone, gravel, granite, greywacke, basalt, to name a few, can have markedly different active surface sites that are available for interaction with asphalt molecules. Asphalts, being the bottoms product from petroleum refining of crude oils, also vary considerably in their chemistry, because of the differences in their source crudes. Hence, the interaction between the asphalt and aggregate is dependent on the chemistries of both.
Many factors influence the strength and longevity of the bond between asphalt and aggregate. Environmental and traffic factors take their toll. Water, in the form of rainfall or humidity, can have a direct and insidious effect on the adhesive bond between asphalt and aggregate. Moisture damage to the asphalt-aggregate bond results in the deterioration of the
1292

bond through adhesive failure at the interface or cohesive failure within the asphalt or aggregate. These failures cause the asphalt to separate or strip from the aggregate, leaving the aggregate loose without a binder to keep the aggregate particles and, hence, the pavement together.
The overall objective of this work was to investigate and understand fundamental aspects of asphalt-aggregate interactions including both chemical and physical processes. A number of different aspects of this problem was evaluated including chemistry of the interaction between asphalt and aggregate, the effect of the interstitial asphalt on the bond, the effect of the aggregate on aging, and the water sensitivity of the asphalt-aggregate pair. This work, performed under the Strategic Highway Research Program Contract A-003B, covered many different aspects of asphalt-aggregate interactions which are summarized in this paper. A number of researchers was involved in this study who will be referenced in the text.
ASPHALT-AGGREGATE INTERACTIONS
The initial model of asphalt-aggregate interactions that was postulated was the adherence of asphalt at the asphalt-aggregate interface, followed by the development of a structured interphase region, which lay between the interface and the bulk, unstructured asphalt. A new understanding and model of asphalt-aggregate interactions have emerged out of the research performed. During hot mix processing, asphalt components contact and adhere to the interfacial surface of the aggregate with the more polar constituents, those compounds containing heteroatoms of sulfur, nitrogen, or oxygen, being the most competitive for the active sties on the aggregate. Physiorption rather than chemisorption usually occurs with most of the interactions being electrostatic, dipole-dipole, or Van der Waals interactions. Asphalt once contacted with the aggregate surface remains relatively stationary; although under high temperature and stressful conditions the molecules have an opportunity to move, change orientation and diffuse (Hicks, 1991).
Effect of Chemistry on Adhesion Asphalt is a complex 'material composed primarily of hydrocarbons but contains a
variety of functional groups containing heteroatoms of C, N, H, and metals such as vanadium and nickel, which are present primarily in the asphaltene fraction. A study by Scott (1978) has shown that when asphalts were contacted with aggregates, oxygen-containing groups from asphaltenes were preferentially adsorbed on the aggregate surface. Fritschy and Papier (1978) observed a similar behavior from the polar asphaltenes. Likewise, Curtis et al. (1989a, b) have shown that asphaltenes adsorbed more on sandstone and limestone than did the parent asphalt.
Asphalt is a complex material with many different types of compounds and functional groups present. Adsorption studies were performed with both asphalt model compounds, that represented the type of functional groups present in asphalt, asphalt and asphalt fractions. Adsorption tests involving model compounds gave the following ranking averaged over a series of aggregates, including granites, limestones, gravels, and greywacke: sulfoxide > carboxylic acid > nitrogen base > phenol > ketone > pyrrole > 4-ring aromatic > 2-ring aromatic. The adsorption of polar asphalt model compounds on the different aggregates was much larger than the less polar or nonpolar compounds. Likewise, the larger molecular size
1293

fraction of asphalt, that contains the most polar groups, adsorbed more on the aggregate surface than did the smaller molecular size fraction and, usually, even more than the asphalt itself.
Water attacks the bond between asphalt and aggregate. Evaluation of the effect of water on the adsorbed models showed that models with carboxylic acid and the basic sulfoxide functional groups desorbed readily while the phenolic and nitrogen-base models were more able to withstand the effects of water and remain on the surface of the aggregate. Components that had the most affinity for the aggregates also tended to have the most sensitivity to water.
Aggregate chemistry plays a key role in the adsorption of asphaltic components, the adhesion of the asphalt to the aggregate, and the retention of the asphaltic components in the presence of water. Each aggregate of a given bulk mineralogical type has a unique surface chemistry. These active sites promote adsorption of asphaltic components, particularly ones with polar functional groups. The covering of those active sites by nonpolar C8 or C,8 hydrocarbons completely masks their activity, while changing the chemistry of the sites by adding amine groups affects the adsorption behavior of both asphaltic models and asphalts themselves (Curtis et al., 1992). Dust coatings occurring naturally on aggregate surfaces can change the chemistry of adhesion and result in weak bonding between the dust and aggregate surface, leading to attrition of the bonding forces that help maintain the adhesion and, hence, the pavement.
Evaluation of asphalt-aggregate interactions in terms of the adsorption and desorption isotherm behavior of three different asphalts from solutions onto four different aggregates showed that aggregate chemistry is much more influential than asphalt chemistry for both adhesion and sensitivity to water. For a given asphalt, large differences were observed in the amount of asphalt adsorbed and retained after exposure to water when using both siliceous and calcareous aggregates (Brannan et al., 1991). Likewise, for a given aggregate, the differences observed in the adsorption of three different asphalts was much less than that for a single asphalt and several aggregates.
Net Adsorption Tests. A test that provides a method for determining the affinity of an asphalt-aggregate pair and its sensitivity to water was developed. This test is called the Net Adsorption Test. The test is composed of two steps: first, asphalt is adsorbed from toluene solution and the amount of asphalt adsorbed is measured; and second, a small amount of water (-280 mM) is introduced into the system, asphalt is desorbed from the aggregate surface, the amount of asphalt desorbed is measured and the net amount of asphalt remaining on the aggregate surface is measured. This value is termed the net adsorption and provides a means of directly comparing the affinity and water sensitivity of different asphalt-aggregate pairs (Curtis et al., 1992).
The net adsorption of an asphalt aggregate pair is dependent on both the asphalt composition and the aggregate chemistry and morphology. The amount of asphalt adsorbed for eleven aggregates, which were composed of limestones, granites, greywacke, gravels, and basalt, ranged over an order of magnitude for a given asphalt at a preselected asphalt solution concentration (Figure 1). Water sensitivity was also strongly dependent on the chemistry of the aggregate. For some aggregates, half or more of the initial asphalt adsorbed desorbed into a toluene solution that contained only a very small amount of water. For those aggregates that showed substantial water sensitivity, the asphalt chemistry seemed to have a larger influence than on those aggregates that were not sensitive to water.
1294

Bonding Energy. The influence on the composition and chemistry of the aggregate on the amount of heat released or bonding energy was substantial (Ensley, 1990). The bonding energy of the asphalt-aggregate mixture is measured by immersing the aggregate in the asphalt and measuring the resulting exotherm. Eleven aggregates were evaluated with a series of different asphalts. The aggregates could be ranked according to their bonding energy because of the large differences observed among them. By contrast, the ranking of asphalts in conjunction with a given aggregate was not easily discemable.
Early research involving determining the bonding energy associated with asphalt-aggregate resulted in an initial exotherm followed by a small release in energy over a fairly long time period (Ensley and Scholz, 1972). These results were interpreted as the development of an interphase region between the asphalt-aggregate interface and the bulk, unstructured asphalt. The interphase region was hypothesized to be a structured region where asphalt molecules were ordered according to their dipole-dipole interactions. However, the research performed recently (Ensley, 1992) did not show the same long-term, low energy release. Additionally, autoradiographic measurements of asphalt contacted to aggregate gave no evidence of the formation of a structured interphase region (Ross, 1990). Aging experiments, performed to evaluate the effect of aggregate on asphalt oxidation, examined the region between the asphalt-aggregate interface and 100 pm out from the aggregate surface. This region, which was sampled every 24 pm, showed no differentiation in the chemical composition that was detectable by infrared analysis.
Asphalt-Aggregate Model, The evidence obtained in this research indicated that the asphalt-aggregate mixtures can be modeled as a system in which large, small, and fine aggregate particles are either coated with asphalt or suspended within the asphalt. Asphalt adheres to the outer surface and penetrates into the pores, crevices, and interstitices of the aggregate. The active sites on the aggregate particle attract the most polar and bondable asphalt species upon initial contact. Competition exists among the various asphaltic constituents with the polar components being most competitive (Jeon and Curtis, 1992). Most asphalt molecules are directly contacted with an aggregate or with another asphalt molecule in contact with or close to an aggregate surface. The fines that compose 5 to 8% of the aggregate are interspersed with the aggregate forming a mastic, a medium in which it is difficult to distinguish macroscopically between asphalt and aggregate.
Aging. Aging studies showed that carboxylic acids, ketones, and sulfoxides increased with oxidative aging, at the interface and in the asphalt at distances of 25 pm to 100 pm from the aggregate surface (McKay, 1992). The number and type of oxidative aging products appear to be directly related to the compositional chemistry of the asphalt. The higher the indigenous sulfur content is in a particular asphalt, the higher the sulfoxide formation is under oxidative conditions.
The changes caused by oxidative aging can potentially affect the nature of the chemistry of the interface. The compounds typically produced are sulfoxides, carboxylic acids and ketones. Both sulfoxides and carboxylic acids have a high affinity for the aggregate surface. However, when the moisture sensitivity of these model compounds was evaluated, these two models with the high affinity for the aggregate showed the most sensitivity to water.
Hence, oxidative aging may produce substantial changes in the chemistry of the asphalt-aggregate interface, particularly with an asphalt-aggregate pair that is particularly susceptible to aging. The adhesion of the asphalt to the surface is dependent upon the types
Interphasal Asphalt.
1295

of species at the interface and their ability to bond strongly to the surface. The resistivity of that bond to environmental factors, particularly the intrusion of water, is essential for maintaining long pavement life. Since several of the functional groups present after oxidative aging are susceptible to water, the resistivity of the asphalt-aggregate bond may be weakened by the presence of water.
Water Sensitivity Stripping of asphalt from aggregate stems from the intrusion of water into the asphalt-
aggregate system. The modes of failure depend upon the character of the system and include: Separation of the bond at the interface Cohesive failure within the asphalt Cohesive failure within the aggregate
0 Phase separation of components when the presence of water increases the solubility of polar compounds through hydrogen bonding.
If the water-proofing layer of asphalt surrounding an aggregate particle is continuous, then water can penetrate the system by diffusing through the asphalt film removing along the way those asphaltic components that are solubilized. If cracks occur in the film, then water can intrude to the asphalt-aggregate interface, causing failure at or near the interface. The failure can be interfacial or cohesive either in the asphalt or in the aggregate. Reduction in water damage can be attained by modifying the aggregate surface through silylation or the addition of antistripping agents. However, complete covering of the particle by an asphalt film should decrease the quantity of water reaching the aggregate and reduce the deleterious effect of water on the aggregate. Building of roads with low air voids or good drainage may be most influential in reducing water damage, by limiting the exposure of the asphalt-aggregate bond to water.
Resilience of Asphalt-Aggregate Bonds. Adhesion between an asphalt-aggregate pair can be promoted or inhibited by processing and environmental factors. As part of this research, the effect of pH on the asphalt-aggregate bond was investigated. High pH found in a very basic medium was detrimental to most asphalt-aggregate bonds; however, treatment at somewhat lower but still basic pH did not affect the bond substantially (Tamer, 1992). Curing at elevated temperatures after mixing promoted adhesion in some asphalt-aggregate pairs. A test involving the factors of increased pH and curing was incorporated into the modified Lottman (T-283) test and has been suggested as a means of differentiating among asphalt-aggregate combinations. Those particular asphalt-aggregate combinations that did not perform well under chemical preconditioning (high pH) or curing were treated with additives, either liquid antistripping agents or lime, to improve their performance. Retesting the treated mixture under the stringent pH conditions offers a means of determining the effectiveness of the treatment.
SUMMARY AND CONCLUSIONS
Asphalt-aggregate interactions are strongly influenced by the composition and surface chemistry of the aggregate. Aggregate properties are much more influential in determining adsorption and stripping behavior than are asphalt properties. The net adsorption test demonstrated the large differences in asphalt affinity and stripping propensity occur among aggregates of different minerialogy. Asphalt compounds with polar functional groups are
1296

highly competitive for the active sites (i.e., those sites that contain metals or charged species) on the aggregate surface. Some polar compounds that adhere competitively to the aggregate surface are highly susceptible to water and are readily removed from the aggregate surface. Changes in pH, particularly very basic pH, can be detrimental to the bond between asphalt and aggregate. Curing of the asphalt-aggregate bond can improve bonding between a particular asphalt-aggregate pair although that interaction is highly specific. Specificity among the different asphalt-aggregate combinations was readily apparent in both the adsorption and desorption studies and the bonding energy measurements. The interactions between asphalt and aggregate are dominated by aggregate chemistry. Asphalt chemistry also has an influence, though much smaller than that of the aggregate, on asphalt-aggregate interactions.
Nomenclature for Figure 1.
RA = granite RE = gravel RG = gravel RB = granite RF = glacial gravel RH = basalt RC = limestone RG = sandstone RL = gravel RD = limestone
REFERENCES
Brannan, C.J., Curtis, C.W., Perry, L.M., Jeon, Y.W. Trans. Res. Rec., 1323, 1991, 10- 21. Curtis, C.W., Jeon, Y.W., and Clapp, D.J. Fuel Sci. Tech. Int,, 7, (9), (1125), 1989a. Curtis, C.W., Jeon, Y.W., Clapp, D.J., and Kiggundu, B.M. Trans. Res. Rec., 1228, (112), 1989b. Curtis, C.W., Terrel, R.L., Perry, L.M., Al-Swailmi, S., and Brannan, C.J. Journal of AAPT, 69, 1991, 476. Curtis. C.W., Gardiner, M.S., Brannan, C.J., and Jones, D.R. Trans. Res. Rec,, in press, 1992. Ensley, E.K. and H.A. Scholz, J. Inst. Petrol., 58, 1972, 95. Ensley, E.K.. Final Report, SHRP Contract A-O03B, 1992, 265. Fritschy, G. and Papirer, E., 57, 1978, 701. Hicks, G. Personal Communication, 1991. Jeon, Y.W. and Curtis, C.W. -. 10, 1992, 697. McKay, J. Final Report, SHRP Contract A-003B, 1992, 167. Podoll, R.T., Becker, C.H., Irwin, K.C. "Surface Analysis by Laser Ionization of the Asphalt-Aggregate Bond," Phase I Progress Report, (SHRP AIIR 07), April 1990. Podoll, R.T., Becker, C.H., Irwin, K.C. "Surface Analysis by Laser Ionization of the Asphalt-Aggregate Bond," Phase I1 Progress Report, (SHRP AIIR 07), 1991. Ross, D.S. "Fundamentals of the Asphalt-Agregate Bond," Phase 2 Report (SHRP AIIR-1 l), 1991. Ross, D.S. Presented by D. R. Jones at the SHRP A-003B Advisory Council Meeting, National Center for Asphalt Technology, Auburn University, May 1991. Scott, J.A.N. Proc. AAPT, 47, 1978, 19. Tamer, A.R. Final Report, SHRP Contract A-O03B, 1992, 151.
RH = greywacke
1297

r:!
a
L1. 9 M c
LJ 9 c a
I c
Y Q a
I ' I
0 1 a a
1298

Isolation and Characterization of Amphoteric Components of SHRP Asphalts by Ion Exchange Chromatography
Jan F. Branthaver, S.S. Kim, M.W. Catalfomo, and D.C. Goray Western Research Institute
P.O. Box 3395 Laramie, Wyoming 82071-3395
Keywords: Asphalt, Amphoterics, Ion Exchange Chromatography
ABSTRACT
An ion exchange chromatography separation procedure was devised for the purpose of isolating compounds of amphoteric nature from four asphalts studied in the Strategic Highway Research Program. Amphoteric materials constitute about 18-25% of the asphalts studied. Other defined chemical fractions (neutral, acidic, and basic fractions) also were collected. Of the four fractions, the amphoteric is the most polar and most aromatic in each of the asphalts. Number-average molecular weights of the amphoteric fractions are two-to-four times greater than those of the parent asphalts.
Several mixtures of the above ion exchange chromatography fractions with each other and with whole asphalts were prepared and their viscosities were measured. Based on these studies, amphoterics are the chemical component of asphalts most responsible for high viscosities. Polyfunctional compounds that are of purely acidic or basic character do not appear to be present in large amounts.
INTRODUCTION
One model of asphalt structure proposes that asphalts can be considered to be dispersions of polar, aromatic molecules in solvent moieties consisting of less polar, more aliphatic molecules (1). The relative amount of polars and the effectiveness by which they are solubilized will be major determinants of asphalt properties (2). If this model is correct, polyfunctional polar molecules should contribute disproportionately to the buildup of niolecular associations, which presumably govern such asphalt bulk properties as viscosity. Polyfunctional molecules may be categorized as amphoteric, polyacidic, or polybasic. It should be possible to isolate these materials and study their properties if the model described above is correct.
The technique of ion exchange chromatography (IEC) has been used to separate tar sand bitumens, shale oils, crude oils and their components into defined chemical fractions (3-9). When used to separate the above mentioned substrates, IEC works as a form of affinity chromatography. Usually, neutral, acidic, and basic fractions of varying strengths are collected. An IEC separation method used for the separation of asphalts studied in the
1299

Strategic Highway Research Program (SHRP) into neutral, acidic, and basic fractions (4, 5 ) was modified to separate asphalts into neutral, acid, base, and amphoteric fractions.
EXPERIMENTAL
The experimental details of the IEC separation of asphalts, including resin activation, have been published (4.5). In the conventional IEC separation, solutions of asphalts in either a mixed solvent (benzene, tetrahydrofuran, ethanol) or cyclohexane are pumped through two COIUINIS, the first filed with activated anion resin, and the second filled with activated cation resin. For the separation of amphoterics, a solution of asphalt (16 g) in cyclohexane (64 mL) was pumped into a jacketed column filled with activated cation resin (Bio-Rad MP-50, 100- 200 mesh). AU molecules with one or more basic functional groups are adsorbed on the cation resin. Molecules containing only acidic or no functional groups are eluted, and these eluates are pumped through a jacketed column filled with activated anion resin (Bio-Rad MP-I, 100- 200 mesh). Acidic materials are adsorbed on the anion resin, and neutral materials are eluted. Column temperatures of 37oC (98.6OF) are maintained by circulating warm water through the column jackets. Both columns are desorbed in the manner previously described (4.5). The materials desorbed from the cation resin are divested of solvent and are redissolved in cyclohexane. This solution is pumped through another jacketed column filled with activated anion resin. Amphoteric materials are collected on the anion resin, and basic materials are eluted. The base fraction is recovered by solvent removal, and the amphoterics are recovered by desorption of the anion resin by formic acid-benzene, followed by solvent removal. A flow sheet for this process is illustrated in Figure I.
To make mixtures of asphalts and IEC fractions or mixtures of IEC fractions, materials are added to a tared vial and methylene chloride is added to the mixture. The sample is allowed to stand overnight under argon. The mixture then is rotated on a rotary evaporator immersed in the waterbath at a temperature of 44OC (1 11.2'F). After most of the methylene chloride has evaporated off, the temperature is increased until boiling of the water is observed in the bath. Vacuum then is applied to the sample, approximately 208 mm Hg (8.19 in Hg). The vacuum is increased gradually to prevent any bubbling of the sample. A maximunl vacuum of approximately 4.7 mm Hg (0.19 in Hg) is reached and the sample is allowed to rotate for 2 hours. The sample is then immersed into an oil bath of 1250C (2570F) for 2 hours at 2 torr (0.08 in Hg). The dried samples are submitted for rheological analysis.
Elemental analyses were performed by the Analytical Research Division of Western Research Institute, using standard methods. Number-average molecular weights (a,,) were determined by vapor phase osmometry (VPO) in toluene or pyridine at 60°C (140°F) using ASTM Method D2503. Infrared functional group (IR-FGA) analyses were obtained on a Perkin-Elmer 983G infrared spectrophotometer using a method developed by Petersen (IO). Rheological data were obtained on a Rheometrics mechanical spectrometer. Samples were annealed prior to measurement at 150°C (302-F) for one hour under an inert gas atmosphere. Measurements were performed within two hours after the samples had cooled to room temperature.
1300

Liquid-state 'H and 13C NMR measurements were made on a JEOL GSX-270 NMR spectrometer. The experimental conditions for recording a 'H spectrum were 8 scans, a pulse width of 5.4 p s (4S0), an acquisition time of 1.5 s a pulse delay of 20 s. and 16 K time- domain data points. The conditions for recording a 13C NMR spectrum were 320 scans, 9.3 ps pulse width (YO"), 0.8 s acquisition time, a pulse delay of 10 s, 32 K time-domain data points, and gated decoupling with the decoupler on during data acquisition. Carbon-I3 spectra were obtained on samples containing -0.05 M chromium (III) acetylacetonate as a relaxation agent.
DISCUSSION
Yields of amphoteric, base, acid, and neutral fractions from IEC separation of four SHRF' asphalts (coded AAD-1, AAG-1. AAK-1, and AAM-I) are listed in Table 1. For some runs, neutrals were not subsequently separated from acids, so the combination of the two materials is listed under the entry neutral plus acids. In some other runs, amphoterics were not subsequently separated from bases, so this comhination of materials is listed under the entry amphoterics plus bases. In each case, the neutral fraction comprises over half of the mass of the asphalt. Yields of neutral materials are similar to those reported using another IEC separation method on the sanie asphalts (4, S). Of the three polar fractions, the amphoteric is by far the largest for each of the asphalts. The amphoteric materials are black solids which swell when contacted with small amounts of solvent. Bases and acids are tacky semisolids. Neutrals are viscous liquids.
Number-average molecular weights (En) of amphoterics and bases are listed in Table 2. The En values of the amphoteric fractions vary from 1,540 Daltoiis (AAG-1) to 3,690 Daltons (AAK-I) in toluene, and from 1,240 Daltons (AAG-1) to 2,730 Daltons (AAK-I) in pyridine. The lower En values in pyridine compared with toluene indicate that amphoteric materials tend to form associations. The En values of the base fractions range from 815-880 Daltons (AAG-I) to 1,740 Daltons (AAM-I), and are the same in toluene and pyridine, indicating that by themselves the total base fractions do not engage in strong associations. The En values of the parent asphalts are: AAD-1,700 Daltons; AAG-1,710 Daltons, AAK-I, 860 Daltons, and AAM-1, 1,300 Daltons (4.5). These En values are the same when measured in pyridine or toluene for those asphalts completely soluble in both solvents. Asphalt AAM-1 is not completely soluble in pyridine.
Infrared (IR-FGA) analyses of amphoterics, bases, and the combination of neutrals and acids of four asphalts are reported in Table 3. The bifunctional 2-quinolone compounds are found in abundance only in the four amphoteric fractions. Other polar functional groups measured by the IR-FGA method are distributed among the various fractions, largely according to expectation. Carboxylic acids and phenols are found in measurable amounts in aiiiplioteric and neutral plus acid fractions. Sulfoxides and ketones are concentrated in base fractions. Pyrroles are found in measurable amounts in all fractions.
Elemental analyses for carbon, hydrogen, and nitrogen of the four amphoteric fractions (Tahle 4) show that these materials are aromatic and contain large amounts of nitrogen. Some of the nitrogen atoms are part of basic functional groups (1 1). Standard deviations of the
1301
t
elemental analyses of the amphoteric fractions generally are small. Nuclear magnetic resonance (NMR) measurements (Table 5 ) show that about 40-50% of carbon atoms in the amphoteric fractions are pan of aromatic strucrures, whereas aromatic hydrogens comprise only 6-13% of the total hydrogen, suggesting the presence of condensed aromatic suuctures.
All the above observations demonstrate that the amphoteric fractions of the four asphalts consist of polar, aromatic molecules which are of relatively high 4 compared with the parent asphalts and other IEC fractions (4,5). These molecules should have the greatest tendencies to associate of all the asphalt IEC fractions, and therefore should be the principal viscosity- enhancing components of asphalts.
In order to test this hypothesis directly, mixtures of each asphalt with each of the four IEC fractions (neutral, amphoteric, acid, and base) were prepared. The compositions of these mixtures were calculated based on the observation that a specific natural abundance of each IEC fraction characterizes each asphalt. For example, asphalt AAD-1 consists of about 54% neutrals, 25% amphoterics, 9% bases and 8% acids. Asphalt AAG-1 consists of 52% neutrals, 18% amphoterics, 12% bases, and 14% acids. It was decided initially to add amphoterics to asplialts such that the resulting mixtures would contain double the natural abundance levels of amphoterics. However, the resulting materials were observed to be coal-like, and viscosities were barely measurable at 60 OC (140'F). Solvent removal from the prepared mixtures proved to he very tedious. The amphoteric fractions impart great surface activities to the mixtures, and under vacuum, meringues form which flow from distillation flasks into the rotary evaporators used in the solvent removal process.
Accordingly, mixtures for each of the four asphalts were formulated such that amphoterics comprise a 50% excess of their natural abundance for each of the asphalts. For example, a 10.0 g sample of AAD-1 contains - 2.5 g amphoterics, a 25% natural abundance. A 50% excess would be 37.5%. So to make 10.0 g of a mixture having 37.5% amphoterics, enough amphoteric material (1.67 g in this case) was added to AAD-1 (8.33 g in this case) to yield 10.0 g of a mixture containing 3.75 g amphoterics. For AAG-1, the natural abundance level for amphoterics is 18%. much less than for AAD-1. A mixture of AAG-I containing a 50% excess of this natural abundance would contain 27% amphoterics. Similar considerations apply to AAK-1 and AAM-1. Natural abundances of amphoterics in these asphalts are sinlilar to tliose in AAD-1 and AAG-1 respectively.
Mixtures also were formulated by adding neutral, acid, and base fractions to the asphalts. In every case, the same amount of each fraction was added as for the amphoteric fraction. For example, in the AAD-1 mixtures, 1.67 g amphoterics was added to 8.33 g AAD- 1. In the mixtures of AAD-1 with its neutral fraction, 1.67 g neutrals were added to 8.33 g AAD-1. Similarly, 1.67 g bases were added to 8.33 g AAD-1, and 1.67 g acids were added to 8.33 g AAD-1. The neutral, acid, and base kactions were not added in amounts commensurate with their own natural abundances, but in amounts corresponding to the natural abundance of the amphoteric fraction. This is so that effects of each fraction on rheological propelties can be compared on an equivalent mass basis for each asphalt.
1302

Viscosities of all these mixtures at 6OoC (140°F) (Table 6) show that, as afraction, the amphoterics are the components of the asphalts governing high viscosities, as predicted. Bases cause moderate viscosity increases when added to asphalts and acids cause hardly any increases. These results indicate that there may be few polyfunctional acidic and basic compounds present. Addition of neutral materials causes large viscosity decreases when mixed with parent asphalts. These results do not mean that no viscosity-enhancing species exist in acid, base, or neutral materials, or no viscosity-reducing species exist in the amphoteric fractions. The results apply to the fractions as a whole.
To verify the effect of the absence of amphoterics on asphalt properties, mixtures of a different kind were prepared. In these mixtures, the relative amounts of neutrals and polars were the same as hi the parent asphalts. However amphoterics have been replaced by bases. In the mixtures discussed earlier, in which IEC fractions are added to whole asphalts, the ratios of neutrals to polars are different from the relative abundance of neutrals and polars in neat asphalts. Acids, bases, and amphoterics are considered to be the polar fractions. In the new set of mixtures, bases replace amphoterics, so the mixtures have much more than their natural ahundances of bases, but relative amounts of total polars and neutrals are the same as for each of the original four asphalts studied. In Table 7, viscosities at three temperatures and tan d values at 2 S 0 C (77 OF) of four such mixtures are compared with the same measurements on the parent asphalts. Viscosities of the mixtures are much lower than those of the parent asphalts at aU three temperatures. The tan d (ratio of viscous to elastic moduli) values of the mixtures are high, compared with tan d values of parent asphalts, particularly the mixture made up of IEC fractions of AAG-1. The rheological data obtained for these mixtures demonstrate that the amphoteric materials as defined by IEC are largely responsible for viscosity-enhancing phenomena in asphalts.
CONCLUSIONS
Separation of four different asphalts into neutral, acid, base, and amphoteric components hy IEC shows that neutral fractions comprise somewhat over half of the asphalts. Amphoterics are the largest of the three polar fractions. Amphoterics are much more aroniatic than their parent asphalts, and also have higher Mn values. These E,, values, determined by VPO, are higher in toluene than in pyridine, which indicates that amphoterics tend to engage in associative interactions.
Mixtures of asphalts with each of the four IEC fractions were prepared and their viscosities measured. Only the mixtures containing amphoterics were much more viscous than the parent asphalts. Mixtures containing only IEC neutral, acid, and base fractions were much less viscous than parent asphalts and had sniall values of elastic moduli (based on tan d values) compared with those of parent asphalts. Thus the presence of amphoterics, presumably forming associations of varying strengths, is required to form elastic networks in asphalts, and asphalt rheological properties should be a function of the nature and relative amounts of amphoterics present.
1303

ACKNO WLEDG MENIS
The work reported herein has been conducted as a part of Project A002A of the Strategic Highway Research Program (SHRP). SHRP is a unit of the National Research Council that was authorized by Section 128 of the Surface Transportation and Uniform Relocation Assistance Act of 1987. This project is titled "Binder Characterization and Evaluation" and is being conducted by the Western Research Institute, Laramie, Wyoming, in cooperation with the Pennsylvania Transportation Institute, Texas Transportation Institute, and SRI International. Dr. Raymond E. Robertson is the principal investigator. Dawn Geldien is the project administrator. , The support and encouragement of Dr. Edward Harrigan. SHRP Asphalt Program Manager, and Dr. Jack Youtcheff, SHRP Technical Contract Manager, are gratefully acknowledged.
NMR spectra were obtained by D.A. Netzel. IR-FGA analyses were performed by G. Miyake. En values were obtained by G. Gardner. Rheological measurements were obtained by F. Reid. The manuscript was prepared by J. Greaser.
LITERATURE ClTED
( I ) (2) (3) (4)
( 5 )
(6) (7) (8) (9)
Pfeiffer, J.P. and Saal, R.N.J., J. Phys. Chem., 44, 139 (1940). Petersen, J.C., Transport. Res. Rec., 999.13 (1984). Boduszynski, M.M., Chadha, B.R. and Pochopien, T.S., Fuel, 33,432 (1977). Branthaver, J.F., Catalforno, M.W., and Petersen, J.C., Preprints, Div. Petrol. Chem., Am. Chem. SOC., 35 (3). 376 (1990). Branthaver, J.F., Catalfomo, M.W., and Petersen, J.C., Fuel Sci. Technol. lntl., lo (4-6). 855 (1992). Green, J.B., Hoff, R.J., Woodward, P.W., and Stevens, L.L., Fuel, 63,1290 (1985). Kircher, C.C., Fuel Sci. Technol. Intl., 9 (3). 379 (1991). McKay, J.F., Cogswell, T.E., Weber, J.H. and Latham, D.R., Fuel, 54,50 (1975). Selucky, M.L., Kim, S.S., Skinner, F., and Strausz, O.P., in "Chemistry of Asplialtenes," Bunger, J.W. and Li, N.C., Eds., Advances in Chem. Series 195, ACS, Washington, DC, Chapter6 (1981).
( I O ) Petersen, J.C., Transport. Res. Rec., m,1 (1986). (11) Robertson, R.E., Schabron, J.F., Gwin, A.A., and Branthaver, J.F., Preprints, Div.
Petrol. Chem., Am. Chem. Sac., 37,913 (1992).
1304

I
1305

Table 2. Molecular Weights of IEC Amphoteric and Base Fractions
Asphalt Run No. Fraction Molecular Weight (Dallons) Toluene Pyridine
AAG- 1
AAK- 1
1
2
1
2
AAM- 1 1
2
Amphoteric Base
Amphoteric Base
Amphoteric Base
Amphoteric Base
Amphoteric Base
Amphoteric Base
Amphoteric Base
Amphoteric Base
2,960 1,100 2,930 1,060
1540 880; 880
1,620 815
3,690 1,260; 1,240
3,540 1.300
3.560 1,740 3.410 1.670
2,260 1,100 2,180 1,200
1,170
1,240 835
2,730 1,340 2,160 1,350
insol. insol. insol. insol.
1306

PI rI v. 0 0 0
- z g 8 9 0
5 2 s V O ?
*
%
r? r? r? 0 0 0
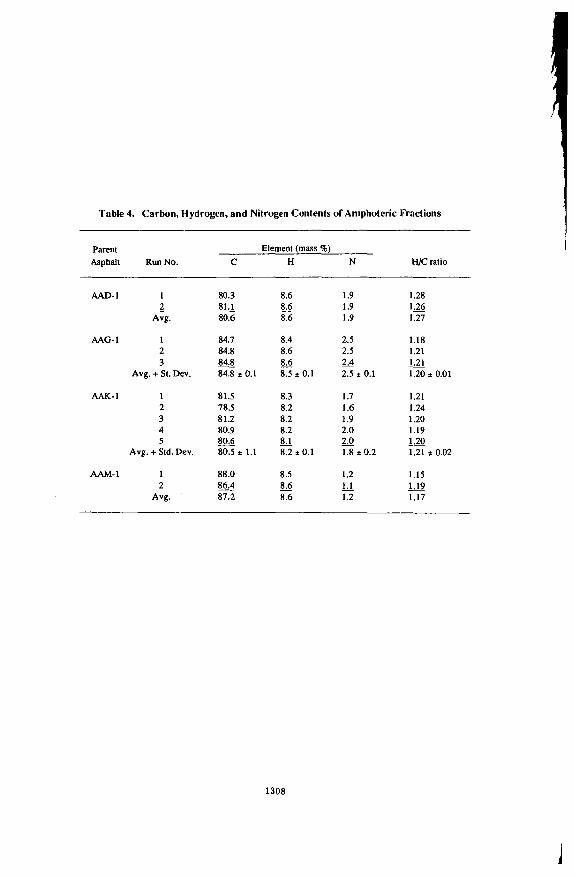
Table 4. Carbon, Hydrogen, and Nitrogen Contents of Amphoteric Fractions
Parent Element (mass 96) Asphalt RunNo. C H N H/C ratio
AAD- 1 1 2
Avg.
AAG-1 1 2 3
Avg. + St. Dev.
AAK-I 1 2 3 4 5
Avg. + Std. Dev.
AAM- 1 1 2
Avg.
80.3
80.6
84.7 84.8
84.8 0.1
81.5 78.5 81.2 80.9 80.6 80.5 1.1
81.1
- 84.8
-
88.0 86.4 87.2 -
8.6
8.6
8.4 8.6 8.6 8.5to.1
8.3 8.2 8.2 8.2 8.1 8.2 * 0.1 -
8.5 - 8.6 8.6
1.9 - 1.9 1.9
2.5 2.5 2.4 53 t 0.1
1.7 1.6 1.9 2.0 2.0 1.8 t 0.2 -
1.2 1.1 1.2 -
1.28 - 1.26 1.27
1.18 1.21 1.21 1.20 f 0.01 -
1.21 1.24 1.20 1.19 - 1.20 1.21 f 0.02
1.15 - 1.19 1.17
1308

Table 5. NMR Analysis of IEC Amphoteric Fractions of Four Core Asphalts
Asphalt Run No. 9% Aromatic Carbon % Aromatic Hydrogen
AAD- 1
AAG-I
AAK- 1
AAM- 1
1 2
1 2
41.1 45.0
49.3 51.8
44.8 43.6
47.1 46.1
7.1 8.1
11.8 12.9
8.3 6.2
9.4 9.2
Table6. Viscosities (Paas ) of Mixtures of Four Core Asphalts with Their IEC Amphoteric, Base, Acid, or Neutral Fractions at 6 0 0 C and 1.0 rad/s
Asphalt Run Viscosity Viscosity of Viscosity Viscosity Viscosity Number of Asphalt + of Asphalt of Asphalt of Asphalt
Asphalt Amphoterics + Bases + Acids + Neutriils
AAD-1 1 2
AAG- 1 1 2
AAK- 1 1 2
AAM-I 1 2
131 2.462 2,815
240 1,740 1,139
413 6,836 6.755
258 4,032 3,901
321 301
346 402
6.56 1.004
399 470
174 21 1
285 437
517 550
292 342
37 43
132 129
I 1 0 1 24
140 135
1309

Y
L s b .d
n v)
n s .d
9 a a L
L& L 0 v) E .- - u L
L& Y
n m
1310
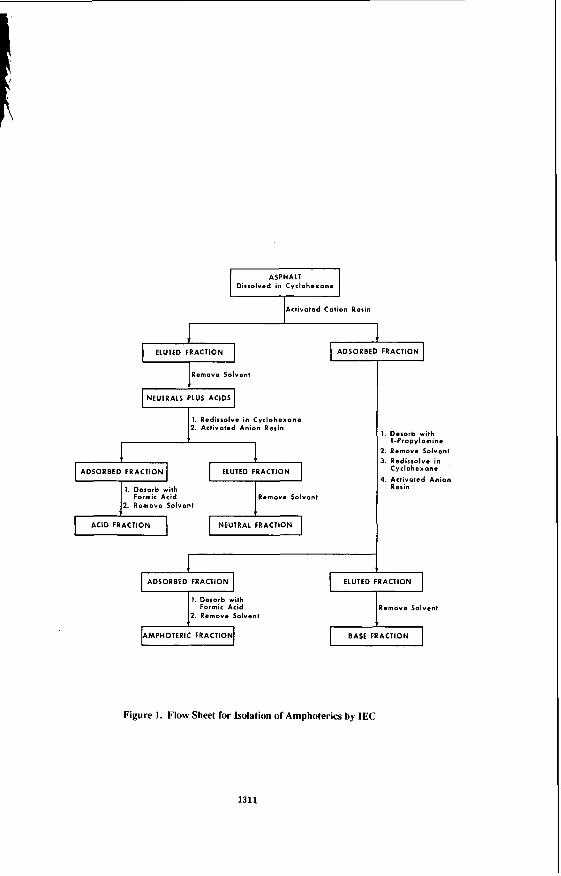
I Dissolved ASPHALT i n Cvcloherone I A d v o t e d Cation Resin
I I ELUTED FRACTION
Remove Solvent
I NEUTRALS PLUS ACIDS I I . Redissolve i n Cyclohexane 2. Activated Anion Resin
I I ADSORBED FRACTION ELUTED FRACTION
Formic Ar id Remove Solvanl 2. Remove Solvanl
ADSORBED FRACTION
Formic Acid 2. Remove Solven~
I . Desorb with I-Propylamine
2. Remove Solvent 3. Redissolve i n
Cyclohexane 4. Activated Anion
Resin
ELUTED FRACTION
Remove Solvent
Figure 1. Flow Sheet for Isolation of Amphuterics by IEC
,1311
HP-GPC ANALYSIS OF ASPHALT FRACTIONS IN THE STUDY OF MOLECULAR SELF-ASSEMBLY IN ASPHALT
P. W. Jennings, J. A. S. Pribanic; J. A. Smith, T. M. Mendes Department of Chemistry and Biochemistry
Gaines Hall, Montana State University Bozeman, MT 59717-0340
Keywords: asphalt; intermolecular interactions; asphalt fractions
INTRODUCTION
The nature of intermolecular interactions in asphalt cement remains incom- pletely understood, although the body of evidence continues to grow. Several types of interactions are possible. In a number of papers, the theory has been propounded that micelles, formed by the stacking of flat aromatic molecules via pi-pi interactions, are important constituents of asphalt cements [l]. J. C. Petersen, on the other hand, has concentrated efforts on the study of functional groups containing oxygen, nitrogen and sulfur because some of these functional groups could interact through polar forces [Z]. Less attention has been paid to possible van der Waals interactions except in cases in which long unsubstituted aliphatic chains (waxes) crystallize within the asphalt [3]. Nevertheless, all of these interactions could contribute to the formation of an intermolecular network, the characteristics of which may determine the behavior of the asphalt cement.
Because of the complexity of asphalt, such interactions are difficult to study. High Performance Gel Permeation Chromatography (HP-GPC) has been used to demonstrate the tendency of self-assembled units to form in whole asphalts and some fractions [4,5]. Molecules in many common asphalts show a distinct tendency to self- assemble; a few asphalts show little if any such character. The latter asphalts are likely to be thermally sensitive, that is, to be subject to early thermal cracking and/or permanent deformation [6]. In experiments in which the polarity of the eluting solvent was changed, it appeared that both polar and non-polar interactions are much more important in those asphalts which exhibit self-assembly than in those which do not [7].
In efforts to clarify the chemical nature of asphalt cements, two important fractionations of asphalt have been performed by Western Research Institute (WRI) under auspices of the Strategic Highway Research Program (SHRP). Preliminary work on the HP-GPC analysis of two fractions from Ion Exchange Chromatographic separations was described previously [5]. Further work on these and other fractions will be the subject of this paper.
EXPERIMENTAL PROCEDURES
Two fractions from preparative size exclusion chromatographic (SEC) separa- tions of each of eight asphalts were supplied by WRI. This molecular size separation uses toluene as solvent. The separation is based on a transition from non-fluores- cence to fluorescence of the eluting substances. The non-fluorescent fraction,
1312
I
labelled SEC I, is thought to consist of associated entities whereas the fluorescent fraction (SEC 11) is composed of individual molecules [8] or perhaps small associated units.
Using ion exchange chromatography (IEC), WRI obtained five fractions from each of the same eight asphalts. These are strong acid, strong base, weak acid, weak base and neutral materials [9].
Both SEC and IEC fractions were used as received and subjected to HP-GPC analyses as previously described [5]. Tetrahydrofuran (THF) was used as solvent.
RESULTS AND DISCUSSION
A Note about the Solvent Tetrahydrofuran is a common solvent for HP-GPC analysis of asphalts and
their fractions. At the low sample concentrations used (0.5% wk), THF disrupts most intermolecular associations present in the neat asphalt. However, the strongest associative bonds, both polar and non-polar, apparently do survive in THF solution. Thus, we suggest that THF is the solvent of choice for indicating the tendency of molecules in an asphalt to form strong associations by any mechanism (polar and/or non-polar). This is particularly important because we theorize that the extent to which the molecules in an asphalt form an intermolecular network consisting of both polar and non-polar interactions contributes to the ultimate performance of the asphalt.
The SEC Fractions The SEC I and I1 fractions from each of eight asphalts were analyzed by HP-
GPC in THF. In Figure 1, the chromatograms which were detected by 340 nm absorption for SEC I and I1 fractions are superimposed on that of the parent asphalt for two asphalts, representing the range of results observed.
size (LMS) material(2) than the corresponding whole asphalt, whereas SEC I1 is much less aromatic and shows no evidence in the LMS region for intermolecular association. However, there are significant differences among asphalts. For example, in THF, asphalt A shows strong evidence for intermolecular association in the whole asphalt and in SEC I, but asphalt G contains little, if any, self-assembled material in the whole asphalt and the least amount in SEC I of all asphalts tested (Figure 2). Furthermore, the percentages of LMS material in the whole asphalts bear a nearly linear relationship to the percentages of LMS in their respective SEC I fractions (r2=0.89).
much less evidence for the presence of self-assembled entities in the LMS regions of
In all cases studied, SEC I is more aromatic(') and has more large molecular
However, there are some interesting details within this data. First, there is
(')?he aromatic content of samples can be compared by summing the areas in mAU under the chromato-
(')Percentage of L M S is defmed as the percentage of CV, appearing m the large molecular size region of the graphic cuwes at 230. 254, 280. 340. 380, 410 and 440 nm. This is called the total conjugated volume, CV, . chromatogram, before 17 minutes elution time m this system.
I
1313
SEC I fractions from Group 1(3) asphalts than in SEC I fractions from other Groups. Furthermore, these fractions begin to elute as much as two minutes earlier than their parent asphalts. This indicates that the process of SEC separation in toluene may force some intermolecular polar associations that a) are not present in the original asphalt and b) are quite stable. That such a change is induced by the SEC process is further evidenced by the fact that SEC I fractions from Group 1 asphalts are not completely soluble in THF, whereas the parent asphalts are easily soluble.
Second, when one observes the strong response in the LMS region for SEC I fractions, it would be easy to assume that all the LMS material in the whole asphalt is accounted for by the SEC I fraction. However, when the amount of LMS material explained by SEC I and Id4) is compared with that found by analysis of the whole asphalt, differences among the asphalts are observed (Table I). For example, for asphalts A, 8 and D, less LMS material is calculated from the SEC I and I1 fractions than is observed in the whole asphalt. Since the SEC preparation using toluene should encourage polar interactions while disrupting pi-pi bonds, the HP-GPC data may indicate that pi-pi interactions are somewhat more important than polar interac- tions in these three asphalts.
For asphalts C, F and K, the difference between calculated and observed LMS percentages is small (within experimental error). This may mean either a) that neither interactive mechanism is important, or b) that both interactions contribute about equally in the whole asphalt. Earlier studies with changes in solvent polarity indicate that the latter is true for asphalt K. For asphalts C and F, in which little intermolecular interaction is noted, it may be that both polar and non-polar associa- tions contribute about equally to the low LMS content.
Asphalts G and M present a different picture in that the total LMS percentage in SEC I and I1 is higher than in the whole asphalt. This difference is substantial in asphalt M, less so in asphalt G. We suggest that the SEC separation of G in toluene encourages polar interactions not present in the whole asphalt, as mentioned earlier. In the whole asphalt, in fact, neither polar nor non-polar interactions seem to be important.
Asphalt M (Group 4)('), well known as an unusual material, does not change its reputation here. We suggest that, not only does the SEC separation encourage polar bonds not present in the whole asphalt, but also it disrupts non-polar interactions that are particularly strong in this asphalt. That is, toluene may actually invert the interactions prevalent in the neat asphalt. It should be noted that asphalt M is known as a highly compatible material from which little if any asphaltene can be precipitated by heptane. That is, heptane can not induce the separation of polar materials perhaps because they are so strongly solubilized by virtue of pi-pi interac- tions. This would be consistent with the HP-GPC results.
(')Group 1 asphalts have narrow molecular size distribution. with little evidence for mtermolemlar association
("Percent LMS whole asphalt, calc. = (% LMS SEC I)(wt % SEC I) + (46 LMS SEC II)(wt % SEC lI)/lm. (s)Asphalts m Group 4 posres narrower molecular s k distributions than Group 2 asphalts, but the overall
(Le.. little LMS shoulder area) in the HP-GPC chromatogram. These asphalts are often temperature sensitive and may crack early and/or NI in a pavement.
molecular size is quite large.
1314

The IEC Fractions
strong bases, weak acids, weak bases and neutrals - the strong acids exhibit most intermolecular association in THF. These fractions are highly aromatic (Table 11) and, because of the isolation procedure, should contain molecules with strongly acidic functional groups as well as those with a strong acid and one or more additional functional groups. Thus, the extensive intermolecular association is not surprising. Nevertheless, there are significant differences among the chromatograms of strong acid fractions from different asphalts (Figure 3). The chromatogram of strong acids from asphalt G (representing Group 1 asphalts), although showing evidence for considerable intermolecular interaction, also indicates that most of the materials are unassociated. This contrasts with the situation for strong acids from asphalt A (Group 2f6), which are seen to be predominantly in the LMS region and thus highly associated.
also have more than one functional group (but not a strong acid since they have been removed). Their chromatograms indicate less self-assembly in the strong bases than in the corresponding strong acids and less self-assembly among Group 1 asphalts than others.
little if any tendency toward self-assembly in THF, i.e., any intermolecular bonds are quite weak. Neutral fractions are the least aromatic of the IEC fractions and display no evidence for self-assembly in the LMS regions of their chromatograms.
It is expected that the process of IEC separation may destroy some intermo- lecular interactions because each contributor belongs in a separate category. Thus, the total LMS percentage for all the IEC fractions is expected to be significantly less than that obtained by HP-GPC analysis of the whole asphalt (Table 111). For most asphalts, this is true. However, for asphalt G, there is no significant difference between these approaches, again suggesting that intermolecular interactions are not strong in this asphalt.
SUMMARY AND CONCLUSIONS
Among the fractions from Ion Exchange Chromatography - strong acids,
Strong base fractions are also quite aromatic (Table 11). The molecules could
The weak acid and weak base fractions are quite aromatic but demonstrate
Separation of asphalts into fractions has provided somewhat simpler samples by which to study intermolecular interactions in the asphalts. Separation by size exclusion chromatography (SEC) using toluene has yielded SEC I, composed of large species associated by polar bonds, and SEC 11, consisting of essentially nonassociated molecules (as evidenced by HP-GPC analysis). Analyses of these fractions by HP- GPC in THF emphasize the aromatic character of SEC I (but not of SEC II), agree that SEC I contains highly associating components, but distinguishes among asphalts as to the extent, strength and source (polar or non-polar) of the interactions.
by HP-GPC. These analyses confirm that components in the strong acids fraction, which are highly aromatic and may include molecules with more than one functional
Other fractions derived from ion exchange chromatography were also analyzed
@)Group 2 asphalts include most common materials. n e y have broader molecular size distributions and show strong evidence for intermolecular interactions.
1315

group, are extensively associated. However, the strong acids do not account for all of the associated entities in the asphalt. Thus, even though the other polar fractions appear by HP-GPC not to be associating when separated, they must contribute significantly to the self-assembled materials observed in the whole asphalt. However, the strength, and therefore the contribution to behavior, of intermolecular associa- tions, differ among asphalts.
ACKNOWLEDGEMENTS
The support of the Strategic Highway Research Program is gratefully
We thank researchers at Western Research Institute, Laramie, Wyoming, for acknowledged.
providing samples.
REFERENCES
Yen, T.F., "A Macrostructure of Petroleum Asphalt," PREPRINTS, Div. of Petrol. Chem., ACS, 35, (3)314 (1990). Petersen, J.C., "Chemical Composition of Asphalt as Related to Asphalt Durability. State of the Art," and references cited therein, in Transportation Research Record, TRB, National Research Council, Washington, D.C., 1984. Planche, J.-P., et al., "Relationships between Characterization of Asphalt Cements by Differential Scanning Calorimetry and their Physical Properties," PREPRINTS, Div. of Petrol Chem., ACS, 35, (3)330 (1990). BrulC, B., et al., "Characterization of a Road Asphalt by Chromatographic Techniques (GPC and HPLC)," J. Liquid Chromatography, 2, 437 (1979). BrulC, B., et al., "Contributions of Gel Permeation Chromatography (GPC) to the Characterization of Asphalts,'' in Liquid Chromatography of Polymers and Related Materials 11. Cazes and Delamore, Eds., Dekker, 1980. Jennings, P.W., et al., "High Performance Gel Penneation Chromatography in the Characterization of Self-Assemblies in Asphalt," Fuel Sci. and Techno]. Int., in press. Jennings, P.W., et al., unpublished results. Jennings, P.W., et al., "High Performance Gel Permeation Chromatography in the Characterization of Self-Assemblies in Asphalt. 2.," Proceedings, Interna- tional Symposium on Chemistry of Bitumens, June, 1991, Rome, Italy. Branthaver, J.F., et al., "Separation of SHRP Asphalts by Preparative Size Exclusion Chromatography," PREPRINTS, Div. of Petrol. Chem., ACS, 35, (3)407 (1990). Branthaver, J.F., et al., "Separation of SHRP Asphalts by Ion Exchange Chromatography," PREPRINTS, Div. of Petrol. Chem., ACS, 35 (3)376 (1990).
1316

Table I. Differences between % LMS observed in the whole asphalt and that calculated from amounts in SEC I and 11.
a b Asphalt % LMS % LMS difference
observed(’) calculated(’) a - b
A 19.2 16.5 2.7 B 14.2 11.7 2.5 C 8.2 7.3 0.9 D 24.0 20.0 4.0 F 8.3 8.3 0.0 G 3.2 4.7 - 1.5 K 19.5 18.6 0.9 M 20.1 24.2 -4.1
U) Experimental error 20.5 (’) See footnote 4
Table 11. Relative aromaticity of fractions from Ion Exchange Chromatog- raphv from HP-GPC Analvsis.
. I
cv, (x 10’) Asphalt Whole SA(’) SB(’) WA(3) WB(4) N(’)
22.6 34.9 30.1 33.0 26.9 43.5 36.7 35.2 23.9 40.9 30.5 35.6 20.6 30.7 25.6 28.3 27.6 40.2 35.1 35.6 24.8 35.0 29.7 31.8 24.6 33.7 28.7 28.3 23.5 38.3 28.9 31.6
CV, - total conjugated volume, see Footnote 1 Strong. acid (3) Weak acid
27.5 14.7 33.4 15.8 29.7 14.2 19.7 11.8 34.4 16.9 26.8 16.6 30.5 14.9 28.3 13.8
(’) Neutral (’) Srongbase (4) Weak base
1317

Table 111. Differences between % LMS observed in the whole asphalt and that calculated from amounts in the IEC fraction.
a b Asphalt % LMS % LMS difference
observed(') calculated(*) a - b
A 19.2 13.4 5.8 B 14.2 9.9 4.3 C 8.2 1.3 6.9 D 24.0 16.8 1.2 F 8.3 6.0 2.3 G 3.2 3.8 -0.6 K 19.5 13.2 6.3 M 20.1 16.3 3.8
(') 20.5 (*) from % LMS in all IEC fraction
L
1318

E
SEC-1 R T 3 4 0 n m I - i 3 E
1 L
Figure 2. Cbromatogams (340 om) for SEC I factions of eight asphalts
Figure 3. Chromatograms at seven wavelengths for strong acid fractions of asphalts A and G.
1319
i
NUCLEAR MAGNETIC RESONANCE SPECTROSCOPY FOR THE CHARACTERIZATION OF ASPHALT
P. W. Jennings, F. F. Stewart. J. A. Smith, M. A. Desando, T. M. Mendes and J. A. S. Pribanic
Department of Chemistry and Biochemistry Montana State University
Bozeman. MT 59717
INTRODUCTION
Nuclear Magnetic Resonance (NMR) spectroscopy is a powerful tool used in a broad array of disciplines to describe the character of atoms, molecules and assem- blies of molecules. This information may be athered from samples solubilized in
are typically used, there is a variety of NMR active nuclei which include oxygen, phosphorus, nitrogen, silicon and many metals. With regard to applications, this tool has been used to characterize simple organic and inorganic compounds, proteins, carbohydrates, enzymes, coal and polymeric materials. Thus, it has broad use in a variety of disciplines. With regard to asphalt. NMR spectroscopy has been applied but not to the extent that it has in the areas previously mentioned.'-6
Before describing some of the results from our laboratory, it is appropriate to briefly describe the character of asphalt and some of the goals for which answers are sought. Asphalt is a hydrocarbon mixture containing minor elements, in bonded form, of 0, N, S, V, Fe and Ni. None of these minor elements is present in more than a few percent. The hydrocarbon portion is approximately 25% aromatic and 75% aliphatic with average molecular weights in the range of 700-1000 amu. Thus, average structures for asphalt contain 4 or 5 aromatic rings joined in a planar polynuclear fashion and a couple of aliphatic chains (5-10 carbons in length). In every 2-3 molecules there is a heteroatom (0, N, S) as either an aromatic or aliphatic moiety. A variety of functional groups is present and includes carboxylic acids (COOH), phenols (ArOH), ketones (C=O), ethers (-0-), esters (-COOC-), amines (pyroles and pyridines) and sulfur derivatives (= 60-70% thiophenic and 30-40% sulfides).
the following questions.
solvents or in the solid state. While carbon ( e3 C) and proton ('H) characterizations
The goals to be achieved in the characterization of asphalt include answers to
1. 2.
3.
4. 5.
What are the functional groups and how many of each are present? How are the aromatic rings arranged and how many substituents are present? How long are the aliphatic chains, how many are there and how many branches are present? How are the heteronuclear aromatic nuclei arranged? What is the sulfide content?
Finally, the big questions are derived from the interactions of these components in a macrosystem.
1320

6 .
i. Y. 9.
How do these components assemble for !om the substance called asphalt? How do these assemblies differ among the asphalts? How do these features relate to periomance? How do these features change with modifiers. trearments and additives'?
With this introduction. perhaps the results described below will be in context and more readily understood.
RESULTS AND DISCUSSION
Functional Croup Analysis
In this portion of the work. carboxylic acid and phenol content of a variety of asphalts were measured. Two reactions were run to prepare derivatives which provided a NMR active probe for the analysis. They are:
RCOOH R,NOH ~ RCOO ' C H ~ I R C O O ' C H , ArOH A r O ArO'CH,
RCOOH ''H7N7 - RCOO'CH,
The first reaction involves a phase transfer type base followed by methylation with enriched 13C.7.8 For the carboxylic acid analysis a sharp resonance should result and does in a few wes. However, there often is a broader resonance band on the downfield side of the carboxylate which interferes with the correct analysis. There- fore, the diazomethane reaction was used to analyze carboxylic acids. In this case a sharp resonance was obtained. The phenolic content was analyzed using the phase transfer methodology. Due to the variation in aromatic residue these resonances are broad. Numerical results of these analyses are tabulated in Table I for selected asphalts and asphalt fractions.
but there is not ve displayed are x 10' moleqgm. POV stands for pressure oxygen vessel and refers to an aging process used in the SHRP studies. Given the error associated with these analyses, it is concluded that POV aging does not reflect any increase in the carb- oxylic acid content of an asphalt
fractions. SEC-1 represents the larger molecular sized materials while SEC-2 fractions have smaller molecular sized units. The former are thought to have molecular assemblies of components while SEC-2 has fewer assemblies and are necessarily smaller. This separation was conducted using toluene which destroys pi-pi aromatic assemblies and facilitates polar interactions. Thus it is interesting to note that there is little disparity for carboxylic acids between these two fractions. Save asphalts F, G and K in which SEC-2 shows enhanced values. These authors are not
The conclusions drawn here are that there is some variation among asphalts much carboxylic acid or phenolic content since the numbers
Size exclusion chromatography on a preparative scale by WR19 provided these
1321

willing to speculate at this time on the application of these results to performance testing.
Hydrocarbon Characteristics
Both proton and carbon spectroscopy were used to characterize aromatic and aliphatic content. The numerical results for carbon are displayed in Table 11. The conclusions here are that there is very little variation among the whole asphalt samples. Among the fractions it is noted that the aromaticity is less for SEC-2 vs SEC-1 and that the neutral fraction derived from ion exchange chromatography (IEC) has the least aromaticity among that group.
Two-Dimensional NMR Spectroscopy
From the one-dimensional data results cited above, we turned to the use of two-dimensional NMR spectroscopy in an effort to provide additional data on the aromatic and aliphatic resonances. Figures 1 and 2 are for the whole asphalt and represent the typical I3C spectrum for comparison with a DEPT 135 spectrum. respectively. Using these data, one can better determine which resonances are due to CH,, CH2, CH and C. The DEPT 135 data nulls quaternary carbons which is particularly noticeable in the region of 130-150 ppm. Figure 3 reinforces this feature as it is run under conditions which facilitate quaternary carbons and suppress all others. The peak at 97 ppm is an impurity and the one at 78 ppm is CHCI,. Those in the aliphatic region represent incomplete suppression of CH, resonances. The broad aromatic CH resonances occur from 115 to 129 ppm, with a rather sharp demarcation on the downfield side, Figure 3a. At this juncture, the quaternary carbons arise in earnest and range from 120 to 145 ppm, Figure 3b. In looking at the entire spectrum, Figure 1, one can readily see the break between these two moieties at 130 ppm. Given the relative amounts of these two moieties, one must conclude that a number of polynuclear aromatic sheets must be present.
sites for oxidation, it was desired to find a way to analyze for these units. After trying some direct methods such as HETCOR without success, we turned to looking for long-range coupling between the benzylic protons and the aromatic ipso carbons. Success was readily achieved with model compounds and asphalt was subsequently attempted. The results are shown in Figures 4, 5 and 6. In Figure 4, the correlation of interest occurs at intersection 2.3 ppm on the proton axis and 120 to 140 ppm on the carbon axis. These are protons on benzylic carbons attached to two different types of aromatic moieties. The first at 120-130 ppm is likely a substituent on a typical carbon based aromatic ring. The correlation at 130-145 ppm is likely to be of a heterocyclic ring system. From model compounds, it is believed that these are benzylic methyl groups. Figure 5 shows a similar correlation but now the CH2 units are also present. This is achieved by altering the spectrometer parameters. Finally in Figure 6, the graph shows a projection of these peaks when the parameters have been adjusted so as to project benzylic CH (2.7 ppm), CH, (2.5 ppm) and CH3 (2.3 ppm) on the proton axis. Efforts to investigate the effects of oxidation are undenvay.
Due to the long-standing conception that benzylic carbons bearing protons are
1322

CONCLUSION
A few techniques within the scope of solution NMR spectroscopy have been applied to the complicated mixture called asphalt. Through these uses, one can gain considerable insight into the details of asphalt compounds. These. in turn. should provide future scientists with data for correlations with performance and physical testing.
REFERENCES
Hagen, A.P.; M.P. Johnson, and B.B. Randolph. "C NMR studies on roadway asphalts, Fuel Science and Technology In12 (1989) 7, 1289. Hasan, M.U., A Burkhari and M.F. Ai . Structural characterization of Saudi Arabian medium crude oil by NMR spectroscopy, Fuel (1985) 64, 839. Netzel, D.A. and F.P. Miknis. NMR study of U.S. Eastern and Western shale oils produced by pyrolysis and hydropyrolysis, Fuel (1982) 61. 1101. Netzel, D.A. Quantitation of carbon types using DEPT/QUAT NMR pulse sequences; application to fossil-fuel-derived oils. Ana.! Chem. (1987) 59. 1775. Snape, C.E. Analysis of Fossil Fuels. In L.D. Field and S. Sternhell (eds.), An&ical NMR, (1989) John Wiley and Sons, Ltd., 66-115. Jennings, P.W., et al. High performance gel permeation chromatography in the characterization of self-assemblies in Asphalt. l., Fuel Science and Technology, Int. (1992) 10, 887. Rose, KD. and M.A. Francisco. Characterization of acidic heteroatoms in heavy petroleum fractions by phase - transfer methylation and NMR spec- troscopy, Energy and Fuek (1987) 1, 233. Rose, K.D. and M.A. Francisco. A two-ste chemistry for bigblighting he te re atom species in petroleum material using 1% m R spectroscopy. 1. Am. Chem. Soc. (1988) 110, 637. WRI - Western Research Institute in Laramie, Wyoming provided SEC and IEC samples. We are deeply grateful for their generosity.
1323

Table 1. Carobxylic Acid and Phenol Content Asphalts and Asphalt Fractions.
AAA-1' POV(1) SEC-l(') SEC-2
AAB- 1 POV SEC-I SEC-2
MC-1 POV SEC-1 SEC-2
M - 1 POV SEC-I SEC-2
AAF- 1 POV SEC- 1 SEC-2
AAG-I POV SEC-1 SEC-2
AAK-1 POV SEC-1 SEC-2
AAM-1 POV SEC-1 SEC-2
1.1 1.9 1.6 1.9 0.5 0.3 0.5
small 0.5 0.4 0.9 0.6 1.1 1.7 3.2 3.2 0.1 0.1 0.1 0.4 4.5 3.5 0.3 1.7 1.6 1.5 0.75 5.1 1.0 0.6 0.8 0.9
3.5
13.0
1.2
10.0
1.8
9.3
7-7
14.0
6.3
17.0
4.2
11.0
2.5
7.4
3.5
3.2
2.5
6.8
3.1
5.5
1.7
4.5
7 7 -.-
7.8
3.2
7.6
5.5
7.0
1.5
2.0
2.4
3.2
.. 'Asphalts from SHRP-Whole Asphalt Hindered phenols Unhindered phenols
I..
(')Aged by pressure of oxygen (')Sized Exclusion Chromatography with toluene solvent from WRI
1324

\
Table 11. Aromaticity from 13C Analvses of Asphalt and Fractions.
Asphalt Strong' Strong' Whole SEC I SEC I1 Acids Bases Neutrals'
.m- 1 27.9 36.7 26.2 38.1 32.3 19.8
.-\AB- 1 31.2 47.1 27.6 46.7 38.3 16.8
M C - 1 27.8 40.1 25.4 44.7 34.6 18.3
AAD-1 3 . 4 50.9 24.0 32.1 34.1 19.7
.M- 1 32.8 45.6 29.9 37.4 39.9 24.5
I W G - 1 29.0 30.3 28.3 37.0 29.0 16.6
x- 1 26.2 37.9 26.9 33.5 34.8 15.4
M- 1 3 . 6 23.0 27.1 35.1 32.3 14.7
'Fractions from an ion exchange chromatograph (EC) separated at Western Research Institute, Laramie, Wyoming'
1325
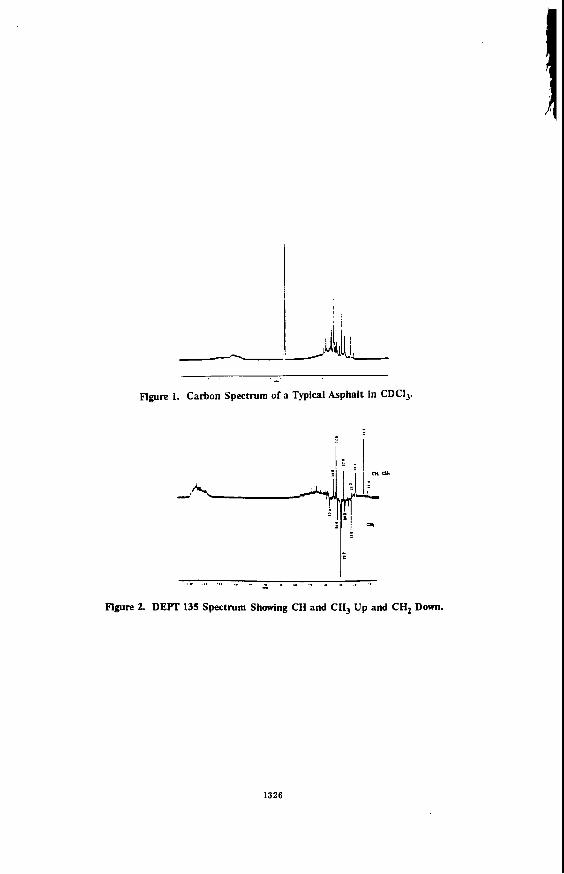
~ . . - Figure 1. Carbon Spectrum of a Typical Asphalt in CDCI,.
I- I. I. .. . . . " , , , . - Figure 2. D E R 135 Spectrum Showing CH and CH, Up and CH, Dom.
1326

Figure 3. Selected D E R Spectra of Asphalt: (a) DEPT 45 Where Quaternary Carbons Are Suppressed, (a) QUAT Spectrum Where Quaternary Carbons Are
Emphasized and Other Resonances Are Suppressed.
1327

0
1328
e? d

CHARACTERIZATION OF MICROSTRUCTURE OF ASPHALT, AND CORRELATION WITH THEIR PERFORMANCE
William H. Daly and Zhaovao Qiu(Chiul Macromolecular Studies Group, Department of
Chemistry, Louisiana State University, Baton Rouge, LA 70803-1804
Keywords: asphalt, rheology, nuclear magnetic resonance.
Introduction Asphalt is a very complex mixture; even within a given grade the composition
may vary significantly depending upon both the source of the crude and the refining process. Although tremendous efforts have been devoted to characterize asphalt, microstructure of asphalt remains to be defined. In particular a routine technique which quantifies the components controlling the long term behavior of an asphalt cement is required. In our laboratory, eight asphalt samples with grades ranging from 10 to 30 from four different sources were examined. The molecular structure of the asphalts was characterized quantitatively using NMR and FTlR techniques. Differential scanning calorimetry (DSC) was employed to estimate the crystallinity, and rheological properties of the asphalts were studied by dynamic mechanical analysis (DMA). Our goal is to achieve an understanding the relaxation mechanisms of asphalt under load at the molecular level. Characterization of Asphalt Samples NMR and FTlR Characterization of AsDhalt The application of NMR to analysis of asphalt samples is well established [l-31. Samples were dissolved in deuterated chloroform at a concentration of 10% (w/v), spectra were measured using a Bruker 200 MHz FTNMR. A relaxation agent, Cr(acac)g,l2 mglml, was added to the 1% nmr samples. Using an interpulse time of six seconds and more than 8000 scans, reliable quantitative spectra can be obtained 141. Table 1 summarizes the observations on our eight samples from the nmr measurements.
It is known that methine structures, especially those attached directly to aromatic ring [5], are mainly responsible for oxidation of asphalt, a major cause of pavement failure. We identified the specific aliphatic carbon types in terms of methyl (8), methylene (19) and methine (6) structures with DEPT technique of 13C nmr (table 2). Comparison of DEPT nmr spectra with broadband nmr spectrum at aromatic band region (100-160 ppm) reveals that no aromatic carbons coupled to hydrogen appears at chemical shifts greater than 131 ppm. The large number of distinctive resonances emphasizes the complexity of the asphalts and suggests that correlating nmr analyses to asphalt chemical and physical properties will be very difficult.
Asphalt samples, 5% (w/v) chloroform solution in 1 mm cell were examined by quantitative FTlR using a Perkin Elmer 1700 FTIR. The overlapped peaks in 1550 - 1800 cm-lwere resolved by curve fitting program (figure 1) based on the work of J. C. Petersen and his colleagues [6]. The results (Table 1) show significant differences in composition between asphalt samples of the same grade. Thus comparison of asphalt properties based simply on the grade is rather imprecise.
1329

Crvstallinitv of Asphalt Linear paraffins present in asphalt readily crystallize. The relative crystallinity of a given asphalt can be measured by DSC [7,8] We used DSC to estimate the relative volume of the crystalline phase in each of the asphalt samples. A Seiko DSC 220C calibrated for temperature and enthalpy with indium was employed for the measurement. The DSC was conducted on z 10 mg samples sealed in an aluminum sample pan using an empty aluminum sample pan with cap as a reference. Initially each sample was cooled at 3 Clmin to -45 C and then heated at 3 Clmin. The heats of fusion (AHf) observed are is listed in Table 3. The percent crystallinity was estimated from this data by assuming that completely crystallized hydrocarbons in an asphalt matrix exhibit an average enthalpy of 200 Jlg (8). Glass Transition Processes in Asphalt
materials not only because it limits practical applications but also because it can provide valuable information about microstructure of a material. We believe that DMA is the best technique to determine Tg both in terms of accuracy and correlation with service conditions of asphalt on the road.
Molded asphalt bars, 20 x 9.495 x 1.64 mm (I x w x 1) were mounted in a Seiko DMS 11 0; each sample was run in bending mode at cooling rate of 1 Clmin at single frequency. Operation at single frequency over each temperature range yields more reproducible data that attempting to obtain multifrequency data in a single run. Since multiple runs are required establishing the relationship between frequency and temperature is very time consuming. The Tg was identified as the temperature corresponding to the maxima of loss modular E" at each frequency. If the Tg is plotted against corresponding frequency based on an Arrhenius equation, an activation energy for the relaxation process can be computed. Table 4 summarizes Tgs and the calculated activation energies, Ea, for our asphalt samples.
different Tg's, e. g., compare ACC and ACD. An asphalts with a higher grade may have the same or even lower Tg than that of an asphalt with lower grade. Another interesting thing to note is that the values of active energy for the transition process of the asphalt samples are close enough to be considered constant; an average active energy of 9.4 kcallmol with a standard deviation of 20.4 kcallmol is observed. B. Brule et. al. [E] measured Tg of four asphalt samples with DMA at eight different frequencies from 0.015 to 7.3 Hz, a lower range of frequencies than we employed, We calculated the values for Ea from Brule's data: the results for the four samples are 9.6,9.3, 9.3 and 8.4 kcallmol, respectively, which are consistent with our results. The activation energy in this context is an energy barrier separating two set conformations which are in equilibrium. The height of the barrier determines the temperature dependency of wriggling rate. Thus, the constant activation energies imply that the molecular structures responsible for relaxation in each sample are the same. Previous authors [E, 9, 101 have examined fractionated asphalt samples and have shown that only saturates and aromatic fractions contribute to the glass transition. We determined the activation energy of low density polyethylene (LDPE) Tg to be 9.9 kcallmol, which is very close to that of asphalt. Hence, we postulate that
The glass transition temperature is a very important property to most organic
Scrutiny of table 4 reveals that asphalts with the same grade can exhibit very
1330

only those segments primarily composed of aliphatic units are wriggling in the glass transition process.
Imposition of a larger strain (1 %) on the asphalt samples at 50 Hz in DMA experiments will induce cracking at a specific temperature during the cooling. The temperature, called cracking temperature (Tc), can be used to estimate the low temperature cracking resistance of asphalt. The cracking temperature (Tc) is listed in Table 4. Note that all asphalt samples cracked at temperature above their Tg at 50 Hz, which implies Tg measured at this frequency can be considered the limit of brittle temperature of asphalt. In five of the eight cases the asphalt sample cracked at temperature within 4 O of its Tg, however sample ACC cracked 11 5" above its Tg. The reason behind this deviation is not clear, but we believe it is related to the morphology of the asphalt. Comparing the data on relative crystallinity of the asphalt samples with Tc (table 3), one observes the sample having exhibiting the highest Tc is the most crystalline. There is a general inverse correlation between the extent of crystallinity and the cracking temperature.
Viscous Flow Process of Asphalt Flow curves of each asphalt samples were measured with a Bohlin CS
rheometer using a cone and plate mode from 5" to 150°C. Initial Newtonian viscosities at different temperatures were determined. At temperatures well above the glass transition temperature, the viscosity is primarily governed by the energy required for a molecule to jump from one site to an adjacent site. The dependence of viscosity on temperature follows the Arrhenius equation [I 11. Figure 2 is an example of the Arrhenius plot of the viscosity versus temperature for asphalt. One observes that the curve is basically comprised of two linear regions with a single inflection point. The different slopes imply that the energy barrier of the flow process changed at certain temperature, called the onset temperature To, where a significant change in interaction between molecules occurred. The Togs determined for each asphalt samples are listed in table 5. The molecular nature of the activation energy change has not experimentally confirmed at this point, but we speculate that dissociation of aromatic rr-complexes must contribute to the change in molecular interaction. In addition, polar aromatics may interact to form of a three dimensional network that extends throughout asphalt.
Acknowledgment
Center. Support for this work was provided by Louisiana Transportation Research
1331

References 1
2 3
4 5 6. 7 8
9 10
11
L. Petrakis, D. T. Allen, G. R. Gavalas and B. C. Gates, Anal. Chem., 55, 1557, (1983) I. Gawel, Fuel, 66(5), 618, (1987) A. P. Hagen, M. P. Johnain and 6. B. Tandolph, Fuel Sci. 8 Tech. lnt'l., 7(9), 1289, (1989) D. J. Cookson and E. Smith, J. Magnetic Resonance, 57, 355, (1984). T. Mill and D. Tse, Prepr Am Chem. Soc., Div. Pet. Chem., 35(3), 483, (1990). J. C. Petersen, Transportation, Research Record, 1096, 1, (1 986) F. Noel and L. W. Corbett, J. lnst. Petrol., 56(551), 261 (1970) B Brule, J. P. Planche. G. King, P. Claudy and J. M. Letoffe, Prepre. Am. Chem. SOC., Div. Pet. Chem. 35(3) 330 (1990). Y. Wada and H. Hirose, J. Appl. Phys. Jpn., 30, 40, (1961). H. K. Huynh, T. D. Khong, S. L. Malhotra and L. P. Blanchand, Anal. Chem., 50(7), 978, (1978). G. V. Vinogradov and A. Y. Malkin, Rheology of Polymers. p105, Mir Publishers, 1980.
Table 1 NMR and FTlR Characterization of Asphalt Composition
Sample ACA Source Calumet
Grade AC-10 Arom H% 5.5 Arom C% 28.2
Linear Aliph% 41.8 Phenolics* 0.0086 Pyrrolics' 0.0142 Carboxyl 0.109
Ketone' 0.133 Quinolone' 0.0412 Sulfoxide* 0.0022
Acid'
' in mmollg asphalt.
ACE Calumet
AC-20 6.1 30.4 41.6
0.0058 0.01 12 0.0828
0.13 0.0298 0.001
ACC Exxon
AC-10 6.9 37.3 22.5
0.0069 0,0225 0.0318
0.0275 0.0269 0.0014
ACD Exxon
AC-20 6.0 34.1 21.8 0.003 0.0135 0.021
0.0195 0.027 0.0036
ACE south- land
AC-10 6.3 33.4 19.5
0.012 0.0137 0.0220
0.0798 0.023 0.0043
ACF South- land
AC-20 6.8 33.7 21.2
0.0093 0.014 0.031 1
0.043 0.0238 0.004
ACG Texaco
AC-20 7.1 34.0 22.3 0.0036 0.0145 0.0242
0.027 0.0175 0.0008
ACH Texacn
AC-30 5.7 24.5 23.2 0.004 0.0137 0.0324
0.0362 0.0109 0.0015
1332

Table 2 Types of Aliphatic Carbons in Asphalt
Structure Type Chemical Shifts, ppm
, CH2
10.8, 11.4, 14.1, 14.4, 19.2, 19.7, 20.3, 23.0
20.1, 21.6, 22.7, 24.5, 25.2, 26.7, 27.1, 27.4, 28.6, 29.4, 29.7, 30.1, 31.9, 33.7, 34.8, 37.1 I 37.4, 39.1 I 39.4
CH 28.0, 32.8, 34.4, 38.8, 40.2, 46.0
Table 3 Heat of Fusion (AHf) of the Asphalt Samples
Sample ACA ACB ACC ACD ACE ACF ACG ACH 5.8 8.6 11.3 9.6 &H&;Jf!' 37i5 i:: ::5 49:; 2.9 4.3 5.65 4.8
Tc, ,"C -12 -9 -3 -5 -20 -10 0 -3 Average entropy for 100 % crystalline = 200 J/g (8)
Table 4 Glass Transition Temperature (Tg) from E , Active Energy (E,) of the Transition and Cracking Temperature (Tc) of Asphalts
Asphalt ACA AC B ACC ACD ACE ACF ACG ACH
1 Hz -23.0% -24.9% -19.6% -14.9"C -32.2"C -23.2"C -1 6.5"C -1 6.0"C
10 Hz -17.8"C -1 7.6% -17.6"C -9.9%
-26.6% -1 8.8% -1 0.5% -9.6%
50 Hz -1 3.3% -14.5% -14.5"C -4.1"C -22.5"C -13.8% -6.1"C -5.1 "C
Ea (kcal/mol) Tc 9.8 -1 2°C 8.8 -9°C 10.0 -3°C 9.4 -5°C 9.0 -20°C 9.5 -1 0°C 9.7 0°C 9.2 -3°C
Table 5 Onset Temperature (To) of the Arrhenius Plot of Viscosity ver. Temperature
Sample ACA ACB ACC ACD ACE ACF ACG ACH ToC 74 72 63 74 86 75 70 71
1333
I

1 iw 1 io0 1 600 Wavenumbam (cm-1)
Figure 1 Deconverlution of Overlaped Peaks in a FTlR Speclrum.
Figure 2 An Arrhenius Plot of Initial Newtonian Viscosity versus Temperature.
1334

ASPHALTENE PRECIPITATION AND INCIPIENT FLOCCULATION IN MD(ED SOLVENTS.
Simon I. Andersen, Danish Natural Science Research Council,
H.C. Andersens Boulevard 40, DK-1553 Copenhagen, Denmark.
and James G. Speight,
Westem Research Institute, Laramie, WY 82071-3395
Keywords: Asphaltene, flocculation, interactions
INTRODUCTION.
The presence of asphaltenes is known to have a significant effect on both processability of crude oils and the properties of asphalts (1). Indeed, the presence of asphaltenes is particularly felt when circumstances permit their separation (precipitation) from the oil medium in such a manner that the phenomenon of phase separation causes either coke formation during processing or failure of an asphalt pavement by loss of physical StNCtUre of the asphalt-aggregate system (2).
Briefly, asphaltenes are defined as the fraction of petroleum that is insoluble in an excess of a low-boiling liquid hydrocarbon, such as n-heptane, but soluble in aromatic solvents (e& toluene or benzene) at ambient temperatures.
Thus, there is the need to understand the stability of crude oils and this can be achieved by an investigation of asphaltene precipitation/flocculation, by titration, using solvent/non- solvent mixtures. This may give an indication of both asphaltene and maltene properties (3,495).
At the point of incipient precipitation, i.e. the point at which separation of asphaltenes from a cmde oil becomes apparent, the precipitated material is, presumably, a conglomeration of species based on molecular size and polarity of the type. that constitute the asphaltenes (6,7). This phenomenon has, however, not been addressed in any detail and is certainly worthy of investigation in order to increase the understanding of crude oil (asphaltene/maltene) relationships.
Thus, in order to investigate the mechanism of asphaltene precipitation, the change in precipitated material with changes in the non-solvent/solvent composition have been examined. Material isolated at the point of incipient precipitation was recovered and characterized by high performance liquid chromatography-size exclusion chromatography (HPLC-SEC) and diffuse reflectance spectra (DRIFT-FIIR). The possibility of determining the solubility parameter (6) of the asphaltenes from titration and precipitation experiments was investigated.
The change in solvent composition from aromatic to aliphatic may mimic the change in oil composition during refinery, where the oil phase becomes more aliphatic with increasing conversion (8.9).
1335

EXPERIMENTAL
Asphaltenes were precipitated by addition of 30 mL precipitant per gm oil at 2OoC. Mixtures of n-heptane and toluene containing up to 40% (vol/vo~) of toluene were used as the precipitant.
A modification of the asphaltene separation method (IP 143) was used as described elsewhere (IO). Thus, after a 16 hr. contact t h e , precipitated asphaltenes were fuither purified by treatment with 3 x 10 mL of the appropriate solvent mixture, sonication, centrifugation (4000 rpm), and decantation.
The flocculation threshold in solvent/non-solvent mixtures was determined by measuring the light absorbance at 740 nm of the titrated solution. From a burette n-heptane was added to a stirred asphaltene or oil solution in a beaker. Asphaltene concentrations in initial solution was kept at 4 g/L. The flocculation point or threshold (m) is the solvent composition (i.e. the volume fraction of solvent in non-solvent) where the absorbance increases rapidly. The absorbance was measured 20 min. after each addition of non-solvent, allowing equilibrium conditions to be reached; shorter time periods gave inconsistent readings.
Two commercial asphaltene solvents (methylnaphthalene oil and Basen 140/160) supplied by Preussag Erdoel und Erdgas GmbH, Hannover, Germany were also examined.
The crude oil investigated was a Kuwait oil topped at 100°C and supplied by Kuwait Petroleum Denmark A/S.
I~ifr~ared spectra were recorded using a BIO-RAD (Digilab Division) model FTS-45 Fourier Transform infrared (FTIR) spectrometer with an attachment for diffuse reflectance spectra (DRIFT) (1 1).
Synchronous fluorescence spectra were obtained as described elsewhere (10); asphaltenes were dissolved in mixtures of n-heptane and toluene (10-10096 toluene) at a specified concentration ( 5 mg/L). No precipitation or particle formation was observed by Rayleigh scattering at 460 nm.
Size exclusion chromatography (HPLC-SEC) analysis was performed using a Hewlett- Packard 1090 HPLC with a diode array detector (DAD) with 8 wavelengths, and a Waters R401 refractive index (RI) detector. Freshly distilled toluene was used as eluant at a flow rate of 2 mL/min at 30 C. The column was a Phenomenex 5 p n , lo4 A, 30 cin 7.9 mtn i.d. The DAD wavelengths were 305,340,380,410,420,460,500, and 575 nm. The injected sample concentrations were 10 g/L toluene.
RESULTS AND DISCUSSION.
In the flocculation titration experiments a difference was found for solutions of pure asphaltenes and of the original oil. The latter showed a lower flocculation threshold (0.31*0.02) in terms of toluene in n-heptane than the asphaltene solutions (0.41i0.03). This was also noted for asphaltenes precipitated under a variety of conditions. This indicates that more non-solvent is required to precipitate the asphaltenes in the presence of maltenes.
The effect of various asph'altene solvents on the flocculation threshold, using n-heptane as the non-solvent, was also examined. A comparison of the various flocculation thresholds with the effective Hildebrand solubility parameter (heff) of the relevant solvent mixture (Table I) suggests that, although solvent-solute interactions vary, de^ is similar (16.7 * 0.3) for all solvent systems except for 2,4-dhnethylpyridine.
1336

Immiscibility is known to occur at solubility differences between solvent and solute of ea. 3.5 to 4 MPaln. Hence the solubility arameter of the precipitated material can be estimated to fall within the range 20.2-20.7 MPa'D which is in accordance with previous work (12,13).
Using the data further, it is predictable that there will be no precipitation of material
As expected the amount of precipitated material decreased with increasing content of toluene in heptane. Purification of the raw precipitate from the 40% toluene/heptnne precipitant, led to the recovery of a toluene insoluble solid (0.26 '76) which was partially soluble in methylene chloride.
It is possible that this material could be finely-suspended mineral matter which acts as nuclei for the part of the asphaltene, presumably the most polar, and which forms part of the initial precipitate with highly polar species (14). Without any such effect, these species would remain in "solution" and be precipitated in the usual manner. Investigations using FTIR spectroscopy and HPLC-SEC revealed that, at least part of, the material was low molecular weight 'and reacted through hydrogen bonding. In the presence of the remaining asphaltene material, the sample was soluble suggesting some rearrangement of the molecular interactions during the removal of lower molecular weight (polar) asphaltene species, which could indicate a co-solvency effect through association.
The material precipitated from n-heptane to toluene insolubles may have a &distribution between 19 and above 22 MPa1I2 which is in disa reement with the data from the titration experiments which give an upper limit of 20.7 m a B R , and hence were not able to predict the presence of toluene insoluble material. One titration exxr,iment using 2.4-dimethylpyridine showed a flocculation threshold of 0.42 (18.3 MPa ) indicating an upper limit of 22.3 MPalD.
A reasonable explanation of this phenomenon is that asphaltenes associate less in pyridine (15). Hence, the interactions leading to dispersion of the least soluble part are not present, and the compounds behave as single molecular entities. The latter is possible as the asphaltene concentration of this sample is below the critical micelle concentration (4.32 g/L) at the beginning of the titration (16). Hence, if solubility parameters are determined from titration . experiments, the data are relative to the conditions such as solvent system and equilibrium time.
Data from the m I R spectra imply that the chemical nature of the precipitate changes gradually at first but become more obvious as the incipient precipitation conditions are approached. Thus, the relative content of long chain paraffinics (720 cm") increases as do the conteiit of carboxylic acid functions (1730-1700 cm"). The latter increases rapidly above a concentration of 25% toluene. This indicates that the the least soluble part, i s . "hard core asphaltenes", which precipitates first are highly polar and contain long alkyl chains.
According to the group contribution approach for solubility parameter (a) calculation, an increase in molecular weight does not strictly imply an increase in the magnitude of 6 since long chain paraffin systems have low 6 values (17). Hence, the precipitation may be govenled by molecular weight differences between the solvent and the solute.
HPLC-SEC investigations showed that higher concentrations of toluene in the precipitant lead to shorter peak retention time, and changes take place on the low molecular weight side of the eluted profile. The largest change in profiles was seen when going from pure heptane to a mixture containing 10% toluene. The n-heptane asphaltenes had a close to bimodal profile where as for 10% (or higher amounts) of toluene, the profie is a single tailing peak indicating
I ,
1 above a flocculation threshold of 0.33 (heff = 16.2 MPaIR) for the total oil (Figure 1 ) .
1337
that the incremental material, soluble in tolueneheptane but insoluble in heptane, is composed of lower molecular weight species. This suggests that asphaltenes may be composed of different molecular weight types as suggested from frnctionntion stndies (18.19.20.23.22).
The relative change in chemical types was then investigated by a study of the ratios of total areas under the chromatograms obtained at different diode array detector (DAD) wavelengths (Figure 2). The amount of larger chromophores increases relatively as the toluene content in the precipitant rises. DAD and refractive index (RI) signals are different but the overall conclusion the same.
Hydrogen bonding is involved, to some extent, in asphaltene association and dispersion (23). Indeed, an examination of the FTIR spectra, particularly in the range 3100-3700 cm", showed that the main change in the nature of the precipitates from that obtained with pure heptane to that obtained with a 40% solution of toluene in heptane, is the occurrence of less hydrogen-bonded structures.
In the spectrum of the precipitate from the "40% toluene" mixture, distinct, relatively large, bands for free hydroxyl and carboxylic hydroxyl are found. In the presence of the co- precipitated resin-type material these bands are extremely weak, indicating that dispersion of any toluene insoluble material may take place through association with the co-precipitate. A similar concept has been proposed for resin-asphaltene interaction (24). Co-precipitated material was in all samples of lower molecular weight.
In order to investigate the interactions occurring in solution synchronous fluorescence spectra were recorded in mixtures of n-C7 and toluene with toluene volume fractions (@) from 0.1 to I . Hence the entire range from total dissolution to flocculation conditions passing the previously reported (25) critical micelle concentration limit at = 0.68. The asphaltene used was a n-octane insoluble, precipitated at 43OC.
No large changes occurred in the spectra with increasing toluene content, although the polarity of the @vent increases, which based on simple compounds should lead to peak shifts to longer wavelengths. The relative intensity of three peaks at 360,395, and 460 nm was examined representing increasing molecular complexity (IO). These results indicates a general blue shift of the intensities. If asphaltene molecules were associating a red-shift would be expected. That no interactions occurs may be caused by the very low concentration of 5 mg/L toluene. According to the solvent shell theory, asphaltenes will be dispersed as long as sufficient dispersion agent is present to form the so called solvate layer around the asphaltenes (26). This may also imply a concentration effect that can affect the titration and precipitation experiments.
CONCLUSIONS.
Discrepancies between methods (equilibrium precipitation and flocculation titration) employed to determine the incipient precipitation of asphaltenes have been found and may be related to slow kinetics of precipitation (27).
Solubility parameters of asphaltenes can be measured by the titration method but relative to the experimental parameters such as time, solvent and solute (asphaltene or oil) concentration. The recovery of a toluene insoluble fraction from a toluene soluble fraction shows the complexity of the asphaltene aggregation during precipitation. Evidence of rearrangements of molecular interactions is suggested.
1338
ACKNOWLEDGEMENTS.
SIA thanks the Danish Naniral Science Research Council and Thnmas B. Thriges Fnnd (Denmark) for financial support and Western Research Institute (Laramie, Wyoming) for use of facilities.
REFERENCES.
1. Speight, J.G. The Chemistry and Technology of Petroleum. Second Edition. Marcel Dekker Inc., New York. 1991.
2. Speight, J.G. 1992. Proceedings. 4th International Conference on Stability and Handling of Liquid Fuels. U.S. Department of Energy, Washington, D.C. 1992, 169.
3. Heithaus, J.J. J. Inst. Pet. 1962,48: 45. 4 . Bichard, J.A. Proceedings. Annual Meeting. Canadian Society for Chemical
5 . Fulu, B.J., Cathrea, C., Coates. L.. Kalra and Majeed, A.I. Fuel. 1991.70: 1293. 6. Long, R. B. Preprints. Div. Petrol. Chem. Am. Cheni. SOC. 1979,24(4): 891. 7. Long, R.B. In The Chemistry of Asphaltenes. J.W. Bunger and N. Li (editors).
Advances in Chemistry Series No. 195. American Chemical Society, Washington, D.C. 1981, 17.
8. Takatsuka, T., Wada, Y., Nakata S., and Komatsu, S. Proceedings 4th UNITARNNDP Conference on Heavy Crude and Tar Sands, AOSTRA, Alberta. 1988, Vol 5515.
9. Lambert, D.C., and Holder. K.A. Proceedings 4th UNlTARRMDP Conference on Heavy Crude and Tar Sands. AOSTRA, Alberta. 1988, Vol23449.
10. Andersen, S.I. and Birdi, K.S. Fuel Sci. Tech. Intl. 1990,8: 593. 1 1 . McKay, J.F., and Wolf, J.M. Fuel Sci. Tech. Intl. 1992. 10: 935. 12. Hirschberg, A., ddong, L.N.J., Schnipper. B.A., and Meijer, J.G. SOC. Pet. Eng.
13. Burke, N.E., Hobbs, R.D., and Kashou, S.F. J. Pet. Tech. 1991,1440 14. Mitchell, D.L., and Speight, J.G. 1973. United States Patent No. 3779902.
15. Moschopedis, S.E., Fryer, J.F., and Speight, J.G. Fuel. 1976,55: 227. 16. Andersen, S.I. and Birdi, K.S. Proceedings. International Symposium on the
Chemistry of Bitumens. Western Research Institute, Laramie, Wyoming. 1Y91,236.
17. Barton, A.F.M. Handbook of Solubility Parameters and Other Cohesion Parameters, CRC Press. 1983.
18. Bestougeff, M.. and Darmois, R. Comptes rend. 1947,224: 1365. 19. Bestougeff, M., and Darmois, R. Comptes rend. 1948,227: 129. 20. Speight, J.G. Fuel. 1971,50 102. 21. Speight, J.G. Proceedings. NSF Workshop on Coal. Knoxville, Tennessee.
22. Bestougeff, M. A,, and Mouton, Y. Bull. Liason Lab. Pont. Chaus. Special
Engineering. Edmonton, Alberta. 1969.
J. 1984,283.
December 18.
1975,125.
Volume. 1977.79.
- 1339

23. Moschopedis, S.E., andspeight, J.G. Fuel. 1976,55: 187. 24. Koots, J.A., andspeight, J.G. 1975. Fuel. 54: 179. 25. Andersen, S.I. and Birdi, K.S. J. Coll. Interface Sci. 1991, 142:497. 26. Morozova, L.A., Syunyaeva, R.Z. and Kaporovsku, L.M. Chem. Tech. Oil and
27. Speight, J.G., Long, R.B., andTrowbridge, T.D. Fuel. 1984,63: 616. Gas, USSR. 1982,280.
Table I: Flocculation thresholds Kuwait petroleum asphaltenes in volume fraction of solvent in n-heptane.
Solvent Asphaltenes (%)
c5** C6*** Flocculation threshold
6*
Toluene 0.34 0.38 18.2 16.3 Quinoline 0.24 22.0 16.9 Methylnaphthalene oil 0.29 20.3 16.8 Basen 140/160 0.36 19.8 1G.Y
2,4-dimethylpyridine 0.43 0.42 22.2 18.3
* MPalD. ** *** C5: pentane asphaltenes, yield: 21%
C6: hexane asphaltenes, yield: 18% 6,ff' 29i6i
1340

E Legend
RAW PRECIPITATE
0 PURIFIED APSHALTCNCS
0.0 0.1 0.1 0.3 VOLUME FRACTION OF TOLUENE
riqure 1 . mnunt o f p r e s i p i r a i a d a s p h a l t e n o s (=a- and p u r i f i e d 1 versus volume f r a c t i o n of t o l u e n e i n n-heptane p r e c i p i t a n t .
0.00 0.0) 0 . I O 0.13 0.20 0.k c VOLUME FRACTION OF TOLUENE IN N-HEPTANE
Figure 2 . HPLC-SEC Peak area r a t i o s Of VaTiOus d e t o c t o z r a v c l e n g t h 3 V ~ L = Y * v o l m e f r a c t i o n o f t o l u e n e i n n-heptane p r e c i p i t a n t . 3 0 5 / 5 7 5 NII and 410/515 nm.
1341

Separation of a Quinolone-Enriched Fraction From SHRP Asphalts
Stephen C. heece', J.F. Branthave2, and Sang-Soo Kim'
'Arizona Department of Public Safety P.O. Box 6638
Phoenix, AZ 85005-6638
2Westem Research Institute Box 3395 University Station Laramie, WY 82071-3395
Keywords: Asphalt, Modified Silica, Quinolone
ABSTRACT
A method originally designed to separate a carboxylic acid concentrate from asphalts has been modified so that quinolone concentrates also can be extracted from asphalts. The quinolone concentrates are high in molecular weight and contain large amounts of oxygen, nitrogen, and sulfur. Infrared spectra of the quinolone concentrates are similar to those obtained from petroleum distillates by a multistep separation scheme. Some of the sulfur atoms associated with the quinolones are readily oxidizable.
INTRODUCTION
The rheological properties of asphalts are believed to be influenced by associative interactions of polar, polyfunctional molecules in a non-polar hydrocarbon matrix (1). The identities of some of the functional groups involved in associative interactions in asphalts are carboxylic acids, phenols, pyridines, and quinolones. Other heteroatom-containing functional groups are probably involved. Compounds containing one or more of these groups have been identified in petroleum.
Asphalts contain non-volatile constituents of petroleum, which are also the largest and most polar componenk. The isolation of individual compounds, and even compound types, from asphalts for special study is a formidable task. This is because of the existence of large numbers of multifunctional compounds and extended methylene homologues in these residua.
As mentioned above, quinolones are one of a number of polar, associating species in asphalts, and thus may be major viscosity-controlling components of asphalts. Therefore the isolation and study of these compounds would be of interest. Quinolones were identified in petroleum by Copelin (2) , who concentrated them from a gas oil fraction using a separation scheme involving hydrochloric acid treatment, ion exchange separation, and alumina chromatography. The quinolone fraction was characterized by a prominent peak at 1655 cm-'
1342

1 in the infrared spectrum. Based on a comparison with infrared spectra of model compounds, Copelin deduced that the quinolones were 2-quinolones and not 4-quinolones. Snyder et al. (3) detected the same materials in gas oil fractions of other crude oils. Petersen et al. (4) observed the 1655 cm-' peak in the infrared spectrum of asphalts, and assigned the peak to 2- quinolones. These workers observed that asphalts contain molecules that are too large to be typical pyridones. They showed that the 1655 cm'l peak was unaffected by treatments with hydrochloric acid or sodium hydroxide solutions, but disappeared when asphalts were treated with hexamethyldisilazane, which reacts with the enol form of the quinolones. Lithium aluminum hydride treatment of asphalts also resulted in loss of the 1655 cm-l peak in the infrared spectrum of treated asphalts. In this reaction, carbonyl groups are reduced.
The work of Petersen et al. (4) identifies 2-quinolones as probable constituents of asphalts. The complex separation schemes of Copelin (2) and Snyder et al. (3) are not easily applied to asphalts, due to irreversible adsorption of asphalt components on alumina and difficulties in extracting asphalts with acids. However, separation of highly polar carboxylic acids from asphalts using base-treated silica gels have been reported by Ramljak et al. (5 ) . In this report, a modification of the Ramljak et al. ( 5 ) separation scheme was developed as a rapid method for the concentration of 2-quinolones from asphalts.
EXPERIMENTAL
Asphalts used in this study were obtained from the Materials Reference Library of the Strategic Highway Research Program (SHRP).
The modified silica gel was prepared according to the procedure of Ramljak et al. (5). A typical preparation consists of slurrying 400 g silicic acid (BIO-SIL A, 100-200 mesh, Bio- Rad Labs) in 4.0 L dichloromethane and then adding in portions a solution of 40 g potassium hydroxide (J.T. Baker) in 800 mL 2-propanol (J.T. Baker). After stirring the mixture for 30 minutes, it was poured onto a Buchner funnel having a sintered glass disc (C porosity) and washed with another 500 mL 2-propanol. Then the filter cake was washed with dichloromethane to remove alcohol.
The isolation of carboxylic acid concentrates was performed according to the procedure of Ramljak et al. ( 5 ) , except that chromatographic columns were employed in place of extractors. In order to successfully concentrate quinolones, carboxylic acids must be removed from asphalts first. A flow sheet for the separation of asphalts into carboxylic acid concentrate, quinoline concentrates, and quinolone-free material is illustrated in Figure 1.
After the adsorption of the carboxylic acid concentrate on the modified silica gel, chloroform was removed from the eluted fraction on a rotary evaporator. The flask containing the chloroform solution was immersed in a hot water bath, and a vacuum of about 2 Torr was applied to romove the last of the chloroform. Approximately 20 g of this eluted fraction, which comprises 95% or more of the parent asphalt, was dissolved in 80 mL dichloromethane (Omni Soh, HPLC Grade). This solvent was poured onto the top of a column 2.5 cm i.d. x 100 cm filled about three-fourths full with modified silica gel. A small layer of sand was placed in the bottom of the column before adding the modified silica gel. In filling the
1343
column, dichloromethane was poured into the column and then the gel slurry was added while the column stopcock was opened. Gel was added to fill the column with a well-packed bed to the 75 cm level. Flow rates for the separation were set by opening the column stopcock fully. About 4.0 L dichloromethane were required to complete the separation. Eluates were divested of solvent as described above, and designated the quinolone-free fraction. The modified silica gel and adsorbate were transferred to a Buchner funnel (M porosity) and a mixture of 20% furniic acid (Aldrich Chemical Co.) and 80% dichloromethane was poured onto it to desorb the quinolone concentrate. These eluates were dried on a rotary evaporator as described above and tlien redissolved in dichloromethane and again filtered to remove potassium silicate associated with the quinolone concentrate. it may be necessary to use benzene as solvent for the quinolone concentrate in order to remove residual formic acid on the rotary evaporator.
Infrared Spectra of films of the quinolone concentrates were obtained on a Perkin-Elmer 983 Spectrophotometer. Molecular weights were detennined by vapor phase osmometry using ASTM method D 2503 using toluene (60°C; 140°F) as solvent.
Elemental analyses were performed by the Analytical Research Division of Western Research Institute using standard methods.
RESULTS AND DISCUSSION
The Strategic Highway Research Program (SHRP) has designated eight asphalts for special study. Four of these asphalts, AAA-I, AAD-I, AAG-1, and AAK-1 were separated 011
modified silica gel to collect carboxylic acid concentrates and quinolone concentrates. The asphalts contain about 0.01 to 0.02 M/L of quinolones (Table I) , based on the infrared functional group analysis of Petersen (6). Recoveries of material range from 9648% in each step, so that the two concentrates are small in amount compared with the whole asphalts. The replication of the separation for AAK-I, using two different operators was not good, but this dues not affect the utility of the method in concentrating quinolones.
Elemental analyses and number-average molecular weights of the parent asphalts and the quinolone concentrates (Table 2) show that in each case, the quinolone concentrates are more aromatic and contain more nitrogen, oxygen, and sulfur than the parent asphalts. Large sulfur contents in quinolone concentrates in distillates were observed by Copelin (2), who claimed that substantial amounts of thioquinolines were present in the materials he studied. Number-average molecular weight (m,) values of the asphalt quinolone concentrates determined by vapor phase osmometly (VPO) in toluene at 60’C (140OF) are much higher than those reported by Copelin (2), which were about 300 Daltons. These materials were derived from 340450°C (644-842O F) distillates. Evidently quinolones occur in crude oils over a large molecular weight range. The M,, value of the quinoline concentrate of AAK-I also was determined by W O in pyridine at 60°C (140°F). This value is about half that of the R, value determined in toluene, which demonstrates that quinolones have strong tendencies to associate. In contrast, &I,, values for whole asphalts are similar in pyridine and toluene.
Infrared spectra of quinolone concentrates of asphalts are shown in Figures 2-5. Copelin (2) identified the peak at about 1650 cm” as the carbonyl peak of the quinolone amide
1343
function. This peak is prominent in Figures 2-5. The quinolone concentrate of AAG-I (Figure 4) is contaminated by some carboxylic acids, as shown by the presence of a peak at abont 1705 an-'. No peak corresponding to thioquinolones is observed in any of the asphalt quinolone concentrates. Instead, large sulfoxide peaks (- 1020 cm-') are observed. The quinolones contain (or possibly are associated with) readily oxidizable sulfur functionalities.
In another study, the quinolone concentrate of AAD-1 was further separated into fractions using a column of modified silica gel (7). Retention times of most of the components of the concentrates were similar to those of model compounds having 2-pyridone or 2- quinolone structural units.
It is possible to collect both carboxylic acids and quinolones by eliminating the initial step and directly separating the original asphalt on activated silica with dichloromethane. Yield of the combination of quinolones and acids for AAA-1 is 4.8 wt %.
CONCLUSIONS
Quinolones can be concentrated from four asphalts by a modification of a method originally developed to concentrate carboxylic acids from asphalts. The quinolone concentrates are characterized by a prominent peak in their infrared spectra at about 1650 an-'. Nitrogen, oxygen, and sulfur concentrations in these materials also are high. The sulfur functionality associated with the quinolone concentrates is readily oxidizable. The number- average molecular weights of the quinolone concentrates are approximately twice those of the parent asphalts.
The method used to concentrate quinolones from asphalts is rapid and simple and it presumably can be extended to other petroleum-derived fractions. It is estimated that quinolones are concentrated about ten- to twenty-fold by this method based on concentrations of these compounds in parent asphalts. The concentrates can be further purified by other separation methods (7).
DISCLAIMER
The contents of this report reflect the views of the authors, who are solely responsible for the facts and accuracy of the data presented. The contents do not necessarily reflect the official view or policies of the Strategic Highway Research Program (SHRP) or SHRP's sponsors. The results reported here are not necessarily in agreement with the results of other SHRP research activities. They are reported to stimulate review and discussion within the research community. This report does not constitute a standard, specification, or regulation. Mention of specific brands of materials does not imply endorsement by SHRP or Western Research Institute.
1344

ACKNOWLEDGMENTS
1 The work reported herein has been conducted as a part of Project AO2A of the Strategic Highway Research Program (SHRP). SHRP is a unit of the National Research Council that was authorized by Section 128 of the Surface Transportation and Uniform Relocation Assistance Act of 1987. This project is titled “Binder Characterization and Evaluation” and is being conducted by the Western Research Institute, Laramie, Wyoming, in cooperation with the Pennsylvania Transportation Institute, Texas Transportation Institute, and SRI International. Dr. Raymond E. Robertson is the principal investigator. Dawn Geldien is the project administrator. The support and encouragement of Dr. Edward Harrigan, SHRP Asphalt Program Manager, and Dr. Jack Youtcheff, SHRP Technical Contract Manager, are gratefully acknowledged. Analytical work was performed by G.W. Gardner. The manuscript was prepared by J. Greaser.
LITERATURE CITED
(1) (2 ) (3) (4)
( 5 )
(6) Petersen, J.C. 1986. Transport. Res. Rec., 1096, 1-11. (7)
Petersen, J.C. 1984. Transport. Res. Rec., m , 1 3 - 3 0 . Copelin, E.C. 1964. Anal. Chem., 36,2274-2277. Snyder, L.E., B.E. Buell, and H.E. Howard. 1968. Anal. Chem., 40,1303-1317. Petersen, J.C., R.V. Barbour, S.M. Dorrence, F.A. Barbour, and R.V. Helm. 1971. Anal. Chern., 43, 1491-1496. Ranlljak, Z., A. Solc. P. Arpino, J.M. Schmitter, and G. Guichon. 1977. Anal. Chem., 49, 1222-1225.
Preece, S.C. 1992. Master of Science Dissertation, University of Wyoming, Laramie, Wyoming.
TABLE 1
Yields of Quinolone Concentrates from Four Asphalts
Asphalt Yield of Quinolone Concentrate, wt 5% of Asphalt
AAA- 1 2.6 AAD- 1 6.7 AAG-1 2.7 AAK- 1 5.0; 6.8
1345

I
1346

Dissolved in Chloroform
KOH Treated Silica in Chloroform I Adsorbed Eluted
1. Desorb with Formic Acid 2. Remove Solvent
I 1. Remove Solvent
1. Redissolve in Dichloromethane
KOH Treated Silica In Dichloromethone
Adsorbed I
Eluted
1. Remove Solvent 1. Desorb with Formic Acid 2. Remove Solvent 1
Figure 1. Flow Scheme for the Isolation of Ouinolones
1347

I \
1
-
I -
I I 1 I I 1 I 1 0.0 2000 1800 1600 1400 1200 low 800 600
C d
Figure 4. Quinolone Concentrate from AAG-1
0.8
0.6 8
8 3
I l'o
- 0.4 a
1348
I
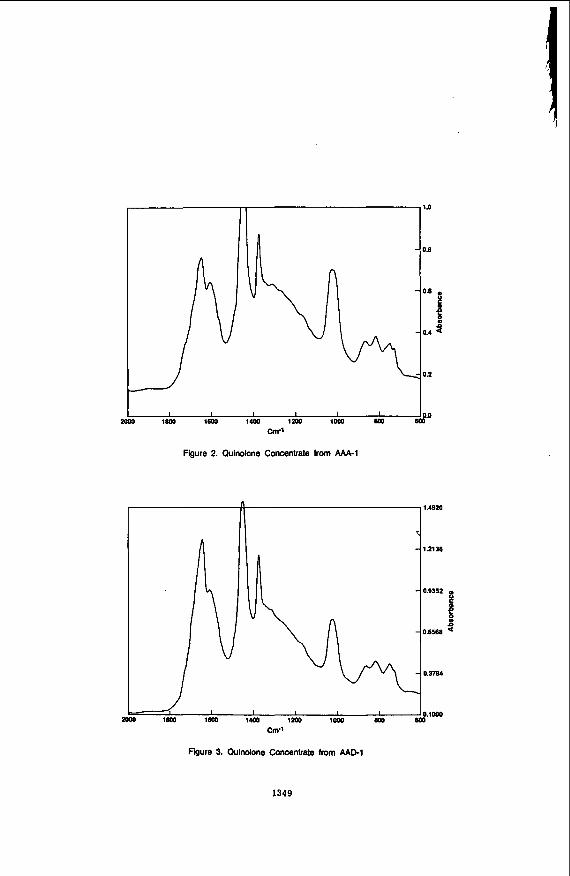
I I I I I I 1863 16w 1400 1200 low Boo
cm”
Figure 2. Quinolone Concentrate from AAA-1
2wo lam lwo tm 1200 two Boo
I I 9
1.8
D.6
4 B D.b
D.2
1.0
1.4920
1.2138
1 0.9352
n 0.6588 .z
0.3784
flow Cm-1
Figure 3. Oulnoione Concentrate from AADl
1349
DEVELOPMENT OF A REPRODUCIBLE IATROSCAN METHOD TO CHEMICALLY CHARACTERIZE ASPHALT
C. C. Wan, T. H. Waters, R. D. Wolever Owens-Corning F iberg las Corp., Technical Center
2790 Columbus Road, Rte #16 Granvi l le , OH 43023-1200
Keywords: asphalt; Iatroscan, TLC, asphalt f r a c t i o n s
ABSTRACT
A rap id, reproducib le method has been developed which q u a n t i t a t i v e l y separates an asphalt i n t o f o u r generic f rac t i ons . This paper describes the impact o f var iab les such as spo t t i ng technique, humidity, sample size, e tc . on the quan t i t a t i ve r e p r o d u c i b i l i t y o f the TLC-FID technique. With minor modi f icat ions, t h i s method i s being evaluated by the Asphalt Roofing Manufacturers Associat ion (ARMA) as t h e i r standard Ia t roscan method.
INTRODUCTION
The a b i l i t y t o p r e d i c t t he performance o f a f i n i s h e d product t h a t has been prepared from an asphalt and t o understand the e f f e c t s o f var ious processing steps and modi f icat ions o f asphalts requi res a knowledge o f t he chemical composition o f the asphalt. Since asphalts are complex mixtures o f thousands o f d i f f e r e n t compounds, separation o f t h i s mater ia l i n t o each i n d i v i d u a l moiety would overwhelm c u r r e n t l y ava i l ab le chromatographic data systems no t t o mention the analyst as we l l as the asphalt chemist. A b e t t e r approach would be t o separate the asphalt i n t o groups o r classes o f compounds s i m i l a r t o the Corbett method.
Recently, a new technique which couples t h i n l a y e r chromatography w i t h a flame i o n i z a t i o n detector has been introduced by I a t r o n Laboratories, Inc. The u n i t i s c a l l e d an Iatroscan. This u n i t takes advantage o f the h igh separation power, simple and r a p i d operat ing procedures, and small sample s i z e o f t he t h i n l aye r technique and couples t h a t t o the exce l l en t quan t i t a t i on o f a flame ion i za t i on detector. With the Ia t roscan a l l sample components are accessible t o the detector .
Model compounds were used t o develop a separation scheme t h a t f rac t i ona tes an asphalt i n t o fou r reasonably d i s t i n c t chemical classes. Although t h e prec is ion f o r t he same t ime period, one t o three days, was genera l l y excel lent ; w i t h i n a mat ter o f months i t was apparent t h a t the r e p e a t a b i l i t y o f week-to-week and month-to-month data was very poor. For example, a Cross roo fe rs f l u x was analyzed on two d i f f e r e n t dates. As the r e s u l t s t h a t are given i n Table 1 ind icate, t h e p rec i s ion f o r both dates i s excel lent ; however, t he r e p e a t a b i l i t y was unsat is factory . By contrast , analys is o f a syn the t i c standard which contained f o u r d i s t i n c t l y d i f f e r e n t compounds w i t h respect t o p o l a r i t y showed no day-to-day r e p e a t a b i l i t y problems. See Table 2. Th is data c l e a r l y p o i n t s t o the fact t h a t t h e chromatography was no t adequate t o a f f e c t t he same separation day a f t e r day.
Thus, s tud ies were conducted t o examine the impact o f var ious chromatographic parameters on r e p e a t a b i l i t y . The most obvious parameters t o study are: humidity, sample s i z e and spo t t i ng technique.
1350
EXPERIMENTAL
ADDaratus:
All data was generated on a Ia t roscan model Mark I V . The instrument was set up according t o the manufacturer’s spec i f ica t ions . The hydrogen gas flow r a t e was set t o 160 mL/min and the a i r flow r a t e was s e t t o 2.0 L/min. Flow r a t e s were read from the bottom of t h e b a l l s located ins ide the Iatroscan gauges. The chromarods were blank scanned twice pr ior t o spot t ing . All scans were made a t 30 seconds per scan. The u n i t was interfaced t o a Hewlett Packard 1000 Data System.
Procedure:
The manufacturer’s procedures were followed t o s t a r t up the Iatroscan. The chromarods were blank scanned twice a t 30 seconds/rod t o remove contaminants.
Samples were prepared by dissolving 150 mg/20 m l of carbon d isu l f ide .
A sequential solvent development technique was used t o separate the asphal t in to four f rac t ions .
1. N-heptane 8.5 cm 2 . Toluene 4.5 cm 3. Tetrahydrofuran 2.0 cm
A constant humidity chamber was used t o deact ivate the chromarods t o a constant s t a t e p r i o r t o each development s t e p . Also, t h e rods were suspended over the solvent vapors f o r fixed time periods p r i o r t o development. After each development s tep, the rods were dr ied in an oven a t 60°C f o r one minute.
Only the areas of t h e four main peaks are used i n the calculat ion. Report the normalized area percent of each peak. Peak 1 should be reported as sa tura tes . Peak 2 should be reported a s naphthene aromatics. Peak 3 should be reported as polar aromatics. Peak 4 should be reported as asphaltenes.
DISCUSS ION
Devetooment of SeDaration Scheme
The Iatron Company suppl ies both alumina and s i l i c a chromarods. Model compounds were used t o evaluate the a b i l i t y of these adsorbents t o resolve compounds represent ing sa tura tes , aromatics, polars and asphaltenes. Nujol, an infrared spectroscopy mulling o i l , was used t o simulate the sa tura tes and 1- phenyltridecane was used as the model f o r the aromatic f rac t ion . The 1- phenyltridecane was a t best p a r t i a l l y resolved from the Nujol on t h e alumina adsorbent. A much b e t t e r separat ion was obtained using the s i l i c a adsorbent with a l l other parameters being held constant . See Figures 1 and 2.
Similar ly , model compounds were used to ver i fy t h a t the solvent development scheme separates the asphal t in to sa tura tes , aromatics, polars and asphaltenes. Neat solvents of increasing polar i ty were selected as opposed t o solvent blends t h a t contain low concentrations of t h e strong solvent . This e l iminates the hassles o f accurately generating and maintaining t h i s solvent blend. The solvents selected a r e N-heptane, toluene and tetrahydrofuran (THF). With t h i s system, a l l saturated hydrocarbons a r e e lu ted i n t h e f i r s t peak. Fused r ing
1351
aromatics, a l k y l subs t i t u ted aromatics p lus thiophenes are e lu ted w i t h toluene i n peak number 2. Nit rogen and oxygen he te rocyc l i c aromatic compounds p lus compounds which have p o l a r f unc t i ona l groups such as hydroxyl, amines (primary and secondary), ca rboxy l i c acids, ketones, etc., are e l u t e d w i t h THF as peak number 3 . The peak a t the o r i g i n i s most l i k e l y metal complexes and sa l t s . Table 3 gives t h e peak l o c a t i o n o f var ious compounds.
fi D i f f e r e n t concentrat ions o f calcium ch lo r i de i n water were used t o prepare 30%, 65% and 100% r e l a t i v e humid i ty (R.H.) chambers. The same asphal t was analyzed a t these three r e l a t i v e humid i t ies. The r e s u l t s are g iven i n Table 4. Dramatic changes i n the concentrat ions o f the naphthene aromatics (NA) and p o l a r aromatics (PA) were observed. A t 30% R.H., the NA are 39.3% compared t o 55.5% NA a t 100% R.H. The PA are 28.5% a t 30% R.H. and 18.6% a t 100% R.H. Clear ly , h igher r e l a t i v e humid i t ies deact ivate the chromarods, thereby a l l ow ing more o f t he po la r aromatics t o be moved w i t h the toluene solvent f ron t . Thus, i t i s imperat ive t h a t t he l abo ra to ry be maintained a t a constant r e l a t i v e humid l ty o r the methodology inc lude constant humidity chambers.
Jmoact o f Samole Size on Ouant i ta t ion
To study the impact o f sample s i z e on quan t i t a t i on , d i f f e r e n t concentrat ions o f t he same asphalt were prepared i n carbon d i s u l f i d e . The i n i t i a l study covered the range o f 20 t o 100 micrograms o f asphalt on the chromarods. A t these loadings, base1 ine reso lu t i on between the po la r aromatics and asphaltenes was no t achieved. I n addi t ion, peaks were d i s t o r t e d and. i n some cases, the peaks s p i t i n t o doublets. Also, rescan o f these rods produced as h igh as 15% residue. C l e a r l y f o r q u a n t i t a t i v e purposes t h i s i s not acceptable.
The next set o f data spanned the range o f 5 t o 15 micrograms i n 2.5 microgram increments. The data i s g iven i n Table 5. From t h i s data, i t appears t h a t the optimum sample s i ze i s i n the 7.5 t o 12.5 microgram range. Rescan o f these rods gave less than one percent residue.
Two spo t t i ng techniques were studied. The f i r s t technique involved the app l i ca t i on o f t he sample on the chromarod as a d i s c r e t e spot us ing a m i c r o l i t e r syringe. Th is approach has two drawbacks. F i r s t , i t would be d i f f i c u l t t o ensure t h a t t h e sample spot for a l l t e n rods i n a rack w i l l remain constant with respect t o the flame p r o f i l e of the detector . Second, a spot does n o t g i ve the sample f u l l access t o the t o t a l surface o f the chromarod. The second spo t t i ng technique was t o apply the sample as a narrow band around the circumference o f the chromarod. Chromatograms f o r the spot and r i n g technique are i l l u s t r a t e d i n Figures 3 and 4, respect ive ly . The loss o f reso lu t i on between the asphaltene and p o l a r aromatic peaks p lus the band d i s t o r t i o n o f t h e asphaltene peak i n the chromatogram o f t he sample appl ied as a spot i nd i ca tes t h a t breakthrough o f t he asphaltenes i n t o the po la r aromatics has occurred. Thus, optimum chromatography was obtained by apply ing the sample as a band ra the r than a d i sc re te spot.
CONCLUSIONS
The Ia t roscan method separates asphalts i n t o fou r reasonably d i s t i n c t groups o f Compounds: saturates, aromatics/thiophenes, pol ars and asphal tenes.
The r e p e a t a b i l i t y o f t h i s technique has been improved by c o n t r o l l i n g the
1352

following variables: relative humidity, sample size and spotting technique.
1353
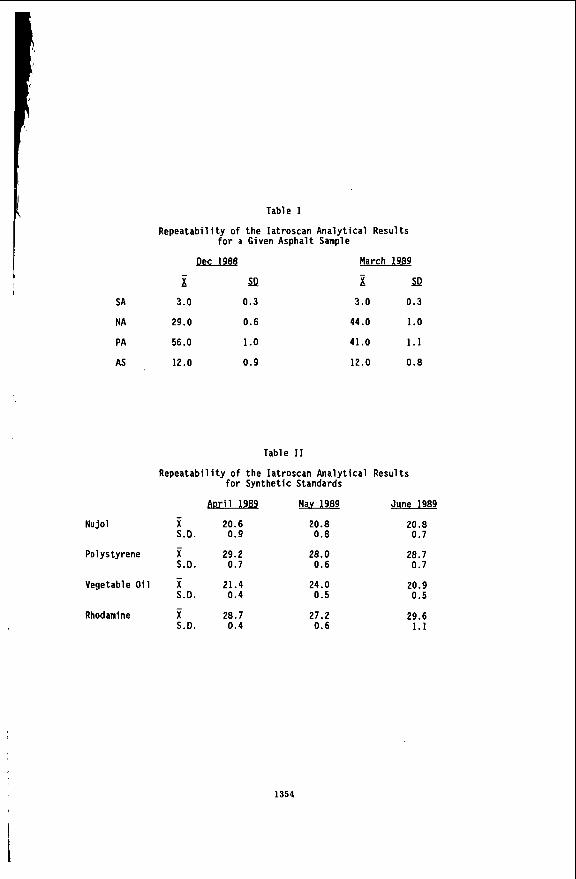
Table 1
Repeatabi l i ty o f the Iatroscan Analytical Results f o r a Given Asphalt Sample
Dec 1988
x - SD
SA 3.0 0.3
NA 29.0 0.6
PA 56.0 1.0
AS 12.0 0.9
- March 1989
x s9 -
3 . 0 0 .3
44.0 1 .o 41 .O 1 . 1
12.0 0 .8
Table I1
f o r Synthetic Standards Repeatabil i ty o f the Iatroscan Analytical Results
April 1989 Mav 1989 June 1989 -
Nujol X 20.6 20.8 20.8 S.D. 0.9 0.8 0.7
Polystyrene X 29.2 28.0 28.7 S.D. 0.7 0.6 0.7
Vegetable O i l X 21.4 24.0 20.9 S.D. 0 .4 0.5 0 . 5
Rhodamine X 28.7 21.2 29.6 S.D. 0 .4 0.6 1.1
-
-
-
1354

Table I 1 1
Ia t roscan Analys is o f Model Compounds
Comoound Saturate
Nujo l X 1-phenyl t r idecane 7,8-benzoquinol i ne 3-pentadecyl phenol Thianthrene 6-methylquinol i ne Phthal az i ne 4,4-di hydroxydi phenylmethane Naphophthal e i n 4-hydroxybenzyl a lcohol p-nitrobenzoic ac id 4,4-dimethyldi anal i ne 4-(P-nitrophenylazo) reso rc ino l Rhodamine B Vegetable O i l Low molecular weight po lystyrene Anthracene
Peak Locat ion Aromatic Polar AsDhal tene
X X
f X X
X X
X X X X X
X
X
X
X X
Table I V
E f f e c t o f Humidity on Ia t roscan Results
Saturates
Aromatics
Pol a r Aromatics
Asphal tenes
Re la t i ve Humidity m65% 100% 16.5 13.5 15.5
39.3 46.5 55.5
28.5 25.0 18.6
14.8 13.0 10.5
1355

9. Table V
I EFFECT OF SAMPLE SIZE ON QUANTITATION
-------------- SAMPLE SIZE _-------------- COMPONENT U U U 12.5LLc U
SA 16.8 18.2 17.8 19 .8 20.1
NA 23.2 26.3 27.6 27.6 27.4
PA 34.5 34.6 34.3 32.7 36.5
AS 25.5 20.9 20.3 19.9 16.0
1356

Figure 1
Iatroscan Separation o f Model Compounds on A1 umi na Adsorbent
r. In N
Nujol Oi
I I I \ . . J I I I
1357

Figure 2
Iatroscan Separation o f Model Compounds on Silica Adsorbent
Nujol Oil
r(
N N
0 W N
.-phenyl tridecane
1358

Figure 3
Sample Applied a6 spot
Figure 4
Sample Applied as Band
. S I
.07 . I2 . I 8 .23 .29 . 3 4 . 4 0 . 4 5 " I ""1C.
1359
.I.

CHARACTERIZATION OF ASPHALTS AND ASPHALT/AGGREGATE MIXTURES USING FLUORESCENCE MICROPHOTOMETRY
Gareth 0. Mitchell and Alan Davis Energy and Fuels Research Center The Pennsylvania State University
University Park, PA 16802
Keywords: Fluorescence microphotometry, fluorometric analysis, asphalt f 1 uorescence
INTRODUCTION
Current techniques used in the paving industry for measuring pavement deterioration first require that the asphalt binder be recovered by solvent extraction [l]. developed during asphalt aging and which may be responsible for some of the detrimental changes in pavement properties [2] . is being developed as a non-destructive quantitative technique for the characterization of asphalt binder quality and deterioration, for both the raw asphalts as well as from cements and pavement cores.
This practice may disrupt the molecular structuring that has
Fluorescence microphotometry
EXPERIMENTAL
Analysis of fluorescence intensity at 600 nm and the measurement of spectral distribution between 510 - 750 nm were performed using a Leitz MPV-I1 microscope photometer system [3,4]. For both methods light energy from either a high-pressure xenon or mercury-arc lamp was passed through a heat filter (suppressing red and infrared wavelengths) and then through a series of interference filters which defined the appropriate excitation and measuring wavelengths. 490 nm (blue light) excitation, 510 nm dichromatic beam splitter and 515 nm long-pass barrier filter. reflection short-pass dichromatic beam splitter and condensed onto the sample through a 50X NPL FLUOTAR air objective. dry nitrogen atmosphere to eliminate photooxidation and the total magnification of the optical system was 625 times. back through the dichromatic beam splitter, and a 515 nm long-pass barrier filter blocked any residual reflected excitation light. From this point, the measuring system became significantly different depending upon the desired measurement, i .e., intensity at a single wavelength or spectral distribution.
For measurement of intensity, the fluorescence emission passed through a measurement filter centered around 600 nm (570-630 nm). were transformed into electronic signals by an EM1 9558 photomultiplier and amplified. of stable fluorescence intensity (uranyl glass), a statistically adequate number of intensity readings were accumulated [4]. relative intensity by wavelength (spectra), fluorescence emissions were passed through a motor-driven Kratos GM200 double-grating monochromator with 20 nm bandwidth, and then to a RCA C31034A water-cooled photomultiplier for measurement. In this system wavelength and intensity were calibrated over the range of visible light and the spectra were corrected with respect to color temperature [5].
Analyses were performed using filter combinations utilizing 390-
The excitation light was reflected by a 510 nm
All measurements were made using a
The light energy passed
The optical signal(s)
Once the photoelectric system was calibrated to a glass standard
For the measurement of
1360

Various samples were obtained inc lud ing twelve raw asphal ts from the Mater ia ls Reference L ib ra ry (MRL, [SI) as we l l as samples o f t h i n - f i l m oven residues (TFOT) and pressure vessel (TFO-PV-Air) aged asphal ts from Western Research I n s t i t u t e . Each o f these samples were prepared i n t o plug-mount subsamples su i tab le f o r microscopy as discussed elsewhere [4]. About 30 p lug mounts were made f o r each raw asphal t . preparat ion was analyzed and the remaining subsamples were sealed i n f o i l mu l t i laminate bags i n an argon atmosphere and re f r i ge ra ted a t -5" C. For comparison, some asphal t samples were exposed t o room cond i t ions (but protected from l i g h t ) f o r var ious per iods o f time.
absorpt ion l imestone), RD ( low absorpt ion l imestone), RB (gran i te ) and RJ (gravel) . Each aggregate was s p l i t and stage-crushed t o pass a 200 mesh (e74 pm) screen. Along w i t h these aggregates, p a r t i c u l a t e (e lmm) t e f l o n was used as an iner t -sur face add i t i ve t o determine the e f f e c t s o f d i l u t i o n . In addi t ion, four f resh asphal ts were obtained (AAA-1, AAG-1-2, AAM-1 and ABO) from the MRL f o r p repara t ion o f asphalt/aggregate mixtures o r mastics.
Mastics were prepared by forming a 50/50% volumetr ic mix tu re o f each asphalt and aggregate fo l l ow ing the same methodology. About 50 g o f each aggregate were d r i e d i n an oven a t 150°C f o r 10h. thoroughly heated and homogenized, each aggregate (o r t e f l o n ) i n t u r n was removed from the oven and, wh i le s t i l l hot, an appropr iate amount o f asphal t was weighed i n t o the aggregate. were wetted w i t h asphal t (-5 min). i n t o several preheated 2.5 cm diameter s tee l molds f i t t e d w i t h s tee l end caps and pressed under 4000 p s i using a hydrau l i c press. molds, some o f t he samples were placed i n f o i l mu l t i laminate bags under argon and re f r igera ted . Other samples were pushed from t h e i r molds and the sides and one end covered w i t h masking tape and labe l led . The exposed end was l i g h t l y ground on 600 g r i t abrasive paper t o reveal i n te r faces between asphal t b inder and aggregate. desiccator before analysis.
g iven asphal t on the day fo l l ow ing preparat ion. determined using the standard set-up. A t o t a l o f 50 readings was necessary t o ob ta in repeatable mean fluorescence i n t e n s i t y values from the asphal t b inder when aggregate mater ia ls were present. Spectral analyses were a l so performed on t he asphal t b inder p o r t i o n o f t he mastics by determining the mean spectra o f readings taken from f i v e d i f f e r e n t areas.
Fol lowing a cool-down per iod ( lh), one
Four aggregates were a l so obtained from the MRL, inc lud ing RC (h igh
A f resh asphal t was
Mixtures were s t i r r e d u n t i l a l l p a r t i c l e s Subsamples o f t he mix tu re were then placed
While s t i l l i n t h e i r
Samples were allowed t o warm t o room temperature i n a
Fluorometric and spec t ra l analyses were performed on a l l mastics o f a Fluorescence i n t e n s i t y was
RESULTS AWD DISCUSSION
Measurement o f mean fluorescence i n t e n s i t y has been shown t o p rov ide unique and cha rac te r i s t i c values f o r i nd i v idua l raw ( f resh) asphal ts [4]. When measurements were made using xenon i r r a d i a t i o n i n a n i t rogen atmosphere the mean i n t e n s i t y o f 10 readings were found t o be repeatable t o within *0.1%. A p re l im inary eva lua t ion o f f luorescence i n t e n s i t y o f twelve asphal ts w i t h t h e i r i n i t i a l physical and chemical p roper t ies revealed a weak c o r r e l a t i o n w i t h v i scos i t y ( a t 60'C). Figure 1 shows t h a t f luorescence i n t e n s i t y decreases as v i s c o s i t y increases. supported by comparison o f t he i n t e n s i t y and v i scos i t y values observed f o r t he AAA-1, AAA-2 and AAE asphalts (Figure 1). These asphal ts were der ived from
This re la t i onsh ip was independently
1361
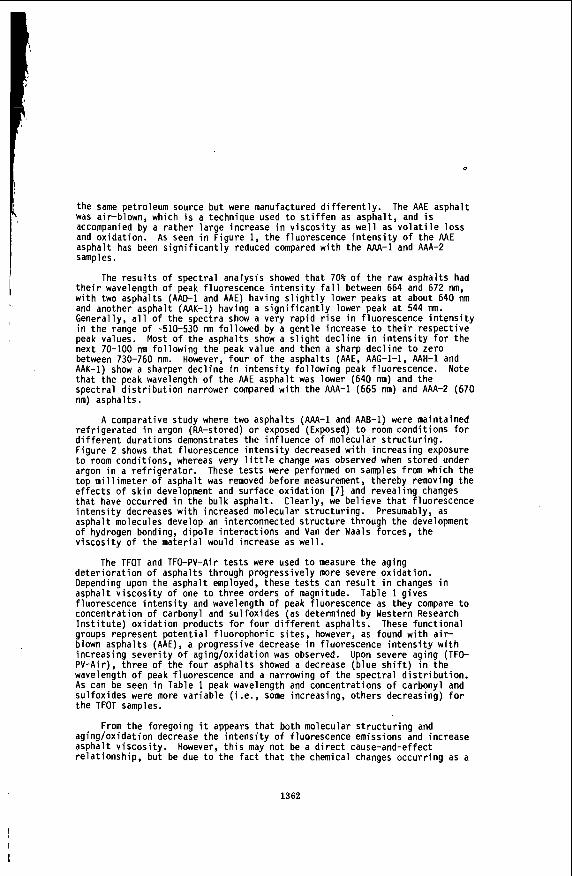
the same petroleum source bu t were manufactured d i f f e r e n t l y . was air-blown, which i s a technique used t o s t i f f e n as asphalt, and i s accompanied by a ra the r l a rge increase i n v i s c o s i t y as w e l l as v o l a t i l e l oss and ox idat ion. asphalt has been s i g n i f i c a n t l y reduced compared w i t h the AAA-1 and AAA-2 samples.
The r e s u l t s o f spect ra l analysis showed t h a t 70% o f t he raw asphalts had t h e i r wavelength o f peak f luorescence i n t e n s i t y f a l l between 664 and 672 nm, w i t h two asphalts (AAO-1 and AAE) having s l i g h t l y lower peaks a t about 640 nm and another asphalt (AAK-1) having a s i g n i f i c a n t l y lower peak a t 544 nm. Generally, a l l o f the spectra show a very rap id r i s e i n f luorescence i n t e n s i t y i n the range o f -510-530 nm fol lowed by a gent le increase t o t h e i r respect ive peak values. Most o f the asphalts show a s l i g h t dec l ine i n i n t e n s i t y f o r t he next 70-100 nm fo l l ow ing the peak value and then a sharp dec l i ne t o zero between 730-760 nm. However, f ou r o f t he asphalts (AAE, AAG-1-1, AAH-1 and AAK-I) show a sharper dec l ine i n i n t e n s i t y fo l l ow ing peak fluorescence. Note t h a t the peak wavelength o f the AAE asphalt was lower (640 nm) and the spect ra l d i s t r i b u t i o n narrower compared w i t h the AAA-1 (665 nm) and AAA-2 (670 nm) asphalts.
A comparative study where two asphalts (AAA-1 and AAB-1) were maintained r e f r i g e r a t e d i n argon (RA-stored) or exposed (Exposed) t o room condi t ions f o r d i f f e r e n t durat ions demonstrates the in f luence o f molecular s t ruc tu r ing . Figure 2 shows t h a t f luorescence i n t e n s i t y decreased w i t h increas ing exposure t o room condi t ions, whereas very l i t t l e change was observed when stored under argon i n a r e f r i g e r a t o r . These t e s t s were performed on samples from which the top m i 11 imeter o f asphalt was removed before measurement, thereby removing t h e e f f e c t s o f s k i n development and surface ox ida t i on [7] and revea l i ng changes t h a t have occurred i n the bulk asphalt. Clearly, we be l i eve t h a t f luorescence i n t e n s i t y decreases w i t h increased molecular s t ruc tu r ing . asphalt molecules develop an interconnected s t ruc tu re through the development o f hydrogen bonding, d ipo le i n te rac t i ons and Van der Waals forces, t he v i s c o s i t y o f the mater ia l would increase as wel l .
The TFOT and TFO-PV-Air t e s t s were used t o measure t h e aging d e t e r i o r a t i o n o f asphalts through progress ive ly more severe ox idat ion. Depending upon the asphalt employed, these t e s t s can r e s u l t i n changes i n asphalt v i s c o s i t y o f one t o th ree orders o f magnitude. Table 1 g ives f luorescence i n t e n s i t y and wavelength o f peak f luorescence as they compare t o concentrat ion o f carbonyl and su l fox ides (as determined by Western Research I n s t i t u t e ) ox ida t i on products f o r f ou r d i f f e r e n t asphalts. These func t i ona l groups represent p o t e n t i a l f luorophor ic s i t es , however, as found w i t h a i r - blown asphalts (AAE), a progressive decrease i n f luorescence i n t e n s i t y w i t h increas ing s e v e r i t y o f aging/oxidation was observed. Upon severe aging (TFO- P V - A i r ) , t h ree o f the f o u r asphalts showed a decrease (b lue s h i f t ) i n the wavelength o f peak f luorescence and a narrowing o f the spec t ra l d i s t r i b u t i o n . As can be seen i n Table 1 peak wavelength and concentrat ions o f carbonyl and su l fox ides were more va r iab le ( i .e., some increasing, o thers decreasing) f o r t he TFOT samples.
From the foregoing i t appears t h a t both molecular s t r u c t u r i n g and aging/ox idat ion decrease the i n t e n s i t y o f fluorescence emissions and increase asphal t v i s c o s i t y . However, t h i s may no t be a d i r e c t cause-and-effect re la t i onsh ip , but be due t o the f a c t t h a t the chemical changes occu r r i ng as a
The AAE asphal t
As seen i n Figure 1, the f luorescence i n t e n s i t y o f t h e AAE
Presumably, as
1362
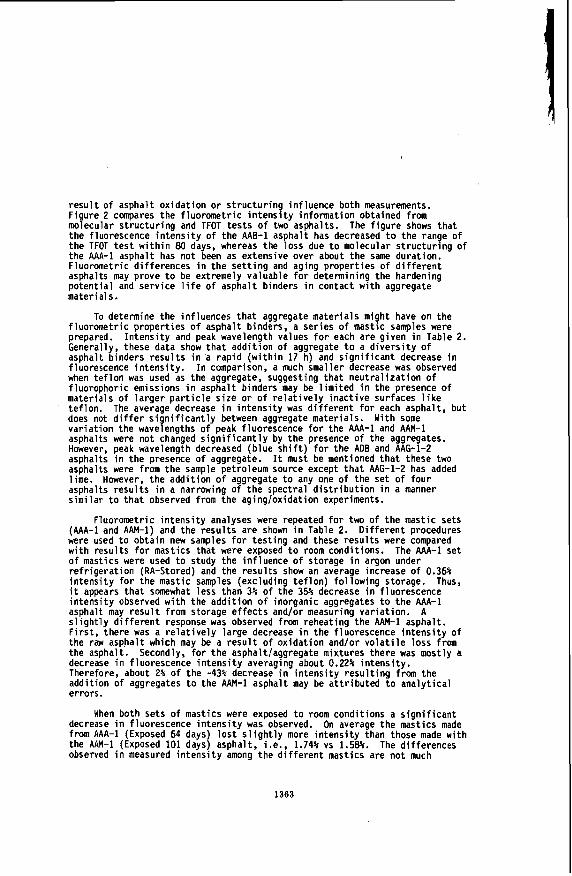
r e s u l t o f asphal t ox ida t i on or s t r u c t u r i n g in f luence bo th measurements. Figure 2 compares the f luoromet r ic i n t e n s i t y in fo rmat ion obtained from molecular s t ruc tu r ing and TFOT t e s t s o f two asphalts. t he fluorescence i n t e n s i t y o f t he AAB-1 asphal t has decreased t o t h e range o f t he TFOT t e s t w i t h i n 80 days, whereas the loss due t o molecular s t ruc tu r ing o f t he AAA-1 asphal t has no t been as extensive over about the same durat ion. Fluorometric d i f fe rences i n the s e t t i n g and aging proper t ies o f d i f f e r e n t asphalts may prove t o be extremely valuable f o r determining the hardening po ten t i a l and serv ice l i f e o f asphal t binders i n contact w i t h aggregate mater ia ls.
To determine the inf luences t h a t aggregate mater ia ls might have on the f luoromet r ic p roper t i es o f asphal t binders, a ser ies o f mast ic samples were prepared. Generally, these data show t h a t add i t i on o f aggregate t o a d i v e r s i t y o f asphalt b inders r e s u l t s i n 'a r a p i d ( w i t h i n 17 h) and s i g n i f i c a n t decrease i n fluorescence i n t e n s i t y . In comparison, a much smal ler decrease was observed when t e f l o n was used as the aggregate, suggesting t h a t n e u t r a l i z a t i o n o f f luorophor ic emissions i n asphal t b inders may be l i m i t e d i n the presence o f mater ia ls o f l a r g e r p a r t i c l e s i z e or o f r e l a t i v e l y i n a c t i v e surfaces l i k e te f l on . does not d i f f e r s i g n i f i c a n t l y between aggregate mater ia ls . va r ia t i on the wavelengths o f peak fluorescence f o r t he AAA-1 and AAM-1 asphalts were no t changed s i g n i f i c a n t l y by the presence o f the aggregates. However, peak wavelength decreased (b lue s h i f t ) f o r t he ADB and AAG-1-2 asphalts in t he presence o f aggregate. asphalts were from the sample petroleum source except t h a t MG-1-2 has added lime. However, t he add i t i on o f aggregate t o any one o f t he se t o f f ou r asphalts r e s u l t s i n a narrowing o f t h e spec t ra l d i s t r i b u t i o n i n a manner s im i la r t o t h a t observed from the ag ing lox ida t ion experiments.
(MA-1 and AAM-1) and the r e s u l t s a re shown i n Table 2. were used t o ob ta in new samples f o r t e s t i n g and these r e s u l t s were compared w i t h resu l t s f o r mastics tha t were exposed t o room condi t ions. o f mastics were used t o study the in f luence o f storage i n argon under r e f r i g e r a t i o n (RA-Stored) and the r e s u l t s show an average increase o f 0.36% i n t e n s i t y f o r the mast ic samples (excluding t e f l o n ) fo l l ow ing storage. i t appears t h a t somewhat less than 3% o f the 35% decrease i n f luorescence i n t e n s i t y observed w i t h the add i t i on o f inorganic aggregates t o t h e AAA-1 asphalt may r e s u l t from storage e f f e c t s and/or measuring va r ia t i on . A s l i g h t l y d i f f e r e n t response was observed from reheat ing the AAM-1 asphalt. F i r s t , there was a r e l a t i v e l y l a rge decrease i n the fluorescence i n t e n s i t y o f the raw asphal t which may be a r e s u l t o f ox ida t ion and/or v o l a t i l e loss f r o m the asphalt. Secondly, f o r t h e asphal t laggregate mixtures there was most ly a decrease i n f luorescence i n t e n s i t y averaging about 0.22% i n t e n s i t y . Therefore, about 2% o f t he -43% decrease i n i n t e n s i t y r e s u l t i n g from the add i t ion of aggregates t o the AAM-1 asphal t may be a t t r i b u t e d t o ana ly t i ca l errors.
When both sets o f mast ics were exposed t o room cond i t ions a s i g n i f i c a n t decrease i n f luorescence i n t e n s i t y was observed. from AAA-1 (Exposed 64 days) l o s t s l i g h t l y more i n t e n s i t y than those made w i th the AM-1 (Exposed 101 days) asphal t , i.e., 1.74% vs 1.58%. The d i f fe rences observed i n measured i n t e n s i t y among the d i f f e r e n t mast ics a re no t much
The f i g u r e shows t h a t
I n t e n s i t y and peak wavelength values f o r each are g iven i n Table 2.
The average decrease i n i n t e n s i t y was d i f f e r e n t f o r each asphalt, but With some
It must be mentioned t h a t these two
Fluorometr ic i n t e n s i t y analyses were repeated f o r two o f t h e mast ic sets D i f f e r e n t procedures
The AAA-1 se t
Thus,
On average the mastics made
1363

greater than the v a r i a t i o n found dur ing the repeat analyses which means t h a t the type o f aggregate used i n our mastic preparat ion has much less i n f l uence on changes i n f luorescence proper t ies compared w i t h the type o f asphal t used.
CONCLUSIONS
Fluorescence microphotometry techniques employ o p t i c a l microscopy t o f a c i l i t a t e the d i f f e r e n t i a t i o n o f asphalt binder from aggregate ma te r ia l s thereby e l im ina t i ng the need t o so lvent ex t rac t t he b inder f o r evaluat ion. the cu r ren t research, techniques f o r the uni form measurement o f f luorescence i n t e n s i t y and spectra were developed and appl ied t o the cha rac te r i za t i on o f raw asphalts. Relat ionships were found between f luorescence i n t e n s i t y values and v i s c o s i t y as measured i n o r i g i n a l and laboratory-aged asphalts. As v i s c o s i t y increases, i n t e n s i t y decreases, a re la t i onsh ip thought t o be due t o the dependence o f both these proper t ies upon ox ida t i on and/or molecular s t ruc tu r ing . mixing of aggregate mater ia ls w i t h asphalt, the magnitude o f the change being inf luenced more by the asphalt b inder used r a t h e r than the aggregate type. Just as observed f o r raw asphalts, t he f luorescence i n t e n s i t y o f asphal t binders i n contact w i t h d i f f e r e n t aggregate mater ia ls continues t o decrease w i t h curing/aging time. f luorometr ic measurement o f asphalt i n t e n s i t y has p o t e n t i a l f o r use in monitoring asphal t ox ida t i on during manufacturing and p l a n t mixing, pavement cur ing and as a technique t o monitor the de te r io ra t i on o f asphal t pavements tha t are i n service.
ACKNOWLEDGEMENTS
I n
Fluorescence i n t e n s i t y a lso decreases s i g n i f i c a n t l y upon the
Results o f t h i s i nves t i ga t i on demonstrate t h a t
The authors are pleased t o acknowledge the support o f t he S t ra teg i c Highway Research Program, under contract No. SHRP-AIIR-04.
REFERENCES
1. Welborn, J.Y., National Cooperative Highway Research Program, Synthesis, 59, Washington, D.C., 34 pp. 1979.
2. Petersen, J.C., Proc. 63rd Annual Meeting o f t he Transpor tat ion Research Board, Washington, D.C., 42 pp., 1984.
3. M i t c h e l l , G.D. and Davis A. , The Fluorescence Character izat ion o f Asphalts, Am. Chem. SOC. Prepr in t , 35 (3) 469 1990.
4. M i t che l l , G.D. and Davis A., The Fluorescence Character izat ion o f Asphalts, Fuel Sc i . Tech. In ternat . , 10 (4-6) 909 1992.
5. Lin, R. and A. Davis, The Chemistry o f Coal Maceral Fluorescence: With Special Reference t o the Humin i te /V i t r i n i t e Group, Spec. Research Report SR-122, Energy and Fuels Research Center, 278 pp. 1988.
6. Ma te r ia l s Reference L ibrary , Section 5, Rev. 11-1-88, Un ive rs i t y o f Texas a t Austin. 19fB. . - - - -
7. M i l l , T. and 0. Tse, Oxidat ion and Photooxidation o f Asphalts, Am. Chem. SOC. P rep r in t , 35 (3) 483 1990.
1364

1365
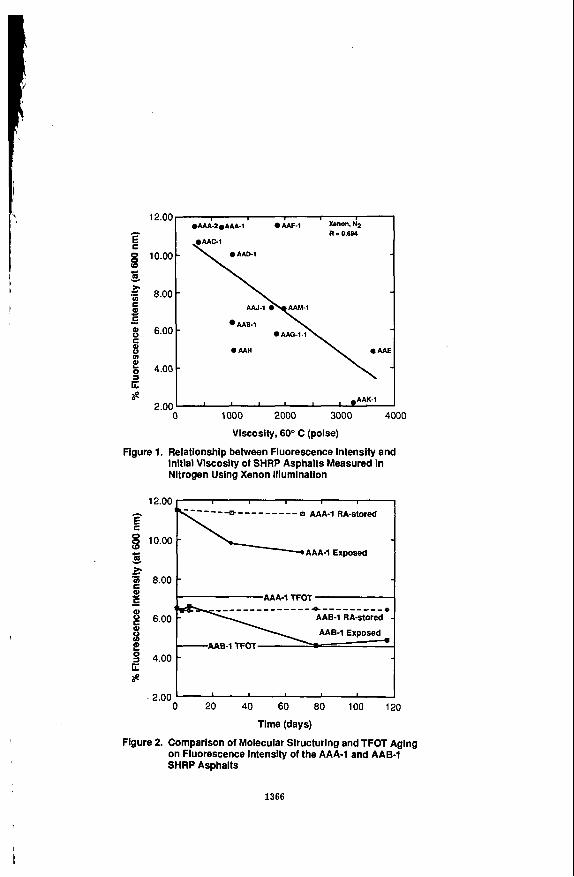
10.00
8.00
6.00
4.00
\ -
-
-
-
I AAE-1
0 AAH
a9 .AAK-l
12.00 I 1
% 4.00 ti s
AAA-1 RA-stored
AAA-1 Exposed c a
-
Time (days)
on Fluorescence Intensity of the AAA-1 and AAB-1 SHRP Asphalts
Figure 2. Comparison of Molecular Structuring and TFOT Aging
1366
I

OXIDATION PATHWAYS FOR ASPHALT
Theodore Mill, Doris S. Tse, Bock Loo. C.C. David Yao and Elizabetta Canavesi* Chemistry Laboratory
SRI International Menlo Park, CA 94025
*Euron Milan, Italy
Keywords: Asphalt, Oxidation, Pathways
INTRODUCTION
Oxidation of asphalt is a major cause of pavement failure owing to hardening of the asphalt binder with accompanying changes in viscosity, separation of components, embrittlement and loss of cohesion and adhesion of the asphalt in the mix. Slow oxidation of asphalt continues during the service life of the roadbed at a rate that appears to be partly determined by the void volume of the roadbed, as well as the properties of the asphalt (1-3).
We have focused on understanding the chemical pathways for slow oxidation of asphalt in order to predict how rapidly an asphalt will oxidize, based on its composition, and to find better ways to inhibit the process under service conditions.
OXIDATION PROCESSES IN ASPHALT
Three different mechanisms proposed for asphalt oxidation include free radical oxidation, photooxidation and molecular oxidation. The frst two processes may involve participation of free radicals while the last does not. The distinction is important in indicating whether phenolic inhibitors will be effective in slowing oxidation. Free radical processes are inhibited by antioxidants, whereas molecular oxidation requires removal of oxygen or the oxygen-reactive component. In very viscous bulk asphalt, added antioxidants may have limited value.
Oxidative aging is characterized by oxygen uptake, formation of sulfoxide and carbonyl bands in the IR spectrum and marked increases in dynamic viscosity and other rheological properties (4). No chemical changes are observed on heating asphalt at 6@130"C in the absence of oxygen, although small amounts of volatiles may be lost at elevated temperature, causing viscosity increases. Above 15OOC non-oxidative reactions may begin to cause chemical changes, even without oxygen.
Nmr-derived average structures for SHRP core asphalts (4), two of which are shown in Figure 1, illustrate the point that oxidative aging in asphalts is not a single chemical process, but a composite of several independent and cancurrent oxidation reactions at several sites in the asphalt structure. These reactions affect families of similar structural units. Therefore, to understand the process at the molecular level, we must rely for guidance on the behavior of model compounds and model probes. Moreover, the interactions of oxidation products with polar groups in asphalt lead to large changes in physical properties and can saongly affect service life.
Studies of the thermal oxidation of asphalt over the past thirty years have almost uniformly concluded that asphalts are not protected from oxidation by addition of most autooxidation inhibitors such as hindered phenols or zinc dithiocarbamates (5.6) and that free radicals play no role in the oxidation process. This conclusion is based on a concept of free radical oxidation as it applies to reactive hydrocarbons where oxidation proceeds by way of long
1367

chains. In asphalt, native phenol inhibitors already are present and asphalt oxidation may still involve free radicals, but not a chain oxidation.
SULFUR CHARACTERIZATION AND OXIDATION
Sulfur oxidation to sulfoxide is easily measured in asphalt by a single band in the IR near IO00 cm-1. Many investigators have used sulfoxide formation as a measure of asphalt aging, but without clear evidence for the role of sulfoxides in the aging process or the relation of this oxidation to other oxidative changes in the asphalt such as carbonyl formation.
SHRP core asphalts have total sulfur contents ranging from I to 8 percent. Thermal oxidation at 50"-1WC converts a fraction of the total sulfur to sulfoxide (>SO) comsponding to conversion of aliphatic sulfide (>S) to >SO. Figure 2 shows that the concentration of >SO formed in asphalts heated in the TFOT correlates well (r2 = 0.95) with the original concentration of S, but accounts for only 20-30 mole percent of it. The >SO formed by c h h c a l oxidation accounts for a higher proportion of S in high S asphalrs.
Sulfur Kedge X-ray Absorption Fine Structure (XAFS) specha were used to characterize sulfur in several different unoxidized and oxidized asphalts (S). Analysis of the XAFS data are summarized in Table (1). Unoxidized samples of asphalts show the presence of only two kinds of sulfur: aliphatic sulfide and thiophenic sulfur in the ratio of 2278 to 0 6 0 ; among unoxidized asphalts, only AAG-I and AAM-I show the presence of any sulfoxide. Comparison of XAFS and ESCA spectra for AAA-I shows good agreement on the ratios of sulfide and thiophenic sulfur.
Thermally oxidized AAA-1. AAG-I and AAK-I show formation of sulfoxide which is derived only from sulfide sulfur. About 32 and 14% of AAA and AAK sulfides respectively disappear on oxidization, pan of which is accounted for by sulfoxide, however in AAG, 51% of sulfide oxidizes to give the expected amount of additional sulfoxide. No other oxidized sulfur spccies was observed.
In a sample of AAG oxidized with t-BuOOH no sufide sulfur remains after oxidation, consistent with the low initial concentration of sulfide sulfur in AAG- of 0.13 M and with the finding that thermal oxidation of AAG-1 gives only 0.15 M sulfoxide. Asphalt M - I has 10 percent sulfide left after chemical oxidation with the difference almost all accounted for by sulfoxide. AAM-I is especially interesting in having the lowest proportion of sulfide of any sample examined by XAFS; thermal oxidation AAM also gives the smallest amount of sulfoxide by IR.
Model compounds dimethylsulfide, di- n-butyl sulfide and dibenzyl sulfide (OMS, NBS, DBS) were used to study thermal oxidation of aliphatic sulfide sulfur in asphalts. Neither DMS, NBS nor DBS oxidized alone with oxygen at 100°C. By implication, >SO formation in asphalts must occur indirectly. DMS and NBS were added to AAA or AAG to probe the pathway for sulfoxide formation from aliphatic sulfides under conditions where direct oxidation is not detectable. A mixture of DMS and A M - I heated for three days at 110°C in air in a sealed tube developed a strong IR band near IO00 cm-l due to DMSO. Similar experiments with 0.05-0.1 M NBS in asphalt gave similar results when analyzed by IR and by GC for Bu~SO. Reoxidized AAG also oxidized NBS. The results clearly demonswates that a peroxy intermediate (probably non sulfur) species which forms with oxygen can be inexcepted by DMS 0: NBS.
One candidate for this oxidation species is peroxide or a hydroperoxide formed from reactive pyrndic NH bonds or benzyl CH bonds.
1368
i

AmmCHx.lOOH + DMS (ApltSR) - Arom(3Hx.10H + DMSO (Aplts(0)R)
However, purified cumene (isopropylbenzene, CuH) was heated in oxygen at 1 10°C for three days with DMS gave no DMSO. This experiment shows that whatever the reactive oxidation centers might be, they are. much more reactive to oxygen than cumene CH bonds.
The effect of oxygen pressure on rates of oxidation of sulfide was examined in AAA-1 thin films by hearing samples in air or oxygen at 100°C for 25 hours and comparing the FTIR band for sulfoxide between 1 100 and 960 cm-1. The oxygen reaction was clearly faster by a factor of at least two and perhaps more, depending on the extent of conversion of alkyl sulfides in AAA-1. Although these data are consistent with rate-limiting oxygen diffusion, we fmd no significant difference between oxidation rates in thin films and lumps.
We have also measured the stability of several asphalt sulfoxides by fmt oxidizing asphalts at loO°C for 20-30 hrs and then heating them under argon in sealed tubes for 5-10 hrs at 165T followed by FIIR analyses. Argon heated samples showed about 10-58 percent less >SO than unheated ones, indicating a modest degree of stability for >SO udder TFOT conditions. The fastest >SO loss rate corresponds to a half life of 6 hrs at 165O, consistent with half lives found by Walling and Bullyky (6) for pyrolysis of long chain aliphatic sulfoxides. Table 2 summarizes >SO decomposition data.
OXYGEN UPTAKE AND BALANCES IN OXIDIZED ASPHALT
Oxygen and Product Balances
We have conducted detailed oxygen uptake and product studies on the four inner core asphalts AAD-I, AAG-I, AAK-I and AAM-1 to evaluate how well the observableproducts including >SO and S O acwunt for the absorbed oxygen. In each case we examined the oxidation of both the tank asphalt and the TFOT asphalt which had been heated in air for 5 hours at 165OC (WRI supplied these samples). We oxidized several samples of these asphalts as thim films at 100°C in air for times as long as 409 hrs. We measured oxygen uptake for each sample and quantitatively measured >SO and S O formation by FTIR to find out how much absorbed oxygen is accounted for by these two classes of products.
Table 3 summarizes the average oxidation product and rate data. The most important qualitative conclusions are that oxygen balances are generally low (2040%). that carbonyl forms in low yield in most asphalts, but not in AAM or AAMT where sulfide is very low, and that there are no significant differences between tank and TFOT samples, again except for AAh4 and AAMT. The ratio of >SO/>co is close to 10 in oxidized K and KT samples, whereas this ratio is closer to 3 or 4 in D and DT. Both asphalts have relatively high total sulfur, but D@T) has a higher proportion of sulfide sulfur than does K (46% vs 36%). The 409 hr AADT experiment was analyzed for CO and C@ formation as well as oxygen uptake, but none could be found under conditions where we estimate we could detect c3 moles. Thus the missing oxygen is still largely in the asphalt, perhaps as water.
Uncertainty in oxygen uptake and product measurements is 320% in 9, f 10% in >SO formation and possibly as high as f 100% in >co. The high uncertainty in >co stems mainly from our uncertainty as to which model ketone standard to use for calibration of the FI?R spectrum around 1700 cm-I. We chose valerophenone as a standard assuming that any ketones would form at benzylic positions and these would be well modeled by valerophenone. However, oxidation of phenols also leads to ketone formation (as cyclohexadienones) which
1369

probably have very diffmnt IR spectral cross sections from arylphenones such as butymphenone. But, even doubling the carbonyl concentrations still leaves oxygen balances shon of the 2 1 stoichiometry for each @ to form one >SO or >co and one ROH or H20.
Oxidation and Product Rates
Table 3 also shows average rates of oxygen uptake, normalized for time and sample size in micromoles m g l hr-1. The striking feature of these data is the similarity in rates for all of the asphalt samples, with few exceptions. The rates are close to 5 x 10⁻³ micromoles mg-1 hrl for oxygen uptake; hardly a twefold difference in rates among all asphalts studied even though AADT and AAKT have 1.2 M and 0.76 M sullide sulfur compared with AAGT and AAMT with only 0.14 M and 0.065 M sulfide. Again diffusion limited oxidation is one explanation.
DISCUSSION
Sulfur oxidation is widely investigated in asphalts because the IR fingerprint for sulfoxide is so easy to measure, but the details of the process and the kinetics have been confused by several conflicting ideas about the origins of the reaction. The data from this study using XAFS and ESCA spectroscopies clearly shows that only aliphatic sulfide sulfur is oxidized during thermal oxidation or mild chemical oxidation by t-BuOOH, thiophenic sulfur is not significantly affected during these oxidations. This conclusion, first reached by Ruiz et al(7) and by Petersen et al. (8) for a few kinds of asphalts has now been extended semiquantitatively to the SHRP core asphalts and by implication to all other asphalts as well.
It now becomes clearer why >SO-time curves for oxidation of different asphalts are so different and why asphalts with similar total sulfur content, but with different aliphatic:aromatic distributions of sulfur give different >SO yields. In the case of low sulfur asphalts, such as AAG or AAM, aliphatic sulfide is rapidly exhausted and formation of >SO almost stops after 30 hrs at 1WC. High aliphatic sulfide sulfur asphalts such as AAA or AAD continue to form much higher proportions of >SO for longer times.
The induced oxidation of DMS and NBS in oxidizing asphalt points to formation of an peroxy intermediate from direct interaction of asphalt with oxygen. Induced oxidation of NBS is found in both AAA and AAG asphalts, indicating that the source of the peroxy intermediate is both independent of the sulfur and in excess of sulfide sulfur, at least in AAA. Oxygen effects on rates of formation of >SO also are in qualitative agreement with this hypothesis.
Rates and products in oxidation of core asphalts points to oxygen imbalances in terms of the >SO and >coproducts; in some cases the deficits are large. Rates of oxidation show a sbikhg similarity among the four core asphalts even though they differ by twenty-fold in sulfide content and almost as much in vanadium and other metal ion contents. Oxidation rates do not appear to be controlled by these components, but by other components such as phenols or dihydroaromatic groups, the identity of which are currently under investigation. Other features of the rate and product studies also fit well with the overall concept. Thus we see that AAM or AAMT oxidize rapidly to form >SO but the oxidation continues after >SO production stops due to exhaustion of the aliphatic sulfide to form much more carbonyl. In that sense sulfide sulfur acts as internal redox inhibitor to limit >co formation from the pemxy intermediate.
Figure 3 shows a schematic representation of the oxidation process. In this scheme, the fmt step forms peroxy intermediate which then can oxidize either sulfur and form >SO and an alcohol, or in the absence of sulfide sulfur, the intermediate may form carbonyl by one of several Paths. Alcohols are difficult to detect and might account for part of the missing oxygen.
1370

ACKNOWLEDGMENT
This work was supported under a subcontract from Western Research Institute as prime contractor on pmject A002 to SHRp>
REFERENCES
1.
2.
3.
4.
5.
6.
7.
8.
9.
Welborn, J. Y. 1984. Physical Properties as Related to Asphalt Durability: State of the Art. Trans. Res. Record 999: 31-37.
Hveem, F. N., Zube, E., and Skob, I. ASTM Spec. Tech. Pub. No. 277 (1959(.
Rostler, F. S. and White, R. M. ASTM Spec. Tech. Pub. No. 277 (1959).
Jennings, W. 1992. Nmr Structure Determinations of SHRP Core Asphalts. MS in preparation.
Martin, K. G. 1966. Influence of Stabilizers on Bitumen Durability. J. Appl. Chem. 16198-201.
Martin, K. G. 1968. Laboratory Evaluation of Antioxidants for Bitumen. Fourth Conf. A.R. R. B. pp. 1-14.
Huggins, F. E., S. Vaidya. G. Huffman, T. Mill and J. Youtchcff. 1992. Analysis of Sulfur Forms in Asphalt Using Sulfur K-Edge XAFS Spectroscopy. Preprints Div. Fuel Chemisuy 204th Meeting Amer. Chem. Soc., Washington, D.C., 23-29 August.
Walling, C. and J. Bullyky. 1964. Thermal Decomposition of Sulfoxides. J. Org. Chem. 29: 2699-2703.
Ruiz, J. M.; B. M. Carden; L. J. Laura; E.-J. Vincent. 1982. Determination of Sulfur in Asphalt by Selective Oxidation and Photoelectron Specaos~opy for Chemical Analysis. Anal. Chem. 54: 688-691.
10. Petersen, I. C., S. M. Dorrence. M. Nazir, H. Plancher, and F. A. Barbour. 1981. Oxidation of Sulfur Compounds in Petroleum Residues: Reactivity-Srmctural Relationships. Div. Peuol. Chem., 181st Meeting Amer. Chem. Soc., New York, N.Y.
11. Hendry, D. G.; T. Mill; L. Piszkiewicz; J. A. Howard; H. K. Eigenmann. 1974. A Critical Review of H-Atom Transfer in the Liquid Phase. Phys. Chem. Ref. Data. 3: 937-978.
1371

Table 1. Anelyele of Sulfur XAFS end ESCA Spectra of Aephell SamplesJnb
%Sulllde %,SO Sample (M) (%AS)C SLThlophene Sulfoxlde (%AwSO)d % S(H)
- - 7.3(2.3) AAA-1 40[34Ie - 60(66)e
AAA-1 o x d 27[24Ie 13 67 6 -7 7.3
AAB-1 31 - 69 - - 5.6(1.75)
AACl
AAD-1
AAF-1
AAG-1
25 - 75 - - 2.7(0.84)
46(1.2) - 54 - - 8.6(2.7)
28 - 72 - - 3.5(1.1)
33(0.14) - 59 8 - 1.3(0.41)
AAG-I oxid 15 18 60 25 .1h 1.3
AAK-1 36(0.76) - 64 - - 6.6(2.1)
AAK-1 oxidf 31 5 62 7 +2 6.6
AAM-1 17(0.065) - 78 5 - 1.2(0.38)
Asph-X(AAA-1 oxid)9 10 30 63 27 -3 7.3
Asph-Y(AAG-1 oxid)8 0 33 53 17 +23 1.3
%ala from G. P. Huflman et al. (7). kamples from WRI except X and Y from SRI. CChange in sulfide. dDifference between AS and >SO. %SCA spedra taken at SRI. fOxidired by heating a 113-C for
120 h. goxidied with 1-BuOOH in cyclohexane at 25'C.
Table 2. THERMAL CHANGES IN SULFOXIDE AND CARBONYL IN PREOXIDIZED ASPHALTS IN ARGON AT 165O
Aephelte ( S O , M) Tlms, hr % Change >SO 9b Change S O
N B W (0.29 M) 5 -58 - AAD 7 -38 - AAGT (0.1 9 M) 5 -7 +44
AAK (0.37 M) 5 -48 +12
AAK (0.37 M) 10 -54 +7
AAGT (0.19 M) 10 -7 +60
aDissolved in unoxidized AAD.
1372
i

Table 3. OXYGEN UPTAKE AND BALANCES FOR ASPHALTSB
W t Produlu- T h e e Sample u o 2 *SO wC0 %OBb lo3 Oxld Rate,
Sample (hr) (mg) pmols/mg hr
D 114 79 38 13 4.1 23 4.2
DT 409 100 105 37 7 22 2.5
G 30 113 14 13 4.2
GT 140 184 61 34 12 38 2.3
K 24 86 7 13 1.0 100 3.4
KT 140 392 79 141 32 1 08 1.5
M 120 261 205 80 114 47 6.5
MT 120 250 74 76 121 130 2.5
- -
aOxahed in air as thin fihs a! 100°C. boB I oxygen balance - [(>SO + >CO)C?Aq] x 100.
1373

pg OH 4- 40.000
0.05
Selective tor '02
and
AAK-1 (6% S)
40,000
1 .o
0.05
AAG-1 (1% S)
* From P.W. Jennings, Montana State University.
RMa31020A
Figure 1. Oxidizable structures in representative asphalt molecules with relative reactivities shown for ROp radicals (1 1).
1374

y - 8.33B7e-2 + 0.123651 RL2 - 0.874 ,
0 1 2 9
8, M -1PB
-re 2. Correlation of >SO with S in core asphails.
0- or + H20
0 0
Figure 3. Possible pathways for >SO formation.
1375
i

ANALYSIS OF SULFUR FORMS IN ASPHALTS USING SULFUR K-EDGE XAFS SPECTROSCOPY
Frank E. Huggins, Shreeniwas V. Vaidya. G. P. Huffman, University of Kentucky, Lexington, KY 40506;
T. Mill, SRI International, Menlo Park, CA 94205;
and J. Youtcheff, Strategic Highway Research Program, Washington, DC 20006.
Keywords: Asphalt, Sulfur, X-ray Absorption Fine Structure Spectroscopy
ABSTRACT
The sulfur functional groups present in a number of asphalt samples, which varied in total sulfur content from 1.1 wt% to 6.9 wt%, have been investigated by means of sulfur K-edge XAFS spectroscopy. This method, which is based on a least-squares method of analysis of the sulfur XANES spectrum, is capable of quantitatively determining aliphatic sulfur forms, such as sulfides, aromatic sulfur forms, such as thiophenes, and oxidized sulfur forms, such as sulfoxides, sulfones, etc. In the unoxidized asphalt samples examined, oxidized sulfur forms are generally absent, and the principal sulfur form found is thiophenic. However, thiophenic sulfur forms vary from about 54% of the total sulfur to about 78% and there is a weak negative correlation in this trend with total sulfur content. Comparison of sulfur forms in asphalts before and after oxidation treatments shows that only the aliphatic sulfur component oxidizes to sulfoxide.
INTRODUCTION: One of the many studies of asphalts being conducted under the Strategic Highway
Research Program (SHRP) is an investigation of the mechanism of asphalt oxidation to determine those variables that influence oxidative aging. One of the predominant oxidation products found in asphalts is the sulfoxide functional group. Consequently, we are interested in understanding the role that different sulfur forms may play in the oxidation process. In this study, sulfur K- edge X-ray absorption fine structure (XAFS) spectroscopy has been used to characterize the different sulfur forms in asphalts and the changes in these sulfur species on oxidation.
EXPERIMENTAL: Samules and Oxidation Treatments: All of the asphalt samples were obtained from the
SHRP Material Reference Library. Thermal oxidation of the asphalts was conducted at the Western Research Institute. Asphalts were oxidized by the Thin-Film Oven Test followed by additional conditioning for 144 hours at 60'C under 300 psi air in a pressurized oxidation vessel. These two conditioning procedures mimic both short term ageing and the longer term ageing experienced by the pavement in the field.
Chemical oxidation was performed on samples of AAA-1 (Asphalt X) and AAG-1 (Asphalt Y ) by dissolving about 1 g of asphalt in 25 ml of cyclohexane, and adding 5-7 equivalents of t-BuOOH based on the total sulfur concentration in the asphalt. This mixture was stirred for 4-8 hours at room temperature. The samples were then washed three times with 50
1376
I

ml volumes of purified water. dried over sodium sulfate, and stripped free of the solvent. Since . AAG-1 formed an emulsion during the water washing, sodium bisulfite was added to reduce and remove any residual hydroperoxide.
Sulfur K-edge XAFS Soectroscoo~: XAFS spectroscopy at the sulfur K-edge was performed at beam-line X-19A at the National Synchrotron Light Source, Brookhaven National Laboratory. This beam-line is unfocussed and all components are in machine vacuum up to the experimental hutch to maximize the intensity of soft X-rays (2-5 keV) reaching the sample. The monochromator consists of a double channel-cut silicon (1 11) crystal assemblage that can be rotated by means of a precision stepping motor to select a specific range of energies for the spectral scan. Absorption of the X-rays was measured by means of an ion chamber that detects the fluorescent X-rays emitted over a large solid angle in response to the absorption process. For sulfur, absorption of X-rays was measured over the spectral range from 2.4 keV to 2.8 keV; over the X-ray absorption near-edge structure (XANES) region (ca. 2.45 to 2.50 keV), absorption data were collected every 0.08 eV. The ratio of the intensity of the fluorescent X-rays to that of the incident X-rays as a function of X-ray energy constituted the XAFS spectrum. The primary calibration standard employed was elemental sulfur diluted to 5 wt% in a boric acid pellec the major peak maximum at 2.472 keV was defined as the zero energy point for the XANES spectra shown in this report.
The sulfur K-edge XANES spectra of the asphalt samples were obtained from the raw XAFS spectral data in the usual way (1.2). The sulfur XANES spectra were then analyzed by means of a least-squares fitting program and calibration procedure, which is described in detail elsewhere (1.2). Basically, this program fits the sulfur XANES spectra of fossil fuels and related samples as the sum of an arctangent function and a number of lorentzian/gaussian shaped peaks, which represent the "white lines" (Is - 3p electronic transitions) of specific sulfur functional forms. Although this program was primarily designed for analysis of sulfur forms in coals, the same procedure is actually &and more urecise for the analysis of sulfur in asphalts because the complications due to the presence of pyrite in coal (3.4) are avoided. The precision of the determinations is estimated to be fi%.
RESULTS AND DISCUSSION: As indicated in Figure 1 (top), most unoxidiml asphalt samples can be fit with just two
distinct components under the major feature in the XANES spectrum. These two components are interpreted as aliphatic sulfide and thiophene sulfur forms based on peak position systematics (1.5). The small peaks at higher energies represent secondary processes (resonant scattering phenomena) that occur in the same components. For oxidized asphalts (Figure I, bottom), peaks for oxidized sulfur forms, principally sulfoxide, occur near where these secondary peaks are found. The calibration procedure allows for the different contributions in such cases and oxidized sulfur forms can also be estimated from the sulfur XANES spectrum (1.2).
Representative sulfur K-edge XANES specha are shown in Figure 2 for some of the asphalt samples investigated in this study. The spectra of all asphalt samples were fit in similar fashion to those shown in Figure 1 and the derived data on percent sulfur in different functional forms are presented in Table 1. In addition, the third derivative spectra were also examined (not shown) and these data confirmed the presence of just two contributions, aliphatic sulfide and thiophene, to the main spectral peak.
Samples that were subjected to oxidation showed the presence of significant sulfoxide. For those samples that were available in both unoxidized and oxidized states, the difference spectrum obtained by subtracting the sulfur XANES spectrum for the oxidized asphalt from that
1311

for the corresponding unoxidized sample was especially revealing (Figure 3). Such difference spectra invariably showed the presence of a positive peak at about 0.3 - 0.5 eV and a negative peak at about 3.0 - 3.5 eV. These peak positions correspond to those for aliphatic sulfide and sulfoxide sulfur forms, respectively. There was little or no difference between the oxidized and unoxidized spectra in the vicinity of 1.2 - 1.5 eV, where the peak for thiophene sulfur is found. It is clear then from this analysis, that the oxidation procedure converts aliphatic sulfur forms to sulfoxide, but does not significantly affect the thiophenic sulfur forms. It should be noted that whereas approximately 50% of the aliphatic sulfur in sample AAG-1 was converted to sulfoxide, significantly lesser amounts were oxidized in samples AAA-1 and AAK-1 because of their greater initial sulfide contents.
Comparison of the sulfur K-edge XAFS data with sulfur ESCA spectral analysis for AAA- 1 showed reasonably good agreement for the sulfide to thiophene sulfur ratio [6].
XAFS analysis of the sulfur forms in thermally oxidized AAA-1, AAG-1, and AAK-I indicate formation of varying proportions of sulfoxide derived only from sulfide sulfur. About 32 and 14% of AAA-1 and AAK-1 sulfides, respectively, disappear on thermal oxidation, part of which is accounted for by formation of sulfoxide. However in AAG-1, 51% of the sulfide oxidizes to give the expected amount of additional sulfoxide. No other oxidized sulfur species was observed in these samples. ESCA spectra of oxidized asphalt AAA-1 [6] showed that almost 40% of the sulfide sulfur disappeared in 48 hours at 110°C. in reasonable agreement with the XAFS result for AAA-1. Both spectral methods showed significant deficits between sulfoxide formed compared to sulfide oxidized in AAA-I.
The chemically oxidized sample, Asphalt Y (AAG-I), shows a high proportion of sulfate in the XAFS spectrum (Figure 4). This is probably attributable to the use of bisulfite to reduce residual t-BuOOH during clean up.
Information was available on the total sulfur contents of the asphalts and plots were prepared of the XANES derived data on sulfur forms against total sulfur for the unoxidized samples. As indicated in Figure 5 and also in Table 1, these data show that thiophenic sulfur in the asphalts averages approximately 66% of the total sulfur, however, there appears to be a weak negative correlation between % sulfur as thiophene and wt% total sulfur, such that the percentage of sulfur as thiophene varies from a high of 78% in low-sulfur asphalts to about 54% in high- sulfur asphalts. As thiophene is not affected by oxidation, these observations apply regardless of whether the asphalt is oxidized or not.
CONCLUSIONS: A calibrated, least-squares method of analysis of sulfur K-edge XANES spectra has been
used for the direct, non-destructive determination of sulfur species in asphalts. Although specific sulfur compounds are not identified, the technique is valuable for quantitatively determining the distribution of sulfur among various organic sulfur functionalities. In this study of eight asphalt samples, thiophene-like aromatic sulfur forms were found to constitute on average about two- thirds of the sulfur, with the remainder being aliphatic sulfide or oxidized sulfur forms. Samples oxidized by either a thermal or a chemical oxidation treatment showed that the aliphatic sulfur forms were partially oxidized to sulfoxide, and that the thiophenic sulfur forms were unaltered.
Acknowledgements:
Brookhaven National Laboratory, which is supported by the U.S. Department of Energy. The sulfur XAFS spectra were obtained at the National Synchrotron Light Source at
1378
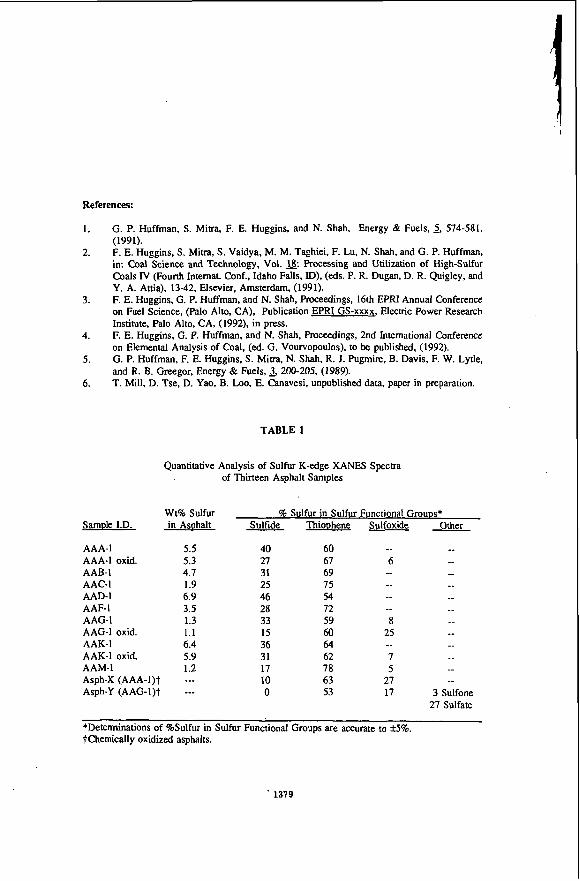
References:
1.
2.
3.
4.
5.
6.
G. P. Huffman, S. Mitra, F. E. Huggins, and N. Shah, Energy & Fuels, 5, 574-581,
F. E, Huggins, S. Mitra, S. Vaidya, M. M. Taghiei, F. Lu, N. Shah, and G. P. Huffman, in: Coal Science and Technology, Vol. B. Processing and Utilization of High-Sulfur Coals IV (Fourth Intemat. Conf., Idaho Falls, ID). ( 4 s . P. R. Dugan, D. R. Quigley, and Y. A. Attia), 13-42, Elsevier, Amsterdam, (1991). F. E. Huggins, G, P. Huffman, and N. Shah, Proceedings, 16th EPRI Annual Conference on Fuel Science, (Palo Alto, CA), Publication EPRI GS-xxxx, Electric Power Research Institute, Palo Alto, CA, (1992). in press. F. E. Huggins, G. P. Huffman, and N. Shah, Proceedings, 2nd International Conference on Elemental Analysis of Coal, (ed. G. Vourvopoulos), to be published, (1992). G. P. Huffman, F. E. Huggins, S. Mitra, N. Shah, R. J. Pugmire, B. Davis, F. W. Lytle, and R. B. Greegor, Energy & Fuels, T. Mill, D. Tse, D. Yao, B. Loo, E. Canavesi, unpublished data, paper in preparation.
(1991).
200-205, (1 989).
TABLE 1
Quantitative Analysis of Sulfur K-edge XANES Spectra of Thirteen Asphalt Samples
Wt% Sulfur % Sulfur in Sulfur Functional Grouus* Sarnule I.D. in Asuhalt Sulfide Thiouhene Sulfoxide Other
AAA-I 5.5 40 60 -- -- AAA-1 oxid. 5.3 27 67 6 _- AAB-I 4.7 31 69 _ _ AAC-I 1.9 25 75 _ _ _- AAD-I 6.9 46 54 _- -_ AAF-1 3.5 28 72 _- _- AAG-1 1.3 33 59 8 AAG-1 oxid. 1.1 15 60 25 -- AAK-I 6.4 36 64 _- _ _ AAK-I oxid. 5.9 31 62 7 _ _ AAM-1 1.2 17 78 5 Asph-X (AAA-l)t --- 10 63 27 _ _ Asph-Y (AAG-l)t --- 0 53 17 3 Sulfone
27 Sulfate
_ _
_ _
_ _
*Determinations of %Sulfur in Sulfur Functional Groups are accurate to f5%. ?Chemically oxidized asphalts.
. 1379

2.4
2
1.6
1.2
0.8
0.4
0
Asphalt AAG-1
I
-8 -4 0 4 8 12 Energy, eV (Sulfur reference)
2.4
2
1.6
1.2
0.8
0.4
0 I
I
-8 -4 0 4 - 8 - 12 . 16 * 20 Energy, eV (Sulfur reference)
Figure 1 : Least-squares fitted sulfur K-edge XANES spectra of asphalt sample AAG-1 before (top) and after (bottom) oxidation.
1380

0 cu
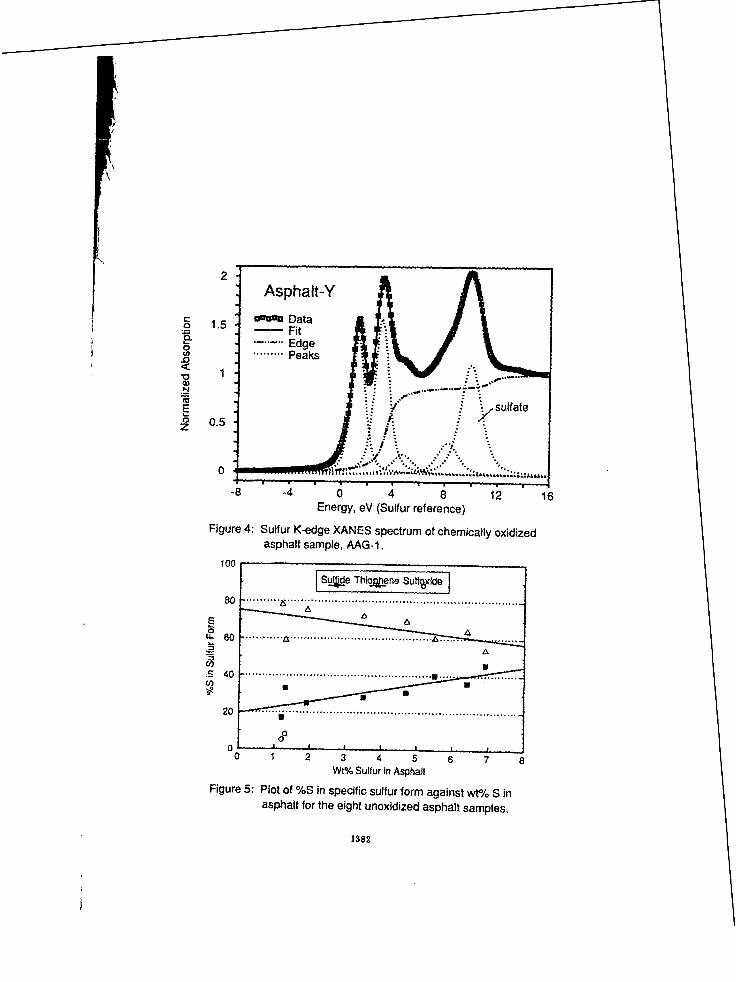
1
0.5
0
Figure 4: Sulfur K-edge XANES spectrum of chemically oxidized asphalt sample, AAG-1.
100
sU&e Thioaene Sulfvide
80 .......... ' ~ ' " " .............................................................
""b.............................
3 UI .h -_ ......................................................... .E 40L,... / ..........._ 8
U B v) 8
20 - .......................... ................................................... 8
O0 0 I I 1 I I I
0 1 2 3 4 5 6 7 8 J
Wt% Sulfur in Asphalt
Figure 5: Plot of %S in specific sulfur form against wt% S in asphalt for the eight unoxidized asphalt samples.
1382

EVOLUTION MECHANISMS OF L.C.O. GAS-OILS DURING STORAGE AND CHEMICAL MODELING OF ASPHALT AGING.
F. Tort and B. Waegell
Laboratoire de Stereochimie associe au CNRS URA 1409 LASCO. Faculte des Sciences St Jerome Case 532, Avenue Escadrille Normandie-Niemen
13 397 Marseille (France)
and
L. Germanaud and C. Bemasconi
Centre de Recherche Elf-Solaize Chemin du Canal B.P. 22
69 360 Saint-Symphorien d’Ozon (France)
Keywords: gas-oils; instability; phenalene.
ABSTRACT In order to control or arrest the instability of L.C.0 gas-oils during storage using
efficient stabilizing additives it is necessary to determine structures and reaction mechanisms involved in these degradation processes. The oxidation of phenalene into phenalenone, alkylindoles and thiophenols play a crucial role in color change and sediment formation. The condensation reaction between phenalenone and 2-methylindole in presence of stoichiometric amount of para-toluenesulfonic acid leads to a complex mixture of compounds. Seven sets of compounds have been isolated by chromatography and spectroscopically identified. A reaction mechanism is proposed and experimentally supported. It is suggested that the phenalane and its derivatives can be partly representative models of the structures involved in asphalt aging.
INTRODUCTION
The evolution of refining processes has lead to an increase in the production of catalytically-cracked distillates. Before, these products particularly the L.C.O.(Light Cycle Oil), were used as diluents of heavy fuels. The decrease of the consumption in heavy fuels and the increase in auto and diesel fuels have lead refiners to introduce limited amounts of L.C.O. in domestic fuels and gas-oils. However these products are often unstable. It is well-known that storage of unstable diesel fuels can result in the color change and formation of organic sediments that have deleterious effects on fuel systems and engine components. An extensive review of this problem of instability in liquid fuels is given by Bans (1). Stabilization of these products can be carried out by hydrotreatment, but this method is too expensive. On the other hand, classical antioxidants are ineffective. In spite of studies made, degradation reaction
1383

mechanisms are still not well-known. In order to control or arrest the instability of L.C.O. gas- oils during storage using efficient stabilizing additives, it is necessary to determine structure and reaction mechanisms involved in these degradation processes. The presence of sulfur compounds, nitrogen heterocycles and condensed ring polycyclic oxidizable hydrocarbon compounds will bring about gas-oils instability which is also influenced by traces metal impurities such as copper. The decisive role of oxidizable sulfur compounds has been determined (2,3). Among the sulfur compounds, the thiophenols, because of their ability to oxidize into sulfonic acids, are the more deleterious (4.5). This observation can be easily rationalized by the fact that condensation reactions between nucleophilic derivatives such as nitrogen heterocycles (6), especially alkylindoles which are electron-rich (7) and electrophilic substrates essentially aromatic in nature, are acid catalyzed. The above mentioned electrophilic aromatic substrates are most likely to result from the presence of oxidizable hydrocarbons in gas-oils (8). Among the condensed ring polycyclic oxidizable hydrocarbons present in the L.C.O. gas-oils, the particular role of phenalene has f i t been emphasized by Pedley et al. (5). Furthermore phenalenyl radical has been identified in L.C.O. by E.S.R. (9). also phenalene seems to be an obvious choice for model studies of the behavior of oxidizable hydrocarbons in L.C.O. gas-oils.
EXPERIMENTAL
The condensation reaction between phenalenone 1 and 2-methylindole 2 in presence of para-toluenesulfonic acid 2 and spectroscopic NMR and IR data of the isolated compounds have previously been well describe ( I O J I ) , as have the two dimensional NMR experiments and hydrogenation reaction to determine the structures of the five tautomers of 2- methylindolylphenalene.
The two isomers 5 and z of bis(2-methylindolyl)phenalene have been synthesized as follows: 2-metliylindolylphenalanone (0.4mM, J2Omg); 2-methylindole 2 (0.4mM. 58mg) (Aldrich Chemical Company) and para-toluenesulfonic acid 2. (0.4mM. 69mg) (Aldrich Cliemical Company) were introduced in a round bottom flask and dissolved in 20ml of methanol. This solution was left under magnetic stirring in the dark under argon for 24 hours. The resulting colored green solution was washed with 2Oml of an aqueous solution of sodium bicarbonate (saturated) and extracted with 3 * 2Oml of ether. A dark precipitate obtained after evapration on a steam bath was chromatographed on flash silica (Merdc silica having pwicle size 0,040- 0,063mm; 230400 mesh ASTM), using a mixture of dichloromethane/pentane : 1/1 as eluent. We obtained lOOmg of 6. The second isomer 1 (40mg) was obtained using the same procedure in mixing 9 (0. ImM, 30mg); 2 (O.lmM, 13mg) and 2. (O.lmM, 17mg) in 15ml of methanol. The NMR and 1R spectroscopy data of these two isomers have been described previously (10).
RESULTS AND DISCUSSION
Our work provide further informations on the origin of coloration and sediment formation in L.C.O. gas-oils. The pioneering work in this area is the one of Pedley et ai. (5.12). who reacted 2-methylindole in methanol with either phenalanone or phenalenone in
1384

presence of paratoluenesulfonic acid. In the first case 2-methylindolylphenaene was isolated, whereas in the second case bis(2-methylind01yl)phenalene was obtained.
In order to understand these degradation reactions which occur in L.C.O. gas-oils during storage, we have studied the condensation reaction between the phenalenone L and 2- methylindole 2 in presence of stoichiometric amount of para-toluenesulfonic acid 3 in methanol. We have shown that this reaction leads to a complex mixture of compounds. Seven sets of compounds have been isolated by chromatography and spectroscopically identified (Fig.1). The mechanism of this reaction has been studied and experimentally supported (10).
Phenalene 4, phenalanone 8 result from a disproportionation reaction of a key intermediate, similar to the one isolated by Murata (13) during the reduction of phenalenone with NaBH4.
The 2-metylindolylphenalene 5 and bis(2-methylindoly1)phenalene 6 and 1 exist under the form of a complex nlixture of tautomers.
The tautomerism between the five structures A,B,C,D,E of 2-methylindolylphenaene 1. has been studied in great details by Tort et al. (13) using two dimensional high field (500 MHz) NMR spectroscopy. T!x relative proportions of each tautomer could be determined using the integration of the H signals of the methylene groups and of the indole methyl group (Fig.2). The bis(2-methylindolyl)phenalene is in fact a mixture of two isomers 6 and 1, each one existing under the form of tautomers. The 'H NMR spectrum of this mixture is too complex to be analyzed. The isomer 6 and 1 could be obtained separately by reacting 1 equivalent of 2- methylindolylphenalanone lo with I equivalent of 2-methylindole 2 and 1 equivalent of 2- iiiethylindolylphenalanone 9 with 1 equivalent of 2-methylindole 2 in presence of para- toluenesulfonic acid in methanol. The tautomerism between the four structures F,G,H,I of 6 and the two structures J.K of 1 have been determined by NMR spectroscopy (Fig.3). These structures have also been confirmed by catalytic hydrogenation reactions on Pt02 of each mixture of tautomers (Fig.2 and Fig.3).
As phenalene 4 oxidizes easily into phenalenone 1 (12,14), it can be assumed that the monoindolylphenalenones fi to 13 and bis(indoly1)phenalenones l4,u have respectively their origin in nionoiudolylphenaleneidolylphenalene 5 and bis(indoly1)phenalenes 6 and 1. However as the reaction has been carried out under argon, the latter oxidation process might have been occurred by disproportionation reaction. We have shown that phenalenone 1. in presence of 2-metliylindole 2 and para-toluenesulfonic acid 3 lead to an unstable intermediate which disproportionates to form 5 , f i . 12 and 13. Compounds 14 and 15 can be formed in the same way by reaction of 11,112 or 13 with 2 in acid medium. Furthermore, 5.5 and 1 are unstable and oxidize easily into the corresponding ketones in presence of air and light. These oxidation reactions seem to take place via the corresponding phenalenyl radicals which have been observed by U.V. spectroscopy of 5.5 and in chloroform solutions.
It is now clear that as soon as phenalenone is present in L.C.O. gas-oils, it will condense in presence of acid with nitrogen heterocycles such as 2-methylindole to form products which are colored, and insoluble in L.C.O. gas-oils, especially when they are in the
1385

I 1
' I
form of ammonium salts of the acid which has played the role of catalyst for the condensation reaction.
Questions which arise from this work are : - what is the origin of phenalene or phenalane correlated structures? - does phenalene proceed from phenalane by dehydrogenation? - is it possible to arrest the phenalene oxidation, using classical anti-oxidants ?
The oxidation of phenalene into phenalenone , which occurs via the phenalenyl radical as we have seen, is likely to proceed by a classical chain reaction mechanism, where the first initiation step yielding the phenalenyl radical would result from the abstraction of one of the allylic-benzylic hydrogen by triplet oxygen which is not thermodynamically favored, hut could be possible in this case with the highly delocalised phenalenyl radical formed. This oxidation reaction could also involve an ene reaction (15) of singlet oxygen on phenalene, especially as the phenalenone is known to be an efficient sensitizer (16) and could lead to the formation of an alkoxy peroxy radical, which as the phenalenyl, can play the role of propagating species. The role of a classical antioxidant such as 2.6-ditertiobutyl 4- methylphenol would be to quench these propagating species by being itself oxidized or dimerized. We have shown that 2.6-ditertiobutyl4-methylphenol as well as a-tocopherol are inefficient in inhibiting the oxidation of phenalene into phenalenone. This means that phenalene oxidizes faster than these. antioxidants.
The origin of phenalene or phenalane is a more difficult question. L.C.O. gas-oils have their origin in fluid catalytic cracking of vacuum distillates of petroleum crudes. During this process, aromatization might occur to generate structures similar to those also present hi asphaltenes. It was therefore of interest to know whether it would he possible to interconven phenalene, phenalenone, phenalane and phenalanone by oxido-reductive processes. We have demonstrated that phenalane might be oxidized under mild conditions using 20% VO(acac)q, oxygen in refluxing methanol. The phenalane can also be dehydrogenated into phenalene with sulfur or DDQ. In addition, we have oxidized phenalenone by ozone into ketal lactone and 1,8- naphthalic anhydride . The latter compound is formed during the aging of asphalt (17).
Accordingly, it does not seem unreasonable to postulate that the phenalenic derivatives could be partly at the origin of the sensitivity of asphaltenes to oxygen leading to asphalt aging. Phenalene type stmctum can indeed be found in asphaltenes models which result from spectroscopic analysis (1 8), although the determination of asphaltene structural composition is presently a matter of controversy (19).
CONCLUSION
The condensation reaction between phenalenone and 2-methylindole in presence of para-toluenesulfonic acid leads to a complex mixture of products which is more complex than it was initially described by Pedley et al. (12). The compounds reported are representative of the structures responsible for the color and sediments observed in unstable L.C.O. gas-oils. The oxidation of phenalene into phenalenone via the phenalenyl radical plays a crucial role in the condensation reaction and in the color and sediment formation. This oxidation reaction is
1386

not inhibited by classical antioxidants. Phenalane and phenalenic structures could be reasonably considered partly representative models of the structures at the origin of asphalt aging.
ACKNOWLEDGMENTS
We would like to thank the Elf Company for their generous financial support especially for a fellowship to Frederic Tort. The results presented here are part of his PhD thesis. We wish to thank also the University of Aix-Marseille 111, the CNRS, the Region PACA and the French Ministly of Research for financial assistance.
LITERATURE CITED
Batts. B.D. and Zuhdan Fathoni, A., Energy and Fuel, 5,2 (1991). Daniel, S.R. and Henemann, F.C., Fuel, 62, 1265 (1983) Loeffler, M.C. andLi, N.C., Fuel, 64, 1047 (1985) Offenhauer, R.D., Brenau, J.A. and Miller, R.C., Ind. Eng. Chem., 49(8), 1265 (1957) Pedley, J.F. and Hiley, R.W., Fuel. 67,469 (1988) Dorbon, M. and Bemasconi, C., Fuel, 68,1067 (1989). Pedley, J.F., Hiley, R.W. and Hancock, R.A., Fuel, 66, 1646 (1987). Bhan, O.K., Tang, S.Y., Brinkman, D.W., Green, J.B. and Carley, B., Fuel, 67,227 (1988). Senglet, N., Faure, D., D e s Courieres, T., Bemasconi, C. and Guilard, R., Fuel, 69,203 (1990).
(10) Ton, F., Waegell, B.. Germanaud, L. and Bemasconi, C., Fuel Science and Technology Liternational, (1991) accepted for publication.
(11) Tort, F., Waegell, B., Zahra, J.P., Bernasconi, C., Germanaud, L. Bessibes, C. and Bounoure, J., submitted for publication.
( 12) Pedley, J.F., Hiley, R.W. and Hancock, R.A., Fuel, 68.27 (1989). (13) Sujikara, Y., Kawanaka, H. and Murata, I., Angew. Chem. Int. Ed. EngL.28, 1268
(1989). (14) Boekelheide, V. and Larabee, C.E., J. h e r . Chem. SOC., 72, 1245 (1950). (15) Pagni, R.M., Bumett, M.N. and Hassaneen, H.M.,Tetrahedron, 38,843 (1982). (16) Oliveros, E.P., Suardi-Murasecco, T., Aninian-Saghafi, Braun, A.M. and Hansen, H.J.,
Helv. Chim. Acta., 74.79 (1991). (17) Petersen, J.C., Barbour, F.A. and Dorrence, S.M., Anal. Chem., 47,107 (1975). (18) Latif, H.A, AI-Ghannam, A.K. and Al-Rawi, J.L., Fuel, 69,519 (1990). (19) Speight, J.G. and Plancher, H., Proceedings Vol.11, International Symposium
"Chemistry of bitumens", Rome (Italy), June 5-8 (1991).
1387

6 .- 1 14 d*24h I GRECNISH PRECIPITATE
I I 6
1 1
Figure I: Compounds isolated after reaction of phenalenone I with 2- methylindol 2 in presence of stoichiometric amount of para- toluenesulfonic acid 2.
Figure 2 Tautomers of 2-methylindolylphenalene 2.
1388

+
I
H'
Figure 3: Tautomers of bis(2-methy1indolyl)phenalene 6 and 7.
1389

AGING OF COLD-MIX ASPHALT PAVEMENTS
J. Shiea*, -, Y. Liu, F. Firouzkouhi, R. Arumugam, P. G . Hatcher
Fuel Science Program, Department of Materials Science and Engineering The Pennsylvania State University, University Park, PA 16802
Keywords: Emulsified asphalt, pavement, aging.
INTRODUCI'ION
One type of cold-mix asphalt is emulsified asphalt which is a mixture of unheated mineral aggregate with a dispersion of asphalt cement in water that contains a small amount of emulsifying agent. Emulsified asphalts offer the advantages of more favorable economics and less polluting operations which are more commonly used for medium and light-Mfic than heavy aaffic applications 1. The focal point of our research on asphalt pavements is the emission of volatile organic compounds (VOC) from different cold-mix formulations*. It appears, however, that the emission (or retention) of volatiles is closely related to the aging of the cold-mix asphalt pavements. The objective of this study is to investigate the changes in the chemical composition of the emulsified asphalt pavements as a result of aging. We have analyzed the samples of pavements aged in-place on the roads from 9 months to 10 years by distillation, FTIR, GC, and GC/MS. Two different formulations of emulsified asphalts used in this study are a proprietary cold-mix (HGP) developed by Heilman Pavement Specialties, Inc, Freeport, PA and Pennsylvania State Depamnent of Transportation standard cold-mix prepared with E-5 emulsion (FB-1).
EXPERIMENTAL
Along with the fresh asphalt samples, two, four, six, and ten year-old HGP pavements and, nine month and eight year-old FB-1 pavements were sampled from local roads exposed to similar climate and traffic load in Beaver and Armstrong counties in Pennsylvania. In laboratory, fresh samples of the two cold-mix asphalts were exposed to air under ambient conditions in a fumehood for fifty days.
Distillation tests were conducted on fresh and aged asphalt samples using a standard apparatus and procedure (AASHTO T 59-86, ASTM D-244-83 a) with some modifications3. A maximum temperature of 700'F was used in the distillation tests, collecting distillates also at lower temperatures (e.g., 3WF and 500OF). The distillates were analyzed in a Perkin-Elmer 8500 gas chromatograph with fused silica capillary column (30 m X 0.25 nun) coated with 50% methyl- and 50% phenylpolysiloxane (Rtx 5 0 Restek Co.) and in a Kratos MS-80 gas chromatograph / mass spectrometer.
FTR analysis of the fresh and aged asphalt samples was carried out using a Digilab FTS-60 Infrared spectrometer. The samples were prepared as thin films on KBr windows from chloroform extracts obtained after soaking the asphalt samples in chlorofonn for 24 h . To obtain the FIlR specha 64 scans were collected and averaged with a resolution of 2 cm-1.
RESULTS AND DISCUSSION
The results from the GC and GC-MS analyses of the distillates from the fresh asphalts showed that the FB-1 distillates are dominated by normal and branched octane (Cg) and nonane (C9) in
* Present Address: Depamnent of Chemisuy, National Sun Yat-Sen University Kaohsiung, Taiwan, 80424
1390

addition to higher alkanes with carbon numbers Clo through C17 and traces of alkylbenzenes and alkylcyclohexanes. The distillates obtained from HGP, on the other hand, consist principally of long chain normal and branched alkanes with nine to sixteen Carbon atoms (@ to cia). In addition, alkylknzenes and alkylnaphthalenes (C7 to C13) as well as alkylcyclohexanes and alkylteualins (C9 to Cis) are present at low concentrations. As summarized in the chromatograms shown in Figure 1, the hydrocarbon additives in FB-1 are much more volatile than those in HGP. considering that the same asphalt cement was used in both HGP and FB- 1.
The high volatility of the hydrocarbons in FB-1 was also demonstrated upon exposing the fresh samples of the two asphalts to ambient conditions in a fume hood for 50 days. After 50 days all the distillable hydrocarbons from FB-1 was lost, while HGP retained a major fraction (30% by volume) of the distillable hydrocarbons. The gas chromatogram of the distillate obtained from the exposed HGP is shown in the chromatogram c in Figure 1. It is interesting to note that both low and high ends of the hydrocarbons are absent in the distillate obtained from this sample. The distillation of the aged pavements heated to a maximum temperature of 7 W F showed that distillate yield first decreased (from 3.5 mL in fresh sample to 1 mL in 4 year-old) and then increased (to 1.3 mL in 6 year-old sample and to 2.7 mL in 10 year-old sample) with the further increase in age. Figure 2 shows the gas chromatograms of the distillates obtained from the fresh mix and 2, 4.6, and 10 year-old HGP pavement samples. No data were obtained for the FB-1 samples since the aged FB-1 pavements did not yield any distillate. Similar to the 5O-day exposed asphalt,the aged HGP samples show different hydrocarbon distributions from that of fresh HGP. It can be seen that as the age of the samples increases, the distribution of dominant hydrocarbons shifts gradually from the higher mass region (C16 to C20 for fresh and 2 year old samples) to lower mass region (C14 to C18 for the samples older than two years). The disnibution of the unresolved complex mixture (UCM), extending from retention time 20 min to 50 min., shows the same @end as that of the identified hydrocarbons in the samples- a decreasing maximum with increasing age. The total intensities of the peaks for selected isoprenoids (C14, C15, C16- isoprenoids, pristane, and phytane) and the corresponding normal alkanes (n-C14, n-C15, n-CI6, n-C19, and n-C20) were calculated by integration. It was found that the relative ratio of the selected isoprenoids to the corresponding normal alkanes increased gradually with the increasing age.
These changes in the chemical composition of hydrocarbons in the asphalt pavements with the increasing age can result from various processes such as evaporation, microbial degradation, oxidation, and thermaUcatalytic cracking and polymerization reactions. Possible effects of these processes are discussed below in relation to the experimental data obtained in this study.
According to a commonly used defmition, volatile organic compounds (VOC) are defined as the chemicals which has 0.002 psi vapor pressure at 0°C. According to this definition, almost all the distillable hydrocarbons found in FB-1 (C8 to 0) can be classified as VOC. It is not surprising to find that these hydrocarbons evaporated after exposure to air for 50 days. The evaporation of light hydrocarbons from the samples also indicates that the hydrocarbons were bound loosely in the asphalt. This is probably the reason why none of the distilled hydrocarbons was observed in the 9 month and 8 year-old FB-1 pavements. The evaporation of the lower molecular weight hydrocarbons (C9 to C12) in HGP also explains the loss of lighter ends in the aged samples, as shown in Figures 1 and 2. The retention of higher molecular weight hydrocarbons (over C13), in HGP asphalts over extended periods of time (up to 10 years) is, however, noteworthy, and indicates that the hydrocarbons are more strongly bonded in HGP and are not readily released to the atmosphere. Evaporation alone does not, however, explain all the changes observed with aging.
It is well known that aerobic or anaerobic microbial degradation plays an important role in petroleum alteration pmcesses and that anaerobic degradation is much slower than aerobic decay4 . A suggested order of vulnerability of hydrocarbons to microbial degradation follows5:
n-alkanes > branched alkanes > low ring cyclic alkanes > aromatics > high ring cyclic alkanes.
1391

A selective depletion of n-alkanes by microbial activity should result in decreasing the ratio of the concentration of n-alkanes to that of the isoprenoids. A gradual decrease in this ratio with age in the pavement samples suggests that anaerobic biodegradation may have contributed to the observed chemical changes. Microbial degradation does not, however, explain why the hydrocarbon distribution shifted from the higher mass (C16 to (20) to the lower mass region (C14 to C16) with the increasing age. Since the low molecular weight hydrocarbons is more readily consumed by the bacteria4, a shift to a higher, not to a lower, mass region should be expected in the distribution of the hydrocarbons with the increasing age.
The results from the 5O-day aging of the asphalt exposed to air combined with those obtained with the aged pavements strongly suggests that thermal/catalytic chemical reactions (oxidation, cracking, and polymerization) played a key role in producing the observed chemical changes. The shift in hydrocarbon distribution to lower mass regions in aged HGP pavements can be explained by cracking and/or polymerization of long paraffin chains. The dramatic change in the composition of distillable hydrocarbons obtained from the 5@day old sample, the complete removal of heavy ends in addition to light ends over a relatively short time period, can be explained by the polymerization of high molecular paraftins (in the presence of oxygen and light). For the aged pavement samples starting as compressed and sealed asphalts with limited access to oxygen and light, polymerization reactions should be expected to proceed much more slowly with thermalkatalytic cracking reactions becoming important over extended periods of time. It can be seen that the major change observed from the fresh to 4 year-old sample is the shift in the hydrocarbon distribution to lower masses, in addition to increasing ratio of isoprenoids to n- alkanes. This mnd, combined with lower distillate yields obtained with 2 and 4 year-old samples, can be explained by polymerization of high molecular weight, but distillable alkanes to produce higher molecular weight nondistillable hydrocarbons. The increasing ratio of isoprenoids to n-alkanes can be attributed to higher reactivity of n-alkanes than that of isoprenoids in polymerization reactions and/or to bacterial degradation processes. The changes in going from 4- year to 10-year old sample are much less pronounced without a major shift in hydrocarbon distribution. The increasing distillate yield in going from the 4 year -old to 6 and 10 year-old pavements suggests that cracking reactions which produced distillable hydrocarbons were important in aging from 4 to 10 years period. The increasing concentrations of aromatic compounds with aging in this period also suggests that thermaVcatalytic cracking reactions had taken place. Possible catalytic effects6.7 of the aggregates used (limestone and blast furnace slag) and temperature increases within the pavement because of oxidation reactions are plausible conditions for thermakatalytic cracking reactions which can occur over extended periods of time under the pavement conditions.
FTIR spectra obtained for the chloroform extracts of the fresh and aged samples FB-1 and HGP are shown in Figures 3. The spectra of the FB-1 fresh mix, 9 month- and 8 year- old pavement samples shown at the top of Figure 3 indicate that oxidation and cracking or aromatization reactions had taken place in the time period from 9 months to 8 years. The spectra of the fresh and 9-month old samples appear to be quite similar. The most notable change in the FIlR specbum of the 8-year old sample is the appearance of a strong band in 1700 cm-1 region which is assigned to carbonyl groups, indicating the incorporation of oxygen into the asphalt pavement similar to the previous data obtained on different hot-mix asphalt samples68.9. Other distinct changes observed in the spectrum of the 8-year old are the stronger aromatic C-H saetch and out- of-plane bending bands at 3050 cm-1 and at 700-900 cm-'. respectively, coupled with a d a m intensity of 2920 cm-l peak relative to that of 2950 cm-l peak. These changes can be attributed to cracking/aromatization reactions which would result in the shortening of paraffinic chains and removal of alkyl side chains from the aromatic rings. Instead of relatively strong absorption at 860 cm-l seen in fresh and 9 month-old samples, assigned to isolated hydrogen, 8 year-old sample shows a more intense peak at 750 cm-1 which is assigned to four neighboring hydrogens on an aromatic ring. The shift from 860 cm-I to 750 cm-I indicates the formation of new aromatic rings and/or the removal of alkyl chains from the existing aromatic rings. The increasing intensity
1392
I

of the aromatic carbon ring stretch band at 1600 cm-l can be taken as a supporting evidence for the formation of new aromatic rings from alkanes.
FlTR spectra of the HGP series shown at the bottom of Figure 3 shows a more gradual change in composition than the FB-1 series, except for the broad bands observed at 3300-3600 and 1100 cm-1 region of the 10 year-old sample. These bands are tentatively assigned to water. Parallel to the behavior of the FB-1 samples, 9 month-old HGP sample has a very similar spectrum to that of the fresh asphalt. The 4 year-old sample shows the appearance of carbonyl band at 1700 an-' which becomes smnger in the IO year-old sample. The relative intensity of this band however is much lower than that observed in the 8 year-old FE3-1 pavement, indicating that the HGP pavement is more resistant to oxidation. Since no oxygenated compounds were observed in the distillates obtained from HGP samples, it can be inferred that only the high molecular weight constituents of the asphalt incorporate oxygen. As different from the trend observed for the FB-1 pavement, aromatic C-H stretch (3050 cm-1) decreases with the decreasing out-of-plane bending at 860 cm-1 as a function of aging. In contrast to FB-I 8 year-old, there is no significant change in the intensity of the 750 cm-1 peak (four neighboring hydrogens on the aromatic rings) with the increasing age. These observations may be explained by the coupling of aromatic rings with other aromatic rings or aliphatic hydrocarbons during the aging of HGP as opposed to dealkylation or formation of new aromatic C-H functionalities in the aged FB-1 pavement. Another difference between the aging behavior of HGP and FB-I is that in the period between 9 months and 10 years aliphatic functionalities in HGP do not show much change in structure.
The differences in the aging behavior of HGP and FE3-1 pavements can be mostly attributed to the different abilities of these pavements in retaining the smaller molecular weight (distillable) hydrocarbons. The presence of these hydrocarbons at high concentrations in HGP pavements is believed to be responsible for their lower susceptibility to oxidation.
CONCLUSIONS
The aging behavior of the pavements from the two different emulsified asphalt mixes FB-1 and HGP are rather different in that FB-1 shows more extensive oxidation and thermal degradation whereas HGP is subjected to subsequent polymerization and cracking reactions during aging. These differences are believed to be due to the differences in the formulation of the two mixes, mainly to the ability of the HGP pavements to retain the distillable hydrocarbons.
ACKNOWLJDGEMENTS
This study has been partially funded by PA Commonwealth's Ben Franklin Partnership Program. All the asphalt samples and partial funding were provided by the Heilman Pavement Specialties, Inc. Helpful discussions with William Heilman and Glenn Heilman of Heilman Pavement Specialties, Inc. are gratefully acknowledged.
REFERENCES 1. "Asphalt Cold Mix Manual," Asphalt Institute Manual Series No: 14, Thud Edition. 2. Eser, S., Shiea, J., Firouzkouhi, F., and Hatcher, P. G., 5th International Pavement
Management Maintenance Exposition and Conference, 4R Conference and Road Show, 1991 Compendium, p. 227, 1991.
3. "A Study of Volatile Organic Compounds in Cold Mix Asphalts," S. Eser and P. G. Hatcher, Year End Report to Ben Franklin Technology Center of Center and N m h m Pennsylvania, Inc., September 1991.
4. Ward, D.M., Atlas, R.M.,Boehm, P., and Calder, J.A., AMBIO 9, 277. 1980. 5. Tissot, B. P. and Welte, D. H., "Petroleum Formation and Occurrence, a New Approach to
Oil and Gas exploration," Spring-Verlag, Amsterdam, 1984. 6. McKay, J. F., Reprints, ACS Div.Petroleum. Chem , Vol. 35,496, 1990.
1393

7 . Petersen, J. C., Barbour, F. A., and Dorrence, S. M., Proceedings of the Association of Asphalt Paving Technologies, Vol. 43,162, 1974.
8. Jemison. H. B., Burr, B. L., Davison. R. R., Bullin, J. A., and Glover, C. J., ACS Div.Petroleum. Chem , Vol. 35,490,1990.
9 . Dorrence, S. M., Barbour, F. A., Petersen, C. J., Anal. Chem. 46,2242, 1974.
2 i= 6
a"
P
Y
1394

6
b 1'4 21 2'8 3'5 4'2 49 516
Retention lime (minute)
Figure 2. Gas chromatograms of the distillates obtained from fresh HGP and 2,4,6. and 10 year-old pavement samples.
1395

n C
I I I I I I I I 4000 3500 3000 2500 2000 1500 1000 500
mavenumbers
HGP 10-year old
A 1.0
I I I I I I I I 4000 3500 3000 2500 2000 1500 1000 500
navenumbers
Figure 3. FlTR specha of fresh and aged FB-1 and HGP pavements exaacted with chloroform.
1396’

Physical Hardening of Paving Grade Asphalts as Related to Compositional Characteristics
H.U. Bahia and D.A. Anderson The Pennsylvania Transportation Institute
Research Office Building University Park, PA 16802
Keywords: Physical hardening, isothermal volume change, T,, wax content, DSC.
Introduction
In a recent investigation of the rheological properties of paving grade asphalts a new hardening phenomenon was observed. The phenomenon, called "physical hardening" by the authors was observed to cause significant isothermal changes in the creep compliance and was shown to relate to the glass transition phenomenon of the asphalts (1). Physical hardening is similar to what is known as physical aging for many amorphous solids such as polymers and plastics. To explain physical hardening, creep compliance, glass transition, and isothermal volume measurements were made on a number of selected asphalts. The isothermal changes in creep compliance were related to volume measurements and a hypothesis was introduced to explain the hardening mechanism. Being a newly discovered phenomenon, there has been speculation regarding the mechanism responsible for the hardening. Crystallization of waxes and internal structuring of highly polar fractions have been offered as possible mechanisms. Data collected by the authors, however, indicates that the hardening is simply a collapse of free volume as the asphalt passes through the glass transition region. The different measurements obtained by the authors clearly proves that physical hardening of paving grade asphalts is no different than physical aging of other amorphous solids that are free of waxes or any crystallizable fractions.
The purpose of this paper is to give a brief review of the physical hardening behavior of selected asphalts and to present creep compliance and volume measurements that support the authors' hypothesis that physical hardening is the result of free volume collapse. Data collected by others for wax contents and melting points of waxes separated from the same asphalts are used to discuss relations between hardening and crystallized fractions. The work reported here is part of the Strategic Highway Research Program (SHRP) project A m A , Bituminous Characterization and Evaluation.
Effect of Hardening on Creep Response
Using the bending beam rheometer (2) beam specimens of asphalt were tested for creep compliance in three point bending after storage for different times at several isothermal temperatures. Testing was done at four temperatures below -5 "C (23 OF) and for isothermal storage times ranging between 30 minutes and four months. The effect of isothermal storage
1397'

was consistently observed to decrease the creep compliance (increased stiffness). An example of the effect for one of the SHRP asphalts is shown in figure 1. The test results indicate that the creep compliance is-affected by the isothermal storage temperature 0, isothermal storage time (Q, and asphalt source (3). The lower the temperature, the higher the hardening level and rate. As a function of 4, the hardening rate was observed to be very rapid at initial 4, decreases rapidly with c, and not reach equilibrium within the time limits of experiment (four months).
Hardening and Resemblance to Temperature Effect
One of the basic characteristics of physical aging of many amorphous materials is that its effect on the viscoelastic properties is similar to the effect of temperature (4). For theFo-rheologically simple materials, the effect of temperature is reflected by a shift in the relaxation spectrum to longer times as the temperature is reduced without changing the shape of the master curve. The same behavior was observed for the asphalt cements that were tested. Figure 2 depicts creep compliance curves for asphalt AAM-1 measured after 30 minutes and 60 days of isothermal storage at -15°C. When plotted on logarithmic scale, the compliance versus loading time curves can be perfectly superimposed by a one dimensional shift along the loading time scale. The simplicity of the hardening effect was confirmed for many different asphalts at all testing temperatures at which physical hardening was observed (3). Therefore the effect of physical hardening on the creep compliance can be defined by a single parameter called the hardening shift factor, 4, in which the shape of the relaxation spectra is unchanged by physical hardening.
Similar to other thermo-rheologically simple materials, asphalts are believed to change their properties with temperature mainly due to changes in free volume which decreases when the temperature is decreased (5,6). The decrease in free volume results in more closely packed molecular arrangement and reduced molecular mobility. During physical hardening, time dependent collapse of free volume is hypothesized to result in volumetric creep that continuously increases the degree of packing, thus producing hardening.
Isothermal Volume Measurements
To verify the free volume collapse hypothesis, isothermal volume measurements were obtained for eight asphalts at selected temperatures. A specially designed dilatometer equipped with precise capillary tubes was used to measure the volume changes for a period of 24 hours. The dilatometers were kept in a liquid bath controlled to within kO.1 "C and volume changes were measured to within O.OOO2 ml. Figure 3 is an example of the measurements for three of the asphalts at the temperature of -15°C. Curves shown in the figure represent best fit curves for three independent replicates per asphalt. Using the isothermal-isobaric volume measurements, the reduction in volume relative to an initial volume (initial equals 30 minutes after quenching) were correlated to the hardening shift factors,,&, obtained from the creep compliance measurements. Isothermal ages of 2, 6, and 24 houn were used and the correlations were very high (R2=92%) as shown in figure 4 for all asphalts. Each asphalt shows its own relation which, if the free volume hypothesis is true should have a slope that is equivalent to the thermal coefficient of contraction at sub-T, temperatures (as). The slopes have an average slope of 0.45 log(s)/mm'/g, which can be
1398

converted to an ag of 4.03 lV/T using the average temperature shift function of 0.183 log(s)/"C calculated for these asphalts (3). The value of ag is within the range of values reported by others (7) and measured in this study. The correlation found between the isothermal volume changes and the isothermal hardening shift factor confirms the analogy between temperature and isothermal storage time and gives strong evidence that favors the free volume collapse hypothesis.
T, and the Physical Hardening
Physical aging of amorphous solids is known to be predominant below TI (63). In fact, the results of isothermal volume measurements suggest that physical hardening is essentially a continuation of the glass transition phenomenon. When the asphalt is cooled from high temperature its volume shrinkage, which is mainly a reduction in free volume, reaches equilibrium almost immediately. When the glass transition region is approached, the transport mobility of molecules is reduced and, at some point, results in non-equilibrium volumes. At this point the asphalt is in a metastable state causing the material to continuously shrink isothermally. Asphalts, however, have a wide glass transition region that reflects the complexity of their composition and a multiplicity of transition temperatures.
To investigate the relation of the glass transition phenomenon to physical hardening, dilatometeric glass transition measurements were made for the asphalts using the same dilatometers used in the isothermal measurements but equipped with larger capillary tubes and a well-controlled ramping thermal bath. At the rate of 1 "Clmin, the volume change in a 10 ml specimen was measured in a cooling and heating mode to an accuracy of 0.002 ml over a temperature range of -60 "C to 40 "C. The measurement clearly reflected a wide transition that for some asphalts extend to temperatures well above 0.0"C. Following the concept of free volume, the deviation of measured volume from the hypothetical thermodynamic equilibrium was used as an indicator of free volume that needs to be recovered (or collapsed) during isothermal storage (1). Figure 5 depicts the relation between isothermal hardening shift factors (aJ and the estimated deviation from thermodynamic equilibrium volume line. The correlation shown ( R2=85 %) reinforces the finding that free volume entrapped at the onset of the glass transition region is the cause of the meta-stable state that leads to the time dependent physical hardening.
Crystallizable Fraction (Wax) and Hardening
Being observed at low temperatures, and being completely reversible, has lead several researchers to propose to the authors that physical hardening is related to crystallization of waxes in the asphalts. Using a modified Shell method (SMS-1769) (9) the wax contents of SHRP asphalts were measured for SHRP by researchers of INTEVEP-Venezuela (10). The wax contents and the melting points are listed in table 1 for 16 of SHRP asphalts that have different chemical composition and different low temperature creep compliance properties. Figure 6 was prepared to show the correlation of the wax content and the hardening shift factor at -15°C. The shift factors were obtained for each asphalt by measuring the isothermal shift factor needed to superimpose creep response measured after 30 minutes at -15°C on the creep response after 24 hours at -15°C (see figure 2 for shift explanation).
There is a definitive relation between the wax content determined by the Shell method
1399

and the physical hardening, Rz >70 96. What is surprising, however, is that the melting points of these asphalts are all above 30 "c while the hardening is observed only at temperatures below -5°C.
Hardening Potential and Endothermic Peaks in DSC Thermograms
Differential scanning calorimetry has been used by several asphalt researchers to determine glass and melting transition. In the early 1970's Noel and Corbett (11) compared wax determinations by several traditional methods and indicated that variations as high as 5 fold can be observed when these methods are used for the Same asphalts. The authors stated that " the traditional concept of asphalt wax content is of questionable significance." The authors, however, presented DSC thermograms that show clear endothermic peaks at moderate temperatures. The peaks were typical of crystallite melting transitions and therefore led the authors to conclude that asphalts contain some kind of waxes that are not completely crystalline nor completely amorphous. They called the material crystallized fractions and offered a method for calculating them from DSC thermograms. Recently this concept was used by other researchers in the US and in Europe and relations between the crystallized fractions and physical properties were reported (12).
As part of another SHRP project, DSC measurements were conducted on eight of the asphalts used in this study (13). Very distinct endothermic peaks were observed for several of the asphalts in the temperature region of 0 . K and 90" C, and the enthalpies of these peaks were reported to an accuracy of f 10%. Asphalts showing the most hardening and the most isothermal volume change also showed the largest endothermic peaks, Figure 7. Although the temperatures at which these endothermic peaks occur do not correlate well with the melting points temperatures of the waxes extracted from the corresponding asphalt, the peaks are within the same temperature range as the melting points, 30°C to 90°C. In contrast, physical hardening is observed some 30 "c below the melting point temperatures and becomes more pronounced as the isothermal temperature is decreased (3). Further, the physical hardening is completely destroyed by heating the asphalt to 25T, well below the melting point of the wax.
Discussion
The above results leave no doubt that there is some connection between physical hardening at low-temperatures and the amount of crystallizable or wax fractions in an asphalt. The isothermal volume measurements and the dilatometeric T8 measurements, on the other hand, also suggest that the hardening is caused by the time-dependent collapse of free volume below the glass transition temperature. Further, the creep compliance master curves (not shown here) do not reveal the presence of a crystallizable phase at low temperatures (14). The master curves and the relaxation spectra are smooth and without the shape that would suggest a second low-temperature phase. The only irregularity in the master curve is in the region of the melting point temperatures where a vertical shifi in the data is required to produce smooth master curves (15).
Ignoring the temperatures at which these two phenomena--physical hardening and crystallization--occur, the answer could be that volume change is merely caused by the crystallization. The maximum volume change measured for an isothermal time of 23.5 hours
1400

is 0.0025 ml/g for asphalt AAM-1. Considering the wax content of this asphalt, 4.21 percent, a 6 percent volume change in the wax would be sufficient to account for the 0.0025 ml/g volume change. Other studies indicate that a that wax changes volume by 4 to 10 percent upon crystallization. Therefore, it is plausible that crystallization of wax is the source of the low-temperature volume change. There are. however a number of points that stands against this hypothesis: m, the large difference between the melting points of the waxes and the temperature at which the isothermal volume change is being observed cannot be ignored. If dissolution of wax, and the endothermic peaks are observed at high temperatures, why is the hardening observed at much lower temperatures. a, physical hardening and isothermal volume change continue for very long times (hardening measured after 4 months for some asphalts). It is highly unlikely that crystallization continues for such long times and continues to effect the creep compliance in such significant way.
Third, the effect of physical hardening on the viscoelastic properties is analogous to the effect of temperature reduction of a thermo-rheological simple material. The rheological properties show no evidence of a second phase at the low temperatures but do seem to account for some orientation of the wax molecules in the region of the melting point temperatures.
-, the rheological behavior of all SHRP asphalts is simple in that creep compliance master curves and the relaxation spectra show no sign of crystallization in the temperature region between -35°C and 60°C.
Conclusions
Circumstantial evidence suggests a link between the wax content and low-temperature physical hardening. A closer examination of the evidence suggests that this link is probably not a cause and effect link but that some third factor is the link between the wax content and physical hardening. Interestingly, both the wax content and the degree of physical hardening appear to increase with the molecular weight of the neutral fraction. Could it be that the molecular weight distribution affects both the percent of wax-like molecules present as well as affecting the low-temperature physical hardening? Most likely this is the case. Therefore, although there is a statistical correlation between measured wax content, DSC properties, and physical hardening it is unlikely that there is a cause and effect relationship between these variables. More research is needed to answer this question.
Acknowledgments
The authors gratefully acknowledge the financial support of the Strategic Highway Research Program (SHRP) under contract A-002A. The authors also acknowledge the cooperation of WRI, the main contractor for the project. The paper represents the views of the authors only, and is not necessarily reflective of the National Research Council, the views of SHRP, or SHRP’s sponsors. The results are not necessarily in agreement with the results of other SHRP research activities. They are reported to simulate review and discussion within the research community.
1401

Literature Cited
(1) Bahia, H.U., and Anderson, D.A.," Isothermal Low-Temperature Physical Hardening of Asphalt Binders," Presented at the International Symposium for Chemistry of Bitumens, 5-8 June Rome, Italy, 1991.
(2) Bahia, H.U., Anderson, D.A., and Christensen, D.W., Presented at the AAPT annual meeting, Charleston SC, Feb. 24-26, 1992.
(3) Bahia, H.U., LowTemperature Physical Hardening of Asphalt Cements, Ph.D. dissertation, CE Dept., Penn State, University Park, PA, 1991.
(4) Struik, L.C.E., in W. Brostow and R.D. Corneliussen, Failure of Plastics, Ch. 11, p.209, Hanser Publishers, Munich-Vienna-New York, 1986.
(5) Williams, M.L., Landel, R.F., and Ferry, J.D., J. of ACS, E, 3701 (1955). (6) Feny, J.D., Vficoelastic Properiies of Polymers, 3rd ed., Wiley, New York, N.Y.,
(7) Schmidt, R.J., and Santucci, L.E., Proc. AAPT, x, 61 (1966). (8) McKenna, G.B., "Glass Formation and Glassy Behavior," in C. Booth and C. Price
(9) Krom, C.J., J. Inst. Petrol., %, 239 (1968) (10 SHRP A-001 Technical program director memorandum concerning wax studies
conducted by INTEVEP, Feb. 4 1992, Center for Transportation Research, University of Texas at Austin.
1980.
(ed.), Comprehensive Polymer Science, Vol. 2, Pergamon, Oxford, 31 1 (1988).
(11 Noel, F. and Corbett, L.W., J. Inst. Petrol., s .261 (1970) (12 Brule, B., Planche, J.P., King, G., Claudy, P., and Letoffe, J.M., PREPRINTS, Div.
(13 Harrison, I., Wang, G., and' Hsu, T.C., Final Report, SHRP contract No. SHRP-87-
(14 Anderson, D.A., Christensen, D.W., and Bahia, H.U., AAPT, a, 437, 1991. (15 Strategic Highway Research Program, A-002A, "Binder Characterization and
Evaluation," Quarterly Report, Technical Section, Subtask 1.2.2.d, WRI, Laramie, WY, September (1990).
of Fuel Chem.,ACS, 3, No.3, 330 (1990)
AIIR-05, National Research Council, SHRP, Washington, D.C. 20006.
1402

Asphalt Source
Creep Isothermal Wax Melting Total Temp. of 2nd Compliance at Shift, Content% Point, OC Enthalpy Endothermic -1s oc, 120s log (@ jlg Peak, T
llGPa after (IO) after (10) after (13) after (13)
AAA-1
AAB-1
1403
43.48 0.42 1.62 35.8 0.27 83.5
14.29 0.67 3.85 62.1 9.94 41.9
AAC-1
AAD-1
AAE
7.67 0.93 5.06 65.7 4.00 53.9
35.71 0.57 1.94 50.6 3.48 46.1
20.80 0.32 1.23 42.5
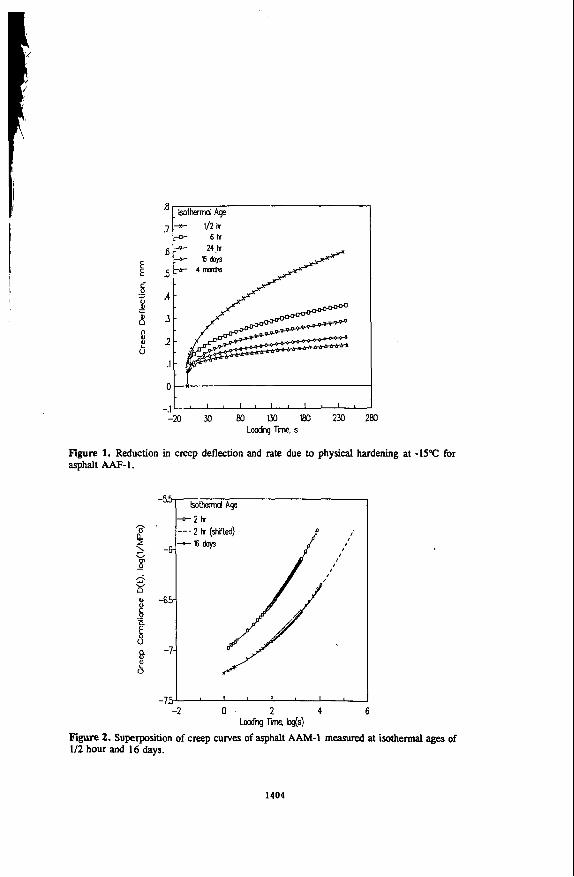
I 0 : :
-2 0 2 4 6 ~oodng rm bg(~)
Figure 2. Superposition of creep curves of asphalt AAM-1 measured at isothermal ages of 112 hour and 16 days.
1404

9 E 6 0 0 6
a > 0 L
0 Q m
f .-
c
0 0
0 S 0
.-
Aspholt S w c e .5 V AM-1 0 AAD-I * AAC-1
-1
-.7
-13 A \ ,
Figure 3. Isothermal Volume measurements for three asphalts at -15°C over a period of 24 hours.
.O ,,.,,,, 0 2 . 4 . 6 . 8 1 1 2
Lsothemd ttfajerr'ng 9ift ati
figure 4. Correlation of volume change and hardening shift at qui-isothermal ages.
1405

I
0 3 6 9 12 15 lE 21 2.4 lsothsmd bderirq %It, ati
Figure 5. Correlation between hardening shift factors and the estimated deviation from equilibrium volume line.
0 2 .4 .6 8 1 k o t h d Shift Factor (3 min to 24 h)
Figure 6. Correlation between hardening shift factor at -15°C and wax content for 16 S H R P asphalts.
1406

-5 & 0 5 Y) Is 20 25 30
Hodeni Potenli pmmter. Eta Fire 7. Correlation between total endothermic enthalpy and hardening potential for 8 core s m asphalts
1407
A NEW INTERPRETATION OF TIME-DEPENDENT PHYSICAL HARDENING IN ASPHALT BASED ON DSC AND OPTICAL THERMOANALYSIS
P.Claudy, J.M.Letoffe, *F.Rondelez, 'L.Germanaud, 'G. King and *J.P. Planche.
Laboratoire de Thermochimie MinBrale, CNRS URA 116, 20 Avenue Albert Einstein, 69621 Villeurbanne Cedex - France
'UniversitB Paris VI, Laboratoire de Physico-Chimie des Surfaces et Interfaces, lnstitut Curie,
11, rue Pierre et Marie Curie, 75231 Paris Cedex 05 - France
"Centre de Recherche Elf, BP22 60360 St Symphorien d'Ozon - France
***Elf Asphalt Laboratory, 400 North 10th Street, P.O. Box 1507, Terre Haute, Indiana - USA
Keywords: DSC, Asphalt Physical Hardening, Thermomicroscopy.
INTRODUCTION
As a part of their work for the Strategic Highway Research Program (SHRP), Anderson and Bahia recently reported an important phenomenon in asphalt cement they defined as "low temperature physical hardening" (1.2.3). This effect seems to be caused by a gradual density change that occurs over time when bitumens are held at low temperatures. The mechanical stiffness of the asphalt increases markedly in response to this decrease in volume. They were able to demonstrate that the changing stiffness can be explained by time-dependent shift factors not unlike those used t o explain time- temperature superposition in conventional rheological measurements. In other recent papers (4,5,6,7), Claudy and coworkers used Differential Scanning Calorimetry (DSC) and two therrnomicroscopy methods (polarized light and phase contrast) to identify certain molecular associations within asphalt defined as "crystallized fractions". The associating species are more prevalent in the saturates fraction of the bitumen, and thus are thought to be highly aliphatic molecules. Even though Crystallized fractions are more evident at low temperatures, they begin to form at temperatures as high as 8OoC, and then continue to precipitate as the asphalt cools. This study was designed to characterize the temperature and time dependent structural changes that occur in the eight SHRP core asphalts. There are two important questions to be answered: "Are the newly observed phases truly crystalline?" and "Does the formation of multiple phases at low temperatures contribute to the low temperature isothermal
1408

hardening of asphalt cement. It is not unreasonable to predict volume shrinkage should occur upon phase separation if the associating molecules occupy less volume than they did in a homogeneous liquid state. If this process occurs at the same temperatures and over the same time scales used in Anderson's experiments, then it should be possible to gain some insight regarding the physico-chemical changes which contribute to physical hardening. The first step is to relate the structuring observed by DSC and thermomicroscopy to the time-dependent changes in the rheological properties of the asphalt cement. Then, the underlying chemical interactions which cause the observed structural changes will be characterized. Since previous DSC studies have demonstrated that the thermal effects are most evident in the saturates fraction, it seems most probable that weak Van der Waals forces are causing aggregation of the aliphatic chains, creating localized regions with a density and refractive index different from that of the bulk asphalt. These aliphatic species may be n-alkanes (waxes), or they may be long side chains on much larger molecules. As was discussed in some detail elsewhere (a), n-alkanes from C-10 to C-20 melt within the temperature range of -30 t o 40 OC, which corresponds to pavement service temperatures. However, adding a double bond anywhere in the alkyl chain will typically reduce the melting temperature by 30 to 90°C. Placing the aliphatic chain in a sterically hindered environment, such as on an aromatic or aliphatic cyclic system, will also reduce its tendency to agglomerate with other molecules. To confirm that aliphatic species are indeed responsible for the enthalpy changes observed by DSC and the localized refractive index differences observed by microscopy, model asphalts have been formed by adding pure n-alkanes (n = 20 to 40) to selected asphalts. Finally, we have attempted to describe how the physico-chemical changes occur. A mathematical analysis of the microscopic images was used to evaluate the polyphasic structure within the cooled asphalt and to identify the mechanism through which the phase changes occur.
EXPERIMENTAL
In order to relate the thermal properties to the observed rheological changes, the eight SHRP core asphalts were analyzed by DSC and two thermomicroscopy techniques as reported in previous papers and summarized below. SHRP asphalt AAO and a waxy Chinese crude residue (#12) that cannot meet current bitumen specifications were also evaluated. The chemical composition of each asphalt was analyzed using IATROSCAN (a thin layer chromatography technique) to separate the nC7 maltenes into aromatic, polar, and saturates fractions (see Table 1 a). The traditional physical properties of these asphalts were determined previously in ref. 7 (see also Table la) .
1409
The Chinese bitumen was evaluated for low temperature physical hardening by conditioning and testing samples at -15OC over a four day period. Anderson and Bahia's protocol was used t o measure the creep response of conditioned samples in the Cannon Bending Beam Rheometer (BBR) (2.3). DSC experiments were carried out using a Mettler TA 2000 B apparatus controlled by a computer. The experimental procedure for the calibration of temperature and enthalpy has been previously described (9). A DSC run typically sweeps a temperature range of -100 to +lOO°C at a heating rate of 5OC/min while the sample is maintained under an argon atmosphere. The amount of crystallized fraction (CF) was determined using a quantitative method previously described (4). Most of the detailed sample conditioning and test procedures used to obtain the DSC results presented herein have also been described elsewhere (7). To study the effect of aliphatic compounds on thermal behavior, up to 7% pure n-alkanes (n = 20 to 40) were added to selected asphalts. The alkanes were supplied by Aldrich at 99+ YO purity. The resulting blends were stirred for 24 hours at 100°C t o guarantee homogeneity. After storing the samples another 24 hours at room temperature, DSC sweeps were run following the conventional procedure. First the samples are cooled at a rate of 10°C/min to -lOO°C, and then thermal effects were monitored while heating the sample to 100°C at 5OC/min. Optical microscopy can provide information regarding the internal structure of materials, including phenomena 'such as crystallization or phase separation. Binders were analyzed using equipment and experimental procedures previously described (6). - Polarized liaht microscooy This technique is most commonly employed to observe anisotropic behavior within substances which exhibit more than one refractive index, e.g. birefringent materials. Small crystallized regions within the sample may appear white or colored under polarized light. Amorphous materials such as polymers or glasses are isotropic and will not affect the light passing through them. - Phase contrast microscoDv fZernike method) This method is primarily applied to increase the contrast of unstained specimens when the refractive index within a region of interest is very close t o that of the surrounding matrix. This device transforms differences in refractive indices into variable intensities of transmitted light. By combining these two methods, one can observe both well-crystallized domains (polarized light) and amorphous fractions (phase contrast) contained in a glassy matrix.
1410

THERMAL BEHAVIOR OF SHRP CORE ASPHALTS
The thermal behavior of each of the eight SHRP core asphalts was characterized using a previously described DSC procedure (7) (Figure 1). Several important features can be observed on each thermogram: - In a narrow temperature range usually falling below OOC, there is a clearly defined increase in heat capacity corresponding to the glass transition within the hydrocarbon matrix. The glass transition temperature (Tg) is assumed to be the midpoint of this temperature range. The corresponding change in heat capacity around Tg is designated DCp. - In the temperature range above OOC, there are two or three peaks which represent changes in enthalpy within the hydrocarbon matrix. These endothermal effects are attributed to a change of state related to the dissolution of fractions that had previously been precipitated upon cooling. The term CF (crystallized fraction) designates the relative amount of material which ultimately participates in this solid-to-liquid phase change over the entire test temperature range. It is calculated by integrating the enthalpy changes measured in a DSC sweep. It is now obvious that not all of these enthalpy changes are due t o formation of purely crystalline materials. Thermal parameters for the tested asphalts are listed in Table la .
Four asphalts (AAG, AAO, AAM, #12) were selected specifically to provide samples with a broad range of dissociating materials. They were annealed at a temperature of -15OC for periods ranging from 1 to 8 days to determine the effect of storage time on the thermal events observable by DSC. Experimental curves for AAG and AAM are shown in Figure 2, and CF results for the four asphalts are listed in Table 2a. Since AAG has a very low CF, there are no drastic changes in either CF or Tg after annealing at - 15OC. On the other hand, both AAO and AAM contained over 4% CF initially, and each exhibits very significant changes in thermal properties after conditioning. During the first 24 hours at -15OC. there is a 2O-4O0h increase in CF accompanied by a 5-1OoC increase in Tg. During the following seven days, the CF remains approximately constant, but the structure within the disassociating phases appears to change markedly. Over time, the low temperature thermal effect splits into two clearly defined peaks, with the peak near O°C appearing to grow at least partially at the expense of the peak located near 3OOC. The glass transition appears to shift until it almost becomes an extension passing below the baseline of this first endothermal peak. Given the experimental precision of f 5%. precipitation seems to be essentially complete within 24 hours. However, the continuing evolution in the DSC profile, particularly in the region near OOC, proves that the orientation of molecules within the dissociated phases changes with time. Eight days or more may be required for the system t o reach equilibrium at -1 5OC. It is hypothesized that shorter or highly substituted alkyl chains ultimately form a structure at thermodynamic equilibrium which
1411

dissolves very easily at low temperatures. However, upon more rapid cooling, these molecules may temporarily precipitate with larger paraffins to form one single peak, rather than the two peaks observed upon extended storage. Further doping experiments with C24 in AAG should resolve some of these questions, but these data are not yet available.
In a previous study the SHRP core asphalts were preconditioned for 24 hours at storage temperatures varied in 5OC increments from -3OOC to 25OC. Results of CF versus storage temperature are shown in table 2b (7). Very little CF was detected in AAG and AAA. Generally, for the other seven asphalts, there was a gradual increase in the amount of CF as the storage temperature decreased from + 25OC down to -15OC. This is fairly consistent with the theory that CF results from the precipitation of aliphatic molecules. As the temperature decreases, additional precipitation would be expected as shorter alkyl chains phase separate. However, as the storage temperature continues to drop from -15 to -3OOC. the CF begins t o decrease, rather than increasing as expected. Molecular motion at these very low temperatures is probably so slow that 24 hours is not sufficient for complete precipitation to occur. It is also conceivable that the mixture can supercool in such a way that some of the available molecules will not separate from solution. Further study is needed here.
TIME-DEPENDENT CHANGES IN PHYSICAL PROPERTIES
As reported previously (7). penetrations of three bitumens with moderate to high amounts of CF were reduced by 15 to 40% after only one day of storage at 5OC. even though all conditioned samples were reheated to 25OC for two hours before testing. The greatest time-dependent hardening was observed in those asphalts with higher amounts of CF as determined by DSC (see Tables l a and l b ) . These results do suggest that most of the observed penetration change occurs within the first day of storage. This is apparently not consistent with DSC observations which show that structure may continue to form for days. This inconsistency can, however, be easily explained by recalling that the pen tins are reheated to 25OC before testing. DSC curves show that much of the structure (probably shorter or highly substituted aliphatic chains) which forms over time will dissolve between Tg and 25OC. Hence, consistency measurements must be made over appropriate time intervals at the storage temperature if physical hardening effects are to be correctly evaluated. It is worth emphasizing the importance of physical hardening by comparing it to age hardening, the oxidation-induced irreversible structural changes that occur during the hot-mix operation or in the pavement. A hardening index can be defined by the ratio of the pen after 1 day storage at -15OC vs original pen. Table 1 b compares this hardening index to traditional pen aging indices. Even when the samples are reheated to 25OC for testing, the
1412

physical hardening index suggests changes in consistency almost on the same order as the aging indices observed after the RTFO test. Unlike penetration or other physical consistency measurements made at lower temperatures, the ring and ball softening point remains relatively stable, regardless of the storage time and temperature prior to its determination (see Table l b ) (71. This result is consistent with DSC observations that enthalpy changes detectable above the softening point are fairly small. More importantly, this high temperature portion of the DSC curve is not significantly changed by storage conditions, probably because only very large aliphatic molecules that associate quickly remain agglomerated at high temperatures. This offers additional proof that the time-dependent hardening due to CF is thermoreversible.
Anderson's bending beam rheometer is an excellent tool for evaluating low temperature physical hardening, because it can provide accurate stiffness measurements at the prescribed conditioning temperature. It is also very easy to store and evaluate many samples at the test temperature without tying up the instrument or sample molds for long periods of time. But most importantly, it is possible to reduce all of the data to a single hardening shift factor, much like the shift factor derived for time-temperature superposition. The Anderson-Bahia protocol (2) was used to monitor the change in creep response of the .highly paraffinic Chinese residue (#12) over 96 hours at -15°C. As shown on Figure 3, the creep compliance decreased significantly with time in storage. The hardening shift factor between 2 and 24 hours of isothermal aging is shown on Table 1 b along with Anderson's data for the eight core asphalts. As expected, the shift factor for the waxy Chinese asphalt is somewhat higher.
RELATING PHYSICO-CHEMICAL CHANGES TO PHYSICAL HARDENING
Anderson reports that the hardening phenomenon, and its corresponding shift factor, is related to a measurable time-dependent volume decrease in the asphalt sample. This is probably a consequence of CF precipitation. The dominant mechanism which explains low temperature physical hardening is the formation of a new structure within the asphalt cement as phase separation occurs. Before trying to develop any rigorous models relating chemical functionality to physical properties, it is worthwhile to review relevant data from two papers presented recently at the Rome Bitumen Chemistry Conference (2) (7). Since AAM shows the greatest physical hardening and highest CF content of the SHRP core asphalts, both Anderson and Claudy focused strongly on the evolution of this bitumen with time and temperature. First, one can visually compare the changes in the hardening shift factor of AAM as determined on the BBR (Figure 4) to the evolving endothermal effects observed by DSC after annealing at various temperatures for 24 hours
1413

I (Figure 5). As the annealing temperature decreases below -1 5"C, there is a gradual evolution to a third distinct endothermal effect centered around OOC. This is consistent with the observation that lower molecular weight alkyl chains are able to precipitate upon annealing at lower temperatures. However it is also possible that a third type of structure forms at these very low temperatures which has a dissolution range lower than the other two thermal effects.
If one wants to establish a relationship between chemical and physical properties, the most obvious approach is to compare the hardening shift factor to the enthalpy changes observed by DSC. In Figure 6, CF is plotted against the hardening shift factor for the SHRP core asphalts. All samples were conditioned at -15OC for 24 hours. This simple approach resulted in a surprisingly good correlation coefficient of 0.79. However, the hardening shift factor is not just affected by the amount of crystallizable material. When conditioning temperatures approach the glass transition range, the mobility of the molecules is greatly reduced, and the phase change occurs more slowly. Hence, some correction for molecular mobility should better explain the rate of hardening. One approach that provided a surprisingly good result for the eight core asphalts was to divide CF by the temperature difference between the conditioning\test temperature (Tc) and the glass transition temperature (Tgl as determined by DSC. When the hardening shift factor was plotted against the new parameter CF/(Tc-Tg) for samples conditioned for 24 hours at - 1 5 O C, the correlation improved to r2 = 0.96 (Figure 7). This suggests that asphalts harden faster when they contain more CF and when their Tg is lower (Le. There is more molecular mobility at the conditioning temperature because the solvent phase is further from its glassy state). This represents a quite distinct difference from Anderson's interpretation, which relates the physical hardening to Tg. What is really important is the amount of crystallized fraction at the time of the measurement. Moreover, physical hardening occurs before Tg. Even though the Chinese residue is an extreme case with a very high CF, it falls almost exactly on the line extrapolated from the SHRP asphalts. However, one must still be careful not to attach too much physical significance to the term CF/ITc-Tg), because the denominator goes to zero and is therefore undefined at Tc=Tg. It would be preferable to relate molecular mobility to the rheology of the total bitumen or the neutral fraction at Tc. In addition, CF represents the entire crystallized fraction, not just the additional molecular reorientation that takes place over time at the conditioning temperature. It was unfortunately not possible to accurately quantify the change in CF with time, a property which would logically reflect rates of hardening better than the total CF. Other time-dependent parameters identified by Anderson include the early hardening rate parameter and the limiting hardening parameter. Correlations between these two parameters vs CF/(Tc-Tgl were 0.93 and 0.74 resp..
1414

Anderson also showed there is a very good correlation between physical hardening and a time dependent decrease in free volume. This, too, is consistent with DSC observations. As aliphatic molecules associate through weak Van der Waals forces, the long chains become immobile with respect t o their immediate neighbors, and hence occupy less free volume. Therefore if the formation of CF is time dependent, there should be a corresponding decrease in volume as the process occurs.
ADDITION OF N-ALKANES
The excellent correlation between DSC and physical hardening immediately raises another question, "What chemical functionalities precipitate out of solution at low temperatures." A partial response was given by Claudy et at. (3) when they showed that only the saturate fractions from a SARA separation exhibit strong endothermal effects corresponding to a dissolution process. None of the other three fractions (aromatics, polar aromatics or asphaltenes) exhibit significant enthalpy changes above Tg, leading t o the assumption that most of the agglomerating molecules come from the saturate fraction. Hence, the next logical step was to dope bitumens with various pure n-alkanes and then analyze the thermal behavior of each mixture. First, six pure n-alkanes (C20, C24, C28, C32, C36, C40) were analyzed by DSC using the reference procedure cited above. The corresponding thermograms are compared on Figure 8. C20 and C40 each have one single peak, whereas the other four alkanes each show two different peaks, one related t o a solid-solid transition and the other to melting. In a second experiment, 3% of each alkane was added to asphalt AAG, which contains virtually no CF. The resulting thermal parameters are listed in Table 3, while Figure 9 shows the differential DSC thermograms of the doped AAG samples for each of the six alkanes. Several observations are notable: - Both the pure n-alkanes and the doped asphalts exhibit increasingly higher melting and dissolution temperatures respectively as the molecular weight of the alkane increases. - The dissolution temperature range of the alkane is much broader when it is dissolved in the bitumen. - When dispersed in the asphalt, the n-alkane begins to dissolve at a temperature which is typically 20-30°C below its pure melting point. This suggests strong interactions between the paraffins and the asphalt matrix. - Upon heating, the total enthalpy required t o dissolve the alkane back into the asphalt is surprisingly close to the enthalpy of melting for the pure n- alkane, - For C20, C32, C36, C40 only one endothermal peak is seen. Observations of the data (Table 3) indicate that Tg is systematically lowered upon addition of paraffins, 18OC for C20, 9OC for C24, 4OC for C28.
1415

In another doping experiment, 1 to 6% of C24 paraffin was added to asphalt AAG. DSC fingerprints are presented on Figure 10, and thermal parameters are included on Table 3. Two peaks are generally observed, but the relative area under each changes dramatically with concentration of paraffin. At the lowest concentration of 1.06%. the thermal effect above 35OC is very broad and no second peak is evident. Above 2% C24, the first peak between 0 and 35OC seems t o reach a saturation point, and most of the enthalpy change resulting from continued addition of paraffin appears in the second peak above 35OC. This represents a dramatic difference in dissolution temperatures, implying there must be formation of two liquids within the solvent phase. Perhaps not coincidentally, virgin asphalts with significant amounts of CF also show two peaks with a minimum at 35OC. Hence one would like to postulate that paraffins cause asphalt to separate into two distinct liquid phases. This might explain the two different sized domains as observed by Phase Contrast (1-3 microns) and Polarized Light (10-15 microns) microscopy. Verney et al reported that there seems to be a natural transition in rheological properties around 35OC. This effect is so important that they propose two different rheological models to fit data above and below this temperature (10). The same general trends were observed when 1 to 5% C24 was added to AAM, the SHRP core asphalt with the highest natural CF. Differential DSC curves, which subtract the pure bitumen curves from doped asphalt thermograms, clearly show two peaks splitting at 35OC (see Figure 11 1. However, since AAM already contains a large amount of CF, the second peak is much more strongly affected by the first percent of added paraffin. Apparently, there is already enough natural paraffin present in AAM to interact with one liquid phase. Therefore, most of the added C24 separates on cooling into a different type of structure, hypothesized to be a more crystalline waxlike solid which dissolves a t higher temperatures. When Claudy et al compared the thermal behavior of asphalt to that of other petroleum fractions (kerosene, diesel oil, crude oil) some curious anomalies were discovered (7). Even though all of these products exhibit aliphatic crystallization at low temperatures, only asphalt displays more than one endothermal peak in the dissolution range, and only asphalt exhibits time- dependent structural changes. The time-dependence might be explained by recognizing that the viscosity within the asphalt matrix at these temperatures is very high, so the mobility of molecules is greatly reduced. The two peaks observed may represent the following phenomenon: - Below Tg, the precipitated paraffins are dispersed within the solid glassy matrix. - Immediately above Tg, the liquid continuous phase (L) still contains organized paraffinic entities (PI. As the solid paraffins begin to dissolve upon heating, the combined liquid (L+P) immediately begins to separate into two different liquid phases, (L' +P) and (L"). This process, which is responsible for the first peak, essentially continues until the solid paraffins are dissolved,
1416
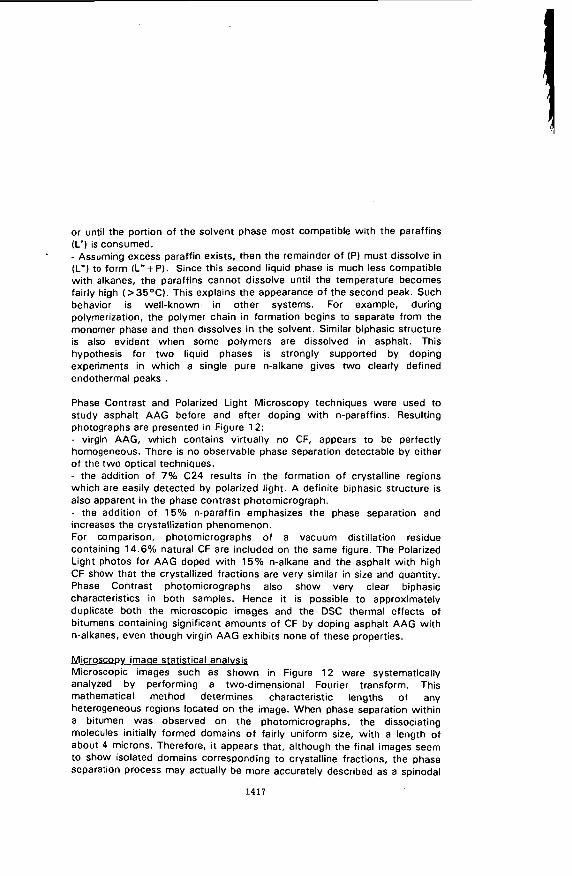
or until the portion of the solvent phase most compatible with the paraffins (L') is consumed. - Assuming excess paraffin exists, then the remainder of (P) must dissolve in (L") to form (L"+P). Since this second liquid phase is much less compatible with alkanes, the paraffins cannot dissolve until the temperature becomes fairly high (>35OC). This explains the appearance of the second peak. Such behavior is well-known. in other systems. For example, during polymerization, the polymer chain in formation begins to separate from the monomer phase and then dissolves in the solvent. Similar biphasic structure is also evident when some polymers are dissolved in asphalt. This hypothesis for t w o liquid phases is strongly supported by doping experiments in which a single pure n-alkane gives two clearly defined endothermal peaks .
Phase Contrast and Polarized Light Microscopy techniques were used to study asphalt AAG before and after doping with n-paraffins. Resulting photographs are presented in Figure 12: - virgin AAG, which contains virtually no CF, appears to be perfectly homogeneous. There is no observable phase separation detectable by either of the two optical techniques. - the addition of 7% C24 results in the formation of crystalline regions which are easily detected by polarized light. A definite biphasic structure is also apparent in the phase contrast photomicrograph. - the addition of 15% n-paraffin emphasizes the phase separation and increases the crystallization phenomenon. For comparison, photomicrographs of a vacuum distillation residue containing 14.6% natural CF are included on the same figure. The Polarized Light photos for AAG doped with 15% n-alkane and the asphalt with high CF show that the crystallized fractions are very similar in size and quantity. Phase Contrast photomicrographs also show very clear biphasic characteristics in both samples. Hence it is possible t o approximately duplicate both the microscopic images and the DSC thermal effects of bitumens containing significant amounts of CF by doping asphalt AAG with n-alkanes, even though virgin AAG exhibits none of these properties.
MicroscoDv imaae statistical analvsis Microscopic images such as shown in Figure 12 were systematically analyzed by performing a two-dimensional Fourier transform. This mathematical method determines characteristic lengths of any heterogeneous regions located on the image. When phase separation within a bitumen was observed on the photomicrographs, the dissociating molecules initially formed domains of fairly uniform size, with a length of about 4 microns. Therefore, it appears that, although the final images seem to show isolated domains corresponding to crystalline fractions, the phase separation process may actually be more accurately described as a spinodal
*
1417

decomposition phenomenon (1 1, 12). There is a periodic modulation of the concentration of paraffin within the asphalt matrix. More experiments are in progress to test this hypothesis which would, if confirmed, provide an important clue to understanding physical hardening at low temperature. The asphalt is no longer homogeneous in density. Instead, it appears to be a complex two phase structure, more akin to a gel, with enhanced visco- elastic properties.
CONCLUSION
There now seems to be no doubt that the molecular agglomerations observed by DSC and thermornicroscopy are at least partially responsible for the time-dependent shrinkage and resulting stiffening observed during low temperature isothermal aging. Ultimately, at any given temperature, the system will reach thermodynamic equilibrium, after which no additional hardening takes place. The amount of stiffening that does occur over time can be related to the number of molecules in the bitumen which coalesce to form microscopic crystalline or amorphous domains within the solvent phase. The rate at which hardening occurs is also affected by molecular mobility within the solvent phase. By correcting the total enthalpy change observed by DSC (CF) by an empirical mobility factor (Tc-Tg) relating the test temperature to Tg, it was possible to predict hardening shift factors with correlation coefficients of 0.96, which is quite remarkable for any chemical-physical relationships in bitumen. Pure n-alkanes have been added to various asphalts and the resulting blends analyzed by DSC, Phase Contrast Microscopy, and Polarized Light Microscopy. It seems evident from these results that molecules containing long aliphatic chains are responsible for time-dependent structural changes. Using microscopy, one observes well-organized crystallized regions of 10-1 5 microns, as well as poorly-organized, amorphous domains 1-3 microns wide. Thus, asphalt microstructure is heterogeneous at low temperatures, with tiny paraffinic crystals and polar-associated molecular chains all dispersed within the solvent matrix. One possible process for the phase separation of a single homogeneous liquid into two liquid phases upon cooling is called spinodal decomposition. It can be found in a wide variety of materials such as glasses, polymers or metals. Spinodal decomposition within asphalt was verified and quantified by applying statistical image analysis techniques to the photomicrographs. Amphoterics, or highly polar molecules, have been shown to play a key role in performance-related asphalt rheology by increasing stiffness within the liquid matrix at high temperatures. Correspondingly, the understanding of aliphatic interactions may prove to be equally enlightening regarding the tendency for pavements to thermally crack in cold environments.
1418

REFERENCES
1. Anderson, D.A. and Christensen, D.W., 65th Annual Meeting of AAPT, Seattle, Wash., March 4-6 (1991).
2. Bahia, H.U., Anderson, D.A., International Symposium on Chemistry of Bitumens. Rome, Italy, Proceedings, 1, 114-147, June 5-8 (1991).
3. Bahia, H.U., Anderson, D.A., and Christensen, D.W., 66th Annual Meeting of AAPT, Charleston, S.Carolina, February 24-26 (1 992).
4. BrOlB, B., Planche J.P., King, G.N., Claudy, P. and Letoffe, J.M., A.C.S. Symposium on Chemistry and Characterization of Asphalts, Washington, D.C., August 26-31 (1 990).
5. BrOlB, B., Planche J.P., King, G.N., Claudy, P. and Letoffe, J.M., Fuel Science and Technology International, 9(1), 71-91, (1991 1.
6. Claudy, P., Letoffe, J.M., King, G.N. and Planche J.P., Fuel Science and Technology International, m4-6). 735-765, ( 1 992).
7. Claudy, P. and Letoffe, J.M., King, G.N. and Planche J.P., International Symposium on Chemistry of Bitumens. Rome, Italy, Proceedings, 2, 530-567, June 5-8 (1991 1.
8. King, G.N., International Symposium on Chemistry of Bitumens, Rome, Italy,Proceedings, 2, 742-769, June 5-8 (1 991 1.
9. Bosselet, F., Thesis No 8, St Etienne, France (1984). 10. Verney, V., Michel, A., Planche, J.P., and BrOlB, B., 25eme Colloque du
Groupe Francais de RhBologie, Session 4, Rhbologie des Bitumes et BBtons Bitumineux, Grenoble, France, November 28-30 ( 1 990).
Verlagsgesellschaft Weinheim, (1 991). 11. Binder, K.. Material Science and Technology, 5, ed. by VCH
12. Cahn, J.W., trans. Metallurgical SOC. of AIME, 242, 166-1 79, (1 968).
1419

I
Table 1 a. Physical and Chemical Properties of Study Asphalts
Asphalt Cements Saturates, wl% Aromatics. w(%
Polar Aromatlcs.wt% nC7 Asphaltenes.wl% Tg. OC DCP. JIW CF.M%
AAA AAB 6 7.2
69.1 64 13.4 15.1 11.5 13.7 -29 -30.9
0.267 0.225 0.4 4.6
AAC AAD 9.7 4.4
67.6 61.9 10.6 18.7 12.1 15
0.235 0.297 4.9 1.6
-26.5 -29.4
AAF 5.9
70.8 14
9.3 -26.1 0.189
3.7
- AAG AAK AAM 4.6 3.6 6.6
70.5 61.5 67.4 21.6 22.9 23.3 3.3 12 2.7
-11.1 -24.8 -25.3 0.337 0.25 0.222
0.2 1.2 5.3
AAO 4.2
70.9 12.5 12.4
-31.5 0.164
4.4
- #12 8.2
50.9 28.5 11.7 -30. 0.15 10.1
-
Penelration,25°C,dmm 155 90 102 137 54 55 65 63 105 119 Ring a Ball, oc 40.1 45.2 45 44 49.2 48 50.1 48.1 45.2 44.9 Viscosily, 60°C.P 640 920 670 880 1360 1450 2550 1690 960 326 Viscoslly.135°C.cSt 263 240 195 292 306 217 500 453 317 194
Salurales. Aromatics. Polar Aromatics determined with IATROSCAN. Tg (Glass Transition Temperature). DCp (Heal Capacity varlation), and CF (crystallized fraction) measured wilh DSC
Fraass Point. OC -20 -16 -16 -18 -9 -5 -8 -17 -18 -17
Values from Claudy et a1.1991.
Table 1 b. Physical Properties of Study Asphalts after Aging
AsphaltCements. AAA AAB AAC AAD AAF AAG AAK AAM AAO #12 Ring 8 Ball'. OC - 48.3 - - 49.5 - 45.7 - - - Penelration Ratiol.% 51.6 62.2 52.9 43.8 53.7 63.6 61.5 66.7 59.6 63
- - - Penelration Ratio2,% - 88.9 - - 85.7 - 69.7 HSF. log(sec) 0.175 0.325 0.456 0.225 0.5 0.106 0.281 0.612 - 0.64 'Ring a Ball aAer 24 hour storage at -15OC. values from Claudy et al. 1991. Raliol: Ratio of 25'C Penetration ratio after and before RTFO Ralio2: Ratio of 25% Penelration after and before 3 day Storage at -15.C HSF: Hardening Shill Factor aHer 24 hour isolhermal age at -15%. measured wilh the Benbing Beam Rheometer.
SHRP asphalt HSF are from Bahia et a1.1991.
1420

Table 2a. Isothermal Age' Influence on Crystallized Fraction and Tg (-15OC)
AC's AAA AAB AAC AAD AAF AAG AAK AAM AAO #12 CF. wt% 0 - - - - 0.2 - 5.3 4.2 9.3 -
- - - 1 - - 0.2 - 7.4 5.5 13 2 - - - - - 0.1 - 7.4 5 13.1 4 - - 0.1 - 7.5 5.2 13.2 8 - - 0.2 - 7.5 5.5 13
- - - -11.1 - -28.6 -25.3 nm" 1 - - - - - -10 - -24.2 -15.3 nm 2 - - - - - -8.9 - -20.5 -15.1 nm 4 - - -6.4 - -23 -21.4 nm 8 - - -6.4 - -18 -17.6 nm
- - - - - - - Tg.'C 0 -
- - - - - -
* Isothermal Age (days) - * ' not measurable - Values from Claudy et a1.1991.
Table 2b. Storage Temperature Influence on Crystallized Fraction (24 hrs)
AC's CF.W% +25OC
+20'C +15'C +1o*c +5*c
O'C -5oc
-10% - 15'C -2ooc -25OC
AAB AAC AAD AAF AAG 4.6 4.9 1.6 3.7 0.2 4.6 5 1.4 3.4 - 3.8 4.5 1 2.9 - 4.2 4.1 1.7 3.2 - 4.3 4.5 1.3 3.9 - 4.6 5.8 1.9 4 - 5.3 5.5 1.9 4 - 5.4 6 1.8 4.3 - 6 6 2.2 4.2 -
5.8 6.3 2.2 4.1 - 5.4 5.1 1.6 3.7 -
AAK AAM AAO #12 1.2 5.3 4.2 9.3 1.2 5.7 4.3 11.5 1.4 5.1 3.1 11.2 1.1 5.2 2.5 11.4 1.4 4.8 3.5 10.4 1.5 6.2 3.9 12 1.2 6.5 5 11.4 1.7 7.3 4.7 12.7 1.2 7.8 5 13 1.1 7 5 12.6 1.1 7.3 4.3 11.1
-30% - 5.6 5.2 1.7 3.6 - 1.3 6.3 4.2 11.9 Values from Ciaudy et a1.1991.
Table 3. Influence of n-Alkane addition on AAG Thermal Behavior
Yo n-Alkane 0 (Neat AAG) 3% C20H42 3% C24H50 3% C28H58 3% C32H66 3% C36H74 3% C40H82 1.66% C24H5O 2.04% C24H50 3.11% C24H50
Tg ("C) -11.4 -29.2 -20.4
-1 5 -1 3
-10.8 -12.5 -15.4 -21.3 -21.3
DCp (JlglK) 0.337 0.134 0.266 0.255 0.295 0.3
0.304 0.244 0.158 0.174
DHd (J/g)' .-
217.5 222.5 252.5 239.8 245.8 220.4 118.5 233.3 236.5
DHsl (Jlg)" -
226.7 230.2 245
254.6 256.6 215.6 230.2 230.2 230.2
5.35% C24HSO -18.5 0.22 238 230.2 'Dissolulion and * 'Solid-Liquid Transition Enthalpy Variations. respectively.
1421
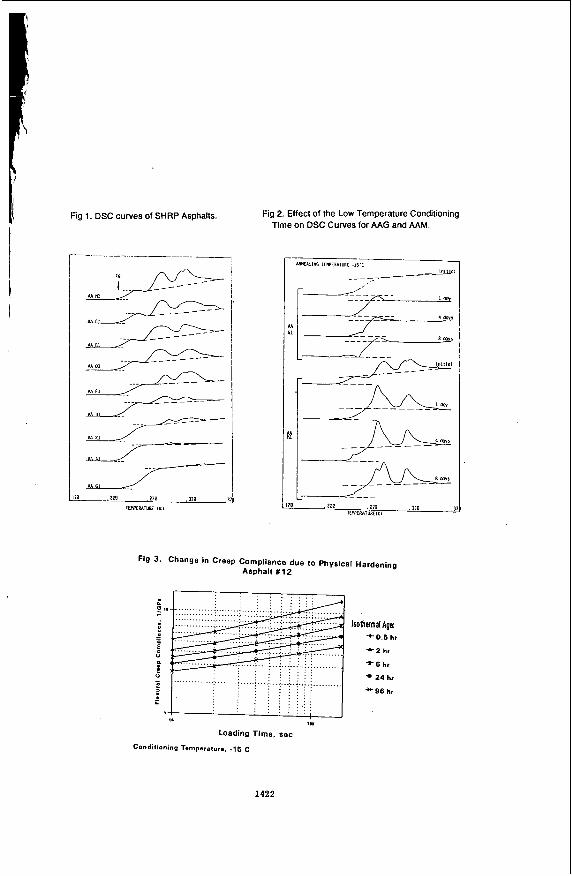
Fig 1. D S C curves of SHRP Asphalts. Fig 2. Effect of the Low Temperature Conditioning Time on D S C Curves for AAG and AAM.
Fig 3. Change in Creep Compliance due to Physical Hardening
Asphalt #12
Isothermal Ags: +0.6 hr
* 2 hr
* 6 hr
*24 hr
"96 hr
loading Time, sec
Conditioning Temperature. -15 c
1422

Fig 4. Physical Hardening Trends of Asphalt AAM at Different Temperatures
-5 20 45 70 95 fzo -.75 ' ' ' " ' ' " ' ' " . ' . ' . " ' '
Isothermal Age (hr)
Reproduced from Anderson et a1.1991, with Dr Anderson's permission
Fig 5. Effect of the Conditioning Temperature on DSC Curves for Asphalt AAM.
-- -N.C
1111 zso 2D 3io .2w .w
1423

Fig 6. AC Harden ing vs Crystal l ized Frac t ion
'1 20.6 -
u' 0.5
I -3 0.4
i 0 . 3 L 1 9 AAK 0
2 0 . 2 A A D .C AAA
AAG X
r
n0 .1
AAF
AAC
0 AAB
4 0 1 1 2 ;
M M
For SHRP AC's:
r2 = 0.79 slope = 0.055 intercept = 0.137
0 0 1 I I I I I I , I I I , i 0 1 2 3 4 5 6 7 8 9 1 0 1 1 12
Crystallized Fraction after 24hrs,-15C,%
SHRPAC tI.r.d.rung Shitl F.c,or f,Dm Andar.on e, .I. lSSl
Fig 7. AC Hardening vs Crystallized Fraction and Tg
0 AC.0 0.3 O M
O M 0 For SHRP AC's:
r2 = 0.958 slope = 0.779 inlercepl = 0.122
f 0.2 C
0-
1424

Fig 8. DSC Curves 01 Pure n-Alkanes.
1
110. DSC Curves lor AAG Doped with n-C24
& 3.11:
L 2.M :
Fig 9. DSC Curves lor AAG Doped with n-Alkanes.
Fig 11. DSC Curves for AAM Doped with n-C24
1425

Fig 12. Influence of n-Alkane Addition on Thermomicroscopy Images for Asphalt AAG.
POLARIZATION T-25OC PHASE CONTRAST
I
~
AAG + 7% C24
I I
AAG + 15%CnHZn+2 1 (20cnc40)
Dislillalion Residue CF=14.6%
1426
100 microns

SYMPOSIUM ON CHEMISTRY OF ASPHALT AND ASPHALT-AGGREGATE MIXES PRESENTED BEFORE THE DIVISION OF FUEL CHEMISTRY, INC.
AMERICAN CHEMISTRY SOCIETY Washington, D.C. Meeting, August 23-28, 1992
Temperature Dependence of Complexation Processes in Asphalt and Relevance to Rheological Temperature Susceptibility
H. Sawatzky, E. Farnand, J. Houde Jr. and I. Clelland Energy, Mines and Resources Canada, Energy Research Laboratories, 555 Booth St., Ottawa, Ontario, Canada KIA OG1, (613) 996-7970
INTRODUCTION
It has been established that asphalts or petroleum distillation residues
are not homogeneous, but micellar based systems (1). The composition of the
micelles is controversial and is considered to involve aggregates of mainly
asphaltenes or complexes of asphaltenes with other high molecular weight
components. The approach described in this paper was developed using the latter
concept with interchanges of components between the micelles and the continuous
phase that are highly temperature dependent. Mechanisms are proposed that
describe how the consistency of asphalt cements changes with varying
temperatures. These mechanisms involve component interchanges between the
micelles and the continuous phase in asphalt.
The viscosity of the complete asphalt system is caused by the major
contributions from both the micellar and continuous phases. The continuous phase
viscosity depends on that of each component, in particular those of high
viscosity. If the micelles were spheres with no interaction then their
contribution to the viscosity of the asphalt would be small. However, it is
known (2) that there must be considerable bridging between the asphaltenic
micelles resulting in various degrees of cross-linked networks. This can be
explained by the fact that the micelles are considered to have polar groups on
their surfaces which associate with polar groups on neighbouringmicellesto form
loose networks. These networks contribute markedly to the viscosity of asphalt
cements.
The micelles are considered to be complexes with the most polar components,
1427

p
J
namely the asphaltenes at their cores. Other less polar components are deposited
on top of the more polar ones with the least polar components located at the
extreme exterior surface of the micelle, as shown in Fig. 1. The continuous
phase contains large amounts of the less polar components and they are major
contributors of viscosity. The following colloidal model is proposed to explain
resistance to changes in viscosities due to temperature changes and rheological
temperature susceptibilities.
The less polar (and possibly higher molecular weight) high viscosity
components can be interchanged between the micellar complexes and the continuous
phase. On cooling, they are gradually withdrawn from the continuous phase due
to complexation with the micelles in order of their degree of polarity.
Therefore, as the cooling proceeds, the components undergoing complexation and
also those that remain in the continuous phase become less and less polar. Thus,
the surface of the micelles becomes less polar and this results in loosening of
the bridging between micelles. Both the removal of the polar components and
loosening of the micellar network result in the resistance to viscosity increases
during cooling. These processes are shown in Fig. 2 . On warming, viscosity
decrease is resisted by the reverse processes.
This model can also be explained with the following equations:
KP l~ol,,,,, - ~po'lmic,,lar 3
K p = f ( T ) 3 )
where [Pol] represents the exchangeable components and Kp is the equilibrium
constant. One way to demonstrate this model would be to show that the degree of
complexation is highly temperature dependent, for example, at the extremes of the
service temperatures experienced by asphalt pavement. The effect of temperature
on precipitation from alkane solutions was chosen to prove that the degree of
1428

complexation is temperature dependant. While precipitation with alkanes will not
include all micelles/complexes, increased complexation should increase the
amounts of precipitate. The procedure that was followed is similar to the
standard method of determining pentane insolubles with two modifications: lower
levels of dilution (solvent to sample ratio) were used; and the precipitates
could not be washed because this would remove much of the complexed materials.
The effect of temperature on tho determination of asphaltenes has been
reported in the literature (3-6) . Andersen and Budi ( 3 ) report a maximum
precipitation in the region of 3OoC. Mitchell and Speight(6) report that the
amount of precipitated asphaltenes in Athabasca bitumen increases with
temperatures up to 7OoC, and this is related to the decrease of the Hildebrand
solubility parameter with temperature. Among these referenced works, very little
attention has been given to the material that precipitates with the asphaltenes.
This material is removed and lost during' the washing step required in the pentane
insoluble determination method. Some of the materials that are removed by washing
are the components that are complexed on the surface of the micelles.
The temperature susceptibility of asphalt cement is a function of the
equilibrium distribution, 4, of components between the micelles and the
continuous phase, as shown in equation 1. Since temperature alters the
equilibrium, it is the change in with temperature that determines the
temperature susceptibility, as shown in equation 3 . The affinity of the
distributing components for the micelles is dependent upon the chemical nature
of the asphalt cement.
EXPERIMENTAL
FSDhalt SamDles
- Esso 85/100 asphalt cement containing 16.10 asphaltenes (heptane
insolubles).
- PetroCanada 8S/lOO asphalt cement containing 17.90 asphaltenes (heptane
1429

insolubles).
Determination of TemDerature su SceDtibilitv
The penetration index was used to measure temperature susceptibility. The
equation used to calculate the penetration index is given as (7):
PI=(20-500A)/(50A+l) 4 )
where A is the slope obtained from the plot of logarithm (base 10) of the
penetration in dmm with temperature in centigrade degrees.
Effect of Precivitation at Various TemDeratures
The initial experiments consisted of thorough dispersion of the asphalt
samples in pentane at room temperature. These mixtures were kept at the desired
temperature overnight, then were filtered quickly through No.1 Whatman filter
paper. The pentane was allowed to evaporate from both the precipitate on the
filter paper and from the filtrate. The precipitate and liquids were then
weighed. In another pilot experiment the mixtures were centrifuged at the
desired temperatures and samples were taken of the supernatant liquids. The
solvent was evaporated from the supernatant liquid and the amount precipitated
was determined by the difference between the asphaltic material in the
centrifuged liquid and the original mixture.
In later experiments, the mixtures were stirred at the desired temperatures
for 6 h and allowed to remain at the desired temperature overnight. Samples were
then taken with a syringe fitted with a 0.45 pm membrane filter to retain
suspended solids. The amounts precipitated were determined by difference with
the original mixtures.
1430

DISCUSSION
PreciDitation at Different TemDeratureS
The results from the initial temperature precipitation and filtration
experiments are shown in Tables 1 and 2. These precipitates were not washed to
retain the complexed components with the asphaltenes at the expense of retaining
solvent and non-complexed asphalt components. The amounts of precipitate
obtained at Z S O C for the Esso 85/100 asphalt at different concentrations did not
significantly differ significantly. However, at O°C the amount of precipitate
for the 20% concentration was almost twice that observed at 25OC. For the 5%
concentration at O°C, there is also a large increase in the amount of
precipitates but considerably less than for the 20% mixture.
The filtrates from these experiments were analyzed by the ASTM D4124 method
and are reported in Table 3 . The filtrates obtained at the lower temperatures
were enriched in saturates but depleted in polar aromatics compared with those
obtained at the higher temperature. This is consistent with the model of micelle
complexation described earlier since the saturates are expected to be the least
complexed with the asphaltene micelles and the polar aromatics are expected to
be among the most strongly complexed.
It is apparent that the reproducibility of the above experiments is poor,
therefore thecentrifugation method was used, the results of which are shown in
Table 4. There is evidence of changes due to temperature but the reproducibility
of these experiments is also inadequate. It is considered that the
reproducibility is limited by difficulties in the transfer of components fromthe
continuous phase to the precipitate and thus the time required to attain
equilibrium is long. Both the duration of the experiment and the absence of
stirring or mixing may have prevented replication of results. Further, the size
of the micelles may vary with temperature and sample, with considerably different
rates of diffusion to and from the surface of the complexes ( 8 ) .
1431

The results of experiments where 1onger.times and stirring were used are
shown in Tables 5 and 6. For the E880 SS/lOO asphalt cement, the amount of
precipitate varied directly with dilution, as would be expected due to greater
addition of alkanes per unit of asphalt cement, and indirectly with temperature.
The reproducibility of this experiment was best at 30% concentration and worst
at 10%. For the PetroCanada 85/100 asphalt, the amount of precipitate varied
directly with dilution but the effect of temperature was greater at higher
asphalt concentrations (lower dilutions).
These results, particularlythose in Tables 5 and 6, demonstrate that the
degree of complexation is highly temperature dependent. This supports the
model’s prediction of higher complexations at lower temperatures, and is the
basie for predicting that changes in viscosity with temperature can be controlled
by controlling the complexation of the micelles. Further study is necessary to
demonstrate this effect, perhaps by adding both polar and non-polar oils and
residues to asphalt cements to relate blending, to control the degree of
complexation, and temperature susceptibility.
CONCLUSIONS
Amodel involving a colloidal system and temperature dependent complexation
processes has been proposed to explain the mechanisms in asphalt that determine
its rheological temperature susceptibilities. It has been shown experimentally
that these temperature dependent complexation processes do occur.
1432

REFERENCES
1. Storm, D.A., Barresi, R.J. and DeCamio, J.D., Colloidal Nature of Vacuum
Residue, PUEL, 70, 779-782 (1991).
2. Altgelt, K.H. and Harle, O . L . , The Effect of Asphaltenes on Asphalt
Viscosity, Ind. Eng. Chem., Prod. Res. Dev., u, 240-246 (1975).
3. Andersen, S . I . and Budi, K.S., Influences of Temperature and Solvent on the
Precipitation of Asphaltenes, Fuel Science and Technology International,
m, 593-615 (1990).
4. Rao, B.M.L. and Serano, J.E., Viscometric Study of Aggregation Interactions
in Heavy Oil, Fuel Science and Technology International, u, 483-500 (1986).
5. Andersen, S.I. and Budi, K . S . , Aggregation of Asphalts as Determined by
Calorimetry, J. Colloid Interface Sci., 1420, 497-502 (1990).
6. Mitchell, D . and Speight, J., The Solubility of Asphaltenes in Hydrocarbon
Solvents, Fuel, 52, 149-152 (1973).
7. Pfeiffer, J.P. and van Doormaal, P.M., J. Inst. Petrol. Technol., 22, 414-
(1936).
8. Cussler, E.L., Diffusion: Mass Transfer in Fluid Systems, Cambridge Press,
Cambridge, England, p.44 (1984).
1433

Concentration, Ut X
Sanple
Precipitate. Ut X
20 20 10 10 5 5
1 2 1 2 1 2
32.8 30.7 37.0 35.7 33.2 33.5
Solubler, Ut X
Total. ut X 100.6
68.3 70.7 64.3 65.7 66.4
101.1 101.4 101.3 101.4 W.6
~~
Total, ut X 102.2 108.1 105.5 105.4
Concentration, Ut X
Sanple
Table 3 - Effect of temperature on filtrate composition (ASTM D4124) Concentration, Ut X 20 20 5 5 1 n
20 20 5 5
1 2 1 2
Tenperature, *C
Saturates. Ut X
Yaphthenic aramtics, ut X 41.3 42.0 45.6 50.8
Polar arcxnatics. ut X 45.5 40.8 37.9 35.2
Precipitates, Ut X
Solubles, Ut X
1434
64.8
59.0 63. 1 43.2
43.2 45.0 62.3
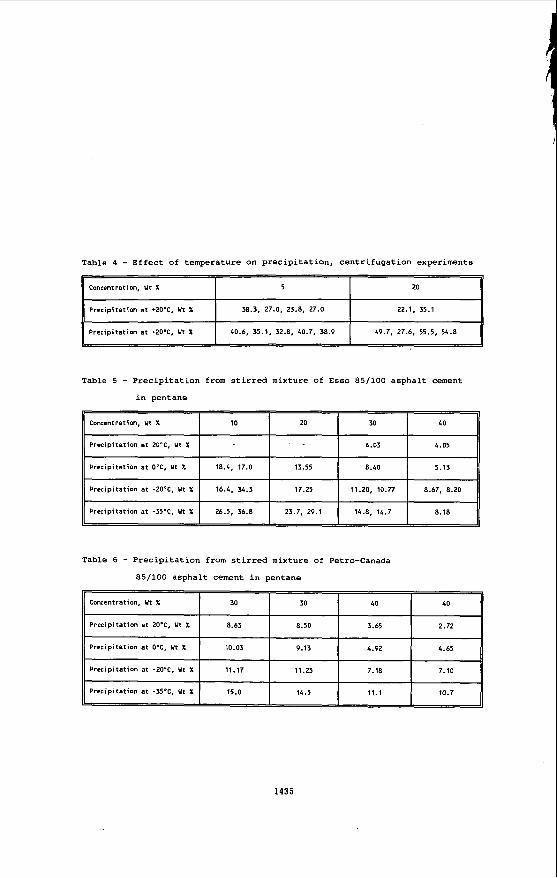
Table 4 - Effect of temperature on prec ipi tat ion, centr i fugat ion experiments
Concentration, Ut X 5 ~
Precipitation a t +20'C, Ut X 38.3. 27.0, 23.8. 27.0 22.1. 35.1
Precipitation a t - 2 O O C . Ut X 40.6, 35.1, 32.8, 40.7. 38.9 49.7. 27.6. 55.5, 54.8
Table 5 - Precipi tat ion from s t i r r e d mixture of E880 85/100 asphalt cement
i n pentane
Concentration, Ut X 10 20 30 40
Precipitation a t ZO'C, ut X 6.03 4.85
Precipitation a t O'C, Ut X 18.4, 17.0 13.55 8.40 5.13
Precipitation a t -20°C. Ut X 16.4. 34.3 17.25 11.20, 10.77 8.67, 8.20
Precipitation a t -35'C. Ut X 26.5, 36.8 23.7. 29.1 14.8, 14.7 8.18
Table 6 - Precipi tat ion from s t i r r e d mixture of Petro-Canada
85/100 asphalt cement i n pentane
Concentration, Ut X 30 30 40 40
Precipitation a t 20°C. Ut X 8.63 8.50 3.65 2.72
Precipitation a t O O C , Ut X 10.03 9.13 4.92 4.65
Precipitation a t -20°C. Ut X 11.17 11.23 7.18 7.10
Precipitation a t -35'C. Ut X 15.0 14.5 11.1 10.7
1435
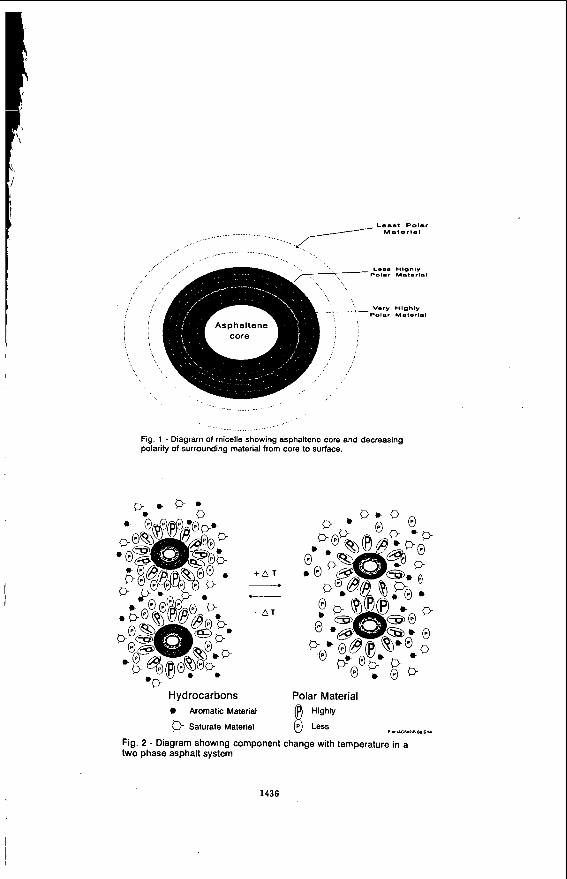
Fig. 1 - Diagram of micelle showing asphaltene core and decreasing polarity of surrounding material from core to surface.
Hydrocarbons W Aromatic Material
0 Saturate Material
Polar Material Highly
I#* WllnnOl ow
Fig. 2 - Diagram showing component change with temperature in a two phase asphalt system
1436

SELF-ASSOCIATION, STRUCTURE, INTERACTION, AND DYNAHICS OF RATAUI ASPHALTENES IN SOLVENTS
E. Y. Sheu, D. A. Storm and M. M. De Tar Texaco R h D Department, Beacon, N. Y. 12508
Keywords: asphaltene, micelles, small angle scattering, permittivity
INTRODUCTION
Asphaltene is a class of petroleum material commonly recognized as the heptane insoluble, but toluene soluble fraction of either the crude oil or
. the vacuum residue [l]. Asphaltene has long been suspected as the key com- ponent hindering refining yields, through micellization [ 2 ] . Although this scenario has been speculated, direct evidence was not available until re- cently [ 3 , 4 ] . Of particular importance is the direct evidence for asphaltene micellization, which correlates asphaltene properties with surfactants.
In this paper, we systematically report findings from our asphaltene study, in organic solvents. First, we measured the surface tension as a function of asphaltene concentration in pyridine to identify the critical micelle concentration. This experiment provided direct evidence of asphaltene self- association. Secondly, we characterized the rheological behavior of the asphaltene micellar solutions, from which hydrodynamic properties were quantified. Thirdly, the structure of the micelles were measured using small angle neutron scattering, along with the interactions between the micelles. Finally, we measured the dielectric relaxation of the asphaltene solutions in toluene, in order to investigate the forces that initiate micellization.
EXPERIMENTAL
Samples
Asphaltenes were derived from Ratawi (Neutral Zone) Vacuum Residue by solvent fractionation. One gram of vacuum residue (VR) was mixed with 40 cm3 of lieptane (HPLC grade), and stirred overnight. Heptane insolubles (C7I or asphaltenes) were extracted using Whatman number 5 filter paper and dried under a stream of nitrogen. Mass balances were performed to ensure complete solvent removal. The asphaltenes were redissolved in appropriate solvents, disscussed below, prior to measurements.
Surface Tension Measurements
Surface tension was measured as a function of asphaltene concentration in pyridine (from 0% to 1% by weight) with a Kruss KlOST Surface Tensiometer, using the Wilhelmy plate method. The details of this instrument and the technique used have been given elsewhere [ 5 ) .
Zero-Shear Viscosity
1437

Viscosity measurements were performed for asphaltene fractions in toluene as a function of concentration for volume fractions from 0.01 and 0.30, at room temperature, on a Brookfield Viscometer. The instrument's working range was from 0-1000 X
Small Angle Neutron Scattering
Pa-s and a 0.1% accuracy of full scale.
The small angle neutron scattering (SANS) measurements were conducted on the time-of-flight small angle diffractometer (SAD) at Argonne National Labora- tory. The scattering vector covered a range from 0.007 to 0.34 A- ' . In this experiment we measured asphaltenes in a series of deuterated toluene/pyridine mixtures for several asphaltene concentrations to study both the structure and polydispersity dependences on concentration and on solvent permittivity. All the measurements were performed at 22 OC.
Dielectric Relaxation Measurements
Dielectric relaxations were measured for asphaltene solutions, using an HP 4192A low frequency (5 Hz to 13 MHz) impedance analyzer. The cell used was an immersion type cell from Rosemont Analytical, consisting of four platinum black coated electrodes, with l m m interplate spacing and a total area of 9 cm2. The HP 4192A impedance analyzer measures the capacitance between the plates from which the dielectric storage E' and the dielectric loss E " (== s'/D, D is the measured quality factor) can be computed according to E ' - C.d/c,, A, where C is the capacitance, d is the electrode spacing, E , , is the calibration constant (- 8.8854 X lo-'* F/m). and A is the total electrode area.
RESULTS AND DISSCUSSION
Surface Tension
Fig. 1 shows the surface tension as a function of asphaltene concentration in pyridine. A breaking point was observed at - 0.025 wtX, signifying that there is an onset of self-association of asphaltenic molecules at this con- centration. This phenomenon is similar to the micellization of surfactant molecules in aqueous solutions. In a previous report we had shown that the self-association of asphaltene molecules in organic solvents was reversible, and more or less followed the micellar thermodynamics [3].
Zero-Shear Viscosity
Fig. 2a shows a typical zero-shear relative viscosity plot for asphaltene in toluene, as a function of asphaltene volume fraction. As expected, the rel- ative viscosity follows the Einstein's argument (linear) in the dilute regime, and gradually deviates from it as concentration increases. This is due to the combination effect of solvation, interparticle interaction, as well as the particle shape. Fig. 2b exhibits the analysis suggested by Pal and Rhodes [6]. In their argument, the zero-shear viscosity should exhibit linearity if the viscosity is plotted as (l/?4"' versus 0, where qr is
1438

the relative viscosity and 4 the volume fraction of asphaltene. The slope of the curve, k, is the solvation constant, representing the effect of solvation, provided the shape effect is negligible. The k value obtained from Fig. 2b was 2.79, different from unity which represents no solvation. Fig. 2c compares the viscosity behavior of asphaltene colloids with a hard sphere model, taking the solvation effect into account. The viscosity for the hard sphere model was developed based on the hopping probability of the particle in a percolated environment (71. Based on this argument. Campbell and Forgacs derived a simple equation for a hard sphere system with a volume fraction higher than the percolation threshold, which is in the neighborhood of 0.16 for most colloidal systems [E]. As one can see from Fig. 2c, for volume fractions up to about 0 . 3 , there is no appreciable difference. This explains why the shape effect can be neglected in Pal and Rhodes analysis (it still shows linearity, although Pal and Rhodes's argument is only applicable for hard sphere systems). The effect of interparticle interaction was analyzed using an equation derived by Grimson and Barker [lo]. They derived the zero-shear viscosity for a (l/rn) potential. The equation reads
- (1+2.54) + ~o(4/~m)[1-(4/4m)1/3~-n
where am is the maximum packing volume fraction (it was estimated to be about 0.64 for asphaltene in toluene [9]). With this equation we found that the interactions between asphaltene colloids can be well described by l/rz potential (see Fig. 2d).
As a summary from our zero-shear viscosity analysis, we found the asphaltene colloids in toluene to be solvated, but behaved rheologically like hard spheres for 4 up to - 0 . 3 , and the interparticle interactions followed a l/rZ potential. In the following, we shall discuss the detailed structure, the polydispersity, and the interparticle interactions obtained from a small angle neutron scattering study.
Small Angle Neutron Scattering
Small angle neutron scattering ( S A N S ) measures the differential cross section per unit volume of the sample, based on the scattering of the nuclei contained in the sample. In our case, the 'scatterers are the solvent (toluene/pyridine) and the asphaltene. Since asphaltene molecules contain nuclei different from toluene/pyridine, the capability in scattering the defined incoming neutrons differs. This scattering contrast allows us to differentiate the suspended asphaltene colloids from the solvent material, in terms of their shapes and the interactions between them. The SANS measurement is usually represented in terms of the scattering intensity I(Q) as a function of the scattering vector Q (- (4rr/X)sin 0 , X is the neutron wavelength and 0 the scattering angle). For colloidal system the I(Q) can often be expressed as (101
I(Q) - Np.<P(Q)>.<S(Q)> where N is the number density of the asphaltene colloids, <P(Q)> is the average pform factor, containing the shape information and the size polydis- persity as well. <S(Q)> is the average structure factor describing the interactions between particles.
1439

Fig. 3a shows I(Q), together with the theoretical curve, assuming the asphaltene to be spheres with a size distribution following the Schultz dis- tribution function, and an (l/r)exp[-(or)] interparticle potential ([I is a constant characterizing the range of the interaction). Apparently, 'the agreement is reasonable. The SANS measurements were performed for a series of concentrations and solvents of various toluene to pyridine volume ratios, to study the effect of solvent permittivity ( e ) . Fig. 3b and Fig. 3c show the effect of solvent permittivity on the particle radius ( R ) , interaction range (i.e., u) and on the particle polydispersity respectively. The par- ticle radius was not sensitive to c . However, u decreased with increasing e , which means that the interaction range becomes longer ranged upon increa- sing c . This suggests that the asphaltene colloids are charged, and the interactions are mainly electrostatic. As c increases, the charge dissocia- tion is enhanced, and results in an increase in the charge screening length (or decrease in 4). As for polydispersity (Fig. 3c), the increasing poly- dispersity, with increasing c , indicating that the solvent quality decreases as a function of E [ll].
Dielectric Relaxation
Fig. 4 gives the dielectric loss e ' * as a function of the frequency for a 20% asphaltene solution in toluene at 60 OC (circles), together with a fitting curve (solid line). This fitting curve was based on the Cole-Cole equation,
c " ( o ) - cm +. A ~ / [ I + (iw,)'-Pi
where o is the frequency in Hz, cm is the dielectric constant at m fre- quency, A E is the difference between c m and the zero-frequency c , T is.the mean dielectric relaxation time, and p is an exponent signifying the stretch of the relaxation, due to the interactions between particles. When fl - 0, the system is a noninteracting ideal system (in this case, the relaxation is called a Dybye relaxation). The fitting quality is not perfect, mainly due to the high polydispersity of the particle size (and may be shape as well). For some cases at lower temperature, a shoulder was exhibited. This is likely due to the formation of a second mode, either resulting from percola- tion, or networking of the suspended particles. The @ values obtained through the Cole-Cole fitting for all temperatures were very different from zero, meaning that there are significant interactions which may interfere the dielectric response. This clearly indicates that the interaction is dipole moment driven, and is electrostatic, confirming the result drawn from SANS measurements.
conclusion
We have systematically studied the physical properties of asphaltene solu- tions, uslng various techniques. The properties we observed can be summar- ized as follows: (1) asphaltenes are similar to surface active agents, since there exists a threshold concentration (for a give organic solvent), above which the molecules self -associate into "micelles", (2) the aggregates are loosely packed (highly solvated), but with rheological behavior very similar to a hard sphere system until the volume fraction exceeds 0.3, (3) the interactions derived from the solution viscosity follows a l/rz potential, ( 4 ) the aggregates are charged and have significant size polydispersity, and (5) the interparticle interactions are electrostatic force driven.
1440

References
Speight, J.G. in "Chemistry of Asphaltenes." edited by Bunger. J.W. and Li, N.C., American Chemical Society, Washington, D.C., Sept. 10-11, (1979). Sheu, E.Y.. Storm, D.A., and De Tar. M.M. 3. Non-Cryst. Sol. 131-133. (1991) 341-347. Sheu. E.Y., De Tar, M.M., Storm, D.A., and DeCanio, S.J. FUEL 71, (1992), 299-302. Andersen. S.I., and Birdi. K.S. J. Interface Sci. 142, (1991) 497. Sheu, E.Y., De Tar, M.M.. Storm, D.A. Macromolec. Rep. A28 (Suppl.2). (1991) 159-175. Pal, R. and Rhodes, E.J. J. Rheol. 33 (1989) 1021. Campbell, G.A. and Forgacsm G. Phys. Rev. A 80,(1990), 8 . Bhattacharya, S, Stoke, J.P., Kim, M.W., and Huang. J.S. Phy. Rev. Lett. 55, (1985) 1884. Sheu. E.Y. De Tar. M.M.. and Storm. D.A. FUEL 70, (1991) 1151-1156.
ilO] Sheu, E.Y. Phy. Rev. A. 45, (1991) 2428-2438. [ll] Sheu, E.Y., and Chen, S . H . J.Phys. Chem. 92 (1988) 4466-4474.
0
4 T = 25 'C
g 20-
Asphaltene in Pyridlne UI
> 0
36 > 0
0 % 10 - 0
6 .. 0
1 0 0 0 0 0 .05 .15 0:
Concentration (Weight X ) 1 .2 Volume Fraction +
Fig. 1. Surface Tension of Asphal- Fig. 2a. Relative viscosity tene as a function of concentration. for asphaltene/toluene solution.
0 0.05 0.1 0.15 0.2 0.25 0.3 Volume Fraction 0
Fig. 2b. Pal and Rhodes Analysis.
1441

I-
C71 in Toluene at T = 25 'C
hard sphere-like
5 -
60 -
O ? 0 8 50 -
x 0 - 5 4 0 - f 3 2 30- 0
0
c" 2 5 1 A S P W T E N E S IN TOLUENE (T - 25 'C) ,
50
2 30
5 20
-1
d
5 10 c!
0
- : Two Fluid Model
1
'0 .05 . I .15 .2 25
Volume Fraction * volume fraction +
Fig. 2c. Comparison of asphaltene Fig. 2d. Interaction model for solution with hard sphere model. asphaltene solution.
1 2
scattering Vector Q
0 0 0
0 0
'R 30 - 0
0 0 - eo -
0 10 - 0
0
O2 4 G 8 Solvent Permittivity
Fig. 3a. SANS dat and the analysis. Fig. 3b. Radius and the inter- ragne parameter, as a function of e
Solvent Permittivity Ln(w) u in Hz
Fig. 3c. Polydispersity as a func- Fig. 4 . Dielectric loss for asphaltene tion of solvent permittivity. solution and the Cole-Cole analysis.
1442

Improved Asphalt Specification Based on Physicochemical Properties
Sang-So0 Kim and Dah-Yinn Lee
Department of Civil and Construction Engineering Iowa State University Ames, Iowa 5001 I
Keywords: Asphalt, Physicochemical Properties, Specification
INTRODUCTION Current specifications for asphalt cement contain limits on physical properties based on
correlations established in the past with field performance of asphalt pavements. Recently, however, concerns have arisen that although current asphalts in use meet these specifications, they are not consistently providing the service life once achieved.
[ I ] A considerable concern is associated with the recent world crude oil supply and the economic climate after the 1973 oil embargo which may have affected the properties of asphalt of certain origin (1). Blending several crudes, as routinely practiced in refineries to produce asphalts meeting current specifications, may have upset certain delicate balances of compatibility among various asphaltic constituents, which may manifest itself in their long- term field performance but not in original physical properties specified in the specifications (2.3). 121 The increased volume and loads of traffic on highways. [3] Inadequate mixture design, poor gradation of aggregates, changing construction practices, and improper use of additives (1.4). [4] Specifications based only on physical properties of asphalts do not guarantee adequate performance.
While the performance of the asphalt pavements could be improved by judicious application of improved mix design techniques, more rational thickness design procedures, better construction methods and quality control measures, selection of asphalts based on performance-related properties, tests, and specifications is the key to durable asphalt pavements.
Asphalt samples were analyzed by high performance liquid chromatography (HPLC), themnomechanical analysis (TMA), differential scanning calorimetry (DSC). X-ray diffraction (XRD), and nuclear magnetic resonance (NMR). The results were correlated with properties known to affect field performance. On the basis of the correlations, performance-based trial specifications for the state of Iowa were developed.
EXPERIMENTAL
There are a number of logically possible explanations of this situation:
Materials
1442

Three sets of asphalt samples were used in this study as follows: 1. A total of 12 virgin asphalts obtained from two local suppliers and their thin fiirn oven test (TFOT) residues (ASTM D1754), 2. Two sets of asphalt samples recovered from two pavements of known performance (total 6 recovered asphalts from Sugar Creek and Wood River), and 3. Asphalt samples used in 10 hot mix field pavement projects in Iowa and their field and lab aged samples.
Aging of asphalts Age hardening characteristics of the project asphalt samples were studied in the
laboratory by use of three different aging procedures; TFOT, Iowa durability test (IDT), and mix aging. TFOT simulates age hardening due to the conventional batch mixing ( 5 ) . The IDT or pressure-oxidation procedure consists of two aging stages: TFOT to simulate hardening during hot-plant mixing followed by pressure-oxidation under 20 atm of oxygen at 65 "C for oxidative hardening during field pavement service (6). In this study, two different durations of pressure-oxidation, 5 and 46 hour, were used. These are, based on the previous study, equivalent to 1 and 5 year field aging under Iowa climate, respectively (6).
The hardening of asphalt in a mix is believed to be affected by air void content, asphalt film thickness, characteristics of aggregate, and the durability of the asphalt. Marshall specimens were prepared by use of the same materials and job mix formula used at each project. To simulate asphalt aging in pavement of high and low void levels, mixes were compacted by 35 blows per side and 75 blows per side, respectively, and oven-aged at 60°C for 12 days, equivalent to eight years of in-service asphalt aging in pavement (7). The asphalts were extracted and recovered.
Rheological properties Penetrations at 5 ° C and 25°C (IOOg, Ssec), penetration at 4 ° C (200g. 60sec),
viscosities at 25,60, and 13S°C, and ring-and-ball softening point tests were performed on the original asphalts, the lab aged asphalts, and asphalts recovered from plant mix and cores (0 and 1 year old). From these data, penetration ratio (PR), penetration index (PI), pen-vis number (PVN), viscosity temperature susceptibility (VTS), cracking temperature (CT). critical stiffness at -23°C and 10,000 sec loading time (S23), stiffness at -29OC and 20,000 loading time (S29), and critical stiffness temperature at 20,000 psi and 10,000 sec (TES) were calculated. Based on viscosity data at 25"C, shear index (SI) and complex flow (CF) were also determined.
To correlate with low temperature field performance, the dependence of viscoelastic properties of selected five asphalt samples on their thermal history was studied at a low temperature. Newtonian viscosities and elastic shear moduli of these samples were determined using modified cone and plate viscometer at 5 ° C after cooling from 25OC and wanning from a quenching temperature of -30 "C. Before cooling or warming, samples were allowed to be conditioned for 24 hours or 1 hour at the specified temperature (25OC or -3OOC). Instrumentation, procedure, and the theory were described elsewhere (8).
High performance gel permeation chromatography (HP-GPC) Waters' HP-GPC system was used during this study. It included three "Ultrastyragel"
columns, one 10008, followed by two 5008. units and a UV absorbance detector (Waters
1443

model 481) set at 340nm. Asphalt samples of 0.02 to 0.05 grams were dissolved in HPLC grade tetrahydrofuran (THF) to be 0.5% (wlv) solution. Before injection, sample was centrifuged to remove foreign particles capable of plugging columns. The delay time between sample dissolution and injection was kept constant from sample to sample (approximately 30 minutes). Sample size was loop1 and THF was used as a solvent with 0.9 d m i n flow rate at 270c.
Thermal analvsis Differential scanning calorimetry (DSC) analysis was performed on the first two sets of
asphalts, scanning from -8OoC to 8OoC at a rate of SoC/min. Precooling rate was 10°C/niin. Thermomechanical analysis (TMA) was performed on the second and the third sets of asphalts. Samples were prepared having 3mm thickness. By using an expansion probe, samples were scanned from -70 " C to 25 'C at a rate of 5 C/min.
Nuclear magnetic resonance (NMR) and X-rav diffraction Four samples from the first two asphalt sets were subjected to I3C and 'H NMR
analysis, usin a home-built solid state NMR spectrometer operating at lOOMHz for 'H and 25MHz for lfC. This unit has extensively been used for studies of pyrolyzed pitches and coals. Solution 13C NMR was also employed for two recovered asphalts, two original asphalts and their n-pentane asphaltenes (Bruker WM-200,SOMHz).
The first set of asphalts, 12 original asphalt and their TFOT residues were subjected to X-ray diffraction analysis by 8-28 scanning, using monochromatized CuK, beam with 1.54A wavelength. The samples were molded in circular Plexiglas holders exactly flush with their brim.
RESULTS AND DISCUSSION
Rheological u rmnies The rheological properties of all asphalts studied were reported elsewhere (8,9,10).
Among the rheological properties, temperature susceptibility may be the most important property determining pavement performance. Asphalt cements of high temperature susceptibility may contribute to rutting at high pavement temperatures and cracking at low pavement temperatures. The results of this study indicates that within each viscosity grade of asphalt cements available in Iowa meeting the current specifications, there were differences in temperature susceptibility between suppliers and between samples from the same supplier over time.
The viscoelastic properties of five asphalt samples measured at 5 O C show the large differences among the responses of these sample to temperature conditioning and the lapse of time. Figures I and 2 show viscosities and elastic shear moduli of two recovered asphalts, Sugar Creek asphalt (SC) and Wood River asphalr (WR). Both were recovered from the surface courses after 80 months of field services. The viscoelastic properties of SC asphalt show large dependence on thermal history. Performance evaluation of these asphalts indicated that SC asphalt developed more cracks in much shoner time than WR asphalt (Mark and Huisman. 1985).
HP-GPC
1444

Figure 3 shows typical HP-GPC chromatograms of original, TFOT residue, and asphalt pressure-oxidized for 46 hours (IDT). The amount of large size molecules is unidirectionally sensitive to aging, Le., as the asphalt ages the amount of large molecules increases. Therefore, the HP-GPC technique can be used to monitor and predict aging.
To better characterize the molecular size distribution of the asphalts and to be used in statistical analysis, the HP-GPC profiie were divided into three, four and eight slices following Montana State (1 1). Iowa State (8), and Purdue (12) procedures respectively. The elution cut- off times used in the three slice method were 22.5 and 30.5 minutes. The four slice method is a modification of the three slice method, in which the f i s t fraction (earliesteluted fraction) is further divided into two using a cut-off elution time of 18.125 minutes. The first and the second eluted fractions is denoted as LMS (large molecular size) and MMS1 (medium molecular size l), respectively. In the 8-slice method, the cut-off times used were 19.875. 21.875,23.875, 25.375,26.875,28.875, and 30.875 minutes and the eight slices were denoted as X1 ... X8.
Results of regression analysis between the physical properties and HP-GPC parameter defied as above are listed in Table 1. The first two columns show one-parameter correlations using the first fractions in the 3-slice and 4-slice methods. LMS fraction which ranges from 1% to 1 I% has weak correlations with physical properties. LMS+MMSl fraction ranges from 20% to 43% and shows significant correlations with all the rheological properties, some temperature susceptibility parameters and low temperature cracking properties. Molecular size distribution is best characterized by the 8-slice method thus correlating well with almost all physical properties. Among the 8 slices, the second slice (X2) and the seventh slice (X7) most predominantly control the rheological and low-temperature properties as indicated by results from stepwise regressions (the last column in Table I and Table 3).
Effects of aging on physical properties and on physicochemical properties are not the same. For example, the asphalt used in one of the ten projects had a large percent increase in LMS due to aging, but not reflected by changes in viscosity ratio. This implies that the chemical coinposition of the asphalt results in excess amount of oxidation products determined by molecular size but the increase of viscosity is also prevented by its chemical composition. The opposite was also observed. The asphalt used in another project showed high increase in viscosity after TFOT, but not reflected in LMS increase, suggesting the opposite chemical composition.
Thermal analysis It has long been attempted to correlate some low temperature transitions in asphalts,
which are believed to affect their low-temperature rheology, such as glass transition and phase transformations to their field performance. A typical DSC thermogram obtained in this study is shown in Figure 4. The low temperature inflection points on the thermograms interpreted as glass transition points (13,14), Tg, were determined. The rest of the thennograms consist of two shallow endothermic peaks. The two peak temperatures were determined. These regions were analyzed to determine the enthalpies of transformation. These endothermic transformations are referred to as melting of the crystallized asphaltic components (13) or dissolution of these components in the matrix (14). The DSC data shows no significant correlation with physical properties determined in this study. However, the enthalpies of transformation for asphalts from one supplier are significantly different from asphalts from the other supplier (the enthalpy values are on the average 24% higher).
1445

The effect of aging on the DSC parameters appears to be in random directions. This might be due to overshadowing the gel to sol transition in thermal analysis by the large thennal effect of dissolution of the crystallized components as treated by Albert et al. (14).
Four parameters were determined from the TMA thermograms as shown in Figure 5 : 1. The slope of the initial straight line (ML) which measures the low temperature thermal
coefficient of expansion of the sample at the glassy state. 2. The slope of the nearly straight adjacent section of the plot at higher temperature (MH),
which measures the coefficient of expansion after the glass transition. 3. The glass transition temperature (Tg) graphically detemiined as shown in the Figure 5. 4. The softening temperature (Tsp) at which the displacement of the TMA probe reaches a
maximum. The glass transition temperature, Tg, of the original asphalts ranges from -34 "C to
-22.5"C. increasing with viscosity from AC-5 to AC-20. In general, aging at high temperature (TFOT or hot mixing) reduced the TMA parameter values and the following low temperature aging (pressure-oxidation or field aging) increased the thennal responses. hi other words, a different aging mechanism seemed to result h different trend of thermal responses.
Correlations between the TMA parameters and physical properties are listed in Table 2. Tg correlates well with low temperature propenies, while Tsp and ML correlates well with both rheological and low-temperature properties. Among the temperature susceptibility parameters only penetration ratio (PR) and pen-vis number at 60 OC (PVN60) significantly correlate with Tsp and ML.
Nuclear magnetic resonance (NMR)
1 , Oven treatment (TFOT) decreases the amount of aliphatic quaternary carbon in the original asphalt. 2. The quaternary carbon content of the Sugar Creek (SC) sample is strikingly less than those of all other samples subjected to NMR.
X-ray diffraction As associative interaction between asphaltenes or polar molecules promote a structural
order in the system, such an interaction is also expected to reflect on X-ray diffraction spectra of the sample.
According to Williford (15). the height of the shoulder of the spectral curve at low angles is a measure of the quality of the asphalt. This height above the background (at 20 = 4.83 " ) for the original asphalts and their TFOT residues were determined. No regular trend was found in these X-ray spectra regarding the viscosity grade, the sample source, and the effect of aging.
Correlation In this section, the discussion will be confined to correlations among physical
propenies, TMA, and HP-GPC parameters of all samples related to the 10 field projects. TMA parameters and HP-GPC parameters had less significant correlation with each
other than their correlations with physical properties. For this reason, it was decided to treat these two sets of parameters as independent but complementary variables to correlate with the physical properties. Table 3 gives a summary of regression analyses performed as such on
Based on the limited experiments, the following conclusions are drawn:
1446

physical properties against TMA and HP-GPC parameters combined. These regression analyses give considerably higher values of coefficients of determination (r') than the regression analyses using TMA or HP-GPC parameters alone. Figures 6 and 7 compare the measured viscosities at 25oC and 135'C with the predicted values from regression analyses.
PROPOSED TRIAL ASPHALT SPECIFICATIONS FOR IOWA
The selection of the proper grade of asphalt for a given paving project must be based on consideration of climate (temperature), traffic, thickness of the layer, and the prevailing construction conditions. The selection of asphalt within a grade must be based on temperature susceptibility and durability. The temperature susceptibility of asphalt influences the mixing. placing and compaction of paving mixture as well as the high and low temperature performance of the pavement. Durability of asphalt or asphalt's resistance to hardening and aging, during construction and in-service, affect the pavement life. Current specifications, while containing requirements for indirect control of temperature susceptibility and asphalt hardening during hot-plant mixing (short-term durability), have no control over long-term durability.
A trial specification based on Iowa pressure oxidation test is proposed. The Iowa pressure oxidation test is a realistic durability test for asphalt developed by consideration of the two stages of hardening processes of asphalt in their logical order and of their differences in mechanisms and effects. Furthermore, good correlations between field hardening and IDT exist (6). Results of this and more recent other studies c o n f m that chemical or compositional factors have a major impact on the performance of asphalt. While specification based solely on chemical composition would be costly and difficult to implement, a rational specification based on both short-term and long-term accelerated aging tests, containing time-honored physical tests and temperature susceptibility control, coupled with minimum chemical and low-temperature requirements is both desirable and feasible. HP-GPC and TMA parameters are detennined to be included in the proposed specification.
Many researchers have proposed physical properties of asphalts and their critical Iimirs for acceptable pavement performance. Some of these properties are penetration at 4 0 c and 25 'C, Ring-and-Ball softening point, viscosity at 25"C, shear index, pen-vis number, and stiffness at a low temperature as summarized in Table 4.
Due to insufficient field performance data correlated with HP-GPC ant TMA parameters, critical values of HP-GPC an TMA parameters were indirectly estimated from correlation with the performance related prOpeRieS as given in Table 4. Aging characteristics of asphalts are commonly expressed by a hyperbolic functions of time and changes of asphalt properties after 5 years of aging become very small. For this reason, the critical values discussed above are recommended as limiting values in specification for an asphalt pressure oxidized for 46 hours at 65'C and 20 arm oxygen.
Limiting values for penetration at 5 C were determined ro meet the cracking temperature criteria to prevent a low-temperature asphalt transverse cracking. Long-term aging index, ratio of viscosity at 60-C after pressure oxidized for 46 hours to viscosity at 60'C after TFOT was introduced to assure long term durability. Based on observation of IDT data, a tentative critical long-term aging index was proposed.
1447

The proposed specification, based on the pressure oxidation test and existing AASHTO M226. Table 2, is given in Table 5 . Some of the limiting values can be refined as more field performance data become available.
CONCLUSIONS
Conclusions of a general natures are summarized as follows: 1. The strikingly different effect of thermal history on the viscoelastic properties at 5OC of
the Sugar Creek core sample might have an important bearing on its poor field pcrformance.
2. HP-GPC parameters are conclusively and unidirectionally sensitive to aging and can be used to predict behavior and performance of asphalts.
3. Both TMA and HP-GPC parameters correlates well with physical properties. 4. For some asphalts, aging characteristics during high temperature (short-term) and service
temperature (long-term) were very different. Physical reponses to aging could be very different from physicochemical responses.
5. Improved asphalt specification should include evaluation methods for short-tenn and long- term aging characteristics in terns of both physical and physicochemical methods.
ACKNOWLEDGEMENTS
This research was sponsored by the Highway Division of the Iowa Department of Transportation (DOT) under Research Project HR-298. This study, under the same title, was also supported by and designated as Project 1942 of the Engineering Research Institute, Iowa State University.
The support of this research by the Highway Research Advisory Board and the Iowa DOT is gratefully acknowledged. The authors wish to extend sincere appreciation to the engineers of the Iowa DOT for their support, cooperation, and counsel. The authors would also like to thank Dr. Bernard C. Gerstein, Professor of Chemistry, Iowa State University for running the NMR work and Gerald Reinke, Koch Asphalt Co.; Alden Bailey, Jebro, Inc.; Brian Chollar, FHWA; and Joan Pribanic, Montana State University, for supplying the asphalt samples tested in the study. The following individuals contributed, in various capacities, to this investigation: B. V. Enustun, Jerry Amenson, Barbara Hanson, Shelley Mellcher, Paul Schmidt, Steve Troyer, Paul Martin and R. Suryanarayana.
LITERATURE CITED
Hodpson, R.S.,Transport. Res. R e c . , m , 10 (1984). Goodrich, J.L.,Transport. Res. Rec.. 1096, 146 (1986). Petersen, J.C., Transport. Res. Rec., 999, 13 (1984). Anderson, D.A. and Dukatz, E.L., Report No. FHA/RD-84/095 (1985). Goodrich, J.L. and Dimpfl, L.H., Proc. Assoc. Asphalt Paving Tech., 55.57 (1986). Lee, D.Y., Highway Res. Rec., 231, 34 (1968). Goode, J.F. and Lufsey, L.A., Proc. Assoc. Asphalt Paving Tech., 34,430 (1965). Lee, D.Y. and Enustun, B.V., Task 1 Report, HR-298, Ames, Iowa (1988).
1448

(9) EnusNn, B.V., Kim, S.S., and Lee. D.Y., Progress Report No. 2, HR-298, Ames, Iowa (1989).
(10) Enustun, B.V., Kim. S.S., and Lee, D.Y., Final Report, HR-298, Ames. Iowa (1990). (11) JeMingS. P.W. et al., Research Report FHWA-MT-7930 (1980). (12) Garrick. N.W. and Wood, L.E., Proc. Assoc. Asphalt Paving Tech., (1988). (13) Noel, F. and Corben, L.W.. 1. Inst. Petrol.,56, 261 (1970). (14) Albert, M.. Bosselet, F., Claudy, P., Letoffe, J.M., Lopez, E., Damin. B., and Neff, B.,
Thermochimica Acta, 84, 101 (1985). (15) Williford, C.L., Texas Engr. Exp. Station Bull. 73, A & M College of Texas, College
Station, TX (1943). (16) The Asphalt Institute, Research Report No. 81-1, College Park, MD (1981). (17) Finn, F.N. NCHRP Report 39 (1967). (18) Kandhal, P.S., Sandvig, L.D.. and Wenger,M.E., Proc. Assoc. Asphalt Paving Tech., 42,
99 (1973). (19) McLeod, N.W., Proc. Assoc. Asphalt Paving Tech., 3 . 4 1 0 (1989). (20) Kandhal, P.S., Proc. Assoc. Asphalt Paving Tech., 47,73 (1978).
I
1449

m m c m n i n m m x x x x x x x x x
c c n c n * e x x x x x x x
VIW w W x x x x
1 7 7 7 x x x x
. . . . . . .
. . .
. . .
N
m w m n m m x x x x x x
7 N N x x x
. . .
n
~ c c m x x x x n n n e x x x x - n x x
. . . .
. . - x
o m u l n m n N - W - W ~ w r . - - n . ?
000000
-w c V I w - o w 9 w c o
000000 8 8 1 2 8 8
~ ~ m m n n - m - n ~ m m m m - m o m m n n n n n - n n
000000000
c w w m m - 0 7 m ~ m o n - 0 0 - n 000000
m m P O e N C O P - o w m - 0 0 0 0 000000
m c n v o m o n e
000000 , 00849 O N N N
0000
.:-a- r m - m n r c n m
YI w 9 m n m c ~ 1 - 0 0 - m - - 0 0 0 - N
: 000000000
1450

m - m - m o 0 - - - u c n - - 0 - 0
0 0 0 0 0 0
N 0 ) C P O O
0 0 0 0 0 0
Ln-NLn L n N O P - n 0 n
0 0 0 0
m m - -
E 8 8 8 0 0 0 0
- I
- Y I ~ ( I ) N N ~ N ~
o a ~ e m o m r - ~ u m a c c ~ n u c m 0 0 0 0 0 0 0 0 0
N o O o N n r r 0
0 0 0 0 0 0 0 0 0 0
- m m n y l n n -
0 0 0 0 0 0 :8;8ce
m m o u n m 8:1Z;8 ? ? ? ? ? ? 0 0 0 0 0 0
o w o n o u o n 00-- 0 0 0 0
-$worn
0 0 0 0
- I 0-00- In LnnLn ,0085; 0 0 0 0 0 0
- 9 0 - n - a - 0 - n N
0 0 0 0
u m n - r
f $@j a 0 0 0 0
0 0 0 0 0 0 0 0 0
0 0 0 0 0 0 0 0 0 0 0 0 0 0 0
a-
P 0 0 0 0
c 0 0 - n - o n u n -L - - - - ”
w u n m 5 gi ig8 10 0 0 0 0 u E- -
::;;a o m 0 -o-,&;c 0 0 0 0 0 0 0 0 0
3 10 01
- a u c
1451

Table 3. Regression analyses: Physical Properties against TMA and HP-GPC Parameters (n=73)
Selected variables I TMA & HP-GPC I
Dependent Variables
from stepwise reg. parameters I I
P-value R+*2 I TMA parameters HP-CPC parameters I I
Rheological properCies
P5 I P25 I P4 I
CF I SI I
SP I
VIS25 I
VIS60 I VIS135 I
0.0001 0.0001 0.0001 0.0001 0.0001 0.0001 0.0001 0.0001 0.0001
0.666 0.669 0.667 0.766 0.741 0.719 0.583 0.773 0.715
Low-temperature cracking proper ties
Tg X2 .XS,X7 .X8 Tg X2,X7
ISp,ML.MH XZ.X4,X7,PIDX Tsp , ML , hH X2 .X5 .X7
Temperature susceptibility
PR PI CN VIS PVN60 PVN135
CT TES S23 S29
0.0001 0.636 0.0517 0.309 0.2076 0.246 0.5121 0.187 0.0098 0.368 0.0001 0.496
0.0008 0.438 0.0001 0.564 0.0001 0.655 0.0001 0.588
X2 ,X6 .X7 X 4 .X6 ,X7
X 2 . X 4 .X6. X7 .X8 X2.X4.X6.X7,MwT,PIDX
XZ XZ XP Xl
XI,X3,X6,MJT
X2 .X4 I X5 X4,PIDX
x5 x3
x2.xa XZ.X8
___ ~ _ _ _ _ _ _ _ _ _
Bold face indicates significantly correlated variable.
1452

i
- Q \ O ~ N I-
0 0 0 0 0 v v v v v x vlr?\q-.-?
145:

TaMe 5 . Proposed Trial Specification for Asphalt Cement
Test AC-5 AC-10 AC-20
Original Asphalt: 500i100 1,000i200 Viscosity @ 60°C. poise 1
Penetration @ 25 "C, min' 140 80 Viscosity @ 135'C, cSt, min' 175 250
Flash point, "C. min' 177 219 Solubility in TCE, %, min' 99.0 99.0
Residue from TFOT: Viscosity @ 60°C, poise, max' 2,000 4,000
Residue from Pressure-Oxidation, 46 hrs, 6S°C, and 20 atrn: Viscosity @ 60°C, poise, max 10,000 20,000 Penetration, 25/100/5, min 20 20 Penetration, 4/200/60, min 5 5 Penetration. 5/100/5, rnin 10 8 R&B softening point, "C, max 71 71 Stiffness, -23 OC, 10,000 sec, psi 20,000 20,000 Viscosity, 25 "C. megapoise, max 20 20 Shear susceptibility, max 0.55 0.55 X2 (HP-GPC), 5%. rnax 20 20 X7 (HP-GPC), %, min 5 5 Tg (TMA), "C, max -20 -20 Tsp (TMA), "C, max 28 28 ML (TMA), max 0.4 0.4
2,000i400 300 60 232 99.0
8.000
40,000 20 5 7 71 20,000 20 0.55 20 5 -20 28 0.4
'AASHTO M226, Table 2
1454

i I i
1
I

a N
U 4
0 5 a a o a n n
(D v
N P
m m
P m
0 m
10 N
N N
2
v r(
1456

I
luprrotu+ (P Mat law
Figure 4. DSC thermogram of Asphalt B2975
a t : : : : . : : : : : : : : : : : ; . : : : : I
i - -28 -18 0 10 e..peroture ('C)
\ Tsp-13.0'C
20 38 4u
OuPont l0DU
Figure 5. Typical TMA thermogram (K20-01-0)
1457
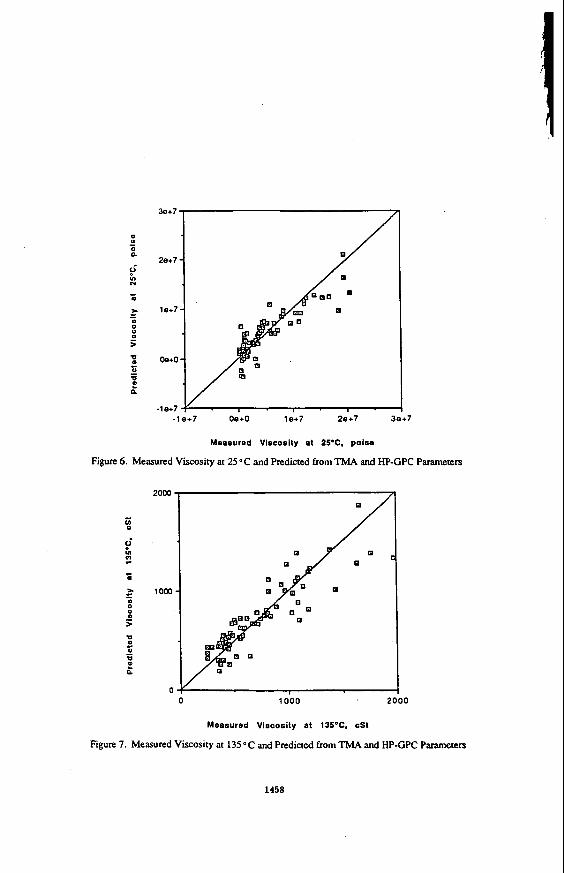
0 0
le+7 - 0
oe+o -
-le+? Y . -le+? oe+o 1 e+7 2e+7 3e+7
Measured Viscosity at 25%. poilie
Figure 6. Measured Viscosity at 25 "C and Predicted from TMA and HP-GPC Parameters
20m
1000
0 1000 00
Measured Viscosity at 135OC. cSI
Figure 7. Measured Viscosity at 135'C and Predicted from TMA and HP-GPC Parameters
1458

RHEOLOGICAL ANALYSIS AND REINFORCEMENT EFFECTS OF POLYMER MODIFIED ASPHALT
William H. Daly, loan I. Negulescu and Zhaoyao Qiu(Chiu), Macromolecular Studies Group, Department of Chemistry, Louisiana State University, Baton Rouge, LA 70803-1 804
Key Words: AsphalUpolymer blends, Dynamic rheology, creep
Introduction Blends of polymeric materials with asphalt are complex and characteristically unique paving material systems. For any specific asphalt cement, (AC), the physical properties of Ihe asphalt-polymer blend are affected by the amount of polymeric material added, its composition, its molecular weight, etc., but the most important variable may be the compatibility of the AC with the admixed polymer and the ability to enhance compatibility is critical to the commercial applications of reinforced ACs. Our research efforts are directed toward developing a simple method to estimate the compatibility of polymer additives with asphalt, to assess the phase structure of the asphalt-additive mixture, and to measure the blended polymerlasphalt performance relative to that of the pure asphalt matrix. Using dynamic testing techniques, we believe that a better assessment of asphalt cement performance can be obtained.
as virgin off spec material or from solid waste classification processes. Polyethylene is a useful asphalt modifier for increasing the low temperature fracture toughness of asphalt cements(1) and it may also confer additional pavement stability at elevated temperatures which would minimize rutting and distortion due to creep. Due to gross incompatibility, polyethylenelasphalt blends tend to separate when allowed to stand at elevated temperatures. We are exploring the potential for simple chemical modification of polyethylene to enhance its compatibility with asphalt. A low degree of chlorination may assure a favorable interaction with the polar components of asphalt. Further, the extent of chlorination can be utilized to vary the crystallinity of the polymer additive. The microstructure and morphology of chlorinated polyethylenes have been evaluated(2). In solution chlorination, attack occurs randomly along the chain and the resultant insertion of chlorine atoms distroys the crystallinity of the polymer. Experimental Materials used High density polyethylene (HDPE) was supplied by Allied Signal. A high melt index (MI = 25) sample with weight and number average molecular weights of 85,000 and 19,000 respectively was used as the substrate for chlorination as well as a standard for the polymer asphalt blends. Solution chlorination of HDPE was conducted in 1,1,2,24etrachloroethane (TCE) at 110" C(3); samples with 8.9 wt% and 15.2 wt% chlorine were used in this study. Asphalt samples from Southland, AClO, and Exxon, AC20, were used as the
Polyethylene is a recyclable waste which is abundantly available either
1459

continuous phase; detailed characterization of these samples is reported in the previous paper (4). The asphalt polymer blends were prepared by melting 5% polymer in asphalt at 15OoC while stirring for 2 hours under N2 atmosphere. The samples are identified as follows: ACD, Exxon Asphalt AC20; ACE, Southland Asphalt AC10; Asphalt blends: HDPE. High Density Polyethylene; CPEB, CPE with 8.9 wt% CI content; CPEC, CPE with 15.2 wt% CI content. Fluorescence Reflection Microscopy The macrostructure of the asphalt polymer mixtures was examined using fluorescence reflection microscopy (FRM). The sample was fractured on dry ice and then the fracture surface was observed through a set of filtering lenses, where the asphalt phase appears dark yellow and the polymer phase bright. Figure 1 shows two FRM pictures of asphalt polymer blends. Clearly, the blends are two phase systems; the size of the CPE phase is larger than that of the HDPE phase for samples prepared under identical conditions. DMA Bendinq Mode Measurements In a typical DMA experiment, an asphalt sample was heated to 150°C in a sand bath. The asphalt sample was then -
poured into a brass mold and kept at room temperature for at least an hour. The sample size was 50 mm long, 10 mm wide and 1.68 mm thick. The sample was run in bending mode at cooling rate of 1"Clmin at the desired frequency. The Tg was identified as the temperature corresponding to the maxima of loss modular E" at each frequency.
Imposition of a larger strain (1 %) on the asphalt samples at 50 Hz in DMA experiments will induce cracking at a specific temperature during the cooling. The temperature, called cracking temperature (Tc), can be used to estimate the low temperature cracking resistance of asphalt or asphaltlpolymer blends. DMA Shearina Mode Measurements The shearing mode measurements were conducted at temperatures well above the glass transition temperature of asphalts and polymers employed. The samples were "sandwiched between two parallel plates with size of 10 x 10 mm. Sample thickness was held to about 1 Smm, measured with a deviation of +0.05mm. Master curves were used with reference frequency of 20 Hz. Constant Stress Creep Test The test was run at 5, 15, 25, 35"C, respectively, with Bohlin CS rheometer using a cone and plate mode. The stress applied was 590 Pa. Results and Discussion
sensitive to polymer/asphalt interactions. Since asphalt is a rather low molecular weight material, it becomes quite brittle at temperatures below its glass transition. In contrast, the Tg's of HDPE and CPE are greater than 30°C below the cracking temperatures of the blends. The amorphous regions of these polymers remain flexible while the crystalline phases provide tie points to limit chain reptation. Thus, these polymers should be effective impact modifiers. However, the extent of polymer contribution to blend properties depends upon the degree of compatibility with the asphalt matrix,
Low temDerature crackina. The low temperature cracking test is quite
1460

As can be seen in Table 1, the blends do indeed exhibit Tcs below the Tg of pure asphalt measured at the same frequency. We have shown that the Tc of pure asphalt falls above the corresponding Tg ( ) so the polymer component has improved the low temperature properties of the blends. Furthermore, CPE modified asphalts have lower Tcs than HDPE modified asphalts as might be expected from a more amorphous polymer with a higher degree of interaction with asphalt. Thus, our data indicate that CPEs are more compatible with asphalt than HDPE and are more effective in low temperature reinforcement.
Our fluorescence reflection microscopy observations confirm previous reports [5,6] that there are basically two phases existent in asphalt-polymer blends, an asphalt rich phase and a polymer rich phase. As fact of matter, the hetero-phased systems are advantageous from a practical of point of view; the dispersed polymer rich phases are expected to improve the toughness of brittle asphalt at low temperature and reinforce asphalt at high temperatures [7-91. Since the polymers are not completely miscible in the asphalt continuous phase, their presence does not increase the melt viscosity of the blends excessively; asphalt cements prepared from these blends should flow smoothly and coat the aggregate efficiently.
The enhanced compatibility of CPE in asphalt can be attributed to a change in the polymer polarity as well as changes in morphology stemming from the reduced crystallinity. In crystalline polymers like HDPE, interaction with solvents and reagents is limited to the readily accessible amorphous regions. In HDPE, these regions are composed of -CH2- segments more compatible with the saturates in asphalt. One would expect selective extraction of the saturates from the asphalt matrix by HDPE; this process would disrupt the balance of components in asphalt mixtures and promote phase separation.
chlorine distribution in the chains indicates that chlorination is not perfectly random. Runs of unreacted methylene groups that can crystallize remain. Chlorinated methylene groups do not enter the crystallites so the amorphous region contains a higher chlorine content than that measured in bulk samples. Thus, the amorphous regions are substantially more polar, and the presence of chlorine atoms on the polyolefin chain will improve the compatibility of the polymer with aromatic components and functional groups contaihing heteroatoms, such as, N, S, 0, in asphalt. It was reported [lo-131 that the CH2/COO ratio was an important factor controlling the miscibility of blends prepared from a series of aliphatic polyester with polyvinylchloride; polymers with a higher polarity were more miscible. The polar components of asphalt would have a greater affinity for the amorphous regions of CPE and one would expect a corresponding increase in the compatibility of these polymers with asphalt. Introduction of chlorine adjusts the interaction parameters to reduce single component extraction thus the delicate equilibrium among the asphalt components is maintained.
Although chlorination of HDPE was conducted in solution, analysis of the
1461
Dvnamic rheoloav. Rheological measurements under oscillating conditions yield the dynamic mechanical properties of polymers, Le. the storage modulus, G', the loss modulus, G' , and a mechanical damping or internal friction, tan 6. The storage modulus reflects the internal stiffness of a material under dynamic loading conditions; the corresponding stress response is in phase with the applied strain. The loss modulus is the viscous, damped response of the material; the corresponding stress is out of phase with the applied stain. This phase lag results from the time necessary for molecular rearrangements and is associated with relaxation phenomena. In studies of the response of a material to vibrational forces, stress, strain, frequency and temperature are the key variables. When a material is subjected to cyclical stress under conditions analogous to those encountered in the intended applications, the data reflect both short-term and long-term responses to the stress conditions. If time- temperature superposition can be applied, dynamic data obtained at short time intervals at high temperature can be transformed to yield long loading time data relevant to thermal cracking. (14)
conformation rearrangements can take place within the period of the deformation (151. Examination of plots of IogG' versus either temperature or frequency (figure 2) reveals that the slope of the curve for ACE-HDPE is very close to that for ACE. In another words, adding HDPE to ACE simply induces a parallel shift of the IogG' curves toward high temperature or low frequency. The presence of HDPE particles results in the development of partially separated regions in the asphalt matrix, which are characterized by a higher rigidity than in the bulk asphalt. A contributing factor to both the parallel shift and the slight difference between slopes of the two curves is the selective adsorption of asphalt components by HDPE. Adsorption of the saturates by HDPE enriches the asphalt phase with aromatics resins and asphaltenes and creates a more rigid continuous phase. The dynamic mechanical response of ACE-HDPE is mainly from the continuous asphalt phase that is indirectly affected by the presence of HDPE.
blends decrease and become more linear (figure 3). Asphalt is much more temperature sensitive or frequency sensitive than the polymer additives employed. The decrease in temperature sensitivity exhibited by the blends may imply that the polymer rich phase is more and more directly involved in responding to the dynamic mechanical load. The effect is particularly pronounced is the higher temperature regimes. Introduction of chlorine atoms enhances compatibility between the polymer additives and asphalt, thus the volume of the polymer rich phase will be increased due to improved 'solubility' in the asphalt A morphological conversion from a particle filled matrix (HDPE blend) to a three dimensional network may occur in CPE blends. Creep. Creep tests (figures 4-7) illustrate a pronounced difference between HDPE and CPE blends. At 35°C the presence of HDPE did not change the creep behavior significantly. Further one can distinguish between the degrees
On a molecular basis, the magnitude of G' depends on the nature of the
Compared with that of ACE-HDPE, slopes of logG curves of ACE-CPE
1462

of chlorination in the two CPE samples; the more amorphous samples were more resistant to creep. Acknowledgement:
Center. References
Support for this work was provided by Louisiana Transportation Research
1. 2.
3. 4. 5
6.
7. 8. 9. 10. 11. 12.
13.
14.
15.
P. Jew and R. T. Woodhams, Asphalt Paving Technology, 55,541 (1986) B. H. Chang, R. Ziegler and A. Hiltner, Polym. Eng. Sci. 28, 1167 (1988) and references cited therein. Zhaoyao Qiu Thesis Louisiana State University, p50, 1991 W.H. Daly and Zhaoyao Qiu, Fuel Chemistry Division Preprints, 1992. B. Brule; Y. Brion and A. Tanguy, Asphalt Paving Technology, 57, 41- 64, (1 988). C. Lenoble, Prepr. -Am. Chem. SOC., Div. Pet. Chem., 35(3), 541-49,
C. B. Bucknall and W. W. Stevens, J. Material. Sci., 15, 2950, (1980). C. B. Bucknall and C. J. Page, J. Material. Sci., 17, 808, (1982). P. Juliano, Polymer Eng. Sci.. 24. 1359, (1984). M. Aubin and R. E. Prudhomme, Macromolecules, 13, 365, (1980). M. Aubin and R. E. Prudhomme, Polym. Eng. Sci. 24, 350, (1984). M. Aubin; Y. Bedard; M. F. Morrissette and R. E. Prud'homme, J. Polym. Sci., Polym. Phys. Ed, 21, 233, (1983). J. E. Harris; D. R. Paul and J. W. Balow, Polym. 'Eng. Sci., 23, 676, (1 983). H. S. Pink, R. E. Merz and D. S. Bosniack, Asphalt Paving Tech. 49, 64 (1980). R. 6. Bird; R. C. Armstrong and 0. Hassager, Dynamics of polymeric liquids, Volume I , Fluid Mechnics, 2nd Edition, John Wiley 8 Sons, Inc., New York, 1987.
(1 990).
Table 1. Glass Transition Temperature (Tg) from E ' and Cracking Temperature (Tc) of Concerned Asphalts, Polymers and Asphalt-polymer Blends
Sample 1 Hz ACE -32.2 C ACD -14.9 C CPEB -12.7 C CPEC -15.2 C
ACE-HOPE -30.3 C ACE-CPEB -31.9 C ACE-CPEC -31.8 C ACO-HDPE -14.3 C ACD-CPEB -16.9 C ACD-CPEC -16.6 C
10 Hz -26.6 C -9.9 c -7.9 c -12.4 C -25.0 C -26.3 C -25.7 C -8.5 c -10.8 c -10.4 C
1463
50 Hz Tb -22.5 C -20 c -4.1 c -5 c -5.7 c -9.4 c -20.5 C -23 C -21.6 C -28 c -21.4 C -31 C -3.7 c -7 c -6.0 c -8 C -6.7 c -10 c

a b
Figure 1 Piclures of fluorescence refledion rnlcroscopy. (a) 5% CPEC In ACO. (b) 5% HOPE In ACO.
7.0 , I
QMXX) ACE aaaoD ACE-HDPE 6.0 -
a 3 5.0 v w 0 -
4.0
3.0 15 25 35 45 55 65 75
Temperature 'C
7.0 I I
6.0
z g 2 5.0 v
4.0
3.0
UCiUM ACE-HDPE QMM ACE-CPEB M A C E - C P E C
, , , , . , . . . . , , . . . - 1s 35 45 i5
8 5
Figure 2 Plol of IogG versus temperature.
Figure 3 PI01 of logG versus temperalure lor ACE, ACE- HOPE. ACE-CPEB and ACE- CPEC.
TEMPERATURE C
1464
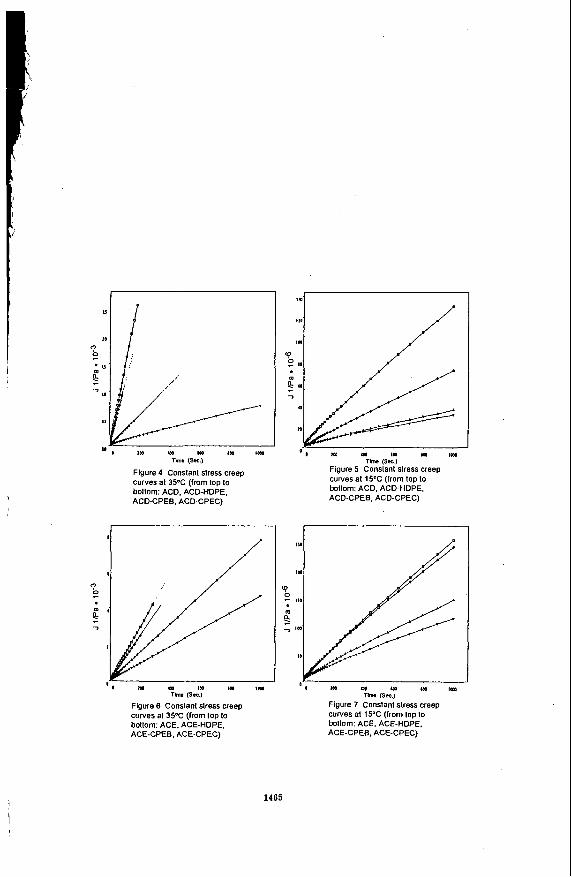
Figure 4 Conslanl slress creep curves al 35% (from lop l o bollom: ACD. ACD-HDPE. ACD-CPEB. ACD-CPEC)
I
1
s I ' r
- 7
I
'm IO 01 IO la IDI
T h e (Sec 1 lhna (s-1 Figure 6 Conslanl slress creep curves al35"C (from lop lo bollom: ACE. ACE-HDPE. ACE-CPEB. ACE-CPEC) ACE-CPEB. ACE-CPEC)
Figure 7 Conslanl slress creep curves a1 15°C (from lop lo bollom: ACE. ACE-HDPE.
Figure 5 Consianislress creep curves at 15OC (from lop lo bollom: ACD. ACD-HDPE. ACD-CPEB. ACD-CPEC)
1465

In Situ Measurement of Water at the Asphalt/Siliceous Aggregate Interface
Tinh Nguyen, Eric Byrd, and Dale Bentz
Building Materials Division National Institute of Standards and Technology
Gaithersburg, MD 20899
Abstract
Warer at the asphaN/aggregate inteiface is the major contributor to the debonding of asphalt from mineral aggregates (stripping). l l i s paper describes a spectroscopic technique to detect and measure in siru water at the interface berween an asphalt and a siliceous aggregate, and the application of the technique to studies of several asphalts. m e technique employs Fourier tramform infrared (FnR) spenroscopy in the multiple internal reflection (MIR) mode. An asphalt layer of any thickness is coated on an SO,-covered Si internal reflection element (IRE) and a water chamber is attached to the asphalt-coated substrate. Spectra are taken automatically at speri/ed rime intervals without disturbance of the specimens. I n the study. water at the asphalt/aggregate interface forfive Strategic Highway Research F?ogram (SHRP) core asphalts (AAC-I. AAD-I , AAGI. AAK-I a n d t d - I ) of about € 0 ~ thick on an Si0,Si substrate was measured using the technique. B e amount and thidmess of the water layer at the asphalr/siliceous aggregate interface were determined based on internal reflection spectroscopy theory, the water concentration-intensify calibration c u m obtained using a series of H,O/D,O mixtures. and the water uptake of the asphalts. I he results indicated that the thickness of the water l q e r at the asphalt/siliceous aggregate interface increared as time of exposure increared. Water aakorption characteristics at the asphalt/SiO,-Si substrate interface were direrent for the five asphalts. l l e technique should be useful for evaluating arphalt/siliceous aggregate mktures in terms of water drgirrion, water susceptibility, effectiveness of antistripping agents. and effects of aggregate surface conraminarion on water stripping.
Keywords: asphaltlaggregate interface, in situ, wateI
INTRODUCTION
The debonding of asphalt from mineral aggregates in the presence of water (stripping) "has been observed at times ever since asphalt paving came into existence" (1). Since stripping was first recognized as a problem, many studies have been devoted to the search for a solution to this problem. Still, stripping continues to occur in many areas. Whether asphalts fail prematurely or in the range of the expected service life, they require large replacement costs that could probably be reduced through development of effective methods for measuring the effects of water on the stripping of asphalt from an aggregate and for evaluating the effectiveness of antistripping agents. A major technical barrier to overcoming the problem of stripping is the lack of a technique for measuring water at the asphaltlaggregate interface. Measuring water at bonded interfaces has been the subject of much interest, not only in the asphalt pavement area, but also in many areas involving a polymer film on a substrate, such as in the fields of coatings, adhesives, and fiber composites. However, until recent research at the National Institute of Standards and Technology (NIST) that led to a technique for measuring water in siru at the coatinglmetal interface (2-4), there has been no suitable technique available. The main objective
1466

of this study was to develop a technique for measurement of water in sinr at the interface between asphalt and a model siliceous aggregate.
The technique developed for studying water in sifu at the asphaltkiliceous aggregate interface is based on Fourier transform infrared - multiple internal reflection FIR-MIR) spectroscopy, commonly known as FTIR-ATR (attenuated total reflection) spectroscopy. The theory and principles of FTIR-MIR are well understood (5). The application of this technique for measuring in siru (2) and quantifying (4) water at the interface between a polymer and a substrate has been described.
EXPERIMENTAL
The model siliceous aggregate used in this study was a 50xlOx3mm, spectroscopic grade, Si@- covered Si internal reflection element (IRE). The asphalts were five of the Strategic Highway Research Program (SHRP) core asphalts: AAC-1, AAD-1, AAG-1, AAK-1, and AAM-1. Asphalts were heated to 60°C in air and applied on the model aggregate using a "drawdown" technique. The thickness of the asphalt films on the model aggregate was 63k 15 pm. A water chamber was attached to the asphalt-coated aggregate and water was introduced into the chamber. Figure 1 illustrates the specimen configuration and experimental setup. At specified time intervals, FTIR-MIR spectra were taken automatically without realignment of the instrument accessory and without disturbance of the specimens. Difference spectra between the water- exposed and unexposed asphalt-coated aggregate specimens as a function of exposure times were recorded. All spectra were the result of 32 coadditions and were collected at 4 cm-' resolution throughout the 1200-4000 cm-I range. Unpolarized light at an incident angle of 45" was used. Quantitative analyses were performed using the peak height method. Since this was an in sifu measurement, no random errors due to specimen changing, spectrometer and environmental chamber conditions, and optical alignments were introduced in the measurement. Thus, any changes in the spectra were a direct result of water entering the asphaltlaggregate specimen. Further, because asphalt was directly applied to the IRE, errors resulting from variations in contact between the asphalt and the IRE were avoided.
TO translate FTIR information to the amount and thickness of the water layer at the asphaltlaggregate interface, an FTIR-MIR intensity-concentration calibration curve for water was established and the amount of water absorbed in the asphalt was determined. The calibration curve was established by an FTIR-MIR analysis of water at eight different concentrations in D20. The amount of water absorbed in the asphalt was determined using the gravimetric method and 63-pm asphalt films on thin aluminum plates. The asphalt-coated aluminum plates (three replicates for each asphalt) were immersed in distilled water, taken out, blotted, and weighed at desired intervals up to 310 hours; the amount of water gained was expressed in percent by mass of the original asphalt. Complete experimental details are given in Reference 6
RESULTS
Figure 2 shows typical mIR-MIR difference spectra of an asphaltkiliceous aggregate specimen exposed to water at different times. The intensities of the water bands (e.g. OH stretching near 3400 cm-') increased while those of the asphalt bands (e.g. CH band at 2922 cm-') decreased,
1467

as a function of time of exposure. (The water bands were verified by the FTIR-MIR spectrum of the liquid water in contact with the asphalt-free siliceous aggregate.) The intensity-time plots of water (e.g. Figure 3) revealed that the increases and decreases were rapid initially, then slowed down. These results indicated that the technique is effective for detecting in siru water taken up by an asphalt-coated siliceous aggregate system. The effects of water on the asphalt- coated siliceous aggregate were different for the five asphalts. The intensities of the water bands of the AAD-1 asphalt increased substantially over the first 45 hours then levelled off, while those of the other asphalts increased more slowly (than AAD-1) but continued to increase even after much longer times.
The water detected in the asphaltlaggregate specimen was the sum of water absorbed in the asphalt within the FTIR-MIR probing depth and of the water at the asphaluaggregate interface. This may be expressed mathematically as:
CJt) = A(t)[l-x] + x
4(t) = 0.243 - 0 .018~ x = l(t)/d&,(t)
I11 t21 [31
where dp(t), in pm, is the penetration depth of the evanescent wave in the samples as a function of exposure time, t; 4 was calculated based on the internal reflection spectroscopy as presented in detail in References 4 and 6 for polymer/substrate and asphaltlsiliceous aggregate systems, respectively. C,(t) is the mass fraction of water within 4; this quantity was derived from the results in Figure 3 and the calibration curve. A(t) is the mass fraction of water absorbed in the asphalts within d, thickness as a function of time; A(t) was determined from the water absorption experiment. x is the thickness fraction of 4 occupied by the water layer at the asphaluaggregate interface and I(t), in pm, is the thickness of the water layer at the asphaltlaggregate interface as a function of time. Equation 3 accounts for the change of 4 due to a replacement of asphalt (4 = 0.243 pm) by water (4 = 0.225 pm) during exposure.
Equations 1, 2, and 3 allowed the calculation of the amount and thickness of the water layer at the asphaldmodel aggregate interface. A computer spreadsheet was designed to obtain the thickness, 1(t), of the water layer at the asphaltlsiliceous aggregate interface. The results are presented in Figure 4 for five SHRP asphalts. The thickness values were calculated assuming that water was uniformly distributed on the entire surface area of the specimen. The mass of water at the asphalvaggregate interface was determined by multiplying the thickness by the surface area within the chamber walls (329 mm2) and by a water density of 1 Mglm’. Alternatively, the mass can be determined first, then converted to a thickness value. The results showed that the thickness of the water layer at the asphaltlmodel aggregate interface varied with exposure times and with the asphalt types. For example, after 50 hours immersion, AAD-1 had a 85 nm-thick water layer, while AAC-1, AAG-I, AAK-1, and AAM-1 had thicknesses ranging from 20 to 28 nm after the same period. The thickness of the water layer of AAD-1 reached a plateau value after 50 hours, but that of the other asphalts continued to increase for some time.
1468

CONCLUSIONS
A sensitive technique for measuring water in situ at the asphalVmode1 siliceous aggregate interface has been developed. The technique can detect and also quantify the water at the asphaWsiliceous aggregate interface. The technique will be valuable for understanding the water susceptibility of asphalusiliceous aggregate mixtures. The technique is unique in providing information on the transport of liquid water through an asphalt layer of any thickness attached to an aggregate (6). Such information should be useful for predicting the performance of asphalt and asphaluaggregate mixtures in service. The technique should therefore be useful for predicting water susceptibility and studying the effects of the aggregate, contamination of the aggregate, antistripping agents, and the asphalt on the water susceptibility of asphalusiliceous aggregate mixtures. Further, the technique should be useful for measuring organic or inorganic materials, such as oil, lime, etc., in situ at the asphalvaggregate interface. Similarly, it may also be useful for measuring the transport properties of water, organic, and inorganic materials through a layer of asphaluaggregate mixture or concrete on a substrate. It is anticipated that the technique will have a wide range of applications in highway technology.
ACKNOWLEDGEMENTS
The research described herein was supported by the Innovations Deserving Exploratory Analysis (IDEA) Program of the Strategic Highway Research Program (SHRP), a unit of the National Research Council.
REFERENCES
1.
2
3.
P. Hubbard, Adhesion of Asphalt to Aggregate in the Presence of Water, Proceedings, Highway Research Board, 1938, Vol. 18, Part I, p. 238. T. Nguyen, E. Byrd, and C. Lin, A Spectroscopic Technique for In Situ Measurements of Water at the Coating/Metal Interface, J. Adhesion Sci. Techno]., 5, 697 (1991). T. Nguyen, E. Byrd, C. Lin, and D. Bentz, A Novel Technique for Measurement of Water at the Interface between a Metal and an Opaque Polymeric Film, Advanced Composite Materials, 19, 1051 (1991). T. Nguyen, E. Byrd, and D. Bentz, Quantifying Water at the Coating/Substrate Interface, Proc. Am. Chem. Soc., Polymeric Materials Sci. Eng., Vol. 66, p. 414, 1992. N. J. Hanick, Internal Reflection Spectroscopy, Harrick Scientific Corporation, N. Y., 2nd ed., 1979. T. Nguyen, E. Byrd, D. Bentz, and J. Seiler, Development of a Technique for In Si& Measurement of Water at the AsphalVModel Siliceous Aggregate Interface, National Institute of Standards and Technology NISTIR No 4783, April 1992.
4.
5.
6.
1469

MIR element holder Silicone adhesive
Water chamber
50x10 mm Si element
element holder
Figure 1
0.16
0.12
0.08
9 0.04
4 0.00
-0.04
-o.oe 4
Specimen configuration and experimental setup for in situ measurement of water at the asphaltlsiliceous aggregate interface.
Arphall Bands 2921
1 3500 3000 2500 2000 1500
Wovenumber (cm- 1)
Figure 2. Typical FTIR-MIR difference spectra (water exposed - unexposed) of an asphaltlsiliceous aggregate specimen for different exposure times in water.
1470

/.*/-*---
... .+” -E
...e .“- ... -- 2.
-
I I I ! I I I
0.08 1 AAM-l -I a, 0 6 0.06 + 2 0.04
0.02
0.00
13 Q
Exposure time in water (hours)
Figure 3. A typical water OH stretching intensity/time plot of an asphalt/siIiceous aggregate specimen exposure to water. (Each dot represents one data point.)
..--.
AAC-1 0 AAD-1 - AAG-1
AAK-1 * AAM-1
0 25 50 75 100 125 150 175 200 225 Time (hour)
Figure 4. Thickness of the water layer at the asphaltlsiliceous aggregate interface for five SHRP asphalts.
1471
ASPHALT-AGGREGATE INTERACTIONS AND MECHANISMS FOR WATER STRIPPING
&f. E. Labih, David Sarnoff Research Center, Princeton, NJ 08540
Keywords asphalt-aggregate; donor-acceptor; water stripping
AasTRAcT The surface chemical properties of four types of aggregates were measured by electrokinetic and spectroscopic techniques. The isoelectric points of aggregates ranged from 2.3 for granites to 9.3 for limestones. Zeta potential - pH curves were measured for four types of asphalts where the isoelectric points depended on the origin of the crude. Interaction diagrams between several aggregate and asphalt types were constructed and used to predict the extent of aggregate-asphalt adhesion. The contribution of electron donor-acceptor interaction to adhesion will be discussed. The reaction of water soluble ions leaching out from the aggregate surface with the carboxylic acids of asphalts is a major variable affecting adhesion and water stripping in pavements. Surface complexation of aggregate with asphalt species and the dissolution kinetics of such complexes are viewed as an important mechanisms for water stripping.
INTRODUCTION
The strength of the adhesion bond between aggregates and asphalts determines the performance of pavement. For acceptable performance, this adhesion bond must withstand the presence of water for prolonged periods of time. Pavement failure a t the aggregate-asphalt interface due to water is termed "water stripping." The donor-acceptor interactions between aggregate and asphalt surfaces determine the extent of their adhesion in pavement. The effect of water on the aggregate-asphalt chemical bonding is expected to influence the water stripping performance.
For solid surfaces such as aggregates, the donor-acceptor surface properties may be divided into proton and electron transfer contributions [l]. Proton transfer surface properties are normally estimated from electrokinetic properties as a function of pH [21. Electron transfer properties are determined by measuring the zeta potential of the solid particles in nonaqueous liquids of known donor or acceptor properties [2,3].
For asphalts, the proton transfer donor-acceptor surface properties can be determined from electrokinetic measurements of their emulsions as a function of pH. A technique was developed to prepare a stable asphalt emulsion that does not alter the intrinsic surface properties of the asphalt [41. The electron transfer donor-acceptor properties were measured by FTIR techniques. This was done by measuring the frequency shift of the carbonyl mode in the presence of probe solvents. The above technique was developed for polymer matrices to predict their adhesion properties and performance in composites 151.
In this paper, we describe how the surface chemistry of aggregates and asphalts determines the propensity of interaction - which in turn dictates the extent of their
1412

adhesion. The stability of aggregate-asphalt chemical bonding in the presence of water is discussed on the basis of detailed knowledge of surface chemistry. Mechanisms for water stripping are proposed. The results of this research demonstrate that knowledge of aggregate and asphalt surface properties is needed to construct pavement with better performance and service life.
EXPERIMENTAL PROCEDURES
Materials: Tables I and I1 summarize the properties of several types of aggregates and asphalts, respectively. The aggregates range from granites to limestones - which cover a wide range of donor-acceptor (acid-base) properties. The asphalts represent the main types and were recommended by the Strategic Highway Research Program (SHRP).
Procedures: The zeta potential of aggregates was measured by the acoustophoresis technique using the Pen Kem System-7000. The nonaqueous zeta potential of aggregate particles was calculated from mobility values measured by the Doppler-shift electrophoresis technique using the Malvern Zetasizer 11. Details of the experimental techniques are described elsewhere [2,31. The zeta potential of aqueous asphalt emulsions was measured by the Doppler-shift electrophoresis technique. The emulsion was stabilized with a peroxide-free nonionic surfactant [41. The frequency shift of asphalt carbonyl mode due to probe solvents was measured by FTIR using the procedure developed by Fowkes et a1 [51. Energy scale conversions were made according to Gutmann [61, Labib and Williams [2] and Fowkes et al [7].
RESULTS AND DISCUSSION
The results and discussion of this work are presented in several sections. Proton and electron transfer donor -acceptor surface properties of aggregates and asphalts are presented in section I and 11. Development of the interaction diagrams of some aggregate-asphalt pairs is given in section 111. The last section N discusses mechanisms of water stripping in pavement.
L Proton and Electron Transfer Surface Chemistry of Aggregates
1. Proton Transfer Properties of Aggregates and Asphalts: The acid-base properties of aggregates were measured by the electrophoresis technique and expressed as zeta potential - pH curves. Figure 1 shows the electrokinetic properties of the four aggregate types defined in Table I. The isoelectric points ranged from 2.3 for quartz-based granite to 9.3 for calcite-based limestone. Apparently the two limestones RC and RD have different surface compositions, as indicated by their isoelectric points.
An important property of the aggregate surface is its stability towards dissolution in water. Table I11 summarizes the pH and specific conductivity of various aggregates after several soaking cycles. The results indicate that the surface of aggregates slowly dissolves upon exposure to water and that the pH of the medium near the interface is basic (pH >10.0). This was the case for all aggregate types including the quartz-based RJ. This finding is important to the
1413

understanding of the pH conditions present a t the aggregate-asphalt interface under wet conditions.
2. Electron Transfer Surface Chemistry of Aggregates: Figure 2 presents the donor-acceptor surface properties of the four types of aggregates. This diagram was constructed from the zeta potential - donicity results of the aggregates in organic solvents, as described by Labib et a1 [3]. The energy scale used in Figure 2 is based on converting the Gutmann acceptor number to an energy scale using the results of Fowkes et al [7]. The RJ granite exhibited strong acceptor properties while the RD limestone was the strongest donor aggregate. Clay aggregate (RL) has both donor and acceptor surface sites.
IL h t o n and Electron Transfer Donor-Acceptor Surface Properties of Asphalts
1. Proton Transfer Properties ofAsphalts: Figure 3 presents the zeta potential - pH curves for the four asphalts described in Table 11. The measurements were made using a n asphalt emulsion stabilized with peroxide-free nonionic surfactant. The asphalts had acid isoelectric points with the exception of non- marine origin AAG which was amphoteric. The results indicate that the surface charge of the asphalts is mainly due to carboxyl functionalities. There is evidence of hydroxyl group contribution to the surface chemistry of asphalts as evidenced by the increase in zeta potential a t pH 9 . 0 .
2. Electron Transfer Surface Properties ofhphalts: In the present context, the asphalt was treated as the matrix component of the pavement composite. The electron donor-acceptor properties are determined from the frequency shift of the carbonyl mode of asphalt solutions i n probe solvents. The frequency shifts of asphalts carbonyl mode due to chloroform referenced to a cast film and to an asphalt solution in toluene are summarized in Table IV. A higher frequency shift in chloroform indicates stronger base properties of carbonyl functions of asphalts. Data for PMMA and polycarbonate are listed for comparison. It should be noted that the results of Table IV are of oxidized asphalts. We found oxidation to be essential to formation the electron donor groups in asphalts at reasonable concentration.
III. Interaction Diagrams Based on Proton Transfer Surface properties:
1. Examples of Proton Transfer Interaction Diagrams:
a Interaction of a Granite Aggregate with Asphalts:: Figure 4 is an interaction diagram for quartz-based RJ granite and four asphalt types. The figure shows that the surfaces of the aggregate and asphalt are both negatively charged at pH >3.0. This indicates that under dry conditions (pH 7.0), the propensity of adhesion between asphalt and aggregate is low. At pH 10.0, such as that encountered in the presence of water (Table 111). the surfaces of aggregate and asphalt are strongly negative. This is expected t o lead to repulsion and therefore water stripping. In actual performance evaluations, RJ was found to be a "stripper" with most asphalt types. The main source of adhesion expected in this case is due to electron transfer donor-acceptor interaction between acceptor sites on the granite and electron donor groups of asphalts.
1474
F

b. Znteraction of a Limestone Aggregate with Asphalts: Figure 5 is an interaction diagram for calcite-baded RD limestone and four asphalt types. In this case, the surfaces of asphalt and aggregates have opposite polarities a t pH 7.0 (proposed condition for the dry state). The interaction in the presence of water a t pH 10.0 is small or zero. In actual performance tests, the RD limestone has been found to be a good performer with respect to water stripping. Similar interaction diagrams can be constructed with the different aggregate- asphalt pairs. valuable in predicting the performance of several asphalt -aggregate pairs.
2. Electron Transfer Donor-Acceptor Contribution to Asphalt-Aggregate Adhesion:
The contribution of electron transfer donor-acceptor interaction between aggregates and asphalts is viewed to be essential to their adhesion in some cases. Asphalts, especially after initial oxidation, have been found t o contain aprotic electron donor groups such as carbonyl, sulfoxide, ether and lactone. The interaction of these donor groups is likely to take place with aggregate surfaces having acceptor properties. The bonding of asphalts with granite (RJ) and clay (RL) aggregates may be due in major part to the electron donor-acceptor interaction. The oxidation of asphalt surface is essential to the development of the above aprotic donor groups which in turn controls the bonding with aggregates. The donor-acceptor character of aggregates (Figure 2) and the frequency shift data of asphalts (Table IV) provide guidelines for predicting the extent of this contribution to bonding.
IV. Mechanisms of Water Stripping:
Water stripping in asphalt pavement results from the failure of the asphalt- aggregate adhesion bond due to the presence of water. The location of this failure (in the interface region) is crucial t o understanding the mechanisms of water stripping. The following is a list of major mechanisms that are expected to lead to water stripping:
1. Weak Adhesion Bond - Lack of Bonding Sites on Aggregate Surface: The adhesion bond may be weak due to the lack of intrinsic chemical interaction between the aggregate and asphalt - as described for the case of granite (RJ) and asphalts. The remaining electron donor-acceptor bonding between aggregate and asphalt can be weakened or even reversed by water. This is a known failure mechanism in other material systems [81. 2. Naturally Emulsifiable Asphalt Leading to Unstable Adhesion: Due to their composition or balance of constituents, some asphalts are unstable in water and tend to form stable emulsions. This was the case for AAG which was amphoteric in character. This asphalt type is expected to form unstable interface with aggregates in the presence of water. This has been found to cause water stripping P I . 3 Soluble Cations Forming Displaceable Soap at Aggregate-Asphalt Interface: Most aggregates contain a large concentration of soluble ions that are leachable in water (Table 111). These ions are known to form soaps (with asphalt caboxylic acids) a t asphalt-aggregate interface. These soaps are displaceable and can cause
This technique was found to be
\
1475

water stripping. Evidence is present to support better performance of experimental pavements made with thoroughly washed and dried aggregates [91. 4. Aggregates with Weak Boundary Layers: It has been demonstrated by Podoll [lo] that the location of failure of some asphalt-aggregate pairs occurs in the aggregate side of the bond. The responsible weak boundary layer may be intrinsic to the aggregate or can be developed by surface complexatioddissolution, as described below. 5. Dissolution of Aggregate-Asphalt Surface Complexes: The exterior surface layers of aggregate may be weakened due to the formation of complexes between the aggregate surface sites and asphalt surface groups. These complexes are known to dissociate and dissolve from the aggregate surface. These concepts are developed by Stumm and are recognized in the literature [11,12].
For different asphalt-aggregate pairs, a combination of mechanisms may explain differences in pavement performance. The results of this work would guide us in selecting proper aggregates and asphalts for various climatic regions and in the design of adhesion promoters and anti-stripping agents, when necessary.
ACKNOWLEDGMENT:
The support of the Strategic Highway Research Program is gratefully acknowledged. The Author would to acknowledge the assistance of P.J. Zanzucchi for the FTIR work and other Sarnoff Staff who made this work complete. The author would also like to express gratitude to Dr. J. F. Branthaver of WRI for his valuable discussions, especially with respect to the geochemical aspects of this work.
REFEXENCES
Labib, M.E., "The Origin of Surface Charge of Particles Suspended in Organic Liquids," Colloids and Surfaces, 29, 293 (1988). Labib. M.E., et al.,"An Experimental Comparison Between the Aqueous pH Scale and the Electron Donicity Scale," Colloid & Polymer Science, 264,533 (1986). Labib, M.E., et al., "The Use of Zeta Potential in Organic Solvents to Determine The Donor-Acceptor Properties of Solid Surfaces." J. Colloid Interface Science, 97,356 (1984). Labib, M.E., in Preparation. Fowkes, F.M. et al., "Acid-Base Complexes of Polymers," J. Polymer Science, 22,547 (1984). Gutmann, V., "The Donor-Acceptor Approach to Molecular Interactions," Plenum Press, New York (1878). Fowkes, F.M., et al., "Spectral Shifts in Acid-Base Chemistry. 1. Van der Waals Contributions to Acceptor Numbers," J. Am. Chem, SOC., 112, 3259 (1990). Labib, et al., "The Effect of Moisture on the Charge at the interface Between Solids and Organic Liquids," J. Colloid Interface Science, 115, 330 (1987). Ensley, K., and H. Plancher of WRI, Private Communication (1991). Podoll, R.T., et al., SHRP Final Report (1991). Stumm, W., et al., "The Role of Surface Coordination in Precipitation and Dissolution of Mineral Phases," Croatica Chemica Acta, 56, 593 (1983).
1476

5 I '
Silicon Dioxide Aluminum Odds Resrric Oxida Calcium Odds Magmedurn Oxide Sulfur Triodds Sodium Odds Potauium Oxide Titanium Odds Phosphorus Pantadds Mangnnic Oxida Loor on Ignition
TABLE I
63,s 61.73 11.79 1460 696 l.%S +M 3.77 0.96 6.09 a m 35.05 1.62 a43 11.16 0.lO 015 0.46 1.m 0.48 0 2 931 1.u 0.51 0.u 088 016
011 0.02 4.01 0.l3 0.04 0.03 3.54 1329 37.64
ASPHALT ORIGINS AND PROPERllES
14.84 1.46 0.89
11.43 0.34 0.08 2.00 021
4.01 0.08 3.64
3.n
Sample. NRL coda AAA-1 AAD-1 AAO-2 AAG-1 A 1 0 2 AAW-l AAU.2 Crude (OrqhJ L l & l l u w ~ ~ " w ; - -
3 Componsnl AMIysIa, X
Asphaltsnes. (n-heptane) 183, 23 213 58 514 3 9 4 0
Polar Aromattcs 373 4 1 3 4 0 1 512 510: 503 500 Napthens ArOmalICs 318, 251 267 3 2 5 353, 419 413
ASphaltenoa, (Iso-octane) 34, 3 4 3 3 4
?!!!!2!=?, . -. -- .."* "1 .--- 1 0 6 8 6 1 0 0 8 5 6 Elements1 Analysls c x 8421 81 6 85 6 86 8
QU Nltrogsn. X s u w x - - --I_-.- VIs~osIty, Prlor to Oxldatlon 8641 1055 600; 1862 VIacoslty, Alter Oxldatlon 19011 3420 1715i 3253
P."? -_ - ' . I__ I_ 22. 3216A...1?.
n. x 1 0 1 108 f 105 1 1 1 2 061 0 9 1 1 0 5 o s ! 09 0 9 1 1 1 1 1 9 0 8 0 5 73: 8%- 83: 13 2 9 I 2 1.9
lor 14OF. POIM
1417

1 hr. soak
cycle U 1 br. soak
cycle Ill 1 br. soak
cycle N l b . soak
12 lUS. s o d
RT -2-
9.6 n
0.4 41
9.3 37
9.5 33
9.3 36
m Dn 1lsCDJ-
95 113
9.4 m
9.4 61
9.6 U
9.4 56
8.1 56
0.1 46
9.1 45
9.5 42
w nHJ-
9.1 l25
0 2 m
93 49
9.5 .M
95 .a
* SLUNUES CONSEXSU OF 4 cnus OF c n o w AGGREGATES m 26 ML OF WATER
TABLE N
SHIFT OF THE CAFU3ONn MODE, cm.1 DUE TO THE LEWIS ACID, CHLOROFORM
Oxidized Reference Reference SHRP Material Material Samule Cast Film in Toluene
AAA- 1 -1.8 AAD- 1 -3.0 AAG-1 -2.3 AAM-1 -3.7 PMMA -2.4 PCarb* -4.5
-9.0 -8.5 -6.4 -7.1 -5.5
PCarb*, poly(carbonate), a reference material for study.
1478

FIGURE 1
I Electron Acceptor
Electrophoretic Mobility - pH Curve for Core Aggregate
R J
1-1 5 .OO E- IO
Electron Acceptor
- B.00E-lO 12.0 2.00
PH
RL
FIGURE 2
The Donor-Acceptor CharuCtel of the Four Core AggreKates. The9 are Arranged Top-to-Bottom Accordlog to their Relative Strength. a8 Judged by the Values of Zeta Potential i n Va~1ou8 Liquids of the DOniclty series.
Electron Acceptor R G
- - - - - - - R D Electron
lcceatar ~/,E!~t!o!Don,? //A Acceptor _ _ _ _ _ _ - Donicity
_.__ Number Kcal/mol ;O 20 10 0 10 20 30 40 50 6b WcaJ/mo’
1419
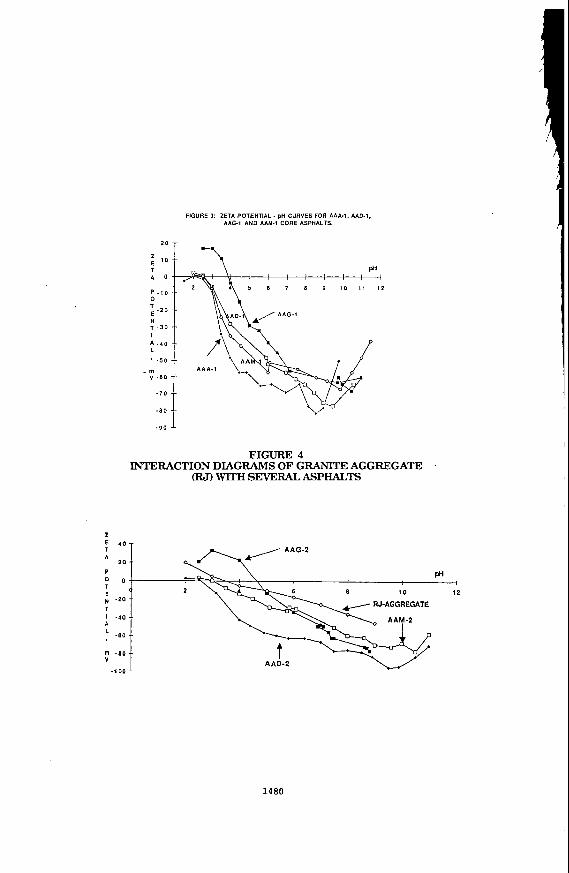
FIGURE 3 ZETA POTENTIAL. pH CURVES FOR AAA.1. AAD-1, AAG-I AND AAM.1 CORE ASPHALTS.
E 4 0 -
A 20
P
E ‘
T I .40 A
0 o T ,
H - 2 0
- 0 0
m - 8 0 V
- 1 0 0
- 7 0 +
-.
--
--
.-
-.
--
-
- 9 0 - 6 0 i FIGURE 4
INTERACTION DIAGRAMS OF GRANITE AGGREGATE (RJl WITH SEVERAL ASPHALTS
---1
12
1480

FIGURE 5 INTERACTION DIAGRAMS OF LIMESTONE AGGREGATE
(RD)rnsEvERALAsPHACTs
2 60 E T 4 0 A
20
P o 6 7 8 N - 2 0 T I .b0 A L - 6 0
.a0
-100 V
1481
EFFECT OF AGGREGATE MODIFICATION BY ORGANOSILANE COUPLING , AGENTS ON THE ADSORPTION BEHAVIOR OF ASPHALT MODELS AND ASPHALT
Lynn M. Perry and Christine W. Curtis Chemical Engineering Department
Auburn University, AL 36849-5127
ABSTRACT
The effect of modifying aggregate surfaces by organosilane coupling agents on the adsorption and desorption behavior of asphalt models and asphalt was investigated. The organosilane coupling agents used were hydrocarbon silane of Cs chain length, thiol silane, and amino silane. These agents were coupled to aggregates composed of limestone and gravel. The adsorption and desorption behaviors of asphalt models and asphalt were determined on treated aggregates and compared to their behaviors on untreated aggregate. The amount of bonding enhancement of the treated versus the untreated aggregate, which is a measure of the com- parative resistivity of the asphalt-aggregate interfacial bond to water, caused by treating aggregate with organosilane agents was determined. Highly specific interactions were observed between pairs of asphalt models or asphalts and the organosilane treated aggregate. The highly specific behavior was dependent upon the chemistry of the model or asphalt as well as the chemistry of the silane coupling agent.
INTRODUCTION
Asphalt-aggregate interfacial interactions are important in the adhesion of asphalt to aggregate. At the interface, the first layer of asphalt must adhere to the aggregate for the adhe- sive binding action to occur that is required to maintain an asphalt pavement. This adhesive binding must hold through all the stresses that are applied to the asphalt pavement. These stresses include the effect of traffic, changes in daily and seasonal temperature, and the attriting force of water. All of these stresses attack the adhesive forces that hold the asphalt to the aggre- gate and, hence, the pavement together. These forces include the cohesive forces within the asphalt cement and within the aggregate in addition to the adhesive forces between asphalt and aggregate.
Organosilanes have been used to pretreat aggregate to promote water resistivity between the asphalt and the silane treated aggregate. Divito et al. (1982) compared the efficacy of one organosilane agent and two commercial amine antistripping agents for increasing the water resistivity of three aggregates from different sources. Silane treatment of aggregates showed increased water resistivity at the adhesive bond compared to aggregate treatment with two amine antistripping agents. Graf (1986) showed that diaminosilane produced increased hydrophobic bonding between crushed glass and asphalts. Hence, from this background, the present study for evaluating the potential of organosilane compounds for enhanced, durable bonding was undertaken.
The research presented is focused upon modifying aggregate in order to enhance adhesion between asphalt and aggregate. Aggregates were modified by using organosilane coupling agents with different chemical functional groups, hydrocarbon of C, chain length, thiol and amino groups. These silane functional groups were chosen as modifers for aggregates composed of
1482

granite, limestone, and gravel to increase wetting of the aggregate surface, promote adhesion, and resist water. To evaluate the effect of the surface coupled organosilane agent, the adsorption and desorption behaviors of asphalt models and asphalts were measured on the silane-treated aggregate. The adsorption behavior was measured by adsorbing the asphalt models and asphalt from organic solution and developing an isotherm of their behavior. The desorption behavior was determined by adding water at adsorption equilibrium to the asphalt model or asphalt-aggre- gate system. The amount of bonding enhancement between the asphalt model or asphalt and the silane-treated versus the untreated aggregate provided a measure of the comparative resistivity to water rendered by treating the aggregate with organosilane coupling agents.
EXPERIMENTAL
Materials. The asphalt model compounds used for this study were benzoic acid, 1- naphthol, phenanthridine, and phenylsulfoxide, all of which were obtained from Aldrich with purities of 99+%. The asphalts (AAD-1, AAK-1, and AAM-1) used were obtained from the Strategic Highway Research Program’s (SHRP) Material Reference Library (MRL). These asphalts came from different sources and were different viscosity grades.
Preparation of Organosilane Aggregate. Three aggregates, obtained from the SHRP MRL, were used for this study: RC-limestone, RJ-gravel, and RL-gravel. The aggregates, sized to -40+80 mesh, were contacted with 100 ml of I % , by volume, silane solution for three minutes, filtered, and dried in a vacuum oven at 70°C for 48 hours. The solvent used for the hydrocarbon silane solution was 95 %/5 % ethanollwater while the thiol silane was prepared using water adjusted to a pH of 4.5. The amino silane was prepared as a water stable solution by the manufacturer, HULS.
Adsorption and Desorption Experiments. The adsorption of the asphalt models onto the aggregate was performed by adding varying amounts of aggregate, ranging from 1 to IO g, into 20 ml of cyclohexane solutions containing 100 mgll of asphalt model. The samples were agitated for one hour using an orbital shaker and then allowed to settle overnight. Agitation was repeated the next day, followed by one hour of settling. The solution was filtered through a 0.22 pm filter and was analyzed by UV-visible spectroscopy at the wavelength of maximum absorbance of the model compound (Curtis et al., 1991). The adsorption of the asphalt was performed in the same manner except that asphalt solutions, 100 ppm, were prepared in toluene and analyzed at 450 nm.
The desorption experiments for both the asphalt models and the asphalts were conducted similarly. Water introduced at an equivalent volume to the solvent was added into the system after the adsorption step was completed; the amount desorbed was monitored after 48 hours. Both the organic and aqueous phases were monitored for the desorbed material. Increases in the amount of model component or asphalt present in the solvent after the desorption equilibrium had been established were reported as the amount of material desorbed.
The concentrations of the asphalt model or asphalt present in solution after adsorption and desorption were monitored by UV-visible spectroscopy and the amount of model or asphalt adsorbed or the amount of either desorbed was calculated. Adsorption isotherms were developed for asphalt models in combination with silane treated aggregates and natural aggregates. The resulting data were treated by Langmuir analyses and by averaging experimental results on two points of the isotherm data. The relative rankings of both treatments of data for amounts of material adsorbed onto aggregate surface were nearly identical. Thus, all data for the
1483

investigations reported herein, asphalt models and asphalts combined with silane-treated and untreated aggretages, are reported using the experimental average of data obtained from the adsorption isotherms. Surface amounts of material adsorbed were calculated for each system. Desorption experiments were performed at a selected point on the isotherms; the amount desorbed was compared to that of corresponding asphalt model- or asphalt-aggregate systems comprised of natural aggregate.
RESULTS AND DISCUSSION
Adsorption and Desorption of Asphalt Model Compounds on Organosilane Treated Aggregates. Asphalt model compounds of benzoic acid, I-naphthol, phenanthridine and phenylsulfoxide were adsorbed from cyclohexane solution onto silane-treated and natural aggregates. The mass of asphalt model adsorbed onto all aggregates was determined by UV- visible spectroscopy at a wavelength of maximum absorbance for the adsorbing asphalt model (Curtis et al., 1991). The amount of each specific asphalt model adsorbed onto the silane-treated aggregates was compared to the amount adsorbed on the natural aggregate and has been reported in Table I. Positive signs indicate adsorbed masses increased with organosilane treatment while negative signs indicate adsorption of the asphalt model occurred to a greater extent on the natural aggregate, and thus, indicating organosilane treatment did not increase bonding between asphalt model and aggregate, Water was added to the adsorption system at equilibrium to determine the extent of debonding of asphalt model. The mass of asphalt model adsorbed was determined at adsorption equilibrium, and after desorption equilibrium was attained. The difference in amount of asphalt model adsorbed prior to water addition and after desorption equilibrium is reported as hydrophobic bonding enhancement i n Table 11. Positive signs on Table 11 indicate enhanced hydrophobic bonding as a consequence of organosilane treatment while negative signs indicate decreased hydrophobic bonding with organosilane treatment.
Adsorption of Asphalt Models. Adsorption behaviors were observed to be specific for the different combinations of silane coupling agent, the asphalt model compound, and the aggregate examined. Three organosilane agents, hydrocarbon, thiol, and amino, were used to treat the surface of three selected aggregates, one limestone and two gravels, that are commonly used in road pavements. The adsorption behavior of organic compounds, containing functional groups that are representative of those i n asphalt, on silane-treated aggregates was compared to the adsorption behavior of the same organic compound on natural aggregate. This comparison has been reported in Table I as percent change in adsorption amount for each asphalt model/treated aggregate combination.
Few silane-treated aggregate/asphalt model combinations showed increased adsorption of asphalt models in comparison to adsorption amounts produced on the natural aggregate. Adsorption masses of benzoic acid and phenanthridine on hydrocarbon-treated RC-limestone increased to 20-34% with approximate error of k 10%. Thiol-treated RC-limestone exhibited an increase in adsorption amount of benzoic acid, 25%* 13%, compared to its adsorption on the natural aggregate. Additionally, increased adsorption, 32 % +23%, of phenanthridine was observed for thiol-treated RC-limestone. Adsorption amounts for all other combinations of asphalt models and all silane-treated aggregates showed no change or decreased adsorption amounts compared to adsorption on the natural aggregate.
Most thiol treatments of RC-limestone and RJ-gravel resulted in greater decreases in adsorption amounts of phenysulfoxide, 1-naphthol, and phenanthridine, by nearly a factor of 2,
1484

than those observed for these same models on thiol-treated RL-gravel. Amino-treated RJ-gravel and RL-gravel yielded large decreases, greater than 50%, in adsorbed amounts of all models, except for benzoic acid. Phenylsulfoxide presented little or no change in adsorption mass with hydrocarbon-treated RC-limestone, hydrocarbon-treated RL-gravel, and thiol-treated RL-gravel. Additionally, benzoic acid showed little or no change i n adsorption mass for hydrocarbon-treated RL-gravel, thiol-treated RJ-gravel, and amino-treated RC-limestone.
For most of the systems, the propagated error associated with increases or decreases in adsorption mass of asphalt models for treated aggregates was dominated by the aggregate rather than the asphalt model or the silane treatment. This suggests that the chemical composition of the aggregate is the dominant factor for adhesion and subsequent durabilitiy for asphalt road pavements. Propagated error associated with organosilane treated RC-limestone adsorption masses of asphalt models were roughly 10%. Propagated error for treated RL-gravel ranged from 10-30%, and for RJ-gravel ranged from 20-48%.
Desorption and Bonding Enhancements. The desorption amounts of asphalt models from the silane-treated aggregates were system specific with the type of silane coupling agent and aggregate being influential in the desorption behavior. Silane treatments of nearly all aggregates resulted in enhanced hydrophobic bonding, i.e., less desorption of the asphalt models with the silane-treated aggregate than with the natural aggregates. Most of the treated aggregates retained more of the adsorbed model compounds in the presence of water, thus, indicating more durable bonding with less sensitivity to water. Hence, desorption percents were observed to be less with silane-treated aggregates than those observed for the natural aggregates.
A few combinations of asphalt models and silane-treated aggregates showed that silane treatments yielded no advantage i n hydrophobic bonding. All silane treatments of RC-limestone in combination with I-naphthol exhibited no change in hydrophobic bonding as compared to natural aggregates. Lack of change in hydrophobic bonding was also observed for all organosilane treatments of RJ-gravel in combination with phenylsulfoxide. Thiol-treated RC- limestone combined with phenylsulfoxide and thiol-treated RL-gravel combined with phenanthridine or benzoic acid indicated little or no change in percent desorptions with silane treatment as compared to those obtained for the same systems in combination with natural aggregates. Amino treatment of RC-limestone aggregate was especially deleterious for hydrophobic bonding of 1-naphthol which suggested that pairing asphalts with high phenolic content with amino-treated RC-limestone should be avoided.
Adsorption and Desorption of Asphalt on Organosilnne Treated Aggregates. The SHRP MRL asphalts AAD-1, AAK-1, and AAM-1 were adsorbed from toluene solution onto silane treated and natural aggpgates, RC-limestone, RJ-gravel, and RL-gravel. Changes in the amount of asphalt adsorbed on treated aggregates were monitored at 450 nm and compared to asphalt adsorbed onto natural aggregates as reported in Table I. At adsorption equilibrium, water was added 10 the system to determine the sensitivity of the adhesive bond to water. Any debonding of adsorbed asphalt from the silane-treated aggregates was compared to that observed for natural aggregates and reported as percent bonding enhancement. The bonding enhancement for the silane-treated aggregate for retaining adsorbed asphalt in the presence of water is given as a comparison of the percent desorbed from the silane-treated aggregate to the percent desorbed from the natural aggregate as reported in Table 11. Whenever the percent desorbed was greater for the natural aggregate than for the silane-treated aggregate, bonding enhancement occurred as indicated by the positive sign in Table 11.
1485

I Adsorption of Asphalt on Organosilane Treated Aggregates. Hydrocarbon treatment of
RC-limestone, RJ-gravel, and RL-gravel resulted in increased adsorption mass for only one combination, hydrocarbon-treated RJ-gravellAAK- 1 asphalt, 50% *20%. All other combinations of hydrocarbon-treated RC-limestone and hydrocarbon-treated RJ-gravel presented virtually no change in adsorption mass of AAD-I and AAM-1 asphalts as compared to those observed for the natural aggregates. Decreases in adsorption masses were observed for hydrocarbon-treated RL-gravel in combination with AAD-1 and AAM-I asphalts.
Thiol-treated RC-limestone yielded little or no increase in adsorption mass for the three asphalts tested. Significant decreases, 60%*12-18%, in adsorption mass of AAM-1 asphalt on thiol-treated RJ-gravel and thiol-treated RL-gravel were observed. AAD-I asphalt also showed decreased, 28-38%&12%, adsorption mass. for these Same two thiol-treated aggregates. In contrast, a substantial increase in adsorption mass, 186%*43%, was observed for AAK-1 asphalt on thiol-treated RJ-gravel.
Amino treatment of RC-limestone and RL-gravel produced no change in adsorption mass of AAD-1 asphalt. No changes were observed in adsorption mass of AAK-1 asphalt on amino- treated RC-limestone or for AAM-I asphalt mass on amino-treated RL-gravel in comparsion to the adsorption mass obtained on the natural aggregates. Increased, 58-87% *41-48%, adsorption masses were noted for AAK-1 asphalt on both amino-treated gravels, while decreased, 27- 68% *6-44%, respectively, adsorption masses were observed for the amino-treated RC-limestone and RJ-gravel aggregates.
In terms of increased adsorption of asphalt mass obtained on organosilane treated aggregates, as compared to asphalt mass obtained on natural aggregates, the data in Table I clearly show that AAK-1 asphalt adsorption was substantially enhanced by all organosilane treatements of RJ-gravel aggregate. Also, little or no enhancement in adsorption mass of any of the asphalts investigated was observed for any organosilane treatments of RC-limestone when compared to natural aggregates.
Desorption and Hydrophobic Bonding Enhancements for Asphalts. The specificity of organosilane treated aggregates for individual asphalts are clearly observed in Table 11, which presents the percent hydrophobic bonding enhancement for treated aggregates in combination with selected MRL asphalts. Not all combinations showed an enhancement in hydrophobic bonding. For instance, RC-limestone aggregate treated with hydrocarbon, thiol, or amino silanes presented little or no change in bonding with the presence of water. Amino-treated RC- limestone in combination with AAM-1 asphalt indicated a very slight enhancement, compared to natural aggregate, in hydrophobic bonding, 5.9% +4.3%, while hydrocarbon-treated RC- limestone paired with AAK-1 asphalt showed a decrease, 5.9%*1.6%, for hydrophobic bonding. All other combinations of organosilane treated RC-limestone and asphalts presented no change in hydrophobic bonding as a result of the pretreatments. Thus, it was concluded that hydrophobic bonding between RC-limestone and these asphalts would not be enhanced with organosilane treatment of the aggregate.
Silane treatment of RJ-gravel aggregate resulted in contrasting behaviors for hydrophobic bonding that were dependent on the asphalt type. Silane treated RJ-gravel combined with AAK- 1 asphalt yielded decreased, 17-40% +5-7%, hydrophobic bonding compared to natural aggregate and AAK-1 asphalt, while, no change or an increase in hydrophobic bonding was observed for all silane treated RJ-gravel with AAD-1 and AAM-1 asphalts. Thiol-treated N- gravellAAD-1 asphalt showed substantial hydrophobic bonding enhancement of 38%*9%. AAM-I asphalt indicated improved resistance to debonding by water when combined with
.
1486

I
1
hydrocarbon and amino treated RL-aggregate as evidenced by bond enhancements of 17%_+6% and 29% f 9 % , respectively.
No change in hydrophobic bonding enhancement for AAK-1 asphalt was observed for organosilane treated RL-gravel aggregates in comparison to desorption of AAK-I asphalt from natural RL-gravel. Hydrocarbon and amino-treated RL-gravel in combination with AAD-1 and AAM-1 asphalts produced slight increases in hydrophobic bonding. Thiol-treated RL-gravel aggregate in combination with these same two asphalts produced decreased bonding enhancements.
SUMMARY
For the combinations of silane-treated aggregates, asphalt models, and asphalts tested, there was no relationship observed between increased adsorption amounts and increased hydrophobic bonding in comparison to similar investigations involving natural aggregates. Although, increased adsorption mass for some asphalt models and a few asphalts was observed, increased adsorption mass did not translate into increased resistance to water. Differences were observed in the hydrophobic bonding with the type of organosilane treatment employed for specific aggregate/asphalt model or asphalt combinations. The following conclusions point to the specificity of the interactions between all components of the asphalt pavement.
0 Silane treatment of RC-limestone provided no advantage for increased hydrophobicity. None of the silane agents tested in this work provided any enhancement for hydrophobic bonding of AAK-1 asphalt to the selected aggregates, RC-limestone, RT-gravel, and RL- gravel. Thiol-treated RJ-gravel provided increased water resistivity for bonding of AAD-1 asphalt. Hydrocarbon and amino-treated RT-gravel provided greater water resistivity for AAM-1 asphalt than did identical silane treatments of RL-gravel. Hydrocarbon and amino-treated RL-gravel yielded small hydrophobic bonding enhancements for AAD-I and AAM-1 asphalts.
REFERENCES
1.
2. 3.
Curtis, C.W., Terrel, R.L., Perry, L.M., AI-Swailrni, S., Brannan, C.J. "Importance of Asphalt-Aggregate Interactions in Adhesion," Journal of AAPT, 60, 1991, 476. Divito, J.A. and Morris, G.R. Trans. Res. Rec. 843, 1982, 104-11. Graf, P.E. "Factors Affecting Moisture Susceptibility of Asphalt Concrete Mixes," Presented at the Annual Meeting of Association of Asphalt Technologists, 1986.
ACKNOWLEDGEMENTS
The Strategic Highway Research Program (SHRP) is gratefully acknowledged for support Gratitude is also expressed to G.Shieh and G.Li for their and input into this research.
contributions.
1487

1488

Table 11. Percent Bonding Enhancement" for Organosilane Treated Aggregates for Hydrophobic Asphalt-Aggregate Bonding
Thiol Aggregate
Model/Asphalt Amino
RC-limestone Benzoic Acid Phenylsulfoxide 1 -Naphthol Phenanthridine
+11.1 k2.8 -1.1 *3.2*
- 18.0' f 6.0 +24.2_+6.5
+80.7&2.7
+12.8*8.6 +29.4+_2.9
+ l5.8k l8.6*
+11.7+14.0* -15.2k4.4
+10.3f8.4 -4.5*:16.3*
-14.4&20* -0.3k 1.8* -2.3 *4.8*
+37.7+8.8 -36.5 k6.6 -1.0&4.8*
-14.9k8.6 +2.8f14* -4.1k1.7
RJ-gravel Benzoic Acid Phenylsulfoxide 1-Naphthol Phcnanthridine
+ 14.3* 1.6 +32.8&6.5
+25.8* 16.0 -119k6.8
+ 119f4.7
+93.2f2.8 +64.6511.3
-1.4f16.4*
+23.9*1.7 +15.8*4.8 +65.9*1.4 +13.3*11.2
-8.1 k20* +0.8+3.0* +5.9+4.3
+5.3+8.1* -17.2k6.7
+28.8*8.6
+14.3*9.8 +6.2*14*
+ 14.5k4.0
RL-gravel Benzoic Acid Phenylsulfoxide I-Naphthol Phenanthridine
RC-limestone AAD-1 AAK-1 AAM-I
RJ-gravel AAD-1 AAK-1 AAM-1
RL-gravel AAD- 1 AAK-I AAM- 1
Percent Enhancement in Hydrophobic Bonding
Hvdrocarbon
+23.2b*1.5d +48.7f3.2
+49.8+19.8 -2.7&5.6*
+ 192 f 3 .O +9.5+ IO. I*
+192+15 +8.5+2.9
+10.4+6.5 +13.9+6.3 +39.0+ 12.0 +22.0+13.3
-19.5+20* -5.9 k 1 .6
+3.6+4.2*
-5.5*6.5* -40.4 k4.9
+16.6*6.1
+9.8+8.8
+8.0+1.5 -2.7+14.0*
a. Percent Bonding Enhancement = (% Desorption on Treated Aggregate - % Desorption
b. Increased Hydrophobic Bonding. c. Decreased Hydrophobic Bonding. d. Propagated Error, Percent. * Values were considered insignificant due to large propagated error.
on Natural Aggregate.
1489

PROPERTIES OF ASPHALT FRACTIONS OBTAINED BY SUPERCRITICAL EXTRACTION WITH PENTANE AND CYCLOHEXANE
Howard B. Jemison, Kevin M. Lunsford, Richard R. Davison', Charles J. Glover, and Jerry k Bullin
Texas A&M University, Department of Chemical Engineering College Station, Texas 77843-3122
Keywords: Asphalt, Fractions, Supercritical, Extraction, Pentane, Cyclohexane
INTRODUCXION
Supercritical fractionation is particularly attractive for asphalt fractionation as it already is used commercially for this purpose. The system explored in this work, like commercial processing, does not provide the separating efficiency of supercritical chromatography, but it provides large fractions for further study.
In earlier work (1) three asphalts were fractionated with a combination of supercritical and room temperature separations. The first step was with supercritical pentane and split the asphalts into top (approximately 60%) and bottom (approximately 40%) fractions. The top 60% was subsequently separated into four fractions with supercritical pentane. The hard bottom 40% was separated into 4 fractions by precipitation from mixtures of varying ratios of pentane and cyclohexane at room temperature.
In this current work three asphalts and three reduced crude feeds were fractionated. However, all the separation was done supercritically using either cyclohexane or pentane.
SUPERCRITICAL FRACTIONATION
The operation of the Supercritical Unit has been described previously (1) but the conditions used in this study were different and are shown in Table 1. The three asphalts were first fractionated into four fractions using supercritical cyclohexane. These are fractions 8, 9, 10, and C1. Fraction C1 was fractionated with supercritical pentane into fractions 5, 6, 7, and PI. Fraction P1 was then fractionated with pentane into fractions 1-4. The reduced crudes were similarly fractionated with cyclohexane but the top material was only separated into four additional fractions with the lightest containing material that would normally be in vacuum gas oil. In each run (Le., pass through the supercritical unit), the heaviest fraction was insoluble at the initial conditions, the next two fractions precipitated on increase in temperature while the lightest fraction was completely separated from the solvent by a reduction in pressure.
ASPHALT ANALYSIS
Infrared analysis was described previously (1). Corbett analyses were done using a modification of ASTM D4124 (2). Asphalts were aged in pressure oxygen vessels that were described by Lau et al. (3). The asphalt is deposited on aluminum trays in an approximately lmm film to minimize diffusion effects. The vessels were operated at 300
1490
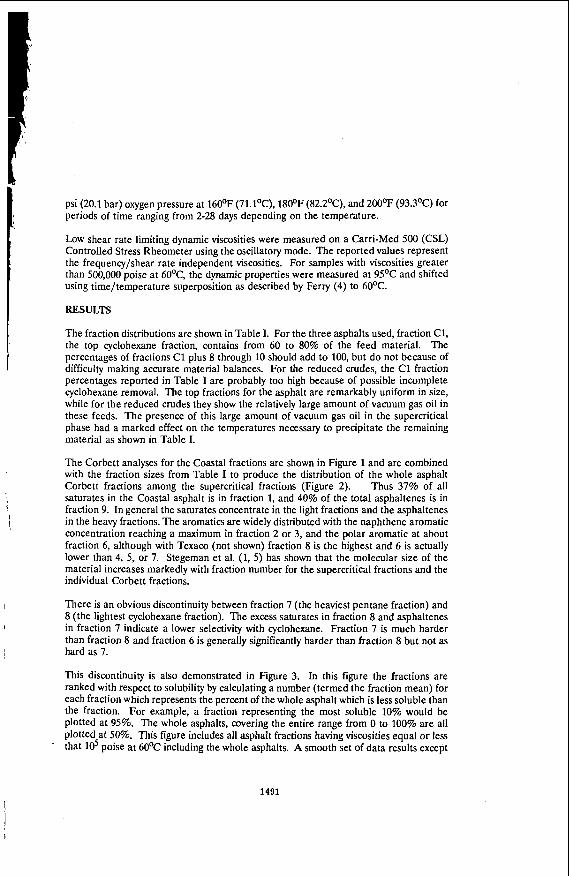
psi (20.1 bar) oxygen pressure at 160'F (71.I0C), 180'F (82.2OC), and 200'F (93.3'C) for periods of time ranging from 2-28 days depending on the temperature.
Low shear rate limiting dynamic viscosities were measured on a Carri-Med 500 (CSL) Controlled Stress Rheometer using the oscillatory mode. The reported values represent the frequency/shear rate independent viscosities. For samples with viscosities greater than 500,000 poise at 6OoC, the dynamic properties were measured at 95'C and shifted using time/temperature superposition as described by Ferry (4) to 60'C.
RESULTS
The fraction distributions are shown in Table I. For the three asphalts used, fraction C1, the top cyclohexane fraction, contains from 60 to 80% of the feed material. The percentages of fractions C1 plus 8 through 10 should add to 100, but do not because of difficulty making accurate material balances. For the reduced crudes, the C1 fraction percentages reported in Table I are probably too high because of possible incomplete cyclohexane removal. The top fractions for the asphalt are remarkably uniform in size, while for the reduced crudes they show the relatively large amount of vacuum gas oil in these feeds. The presence of this large amount of vacuum gas oil in the supercritical phase had a marked effect on the temperatures necessary to precipitate the remaining material as shown in Table I.
The Corbett analyses for the Coastal fractions are shown in Figure 1 and are combined with the fraction sizes from Table I to produce the distribution of the whole asphalt Corbett fractions among the supercritical fractions (Figure 2). Thus 37% of all saturates in the Coastal asphalt is in fraction 1, and 40% of the total asphaltenes is in fraction 9. In general the saturates concentrate in the light fractions and the asphaltenes in the heavy fractions. The aromatics are widely distributed with the naphthene aromatic concentration reaching a maximum in fraction 2 or 3, and the polar aromatic at about fraction 6, although with Texaco (not shown) fraction 8 is the highest and 6 is actually lower than 4, 5, or 7. Stegeman et al. (1, 5) has shown that the molecular size of the material increases markedly with fraction number for the supercritical fractions and the individual Corbett fractions.
There is an obvious discontinuity between fraction 7 (the heaviest pentane fraction) and 8 (the lightest cyclohexane fraction). The excess saturates in fraction 8 and asphaltenes in fraction 7 indicate a lower selectivity with cyclohexane. Fraction 7 is much harder than fraction 8 and fraction 6 is generally significantly harder than fraction 8 but not as hard as 7.
This discontinuity is also demonstrated in Figure 3. In this figure the fractions are ranked with respect to solubility by calculating a number (termed the fraction mean) for each fraction which represents the percent of the whole asphalt which is less soluble than the fraction. For example, a fraction representing the most soluble 10% would be plotted at 95%. The whole asphalts, covering the entire range from 0 to 100% are all plotted at 50%. This figure includes all asphalt fractions having viscosities equal or less that 16 poise at 60'C including the whole asphalts. A smooth set of data results except
1491

for the only three cyclohexane fractions (all fractions 8) which are widely separated from the pentane fractions and form their own curve.
Fraction Aging: Figure 4 shows aging of the fractions in terms of carbonyl formation. Carbonyl area is defined on an arbitrary scale in terms of the infrared peak between wavenumbers of 1650 to 182Ocm-' (3, 6). These data for Fina asphalt aged at 93.3OC (200oF) show a phenomenon common to all the asphalts. There is an initial rapid increase in carbonyl area, for all but the lightest material, which increases sharply with fraction number. After this initial rapid rate, the rate decreases and becomes constant indefinitely. At 93.3OC this constant rate is almost the same for all fractions, although for the Coastal asphalt (not shown) the rate seemed to increase slightly with fraction number. In Figure 5 the same phenomenon is seen for Texaco. The initial jump is smaller than for Fina and there is more effect of fraction number, but again the rate appears to remain unchanged after a short initial period of rapid oxidation.
In Figure 6, the aging of Texaco asphalt and fractions 1 at 82.2OC is shown in terms of viscosity changes. After an initial rapid change as was seen on the carbonyl plots, the log of viscosity changes linearly with time for all fractions and the whole asphalts. This occurs for all fractions at all temperatures.
One of the most interesting and useful relations between chemical changes and changes in physical properties is the universal linear variation of asphalt log viscosity with growth in the carbonyl area (3, 7, 8). Figures 7 to 9 show that this applies to the asphalt fractions as well. All the aging data at all three temperatures are shown on these graphs. These viscosities are measured at 6OoC, but a linear relation exists for viscosities measured at other temperatures as well (3). It has been found that the original unaged material may deviate from these lines.
The anomalous behavior of cyclohexane-separated fraction 8 is shown in Figure 9 where fraction 8 is seen to have lower viscosities as it ages than fraction 6. In general, one observes an increase in the sensitivity of the viscosity to carbonyl growth (hardening susceptibility) with increasing fraction number. The Coastal whole asphalt and fraction 8 appear particularly sensitive to carbonyl formation. This does not in itself assure rapid hardening as this also depends on the rate of carbonyl formation which is strongly affected by temperature.
ACKNOWLEDGEMENTS
Support for this work by the Texas Department of Transportation, Study 2-9-90-1249, in cooperation with the U.S. Department of Transportation, Federal Highway Administration, is gratefully acknowledged.
The Cam-Med Controlled Stress (CSL) Rheometer was manufactured by Carri-Med, Ltd., Dorking, Surrey, England, and distributed in North America by Cam-Med Americas, Inc., Twinsburg, Ohio.
1492

LITERATURE CITED I
1.
2.
3.
4.
5.
6.
7.
8.
Stegeman, J.R., Kyle, A.L., Burr, B.L., Jemison, H.B., Davison, R.R., Glover, C.J., and Bullin, J.A., PREPRINTS, Div. of PetroL Chem, ACS, 35(3), 431- 439 (July 1990). Thenoux, G., Bell, C.A., Wilson, J.E., Eakin, D., and Shroeder, M., “Experiences with the Corbett-Swarbrick Procedure for Separation of Asphalt into Four Generic Fractions,” T r m . Res. Rec., 1171, 66-70 (1988). Lau, C.K., Lunsford, K.M., Glover, CJ., Davison, R.R., and Bullin, J.A.,, T m . Res. Rec., in press. Feny, J.D., Vicoelastic Properties of Polymers, 3rd ed., John Wiley & Sons, New York, (1980). Stegeman, J.R., Davison, R.R., Glover, CJ., and Bullin, J.A., Proceedings of the Intemntional Symposium: Chemistry of Bitumens, Rome, Italy, 1, 336-381, June
Jemison, H.B., Burr, B.L., Davison, R.R., Bullin, J.A., and Glover, C.J., PREPRIhTS, Div. of Petrol. Chem., ACS, 35(3), 490-495 (July 1990). Martin, K.L., Davison, R.R., Glover, C.J., and Bullin, J.A., T r m . Res. Rec., 1269,
Jemison, H. B., Davison, R. R., Glover, C. J., and Bullin, J. A, T r m . Res. Rec., in press.
5-8, 1991.
9-19 (1990).
1493
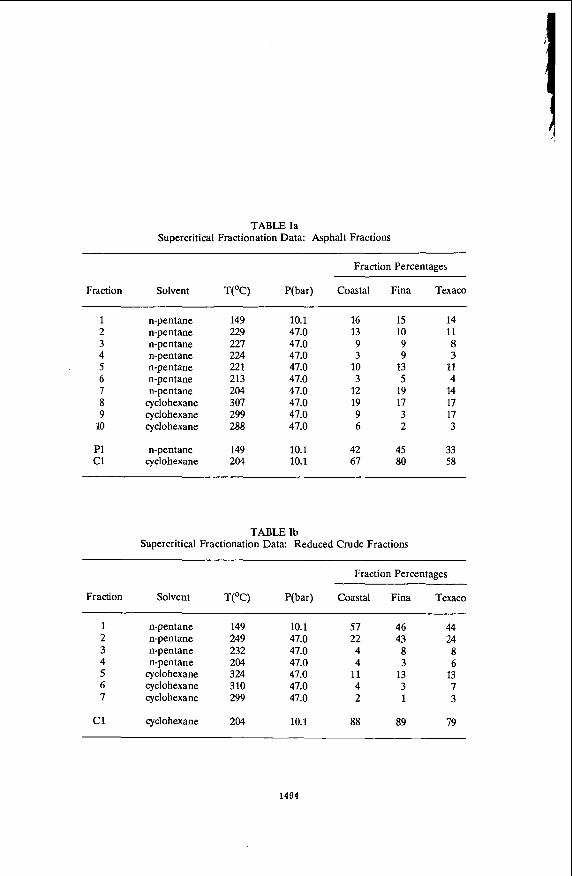
TABLE Ia Supercritical Fractionation Data: Asphalt Fractions
Fraction Percentages
Fraction Solvent V°C) P(bar) Coastal Fina Texaco
1 2 3 4 5 6 7 8 9
10
P1 c1
n-pentane n-pentane n-pentane n-pentane n-pentane n-pentane n-pentane
cyclohexane cyclohexane cyclohexane
n-pentane cyclohexane
149 229 227 224 22 1 213 204 307 299 288
149 204
10.1 47.0 47.0 47.0 47.0 47.0 $7.0 47.0 47.0 47.0
10.1 10.1
16 15 13 10 9 9 3 9
10 13 3 5
12 19 19 17 9 3 6 2
42 45 67 80
TABLE Ib Supercritical Fractionation Data: Reduced Crude Fractions
14 11 8 3
11 4
14 17 17 3
33 58
Fraction Percentages
Fraction Solvent V°C) P(bar) Coastal Fina Texaco
1 2 3 4 5 6 7
c1
n-pentane n-pentane n-pentane n-pentane
cyclohexane cyclohexane cyclohexane
cyclohexane
149 249 232 204 324 310 299
204
10.1 47.0 47.0 47.0 47.0 47.0 47.0
10.1
57 46 22 43 4 8 4 3
I1 13 4 3 2 1
88 89
44 24 8 6
13 7 3
19
1494

z I- 0 2 E E W
0 0 I- z W 0 K W 0
m a
2
t- 0 U
0
E E W m a 0 0 I- 2 W 0
W a a
60%
40%
20%
0 % TANK 1 2
100%
0 SATURATES
80% S NAPHTHENE AROYATICS
E POLAR AROMATICS
ASPHALTENES
3 4 5 6 7 8 e 1 0
FRACTION
F w e 1: Corbctt Analpis of the Superaitid Fractions of the Coastal Asphalt
1 CORBETT FRACTION DISTRIBUTION 50% I
COASTAL
4 0 %
30%
20%
10%
0% 1
0 SATURATES
&I NAPHTHENE AROYATICS
E POLAR AROYATICS
ASPHALTENES
2 3 4 5 6 7
FRACTION
1
8 9 1 0
F w e 2 Dutriiution of the Whole Asphalt’s Corbett Radio- Among the Superait id Fradom of the Coastal Asphalt
1495

- s r n n r
V'PYV lANOBUV1
,......., I.. ...... ....... I... " " ' 1 g
Dml
E 9 t t t t P 0 - P
1496
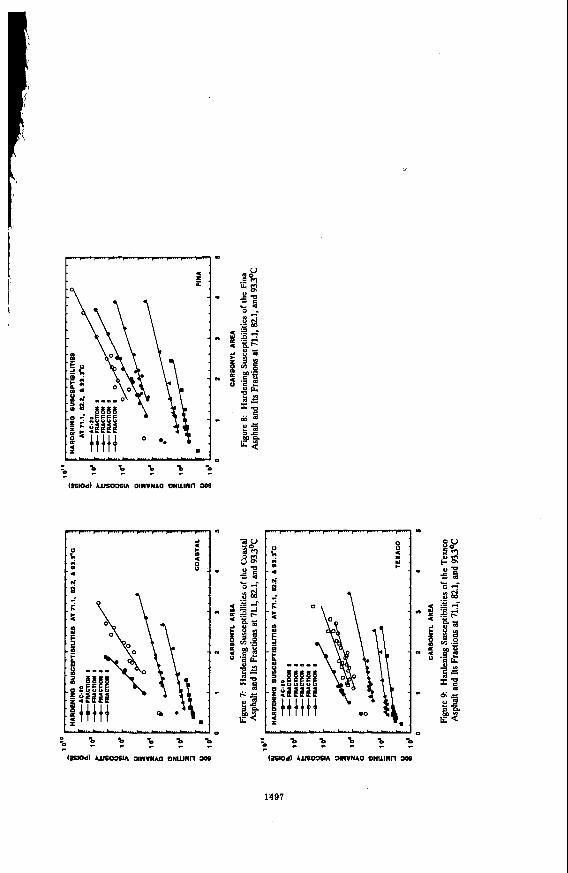
< i
m . . . . , , .
l j 0
< W
m
1497

SYMPOSIUM ON CHEMISTRY OF ASPHALT AND ASPHALT-AGGREGATE MIXES PRESENTED BEFORE THE DIVISION OF FUEL CHEMISTRY, INC.
AMERICAN CHEMISTRY SOCIETY Washington, D.C. Meeting, August 23-28, 1992
The Effect of Composition of Distillable Fractions on the Rheological Temperature susceptibility of Cold Lake Asphalt
H. Sawatzkv, 8. Farnand, J. Houde Jr., I. Clelland - . Energy, Mines and Resources Canada, Energy Research Laboratories,
555 Booth St., Ottawa, Ontario, Canada K1A oG1 (613) 996-7970
Introduction
In another presentation (1) w e proposed a model to explain the mechanisms
in asphalt whereby changes in viscosity due t o changes in temperature are
resisted. In this work the rheological temperature susceptibilities of Cold Lake
asphalt have been studied as components are distilled from it and then replaced
with various amounts of materials of diverse nature, as well as mixtures of these
materials. The results are explained on the basis of the model previously
proposed.
Experimental
Distillation
Figure 1 shows the distillation conditions and fraction yields obtained
from the distillation of Cold Lake asphalt. The temperature of the asphalt in the
distillation flask was not allowed to exceed 340'C to avoid pyrolysis. Figure 2
shows the change in penetration values of residue as distillation proceeds.
Rheoloaical Temperature SusCeDtLbilities
These susceptibilities were determined as penetration indices(2) from
penetrations taken from 4% to 40°C. The equation used to calculate the
penetration index is given as:
1) PI=(20-500A)/(50A+1)
1498

where A is the slope obtained from the plot of logarithm (base 10) of the
penetration in dmm with temperature in centigrade degrees.
Blendinq
The final distillation residue [+533OC] ras blended with calculated amounts
of the distillates to simulate the residues obtained when the distillation cuts
were made. These blends and ths blends obtained with other materials were
thoroughly mixed at 135OC -15OOC.
Blendina Materials
Biomass Derived Oil (BD0)- This is a highly polar material, topped at 35OoC,
whose major functional groups consist largely of amides. It has nitrogen and
oxygen contents of 4 wt % and 6 w t % respectively.
Mineral Oil (Min)- This oil was purchased from Fisher Scientific and consists of
high boiling saturated hydrocarbons.
Hydrogenated syncrude Gas Oil (H2Syn)- This gas oil consists predominantly of
saturated aliphatic and naphthenic hydrocarbons with some aromatic hydrocarbons.
Waste Banbury Oil (Ban)- This high boiling oil is highly naphthenic and was used
in the processing of rubber. It was obtained from Trent Rubber Services Inc.
outrex 776TM (out)- This Shell Oil product has a saturated hydrocarbon content
of 24.4%. naphthepiz-aromatics of 63.38 and polar components of 12.0%. It distils
between 375Oc and 58OOc.
shale Oil (Shale)- This was produced from New Brunswick oil sh le. These shale
oils are known t o have high contents of nitrogenous components.
Paraffinic Gas oil (Para)- This was obtained from a waxy conventional crude oil.
1499

Results and Discussion
The effect of distillation on the rheological temperature susceptibilities'
that are expressed in terms of "Penetration Index" [ P I ] are shown in Fig. 3, 4
and 5 . As the distillation proceeds the PI of the residues increases. Also, the
saturated hydrocarbon content of the distillates decreases and the polar
components increase as shown in Table 1. Since the PI increases as materials are
removed by distillation, it seems that components that are undesirable for low
temperature susceptibility are being removed.
It is assumed that most of the distillate obtained from the Cold Lake
asphalt originated from the continuous phase or uncomplexed material according
to the model proposed earlier. Therefore, it would be expected that this phase
became smaller as distillation proceeded. As there are temperature dependent
equilibria of exchangeable components between the continuous and complexed phases
and since the continuous phase decreases there should be a trend for the
exchangeable components, in particular the more highly polar ones, to be forced
into the complexes. This would leave a new fraction of less polar components in
the exchangeable state which could be more responsive to temperature changes and
result in greater resistance to viscosity changes. Also , the distillation
changes the composition of the continuoue phase (Table 1) and thereby changes the
affinity of this phase for exchangeable components which favours greater
responses to temperature changes.
Figure 5 plots PI vs the penetrations at 25OC of the various blends. The
initial blends are designated by the suffix 1 and the subsequent blends
designated by the suffix 2 , i.e., Minl and Min2. The curve on this plot
represents the Cold Lake residues obtained during distillation and is used as a
curve of reference in the subsequent figures.
As shown in Fig. 6 , when the highly polar biomass derived oil [ 5 % ) was
blended with the +533"C residue the PI fell below that of the reference curve
1500

indicating that highly polar components are not desirable. This blend probably
is quite complex, because some of the polar components of this oil might displace
some of the original asphalt polar components from the micelles or complexes.
The balance of affinities of the two phases for the interchangeable components
becomes less favourable for resisting viscosity changes with changing
temperatures. Therefore, it could be argued that the increase in PI during
distillation is due to some decrease in undesired polar components.
The blend containing the first addition (5%] of the hydrogenated Syncrude
(H2Synl) had the highest PI, followed by that containing a similar amount of
Banbury oil (Banl) then that containing about 10% Dutrex (Dutl). A blend that
contained a similar amount of mineral oil (Minl) and 10% of paraffinic oil
(Paral) also had improved PI and the 5% shale oil blend (Shalel) can be
considered neutral.
These trends change dramatically when twice the initial amount of these
blending agents is added. The PI decreased in the blends containing Syncrude
(H2Syn2). the Dutrex (DutZ) and paraffin (Para2). The PI of the Syncrude (H2SynZ)
decreased by approximately 1.5 PI units. The PI of the Banbury oil blend (Ban2)
also decreased, but still remains fairly high. The PI of the ahale oil blend
(ShaleZ), which was about the same as the +533"C residue, only decreased by as
much as the reference curve during the increase in penetration. Therefore, it can
be considered neutral again. It is quite remarkable that the PI of the blend
containing the increased amount of mineral oil increased marginally.
When another increment of the mineral oil (13.26%) was added as shown in
Fig. 7 , a moderate decrease in the PI occurred due to an upset in the ratio of
saturated hydrocarbon to aromatic plus naphthenic components. As shown in Fig.
8 , when small amounts of the Syncrude gas oil were added to the mineral oil [ - 9 % ]
containing blend, it appeared to have little effect. However, when added to a
blend containing a larger amount there was significant positive effect, but when
more was added the PI decreased although with the increased softening, this
1501

decrease was similar to that in the reference curve. Similar results were
obtained when Banbury oil was added to blends containing the mineral oil as shown
in Fig. 9. In this case, a blend had a penetration similar to the starting Cold
Lake asphalt but with a PI about 1.5 PI units higher.
It appears that replacing the distillates from the Cold Lake asphalt with
the various blending agents modified the continuous phase and this affected the
responses to temperature changes.
Conclusions
It has been shown that the composition of the distillable portion of
asphalt can have a major effect on temperature susceptibility. Also, it has been
shown that for Cold Lake asphalt, blending can increase the PI by at least 1.5
units. These effects can be explained on the basis of a proposed model. Work is
continuing on the quantification of the model.
References
1. Sawatzky, H., Farnand, B., Houde, J. Jr. and Clelland, I., Div. of Petrol.
Chem., ACS, Aug, 1992.
2. Pfeiffer, J.P. and van Doormaal, P.M., J. Inst. Petrol. Technol., 22, 414 (1936).
1502

E .CI
M a h .c,
I
r(
+
2 2 3
CC-
3
CC- '"1 22
3
2 CI
W c? 3 m
W
2 CI
2 m
$2 m m
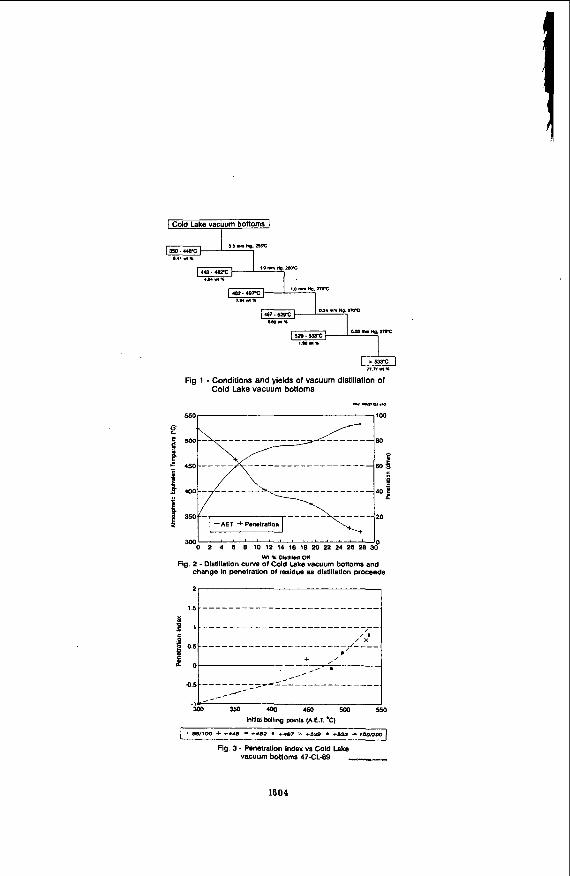
I Cold Lake vacuum bottoms 1
LO^^.^ 35a.m
&.a*%
4onmMo awe 448-4sZ.c 1
l 0 r n M o . m 48z.wrc 7W.l.
n m n m * p m t
I c e * .
.u3% 1 ,l,ll(*
Fig 1 - Conditions and ylelds of vacuum dlslillalion of Cold Lake vacuum bottoms
". ml0C.N
550 I ,100
3cQ b 2 ; 6 ; i o 1; 1; 16 16 m 22 ;4 2s A AJ m % OhtlllM o((
Fig. 2 ~ Distillation culye of Cold Lake vacuum bonoms and change in penetration of redidue e8 distillation Proceeds
1504
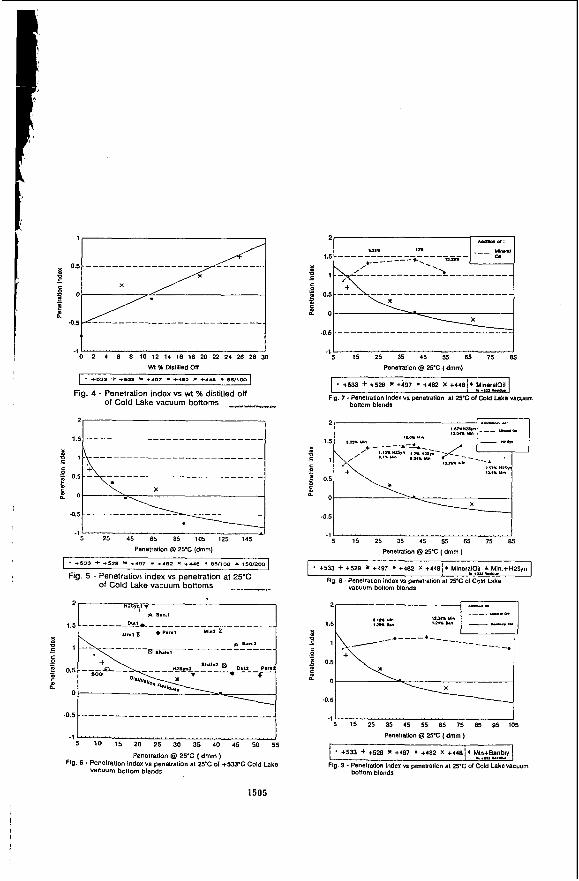
I 0 2 4 6 8 10 12 14 16 18 20 22 24 26 28 30
w1 % Oisliilad 011
1 ,s
. *- + +5tD ). *.*, . * e 2 x *..e . e51,oo
Fig. 4 - Penetration index vs wl % distilled off of Cold Lake vacuum bottoms __-_
* Il."., - - - - - -_ -FL - - - - - - - - - _ - - - - - - - - - -
Y,n, * +P...l Yl"2 x
* +533 + +529 +407 * + a 2 x +448
11 I 5 I 5 25 35 45 55 65 75 85
Penslalion Q 2 S C ( dmm)
I . +%U + +529 X t i 9 7 - +482 X t 4 4 8 1 t ,$ereIOil]
Fig. 7 . PenatraUon index vs DenetRliOn a1 25% of Cold Lake vacuum , w-
bottom blends
kp&B&q
-0.5
1 5 15 25 35 45 55 65 75 85
Penetration @ 25% ( dmm)
I t 5 3 3 + +529 X t497 +482 X t448j * MlneralOil A Mln.+HZSyn I . *tuIn.e4u
Fig. 8 - Penetration indsrvr penetration at 25'C 01 Cold Lake vacuum bollom blends
.-_.-do. ,.,a Un 1124% Y.
1 /--*----

DEASPHALTING OF NON-CONVENTIONAL RESIDUES
S. Ng, E. Castellanos and B. Farnand
Energy Research LaboratorieslCANMET Energy, Mines and Resources Canada
555 Booth St., Ottawa, Ontario, Canada KIA OGI
INTRODUCTION
Mitchell and Speightl established a correlation between the weight of asphaltenes precipitated from Athabasca bitumen and the solubility parameter of the precipitating solvent. The polynuclear aromatic systems in asphaltenes isolated from Athabasca bitumen was also reported by Speighf. Recently, Kokal et al? measured precipitation of asphaltenes in Canadian heavy oils by injecting light hydrocarbon gases, e.g., methane, propane, ethanelpropane mixtures, and carbon dioxide at various temperatures and pressures. A thermodynamic model proposed by Hirshberg et al.' based on Flory-Huggins theory was used to correlate the experimental data and predict precipitate formation. The objective of this study was to evaluate the viability and processability of deasphalted oils (DAO) from Canadian non-conventional residues as feedstocks to produce transportation fuels. This paper only describes and compares the deasphalting characteristics of two vacuum tower bottoms (VTB) derived from Athabasca oil sand bitumen and Lloydminster heavy oil.
EXPERIMENTAL
The Athabasca VTB was obtained by distillation (ASTM DI 160) of a coker feed (305"C+) from a commercial plant which produces synthetic crude from oil sand bitumen. The VTB (544'C+) constituted 63.5 wt 46 of the coker feed. Lloydminster VTB was obtained from an Eastern Canadian refinery that processes pipeline quality Lloydminster crude oil.
The equipment used for the deasphalting experiments is shown in Fig. I . VTB was first dissolved in toluene (approximately 0.3 mL VTBlmL toluene). The blend was transferred to a double-ended sample cylinder (transfer vessel) which could withstand 500 psi pressure through mercury compression. The required amount of blend was transferred by mercury displacement to a detachable PVT cell which was held at 75°C. The PVT cell was removed from the system and attached to a vacuum line. Toluene was evaporated from the blend overnight. The PVT cell was restored to the deasphalting system. The volume of solvent required to give the desired solvent/VTB ratio was determined using Starling's tabulations'. This volume was added to the PVT cell, again using the mercury displacement technique. The cell was then brought to operating temperature and pressure, and the mixture was equilibrated by shaking for 1 h. The phases were allowed to separate for 3 h at equilibrium temperature and pressure.
The solvent-rich phase was removed at equilibrium pressure from the cell by mercury displacement and was collected in a tared flask which was chilled to prevent solvent loss (propane required a dry ice-acetone slurry, n-butane and n-pentane required dry ice, while an ice bath was sufficient for n-heptane). Toluene (50 mL) was added to the cell. After shaking for 20 min, the toluene
.
1506

fraction was displaced from the cell using the mercury pump. This washing procedure was repeated four times. The weight of the solvent-rich phase was determined before the solvent was evaporated off and the weight of deasphalted oil determined. Toluene was also evaporated from the solvent-lean phase in order to determine the weight of residue. The weight of solvent in the solvent-lean phase was obtained by substracting the weight of solvent in the solvent-rich phase from the total weight of solvent added to the cell.
To complete the phase behaviour measurements, the concentrations of the oils, resins and asphaltenes in the solvent-rich and solvent-lean phases were required. The DAO and the residue were deasphalted using ASTM method D3279 and the recovered maltene fractions were then separated into oils and resins on an Attapulgus clay column. For this study, 33 g of clay was used to separate 1 g of maltenes dissolved in 10 mL of n-heptane. The oil was eluted from the column using 200 mL of n- heptane. Resins adsorbed by the column were then eluted using 70 mL of methylene chloride followed by 70 mL of 20% diethylether in methylene chloride. All solvents were finally evaporated off.
For both VTB’s, most of the phase behaviour measurements were made over a wide range of solventlVTB ratios using the following solvents and conditions:
Propane n-Butane n-Pentane n-Heptane
75°C 465 psia 120°C 415 psia 160°C 365 psia 75°C 65 psia
Several measurements were made at other conditions. In all cases the system pressures were selected so that the solvent would be undersaturated by at least 50 psia (Le., 50 psia above the bubble point) at the desired operating temperature to ensure that the systems would remain completely in the liquid phase.
The two VTB’s were characterized using ASTM and other analytical methods.
RESULTS AND DISCUSSION
Table 1 gives the analyses of the two VTB’s. It can be seen that the Athabasca VTB is significantly heavier than the Lloydminster. The Athabasca contains approximately one quarter more sulphur, nitrogen, asphalt (asphaltenes + resins), Conradson Carbon residue, and 1.5 times the Ni + V content. In addition, the Athabasca VTB has much higher softening point and viscosity. The gas chromatograph distillation (GCD) data indicate that the Athabasca sample has been cut a little heavier than the Lloydminster.
Comparison of the phase behaviour for solvent-VTB systems is facilitated by plotting the phase data on pseudo-ternary phase diagrams. Typical examples are shown in Fig. 2 and 3 for n- pentanelAthabasca and n-pentanellloydminster systems, respectively, at 160°C and 365 psia. The dotted dilution line connecting the pure solvent apex and VTB composition on the baseline serves to indicate (i) the solventlVTB ratio; (ii) the ratio of solvent-rich and solvent-lean phases when used together with the individual tie-line in the immiscible region.
1507

r Variables that significantly affect the phase behaviour of the deasphalting process would be
expected to influence both the quantity and quality of DAO produced. Using data from the phase behaviour measurements, these effects can be investigated and are summarized as follows:
Table 2 compares data for the runs conducted at 7 X with a nominal volumetric solventNTB ratio of 9 for various solvents. The overall weight per cent of the original VTB recovered as deasphalted oil in the upper phase increased rapidly with higher carbon number of the solvent. This was accompanied by higher recoveries of (i) the oil fraction which reached about 90 wt X with n-heptane; (ii) the resin fraction and (iii) the asphaltene fraction with n-heptane. These observations accord with the conclusions of the Flory-Huggins liquid model, i s . , increasingly heavier solvents give smaller regions of immiscibility with shorter tie-lines and heavier deasphalted oils (greater resin and asphaltene contentsj.
In addition, between the two VTB’s there was markedly better recovery of oil and resins from the Lloydminster over the Athabasca at equivalent conditions, especially with lighter solvents. This certainly reflects the differences in the VTB constituent fractions of the two oils and their influence on the phase behaviour.
B. EffectofTemwra turePre.ssurp
These two variables could be combined so far as the pressure at any selected temperature was kept at least 50 psia above the solvent bubble pressure to maintain a liquid system. The effect of the temperature-pressure combination is presented in Table 3 for n-butane and n-pentane at a nominal volumetric SolventNIB ratio of 9. It can be seen that the overall recovery of VTB as DAO was lower at higher temperature. For n-butane, the recovery of both oil and resin fractions was depressed at more severe operating conditions whereas for n-pentane the major effect was to lower the recovery of the resin fraction. The results concur with Flory-Huggins model which indicates an increase of disparity between solvent and solute as the temperature is raised. This leads to a larger region of immiscibility with a broader two-phase envelope and longer tie-lines on a pseudo-ternary representation.
It should also be noted from the results that the effect of the solvent predominated over that of the temperature-pressure combination. For n-pentane at the most severe conditions, recoveries exceeded those for n-butane at the lowest temperature. Also, the recoveries of Lloydminster VTB, both overall and for individual fractions, were better than those of Athabasca VTB at comparable operating conditions.
C. Effect of SolventlVTB Rat ip
Data for the deasphalted oil composition and weight per cent extracted as a function of solventATI3 ratio are given in Table 4 for the n-pentanelAthabasca VTB system at 160°C and 365 psia. Over a range of ratio from 20 to 5.2, there was little change in either the composition or the extracted weight of the deasphalted oil. Only as the phase envelope started to close at the lower solventNTB ratios, a rapid increase occurred in the asphaltenes at the expense of the oil. The overall weight extracted also showed an increase at the low solvent/VTB ratio.
1508

To conclude, deasphalting parameters such as solvent type, temperature, pressure and solventNTB ratio should he optimized to make deasphalting a viable process for subsequent fuel production. The qualities of the deasphalted oils produced from this study have been partially reported elsewhere6. The presence of asphaltenes, and to a lesser extent resins, in the DAO will certainly reduce its desirability as a fluid catalytic cracking (FCC) feed. This has been confirmed by microactivity tests (MAT) and kinetic riser simulations which indicate that propane and n-butane deasphalted heavy oil residues are acceptable feeds for FCC riser units provided the unit is flexible enough to permit considerable increase in the regenerator operating temperature6. Alternatively, the n-C4 to n-C7 DAO's can be diluted with conventional gas oils or hydrotreated to yield feedstocks acceptable to unmodified FCC units as suggested by Bousquet et a1.7
Mitchell, D.L. and Speight, J.G., Fuel 2, 149, 1973. Speight, J.G., PREPRINTS, Div. of Petrol. Chem., ACS, 3(4), 818, 1986. Kokal, S., Najman, I . , Sayegh, S. and George, A., J. Can. Petrol. Tech., 3(4) , 24, 1992. Hirshberg, A,, De long, L.N.I., Schipper, B.A. and Meijer, J.G., SPE J., 3(3), 283, 1984. Starling, K.E., "Fluid Thermodynamic Properties for Light Petroleum Systems", Gulf Publishing Co., Houston, Texas, 1973. Pope, A.E. and Ng, S.H., Fuel, a, 539, 1990. Bousquet, J. and Laboural, T., Oil & Gas J . , @(16), 62, 1987.
Table 1. Characteristics of Feedstocks
Athabasca Lloydminster VTB VTB
'API Gravi ty -0 .7 6 . 3 S o f t e n i n g P o i n t , O C 66 36 Pen @ 25OC, 0 . 1 mm 11 192 Viscosity @ 135'C, c S t 2002 205 Conradson Carbon, w t % 2 4 . 3 1 8 . 3 T o t a l Nitrogen, ppm 6390 4964 Basic Nitrogen, ppm 1820 1352 T o t a l Sulphur, w t % 5 . 9 4 . 5 N i t PPm 130 84 V, PPm 310 189
Cu, PPm 0 . 8 0 . 1 Na, ppm 64 < 1
Fe , Ppm . 4 7 0 510
O i l F r a c t i o n , w t % 4 6 . 0 5 9 . 0 Resin F r a c t i o n , w t % 3 6 . 7 2 7 . 3 A s p h a l t e n e s (n-C7), w t % 1 7 . 3 1 3 . 7
IBP 331 3 16 5% 507 429
10% 535 465
B o i l i n g Range by GCD, 'C
- 3 0% 554
1509

Table 2. Effect of Solvent on Deasphalting
Nominal volumetric solvent/VTB ratio - 9, Temperature - 75°C ~~ ~
Wt % Recovery of VTB Components as DAO
Solvent c 3 n-C4 n-C5 n-C7 Pressure, psia 4 6 5 2 0 5 1 0 5 65
Athabasca Overall Oil Resins Asphaltenes
Llovdminster Overall oil Resins Asphaltenes
1 1 . 6 4 7 . 1 2 2 . 2 74.8
3 . 7 34.4 0 . 1 0.3
27.3 64.5 41.7 83.0
9.8 56.7 0 . 1 0.5
66 .0 80.5 85 .5 89.6 72 .5 95.0
0 .4 25.6
7 7 . 1 89.8 8 8 . 1
0 .6
Table 3. Effect of Temperature-Pressure on Deasphalting
Nominal volumetric solvent/VTB ratio - 9
Wt % Recovery of VTB Components as DAO
Solvent n-C4 n-C5
Temperature, 'C 1 2 0 7 5 1 6 0 7 5 Pressure, psia 415 205 3 6 5 1 0 5
Athabasca Overall Oil Resins Asphaltenes
Llovdminster Overall Oi 1 Resins Asphaltenes
39.2 65.5 24 .6
0.2
56.9 7 6 . 1 43.8
0.4
4 7 . 1 7 4 . 8 34.4
0.3
64.5 83 .0 56.7
0.5
58 .4 85 .7 51.4
0 . 7
71 .7 93 .9 59.4
0.5
6 6 . 0 8 5 . 5 7 2 . 5
0.4
7 7 . 1 89 .8 8 8 . 1
0 .6
Table 4.Effect of Bolvent/VTB Ratio on Deasphalting
Athabasca VTB, n-Pentane, 16OoC, 365 psia
Wt %
SolventIVTB w/w 3 7 . 1 20 .0 6.8 5.2 1 . 0 0.9
oils 58.5 65 .6 64 .0 67.5 53 .7 46.8 Resins 40.9 34.4 35 .9 32.3 38.9 38.3 Asphaltenes 0.6 0.0 0 . 1 0.2 7.4 14.9 VTB Recovery 65.8 62.3 59.3 58.4 65.5 68.0
1510

I
I ' Fig. 1. Deasphalting System.
1: Sample pump.
2, 3, 5, 6, 8, 10, 11, 13, 14, 17: On-off valves.
4: Sample cylinder (transfer vessel).
7: Mercury reservoir.
9: Cell pump.
12: Three window PVT cell.
15: Controllers (pressure indicator, temperature control, motor control).
16: Solvent trap.
1511

AGUE 2 AM
A! : ,, ,, ,,‘v \, “j oQ&bsrm / v :,,
p1 a4 ah a8
1512