Development of a mobile interactive musical service
79
HELSINKI UNIVERSITY OF TECHNOLOGY Department of Electrical and Communications Engineering Laboratory of Acoustics and Audio Signal Processing Matti Airas Development of a Mobile Interactive Musical Service Master’s Thesis submitted in partial fulfillment of the requirements for the degree of Master of Science in Technology. Espoo, December 1, 2002 Supervisor: Professor Matti Karjalainen Instructor: Dr. Tero Tolonen
Transcript of Development of a mobile interactive musical service

HELSINKI UNIVERSITY OF TECHNOLOGYDepartment of Electrical and Communications EngineeringLaboratory of Acoustics and Audio Signal Processing
Matti Airas
Development of a Mobile Interactive Musical
Service
Master’s Thesis submitted in partial fulfillment of the requirements for the degree ofMaster of Science in Technology.
Espoo, December 1, 2002
Supervisor: Professor Matti KarjalainenInstructor: Dr. Tero Tolonen
TEKNILLINEN KORKEAKOULU DIPLOMITYON TIIVISTELMA
Tekija: Matti Airas
Tyon nimi: Vuorovaikutteisen musiikillisen mobiilipalvelun toteutusPaivamaara: 1.12.2002 Sivuja: 67
Osasto: Sahko- ja tietoliikennetekniikkaProfessuuri: S-89
Tyon valvoja: Professori Matti KarjalainenTyon ohjaajat: TkT Tero Tolonen
Tassa tyossa esitellaan vuorovaikutteinen soittoaanipalvelu, jonka avullapalvelun kayttaja voi laulamalla tai viheltamalla luoda omaan matkapuhe-limeensa ainutkertaisen soittoaanen. Tyossa kasitellaan seka jarjestelmanaanenkasittelykomponenttien etta palveluarkkitehtuurin toteuttamista.
Palvelua kaytetaan soittamalla matkapuhelimella palvelunumeroon ja laulamallalyhyt aanite. Aanite lahetetaan soittoaanimuunnoksen tekevalle komponentille,joka automaattista nuotinnusta kayttaen muuntaa aanitteen soittoaaneksi. Luotusoittoaani lahetetaan edelleen lyhytsanomaviestina kayttajan matkapuhelimeen.
Tyossa tarkastellaan eri menetelmia perustaajuuden seka melodian tunnistukseenja esitellaan valitut menetelmat seka niihin tyossa tehdyt parannukset.
Tyossa kiinnitetaan huomiota myos jarjestelmaarkkitehtuuriin ja sen eri toteu-tusvaihtoehtoihin. Jarjestelman suorituskykya tutkitaan seka simuloimalla ettatestaamalla.
Lopuksi esitetaan suuntaviivoja jatkokehitykseen tulevien mobiilistandardien val-ossa seka kaydaan lapi paatelaitteessa toimivien musiikkisovellusten tekoon sovel-tuvia jarjestelmia.
Tyon tuloksena syntyi toimiva soittoaanipalvelu. Palvelulla luodut soittoaanetovat tunnistettavia ja laadultaan kohtuullisia, joskaan eivat virheettomia.
Avainsanat: mobiilipalvelu, automaattinen musiikin nuotinnus, soittoaani, aanenperustaajuuden maarittaminen
1

HELSINKI UNIVERSITY ABSTRACT OF THEOF TECHNOLOGY MASTER’S THESIS
Author: Matti Airas
Name of the thesis: Development of a mobile interactive musical serviceDate: Dec 1, 2002 Number of pages: 67
Department: Electrical and Communications EngineeringProfessorship: S-89
Supervisor: Professor Matti KarjalainenInstructors: D.Sc. (Tech.) Tero Tolonen
This thesis presents an interactive ringing tone service, with which the user ofthe service can create a unique ringing tone to his mobile phone by singing orwhistling. The implementation of both the sound signal processing componentsand the service architecture are studied.
The ringing tone service is used by calling a service number by a mobile phoneand singing a short recording. The recording is sent to a ringing tone conversioncomponent, which converts the recording to a ringing tone by using automaticmusic transcription. The created ringing tone is further sent to the mobile phoneof the user by a short message service.
The work investigates different methods for fundamental frequency and melodydetection and presents the chosen methods and improvements made to them.
Furthermore, system architecture aspects and different implementation possibil-ities are studied. The computational efficiency of the system is studied both bysimulating and by testing.
Finally some possible paths for future developments in the light of upcomingmobile standards are presented and systems suitable for client-based music ap-plications are reviewed.
As a result of the work a functional ringing ton service was created. The ring-ing tones created using the service are recognizable and of reasonable quality,although not perfect.
Keywords: mobile service, automatic music transcription, ringing tone, funda-mental frequency detection
2

Preface
The work for this thesis has been carried out at Elmorex Ltd. and in the Laboratoryof Acoustics and Audio Signal Processing at Helsinki University of Technology.
The work has been instructed by Dr.Sc.(Tech.) Tero Tolonen, with whom I workedclosely in the initial stages of the project. I want to thank him both for his valuableinsights on the design of the system, and for his helpful comments and suggestions onthe structure and contents of this thesis. I am also grateful to my supervisor ProfessorMatti Karjalainen for providing insight on writing the thesis and setting target datesfor the project. Without those deadlines brewing of this thesis probably would havegone on forever.
I wish to thank Jyrki Kohonen of Elmorex Ltd. for employing me for this project andsupporting the writing of this thesis. Elmorex proved a unique working place for thisfun and entertaining project!
Perttu Hamalainen, a friend and a co-worker at Elmorex, has had an enormous impacton his thesis. We spent innumerable hours discussing subjects both on and off-topic,but those hours were something gained, not wasted. I always marvelled his enthusiasmon just about anything and his ability of getting things done. Thank you, Perttu!
There are also many other people whom I need to thank for either helping me outwith this thesis, or for helping me keep my (relative) sanity. Listed in no particularorder: my comrade-in-arms Henri Penttinen, Hanna Jarvelainen, Riitta Vaananen andVille Pulkki of Naistenhuone, Rami Laiho, Laura Turkki and others at Ihana.tv, AnttiKaihola, Laura Saarilahti, my sisters Katri and Laura and their families (especiallyMarkku Huhta-Koivisto, who persuaded me to apply to HUT), and many, many others,whom I have forgotten to mention. Thank you, all of you! I also wish to thank Trurland Klapausius for company and not chewing all my clothes.
Finally, I would like to thank my parents Kaija and Kalervo for their love and theirsupport throughout my studies and showing keen interest on this thesis. My motherhas shown also great skill in patching my chewed clothes, for which I am grateful.
Helsinki, December 1, 2002
Matti Airas
ii
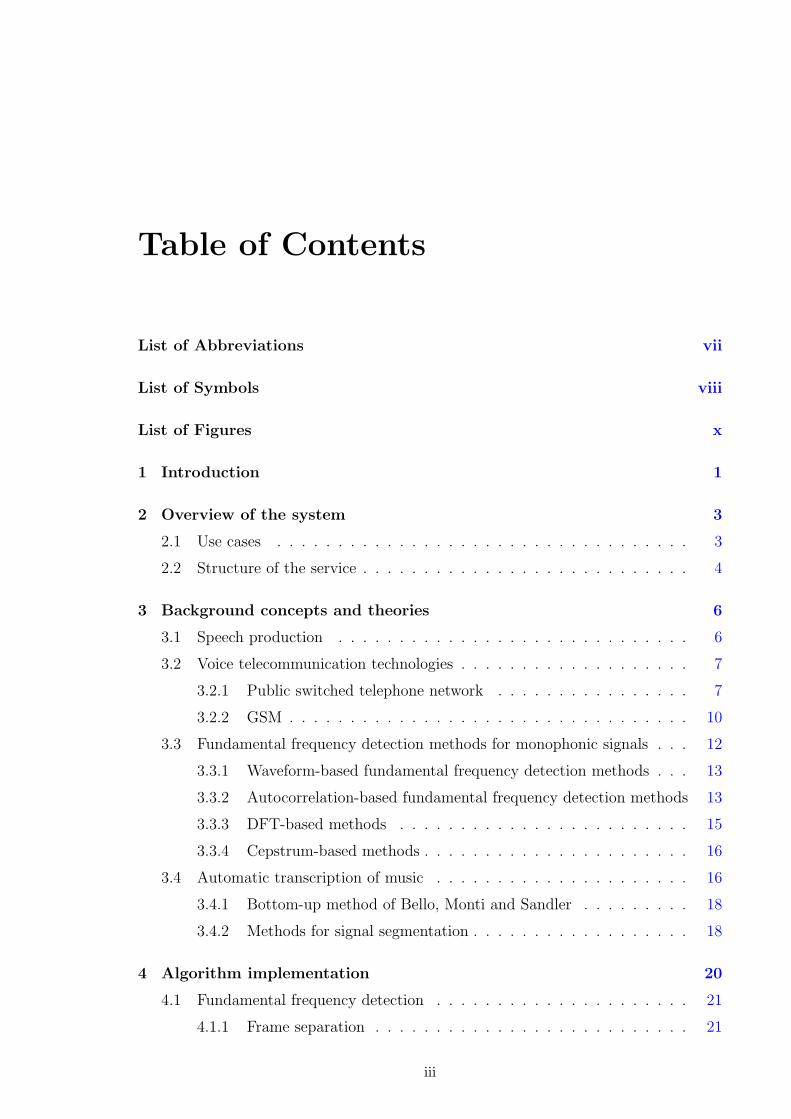
Table of Contents
List of Abbreviations vii
List of Symbols viii
List of Figures x
1 Introduction 1
2 Overview of the system 3
2.1 Use cases . . . . . . . . . . . . . . . . . . . . . . . . . . . . . . . . . . 3
2.2 Structure of the service . . . . . . . . . . . . . . . . . . . . . . . . . . . 4
3 Background concepts and theories 6
3.1 Speech production . . . . . . . . . . . . . . . . . . . . . . . . . . . . . 6
3.2 Voice telecommunication technologies . . . . . . . . . . . . . . . . . . . 7
3.2.1 Public switched telephone network . . . . . . . . . . . . . . . . 7
3.2.2 GSM . . . . . . . . . . . . . . . . . . . . . . . . . . . . . . . . . 10
3.3 Fundamental frequency detection methods for monophonic signals . . . 12
3.3.1 Waveform-based fundamental frequency detection methods . . . 13
3.3.2 Autocorrelation-based fundamental frequency detection methods 13
3.3.3 DFT-based methods . . . . . . . . . . . . . . . . . . . . . . . . 15
3.3.4 Cepstrum-based methods . . . . . . . . . . . . . . . . . . . . . . 16
3.4 Automatic transcription of music . . . . . . . . . . . . . . . . . . . . . 16
3.4.1 Bottom-up method of Bello, Monti and Sandler . . . . . . . . . 18
3.4.2 Methods for signal segmentation . . . . . . . . . . . . . . . . . . 18
4 Algorithm implementation 20
4.1 Fundamental frequency detection . . . . . . . . . . . . . . . . . . . . . 21
4.1.1 Frame separation . . . . . . . . . . . . . . . . . . . . . . . . . . 21
iii
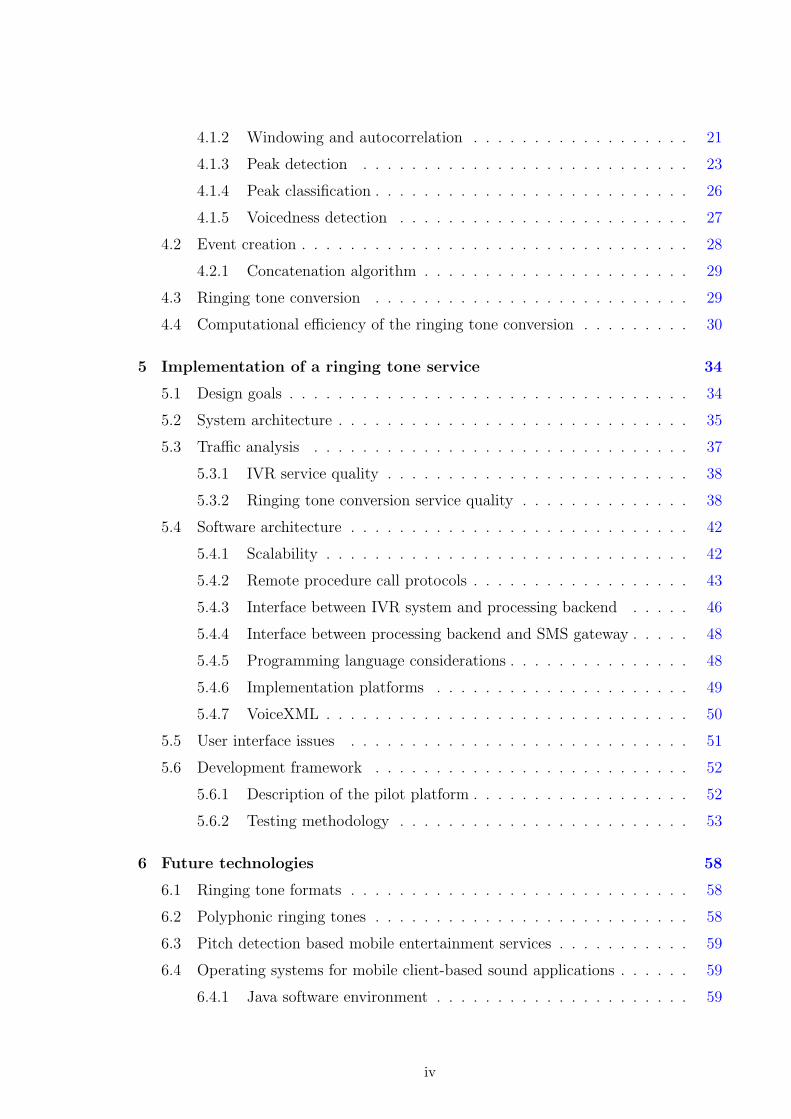
4.1.2 Windowing and autocorrelation . . . . . . . . . . . . . . . . . . 21
4.1.3 Peak detection . . . . . . . . . . . . . . . . . . . . . . . . . . . 23
4.1.4 Peak classification . . . . . . . . . . . . . . . . . . . . . . . . . . 26
4.1.5 Voicedness detection . . . . . . . . . . . . . . . . . . . . . . . . 27
4.2 Event creation . . . . . . . . . . . . . . . . . . . . . . . . . . . . . . . . 28
4.2.1 Concatenation algorithm . . . . . . . . . . . . . . . . . . . . . . 29
4.3 Ringing tone conversion . . . . . . . . . . . . . . . . . . . . . . . . . . 29
4.4 Computational efficiency of the ringing tone conversion . . . . . . . . . 30
5 Implementation of a ringing tone service 34
5.1 Design goals . . . . . . . . . . . . . . . . . . . . . . . . . . . . . . . . . 34
5.2 System architecture . . . . . . . . . . . . . . . . . . . . . . . . . . . . . 35
5.3 Traffic analysis . . . . . . . . . . . . . . . . . . . . . . . . . . . . . . . 37
5.3.1 IVR service quality . . . . . . . . . . . . . . . . . . . . . . . . . 38
5.3.2 Ringing tone conversion service quality . . . . . . . . . . . . . . 38
5.4 Software architecture . . . . . . . . . . . . . . . . . . . . . . . . . . . . 42
5.4.1 Scalability . . . . . . . . . . . . . . . . . . . . . . . . . . . . . . 42
5.4.2 Remote procedure call protocols . . . . . . . . . . . . . . . . . . 43
5.4.3 Interface between IVR system and processing backend . . . . . 46
5.4.4 Interface between processing backend and SMS gateway . . . . . 48
5.4.5 Programming language considerations . . . . . . . . . . . . . . . 48
5.4.6 Implementation platforms . . . . . . . . . . . . . . . . . . . . . 49
5.4.7 VoiceXML . . . . . . . . . . . . . . . . . . . . . . . . . . . . . . 50
5.5 User interface issues . . . . . . . . . . . . . . . . . . . . . . . . . . . . 51
5.6 Development framework . . . . . . . . . . . . . . . . . . . . . . . . . . 52
5.6.1 Description of the pilot platform . . . . . . . . . . . . . . . . . . 52
5.6.2 Testing methodology . . . . . . . . . . . . . . . . . . . . . . . . 53
6 Future technologies 58
6.1 Ringing tone formats . . . . . . . . . . . . . . . . . . . . . . . . . . . . 58
6.2 Polyphonic ringing tones . . . . . . . . . . . . . . . . . . . . . . . . . . 58
6.3 Pitch detection based mobile entertainment services . . . . . . . . . . . 59
6.4 Operating systems for mobile client-based sound applications . . . . . . 59
6.4.1 Java software environment . . . . . . . . . . . . . . . . . . . . . 59
iv

7 Discussion and conclusions 61
7.1 Ringing tone quality . . . . . . . . . . . . . . . . . . . . . . . . . . . . 61
7.2 Contributions made by the author . . . . . . . . . . . . . . . . . . . . . 62
7.3 Evaluation of project success . . . . . . . . . . . . . . . . . . . . . . . . 62
Bibliography 64
v
Abbreviations
ACELP Algebraic Code Excited Linear PredictionAIX IBM’s UNIX operating systemAMD Advanced Micro Devices, Inc.API Application Program InterfaceARM A provider of embedded RISC microprocessorsCASA Computational Auditory Scene AnalysisCDMA Code-Division Multiple AccessCEPT European Conference of Postal and Telecommunications
AdministrationsCGI Common Gateway InterfaceCORBA Common Object Request Broker ArchitectureCPU Central Processing UnitDFT Discrete Fourier TransformDSP Digital Signal ProcessingDTMF Dual Tone Multi-FrequencyEFR Enhanced Full RateEMS Enhanced Messaging ServiceEPOC An operating system designed for mobile computing devicesFFT Fast Fourier TransformFIFO First in, first outFTP File Transfer ProtocolGPRS General Packet Radio ServiceGSM Global System for Mobile CommunicationsHFC High Frequency ContentHP Hewlett-PackardHTTP Hypertext Transfer ProtocolIDL Interface Definition LanguageISDN Integrated Services Digital NetworkIVR Interactive Voice ResponseJIT Just-in-time (compiler)JSP Java Server PagesLP Linear PredictionLPC Linear Prediction CoefficientsMiB Mebibyte, 220 or 1,048,576 bytesMIDI Musical Instrument Digital InterfaceMIDP Mobile Information Device Profile
vi

MIME Multipurpose Internet Mail ExtensionsMMS Multimedia Messaging SystemMOS Mean Opinion ScoreMPEG Moving Picture Experts Group.NET A software platform developed by Microsoft Corp.OS Operating SystemPC Personal ComputerPCM Pulse Code ModulationPRI Primary-Rate InterfacePS Processor-sharingPSTN Public Switched Telephone NetworkRMI Remote Method InvocationRPC Remote Procedure CallRPE Regular Pulse ExcitationRTC Ringing Tone ConversionSMS Short Message ServiceSMTP Simple Mail Transfer ProtocolSOAP Simple Object Access ProtocolSQL Structured Query LanguageUML Universal Modeling LanguageUMTS Universal Mobile Telecommunications SystemUNIX A popular multi-user, multitasking operating systemVSELP Vector Sum Excited Linear PredictionWAP Wireless Application ProtocolWLAN Wireless Local Area NetworkWSDL Web Services Definition LanguageWWW World-wide webXML Extensible Markup Language
vii
Symbols
A Companding rate in A-law quantizationa Traffic intensityBc Call blocking probabilitycx(k) Cepstrum functionE(ν) Energy error function for peak classificationf0 Fundamental frequencyφk(m) Short-time autocorrelation functionFD Discrete Fourier transformh Average holding timeλ Peak acceptance thresholdλ Service request arrival rate (traffic theory)µ Companding rate in µ-law quantizationµ Service rate (traffic theory)ν Autocorrelation lag valueσ Voicedness thresholdv(k) Voicedness value of a framew(n) Time-domain window function
viii
List of Figures
2.1 Rring use case diagram showing the common use cases. . . . . . . . . . 3
2.2 Rring use sequence. . . . . . . . . . . . . . . . . . . . . . . . . . . . . . 5
2.3 Ringing tone conversion use sequence closeup. . . . . . . . . . . . . . . 5
3.1 Human vocal organs and a representation of their main acoustical fea-tures. (After J. L. Flanagan [Fla65].) . . . . . . . . . . . . . . . . . . . 6
3.2 Plot of second formant frequency versus first formant frequency for vow-els by a wide range of speakers. (After Peterson and Barney [PB52].) . 8
3.3 Telephone band limits and transfer characteristics of a Texas Instru-ments TCM29C13 single-chip PCM codec and filter. (After [Tex86].) . 9
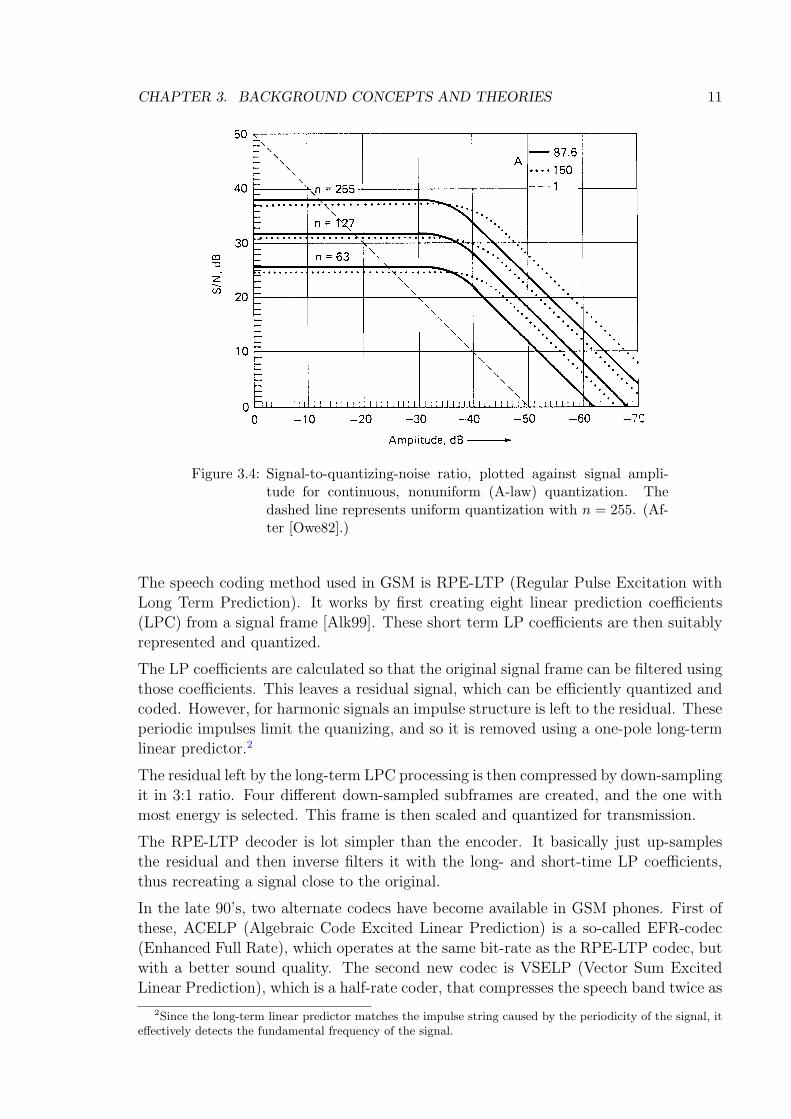
3.4 Signal-to-quantizing-noise ratio, plotted against signal amplitude forcontinuous, nonuniform (A-law) quantization. The dashed line repre-sents uniform quantization with n = 255. (After [Owe82].) . . . . . . . 11
3.5 The principle of zero-crossing pitch detector. . . . . . . . . . . . . . . 13
3.6 Waveform and autocorrelation graphs of vowel /i/. . . . . . . . . . . . 14
3.7 Spectrum of vowel /i/ after the transmission path. . . . . . . . . . . . 16
3.8 Scheme of the transcription system presented by Bello, Monti and Sandler. 18
4.1 Waveforms, spectra and autocorrelation graphs of sung vowel /u/. . . . 22
4.2 Block diagram of the fundamental frequency detector. . . . . . . . . . . 23
4.3 Periodic extension of sinusoid not periodic in observation interval. (After[Har78].) . . . . . . . . . . . . . . . . . . . . . . . . . . . . . . . . . . . 23
4.4 Local peaks in an autocorrelation vector. . . . . . . . . . . . . . . . . . 24
4.5 Peaks in an autocorrelation vector as detected by the peak detectionalgorithm. . . . . . . . . . . . . . . . . . . . . . . . . . . . . . . . . . . 25
4.6 Autocorrelation of a Hamming window. . . . . . . . . . . . . . . . . . . 25
4.7 Error function for the whole frame and limited to vicinity of the peaks. 27
4.8 Effect of different window approximations on voicedness detection. . . . 28
4.9 Execution times of the melody detection program as a function of record-ing length. . . . . . . . . . . . . . . . . . . . . . . . . . . . . . . . . . . 33
ix

5.1 Monolithic service architecture. . . . . . . . . . . . . . . . . . . . . . . 35
5.2 A synchronous distributed system. . . . . . . . . . . . . . . . . . . . . 36
5.3 An asynchronous distributed system. . . . . . . . . . . . . . . . . . . . 37
5.4 A partially asynchronous distributed system. . . . . . . . . . . . . . . . 37
5.5 IVR service quality as a function of traffic intensity. . . . . . . . . . . . 39
5.6 Backend service quality as a function of request intensity. . . . . . . . . 40
5.7 Backend service load simulation graph. . . . . . . . . . . . . . . . . . . 41
5.8 Basic IVR line bundling. . . . . . . . . . . . . . . . . . . . . . . . . . . 43
5.9 Multiple IVR servers. . . . . . . . . . . . . . . . . . . . . . . . . . . . . 44
5.10 Separate processing backend. . . . . . . . . . . . . . . . . . . . . . . . . 44
5.11 VoiceXML Architecture. . . . . . . . . . . . . . . . . . . . . . . . . . . 51
5.12 Rring development framework architecture. . . . . . . . . . . . . . . . . 53
5.13 Sample processing times in test runs on a Celeron CPU. . . . . . . . . 55
5.14 Sample processing times in test runs on a Athlon XP CPU. . . . . . . . 56
x

Chapter 1
Introduction
The growth of mobile short messaging services has been huge in the last years. Eventhough first Finnish commercial SMS content services were launched in 1998, the mar-ket value in Finland in 2001 was already 44 million euro [Min01, Min02]. The largestsingle service group was ringing tone services, amounting to 24% of all service requestsin 2001. It is predicted, however, that the value of ringing tone services rises onlyslightly in the future, as the market will already saturate [Min02].
Currently all ringing tone services on the market are very similar to each other. Pre-made ringing tones can be selected from a list and ordered to user’s own or otherdefined mobile phone number. The services differentiate each other only by brandingor by the quality of pre-made ringing tones.
Given the market situation outlined in the previous paragraphs, it is obvious thatnew ringing tone services, which clearly differentiate the service provider from thecompetition, are sought for. So, when Dr. Tero Tolonen in 1999 had an idea of makingan interactive ringing tone service, the idea was aptly researched, and a project tomake such a service was begun.
The service implemented in this work—dubbed Rring—is a ringing tone service, inwhich the user can sing, whistle or hum himself a new mobile phone ringing tone.Present technologies are utilized in a way that a novel service is created, and so thetechnologies are extended to new markets.
To use the service, the user dials a telephone number. He or she hears a instructionrecording, in which he is asked to sing or hum after a beep. After recording theperformance, the service transforms the recorded melody to a symbolic, or object-based notation, which is then transformed to a vendor-specific ringing tone format andsent to the user.
The service is implemented as an interactive voice response system, but so that it is aseasy to use as leaving an answering-machine message would be. Since the service onlyutilizes user interface elements already known to the user, the barrier to use is keptlow.
The title of this thesis is Development of an mobile interactive musical service. Thetitle can be broken down as follows. Development means that the work covers thealgorithm selection and implementation, as well as the service framework design and
1
CHAPTER 1. INTRODUCTION 2
implementation. Mobile refers to the fact that the service is characteristically a mobilephone application. Interactive means that the user is not just a passive consumer ofthe service, but actually actively participates in the process. Musical stands for themusical properties of the service. The user sings, hums or whistles to interact with theservice. Service means that the main effort in the thesis has been to create a service,which customers can use with ease. The barrier of use should be kept low and usabilityand attractiveness should be important design aspects.
The structure of this thesis is as follows.
Chapter 2 gives an overview of the service and describes the different high-level com-ponents. It is recommended to read this chapter first to familiarize oneself withthe overall structure of the service.
Chapter 3 reviews different algorithms and background information related to thesubject of this thesis.
Chapter 4 describes the particular algorithms chosen for this work and their imple-mentation specifics. The emphasis is in the digital signal processing part of theservice.
Chapter 5 describes the architecture of the service and several implementation is-sues such as processing power requirements, traffic analysis and scalability of theservice.
Chapter 6 reviews some upcoming technologies relevant to mobile music entertain-ment services. These include further development ideas and an operating systemreview to chart viable platforms for client-side music entertainment services.
Chapter 7 concludes the thesis, analyzing the achievements of the work and summa-rizing the results.

Chapter 2
Overview of the system
This chapter gives an overview of the service and familiarizes the reader with the termsand concepts connected to it.
As mentioned in Chapter 1, Rring is a ringing tone service, in which the user createshimself a new, individual ringing tone. The following section gives some usage scenariosfor the service. Then, in the light of these scenarios, the structure of the service isdiscussed.
2.1 Use cases
Usage of the Rring service is illustrated using terminology and concepts coined byUniversal Modeling Language (UML) [Obj02]. Basic use is described using two usescenarios. The respective UML Use case diagram is shown in Figure 2.1. The stickfigure represents the user, who is the actor in these cases. The user may either use theservice to create a ringing tone, or forward a created ringing tone to someone else.
User
Create ringing tone
Forward ringing tone
Figure 2.1: Rring use case diagram showing the common use cases.
The first scenario consists of a basic interaction between a user and the system.
A high-school student, having listened to her friend’s new personalizedringing tone, decides to make one to her own mobile phone. She dials theadvertised service number, and listens to the welcome and instruction record-ing. After a tone she whistles the theme of her all-time favorite piece, Eu-rope’s The Final Countdown. After whistling, she hangs up as instructed.
3
CHAPTER 2. OVERVIEW OF THE SYSTEM 4
The service then converts the melody to a ringing tone and sends it as anSMS message to the phone number the user dialed from. Almost immediatelyher mobile phone beeps and tells a new ringing tone has arrived. She listensto the ringing tone, which resembles her whistling, including all the errorsshe made while whistling. She finds it incredibly amusing and sets it as theringing tone of her phone.
The first scenario describes the service actually implemented as a result of this thesis.
The second scenario is a sequel to the first one. In it, the user forwards a ringing toneto her friend, thus giving added value to the created ringing tone.
The generated ringing tone, while having an unmistakable home-bakedflavor, still is recognizable as the original piece, and the user wants to shareit with her boyfriend. As the ringing tone-arrived, it was assigned a uniquename. She sends a forwarding request to an SMS service. The service thenre-sends the ringing tone to the number she gave.
While planned as a future addition, the service outlined in the second scenario was notimplemented in this thesis.
2.2 Structure of the service
The use sequence of Rring service is shown in Figure 2.2. As can be seen in theFigure, the service consists of three separate functional modules. The first module,the Interactive Voice Response (IVR) system, automatically handles the telephoneconversation, answering the call, reading prompts and recording user input. The secondmodule, ringing tone conversion (RTC), receives a recording from the IVR system andconverts it to a ringing tone. The third module is the SMS gateway, through whichthe ringing tones are sent to the user.
Figure 2.3 shows a more detailed view of the ringing tone conversion module. Afterreceiving a recording, the RTC server sends it to the pitch detector. The pitch detectorthen creates frame-based pitch and voicedness trajectories from the recording. Thisinformation is then sent to the event creator, which creates musical event data fromthe trajectories. This event data is then sent to a music transcription program, whichcreates MIDI and ringing tone files from the event data. The RTC server then sendsthe ringing tone file to the SMS gateway.

CHAPTER 2. OVERVIEW OF THE SYSTEM 5
User : IVR : Ringing tone conversion : SMS gateway :
Dial Rring
Play instructions
Record
Hangup
Handle recording
Send SMS
Transmit SMS
Figure 2.2: Rring use sequence. Different modules can be seen as verticalbars, with time advancing down on the vertical axis. Interactionbetween the modules can be seen as the different arrows.
RTC server : Pitch detector : Event creation : Music transcription :
Pitch detect wave file
Return frame pitch info
Create events
Return event data
Create ringing tone
Return ringing tone
Figure 2.3: Ringing tone conversion use sequence closeup. Time advancesdownwards on the vertical axis, and different arrows representinteraction between the different modules.

Chapter 3
Background concepts and theories
This Chapter first gives an introduction to human speech production, after whicha primer to relevant voice telecommunication technologies is given. Some differentfundamental frequency detection methods are reviewed, and finally event creation andmusic transcription technologies are discussed.
3.1 Speech production
According to Rossing [Ros90], human speech production system is as follows. In speak-ing, air is forced from the lungs through the larynx into the three main cavities of thevocal tract: the pharynx and the nasal and oral cavities. From the nasal and oralcavities, the air flows through the nose and mouth, respectively. In order to producespeech sounds, the flow of air is interrupted by the vocal cords or by constrictions inthe vocal tract made with the tongue or lips. The sounds from the interrupted flow areappropriately modified by various cavities in the vocal tract and are eventually radiatedas speech from the mouth and the nose. The human vocal organs and a representationof their main acoustical features are shown in Figure 3.1.
Figure 3.1: Human vocal organs and a representation of their main acous-tical features. (After J. L. Flanagan [Fla65].)
Voiced sounds are produced by vocal cords. They modulate the air flow by rapidly
6
CHAPTER 3. BACKGROUND CONCEPTS AND THEORIES 7
opening and closing, and this vibration produces a buzzing sound from which voicedsounds are created. These glottal pulses generated by the vocal cords define the funda-mental frequency of speech. During normal speech, the vibration rate may vary overone actave, although the range of a singer’s voice is more than two octaves. Typicalfrequencies used in speech are 110 Hz in the male, 220 Hz in the female and 300 Hz inthe child, with wide individual variations. The pitch of a male singer can be as low as80 Hz.
Different voiced sounds are produced by the vocal tract. The vocal tract, as shown inFigure 3.1, can be considered a single tube extending from the vocal cords to the lips,with a side branch leading to the nasal cavity. It transforms the sounds produced bythe vocal cords into distinct vowels and voiced consonants. This is accomplished bychanging the shape of the vocal tract to produce various acoustic resonances. Theseresonances, or peaks in the sound spectra of vowels, exist independently of pitch, andare called formants. They appear as envelopes that modify the amplitudes of thevarious harmonics of the source sound.
The relative positions of the formants differ for different vowels. Generally speaking,different vowels can be distinguished from each other if the two first formats of speechare transmitted. However, for sound quality and recognition of individual speakers,transmission of more than two formants is preferred.
Peterson and Barney [PB52] measured the formant frequencies of vowels that wereperceived to be equivalent. Their results are shown in Figure 3.2, which shows secondformant frequency as a function of first formant frequency for several vowels spokenby men and children. The broad ellipses show the approximate range of variation informant frequencies for each of these vowels.
3.2 Voice telecommunication technologies
Modern public switch telephone network (PSTN) is a direct descendant of first tele-phone networks of 1880’s. While the transmission technologies have fundamentallychanged from original dedicated twisted pairs to carrier-based technologies to digitalPCM transmission using broadband coaxial cables and optical transmission, the cus-tomer interface still remains essentially the same. The PSTN telephone connection stillis a copper twisted pair with same electrical specifications as decades earlier. Thereforealso the transmission band and dynamic range are “set in stone”. This Section intendsnot to give a complete review of history of telephony development, but to summarizemodern voice telecommunications technologies relevant to this thesis.
3.2.1 Public switched telephone network
Figure 3.3 shows the frequency response of a typical telephone band integrated codec/filter.Also shown are the transition band boundaries. The telephone transmission band isdefined to be 300–3400 Hz. The necessary bandwidth was defined to (barely) fit thefirst four formant frequencies for vowels in male speech. This improves the legibility ofspeech and assists in personalizing the sound. The lower limit of the bandwidth was

CHAPTER 3. BACKGROUND CONCEPTS AND THEORIES 8
Figure 3.2: Plot of second formant frequency versus first formant frequencyfor vowels by a wide range of speakers. (After Peterson andBarney [PB52].)

CHAPTER 3. BACKGROUND CONCEPTS AND THEORIES 9
set to provide an ample transition band for a high-pass filter. The high-pass filter wasdeemed necessary to eliminate any possibility of the 50 Hz (in North-America 60 Hz)mains hum coupling to the telephone signal. The higher limit was set so that the signalcan be sampled at a sampling rate of 8 kHz. The 600 Hz transition band was needed sothat analog anti-aliasing filters could be implemented economically. Figure 3.3 showsthat especially the lower transition band slope is allowed to be quite gentle, with only23 dB of attenuation at 60 Hz. It also has to be noted that while the lower limit oftelephone band is 300 Hz, the maximum attenuation at 200 Hz is still less than 2 dB.1
Figure 3.3: Telephone band limits and transfer characteristics of a Texas In-struments TCM29C13 single-chip PCM codec and filter. (After[Tex86].)
The signal is sampled at 8 bits per sample, so that the voice channel becomes repre-sented by a stream of pulses with a repetition rate of 64 kHz. Uniform quantization ofthe signal, while the most straightforward and obvious choice, is not statistically jus-tifiable. The probability distributions of message signal amplitudes are rarely, if ever,uniform. In speech, the probability of occurrence of a small amplitude is much greater
1There may be additional filtering performed in other parts of the telephone network, though.
CHAPTER 3. BACKGROUND CONCEPTS AND THEORIES 10
than a large one. Experiments have shown that the probability distribution of speechsignal amplitudes is approximately exponential [Dav52]. Furthermore, the range ofamplitudes that can occur within a transmission system is considerable. Telephony,in particular, demands that quantizing equipment be designed to accept a wide rangeof amplitudes due to the wide attenuation differences of transmission lines within aswitched telephone network [Owe82]. (The difference in level between two telephonic-speech signals can easily exceed 30 dB.) Consequently, it is appropriate to allocatemany quantization steps in the small amplitude region, and only a few in the largeamplitude region. This technique is referred to as nonuniform quantization.
The nonuniform quantizations in use are µ-law and A-law. They are used in Americasand in Eurasia, Africa and Australia/Pacific respectively. The companding algorithmof µ-law is
y =log(1 + µx)
log(1 + µ), (3.1)
where µ is the companding rate (normally µ = 100). The respective algorithm forA-law is
y =Ax
1 + log Afor 0 ≤ x ≤ 1
A(3.2)
y =1 + log(Ax)
1 + log Afor
1
A≤ x ≤ 1 , (3.3)
where A is the companding rate (normally A = 87.6).
Figure 3.4 represents signal-to-quantizing-noise ratio of an A-law companded signal. Itcan be seen that the ratio is 38 dB for a wide range of signal amplitudes, and beginsto fall a lot later than with uniform quantization.
3.2.2 GSM
The abbreviation GSM originates from French words Groupe Special Mobile, whichwas the name of CEPT (Conference Europeenne des Administrations des Postes etdes Telecommunications, or European Conference of Postal and TelecommunicationsAdministrations) workgroup founded in 1982 [HAHN93]. It was assigned to define anext generation digital mobile phone system. To ensure creation of a pan-Europeanmobile phone system, a memorandum of understanding to implement GSM in mostEuropean countries was signed in 1987. The first GSM commercial network was openedin 1991. Nowadays it is the leading second-generation mobile phone standard in theworld.
GSM works on several frequency bands. In addition to the original 900 MHz band, a1800 MHz band is allocated as well to reduce bandwidth congestion. In North America,GSM phones transmit at 1900 MHz. In the frequency domain, the allocated bands aredivided to several 200 kHz bands. In the time domain, these bands are further dividedto eight different time slots. The transmission rate in the channel is 22.8 kbit/s, whichis divided so that 13 kbit/s is the speech codec bit rate and the rest is allocated forerror correction.
CHAPTER 3. BACKGROUND CONCEPTS AND THEORIES 11
Figure 3.4: Signal-to-quantizing-noise ratio, plotted against signal ampli-tude for continuous, nonuniform (A-law) quantization. Thedashed line represents uniform quantization with n = 255. (Af-ter [Owe82].)
The speech coding method used in GSM is RPE-LTP (Regular Pulse Excitation withLong Term Prediction). It works by first creating eight linear prediction coefficients(LPC) from a signal frame [Alk99]. These short term LP coefficients are then suitablyrepresented and quantized.
The LP coefficients are calculated so that the original signal frame can be filtered usingthose coefficients. This leaves a residual signal, which can be efficiently quantized andcoded. However, for harmonic signals an impulse structure is left to the residual. Theseperiodic impulses limit the quanizing, and so it is removed using a one-pole long-termlinear predictor.2
The residual left by the long-term LPC processing is then compressed by down-samplingit in 3:1 ratio. Four different down-sampled subframes are created, and the one withmost energy is selected. This frame is then scaled and quantized for transmission.
The RPE-LTP decoder is lot simpler than the encoder. It basically just up-samplesthe residual and then inverse filters it with the long- and short-time LP coefficients,thus recreating a signal close to the original.
In the late 90’s, two alternate codecs have become available in GSM phones. First ofthese, ACELP (Algebraic Code Excited Linear Prediction) is a so-called EFR-codec(Enhanced Full Rate), which operates at the same bit-rate as the RPE-LTP codec, butwith a better sound quality. The second new codec is VSELP (Vector Sum ExcitedLinear Prediction), which is a half-rate coder, that compresses the speech band twice as
2Since the long-term linear predictor matches the impulse string caused by the periodicity of the signal, iteffectively detects the fundamental frequency of the signal.

CHAPTER 3. BACKGROUND CONCEPTS AND THEORIES 12
effectively as the RPE-LTP-codec. This enables theoretical doubling of GSM transmis-sion capacity. The half-rate codec is primarily used in large metropolies of South-EastAsia, while the EFR codec has been more widely adopted. All these speech codingmethods are based on LPC-analysis.
Codec speech quality is commonly measured using mean opinion scores (MOS) [itu96].The MOS quality metric scale is represented in Table 3.1. The RPE-LTP codec hasa MOS value of 3.5, while the EFR codec reaches 4.0. The half-rate codec also hasa MOS value of 3.5. For comparison, the MOS value of the A-law companded PSTNtelephone transmission path is 4.5 [Sch01].
Score MOS5 excellent4 good3 fair2 poor1 bad
Table 3.1: Mean Opinion Score scale.
3.3 Fundamental frequency detection methods for monophonicsignals
Fundamental frequency detection is an algorithm with a myriad of applications. Musi-cal applications, which this presentation mainly handles, include for example automaticnotation, pitch-shifting (so-called auto-tuning) and speech coding applications.
Fundamental frequency is physically the lowest frequency in the harmonic structureof sound. The perceived pitch is a complex phenomenon which includes much morethan just detection of fundamental frequencies. For example, the human ear can fol-low several pitch trajectories simultaneously, and detect slight but expressive pitchdeviations such as vibrato and microtonal intervals. The ear can be led into hearingnon-existing pitches such as fundamental frequencies implied by the presence of theirharmonic series. Other examples of cheating the ear include illusory pitch trajectoriessuch as sounds that appear to be continuously ascending or descending [Ros90].
While not accurate from the psychoacoustic viewpoint, in signal processing applicationsfundamental frequency and pitch are often considered to be synonymous.
The majority of research in fundamental frequency detection methods is focused aroundfew distinct applications, pitch detection of speech being most prominent of them.Using speech oriented pitch estimators in music applications is not without problems,though. Speech pitch estimators are generally accurate on a relatively narrow frequencyband, about 100–600 Hz. In musical applications the pitch varies over a wide range offrequencies. For example, it can be assumed the input may be sung or whistled. Pitchof a whistled melody may vary from 700 to 2800 Hz [Ros90], while the pitch of a malesinger can be as low as 80 Hz. So, a musical pitch detector should be able to handle apitch range of 80–2800 Hz, a range of over 5 octaves.
CHAPTER 3. BACKGROUND CONCEPTS AND THEORIES 13
The pitch detection methods can be divided into three categories depending on thedomain they operate in: time-, frequency- and cepstrum-domain [RCRM76]. Exam-ples of time-domain algorithms include waveform-based methods and autocorrelationmethods. Frequency and cepstrum domain methods usually make use of the discreteFourier transform (DFT).
Some pitch detection algorithms are reviewed below shortly. Waveform-based methodsare discussed first. After that, autocorrelation and DFT methods are discussed. TheSection ends with a short review of cepstrum-based pitch detection methods.
3.3.1 Waveform-based fundamental frequency detection methods
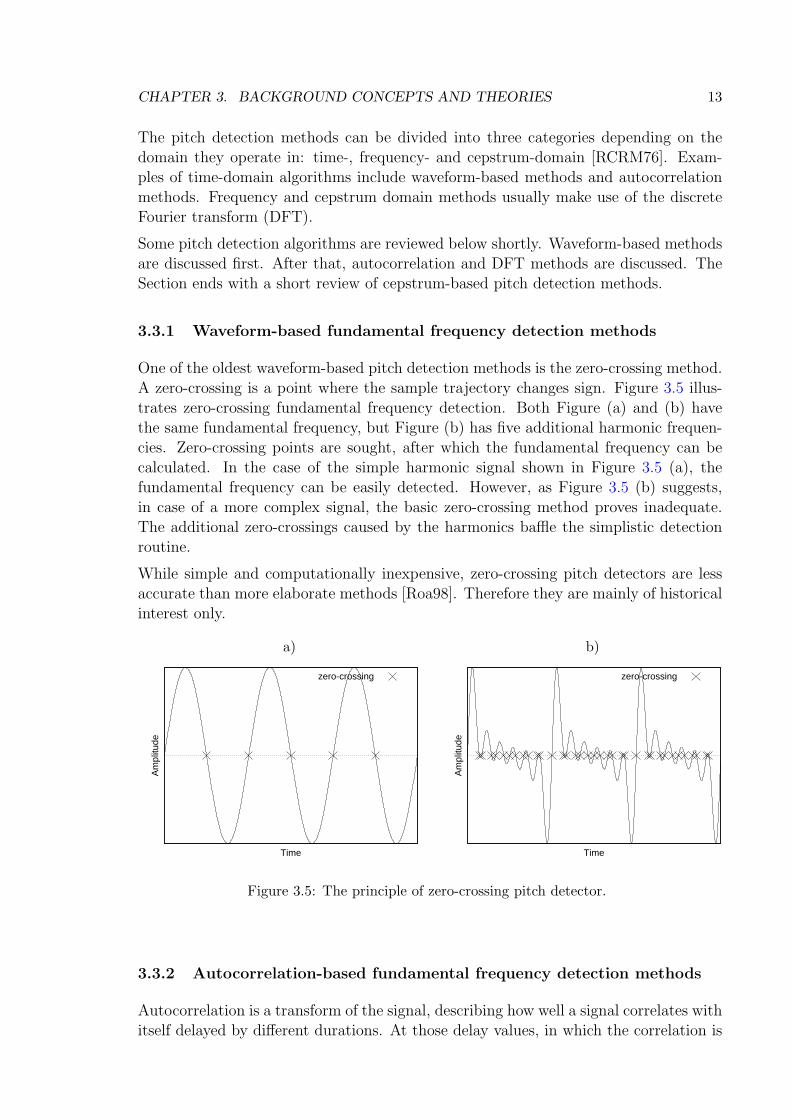
One of the oldest waveform-based pitch detection methods is the zero-crossing method.A zero-crossing is a point where the sample trajectory changes sign. Figure 3.5 illus-trates zero-crossing fundamental frequency detection. Both Figure (a) and (b) havethe same fundamental frequency, but Figure (b) has five additional harmonic frequen-cies. Zero-crossing points are sought, after which the fundamental frequency can becalculated. In the case of the simple harmonic signal shown in Figure 3.5 (a), thefundamental frequency can be easily detected. However, as Figure 3.5 (b) suggests,in case of a more complex signal, the basic zero-crossing method proves inadequate.The additional zero-crossings caused by the harmonics baffle the simplistic detectionroutine.
While simple and computationally inexpensive, zero-crossing pitch detectors are lessaccurate than more elaborate methods [Roa98]. Therefore they are mainly of historicalinterest only.
a) b)
Am
plitu
de
Time
zero-crossing
Am
plitu
de
Time
zero-crossing
Figure 3.5: The principle of zero-crossing pitch detector.
3.3.2 Autocorrelation-based fundamental frequency detection methods
Autocorrelation is a transform of the signal, describing how well a signal correlates withitself delayed by different durations. At those delay values, in which the correlation is
CHAPTER 3. BACKGROUND CONCEPTS AND THEORIES 14
strong, periodicity of the signal can be assumed. If the basic period t0, the lag valueof the first correlation peak associated with the desired signal, can be extracted, thefundamental frequency f0 can be extracted trivially:
f0 =1
t0. (3.4)
The fundamental frequency at each instance of time is calculated using short-timeautocorrelation analysis [Rab77]. In short-time autocorrelation analysis, the signal issplit into short segments, for which the autocorrelation function is calculated.
The short-time autocorrelation function of a short segment of signal x(n) is defined as
φk(m) =1
N
N−1∑n=0
[x(n+k)w(n)][x(n+k+m)w(n+m)], 0 ≤ m ≤ MC−1, N ≤ MC (3.5)
where MC is the number of autocorrelation points to be computed, N is number ofsamples in the segment, k is the index of the starting sample of the frame, and w(n)is the time-domain window function, such as the Hamming or Hanning window.3
For efficiency, short-time autocorrelation analysis is often implemented using fast cor-relation, which requires of computation of two discrete Fourier transforms:
φk(m) =1
NF−1
D
[F ∗
D[x(k)]FD[x(k)]], (3.6)
where FD is a discrete Fourier transform, ()∗ is a complex conjugate function and x(k)is the signal segment.
-0.25
-0.2
-0.15
-0.1
-0.05
0
0.05
0.1
0.15
0.2
0.25
0 0.005 0.01 0.015 0.02 0.025 0.03 0.035 0.04 0.045
Am
plitu
de
time (s)
Waveform of vowel /i/
-6
-4
-2
0
2
4
6
8
0 0.005 0.01 0.015 0.02 0.025 0.03 0.035 0.04 0.045
Am
plitu
de
lag (s)
Autocorrelation graph of vowel /i/
1
2
3
45
6 7
8 9
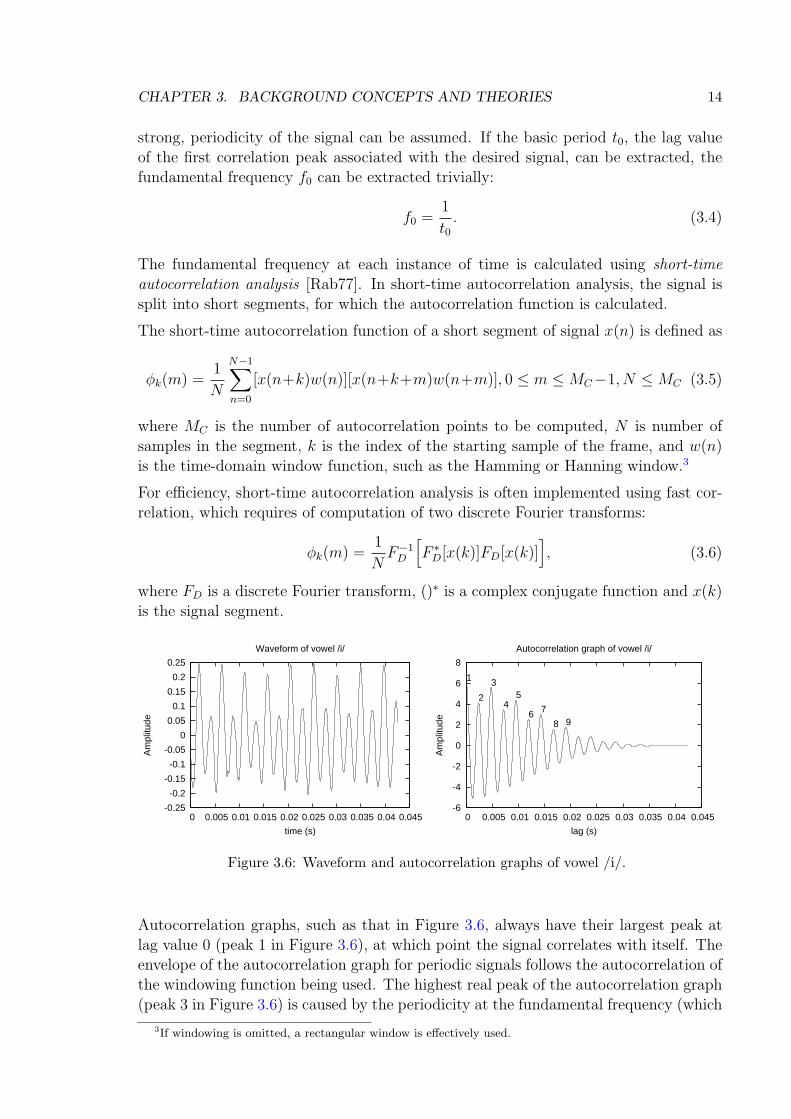
Figure 3.6: Waveform and autocorrelation graphs of vowel /i/.
Autocorrelation graphs, such as that in Figure 3.6, always have their largest peak atlag value 0 (peak 1 in Figure 3.6), at which point the signal correlates with itself. Theenvelope of the autocorrelation graph for periodic signals follows the autocorrelation ofthe windowing function being used. The highest real peak of the autocorrelation graph(peak 3 in Figure 3.6) is caused by the periodicity at the fundamental frequency (which
3If windowing is omitted, a rectangular window is effectively used.
CHAPTER 3. BACKGROUND CONCEPTS AND THEORIES 15
is the strongest periodicity in the signal). There may be peaks between the zero lagvalue and the fundamental frequency peak (peak 2 in Figure 3.6), which correspond tothe harmonics of the fundamental frequency. The other peaks in the autocorrelationgraph are caused by the fundamental and the higher harmonics delayed by more thanone cycle. Thus peaks 3, 5, 7 and 9 in Figure 3.6 are also caused by the fundamentalfrequency, and peaks 2, 4, 6 and 8 by the second harmonic (which also adds up topeaks 3, 5, 7 and 9).
Fundamental frequency can be extracted from the autocorrelation data by taking thelag value of the greatest peak of the autocorrelation graph and applying Equation (3.4)to the value. For example in Figure 3.6, the greatest peak (peak no. 3) is at lag valueof 4.7 ms, so the fundamental frequency is 210 Hz.
One of the problems with basic autocorrelation is its poor resolution. Only very fewsignal components can actually be distinguished in the autocorrelation graph. Har-monic overtones also tend to slightly dislocate the peaks, giving false fundamentalfrequencies. To improve the resolution, Judith C. Brown has proposed a narrowedautocorrelation algorithm [BP89, Bro91], which makes the autocorrelation peaks sig-nificantly narrower, allowing more detail to show. The computational requirements aresignificantly higher, though.
Another problem with autocorrelation based methods is their subjectiveness to har-monic errors. In such case, the autocorrelation graph becomes distorted so that a peakcaused by a higher harmonic for some reason is higher than the peak caused by the fun-damental frequency. In Figure 3.6, this would happen if peak 2 were higher than peak3. Some proposed methods to alleviate this problem include Sondhi’s center-clippingmethod [Son68] or methods that aim at whitening the spectrum of the signal. In speechanalysis, the use of Linear Predictive Coding (LPC) residual is common. This thesisalso addresses the harmonic error problem in Section 4.1.
3.3.3 DFT-based methods
The Fourier transform is a signal transform, in which a spectral representation of a time-based signal is computed. Figure 3.7 shows the magnitude of the Fourier transformof time-based signal displayed in Figure 3.6. In ideal conditions, the fundamentalfrequency simply equals to the location of the strongest peak in the Fourier transform.In practice, the harmonic series of the frequency is often used to gather additionalinformation.
In telephony applications, usefulness of methods based on DFT are limited because ofthe limited bandwidth of the transmission path. According to Rossing [Ros90], typ-ical fundemental frequencies of speech are 110 Hz for male speakers, and 220 Hz forfemales. In singer’s voice this may vary for more than two octaves. Since the lowerlimit of telephone bandwidth is 300 Hz, the transmission path causes the fundamentalfrequencies either to attenuate strongly, or disappear altogether. Because of this, har-monic matching methods have to be utilized in these conditions, and even they haveto be adapted for missing fundamental frequencies.
Harmonic matching methods estimate the fundamental frequency using a theoretical

CHAPTER 3. BACKGROUND CONCEPTS AND THEORIES 16
-60
-50
-40
-30
-20
-10
0
10
20
30
40
0 500 1000 1500 2000 2500 3000 3500 4000
Mag
nitu
de (
dB)
f (Hz)
Frequency spectra of vowel /i/
123456789
Figure 3.7: Spectrum of vowel /i/ after the transmission path.
model based on a maximum likelyhood of the fundamental frequency [DR91]. Harmoniccomponents are matched to with fundamental frequencies that would best create sucha harmonic series.
3.3.4 Cepstrum-based methods
Cepstral methods are commonly used in speech analysis, as they are able to separatethe glottal frequency from vocal tract resonances. The Cepstrum cx(k) of a signal isobtained as follows:
cx(k) = F−1D
[log|FD[x(k)]|
]. (3.7)
The fundamental period can be derived from the peak in the cepstral domain repre-sentation.
The problems of cepstral pitch detection are that it can only analyze a rather narrowfrequency range, and that it relies on the presence of harmonics in the input signal.It therefore fails to detect pitch in whistled input, as whistling produces a quite puresinusoidal tone with few harmonics.
3.4 Automatic transcription of music
Transcription of music is defined to be the act of listening to a piece of music andof writing down musical notation for the notes that constitute the piece. In otherterms, this means transforming an acoustic signal into a symbolic representation, which
CHAPTER 3. BACKGROUND CONCEPTS AND THEORIES 17
comprises notes, their pitches, timings, and a classification of the instruments used[Kla97].
Computational auditory scene analysis (CASA) as an area of research greatly influencedby Albert Bregman and his book “Auditory Scene Analysis” [Bre90]. CASA tries toautomatically analyse the acoustic information coming from a physical environmentand to interpret the numerous distinct events in it. The scope covers everything fromsimple onset-detection algorithms to complete sound-description systems that aim to’explain’ unrestricted real-world sound ambiences into symbolic representations reflect-ing the perceived source structure [Ell96].
It is common in computational auditory scene analysis to distinguish from the auditoryperception process three separate levels of representation. The low-level representationsare those appropriate to describe the sound signal reaching the cochlea, whereas thehigh-level representations convey meaning, and are those to which human beings havecognitive access, such as “Someone is whistling the James Bond theme”.
Between the high and low-level representations lies a network of representations labeledmid-level, about which there is little direct knowledge, as the relevant physiology ofthe brain is just beginning to be understood. The knowledge of these representationsarises mainly from the constrains imposed on them at the lower and higher levels aboutwhich more is known [Ell95].
Despite the lack of knowledge of mid-level representations, computer models can bebuilt to bridge the gap between low and high-level representations.
Since the low-level functions of hearing and signal processing are thought to be rela-tively well known, the approach of making mid-level representations has mostly beenbottom-up. In these approaches, information is observed in an acoustic waveform,combined to provide meaningful auditory cues, and passed to higher-level processesfor further interpretation. No information flows in the other direction. Because ofthe order of the information flow, the approach is also called data-driven processing[Kla97].
However, while bottom-up processes are needed to process the acoustic waveform in-formation, to apply them to the whole auditory perception process would be a grossoversimplification. The mammal auditory perception process has a lot of a-prioriknowledge or expectations of the auditory signals to be heard. This knowledge inter-acts with the hearing process so that information actually flows in both directions,and high-level representation contributes to the mid-level processes. This is called top-down, or prediction-driven processing. An extensive presentation of this approach canbe found in Daniel Ellis’ PhD Thesis [Ell96].
In music-related CASA the low-level representation is commonly considered as theacoustic waveform. While note as a high-level representational symbol of music has tra-ditionally been implicitly accepted, contemporary knowledge of musical perception andcognition does not support this view [Sch96]. Ellis and Scheirer present a prediction-driven model of music perception and cognition, in which the listening process is notseen as a means of virtually transcribing the music into separate note patterns, butrather in which psychoacoustic cues in the data, such as “tracks”, noisy regions, or

CHAPTER 3. BACKGROUND CONCEPTS AND THEORIES 18
onsets in the time-frequency spectrum are highlighted. These psychoacoustic cues arecompared against predictions based on the current musical context, and the agreementsor disagreements between prediction and realization are reflected in a new representa-tion of the musical situation. The representation often is chimeric, combining differentsimultaneous instruments in a single coherent event with its own individual properties,questioning the notational representation of the perceived sound [Bre90].
This work, however, concentrates on transcribing music to a form that resembles theoriginal melody. Although trying to represent the original melody perceptually asclosely as possible theoretically is very much of interest, the arbitrary limits imposedby the ringing tone formats practically reduce the problem back to more conventionalautomatic music transcription.
3.4.1 Bottom-up method of Bello, Monti and Sandler
Bello, Monti and Sandler describe a monophonic transcription system, which workswith a simple bottom-up orientation [BMS00]. The scheme of their transcription sys-tem is shown in Figure 3.8. Their system uses a very straight-forward method of cal-culating pitch values of audible signal segments, converting the pitch values to MIDIkey numbers, and finally collecting the single frame with similar MIDI key numbersto longer events. Their collector detects sound onsets based on the beginning of thesteady state part of the signal, thus ignoring problems with noisy signal attack phase.
Figure 3.8: Scheme of the transcription system presented by Bello, Montiand Sandler.
3.4.2 Methods for signal segmentation
Signal segmentation, i.e. extracting information of the onset and offset of events, isof great importance in creation of ringing tones. The storage space for the melody inringing tones is very limited, and avoiding detection of false event boundaries in thesignal allows for longer melodies.
In his Master’s Thesis Tristan Jehan divides signal segmentation field to frequencyand time-based approaches [Jeh97]. Frequency domain method presented by him isbased on calculating values of High Frequency Content function and energy function

CHAPTER 3. BACKGROUND CONCEPTS AND THEORIES 19
for each frame and using them to calculate the detection function. This approach isalso explored by Bello, Monti and Sandler [BMS00].
The energy function is calculated as a sum of the magnitude squared of each frequencybin:
E =
N2
+1∑k=2
(|X(k)|2) (3.8)
where E is the Energy function for the current frame, N is the FFT array length, andX(k) is the kth bin of the FFT.
The High Frequency Content function is defined as
HFC =
N2
+1∑k=2
(|X(k)|2 · k) (3.9)
where HFC is the High Frequency Content function of the current frame.
Since the noisy onset periods of events usually have a lot of high frequency content, adetection function comparing high frequency content of two consecutive frames can beformulated as
DFr =HFCr
HFCr−1
· HFCr
Er
, (3.10)
where subscript r denotes current frame and r − 1 denotes the previous frame. Peaksof the detection function indicate onsets of events.
Jehan also experimented with alternate event detection methods which worked by high-frequency filtering the HFC trajectory or by comparing the difference of spectra of thesignals. In his experiments these methods were as reliable as the method presentedabove, but they could also indicate the offsets of notes fairly well.
The time-domain approaches explored by Jehan modeled the signal by an autoregres-sive statistical model and then used these statistics to detect changes in the modelparameters.

Chapter 4
Algorithm implementation
The primary motivation behind this thesis was to create an economically viable ringingtone service, in which one could sing, whistle or hum a new and unique ringing tone forhis mobile phone. The intended application for a major part designated the algorithmand technological choices for the implementation. The limitations were as follows:
• Transmission path: the algorithm has to work with telephone bandwidth and overspeech codecs such as the GSM codec.
• Ringing tone formats: upon beginning the work, only mobile phones made byNokia supported sending ringing tones using short messages. Therefore, the ser-vice has to obey the limitations of this format.
• Feasibility: since the service has to be economically viable, development costshave to be capped, and the computational efficiency of the service has to begood.
The aforementioned limitations led to the following initial design choices:
• Monophony. Since the output format is strictly monophonic, polyphonic pitchdetection would be of no use.
• Autocorrelation based pitch detection techniques are used to bypass the band-width limitations, since they work well even when the fundamental frequency ismissing from the signal.
• The design will be kept sufficiently simple to cut the development costs. Thismeans that only traditional bottom-up based transcription algorithms will beused.
In the following sections different design and algorithm choices will be addressed indetail.
20
CHAPTER 4. ALGORITHM IMPLEMENTATION 21
4.1 Fundamental frequency detection
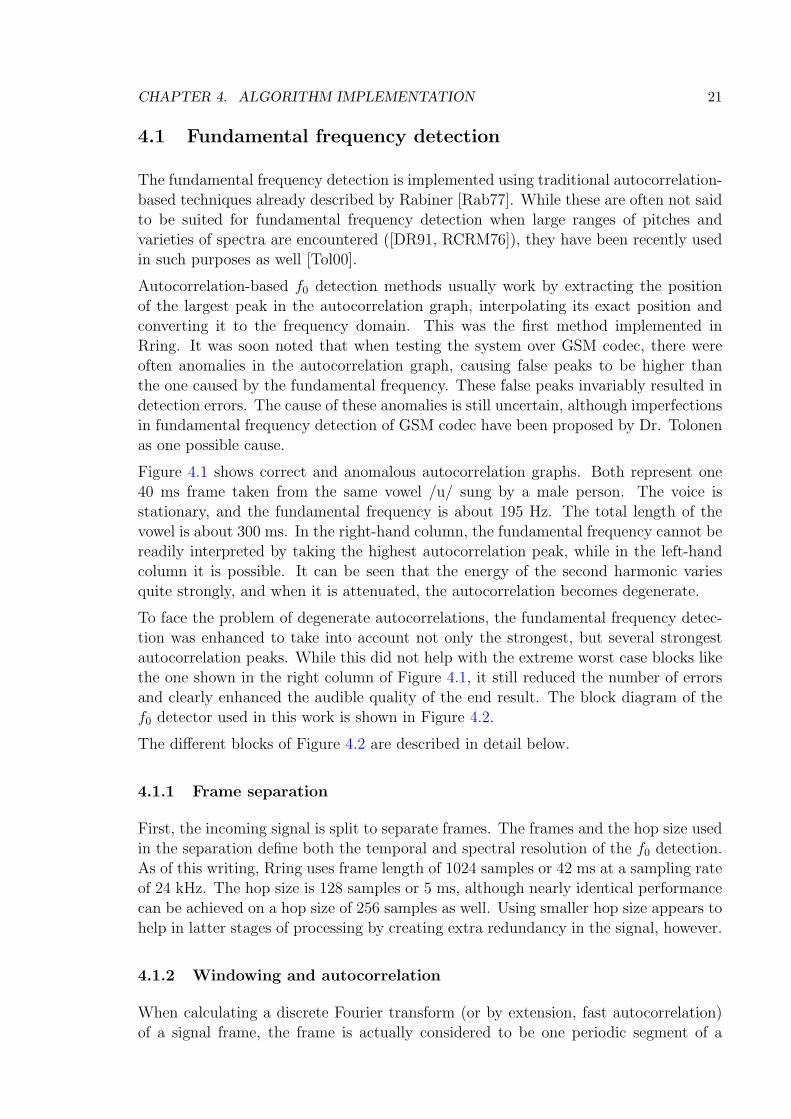
The fundamental frequency detection is implemented using traditional autocorrelation-based techniques already described by Rabiner [Rab77]. While these are often not saidto be suited for fundamental frequency detection when large ranges of pitches andvarieties of spectra are encountered ([DR91, RCRM76]), they have been recently usedin such purposes as well [Tol00].
Autocorrelation-based f0 detection methods usually work by extracting the positionof the largest peak in the autocorrelation graph, interpolating its exact position andconverting it to the frequency domain. This was the first method implemented inRring. It was soon noted that when testing the system over GSM codec, there wereoften anomalies in the autocorrelation graph, causing false peaks to be higher thanthe one caused by the fundamental frequency. These false peaks invariably resulted indetection errors. The cause of these anomalies is still uncertain, although imperfectionsin fundamental frequency detection of GSM codec have been proposed by Dr. Tolonenas one possible cause.
Figure 4.1 shows correct and anomalous autocorrelation graphs. Both represent one40 ms frame taken from the same vowel /u/ sung by a male person. The voice isstationary, and the fundamental frequency is about 195 Hz. The total length of thevowel is about 300 ms. In the right-hand column, the fundamental frequency cannot bereadily interpreted by taking the highest autocorrelation peak, while in the left-handcolumn it is possible. It can be seen that the energy of the second harmonic variesquite strongly, and when it is attenuated, the autocorrelation becomes degenerate.
To face the problem of degenerate autocorrelations, the fundamental frequency detec-tion was enhanced to take into account not only the strongest, but several strongestautocorrelation peaks. While this did not help with the extreme worst case blocks likethe one shown in the right column of Figure 4.1, it still reduced the number of errorsand clearly enhanced the audible quality of the end result. The block diagram of thef0 detector used in this work is shown in Figure 4.2.
The different blocks of Figure 4.2 are described in detail below.
4.1.1 Frame separation
First, the incoming signal is split to separate frames. The frames and the hop size usedin the separation define both the temporal and spectral resolution of the f0 detection.As of this writing, Rring uses frame length of 1024 samples or 42 ms at a sampling rateof 24 kHz. The hop size is 128 samples or 5 ms, although nearly identical performancecan be achieved on a hop size of 256 samples as well. Using smaller hop size appears tohelp in latter stages of processing by creating extra redundancy in the signal, however.
4.1.2 Windowing and autocorrelation
When calculating a discrete Fourier transform (or by extension, fast autocorrelation)of a signal frame, the frame is actually considered to be one periodic segment of a

CHAPTER 4. ALGORITHM IMPLEMENTATION 22
a) b)
-0.8
-0.6
-0.4
-0.2
0
0.2
0.4
0.6
0 0.005 0.01 0.015 0.02 0.025 0.03 0.035 0.04 0.045
Am
plitu
de
time (s)
-0.8
-0.6
-0.4
-0.2
0
0.2
0.4
0.6
0 0.005 0.01 0.015 0.02 0.025 0.03 0.035 0.04 0.045
Am
plitu
de
time (s)
c) d)
-50
-40
-30
-20
-10
0
10
20
30
40
50
0 500 1000 1500 2000 2500 3000 3500 4000
Mag
nitu
de (
dB)
Frequency (Hz)
-50
-40
-30
-20
-10
0
10
20
30
40
50
0 500 1000 1500 2000 2500 3000 3500 4000
Mag
nitu
de (
dB)
Frequency (Hz)
e) f)
-40
-30
-20
-10
0
10
20
30
40
50
0 0.005 0.01 0.015 0.02 0.025 0.03 0.035 0.04 0.045
Am
plitu
de
lag (s)
-40
-30
-20
-10
0
10
20
30
40
50
0 0.005 0.01 0.015 0.02 0.025 0.03 0.035 0.04 0.045
Am
plitu
de
lag (s)
Figure 4.1: Waveforms (a, b), spectra (c, d) and autocorrelation (e, f)graphs of two recordings of sung vowel /u/, both having a funda-mental frequency of approximately 195 Hz (corresponding to alag value of 5.1 ms). The left-hand column (Figures a), c) and e))represents a normal, while the right-hand column (Figures b), d)and f)) represent a recording leading to a degenerate autocorre-lation. In the left-hand column, fundamental frequency can bederived from the autocorrelation graph. In the right-hand col-umn, attenuated second harmonic distorts the autocorrelationand correct f0 detection can be made no longer.

CHAPTER 4. ALGORITHM IMPLEMENTATION 23
Figure 4.2: Block diagram of the fundamental frequency detector.
continuous signal. If the frequencies in the signal do not precisely match the observationinterval, there exist discontinuities between the periodic segments. Figure 4.3 illustratesthis phenomenon. These discontinuities exhibit so-called spectral leakage to the dataset, which corrupts the transform [Har78].
Figure 4.3: Periodic extension of sinusoid not periodic in observation inter-val. (After [Har78].)
According to Harris [Har78], windows are weighting functions applied to data to reducethe spectral leakage associated with finite observation intervals. The window is appliedto data to reduce the order of discontinuity at the boundary of the periodic extension.This is accomplished by matching as many orders of derivative of the weighted dataas possible at the boundary. Windowed data are smoothly brought to zero at theboundaries so that the periodic extension is continuous in many orders of derivative.
Many different window functions have been proposed, each having unique properties.However, all of the commonly used window functions (such as Hanning, Hamming,Blackman, Kaiser) reduce the spectral leakage efficiently enough to be useful in thiswork. Of these, Hamming windowing is used. See [Har78] for a thorough discussion ofdifferent window functions.
A short-time autocorrelation function is calculated from the windowed frames usingEquation (3.6). This yields a list of autocorrelations of frames, from which the peakscan be detected and classified.
4.1.3 Peak detection
Autocorrelation peak detection was designed to collect repeating maxima of the auto-correlation signal, while also correctly taking the effects of windowing of the signal intoaccount. The peaks are detected from the graph by selectively collecting all the localmaxima from the autocorrelation vector. The details of the procedure are described

CHAPTER 4. ALGORITHM IMPLEMENTATION 24
below.
First, all peaks in the autocorrelation vector are detected, as shown in Figure 4.4. Apeak here is defined as any point in the autocorrelation vector, of which neighbors havea lower value.
-10
-5
0
5
10
15
0 0.005 0.01 0.015 0.02 0.025 0.03 0.035 0.04 0.045
Am
plitu
de
lag (s)
AutocorrelationPeaks
Figure 4.4: All local peaks in an autocorrelation vector. The frame is thesame as in Figure 3.6.
After the local peak detection, the detected peaks are traversed in reverse lag order(i.e. from right to left). The first peak is automatically accepted, but after that thenext peaks are accepted only if their height is at least 97% of the previous acceptedpeak (denoted as λ = 0.97). The value of λ is completely heuristic—it has been foundexperimentally, and there is no theoretical reasoning behind it.
Figure 4.5 shows the result of the peak detection algorithm. When peak no. 13 hasbeen detected, the next peak to be detected has to have amplitude of at least λ (97%)that of peak 13. Thus, peaks 8–12 do not apply, but peak 7 clearly applies. After that,no peak exceeds the threshold. The first peak at lag value 0 is ignored, as it providesno information in f0 detection.
Since the envelope of the autocorrelation vector follows the shape of autocorrelationof Hamming window (shown in Figure 4.6), it is evident that there exists a long low-amplitude tail, in which amplitude differences are negligible. Therefore there are plentyof false detections in the right-hand side of the autocorrelation vector. However, thewhole length of the frame has to be analyzed, or low-frequency signals, which havesparse autocorrelation peaks, would not be detected at all.
The peak detection algorithm is presented in pseudocode below.

CHAPTER 4. ALGORITHM IMPLEMENTATION 25
-10
-5
0
5
10
15
0 0.005 0.01 0.015 0.02 0.025 0.03 0.035 0.04 0.045
Am
plitu
de
lag (s)
2
3
4
5
6
7
8
9
10
11
12
13
AutocorrelationPeaks
Selected peaks
Figure 4.5: Peaks in an autocorrelation vector as detected by the peak de-tection algorithm.
0
50
100
150
200
250
300
350
400
450
0 0.005 0.01 0.015 0.02 0.025 0.03 0.035 0.04 0.045
Am
plitu
de
lag (s)
Figure 4.6: Autocorrelation of a Hamming window.

CHAPTER 4. ALGORITHM IMPLEMENTATION 26
last_peak=0
lambda=0.97
for peak in reverse(peaks):
if peak<lambda*last_peak:
peaks=peaks.remove(peak)
else
last_peak=peak
4.1.4 Peak classification
For a periodic signal the autocorrelation function has a period equaling to that ofthe signal. Thus, assuming that part of the gathered autocorrelation peaks belongto the sequence defined by the fundamental frequency and the rest are peaks with nounderlying periodicity, the peak corresponding to the fundamental frequency is the onethat has the most integer ’harmonics’ in the autocorrelation function:
nN = N ∗ n0 where N ∈ N, (4.1)
where nN is the N th periodic of the fundamental lag n0.
Using this knowledge, the following energy function for retrieving the fundamental lagcan be deduced:
E(ν) =N∑
i=1
min2
(1
2−
∣∣∣∣12 − frac(pi
ν
)∣∣∣∣ , κ
), (4.2)
where E(ν) is the total error for the decimal lag value of ν, frac() is a function returningthe fractional part of its argument, N is the total number of accepted autocorrelationpeaks, pi is the lag of ith autocorrelation peak, and κ is an arbitrary maximum valuefor the error induced by a single peak. Currently, κ is set to a value of 0.1.
Equation (4.2) is basically a least-square optimization algorithm (∑
f2()) with a max-imum error limit (f = min(g, κ)) added. Normally error samples are handled in least-square algorithms by dropping L samples with largest errors out, but since the numberof peaks in the calculation varies greatly depending on the fundamental frequency,selection of fixed L would not have been feasible.
To find the fundamental lag, E(ν) must be minimized. To limit detection of falsepositives for small lag values matching many peaks, the search area is limited to bein the vicinity of detected peaks. Furthermore, lag values are limited to a minimumof 0.5 ms (2 kHz) and a maximum of 17 ms (60 Hz). These are reasonable limits forhuman voice scale, both when singing and whistling. The search has to be performedusing interpolated values, since integer values do not give sufficient precision. Theinterpolation method used in this work is cubic interpolation.
Figure 4.7 shows the error function for the left-hand column of Figure 4.1. It can beseen that while the error varies greatly for small lag values, in the search region it isquite predictable and gives the correct result.
CHAPTER 4. ALGORITHM IMPLEMENTATION 27
0
0.2
0.4
0.6
0.8
1
1.2
0 0.005 0.01 0.015 0.02 0.025 0.03 0.035 0.04 0.045
Err
or
lag (s)
Near peaksAll
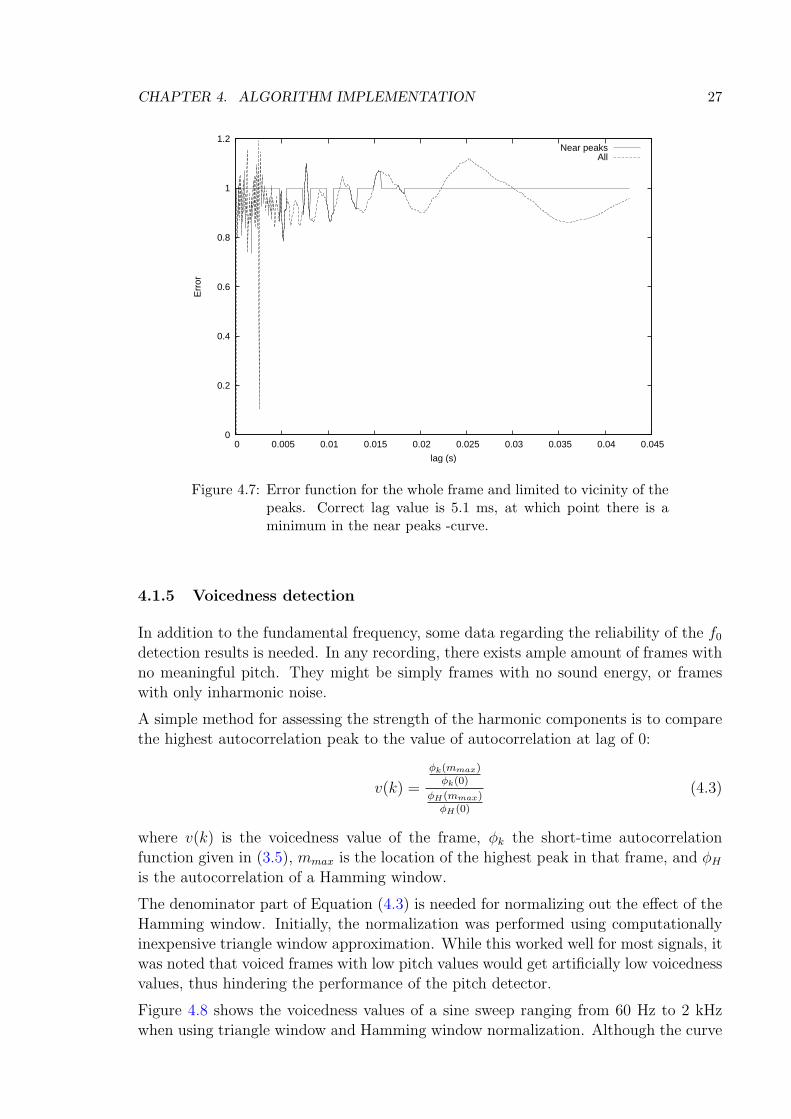
Figure 4.7: Error function for the whole frame and limited to vicinity of thepeaks. Correct lag value is 5.1 ms, at which point there is aminimum in the near peaks -curve.
4.1.5 Voicedness detection
In addition to the fundamental frequency, some data regarding the reliability of the f0
detection results is needed. In any recording, there exists ample amount of frames withno meaningful pitch. They might be simply frames with no sound energy, or frameswith only inharmonic noise.
A simple method for assessing the strength of the harmonic components is to comparethe highest autocorrelation peak to the value of autocorrelation at lag of 0:
v(k) =
φk(mmax)φk(0)
φH(mmax)φH(0)
(4.3)
where v(k) is the voicedness value of the frame, φk the short-time autocorrelationfunction given in (3.5), mmax is the location of the highest peak in that frame, and φH
is the autocorrelation of a Hamming window.
The denominator part of Equation (4.3) is needed for normalizing out the effect of theHamming window. Initially, the normalization was performed using computationallyinexpensive triangle window approximation. While this worked well for most signals, itwas noted that voiced frames with low pitch values would get artificially low voicednessvalues, thus hindering the performance of the pitch detector.
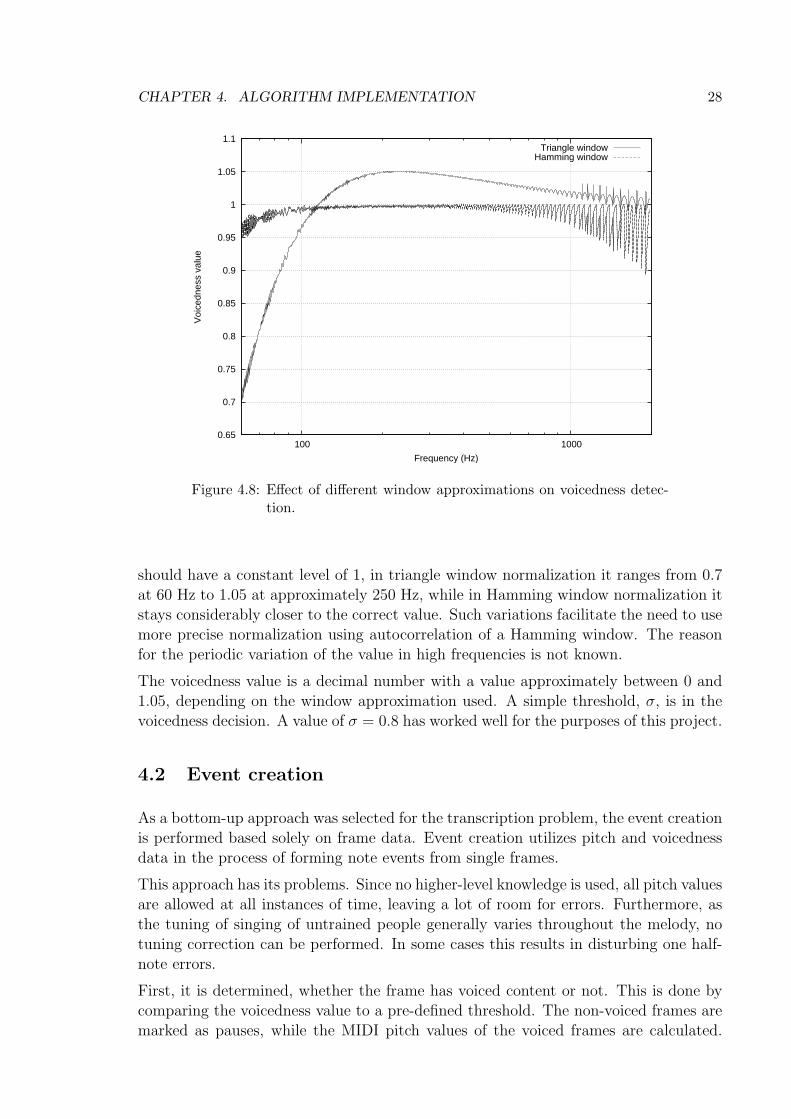
Figure 4.8 shows the voicedness values of a sine sweep ranging from 60 Hz to 2 kHzwhen using triangle window and Hamming window normalization. Although the curve
CHAPTER 4. ALGORITHM IMPLEMENTATION 28
0.65
0.7
0.75
0.8
0.85
0.9
0.95
1
1.05
1.1
100 1000
Voi
cedn
ess
valu
e
Frequency (Hz)
Triangle windowHamming window
Figure 4.8: Effect of different window approximations on voicedness detec-tion.
should have a constant level of 1, in triangle window normalization it ranges from 0.7at 60 Hz to 1.05 at approximately 250 Hz, while in Hamming window normalization itstays considerably closer to the correct value. Such variations facilitate the need to usemore precise normalization using autocorrelation of a Hamming window. The reasonfor the periodic variation of the value in high frequencies is not known.
The voicedness value is a decimal number with a value approximately between 0 and1.05, depending on the window approximation used. A simple threshold, σ, is in thevoicedness decision. A value of σ = 0.8 has worked well for the purposes of this project.
4.2 Event creation
As a bottom-up approach was selected for the transcription problem, the event creationis performed based solely on frame data. Event creation utilizes pitch and voicednessdata in the process of forming note events from single frames.
This approach has its problems. Since no higher-level knowledge is used, all pitch valuesare allowed at all instances of time, leaving a lot of room for errors. Furthermore, asthe tuning of singing of untrained people generally varies throughout the melody, notuning correction can be performed. In some cases this results in disturbing one half-note errors.
First, it is determined, whether the frame has voiced content or not. This is done bycomparing the voicedness value to a pre-defined threshold. The non-voiced frames aremarked as pauses, while the MIDI pitch values of the voiced frames are calculated.

CHAPTER 4. ALGORITHM IMPLEMENTATION 29
Consecutive frames with same pitch values are then concatenated to a single note.
4.2.1 Concatenation algorithm
Single frames are concatenated to note events as follows:
for frame in frames:
if abs(note.pitch-frame.pitch) < maxdelta:
note.pitch =
(note.length*note.pitch+frame.length*frame.pitch)
/
(note.length+frame.length)
note.length = note.length + frame.length
else
notes.append(note)
note.pitch = frame.pitch
note.length = frame.length
where maxdelta is the maximum allowed pitch difference of two note events, belowwhich the events still are concatenated together. A value of 0.5 half-notes was observedto be suitable for maxdelta.
That is, as long as the pitch difference of the note being assembled and the next framedoes not exceed maxdelta (1
2half-notes), the frame is concatenated to the note so
that the pitch value of the note is the weighted sum of the note and the last frame.Otherwise, assembly of a new note begins.
After the first concatenation phase, several heuristics are applied. First, a minimumlength of notes and pauses is enforced. In our experiments, a minimum length of 43 ms(1024 samples at a sampling rate of 24 kHz) was found to be suitable. Shorter eventsare merged to preceding event without any pitch averaging. Then, events with equalrounded MIDI pitch are merged together. These two steps are used to remove shortoctave errors or unvoiced segments from the melody.
After this, one more merging pass is made, in which short notes with a pitch differenceof less than one half-note are merged with adjacent notes. This is done to controlthe unstable attack and release periods of notes, which cause artifacts in the pitchtrajectory.
4.3 Ringing tone conversion
After the event data is output from the event creation routine, it is converted both toan audible melody and to the Nokia Smart Messaging ringing tone format [Nok99].
The transformations were implemented in several steps. First, the event data is con-verted to MIDI file format [MID96] using a custom Perl script. Then, the MIDI file isconverted to a Smart Messaging ringing tone file.
CHAPTER 4. ALGORITHM IMPLEMENTATION 30
While the MIDI generation is a relatively simple format conversion, it also takes careof transposing the melody to pitch range allowed by Nokia mobile handsets. Whilenot stated in [Nok99], it was found that the lowest note Nokia phones can play is C5,and the pitch range is three octaves. The specification [Nok99] defines a range of fouroctaves, beginning from C4, but it was noted that the phones transpose the lowestoctave to the next-higher one. Furthermore, an optimal value for tempo is soughtusing least-square fitting. The optimization criterium is how well note lengths fit full-,half-, quarter- or one-eighth-notes at different tempos.
The ringing tone conversion is performed by another Perl program. The ringing tonespecification imposes many restrictions on the possible tones:
• Note pitch values are limited to exact half-notes (as in MIDI).
• Tempo has to be explicitly defined.
• Note duration is limited to full, 1/2, 1/4, 1/8, 1/16 and 1/32 notes, with dottedand double-dotted variants.
• Pitch is a combination of scale (octave) and note-value, instead of a single value.Once a scale is defined, all further notes are in that scale, until the next scaledefinition.
If tempo detection fails, note duration restrictions may cause unnecessary quantiza-tion of note durations. This has been confirmed in tests, although it has not beena significant problem. The pitch encoding causes problems by making prediction ofthe length of the final melody difficult. For example, the sequence B-C-B-C, whichcrosses scale-boundaries three times, therefore takes nearly twice the space of sequenceC-D-C-D, which stays on one scale only.
The pre-listening melody is generated using the event data as the source. Initially themelody was generated from the MIDI file with a separate MIDI wave-table synthesizerprogram, but to enhance portability a simple sine-tone synthesizer was implementedin Java. This synthesizer uses the event data directly, so that the MIDI conversion isat the moment only used as an intermediate step in the actual ringing tone conversion.
4.4 Computational efficiency of the ringing tone conversion
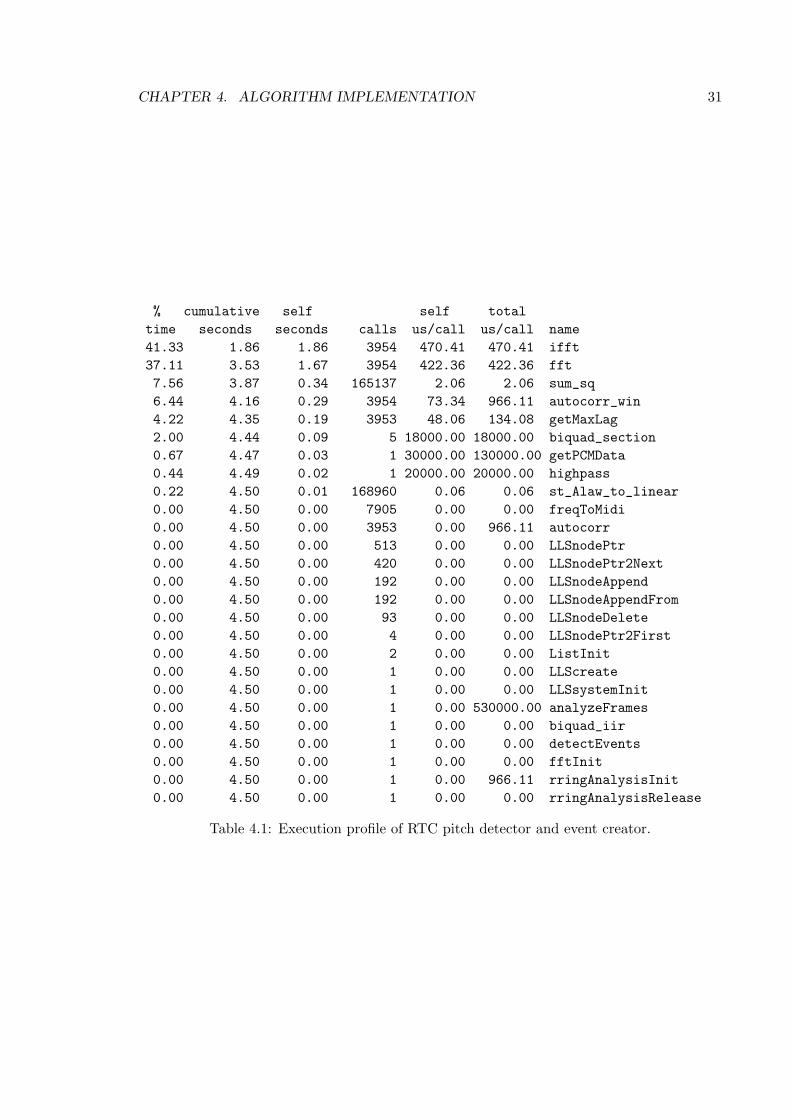
The bulk of the processing time in Rring is spent in the C language analyzer program.Table 4.1 shows the execution profile of the analyzer. It can be seen that nearly 80% ofthe execution time is spent in the FFT routines, so in practice they determine the totalexecution time. FFT is used in Rring to calculate the short-time autocorrelation foreach window. Different methods for optimizing Rring processing power requirementswould be to use some highly optimized FFT implementation or to increase the hop sizeto reduce the amount of analyzed frames.
Figure 4.9 shows execution times of the melody detection program measured withtwo different hardware. In Figure 4.9 a) a modest 375 MHz Intel Celeron processor
CHAPTER 4. ALGORITHM IMPLEMENTATION 31
% cumulative self self totaltime seconds seconds calls us/call us/call name41.33 1.86 1.86 3954 470.41 470.41 ifft37.11 3.53 1.67 3954 422.36 422.36 fft7.56 3.87 0.34 165137 2.06 2.06 sum_sq6.44 4.16 0.29 3954 73.34 966.11 autocorr_win4.22 4.35 0.19 3953 48.06 134.08 getMaxLag2.00 4.44 0.09 5 18000.00 18000.00 biquad_section0.67 4.47 0.03 1 30000.00 130000.00 getPCMData0.44 4.49 0.02 1 20000.00 20000.00 highpass0.22 4.50 0.01 168960 0.06 0.06 st_Alaw_to_linear0.00 4.50 0.00 7905 0.00 0.00 freqToMidi0.00 4.50 0.00 3953 0.00 966.11 autocorr0.00 4.50 0.00 513 0.00 0.00 LLSnodePtr0.00 4.50 0.00 420 0.00 0.00 LLSnodePtr2Next0.00 4.50 0.00 192 0.00 0.00 LLSnodeAppend0.00 4.50 0.00 192 0.00 0.00 LLSnodeAppendFrom0.00 4.50 0.00 93 0.00 0.00 LLSnodeDelete0.00 4.50 0.00 4 0.00 0.00 LLSnodePtr2First0.00 4.50 0.00 2 0.00 0.00 ListInit0.00 4.50 0.00 1 0.00 0.00 LLScreate0.00 4.50 0.00 1 0.00 0.00 LLSsystemInit0.00 4.50 0.00 1 0.00 530000.00 analyzeFrames0.00 4.50 0.00 1 0.00 0.00 biquad_iir0.00 4.50 0.00 1 0.00 0.00 detectEvents0.00 4.50 0.00 1 0.00 0.00 fftInit0.00 4.50 0.00 1 0.00 966.11 rringAnalysisInit0.00 4.50 0.00 1 0.00 0.00 rringAnalysisRelease
Table 4.1: Execution profile of RTC pitch detector and event creator.

CHAPTER 4. ALGORITHM IMPLEMENTATION 32
is used, while Figure 4.9 b) represents execution times of a more modern 1400 MHzAMD Athlon XP processor. The measurements utilize 379 different real-life record-ings, recorded between December 2000 and June 2001. The length of the recordingsvaries from zero to 30 seconds, the average length being 11.1 seconds. Both computerswere running some other services during the measurements, which may have inducedsome extra deviation in processing times. This, however, represents real-life operatingconditions.
The processing speed of the Celeron processor is 16.3 kS/s (kilosamples per second),or 2 times real-time. While this performance is inadequate for proper scalability, theAthlon processor has a more acceptable processing speed of 63.2 kS/s, or approximately8 times real-time.

CHAPTER 4. ALGORITHM IMPLEMENTATION 33
a)
0
2
4
6
8
10
12
14
16
18
0 5 10 15 20 25 30
Pro
cess
ing
time
(sec
onds
)
Clip size (seconds)
Measured durationsFitted curve
b)
0
0.5
1
1.5
2
2.5
3
3.5
4
4.5
0 5 10 15 20 25 30
Pro
cess
ing
time
(sec
onds
)
Clip size (seconds)
Measured durationsFitted curve
Figure 4.9: Execution times of the melody detection program as a functionof recording length. Figure a) shows processing time taken bya Celeron 375 MHz processor, while Figure b) shows processingtime required by a more modern Athlon XP 1400 MHz processor.

Chapter 5
Implementation of a ringing toneservice
5.1 Design goals
The design goals for Rring service have been quality, performance, flexibility, reliability,scalability, usability and profitability. The quality requirement in this context refers tothe quality of produced ringing tones. They should resemble the original piece whereverpossible, without unnecessary omissions or undesired artifacts. Quality considerationsare addressed in Chapter 4, so they are not addressed here anymore.
The performance requirement means that the service has to be able to produce ringingtones in a reasonable amount of time (say, 10–20 seconds for a non-interactive service,or less than 10 seconds for an interactive one), and it has to be able to handle severalsimultaneous service requests without dropping any calls or recordings at any point.
The flexibility requirement means that the service has to be easily adaptable andmodifiable to both new operating system environments and use purposes. For example,even though the system currently runs on a Linux platform, it has to be able to beported to Solaris when needed. Similarly, if the service environment changes (a differentIVR platform is used, the ringing tone format changes, etc.), it must be possible toadapt the software to the new situation easily.
The requirement of reliability: The system should never go inoperable, nor should itdrop any calls or ringing tones unintentionally. As the customer pays for the service,he should always receive some kind of feedback from the service. In a distributedsystem, all modules should work independently and handle communication breakdownsgracefully. For example, if the IVR system cannot reach the conversion module, itshould queue the request and retry sending after a short while.
Scalability means that it must be possible to expand and still maintain the system as itgrows beyond original usage expectations. For example, it should be possible to balancethe load of different components by clustering, and there should be no fatal bottlenecksin the system design. That way, construction and maintenance of service handling 200simultaneous users should not be significantly more difficult than implementation of abasic service handling only two simultaneous users.
34

CHAPTER 5. IMPLEMENTATION OF A RINGING TONE SERVICE 35
Usability is defined as “the effectiveness, efficiency, and satisfaction with which specifiedusers achieve specified goals in particular environments.”[DFAB98] In the case of theRring service, the users are the customers of the service and the specified goal is tosuccessfully record and receive a ringing tone. If the users do not perceive the systemas usable, they will not try it again, nor will they recommend it to their friends.
Profitability is the most straightforward goal: the service needs to make profit. Thedevelopment, infrastructure and running costs have to be kept under control, andunless the system is perceived as a special novelty by operator, the service income hasto exceed costs at some time-scale.
5.2 System architecture
Rring service in its basic form has three functionally separate modules:
1. Recording acquisition
2. Ringing-tone conversion
3. SMS sending
In the first part, a recording from the user is obtained. This is done with an interactivevoice response (IVR) platform, which receives telephone calls, plays prompt record-ings to the customer, records customer input and then sends the results forward tothe ringing-tone conversion module. The ringing-tone conversion module receives therecording from the previous module and converts the recording to a ringing tone asdescribed in Chapter 4. After the ringing tone is generated, it is sent to the SMSgateway, which then sends it to the SMS center of the mobile operator.
There are several ways to implement this functional chain. The most straightforwardway is a monolithic system (depicted in Figure 5.1), in which all these modules areplaced in the same computer, so they can closely interact. This may be desirable indevelopment phase, as the structure is very simple and easily understandable. However,in a production system it is a somewhat simplistic approach, as it is impractical forclustering, and limits available hardware, software and business partners (in cases wheresome parts of the functionality are preferred to be externalized) too much.
Figure 5.1: Monolithic service architecture. All service components are lo-cated in a single computer, and parallel requests are handledconcurrently.
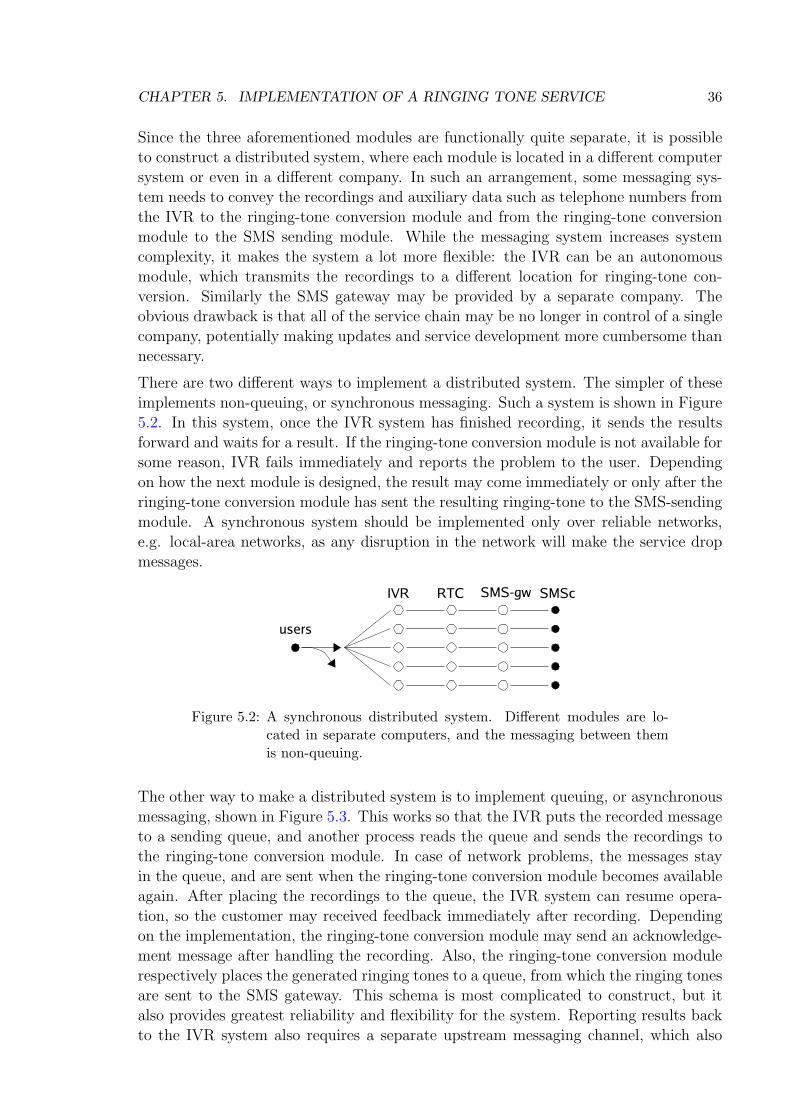
CHAPTER 5. IMPLEMENTATION OF A RINGING TONE SERVICE 36
Since the three aforementioned modules are functionally quite separate, it is possibleto construct a distributed system, where each module is located in a different computersystem or even in a different company. In such an arrangement, some messaging sys-tem needs to convey the recordings and auxiliary data such as telephone numbers fromthe IVR to the ringing-tone conversion module and from the ringing-tone conversionmodule to the SMS sending module. While the messaging system increases systemcomplexity, it makes the system a lot more flexible: the IVR can be an autonomousmodule, which transmits the recordings to a different location for ringing-tone con-version. Similarly the SMS gateway may be provided by a separate company. Theobvious drawback is that all of the service chain may be no longer in control of a singlecompany, potentially making updates and service development more cumbersome thannecessary.
There are two different ways to implement a distributed system. The simpler of theseimplements non-queuing, or synchronous messaging. Such a system is shown in Figure5.2. In this system, once the IVR system has finished recording, it sends the resultsforward and waits for a result. If the ringing-tone conversion module is not available forsome reason, IVR fails immediately and reports the problem to the user. Dependingon how the next module is designed, the result may come immediately or only after theringing-tone conversion module has sent the resulting ringing-tone to the SMS-sendingmodule. A synchronous system should be implemented only over reliable networks,e.g. local-area networks, as any disruption in the network will make the service dropmessages.
Figure 5.2: A synchronous distributed system. Different modules are lo-cated in separate computers, and the messaging between themis non-queuing.
The other way to make a distributed system is to implement queuing, or asynchronousmessaging, shown in Figure 5.3. This works so that the IVR puts the recorded messageto a sending queue, and another process reads the queue and sends the recordings tothe ringing-tone conversion module. In case of network problems, the messages stayin the queue, and are sent when the ringing-tone conversion module becomes availableagain. After placing the recordings to the queue, the IVR system can resume opera-tion, so the customer may received feedback immediately after recording. Dependingon the implementation, the ringing-tone conversion module may send an acknowledge-ment message after handling the recording. Also, the ringing-tone conversion modulerespectively places the generated ringing tones to a queue, from which the ringing tonesare sent to the SMS gateway. This schema is most complicated to construct, but italso provides greatest reliability and flexibility for the system. Reporting results backto the IVR system also requires a separate upstream messaging channel, which also

CHAPTER 5. IMPLEMENTATION OF A RINGING TONE SERVICE 37
complicates the modules when constructing interactive services. If the user interfacedesign does not require immediate feedback, the upstream messaging channel is notrequired, as the system works reliably also without it.
Figure 5.3: An asynchronous distributed system. Different modules are lo-cated in separate computers, and the messaging between themis queued.
It is possible to implement a distributed system as partially asynchronous. If, forexample, the IVR service provider chooses to not implement queuing, it can still beused in other modules. That just creates a single weak link in the service chain. Apartially asynchronous system in shown in Figure 5.4.
Figure 5.4: A partially asynchronous distributed system. The IVR operatessynchronously, and the requests are queued in the ringing-toneconversion module.
Furthermore, the service can be also only partially distributed. In such an arrangement,for example the IVR platform and ringing-tone conversion service are embedded in asame system, and the SMS gateway is separated. Such arrangements may be worthconsidering in some special situations, such as when only low usage is expected, or indevelopment phase, in which rapid changes are implemented both to IVR and ringing-tone conversion services.
5.3 Traffic analysis
In terms of capacity, the service has two bottlenecks. The first, and the most obviousone, is the number of incoming telephone lines in the IVR service. The second is theamount of processing power available for the DSP calculation. While these two can beanalyzed separately, they are intricately linked to each other. If the processing backendcannot handle the load generated by the IVR server, it can lead to situations in whichincoming calls are accepted and the customer is charged for the call, while the serviceis inoperable because of excessive backend server load, resulting in excessive waiting

CHAPTER 5. IMPLEMENTATION OF A RINGING TONE SERVICE 38
times or service collapse.
5.3.1 IVR service quality
From a teletraffic theory point of view, the IVR service can be seen as a pure losssystem [HP93]. It has n parallel servers, which accept calls. If all the servers arereserved, any additional calls are dropped. Note that while a queueing system wouldincrease the service quality, it may not be possible to implement because of the plannedrevenue models. That is also the reason why queueing systems are not considered inthis analysis.
For a pure M/G/n/n loss system with calls arriving according to a Poisson processwith a rate of λ and having an average holding time of h, the traffic intensity is definedas
a = λh. (5.1)
This is used in Erlang’s blocking formula, which defines call blocking probability (Bc)in terms of number of lines and traffic intensity [HP93]. Call blocking is the probabilitythat an arriving call finds all n channels blocked. Erlang’s blocking formula is definedas:
Bc = Erl(n, a) =an
n!∑ni=0
ai
i!
. (5.2)
The service quality 1 − Bc for a service with 10, 20 or 30 lines is shown in Figure 5.5.If service quality of 0.8 is deemed as satisfactory, it can be seen that a 10-line IVRplatform can manage a service with a traffic intensity of 10 Erlang. Given a mean callduration of 1 minute, 10 Erlang equals 600 calls an hour. A 30-line service can thenmanage a traffic intensity of 34 Erlang, or 2040 calls an hour, which should be plentyfor even big markets.
As the IVR platform telephone network connection typically is one or more ISDN E1lines (30 simultaneous voice lines), the IVR capacity typically is not a problem inimplementing the service.
5.3.2 Ringing tone conversion service quality
The RTC backend calculation process can be seen as a pure waiting system, in whichthere is one server and a service queue of infinite length. Theoretically it does notmatter whether the system works as a “First in, first out” (FIFO) queueing system oras a processor sharing (PS) system 1. Thus, it is an M/M/1 queueing system [HP93].Requests arrive according to a Poisson process with a rate of λ, and the service rate hasa mean of µ, and has an exponential distribution. It has to be noted that the actualservice rate depends on the melody length, which is clipped to a certain period, andthe rate distribution is probably not exactly exponential. However, the assumption ofexponential distribution is kept because of its mathematical simplicity.
1These correspond to asynchronous, or serial, and synchronous, or parallel processing described in Section5.2

CHAPTER 5. IMPLEMENTATION OF A RINGING TONE SERVICE 39
0.1
0.2
0.3
0.4
0.5
0.6
0.7
0.8
0.9
1
0 5 10 15 20 25 30 35 40 45 50
Ser
vice
qua
lity
Traffic intensity (erl)
IVR service quality as a function of traffic intensity
10 lines20 lines30 lines
Figure 5.5: IVR service quality as a function of traffic intensity.
Traffic load is defined as a quotient of request arrival rate and the service rate:
ρ =λ
µ. (5.3)
The value represents the utilization of the server.
Using λ, µ and maximum allowed service wait time, z, a parameter describing theservice quality of a waiting system can be defined:
Pz = Wait(λ, µ, z) =
{λµ
exp((λ− µ)z) if ρ < 1
1 if ρ ≥ 1. (5.4)
Pz is the probability for a service incident to take longer time than z. Assuming servicetime of 2 seconds (µ = 1/2, assumption made from the results of the computationalefficiency tests using modern hardware in Chapter 4.4), the service quality behavesas seen in Figure 5.6. A 1-processor server would begin to collapse after a requestintensity of 20 requests per minute, while a 2-processor system could manage 50 beforethe service quality begins to deteriorate. In practice, if the service is designed to beinteractive, even 10 seconds waiting time (as shown in Figure 5.6) is already very long.
One possibility would be to dispatch the service process to the IVR and meanwhileplayback some music or advertisements to the customer.
Although previously stated that FIFO and PS systems are identical regarding trafficintensity aspects, this assumption holds only with systems having an unlimited amountof memory. In real systems, computer main memory is a limited resource, and runningout of it induces swapping behavior, where less frequently used memory pages (pro-cesses or parts of processes) are moved to a swap file residing on a hard disk drive.
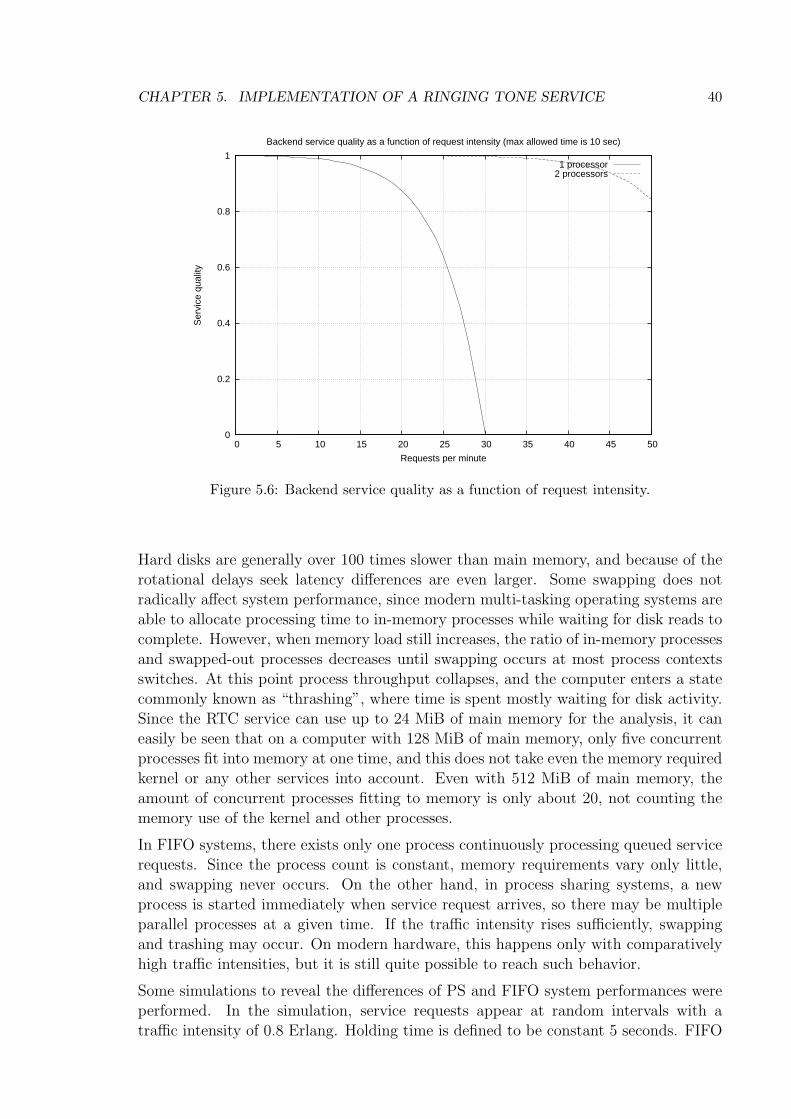
CHAPTER 5. IMPLEMENTATION OF A RINGING TONE SERVICE 40
0
0.2
0.4
0.6
0.8
1
0 5 10 15 20 25 30 35 40 45 50
Ser
vice
qua
lity
Requests per minute
Backend service quality as a function of request intensity (max allowed time is 10 sec)
1 processor2 processors
Figure 5.6: Backend service quality as a function of request intensity.
Hard disks are generally over 100 times slower than main memory, and because of therotational delays seek latency differences are even larger. Some swapping does notradically affect system performance, since modern multi-tasking operating systems areable to allocate processing time to in-memory processes while waiting for disk reads tocomplete. However, when memory load still increases, the ratio of in-memory processesand swapped-out processes decreases until swapping occurs at most process contextsswitches. At this point process throughput collapses, and the computer enters a statecommonly known as “thrashing”, where time is spent mostly waiting for disk activity.Since the RTC service can use up to 24 MiB of main memory for the analysis, it caneasily be seen that on a computer with 128 MiB of main memory, only five concurrentprocesses fit into memory at one time, and this does not take even the memory requiredkernel or any other services into account. Even with 512 MiB of main memory, theamount of concurrent processes fitting to memory is only about 20, not counting thememory use of the kernel and other processes.
In FIFO systems, there exists only one process continuously processing queued servicerequests. Since the process count is constant, memory requirements vary only little,and swapping never occurs. On the other hand, in process sharing systems, a newprocess is started immediately when service request arrives, so there may be multipleparallel processes at a given time. If the traffic intensity rises sufficiently, swappingand trashing may occur. On modern hardware, this happens only with comparativelyhigh traffic intensities, but it is still quite possible to reach such behavior.
Some simulations to reveal the differences of PS and FIFO system performances wereperformed. In the simulation, service requests appear at random intervals with atraffic intensity of 0.8 Erlang. Holding time is defined to be constant 5 seconds. FIFO
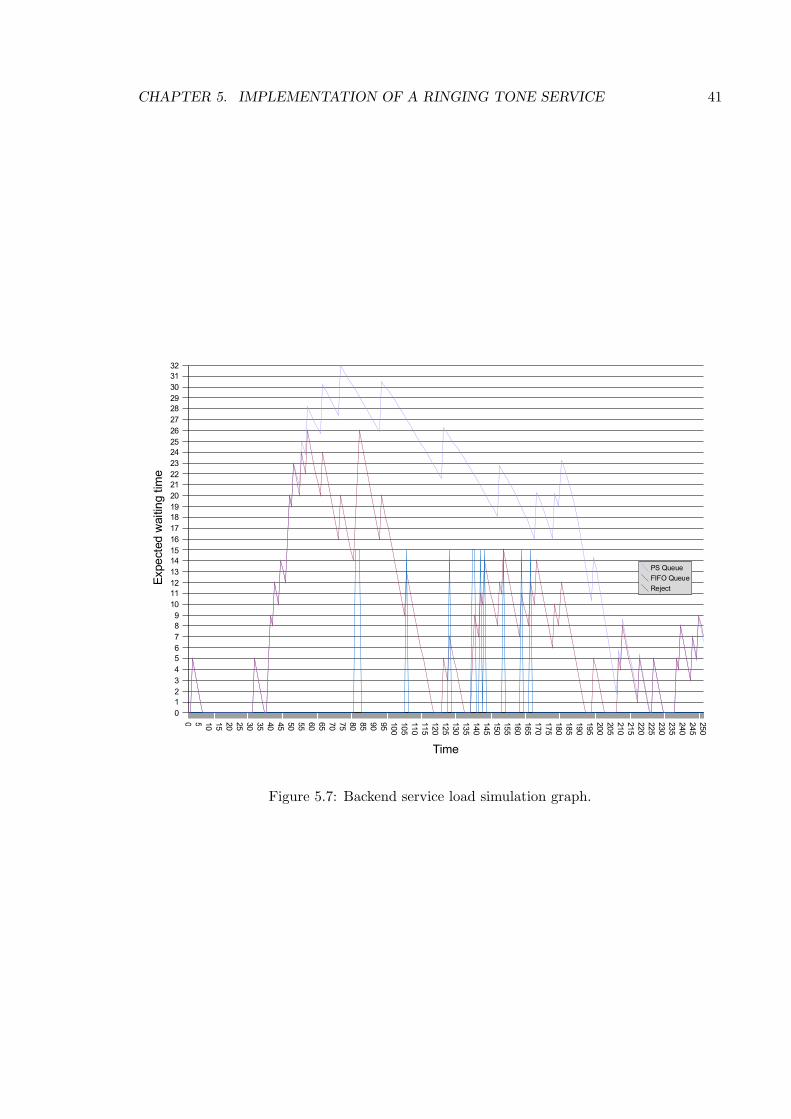
CHAPTER 5. IMPLEMENTATION OF A RINGING TONE SERVICE 41
Figure 5.7: Backend service load simulation graph.

CHAPTER 5. IMPLEMENTATION OF A RINGING TONE SERVICE 42
and PS systems are simulated separately. In FIFO, there is an infinite queue and adefault processing time. In PS, all requests are accepted immediately, but throughputproportionally decreases when there are more than six concurrent processes. Thisbehavior simulates swapping and thrashing. Furthermore, there is a maximum limit often simultaneous processes, which simulates the effect of finite main memory. In realsystems the process and memory limits may be higher, and these values should be seenonly as representative.
Figure 5.7 shows results of simulation of backend load. The x-axis depicts time, whilethe y-axis shows the expected waiting time (sum of unhandled request durations).It has to be noted that in PS system, the actual waiting time may be longer sincehigh process counts induce swapping, which decreases throughput. There is a burst ofrequests beginning at about t = 30 s, during which the expected waiting time increasesconsiderably. It can be seen that the FIFO system is able to consume queued requestswithout problems, while the performance of PS systems strongly deteriorates after theload had risen sufficiently. The FIFO system is able to clear the request burst in 70seconds, while the effects last significantly longer in the process sharing system. Whatis even worse, the PS system is forced to reject requests because of insufficient memory,and the rejects are spread over a long duration of time. Depending on the thrashingbehavior and the virtual memory management capabilities of the operating system, itis even possible to reach a state where the system is not able to recover from thrashing.
5.4 Software architecture
5.4.1 Scalability
While the development of Rring has occurred in a small one-computer environment,it is clear that commercial deployment has very much different requirements for op-eration. The most obvious requirement is sufficient capacity to handle the expectedamount of connections. While a limited system of 6–8 simultaneous users might beimplemented using a PC with several ISDN controllers, practical implementations re-quire a commercial interactive voice response (IVR) system with a 30-line ISDN PRIor similar connection. Section 5.3 outlines some traffic estimates for the service.
Scalability is another key requirement for a commercial installation. The service hasto scale in terms of user amounts, so that both the number of incoming lines andthe available processing power have to be easily increased when necessary, withoutproportionally increasing administrative or maintenance workload.
There are several possible models to scale the service. Outlines of a few differentmodels are shown in Figure 5.8. Figure 5.8 (a) shows the monolithic configuration,in which both the IVR service and ringing-tone creation are integrated to the samecomputer. This arrangement is very simple to set up and easy to operate. This method,however, allows only for 30 simultaneous users (limited by the capacity of ISDN E1connection). Furthermore, the amount of incoming phone lines and the processingpower required for handling the service are difficult to balance in model shown inFigure 5.8 (a), since handling 30 simultaneous users requires considerable amount of

CHAPTER 5. IMPLEMENTATION OF A RINGING TONE SERVICE 43
processing power, which requires server hardware with support of multiple centralprocessing units. The model can be scaled up either by acquiring an IVR system withmultiple ISDN E1 connections, as in Figure 5.8 (b) or by replicating a single server(Figure 5.9 (a)). While E1 spans are an easy and straightforward way to scale ordinaryIVR services, the still increased processing power requirements make it an even moreimpractical solution for Rring. On the other hand, server replication necessitate theuse of a separate database server for any kind of data storage purposes, Figure 5.9 (b).
Probably the most practical models to implement the service separate the IVR platformfrom the backend processing as shown in Figure 5.10 (a). In such a model, the IVRplatform handles the call logic and sends processing requests to the backend as remoteprocedure calls (RPC). Different RPC protocols are discussed in the next section.
High availability can be achieved by replicating any critical components of the service.This can be performed in any configuration, but models shown in Figure 5.9 or 5.10 (b)are especially suitable for replication. The IVR platform can be configured to have ahot spare, that is, an idle backup IVR server that takes over the service in case of aprimary server crash. Similar replication or clustering can be performed to all othercomponents (IVR system and SMS gateway) as well, although in distributed systemsthe network quickly becomes the weakest link. While it is possible to provide redundantservice by using two separate Internet service providers, it is neither straightforwardnor simple to do.
a) b)
Figure 5.8: Basic IVR line bundling.
5.4.2 Remote procedure call protocols
Remote Procedure Call (RPC) is a protocol that one program can use to requesta service from a program located in another computer in a network without havingto understand network details. RPC uses the client/server model. The requestingprogram is a client and the service-providing program is the server. Like a regular orlocal procedure call (often known as a function call or a subroutine call), an RPC is

CHAPTER 5. IMPLEMENTATION OF A RINGING TONE SERVICE 44
a) b)
Figure 5.9: Multiple IVR servers.
a) b)
Figure 5.10: Separate processing backend.

CHAPTER 5. IMPLEMENTATION OF A RINGING TONE SERVICE 45
a synchronous operation requiring the requesting program to be suspended until theresults of the remote procedure are returned.
There are several alternative RPC protocols, including (but not limited to) CORBA,XML-RPC, SOAP, and Java RMI [OMG02, XML02, BEK+00, Jav02]. AlthoughHTTP by itself is usually not regarded as remote procedure call protocol, it can beused as such, and so it is included in this presentation.
Each RPC protocol has its strengths and weaknesses. HTTP requests are most simple,and they are easily implemented in VoiceXML, the standard IVR service definitionlanguage. HTTP based services are also very easy to scale up, so that the processingpower and IVR capacity can be replicated individually. Figure 5.10 (b) shows such anarrangement. This provides increased redundancy as well, providing an easy way tomake the service highly available. On the other hand, using raw HTTP calls providesno standardized RPC parameter passing method (other than HTTP GET and POSTparameters). HTTP interfaces are quite commonly used to provide simple serviceinterfaces such as short-message sending and receiving services.
CORBA is a stable and widely used RPC protocol, and suitable for IVR-backendcommunication as well. In CORBA, the interfaces are defined in interface definitionlanguage (IDL), which provides accurate and unambiguous description of the call inter-face. The IDL files are then used to create proxies and stubs in the target programminglanguages. Proxies are function libraries, which make calling the interface methodslook like calling native, local functions. Stubs are function templates, which are im-plemented to provide server side implementation of the said interface. IDL interfacedefinitions make it fairly straightforward to implement interfaces, but the process ofdefining and implementing a CORBA interface still requires many steps and has quitea steep learning curve. The actual network traffic is performed in binary form, whichmakes CORBA quite efficient in that manner. CORBA is widely used both as desktopenvironment object access protocol and as enterprise-level object access protocol ofchoice.
SOAP (Simple Object Access Protocol) and XML-RPC are both XML-based RPCprotocols. Both normally use HTTP as a transport layer protocol, although SOAPcan be adapted to use a multitude of common protocols, including FTP, SMTP, andJabber. Both have data typing and fault handling properties. Because its simplicity,XML-RPC does not have an explicit interface definition language, instead the interfacesare defined by external means. SOAP, on the other hand, has WSDL (Web ServiceDescription Language), which is analogous to CORBA’s IDL. The WSDL files are gen-erated either by hand, or from an already implemented interface. The client proxiescan then be generated from the interface definition. Some SOAP implementations alsoallow dynamic method calling, so that the actual calls are generated on-the-fly from theWSDL definition. Despite of not having any interface definition language, XML-RPCinterfaces are fairly simple to implement. SOAP interoperability, on the other hand,suffers from the complexity of specification, and getting different implementations tocommunicate reliably can be a difficult task. Both SOAP and XML-RPC are state-less protocols, and so they scale identically to HTTP servers. As they are based onXML, transmitting large amounts of binary data is very inefficient for both of them.

CHAPTER 5. IMPLEMENTATION OF A RINGING TONE SERVICE 46
There is a separate MIME attachment specification for SOAP though, so that largebinary objects such as audio recordings in Rring can be transmitted efficiently. SOAPhas become a common protocol for many remote call tasks. For example, Microsoft.NET architecture uses SOAP as its remote call protocol. Also XML-RPC is widelyused, especially in constructing distributed web applications. Many new high-levelprogramming languages provide excellent XML-RPC interfaces.
Java RMI (Remote Method Invocation) is an RPC interface for the Java language. It islimited to Java language only, but the protocol is very efficient and easy to implement.The interfaces are defined as Java language interfaces with no further steps. The serverand the client can be easily implemented using the defined interfaces. While verystraightforward to use, its usefulness is limited because of dependency on Java. Whencreating interfaces dealing with custom hardware and systems such as IVR systems,and when the systems are spread across several different companies, such languageassumptions usually cannot be made. Java RMI is extensively used in J2EE (Java2Enterprise Edition) environments.
In Rring, raw HTTP interfaces were used so that the implementation could be keptsimple and the different components easily deployed across different companies.
5.4.3 Interface between IVR system and processing backend
Communication between the IVR system and the processing backend is done usingHTTP calls, which the IVR system makes. Parameters and data to be processed aretransmitted using HTTP GET and POST methods, and success status is conveyedusing HTTP status codes and supplementary messages.
There is support both for session-based requests, which support pre-listening of theringing tones and only optional sending of ringing tones, and sessionless requests, whichtake care of both converting the ringing tone and sending it during a single request.
The following describes different CGI scripts that define the interface between the IVRsystem and the processing backend.
get session.cgi
Purpose get session.cgi begins a new session and returns a session cookie to the client.
Receives Nothing.
Returns Session cookie named “sesid”. The cookie does not have a defined lifetime,so it is supposed to last only that session.
Remarks Calling of get session.cgi is not strictly necessary, but it ensures that theserver is available at the beginning of the call.
CHAPTER 5. IMPLEMENTATION OF A RINGING TONE SERVICE 47
pitch detect.cgi
Purpose pitch detect.cgi performs the pitch detection and creates a pre-listening soundclip.
Receives pitch detect.cgi receives the following arguments sent via HTTP POST re-quest:
sesid (Optional.) Session id given by get session.cgi.
data PCM data as a file upload. The MIME type of the data should be eitheraudio/x-wav or audio/x-pcm. In the first case, the file should be a mono-phonic wave file with sample rate of 8 kHz. In the latter case, the file shouldbe raw A-law-compressed audio data with 8 kHz sample rate.
nosave (Optional.) If this parameter is set, saving of the recording in the backendis prevented even if it otherwise would have been done.
Returns • Session cookie named “sesid”.
• Output with the same MIME type as the input data. The output audio clipholds a pre-listening sample of the generated ringing tone.
• In case of an error, returns with HTTP Status 500 together with an associatederror message.
Remarks If a session cookie is not given as an argument, one is generated in get session.cgi.
send sms.cgi
Purpose send sms.cgi sends a previously generated ringing tone to the client via aSMS gateway.
Receives sesid Session id given by get session.cgi or pitch detect.cgi.
telnum The telephone number to which the ringing tone should be sent.
name (Optional.) The name of the ringing tone to be sent. If one is not given,a random name will be generated.
dummy (Optional.) If set, the ringing tone will not be sent actually, but in-stead an artificial delay will be inserted. This is useful for benchmarking thebackend functionality.
Returns “OK” if sending succeeded. Otherwise returns HTTP Status 500 togetherwith an error message.
end session.cgi
Purpose end session.cgi ends a session.
Receives Session id “sesid” given by get session.cgi or pitch detect.cgi.

CHAPTER 5. IMPLEMENTATION OF A RINGING TONE SERVICE 48
Returns “OK” if sending succeeded. Otherwise returns HTTP Status 500 togetherwith an error message.
Remarks Calling of end session.cgi is not required, as sessions expire after a set time.It is provided as a courtesy method to clean the session immediately.
detect and send.cgi
Purpose Convert a recording to a ringing tone and send it in a single, sessionlessrequest.
Receives telnum The telephone number to which the ringing tone should be sent.
name (Optional.) The name of the ringing tone to be sent. If one is not given,a random name will be generated.
dummy (Optional.) If set, the ringing tone will not be sent actually, but in-stead an artificial delay will be inserted. This is useful for benchmarking thebackend functionality.
data PCM data as a file upload. The MIME type of the data should be eitheraudio/x-wav or audio/x-pcm. In the first case, the file should be a mono-phonic wave file with sample rate of 8 kHz. In the latter case, the file shouldbe raw A-law-compressed audio data with 8 kHz sample rate.
nosave (Optional.) If this parameter is set, saving of the recording in the backendis prevented even if it otherwise would have been done.
Returns “OK” if sending succeeded. Otherwise returns HTTP Status 500 togetherwith an error message.
5.4.4 Interface between processing backend and SMS gateway
The interface between the processing backend and SMS gateway is also based on HTTP.The requests are sent as HTTP GET calls with parameters defining the data format,telephone number and header information. Since the interface is defined by the SMSgateway service provider, it is not described here in further detail.
5.4.5 Programming language considerations
Rring currently has been implemented using several different programming languages.In the early planning and prototyping phases, C was deemed to be only feasible lan-guage in the implementation of the digital signal processing functionality. Likewise, theauxiliary scripting, including different conversion tools and the IVR scripts themselveswere programmed in Perl. Perl is flexible and rich language, and well suited for suchpurposes. Perl cgi-binaries can easily be executed within the Apache process using themod perl Apache module [Fou01].
CHAPTER 5. IMPLEMENTATION OF A RINGING TONE SERVICE 49
It has been noted that there would be several benefits if the service was implementedwith Java technologies. First, a Java implementation would be fairly platform-in-dependent and easily portable to different IVR systems. Second, all of the applicationlogic, including DSP algorithms, could be componentized and implemented in only onelanguage. This would ease the maintenance of the software and encourage componentand technology reuse. Third, installation and upgrades of Java Servlet packages isstandardized and automated, further easing service maintenance. Fourth, Java Servletand Java Servlet Page (JSP) platforms are well supported and deemed as standardplatforms by several different value-added service providers, facilitating easier serviceintegration.
Java platform, however, is not without its problems. The primary concern in this case isthe execution performance. Traditionally programs written in Java have been deemedas being slow, because the program binaries have to be translated to native machinecode prior to execution. While no tests regarding Java performance has been performedat Elmorex, several tests available on the web indicate that with modern Java just-in-time (JIT) compilers, execution speed of Java programs is comparable to programswritten in C or C++ [Rij00, Shu01]. In some tests, the Java JIT compilers evenoutperformed some C compilers. Execution speed similarity also applied to differenttests involving Fast Fourier Transform (FFT) calculation, such as SciMark benchmarksperformed by Roldan Pozo [Poz00, PM00]. FFT benchmarks are particularly importantregarding Rring, since the bulk of the calculation time is spent in FFT calculation. Theimportance of FFT in Rring is illustrated in program execution profile shown in table4.1.
Converting the backend service to Java cannot be efficiently done in steps. The wholebackend architecture has to be changed in one sweep to servlets, as stand alone Javaprograms executed as cgi-binaries are extremely inefficient. The process invocationoverhead includes time spent in the just-in-time compiler, and can easily exceed 1.5 sec-onds for even relatively simple programs.
5.4.6 Implementation platforms
IVR systems are traditionally implemented with proprietary systems using specializedcommand languages. Re-implementation of applications using a system of differentvendor is costly, effectively locking the service provider to a single service platform.The proprietary systems are generally built on Solaris, AIX or some other commercialUnix platform, and they utilize special hardware for telephone network connectivity.Lately also Linux and Windows are used as IVR platforms.
VoiceXML has become a promising new standard for IVR platforms. VoiceXML is astandardized description language for IVR services. It may be implemented on sameplatforms as traditional IVR systems, although usually it is provided as a specializedturn-key solution. A closer description of VoiceXML may be found a little furtherbelow.
The ringing tone conversion and SMS gateway modules are not as limited to any par-ticular platform, since they are basically regular network servers. Therefore viable op-
CHAPTER 5. IMPLEMENTATION OF A RINGING TONE SERVICE 50
erating systems include commercial Unixes, Linux and Windows. Commercial Unixes,such as Solaris, HP-UX and AIX are well supported, reliable and established operat-ing systems with good scalability and proven track record. On the other hand, they(with exception to Solaris/x86) only run on proprietary hardware, require knowledgeof that particular brand of Unix and are generally quite costly. Linux servers are nowconsidered in practice as capable as the commercial Unixes, at least as reliable, anda lot more cost-effective than the commercial Unixes. Windows servers are temptingbecause of their deep desktop market penetration and apparent ease of administra-tion. In practice, however, they require a lot more administration than the differentLinux/Unix variants, are not as reliable, and require costly licenses.
Rring was developed on a Linux platform. While the ringing tone conversion modulecurrently runs only on Linux, it may easily be ported to commercial Unixes. The IVRplatform and the SMS gateway are currently handled by third parties, which use SunSolaris and Linux operating systems, respectively.
5.4.7 VoiceXML
VoiceXML is an XML-based language designed for creating audio dialogs that fea-ture synthesized speech, digitized audio, recognition of spoken and DTMF key input,recording of spoken input, telephony, and mixed-initiative conversations [Voi00].
Voice applications are nowadays abundant, ranging from simple information retrievalsystems, e.g. weather services, to automated mail order and ticket reservation systemsor entertainment services such as ringing tone services. While widely used, the devel-opment systems are proprietary and re-implementation of applications using a systemof different vendor is costly. Even worse, the interaction model of the service may notmatch the established commodity systems well.
The goal of VoiceXML is to make the well-established client-server architecture ofWWW applications available to interactive voice response applications. This will makeit easier to treat telephony applications as an alternative user interface for ordinaryWWW or mobile services, or to use web application technologies in creation of IVRservices. By defining the data and interaction with XML, standard tools can be used,reducing product development time and simplifying development.
The VoiceXML architecture is modeled to closely match that of a web service client-server model. See Figure 5.11 for an overview of the architectural model. A documentserver, e.g. a web server acts as an architectural backbone, handling requests fromthe VoiceXML interpreter and providing it documents. The VoiceXML interpreterhandles the user inputs together with VoiceXML interpreter context. The VoiceXMLinterpreter parses the actual VoiceXML documents and the state information encodedwithin, while the VoiceXML interpreter context responds to certain system-wide pre-defined events, e.g. special escapes for reaching human operator, adjusting outputvolume or speech synthesis characteristics.
The VoiceXML interpreter controls the implementation platform together with Voice-XML interpreter context. The implementation platform is responsible for the actualhardware interaction, text-to-speech synthesis and speech recognition. The platform

CHAPTER 5. IMPLEMENTATION OF A RINGING TONE SERVICE 51
Figure 5.11: VoiceXML Architecture.
generates events according to user actions like spoken or DTMF input, or disconnect.The events are then handled as defined in the VoiceXML document by the VoiceXMLinterpreter, or if the interaction is not defined in the VoiceXML interpreter, by theVoiceXML interpreter context.
The main drawback of VoiceXML at the moment is its incompleteness. Many centralaspects of the language, like the speech and DTMF grammars, are completely un-specified. Furthermore, specifications for such things as supported audio formats arequite lacking. The language also supports many different platform-specific extensions.The shortcomings may lead to a situation similar to different SQL dialects, in whichthe applications in principle are written in a common language, but the porting costsbetween different platforms are still considerable.
5.5 User interface issues
Usability of the service is important for the perception of service quality and for theoverall image of the service. For the end-user, several criteria have to be fulfilled:
• The IVR service has to be easy to use.
• The service has to give always feedback.
• The response time has to be short.
The IVR service has to be designed so that the prompt speeches are short and clear,that the user will not have to make extra key-presses, and that the user may not get
CHAPTER 5. IMPLEMENTATION OF A RINGING TONE SERVICE 52
lost in the service. Ideally the user only hears a short prompt speech, gets to record themessage, and then finishes the recording by hanging up the phone. The ringing tone isthen automatically sent to his mobile phone. That way, no user-interface interactionwith the IVR service is required. Another possibility is to provide the user a choiceto listen to the generated ringing tone and to decide whether it is sent to the mobilephone. However, this is not desirable for two reasons. First, it has been noted thatthe male singing voice often gets misinterpreted as DTMF signals, causing preliminaryending of the recordings. Second, even if the end-user has a flat-rate charge, the IVRsystem providers usually charge by service use time, so that the shorter the call is, theless the IVR service provider charges.
The customer always has to get feedback from the service. If no ringing tone is gen-erated or if there are network problems, the customer has to be informed of this bysome means. This may be a notification during the phone call, or a short message,depending on the IVR structure chosen.
The delay between recording and receiving the ringing tone has to be short, preferablyless than 20 seconds. Fast operation improves the perception of quality of service, andencourages the customer or his friends to use the service again.
5.6 Development framework
5.6.1 Description of the pilot platform
The pilot system was constructed as a process sharing system, since it is a lot easierto implement than a FIFO system, especially when using a HTTP server to receivethe requests. To construct a PS system, the HTTP server receiving the request cansimply execute the programs handling the input data itself. The drawback is that theHTTP server process has to wait for the processing to complete, and that consumesextra memory.
An IVR platform has been implemented locally for development and demonstrationpurposes. In the beginning of the project, purchase of a commercial developmentplatform was not deemed necessary or viable, so the development has occurred on acustom system built from commodity components and free software. The architectureof the system is shown in Figure 5.12.
The development platform is a generic x86 computer which is connected to an ISDNline with a passive ISDN card. The operating system used is Red Hat Linux 6.2 [red01].
The SMS sending facilities are provided by connecting a Nokia 6150 handset to thecomputer with a serial cable and by communicating with the handset via Gnokii soft-ware package [gno01]. Small changes to the Gnokii software were required in order tofacilitate raw SMS sending.
The custom IVR service implementation has been done using Vgetty modem softwarepackage [Ebe98], which is controlled by a state machine implemented in Perl. The IVRimplementation takes care of playing prompts back to the user, reading user input andrecording the singing of user. Slight bug-fixes to Vgetty and to Linux kernel ISDN

CHAPTER 5. IMPLEMENTATION OF A RINGING TONE SERVICE 53
Figure 5.12: Rring development framework architecture. Light gray por-tions have been modified or enhanced during the project, darkgray portions have been implemented from scratch.
driver were required for reliable operation.
Vgetty could not recognize user hangups, instead it waited until timeout. In thedevelopment system this was considered highly undesirable, since the IVR would firstwait until timeout of the recording, then play next prompt, then wait until timeout ofthe prompt answer, and finally exit the system. The whole process would take up totwo minutes time, during which the line would return available instead of busy tone tothe next caller. Vgetty was modified (and the patches sent back to Vgetty developmentteam) so that it would recognize user hangups immediately and return the informationback to the IVR software.
Linux ISDN driver often misinterpreted singing as dual tone modulated frequency(DTMF) signals induced by phone key-presses. The phenomenon occurred especiallyon male voices. There exists no simple fix for the problem, since it also occurs incommercial IVR platforms, but the problem was alleviated by implementing a detectionbuffer to Linux kernel ISDN driver, so that several consecutive positive detections areneeded for triggering the DTMF detection routine.
The service architecture has been implemented in a model as compatible with Voice-XML as possible. Although the IVR functionality is defined in the IVR script, commu-nication with different backend modules is performed solely by using a standard webserver and services implemented on that server.
5.6.2 Testing methodology
Since a flawless operation of the RTC backend is critical for reliable service operation,a test bench was built for finding any deficiencies in the backend server operation.
The test bench program was designed to simulate the IVR service as closely as possible.It is run in another computer (so that the existence of the test program itself wouldnot skew the test results), from which it sends service requests to the backend serverby HTTP. It simulates multiple clients accessing an IVR service simultaneously, by
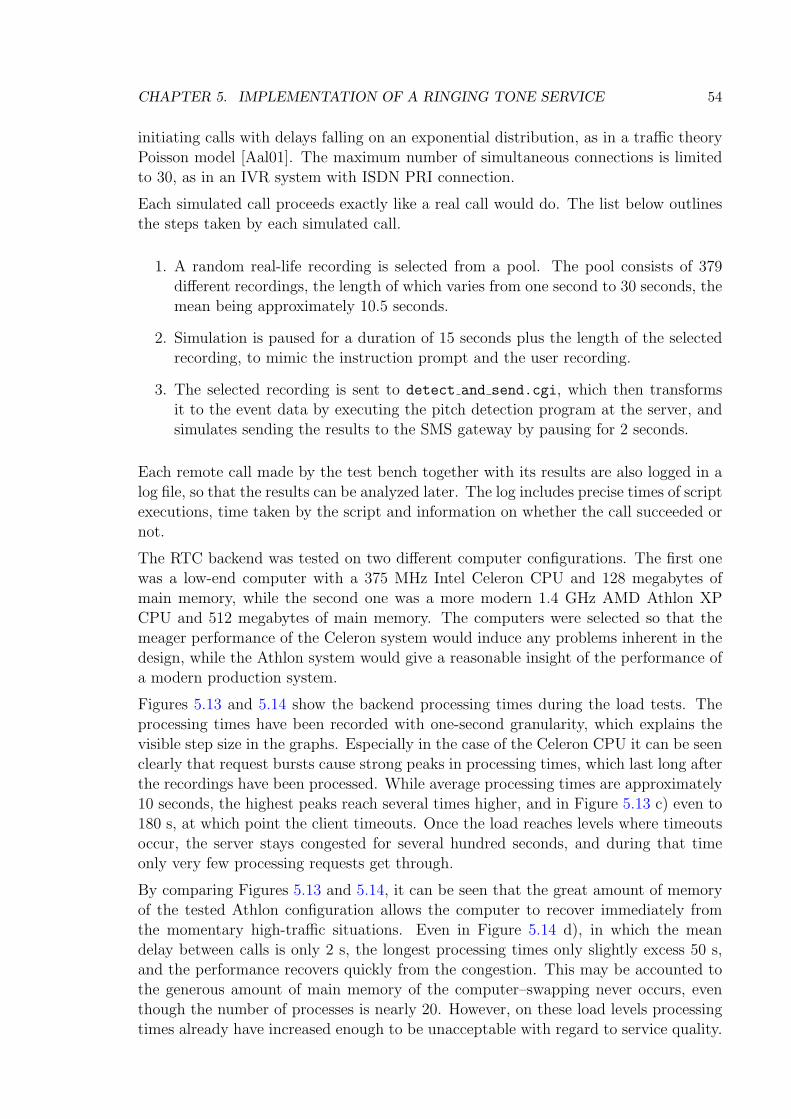
CHAPTER 5. IMPLEMENTATION OF A RINGING TONE SERVICE 54
initiating calls with delays falling on an exponential distribution, as in a traffic theoryPoisson model [Aal01]. The maximum number of simultaneous connections is limitedto 30, as in an IVR system with ISDN PRI connection.
Each simulated call proceeds exactly like a real call would do. The list below outlinesthe steps taken by each simulated call.
1. A random real-life recording is selected from a pool. The pool consists of 379different recordings, the length of which varies from one second to 30 seconds, themean being approximately 10.5 seconds.
2. Simulation is paused for a duration of 15 seconds plus the length of the selectedrecording, to mimic the instruction prompt and the user recording.
3. The selected recording is sent to detect and send.cgi, which then transformsit to the event data by executing the pitch detection program at the server, andsimulates sending the results to the SMS gateway by pausing for 2 seconds.
Each remote call made by the test bench together with its results are also logged in alog file, so that the results can be analyzed later. The log includes precise times of scriptexecutions, time taken by the script and information on whether the call succeeded ornot.
The RTC backend was tested on two different computer configurations. The first onewas a low-end computer with a 375 MHz Intel Celeron CPU and 128 megabytes ofmain memory, while the second one was a more modern 1.4 GHz AMD Athlon XPCPU and 512 megabytes of main memory. The computers were selected so that themeager performance of the Celeron system would induce any problems inherent in thedesign, while the Athlon system would give a reasonable insight of the performance ofa modern production system.
Figures 5.13 and 5.14 show the backend processing times during the load tests. Theprocessing times have been recorded with one-second granularity, which explains thevisible step size in the graphs. Especially in the case of the Celeron CPU it can be seenclearly that request bursts cause strong peaks in processing times, which last long afterthe recordings have been processed. While average processing times are approximately10 seconds, the highest peaks reach several times higher, and in Figure 5.13 c) even to180 s, at which point the client timeouts. Once the load reaches levels where timeoutsoccur, the server stays congested for several hundred seconds, and during that timeonly very few processing requests get through.
By comparing Figures 5.13 and 5.14, it can be seen that the great amount of memoryof the tested Athlon configuration allows the computer to recover immediately fromthe momentary high-traffic situations. Even in Figure 5.14 d), in which the meandelay between calls is only 2 s, the longest processing times only slightly excess 50 s,and the performance recovers quickly from the congestion. This may be accounted tothe generous amount of main memory of the computer–swapping never occurs, eventhough the number of processes is nearly 20. However, on these load levels processingtimes already have increased enough to be unacceptable with regard to service quality.

CHAPTER 5. IMPLEMENTATION OF A RINGING TONE SERVICE 55
a) b)
0
5
10
15
20
25
30
35
40
45
50
0 1000 2000 3000 4000 5000 6000 7000 8000 0
1
2
3
4
5
Tim
e (s
econ
ds)
Pro
cess
es
Time from start of test (seconds)
Processing timeConsecutive processes
0
20
40
60
80
100
120
140
160
0 1000 2000 3000 4000 5000 6000 7000 8000 0
2
4
6
8
10
12
14
Tim
e (s
econ
ds)
Pro
cess
es
Time from start of test (seconds)
Processing timeConsecutive processes
c)
0
50
100
150
200
250
300
350
400
450
500
0 1000 2000 3000 4000 5000 6000 7000 8000 0
5
10
15
20
25
30
Tim
e (s
econ
ds)
Pro
cess
es
Time from start of test (seconds)
Processing timeConsecutive processes
Failed
Figure 5.13: Sample processing times in test runs on a Celeron CPU. Figurea) represents a mean delay of 20 seconds between calls (trafficintensity of 1.3 Erl at the IVR), Figure b) represents a meandelay of 10 s (traffic intensity 2.6 Erl), Figure c) represents amean delay of 7 s (traffic intensity 3.6 Erl).
CHAPTER 5. IMPLEMENTATION OF A RINGING TONE SERVICE 56
a) b)
2
3
4
5
6
7
8
9
10
0 1000 2000 3000 4000 5000 6000 7000 8000 0
0.5
1
1.5
2
2.5
3
3.5
4
Tim
e (s
econ
ds)
Pro
cess
es
Time from start of test (seconds)
Processing timeConsecutive processes
0
2
4
6
8
10
12
14
0 1000 2000 3000 4000 5000 6000 7000 8000 0
1
2
3
4
5
6
7
Tim
e (s
econ
ds)
Pro
cess
es
Time from start of test (seconds)
Processing timeConsecutive processes
c) d)
0
2
4
6
8
10
12
14
16
18
20
0 1000 2000 3000 4000 5000 6000 7000 8000 0
2
4
6
8
10
12
Tim
e (s
econ
ds)
Pro
cess
es
Time from start of test (seconds)
Processing timeConsecutive processes
0
10
20
30
40
50
60
0 1000 2000 3000 4000 5000 6000 7000 8000 0
2
4
6
8
10
12
14
16
18
20
Tim
e (s
econ
ds)
Pro
cess
esTime from start of test (seconds)
Processing timeConsecutive processes
Figure 5.14: Sample processing times in test runs on a Athlon XP CPU.Figure a) represents a mean delay of 10 seconds between calls(traffic intensity of 2.6 Erl at the IVR), Figure b) represents amean delay of 7 s (traffic intensity 3.6 Erl), Figure c) representsa mean delay of 4 s (traffic intensity 6.4 Erl), and Figure d)represents a mean delay of 2 s (traffic intensity 12.8 Erl).
CHAPTER 5. IMPLEMENTATION OF A RINGING TONE SERVICE 57
While the tests clearly confirmed the simulation results in section 5.3.2 and furtheremphasize the need for serializing the backend processing, they also showed that givenenough processing power and main memory, a modern computer can acceptably handlelight and moderate loads even with parallelized backend processing.

Chapter 6
Future technologies
6.1 Ringing tone formats
So far practically all ringing tone providers have been offering only Nokia-compatibleringing tones. Nokia supports ringing tones in their Smart Messaging Specification,introduced already in 1997. Smart messaging not only defines sending of ringing tones,but e.g. sending of business cards, calendar items, dynamic menu items, Internet accessconfiguration data, and so on. Currently all Nokia phones on the market supportSmart Messaging. Nokia has opened Smart Messaging Specification for royalty-freelicensing in December 2000, although so far Samsung is the only major mobile phonemanufacturer to have licensed Smart Messaging technologies [Nok00, Nok01].
Multimedia Messaging Services (MMS) is the next-generation messaging format stan-dardized by 3rd Generation Partnership Project (3GPP) [Nok02]. It is supported byevery major mobile manufacturer, and also the operators expect it to be a new rev-enue source, so it is expected to gain rapid market acceptance. The first MMS-enabledphone, Ericsson T68, was released in Q1 2002, and the actual breakthrough is expectedto happen in 2003 or 2004 [Mob02]. MMS supports several different message formats,including text-based messages, picture messaging, image messaging, and even audioand video messages. The standard is not bound to any specific carrier methods, allow-ing both GSM and UMTS as well as CDMA networks to be used. On a GSM network,the messages are sent as a combination of a SMS notification and WAP over GPRStransmission [Nok02].
6.2 Polyphonic ringing tones
As the demand for phone personalization features has increased, handset manufacturershave been adopting support for polyphonic ringing tones. In Japan, i-Mode devicesgenerally support polyphonic ringing tones, although different phone manufacturershave their own ringing tone formats [KPN02].
In Europe, adoption of polyphonic ringing tone technologies has been slower thanin Asia Pacific. However, several mobile phone manufacturers have introduced modelssupporting polyphonic ringing tones in 2002. Phones made by Nokia and Sony Ericsson
58
CHAPTER 6. FUTURE TECHNOLOGIES 59
have support for ringing tones in MIDI format [MID96]. On Nokia phones, the ringingtones may be transmitted either using SMS Smart messaging [Nok99] or WAP. SonyEricsson phones support WAP on-the-air transmission only.
6.3 Pitch detection based mobile entertainment services
Of course, ringing tone services are not the only possible mobile services to utilize pitchdetection technologies. Several other concepts have been depicted at Elmorex. Pitchdetection may easily be adapted to creation of melody messages. One could composea message consisting of a personalized greeting melody together with a text passage.Such service could work for example so that the user calls a number and sings a melody,after which he or she sends an SMS message to a SMS service number. The servicethen combines these separate messages to a single multimedia message, which is sentto the intended receiver.
Even more intriguing possibilities arise in real-time pitch detection applications. Onecould for example have a real-time melody karaoke in an Internet-based virtual chat-room like Habbo Hotel [Hab01]. In such a service, one would queue up for a performancein the virtual room. Then, on his/her turn, the user would call a service number andmake a singing performance. The result could be then streamed to all listeners in real-time using MIDI or some other high-level music description language. So, the performercould sing in relative anonymity, while the audience would still get a reasonable imageof the performer’s skills. Other real-time applications proposed at Elmorex are forexample different interactive entertainment applications for Digital TV. There, peoplewould call service numbers, perform on-line and see the results directly on the TVscreen. It is also possible to create applications utilizing no other devices than regulartelephone or mobile handsets. One such service would be automatic accompanimentgenerator for singing. The customer would call the service, then defining a phonenumber to be called. After the connection is made, one could sing a song to therecipient, while the accompaniment generator created accompaniment to the singing.Such services could easily be marketed for Christmas, valentines or birthday greetings.
6.4 Operating systems for mobile client-based sound applica-tions
6.4.1 Java software environment
Java2 Micro Edition (J2ME) is a version of Java designed for consumer devices, suchas smart cards, pagers, mobile handsets, or even set-top boxes. The specification iscurrently at version 1.0a, which was released on December 15th, 2000.
For each J2ME device group, there exists a special API for generating applicationsin that genre. The mobile API is dubbed Mobile Information Device Profile (MIDP).It does provide rudimentary means for networking, persistent data storage and userinterface API, but sound support is limited to playing one of a few pre-defined alert

CHAPTER 6. FUTURE TECHNOLOGIES 60
sounds. Therefore development of sound-based entertainment software or services isnot possible on J2ME.
As of October 2002, Java-enabled mobile devices are already widely available in Japanand Europe.
PalmOS, the operating system of Palm handheld devices, has had support for MIDIsounds since version 3.0. However, at least the older devices have been very limitedin sound support, featuring only a simple piezo-electric buzzer, so only simple soundapplications may be implemented.
PalmOS version 5 is the port of PalmOS from the previous Motorola Thunderballplatform to the ARM processor platform. Simultaneously with the platform change,a new sampled sound API has been included. This includes support for playback andrecording of 16-bit sampled stereo and mono sounds in different formats [Pal02]. Whilethe connectivity of Palm devices won’t be on the same level as that of most mobilephones, these inclusions still make Palm a viable platform for client-based mobile soundapplications.
Symbian’s EPOC, which is the operating system of most new advanced mobile phonedevices, does have support for recording and playing sampled audio clips. It also hasa telephony API, which provides application access to the phone’s telephony function-ality, and a framework for writing drivers for particular telephony hardware [Sym02].
The most advanced Windows CE devices, namely Compaq iPaq, have fairly advancedaudio capabilities. They support stereophonic playback through headphone speakers,as well as audio recording with an integrated microphone. With their fast StrongARMprocessors they have enough processing power for MPEG 1 Layer 3 and even com-pressed video playback.
There already exists a multitude of music playback and generation software for the iPaq.The main problem with Windows CE based products is their weak mobile connectivity.None of them are currently integrated with mobile handsets, and while for example iPaqcan utilize wireless local area network (WLAN) cards, they do not offer communicationcapabilities similar to for example already existing Nokia Communicator devices. So,although the audio technology of Windows CE devices is most mature of all, it isnot very attractive as platform for mobile musical entertainment services, until theirconnectivity is enhanced.

Chapter 7
Discussion and conclusions
7.1 Ringing tone quality
Systematic interviews would have given valuable insight of the perceived quality andperformance of the system, but such effort could not be feasibly done in the timeframe and scope of this project. However, lots of informal feedback was gathered bydiscussing with testers and following the usage patterns and listening to the recordingsand the created ringing tones.
Unfortunately the use experience of the pilot system was skewed because of a bugwhich caused full-length ringing tones to not get transmitted correctly. This bug wascorrected only late in the pilot phase, and so no conclusive results from the pilot periodcould be obtained.
Good singers were often able to create ringing tones of very good quality, although eventhen there would almost always be some impurities in the ringing tone. The impuritieswould range from missing short notes to a few half-note errors and short high-pitchednotes. However, often the users sang very badly, and in these cases the ringing toneswere completely unrecognizable, more or less random note sequences. This seemed tooften come as a surprise to the users, who might have expected to receive a correctedversion of their performance.
One observation was that the users with little musical skills often intentionally spokeor just made noises. While ringing tones created this way were not melodic, they stillsounded very unique and were suitable as alarm ringing tones.
Most of the test users were pleased with the service. It was considered to be a novelconcept, and while the created ringing tones were not perfect, their quality was consid-ered acceptable. It was also noted, maybe not surprisingly, that the users with at leastsome musical background, be that choir singing or piano lessons in the childhood, weremost eager to use the service, while the ones with no musical background mostly had aneutral attitude towards it. Also, professional musicians often had negative attitudestowards the service, not tolerating the errors and impurities in the produced ringingtones.
The ringing tone quality is quite dependent on the type of the input recordings. Mono-phonic recordings with a moderate tempo and long, clear notes gave the best results.
61
CHAPTER 7. DISCUSSION AND CONCLUSIONS 62
Short adjacent notes tend to get bound together, but there seemed not to be any simpleway to get rid of that behavior. Also background noise generated extra notes in theringing tones.
It was also noted that the GSM transmission path frequently causes different clicks andpauses to the sound. While they are short enough to not degrade legibility of speech,they do propagate to generated ringing tones. Since the user is not aware of transmis-sion path artifacts, the service itself is blamed for these artifacts. Unfortunately thereare no solutions to this when using the IVR approach. If the transmission path waslossless, the problem would be automatically solved. One way to achieve this would beto use recorded messages and send them via MMS.
7.2 Contributions made by the author
The initial idea for this project came from Tero Tolonen, who was employed at El-morex Ltd. at that time. He also developed the initial version of the f0 detectionand event creation routines. Many fundamental design choices, such as the use of fastautocorrelation and the bottom-up event creation process were made at that time byhim. All other parts of the system were developed by the author. Also the fundamen-tal frequency detection and event creation routines, except the autocorrelation andassociated FFT routines were extensively refined by the author, so that the routinesdescribed in this thesis are the handwriting of the author.
During the pilot phase of the project, the interactive voice response platform and theSMS gateway were provided by third parties, and so only the interfaces to these systemswere designed by the author.
7.3 Evaluation of project success
The objective of this thesis was to develop a ringing tone generation service, in whichthe user can sing or hum himself a new ringing tone. This objective was fulfilled. Afunctional service was created, first as a development system, and then as an operationalcommercial pilot service. While the quality of the created ringing tones is not perfect,it is considered adequate for a commercial service.
Although the proposed architecture changes proposed in section 5.4 were not imple-mented, the original parallel processing architecture was proved viable in light use.During a period of several months, there were no performance problems. Even thoughthe arrival of the ringing tones was intermittently delayed, it turned out that thegreatest delays were caused by the SMS centre, and were thus unavoidable.
The implementation of the system might be cleaner if done using the Java languageand application platforms, as suggested in Section 5.4.5.
Given the market conditions outlined in Chapter 1, a commercial service would prob-ably be viable still with the quality limitations described in this Chapter. Marketingof the service would just have to be adjusted accordingly. Given the current state of

CHAPTER 7. DISCUSSION AND CONCLUSIONS 63
the application, it would take only little work to turn it into a fully-fledged commercialservice.

Bibliography
[Aal01] Samuli Aalto. S-38.145 introduction to teletraffic theory. Helsinki Univer-sity of Technology Course Material, January 2001.
[Alk99] Paavo Alku. S-89.126 puheensiirtotekniikka (speech transmission technol-ogy). Helsinki University of Technology course material, 1999.
[BEK+00] Don Box, David Ehnebuske, Gobal Kakivaya, Andrew Layman, NoahMendelsohn, Henrik Frystyk Nielsen, Satish Thatte, and Dave Winer. Sim-ple object access protocol 1.1. Web page, May 2000. http://www.w3.org/-TR/SOAP/.
[BMS00] Juan Pablo Bello, Giuliano Monti, and Mark Sandler. Techniques for au-tomatic music transcription. In International Symposium on Music Infor-mation Retrieval, Plymouth, MA, October 2000.
[BP89] Judy Brown and M. Puckette. Calculation of a narrowed autocorrelationfunction. Journal of Acoustical Society of America, 85:1595–1601, 1989.
[Bre90] Albert Bregman. Auditory Scene Analysis. MIT Press, Cambridge, MA,1990.
[Bro91] Judy Brown. Musical frequency tracking using the methods of conventionaland narrowed autocorrelation. Journal of Acoustical Society of America,89:2346–2354, 1991.
[Dav52] W. B. Davenport, Jr. An experimental study of speech-wave probabilitydistributions. Journal of the Acoustical Society of America, 24:390–399,1952.
[DFAB98] Alan Dix, Janet Finlay, Gregory Abowd, and Russell Beale. Human Com-puter Interaction. Prentice Hall Europe, 1998.
[DR91] Boris Doval and Xavier Rodet. Estimation of fundamental frequency ofmusical sound signals. In Proceedings of the International Conference onAcoustics, Speech and Signal Processing, 1991.
[Ebe98] Marc Eberhard. Vgetty documentation center. Web page, 1998.http://alpha.greenie.net/vgetty/.
[Ell95] Daniel Ellis. Mid-level representations for computational auditory sceneanalysis. In Proceedings of the International Joint Conference on AI, Work-shop on Computational Auditory Scene Analysis, August 1995.
64
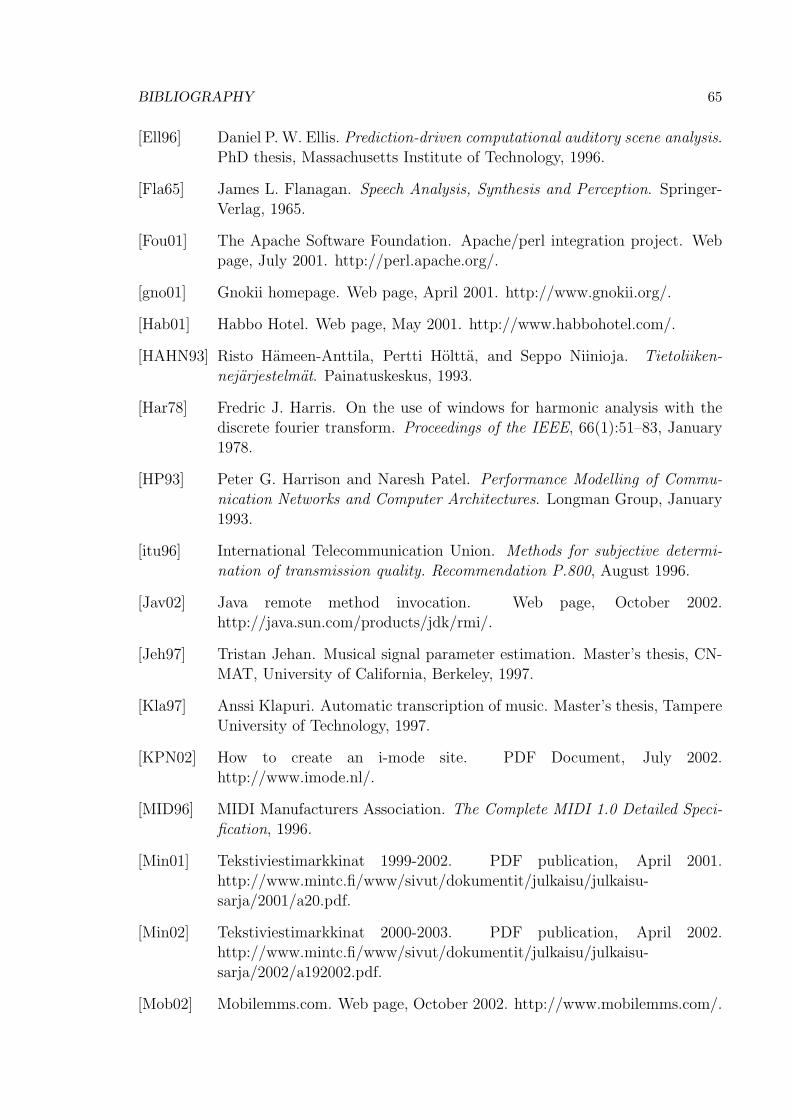
BIBLIOGRAPHY 65
[Ell96] Daniel P. W. Ellis. Prediction-driven computational auditory scene analysis.PhD thesis, Massachusetts Institute of Technology, 1996.
[Fla65] James L. Flanagan. Speech Analysis, Synthesis and Perception. Springer-Verlag, 1965.
[Fou01] The Apache Software Foundation. Apache/perl integration project. Webpage, July 2001. http://perl.apache.org/.
[gno01] Gnokii homepage. Web page, April 2001. http://www.gnokii.org/.
[Hab01] Habbo Hotel. Web page, May 2001. http://www.habbohotel.com/.
[HAHN93] Risto Hameen-Anttila, Pertti Holtta, and Seppo Niinioja. Tietoliiken-nejarjestelmat. Painatuskeskus, 1993.
[Har78] Fredric J. Harris. On the use of windows for harmonic analysis with thediscrete fourier transform. Proceedings of the IEEE, 66(1):51–83, January1978.
[HP93] Peter G. Harrison and Naresh Patel. Performance Modelling of Commu-nication Networks and Computer Architectures. Longman Group, January1993.
[itu96] International Telecommunication Union. Methods for subjective determi-nation of transmission quality. Recommendation P.800, August 1996.
[Jav02] Java remote method invocation. Web page, October 2002.http://java.sun.com/products/jdk/rmi/.
[Jeh97] Tristan Jehan. Musical signal parameter estimation. Master’s thesis, CN-MAT, University of California, Berkeley, 1997.
[Kla97] Anssi Klapuri. Automatic transcription of music. Master’s thesis, TampereUniversity of Technology, 1997.
[KPN02] How to create an i-mode site. PDF Document, July 2002.http://www.imode.nl/.
[MID96] MIDI Manufacturers Association. The Complete MIDI 1.0 Detailed Speci-fication, 1996.
[Min01] Tekstiviestimarkkinat 1999-2002. PDF publication, April 2001.http://www.mintc.fi/www/sivut/dokumentit/julkaisu/julkaisu-sarja/2001/a20.pdf.
[Min02] Tekstiviestimarkkinat 2000-2003. PDF publication, April 2002.http://www.mintc.fi/www/sivut/dokumentit/julkaisu/julkaisu-sarja/2002/a192002.pdf.
[Mob02] Mobilemms.com. Web page, October 2002. http://www.mobilemms.com/.
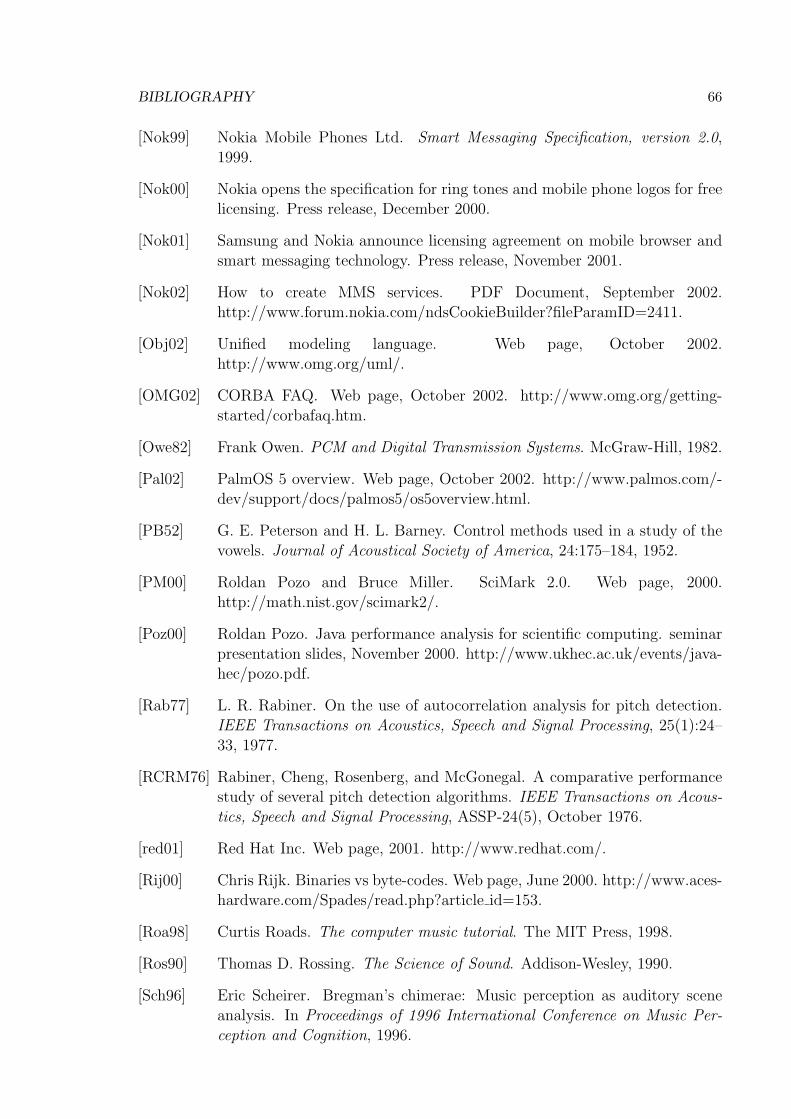
BIBLIOGRAPHY 66
[Nok99] Nokia Mobile Phones Ltd. Smart Messaging Specification, version 2.0,1999.
[Nok00] Nokia opens the specification for ring tones and mobile phone logos for freelicensing. Press release, December 2000.
[Nok01] Samsung and Nokia announce licensing agreement on mobile browser andsmart messaging technology. Press release, November 2001.
[Nok02] How to create MMS services. PDF Document, September 2002.http://www.forum.nokia.com/ndsCookieBuilder?fileParamID=2411.
[Obj02] Unified modeling language. Web page, October 2002.http://www.omg.org/uml/.
[OMG02] CORBA FAQ. Web page, October 2002. http://www.omg.org/getting-started/corbafaq.htm.
[Owe82] Frank Owen. PCM and Digital Transmission Systems. McGraw-Hill, 1982.
[Pal02] PalmOS 5 overview. Web page, October 2002. http://www.palmos.com/-dev/support/docs/palmos5/os5overview.html.
[PB52] G. E. Peterson and H. L. Barney. Control methods used in a study of thevowels. Journal of Acoustical Society of America, 24:175–184, 1952.
[PM00] Roldan Pozo and Bruce Miller. SciMark 2.0. Web page, 2000.http://math.nist.gov/scimark2/.
[Poz00] Roldan Pozo. Java performance analysis for scientific computing. seminarpresentation slides, November 2000. http://www.ukhec.ac.uk/events/java-hec/pozo.pdf.
[Rab77] L. R. Rabiner. On the use of autocorrelation analysis for pitch detection.IEEE Transactions on Acoustics, Speech and Signal Processing, 25(1):24–33, 1977.
[RCRM76] Rabiner, Cheng, Rosenberg, and McGonegal. A comparative performancestudy of several pitch detection algorithms. IEEE Transactions on Acous-tics, Speech and Signal Processing, ASSP-24(5), October 1976.
[red01] Red Hat Inc. Web page, 2001. http://www.redhat.com/.
[Rij00] Chris Rijk. Binaries vs byte-codes. Web page, June 2000. http://www.aces-hardware.com/Spades/read.php?article id=153.
[Roa98] Curtis Roads. The computer music tutorial. The MIT Press, 1998.
[Ros90] Thomas D. Rossing. The Science of Sound. Addison-Wesley, 1990.
[Sch96] Eric Scheirer. Bregman’s chimerae: Music perception as auditory sceneanalysis. In Proceedings of 1996 International Conference on Music Per-ception and Cognition, 1996.
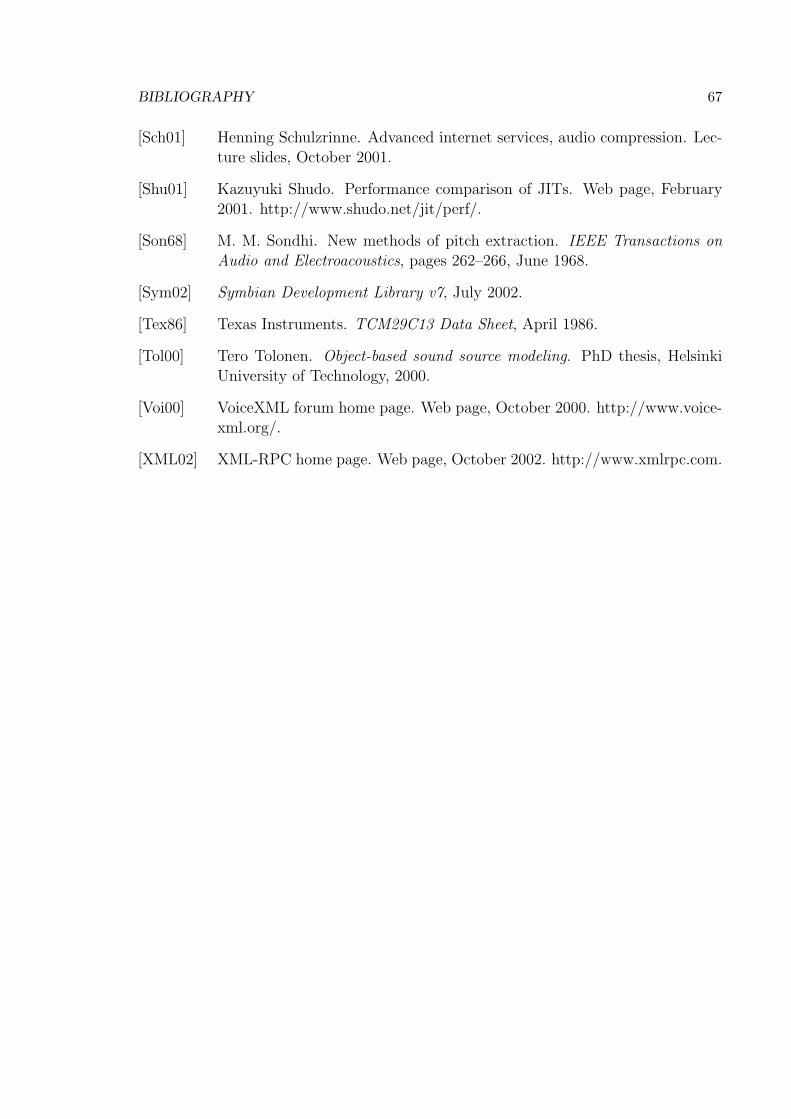
BIBLIOGRAPHY 67
[Sch01] Henning Schulzrinne. Advanced internet services, audio compression. Lec-ture slides, October 2001.
[Shu01] Kazuyuki Shudo. Performance comparison of JITs. Web page, February2001. http://www.shudo.net/jit/perf/.
[Son68] M. M. Sondhi. New methods of pitch extraction. IEEE Transactions onAudio and Electroacoustics, pages 262–266, June 1968.
[Sym02] Symbian Development Library v7, July 2002.
[Tex86] Texas Instruments. TCM29C13 Data Sheet, April 1986.
[Tol00] Tero Tolonen. Object-based sound source modeling. PhD thesis, HelsinkiUniversity of Technology, 2000.
[Voi00] VoiceXML forum home page. Web page, October 2000. http://www.voice-xml.org/.
[XML02] XML-RPC home page. Web page, October 2002. http://www.xmlrpc.com.